Kewanee, IL Map & Demographics
Kewanee Map
Kewanee Overview
$23,645
PER CAPITA INCOME
$52,721
AVG FAMILY INCOME
$46,305
AVG HOUSEHOLD INCOME
33.2%
WAGE / INCOME GAP [ % ]
66.8¢/ $1
WAGE / INCOME GAP [ $ ]
$13,523
FAMILY INCOME DEFICIT
0.43
INEQUALITY / GINI INDEX
12,179
TOTAL POPULATION
6,046
MALE POPULATION
6,133
FEMALE POPULATION
98.58
MALES / 100 FEMALES
101.44
FEMALES / 100 MALES
43.5
MEDIAN AGE
3.0
AVG FAMILY SIZE
2.3
AVG HOUSEHOLD SIZE
5,118
LABOR FORCE [ PEOPLE ]
51.8%
PERCENT IN LABOR FORCE
6.9%
UNEMPLOYMENT RATE
Kewanee Zip Codes
Kewanee Area Codes
Income in Kewanee
Income Overview in Kewanee
Per Capita Income in Kewanee is $23,645, while median incomes of families and households are $52,721 and $46,305 respectively.
| Characteristic | Number | Measure |
| Per Capita Income | 12,179 | $23,645 |
| Median Family Income | 3,035 | $52,721 |
| Mean Family Income | 3,035 | $66,406 |
| Median Household Income | 5,084 | $46,305 |
| Mean Household Income | 5,084 | $55,699 |
| Income Deficit | 3,035 | $13,523 |
| Wage / Income Gap (%) | 12,179 | 33.16% |
| Wage / Income Gap ($) | 12,179 | 66.84¢ per $1 |
| Gini / Inequality Index | 12,179 | 0.43 |
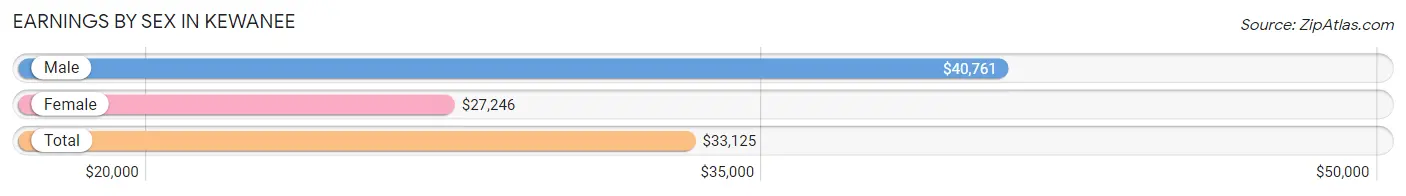
Earnings by Sex in Kewanee
Average Earnings in Kewanee are $33,125, $40,761 for men and $27,246 for women, a difference of 33.2%.
| Sex | Number | Average Earnings |
| Male | 2,818 (52.3%) | $40,761 |
| Female | 2,573 (47.7%) | $27,246 |
| Total | 5,391 (100.0%) | $33,125 |
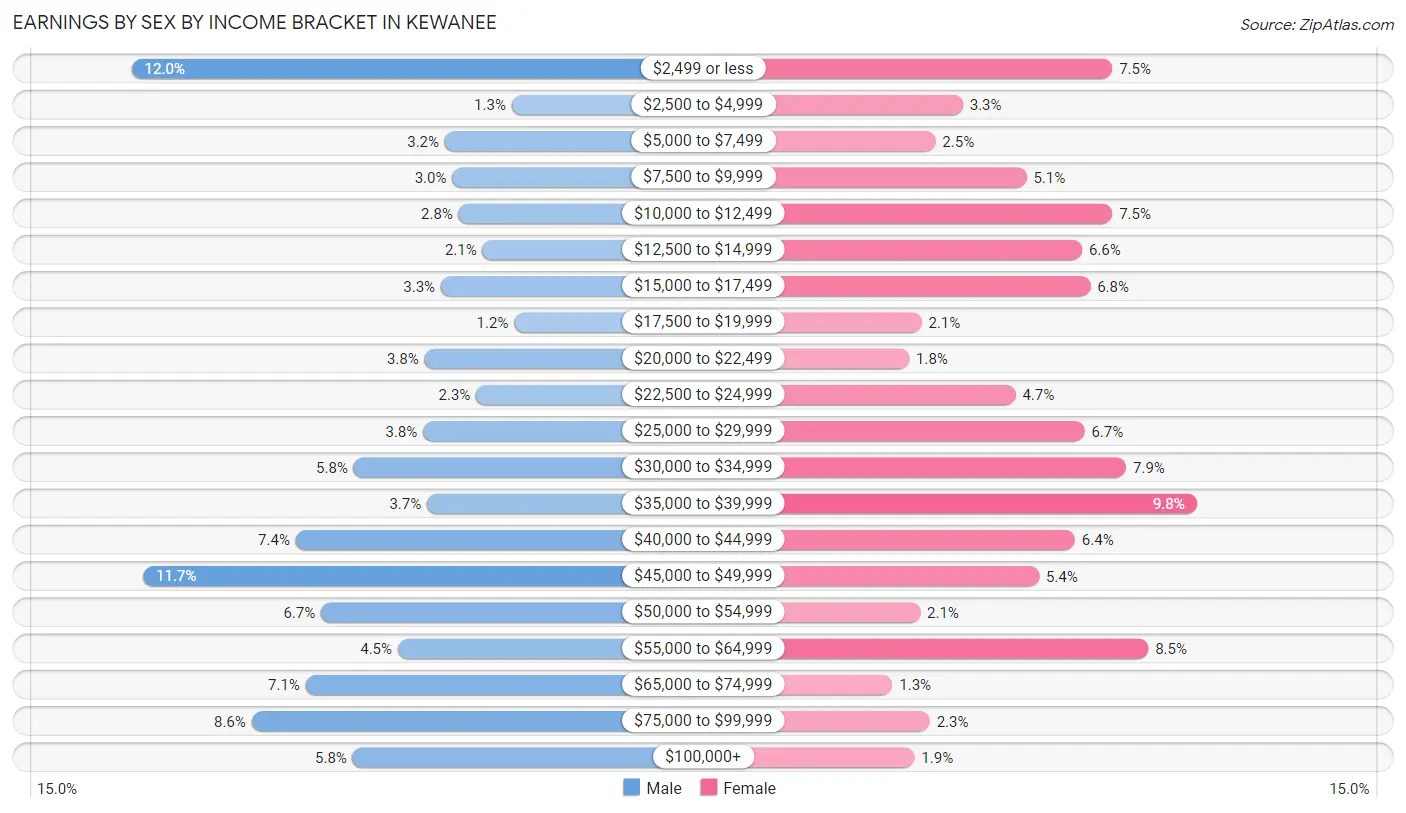
Earnings by Sex by Income Bracket in Kewanee
The most common earnings brackets in Kewanee are $2,499 or less for men (338 | 12.0%) and $35,000 to $39,999 for women (253 | 9.8%).
| Income | Male | Female |
| $2,499 or less | 338 (12.0%) | 192 (7.5%) |
| $2,500 to $4,999 | 37 (1.3%) | 84 (3.3%) |
| $5,000 to $7,499 | 90 (3.2%) | 64 (2.5%) |
| $7,500 to $9,999 | 84 (3.0%) | 130 (5.1%) |
| $10,000 to $12,499 | 79 (2.8%) | 192 (7.5%) |
| $12,500 to $14,999 | 60 (2.1%) | 170 (6.6%) |
| $15,000 to $17,499 | 93 (3.3%) | 176 (6.8%) |
| $17,500 to $19,999 | 35 (1.2%) | 54 (2.1%) |
| $20,000 to $22,499 | 106 (3.8%) | 45 (1.8%) |
| $22,500 to $24,999 | 65 (2.3%) | 122 (4.7%) |
| $25,000 to $29,999 | 107 (3.8%) | 172 (6.7%) |
| $30,000 to $34,999 | 162 (5.8%) | 202 (7.9%) |
| $35,000 to $39,999 | 104 (3.7%) | 253 (9.8%) |
| $40,000 to $44,999 | 208 (7.4%) | 165 (6.4%) |
| $45,000 to $49,999 | 329 (11.7%) | 139 (5.4%) |
| $50,000 to $54,999 | 188 (6.7%) | 53 (2.1%) |
| $55,000 to $64,999 | 127 (4.5%) | 218 (8.5%) |
| $65,000 to $74,999 | 200 (7.1%) | 33 (1.3%) |
| $75,000 to $99,999 | 243 (8.6%) | 60 (2.3%) |
| $100,000+ | 163 (5.8%) | 49 (1.9%) |
| Total | 2,818 (100.0%) | 2,573 (100.0%) |
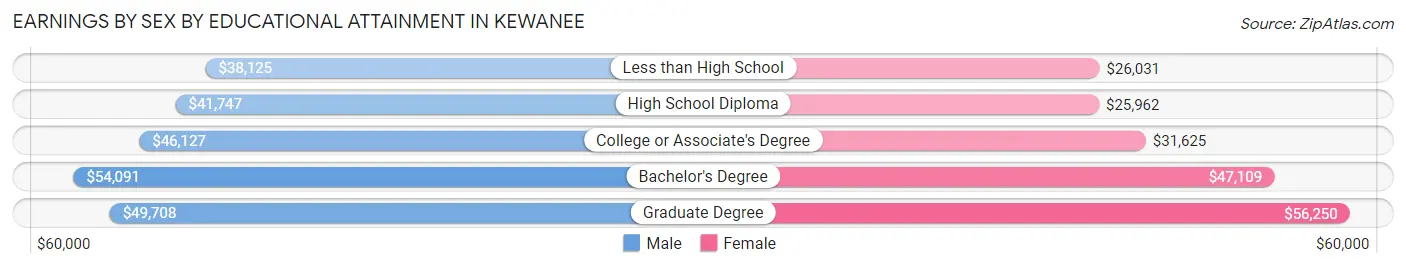
Earnings by Sex by Educational Attainment in Kewanee
Average earnings in Kewanee are $45,734 for men and $31,186 for women, a difference of 31.8%. Men with an educational attainment of bachelor's degree enjoy the highest average annual earnings of $54,091, while those with less than high school education earn the least with $38,125. Women with an educational attainment of graduate degree earn the most with the average annual earnings of $56,250, while those with high school diploma education have the smallest earnings of $25,962.
| Educational Attainment | Male Income | Female Income |
| Less than High School | $38,125 | $26,031 |
| High School Diploma | $41,747 | $25,962 |
| College or Associate's Degree | $46,127 | $31,625 |
| Bachelor's Degree | $54,091 | $47,109 |
| Graduate Degree | $49,708 | $56,250 |
| Total | $45,734 | $31,186 |
Family Income in Kewanee
Family Income Brackets in Kewanee
According to the Kewanee family income data, there are 704 families falling into the $50,000 to $74,999 income range, which is the most common income bracket and makes up 23.2% of all families. Conversely, the $200,000+ income bracket is the least frequent group with only 70 families (2.3%) belonging to this category.
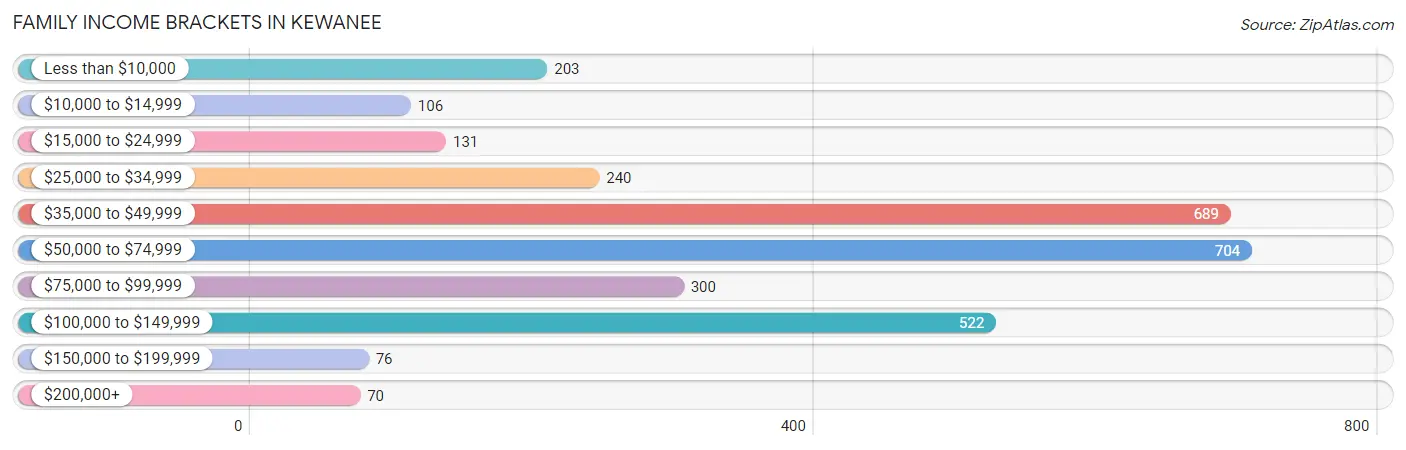
| Income Bracket | # Families | % Families |
| Less than $10,000 | 203 | 6.7% |
| $10,000 to $14,999 | 106 | 3.5% |
| $15,000 to $24,999 | 131 | 4.3% |
| $25,000 to $34,999 | 240 | 7.9% |
| $35,000 to $49,999 | 689 | 22.7% |
| $50,000 to $74,999 | 704 | 23.2% |
| $75,000 to $99,999 | 300 | 9.9% |
| $100,000 to $149,999 | 522 | 17.2% |
| $150,000 to $199,999 | 76 | 2.5% |
| $200,000+ | 70 | 2.3% |
Family Income by Famaliy Size in Kewanee
5-person families (158 | 5.2%) account for the highest median family income in Kewanee with $96,731 per family, while 2-person families (1,612 | 53.1%) have the highest median income of $24,878 per family member.
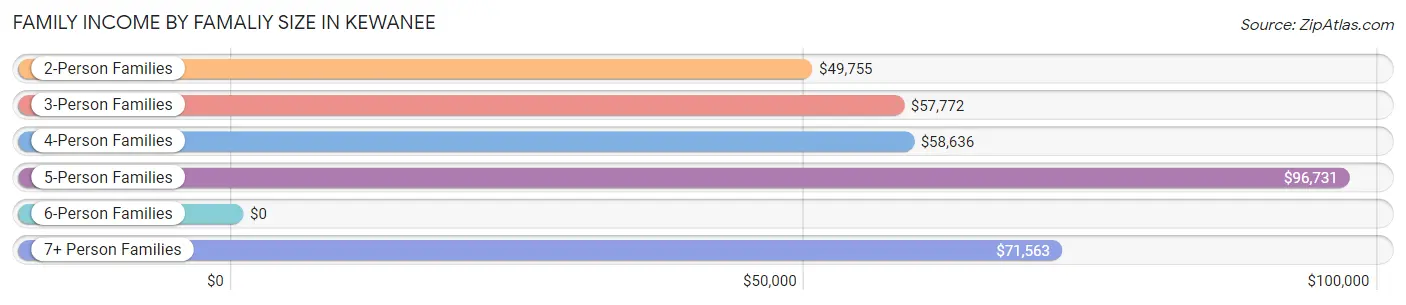
| Income Bracket | # Families | Median Income |
| 2-Person Families | 1,612 (53.1%) | $49,755 |
| 3-Person Families | 727 (23.9%) | $57,772 |
| 4-Person Families | 418 (13.8%) | $58,636 |
| 5-Person Families | 158 (5.2%) | $96,731 |
| 6-Person Families | 77 (2.5%) | $0 |
| 7+ Person Families | 43 (1.4%) | $71,563 |
| Total | 3,035 (100.0%) | $52,721 |
Family Income by Number of Earners in Kewanee
The median family income in Kewanee is $52,721, with families comprising 3+ earners (253) having the highest median family income of $113,047, while families with no earners (729) have the lowest median family income of $39,627, accounting for 8.3% and 24.0% of families, respectively.
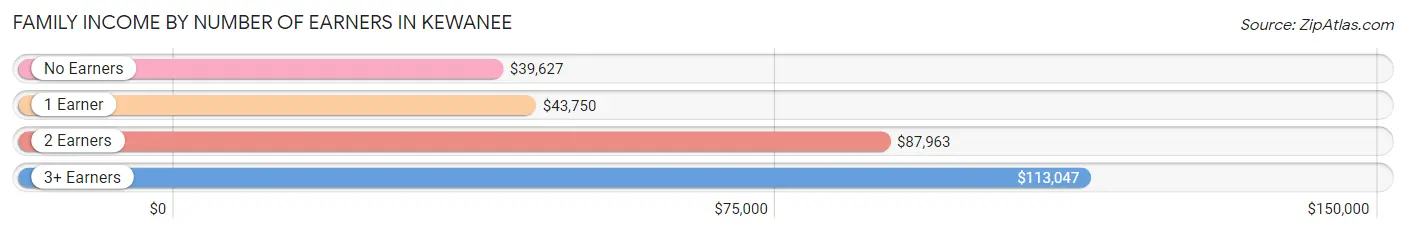
| Number of Earners | # Families | Median Income |
| No Earners | 729 (24.0%) | $39,627 |
| 1 Earner | 1,139 (37.5%) | $43,750 |
| 2 Earners | 914 (30.1%) | $87,963 |
| 3+ Earners | 253 (8.3%) | $113,047 |
| Total | 3,035 (100.0%) | $52,721 |
Household Income in Kewanee
Household Income Brackets in Kewanee
With 1,098 households falling in the category, the $50,000 to $74,999 income range is the most frequent in Kewanee, accounting for 21.6% of all households. In contrast, only 76 households (1.5%) fall into the $150,000 to $199,999 income bracket, making it the least populous group.
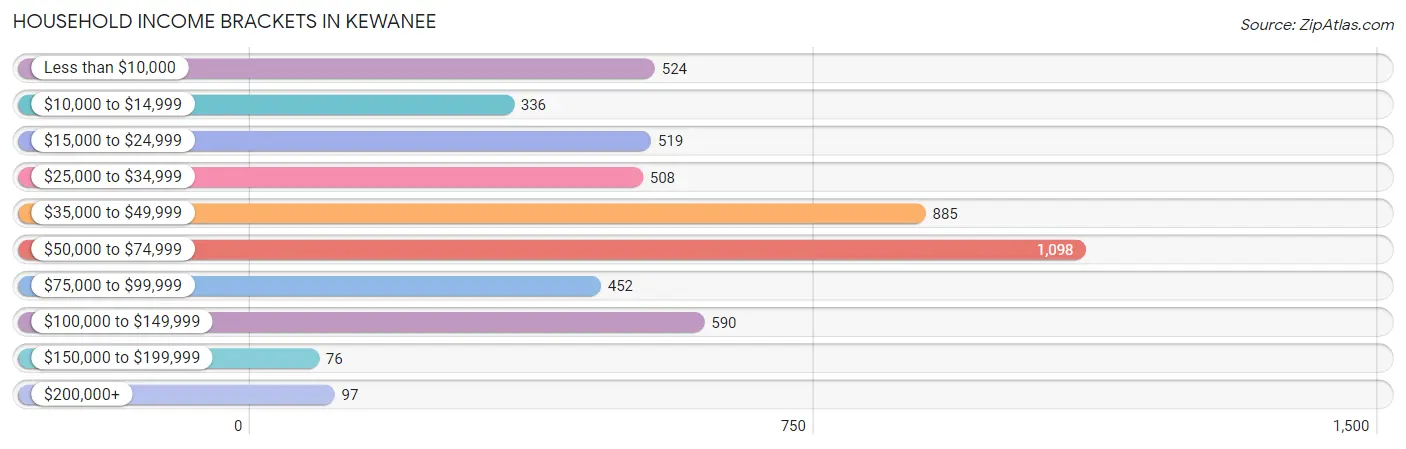
| Income Bracket | # Households | % Households |
| Less than $10,000 | 524 | 10.3% |
| $10,000 to $14,999 | 336 | 6.6% |
| $15,000 to $24,999 | 519 | 10.2% |
| $25,000 to $34,999 | 508 | 10.0% |
| $35,000 to $49,999 | 885 | 17.4% |
| $50,000 to $74,999 | 1,098 | 21.6% |
| $75,000 to $99,999 | 452 | 8.9% |
| $100,000 to $149,999 | 590 | 11.6% |
| $150,000 to $199,999 | 76 | 1.5% |
| $200,000+ | 97 | 1.9% |
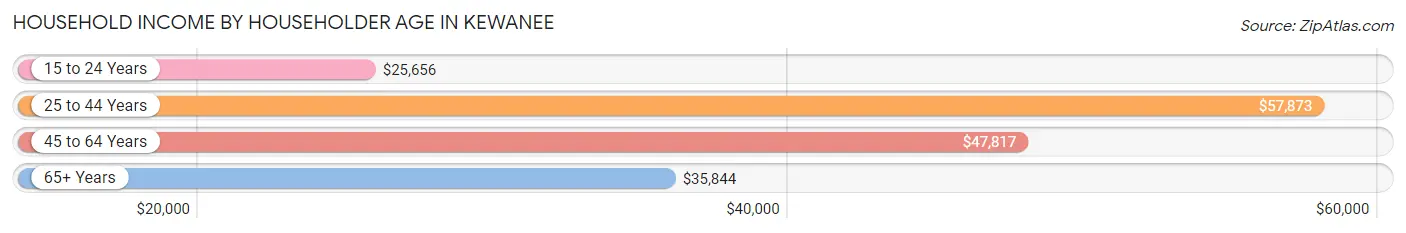
Household Income by Householder Age in Kewanee
The median household income in Kewanee is $46,305, with the highest median household income of $57,873 found in the 25 to 44 years age bracket for the primary householder. A total of 1,380 households (27.1%) fall into this category. Meanwhile, the 15 to 24 years age bracket for the primary householder has the lowest median household income of $25,656, with 213 households (4.2%) in this group.
| Income Bracket | # Households | Median Income |
| 15 to 24 Years | 213 (4.2%) | $25,656 |
| 25 to 44 Years | 1,380 (27.1%) | $57,873 |
| 45 to 64 Years | 1,877 (36.9%) | $47,817 |
| 65+ Years | 1,614 (31.8%) | $35,844 |
| Total | 5,084 (100.0%) | $46,305 |
Poverty in Kewanee
Income Below Poverty by Sex and Age in Kewanee
With 19.6% poverty level for males and 20.3% for females among the residents of Kewanee, 5 year old males and 5 year old females are the most vulnerable to poverty, with 64 males (66.7%) and 30 females (100.0%) in their respective age groups living below the poverty level.
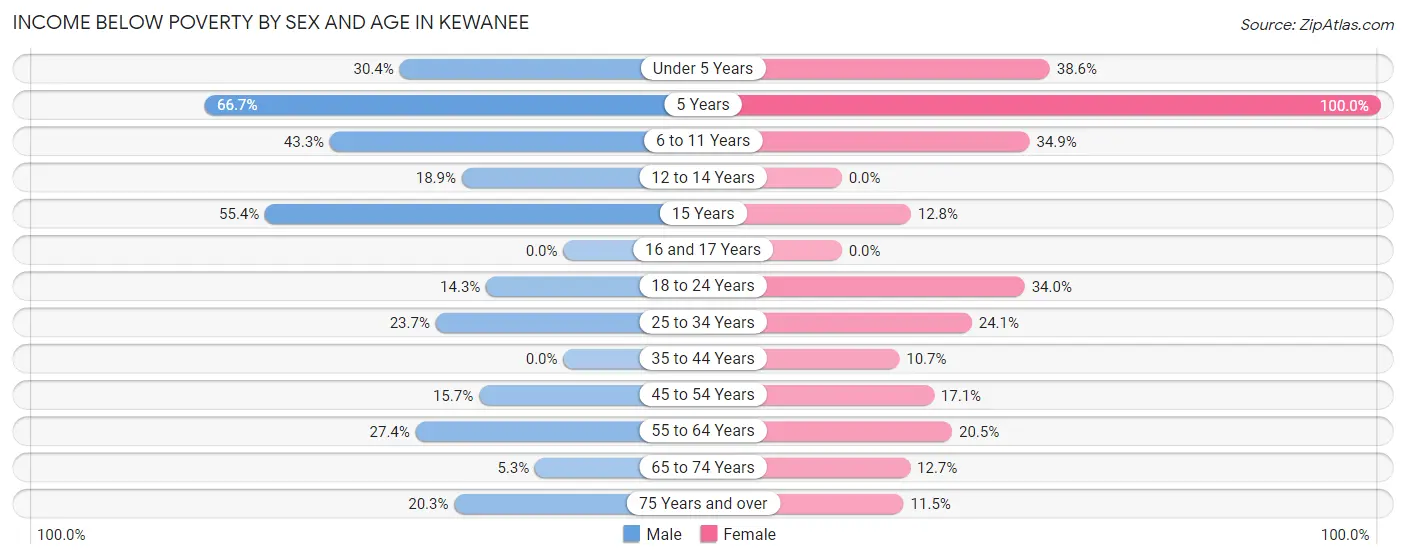
| Age Bracket | Male | Female |
| Under 5 Years | 142 (30.4%) | 129 (38.6%) |
| 5 Years | 64 (66.7%) | 30 (100.0%) |
| 6 to 11 Years | 156 (43.3%) | 169 (34.8%) |
| 12 to 14 Years | 23 (18.9%) | 0 (0.0%) |
| 15 Years | 31 (55.4%) | 15 (12.8%) |
| 16 and 17 Years | 0 (0.0%) | 0 (0.0%) |
| 18 to 24 Years | 85 (14.3%) | 181 (34.0%) |
| 25 to 34 Years | 131 (23.7%) | 167 (24.1%) |
| 35 to 44 Years | 0 (0.0%) | 70 (10.7%) |
| 45 to 54 Years | 114 (15.7%) | 119 (17.1%) |
| 55 to 64 Years | 241 (27.4%) | 159 (20.5%) |
| 65 to 74 Years | 37 (5.3%) | 105 (12.7%) |
| 75 Years and over | 112 (20.3%) | 56 (11.5%) |
| Total | 1,136 (19.6%) | 1,200 (20.3%) |
Income Above Poverty by Sex and Age in Kewanee
According to the poverty statistics in Kewanee, males aged 16 and 17 years and females aged 12 to 14 years are the age groups that are most secure financially, with 100.0% of males and 100.0% of females in these age groups living above the poverty line.
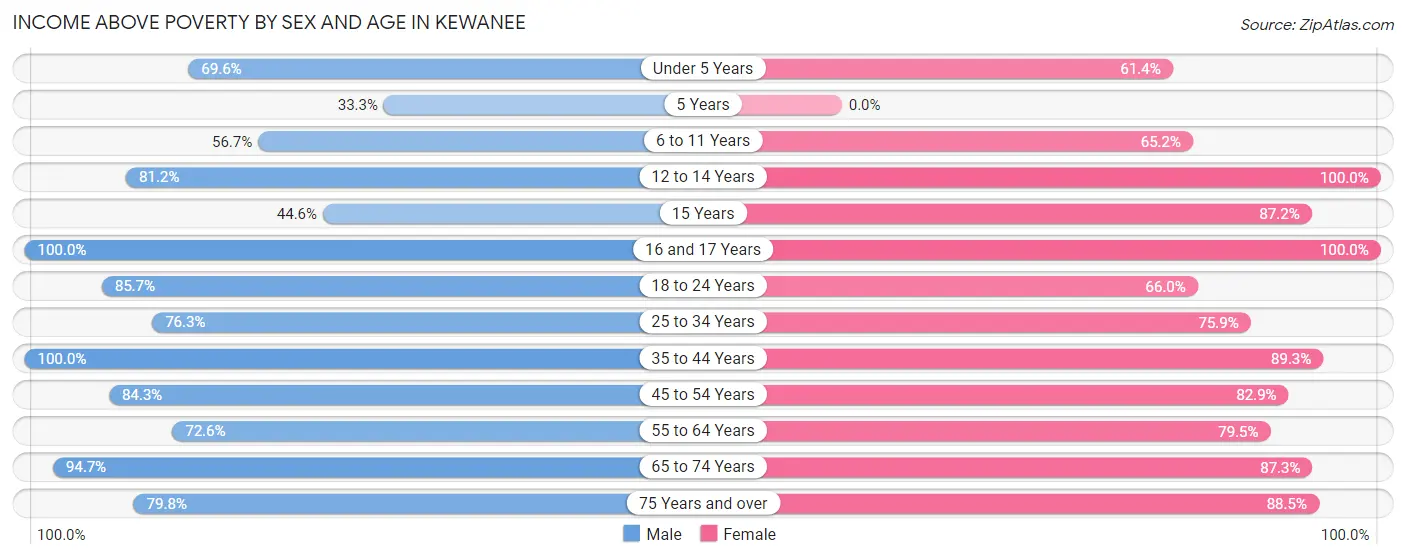
| Age Bracket | Male | Female |
| Under 5 Years | 325 (69.6%) | 205 (61.4%) |
| 5 Years | 32 (33.3%) | 0 (0.0%) |
| 6 to 11 Years | 204 (56.7%) | 316 (65.1%) |
| 12 to 14 Years | 99 (81.1%) | 94 (100.0%) |
| 15 Years | 25 (44.6%) | 102 (87.2%) |
| 16 and 17 Years | 103 (100.0%) | 175 (100.0%) |
| 18 to 24 Years | 508 (85.7%) | 352 (66.0%) |
| 25 to 34 Years | 422 (76.3%) | 525 (75.9%) |
| 35 to 44 Years | 580 (100.0%) | 586 (89.3%) |
| 45 to 54 Years | 614 (84.3%) | 577 (82.9%) |
| 55 to 64 Years | 638 (72.6%) | 618 (79.5%) |
| 65 to 74 Years | 666 (94.7%) | 723 (87.3%) |
| 75 Years and over | 441 (79.7%) | 432 (88.5%) |
| Total | 4,657 (80.4%) | 4,705 (79.7%) |
Income Below Poverty Among Married-Couple Families in Kewanee
The poverty statistics for married-couple families in Kewanee show that 3.6% or 71 of the total 1,997 families live below the poverty line. Families with no children have the highest poverty rate of 4.9%, comprising of 71 families. On the other hand, families with 1 or 2 children have the lowest poverty rate of 0.0%, which includes 0 families.
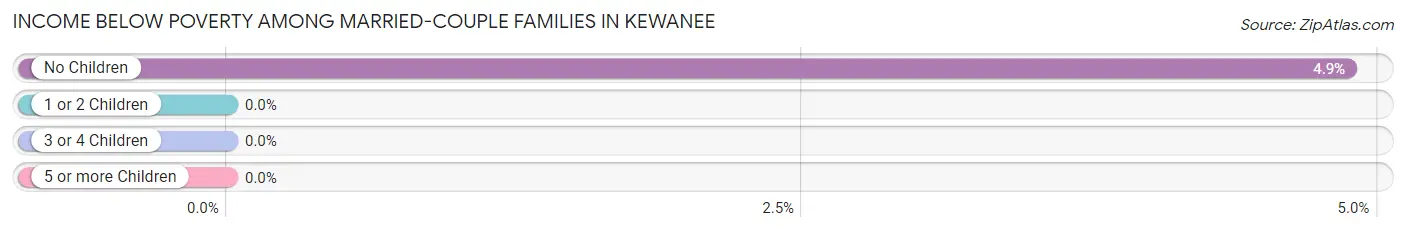
| Children | Above Poverty | Below Poverty |
| No Children | 1,387 (95.1%) | 71 (4.9%) |
| 1 or 2 Children | 384 (100.0%) | 0 (0.0%) |
| 3 or 4 Children | 155 (100.0%) | 0 (0.0%) |
| 5 or more Children | 0 (0.0%) | 0 (0.0%) |
| Total | 1,926 (96.4%) | 71 (3.6%) |
Income Below Poverty Among Single-Parent Households in Kewanee
According to the poverty data in Kewanee, 20.8% or 77 single-father households and 36.8% or 246 single-mother households are living below the poverty line. Among single-father households, those with no children have the highest poverty rate, with 41 households (41.0%) experiencing poverty. Likewise, among single-mother households, those with 5 or more children have the highest poverty rate, with 28 households (100.0%) falling below the poverty line.
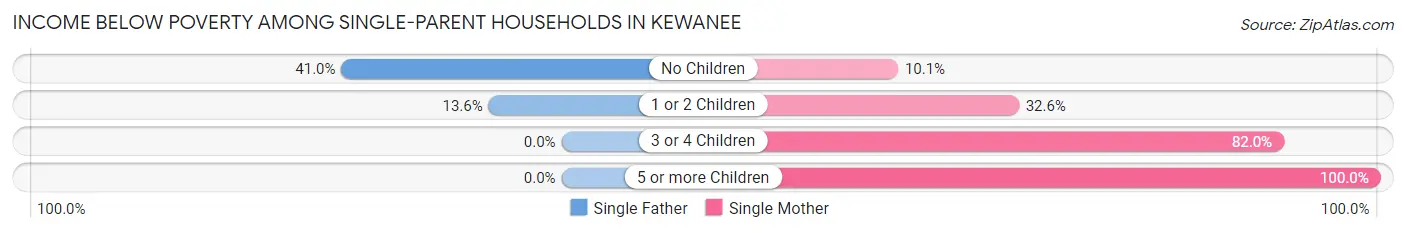
| Children | Single Father | Single Mother |
| No Children | 41 (41.0%) | 18 (10.1%) |
| 1 or 2 Children | 36 (13.6%) | 118 (32.6%) |
| 3 or 4 Children | 0 (0.0%) | 82 (82.0%) |
| 5 or more Children | 0 (0.0%) | 28 (100.0%) |
| Total | 77 (20.8%) | 246 (36.8%) |
Income Below Poverty Among Married-Couple vs Single-Parent Households in Kewanee
The poverty data for Kewanee shows that 71 of the married-couple family households (3.6%) and 323 of the single-parent households (31.1%) are living below the poverty level. Within the married-couple family households, those with no children have the highest poverty rate, with 71 households (4.9%) falling below the poverty line. Among the single-parent households, those with 5 or more children have the highest poverty rate, with 28 household (100.0%) living below poverty.
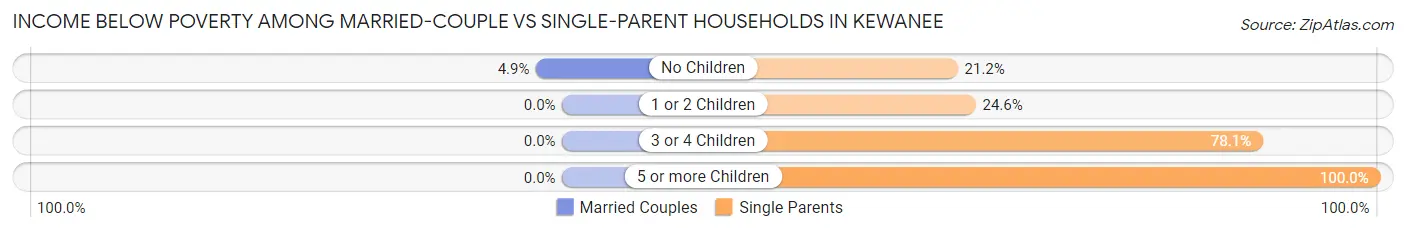
| Children | Married-Couple Families | Single-Parent Households |
| No Children | 71 (4.9%) | 59 (21.2%) |
| 1 or 2 Children | 0 (0.0%) | 154 (24.6%) |
| 3 or 4 Children | 0 (0.0%) | 82 (78.1%) |
| 5 or more Children | 0 (0.0%) | 28 (100.0%) |
| Total | 71 (3.6%) | 323 (31.1%) |
Race in Kewanee
The most populous races in Kewanee are White / Caucasian (9,860 | 81.0%), Hispanic or Latino (1,361 | 11.2%), and Some other Race (953 | 7.8%).
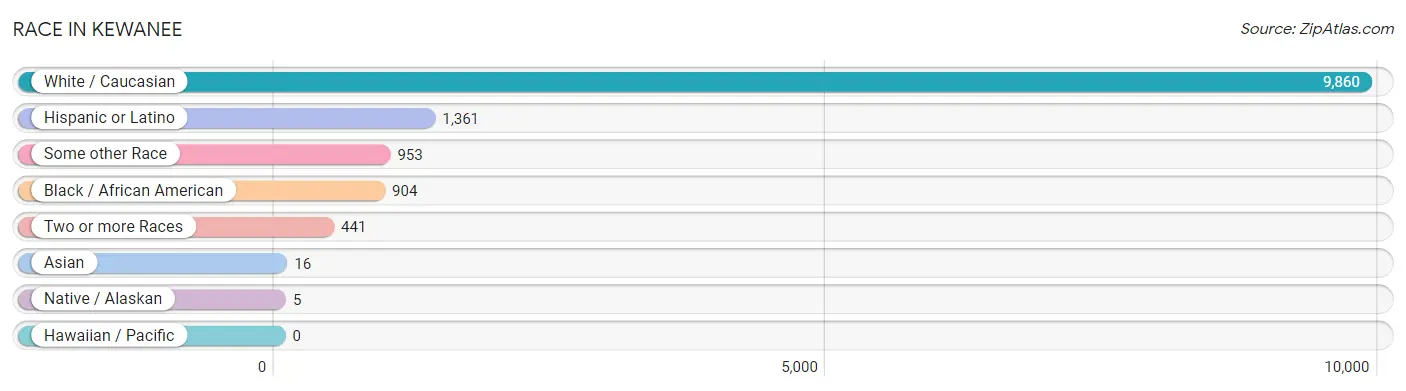
| Race | # Population | % Population |
| Asian | 16 | 0.1% |
| Black / African American | 904 | 7.4% |
| Hawaiian / Pacific | 0 | 0.0% |
| Hispanic or Latino | 1,361 | 11.2% |
| Native / Alaskan | 5 | 0.0% |
| White / Caucasian | 9,860 | 81.0% |
| Two or more Races | 441 | 3.6% |
| Some other Race | 953 | 7.8% |
| Total | 12,179 | 100.0% |
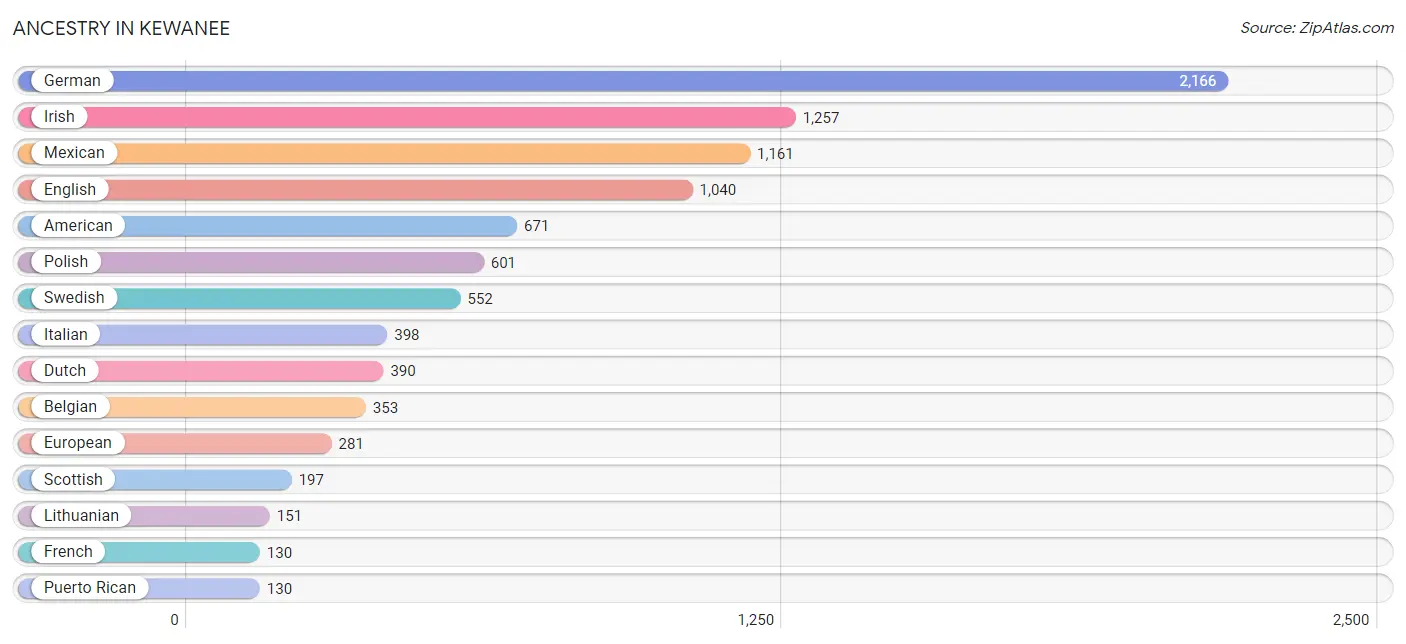
Ancestry in Kewanee
The most populous ancestries reported in Kewanee are German (2,166 | 17.8%), Irish (1,257 | 10.3%), Mexican (1,161 | 9.5%), English (1,040 | 8.5%), and American (671 | 5.5%), together accounting for 51.7% of all Kewanee residents.
| Ancestry | # Population | % Population |
| African | 5 | 0.0% |
| American | 671 | 5.5% |
| Austrian | 21 | 0.2% |
| Belgian | 353 | 2.9% |
| British | 42 | 0.3% |
| Canadian | 37 | 0.3% |
| Central American | 20 | 0.2% |
| Cherokee | 7 | 0.1% |
| Chippewa | 4 | 0.0% |
| Colombian | 16 | 0.1% |
| Czech | 77 | 0.6% |
| Danish | 50 | 0.4% |
| Dutch | 390 | 3.2% |
| Eastern European | 10 | 0.1% |
| English | 1,040 | 8.5% |
| Estonian | 12 | 0.1% |
| European | 281 | 2.3% |
| French | 130 | 1.1% |
| French Canadian | 10 | 0.1% |
| German | 2,166 | 17.8% |
| Greek | 54 | 0.4% |
| Honduran | 15 | 0.1% |
| Hungarian | 7 | 0.1% |
| Indian (Asian) | 12 | 0.1% |
| Irish | 1,257 | 10.3% |
| Italian | 398 | 3.3% |
| Japanese | 31 | 0.3% |
| Korean | 59 | 0.5% |
| Lithuanian | 151 | 1.2% |
| Mexican | 1,161 | 9.5% |
| Mongolian | 12 | 0.1% |
| Northern European | 3 | 0.0% |
| Norwegian | 75 | 0.6% |
| Pennsylvania German | 11 | 0.1% |
| Polish | 601 | 4.9% |
| Puerto Rican | 130 | 1.1% |
| Russian | 20 | 0.2% |
| Salvadoran | 5 | 0.0% |
| Scandinavian | 47 | 0.4% |
| Scotch-Irish | 99 | 0.8% |
| Scottish | 197 | 1.6% |
| South American | 16 | 0.1% |
| Spaniard | 17 | 0.1% |
| Subsaharan African | 5 | 0.0% |
| Swedish | 552 | 4.5% |
| Welsh | 95 | 0.8% |
| West Indian | 9 | 0.1% | View All 47 Rows |
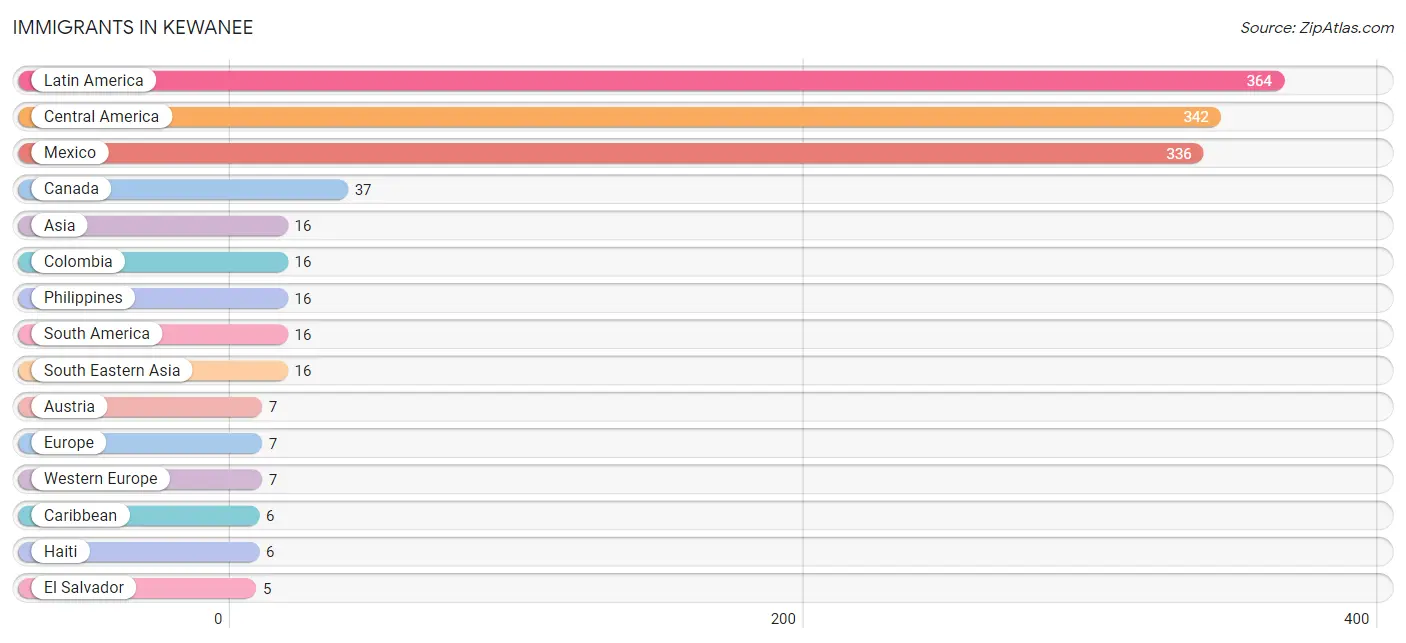
Immigrants in Kewanee
The most numerous immigrant groups reported in Kewanee came from Latin America (364 | 3.0%), Central America (342 | 2.8%), Mexico (336 | 2.8%), Canada (37 | 0.3%), and Asia (16 | 0.1%), together accounting for 9.0% of all Kewanee residents.
| Immigration Origin | # Population | % Population |
| Asia | 16 | 0.1% |
| Austria | 7 | 0.1% |
| Belize | 1 | 0.0% |
| Canada | 37 | 0.3% |
| Caribbean | 6 | 0.1% |
| Central America | 342 | 2.8% |
| Colombia | 16 | 0.1% |
| El Salvador | 5 | 0.0% |
| Europe | 7 | 0.1% |
| Haiti | 6 | 0.1% |
| Latin America | 364 | 3.0% |
| Mexico | 336 | 2.8% |
| Philippines | 16 | 0.1% |
| South America | 16 | 0.1% |
| South Eastern Asia | 16 | 0.1% |
| Western Europe | 7 | 0.1% | View All 16 Rows |
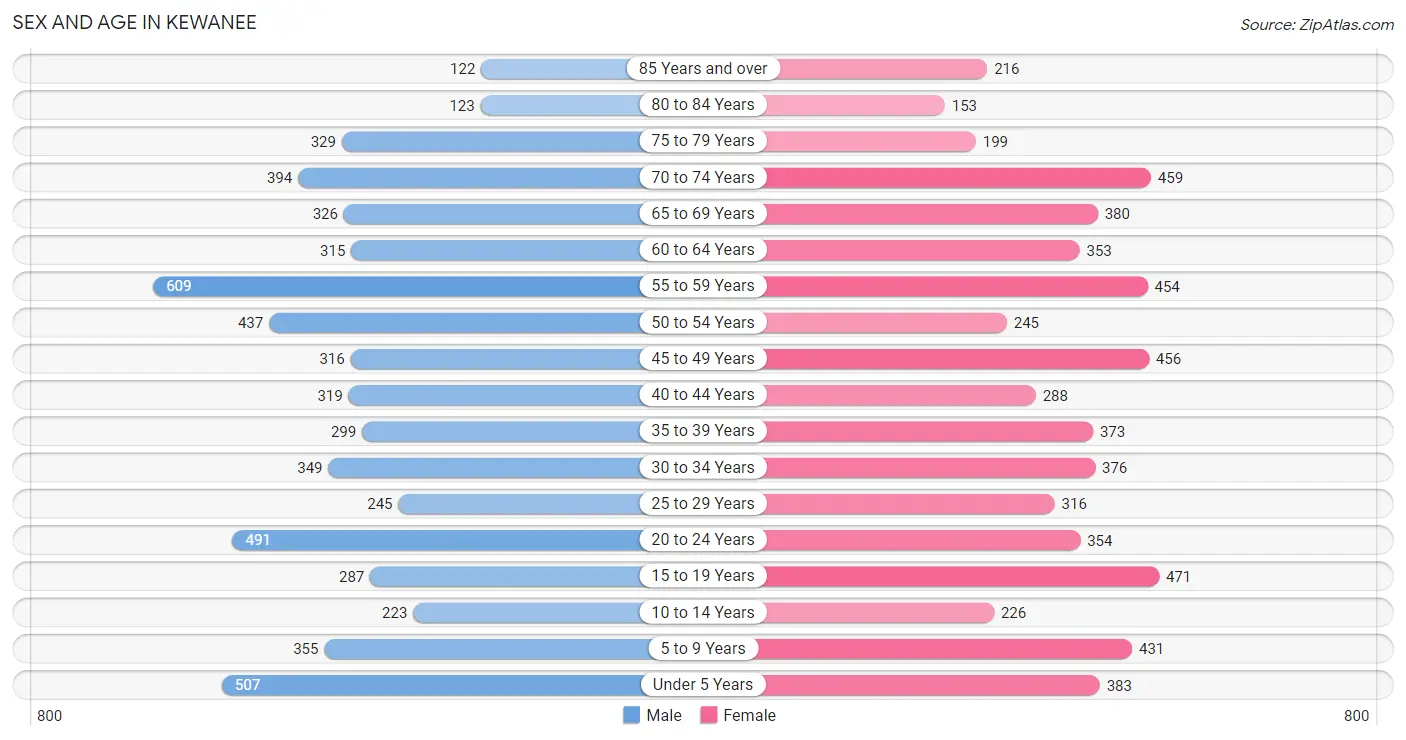
Sex and Age in Kewanee
Sex and Age in Kewanee
The most populous age groups in Kewanee are 55 to 59 Years (609 | 10.1%) for men and 15 to 19 Years (471 | 7.7%) for women.
| Age Bracket | Male | Female |
| Under 5 Years | 507 (8.4%) | 383 (6.2%) |
| 5 to 9 Years | 355 (5.9%) | 431 (7.0%) |
| 10 to 14 Years | 223 (3.7%) | 226 (3.7%) |
| 15 to 19 Years | 287 (4.8%) | 471 (7.7%) |
| 20 to 24 Years | 491 (8.1%) | 354 (5.8%) |
| 25 to 29 Years | 245 (4.1%) | 316 (5.1%) |
| 30 to 34 Years | 349 (5.8%) | 376 (6.1%) |
| 35 to 39 Years | 299 (5.0%) | 373 (6.1%) |
| 40 to 44 Years | 319 (5.3%) | 288 (4.7%) |
| 45 to 49 Years | 316 (5.2%) | 456 (7.4%) |
| 50 to 54 Years | 437 (7.2%) | 245 (4.0%) |
| 55 to 59 Years | 609 (10.1%) | 454 (7.4%) |
| 60 to 64 Years | 315 (5.2%) | 353 (5.8%) |
| 65 to 69 Years | 326 (5.4%) | 380 (6.2%) |
| 70 to 74 Years | 394 (6.5%) | 459 (7.5%) |
| 75 to 79 Years | 329 (5.4%) | 199 (3.2%) |
| 80 to 84 Years | 123 (2.0%) | 153 (2.5%) |
| 85 Years and over | 122 (2.0%) | 216 (3.5%) |
| Total | 6,046 (100.0%) | 6,133 (100.0%) |
Families and Households in Kewanee
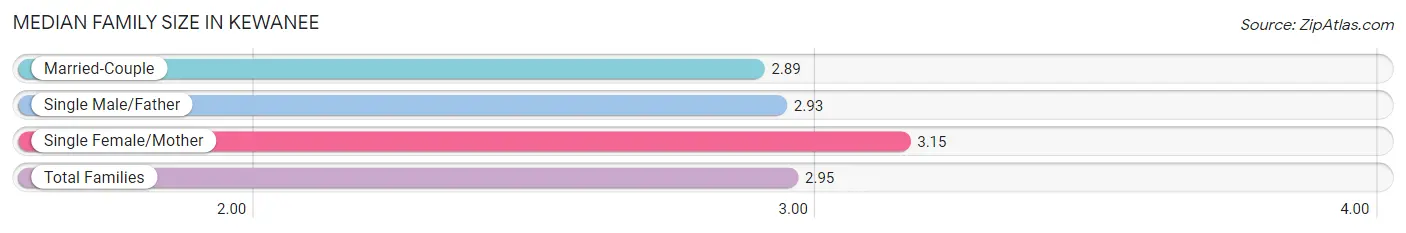
Median Family Size in Kewanee
The median family size in Kewanee is 2.95 persons per family, with single female/mother families (668 | 22.0%) accounting for the largest median family size of 3.15 persons per family. On the other hand, married-couple families (1,997 | 65.8%) represent the smallest median family size with 2.89 persons per family.
| Family Type | # Families | Family Size |
| Married-Couple | 1,997 (65.8%) | 2.89 |
| Single Male/Father | 370 (12.2%) | 2.93 |
| Single Female/Mother | 668 (22.0%) | 3.15 |
| Total Families | 3,035 (100.0%) | 2.95 |
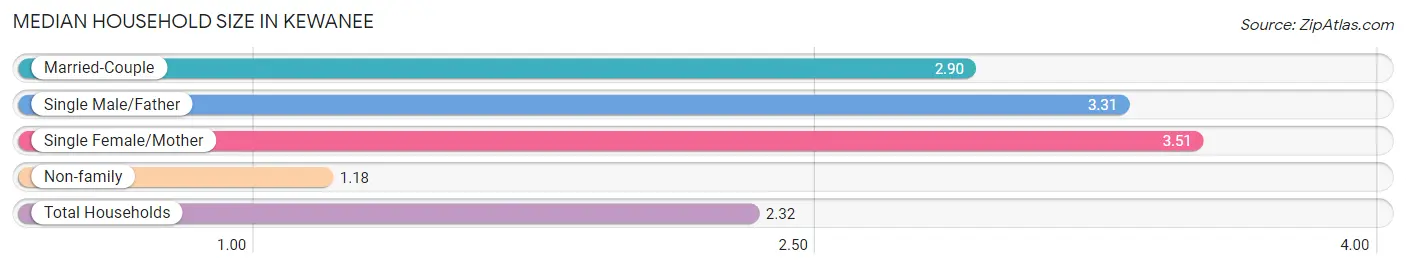
Median Household Size in Kewanee
The median household size in Kewanee is 2.32 persons per household, with single female/mother households (668 | 13.1%) accounting for the largest median household size of 3.51 persons per household. non-family households (2,049 | 40.3%) represent the smallest median household size with 1.18 persons per household.
| Household Type | # Households | Household Size |
| Married-Couple | 1,997 (39.3%) | 2.90 |
| Single Male/Father | 370 (7.3%) | 3.31 |
| Single Female/Mother | 668 (13.1%) | 3.51 |
| Non-family | 2,049 (40.3%) | 1.18 |
| Total Households | 5,084 (100.0%) | 2.32 |
Household Size by Marriage Status in Kewanee
Out of a total of 5,084 households in Kewanee, 3,035 (59.7%) are family households, while 2,049 (40.3%) are nonfamily households. The most numerous type of family households are 2-person households, comprising 1,552, and the most common type of nonfamily households are 1-person households, comprising 1,687.
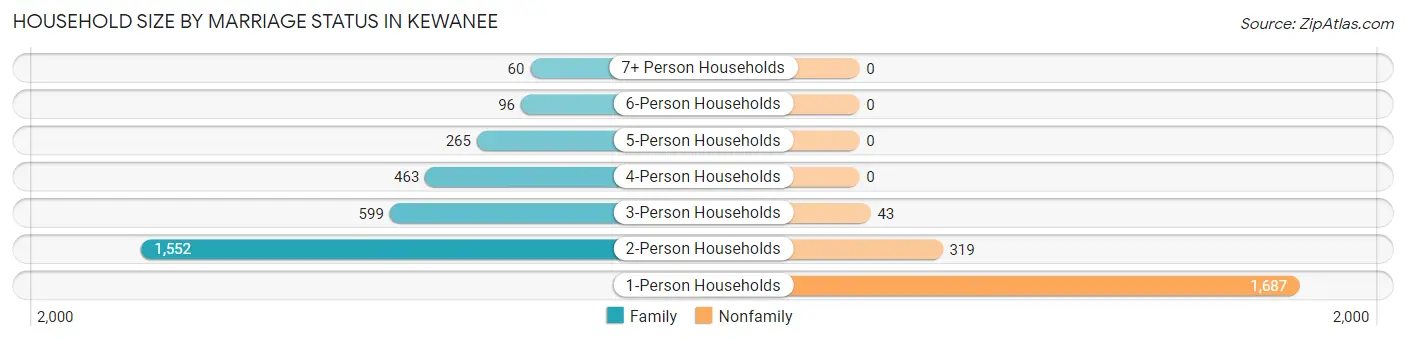
| Household Size | Family Households | Nonfamily Households |
| 1-Person Households | - | 1,687 (33.2%) |
| 2-Person Households | 1,552 (30.5%) | 319 (6.3%) |
| 3-Person Households | 599 (11.8%) | 43 (0.9%) |
| 4-Person Households | 463 (9.1%) | 0 (0.0%) |
| 5-Person Households | 265 (5.2%) | 0 (0.0%) |
| 6-Person Households | 96 (1.9%) | 0 (0.0%) |
| 7+ Person Households | 60 (1.2%) | 0 (0.0%) |
| Total | 3,035 (59.7%) | 2,049 (40.3%) |
Female Fertility in Kewanee
Fertility by Age in Kewanee
Average fertility rate in Kewanee is 50.0 births per 1,000 women. Women in the age bracket of 20 to 34 years have the highest fertility rate with 71.0 births per 1,000 women. Women in the age bracket of 20 to 34 years acount for 55.6% of all women with births.
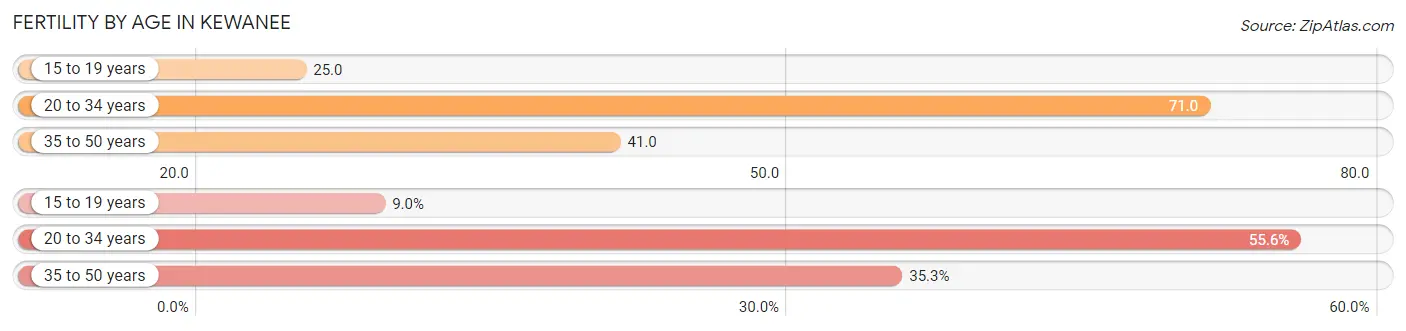
| Age Bracket | Women with Births | Births / 1,000 Women |
| 15 to 19 years | 12 (9.0%) | 25.0 |
| 20 to 34 years | 74 (55.6%) | 71.0 |
| 35 to 50 years | 47 (35.3%) | 41.0 |
| Total | 133 (100.0%) | 50.0 |
Fertility by Age by Marriage Status in Kewanee
30.1% of women with births (133) in Kewanee are married. The highest percentage of unmarried women with births falls into 15 to 19 years age bracket with 100.0% of them unmarried at the time of birth, while the lowest percentage of unmarried women with births belong to 35 to 50 years age bracket with 40.4% of them unmarried.
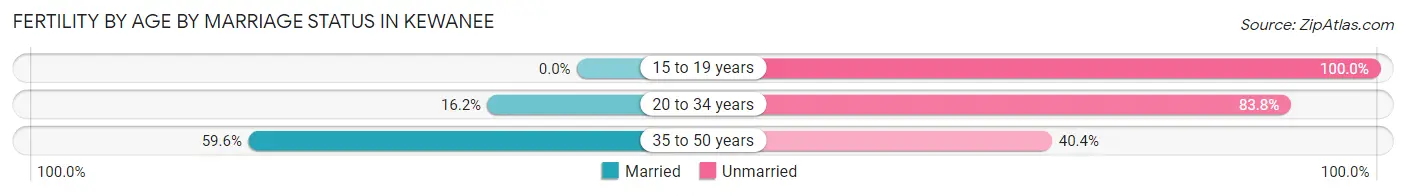
| Age Bracket | Married | Unmarried |
| 15 to 19 years | 0 (0.0%) | 12 (100.0%) |
| 20 to 34 years | 12 (16.2%) | 62 (83.8%) |
| 35 to 50 years | 28 (59.6%) | 19 (40.4%) |
| Total | 40 (30.1%) | 93 (69.9%) |
Fertility by Education in Kewanee
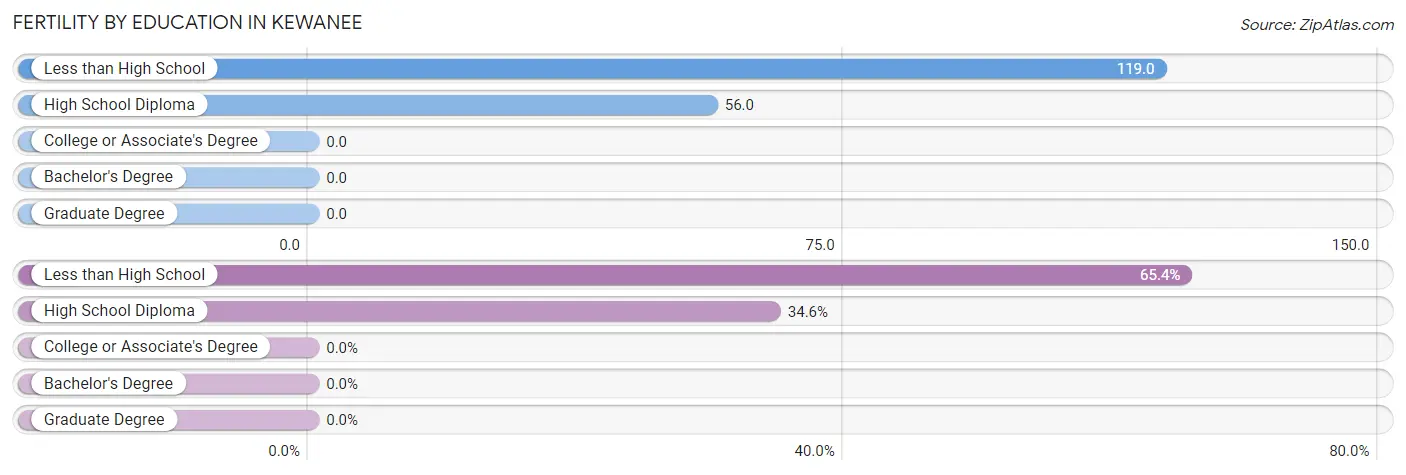
| Educational Attainment | Women with Births | Births / 1,000 Women |
| Less than High School | 87 (65.4%) | 119.0 |
| High School Diploma | 46 (34.6%) | 56.0 |
| College or Associate's Degree | 0 (0.0%) | 0.0 |
| Bachelor's Degree | 0 (0.0%) | 0.0 |
| Graduate Degree | 0 (0.0%) | 0.0 |
| Total | 133 (100.0%) | 50.0 |
Fertility by Education by Marriage Status in Kewanee
69.9% of women with births in Kewanee are unmarried. Women with the educational attainment of less than high school are most likely to be married with 46.0% of them married at childbirth, while women with the educational attainment of high school diploma are least likely to be married with 100.0% of them unmarried at childbirth.
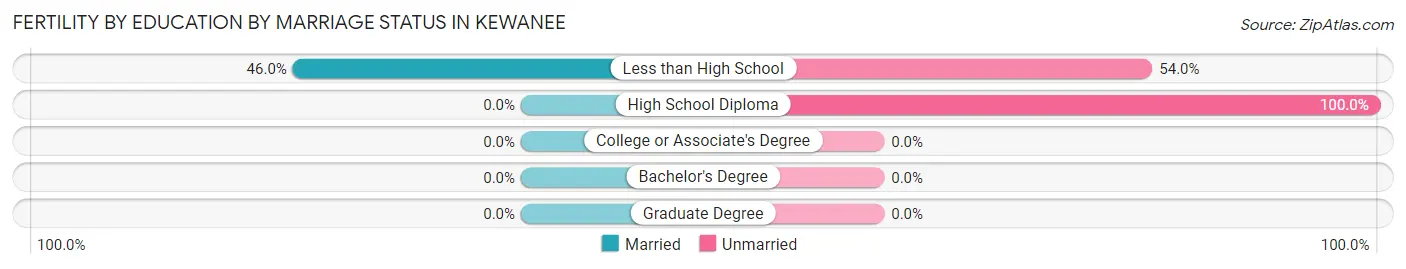
| Educational Attainment | Married | Unmarried |
| Less than High School | 40 (46.0%) | 47 (54.0%) |
| High School Diploma | 0 (0.0%) | 46 (100.0%) |
| College or Associate's Degree | 0 (0.0%) | 0 (0.0%) |
| Bachelor's Degree | 0 (0.0%) | 0 (0.0%) |
| Graduate Degree | 0 (0.0%) | 0 (0.0%) |
| Total | 40 (30.1%) | 93 (69.9%) |
Employment Characteristics in Kewanee
Employment by Class of Employer in Kewanee
Among the 4,678 employed individuals in Kewanee, private company employees (3,186 | 68.1%), not-for-profit organizations (570 | 12.2%), and local government employees (446 | 9.5%) make up the most common classes of employment.
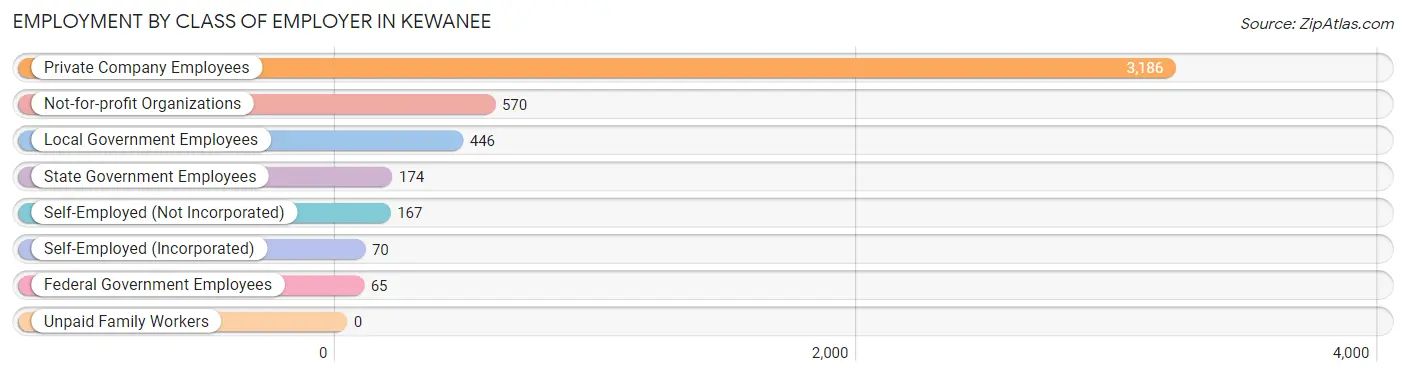
| Employer Class | # Employees | % Employees |
| Private Company Employees | 3,186 | 68.1% |
| Self-Employed (Incorporated) | 70 | 1.5% |
| Self-Employed (Not Incorporated) | 167 | 3.6% |
| Not-for-profit Organizations | 570 | 12.2% |
| Local Government Employees | 446 | 9.5% |
| State Government Employees | 174 | 3.7% |
| Federal Government Employees | 65 | 1.4% |
| Unpaid Family Workers | 0 | 0.0% |
| Total | 4,678 | 100.0% |
Employment Status by Age in Kewanee
According to the labor force statistics for Kewanee, out of the total population over 16 years of age (9,881), 51.8% or 5,118 individuals are in the labor force, with 6.9% or 353 of them unemployed. The age group with the highest labor force participation rate is 25 to 29 years, with 84.0% or 471 individuals in the labor force. Within the labor force, the 20 to 24 years age range has the highest percentage of unemployed individuals, with 16.7% or 92 of them being unemployed.
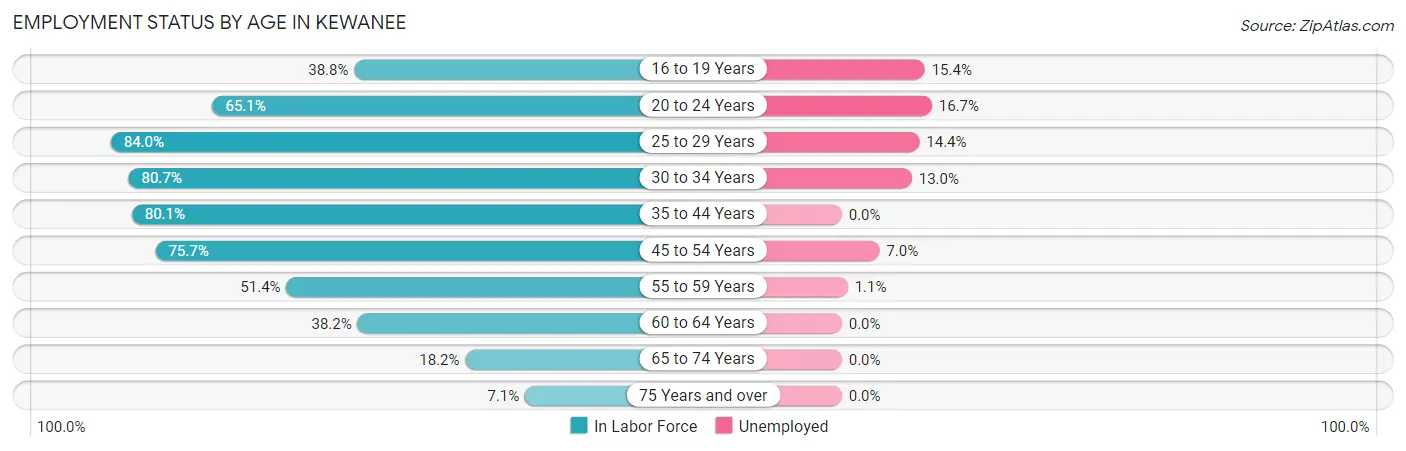
| Age Bracket | In Labor Force | Unemployed |
| 16 to 19 Years | 227 (38.8%) | 35 (15.4%) |
| 20 to 24 Years | 550 (65.1%) | 92 (16.7%) |
| 25 to 29 Years | 471 (84.0%) | 68 (14.4%) |
| 30 to 34 Years | 585 (80.7%) | 76 (13.0%) |
| 35 to 44 Years | 1,024 (80.1%) | 0 (0.0%) |
| 45 to 54 Years | 1,101 (75.7%) | 77 (7.0%) |
| 55 to 59 Years | 546 (51.4%) | 6 (1.1%) |
| 60 to 64 Years | 255 (38.2%) | 0 (0.0%) |
| 65 to 74 Years | 284 (18.2%) | 0 (0.0%) |
| 75 Years and over | 81 (7.1%) | 0 (0.0%) |
| Total | 5,118 (51.8%) | 353 (6.9%) |
Employment Status by Educational Attainment in Kewanee
According to labor force statistics for Kewanee, 69.3% of individuals (3,985) out of the total population between 25 and 64 years of age (5,750) are in the labor force, with 5.7% or 227 of them being unemployed. The group with the highest labor force participation rate are those with the educational attainment of bachelor's degree or higher, with 83.9% or 704 individuals in the labor force. Within the labor force, individuals with less than high school education have the highest percentage of unemployment, with 18.8% or 83 of them being unemployed.
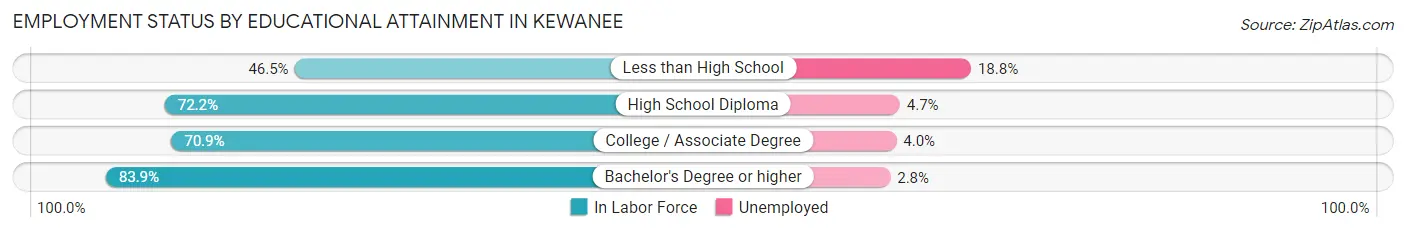
| Educational Attainment | In Labor Force | Unemployed |
| Less than High School | 441 (46.5%) | 178 (18.8%) |
| High School Diploma | 1,553 (72.2%) | 101 (4.7%) |
| College / Associate Degree | 1,284 (70.9%) | 72 (4.0%) |
| Bachelor's Degree or higher | 704 (83.9%) | 23 (2.8%) |
| Total | 3,985 (69.3%) | 328 (5.7%) |
Employment Occupations by Sex in Kewanee
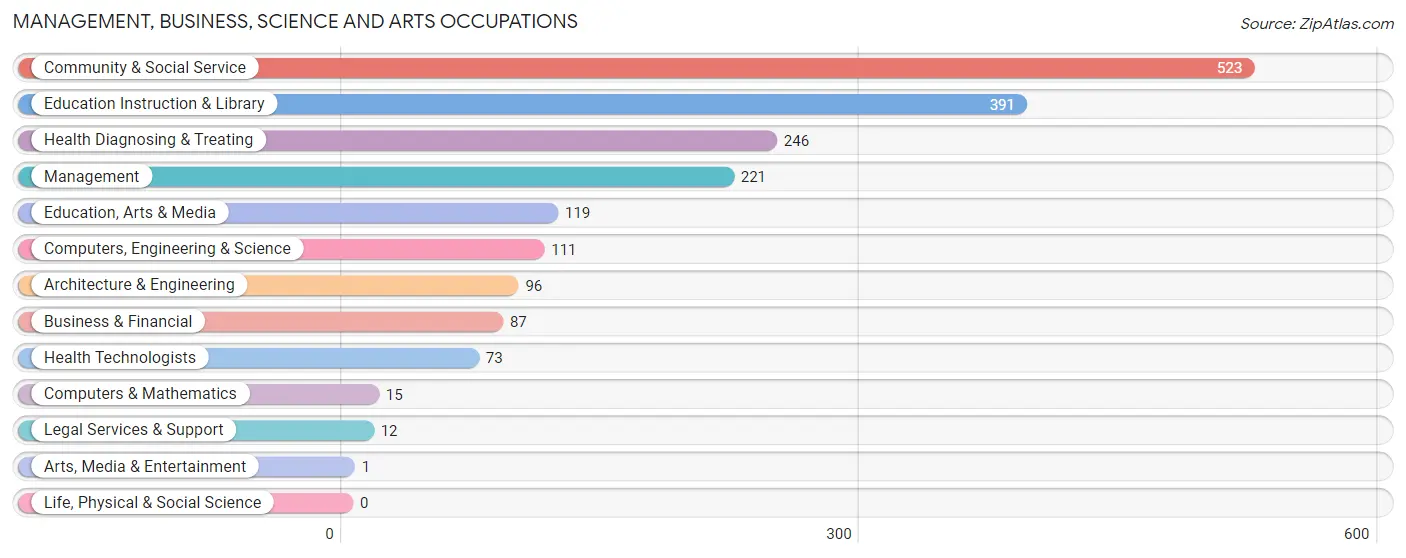
Management, Business, Science and Arts Occupations
The most common Management, Business, Science and Arts occupations in Kewanee are Community & Social Service (523 | 11.0%), Education Instruction & Library (391 | 8.2%), Health Diagnosing & Treating (246 | 5.2%), Management (221 | 4.6%), and Education, Arts & Media (119 | 2.5%).
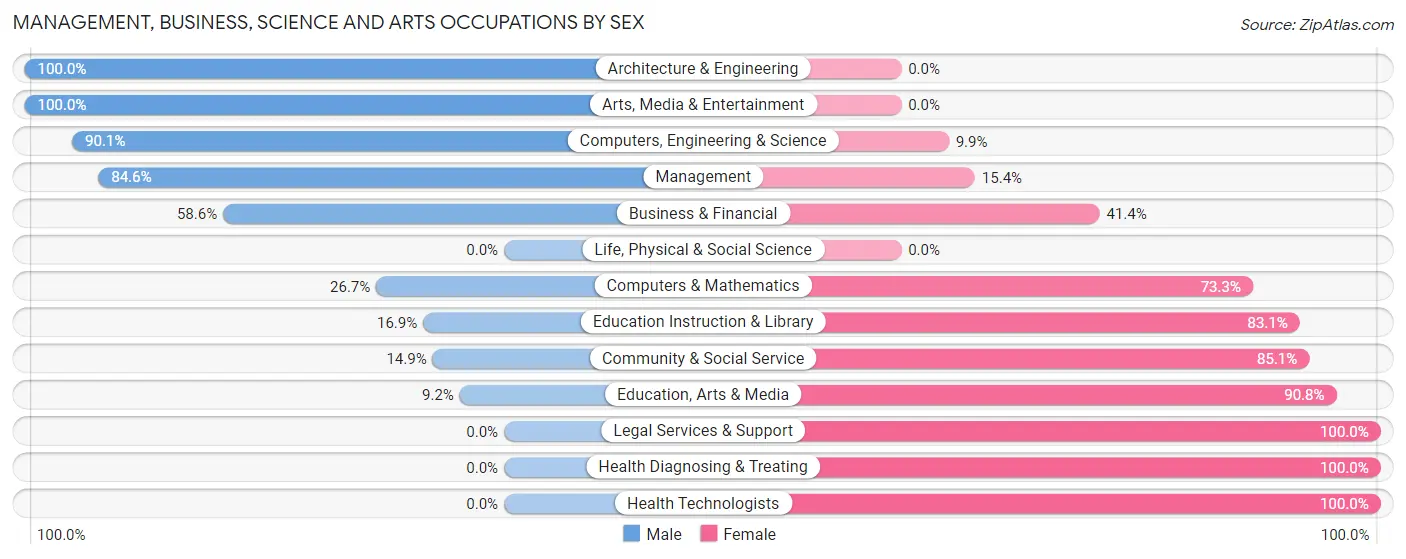
Management, Business, Science and Arts Occupations by Sex
Within the Management, Business, Science and Arts occupations in Kewanee, the most male-oriented occupations are Architecture & Engineering (100.0%), Arts, Media & Entertainment (100.0%), and Computers, Engineering & Science (90.1%), while the most female-oriented occupations are Legal Services & Support (100.0%), Health Diagnosing & Treating (100.0%), and Health Technologists (100.0%).
| Occupation | Male | Female |
| Management | 187 (84.6%) | 34 (15.4%) |
| Business & Financial | 51 (58.6%) | 36 (41.4%) |
| Computers, Engineering & Science | 100 (90.1%) | 11 (9.9%) |
| Computers & Mathematics | 4 (26.7%) | 11 (73.3%) |
| Architecture & Engineering | 96 (100.0%) | 0 (0.0%) |
| Life, Physical & Social Science | 0 (0.0%) | 0 (0.0%) |
| Community & Social Service | 78 (14.9%) | 445 (85.1%) |
| Education, Arts & Media | 11 (9.2%) | 108 (90.8%) |
| Legal Services & Support | 0 (0.0%) | 12 (100.0%) |
| Education Instruction & Library | 66 (16.9%) | 325 (83.1%) |
| Arts, Media & Entertainment | 1 (100.0%) | 0 (0.0%) |
| Health Diagnosing & Treating | 0 (0.0%) | 246 (100.0%) |
| Health Technologists | 0 (0.0%) | 73 (100.0%) |
| Total (Category) | 416 (35.0%) | 772 (65.0%) |
| Total (Overall) | 2,422 (50.8%) | 2,347 (49.2%) |
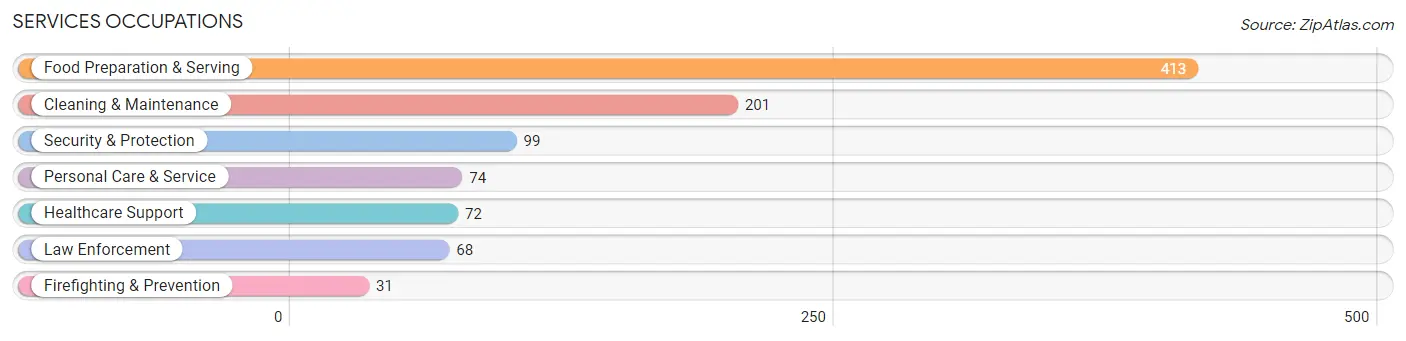
Services Occupations
The most common Services occupations in Kewanee are Food Preparation & Serving (413 | 8.7%), Cleaning & Maintenance (201 | 4.2%), Security & Protection (99 | 2.1%), Personal Care & Service (74 | 1.5%), and Healthcare Support (72 | 1.5%).
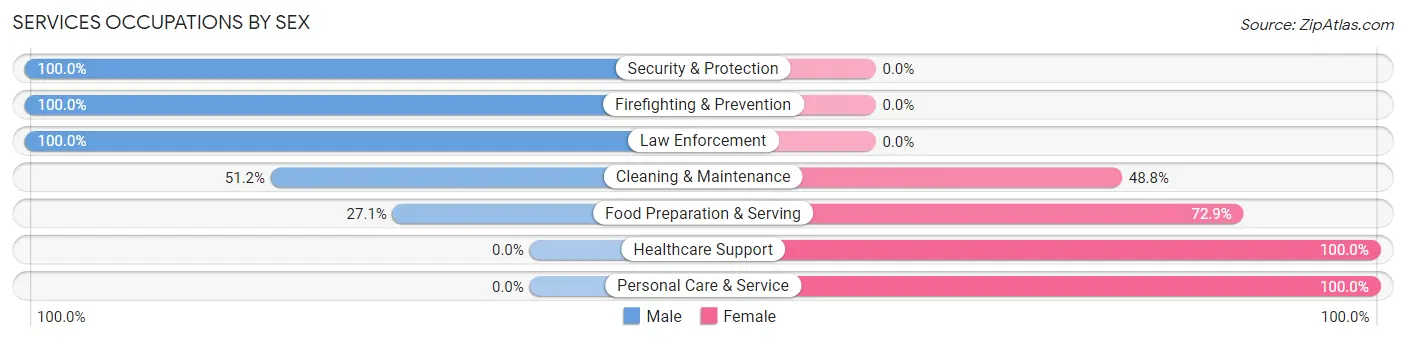
Services Occupations by Sex
Within the Services occupations in Kewanee, the most male-oriented occupations are Security & Protection (100.0%), Firefighting & Prevention (100.0%), and Law Enforcement (100.0%), while the most female-oriented occupations are Healthcare Support (100.0%), Personal Care & Service (100.0%), and Food Preparation & Serving (72.9%).
| Occupation | Male | Female |
| Healthcare Support | 0 (0.0%) | 72 (100.0%) |
| Security & Protection | 99 (100.0%) | 0 (0.0%) |
| Firefighting & Prevention | 31 (100.0%) | 0 (0.0%) |
| Law Enforcement | 68 (100.0%) | 0 (0.0%) |
| Food Preparation & Serving | 112 (27.1%) | 301 (72.9%) |
| Cleaning & Maintenance | 103 (51.2%) | 98 (48.8%) |
| Personal Care & Service | 0 (0.0%) | 74 (100.0%) |
| Total (Category) | 314 (36.5%) | 545 (63.4%) |
| Total (Overall) | 2,422 (50.8%) | 2,347 (49.2%) |
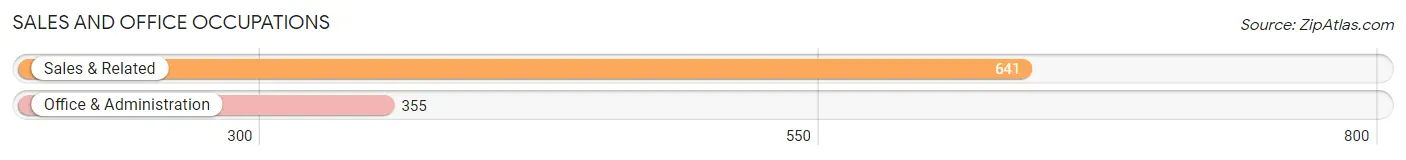
Sales and Office Occupations
The most common Sales and Office occupations in Kewanee are Sales & Related (641 | 13.4%), and Office & Administration (355 | 7.4%).
Sales and Office Occupations by Sex
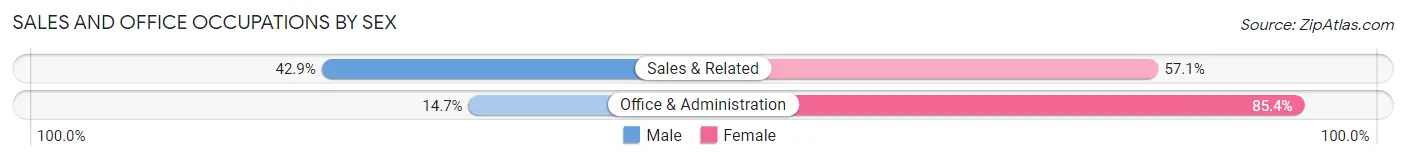
| Occupation | Male | Female |
| Sales & Related | 275 (42.9%) | 366 (57.1%) |
| Office & Administration | 52 (14.6%) | 303 (85.4%) |
| Total (Category) | 327 (32.8%) | 669 (67.2%) |
| Total (Overall) | 2,422 (50.8%) | 2,347 (49.2%) |
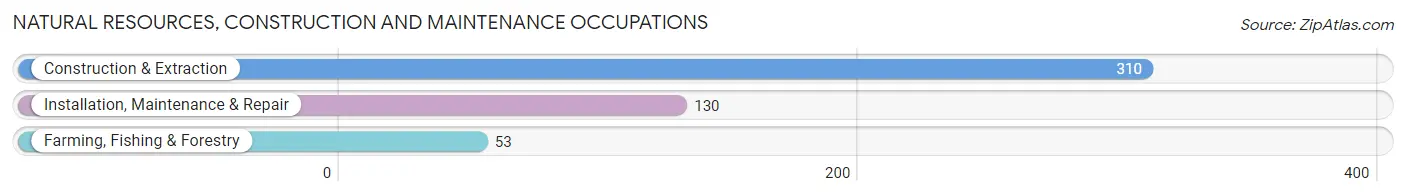
Natural Resources, Construction and Maintenance Occupations
The most common Natural Resources, Construction and Maintenance occupations in Kewanee are Construction & Extraction (310 | 6.5%), Installation, Maintenance & Repair (130 | 2.7%), and Farming, Fishing & Forestry (53 | 1.1%).
Natural Resources, Construction and Maintenance Occupations by Sex
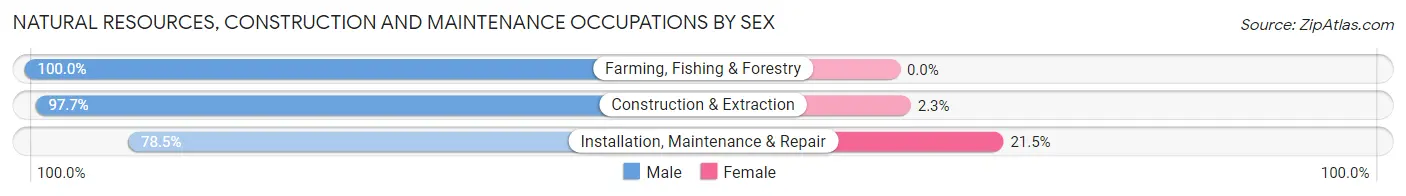
| Occupation | Male | Female |
| Farming, Fishing & Forestry | 53 (100.0%) | 0 (0.0%) |
| Construction & Extraction | 303 (97.7%) | 7 (2.3%) |
| Installation, Maintenance & Repair | 102 (78.5%) | 28 (21.5%) |
| Total (Category) | 458 (92.9%) | 35 (7.1%) |
| Total (Overall) | 2,422 (50.8%) | 2,347 (49.2%) |
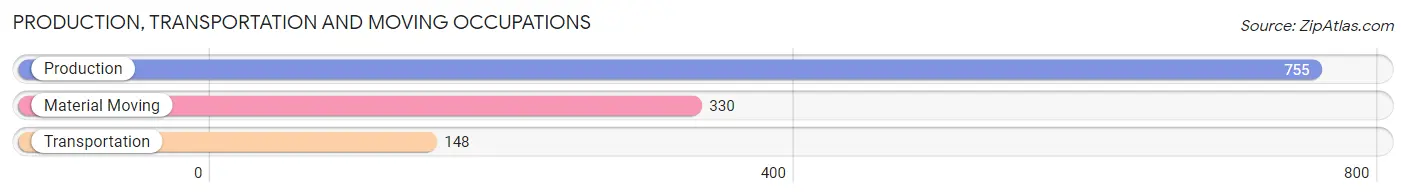
Production, Transportation and Moving Occupations
The most common Production, Transportation and Moving occupations in Kewanee are Production (755 | 15.8%), Material Moving (330 | 6.9%), and Transportation (148 | 3.1%).
Production, Transportation and Moving Occupations by Sex
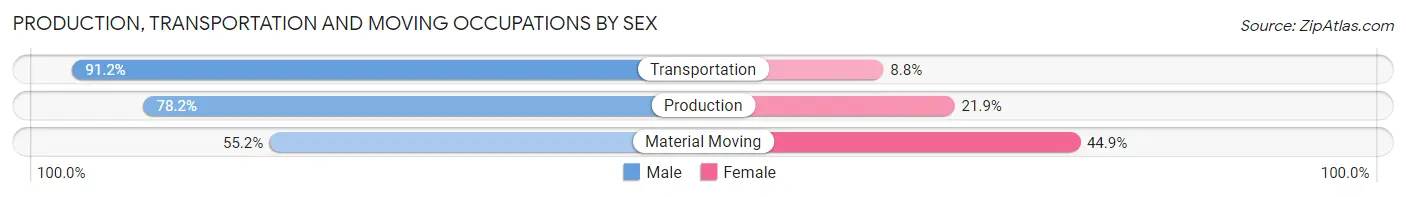
| Occupation | Male | Female |
| Production | 590 (78.1%) | 165 (21.8%) |
| Transportation | 135 (91.2%) | 13 (8.8%) |
| Material Moving | 182 (55.1%) | 148 (44.9%) |
| Total (Category) | 907 (73.6%) | 326 (26.4%) |
| Total (Overall) | 2,422 (50.8%) | 2,347 (49.2%) |
Employment Industries by Sex in Kewanee
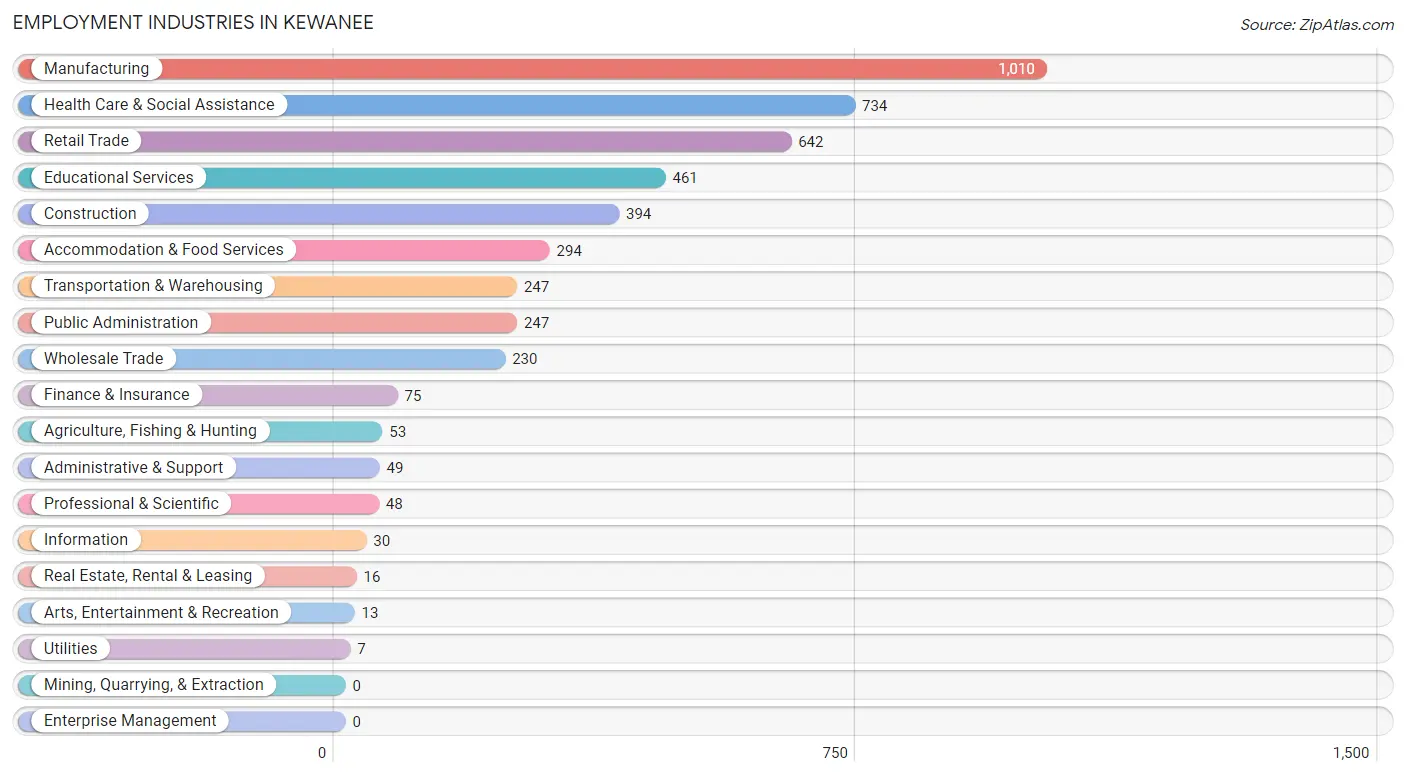
Employment Industries in Kewanee
The major employment industries in Kewanee include Manufacturing (1,010 | 21.2%), Health Care & Social Assistance (734 | 15.4%), Retail Trade (642 | 13.5%), Educational Services (461 | 9.7%), and Construction (394 | 8.3%).
Employment Industries by Sex in Kewanee
The Kewanee industries that see more men than women are Agriculture, Fishing & Hunting (100.0%), Utilities (100.0%), and Arts, Entertainment & Recreation (100.0%), whereas the industries that tend to have a higher number of women are Finance & Insurance (89.3%), Health Care & Social Assistance (89.0%), and Educational Services (76.8%).
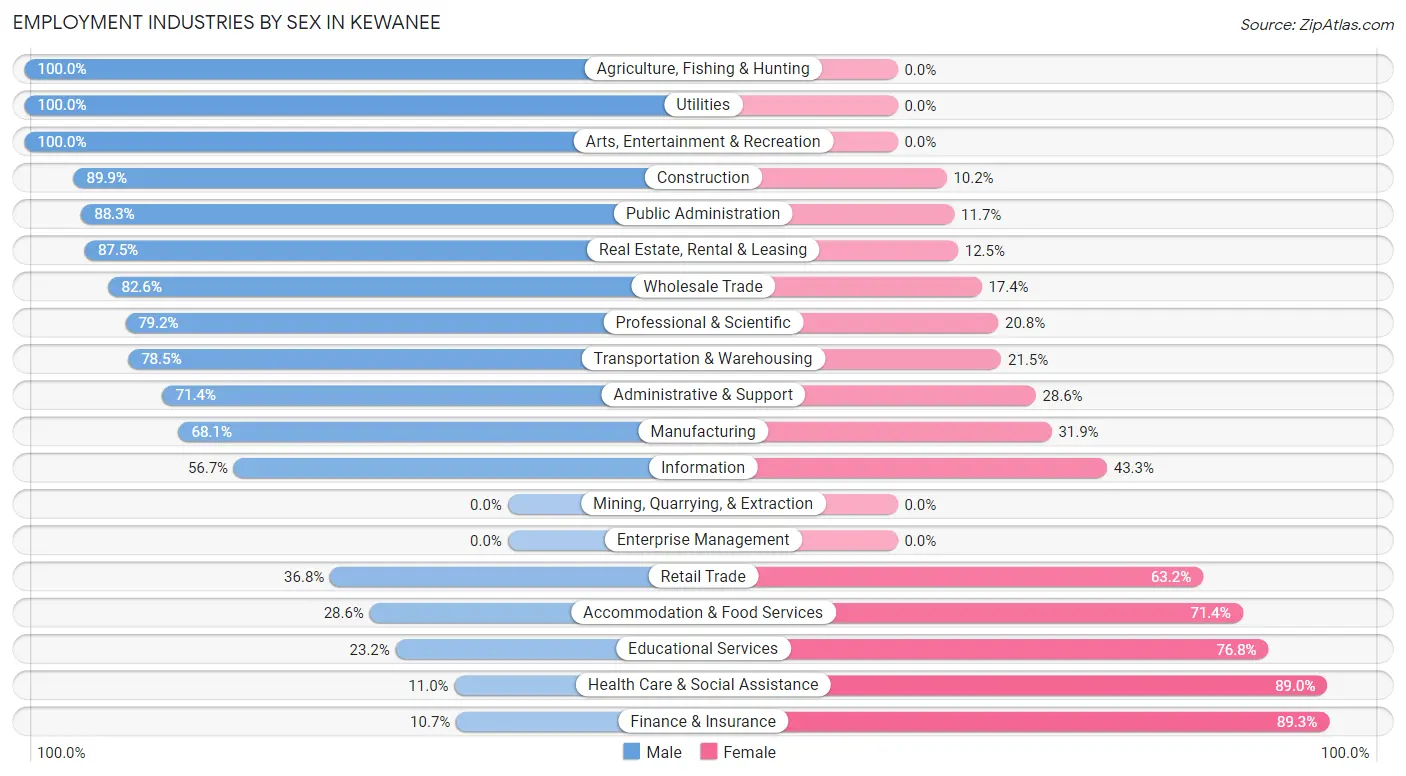
| Industry | Male | Female |
| Agriculture, Fishing & Hunting | 53 (100.0%) | 0 (0.0%) |
| Mining, Quarrying, & Extraction | 0 (0.0%) | 0 (0.0%) |
| Construction | 354 (89.8%) | 40 (10.2%) |
| Manufacturing | 688 (68.1%) | 322 (31.9%) |
| Wholesale Trade | 190 (82.6%) | 40 (17.4%) |
| Retail Trade | 236 (36.8%) | 406 (63.2%) |
| Transportation & Warehousing | 194 (78.5%) | 53 (21.5%) |
| Utilities | 7 (100.0%) | 0 (0.0%) |
| Information | 17 (56.7%) | 13 (43.3%) |
| Finance & Insurance | 8 (10.7%) | 67 (89.3%) |
| Real Estate, Rental & Leasing | 14 (87.5%) | 2 (12.5%) |
| Professional & Scientific | 38 (79.2%) | 10 (20.8%) |
| Enterprise Management | 0 (0.0%) | 0 (0.0%) |
| Administrative & Support | 35 (71.4%) | 14 (28.6%) |
| Educational Services | 107 (23.2%) | 354 (76.8%) |
| Health Care & Social Assistance | 81 (11.0%) | 653 (89.0%) |
| Arts, Entertainment & Recreation | 13 (100.0%) | 0 (0.0%) |
| Accommodation & Food Services | 84 (28.6%) | 210 (71.4%) |
| Public Administration | 218 (88.3%) | 29 (11.7%) |
| Total | 2,422 (50.8%) | 2,347 (49.2%) |
Education in Kewanee
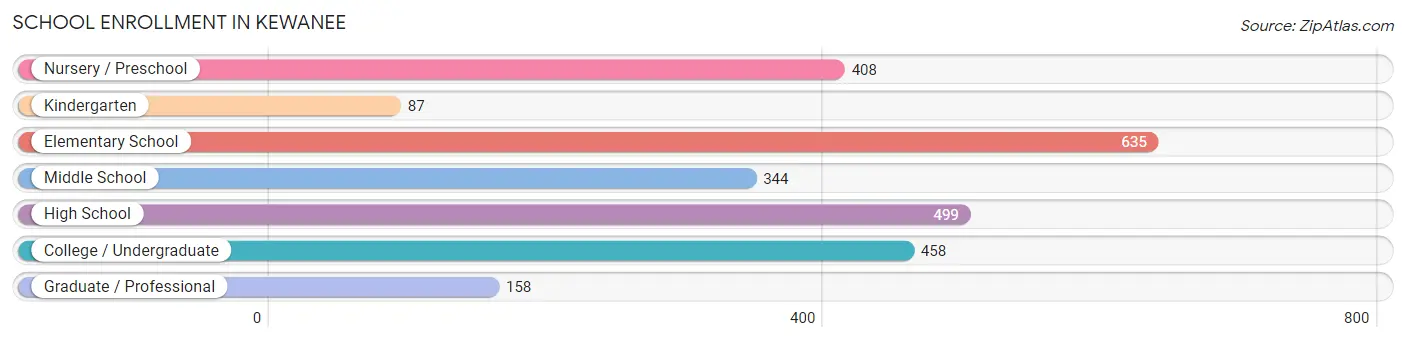
School Enrollment in Kewanee
The most common levels of schooling among the 2,589 students in Kewanee are elementary school (635 | 24.5%), high school (499 | 19.3%), and college / undergraduate (458 | 17.7%).
| School Level | # Students | % Students |
| Nursery / Preschool | 408 | 15.8% |
| Kindergarten | 87 | 3.4% |
| Elementary School | 635 | 24.5% |
| Middle School | 344 | 13.3% |
| High School | 499 | 19.3% |
| College / Undergraduate | 458 | 17.7% |
| Graduate / Professional | 158 | 6.1% |
| Total | 2,589 | 100.0% |
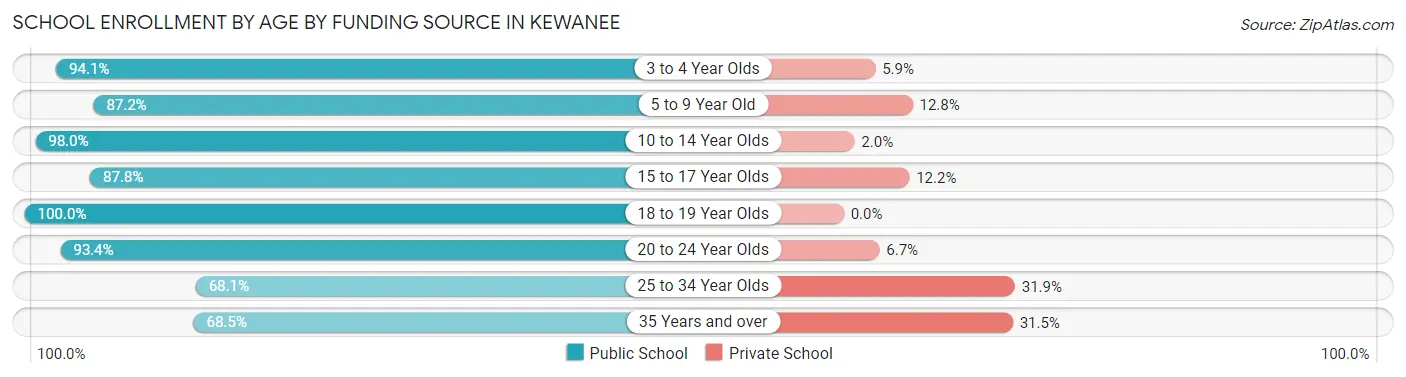
School Enrollment by Age by Funding Source in Kewanee
Out of a total of 2,589 students who are enrolled in schools in Kewanee, 238 (9.2%) attend a private institution, while the remaining 2,351 (90.8%) are enrolled in public schools. The age group of 25 to 34 year olds has the highest likelihood of being enrolled in private schools, with 22 (31.9% in the age bracket) enrolled. Conversely, the age group of 18 to 19 year olds has the lowest likelihood of being enrolled in a private school, with 141 (100.0% in the age bracket) attending a public institution.
| Age Bracket | Public School | Private School |
| 3 to 4 Year Olds | 336 (94.1%) | 21 (5.9%) |
| 5 to 9 Year Old | 625 (87.2%) | 92 (12.8%) |
| 10 to 14 Year Olds | 440 (98.0%) | 9 (2.0%) |
| 15 to 17 Year Olds | 374 (87.8%) | 52 (12.2%) |
| 18 to 19 Year Olds | 141 (100.0%) | 0 (0.0%) |
| 20 to 24 Year Olds | 351 (93.3%) | 25 (6.7%) |
| 25 to 34 Year Olds | 47 (68.1%) | 22 (31.9%) |
| 35 Years and over | 37 (68.5%) | 17 (31.5%) |
| Total | 2,351 (90.8%) | 238 (9.2%) |
Educational Attainment by Field of Study in Kewanee
Business (371 | 28.6%), education (327 | 25.2%), psychology (100 | 7.7%), liberal arts & history (97 | 7.5%), and social sciences (80 | 6.2%) are the most common fields of study among 1,297 individuals in Kewanee who have obtained a bachelor's degree or higher.
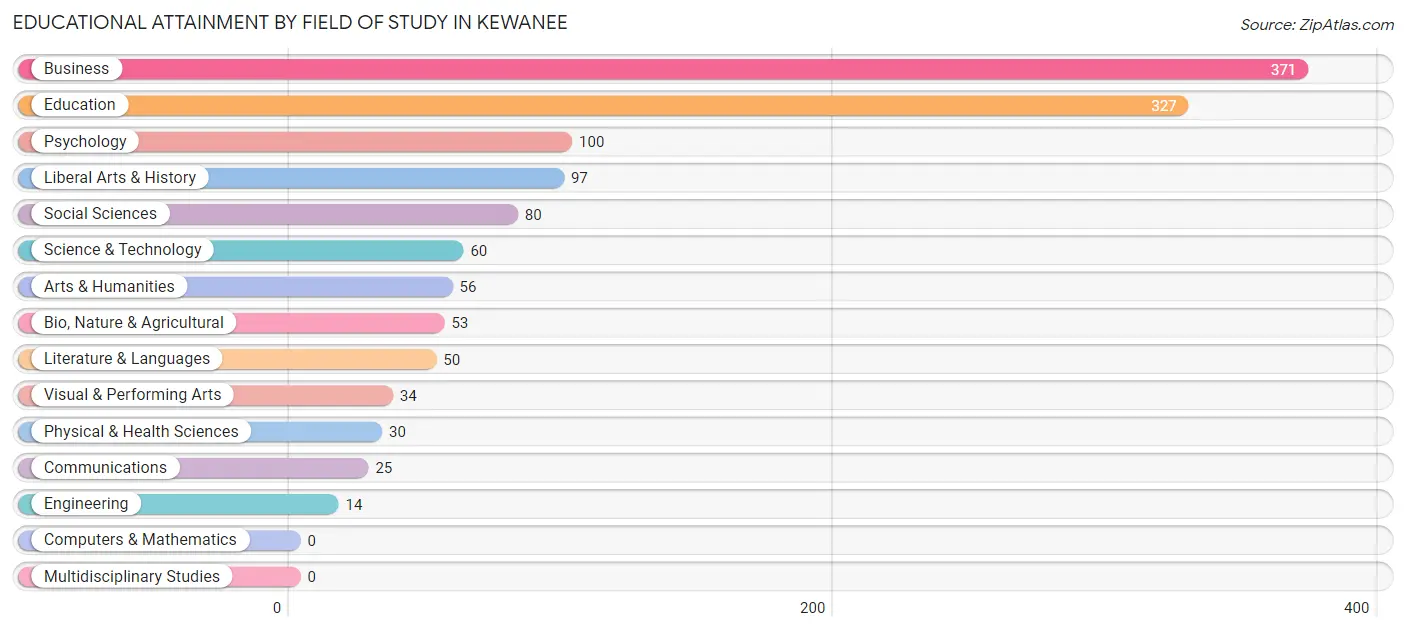
| Field of Study | # Graduates | % Graduates |
| Computers & Mathematics | 0 | 0.0% |
| Bio, Nature & Agricultural | 53 | 4.1% |
| Physical & Health Sciences | 30 | 2.3% |
| Psychology | 100 | 7.7% |
| Social Sciences | 80 | 6.2% |
| Engineering | 14 | 1.1% |
| Multidisciplinary Studies | 0 | 0.0% |
| Science & Technology | 60 | 4.6% |
| Business | 371 | 28.6% |
| Education | 327 | 25.2% |
| Literature & Languages | 50 | 3.9% |
| Liberal Arts & History | 97 | 7.5% |
| Visual & Performing Arts | 34 | 2.6% |
| Communications | 25 | 1.9% |
| Arts & Humanities | 56 | 4.3% |
| Total | 1,297 | 100.0% |
Transportation & Commute in Kewanee
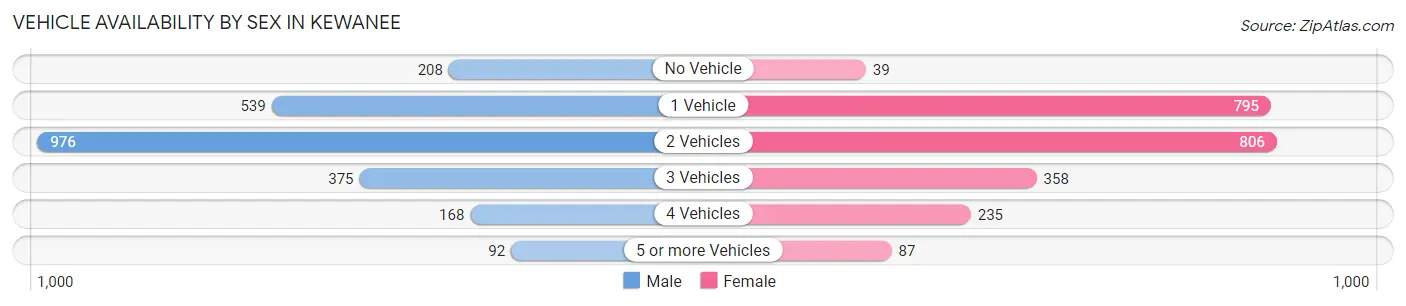
Vehicle Availability by Sex in Kewanee
The most prevalent vehicle ownership categories in Kewanee are males with 2 vehicles (976, accounting for 41.4%) and females with 2 vehicles (806, making up 42.1%).
| Vehicles Available | Male | Female |
| No Vehicle | 208 (8.8%) | 39 (1.7%) |
| 1 Vehicle | 539 (22.9%) | 795 (34.3%) |
| 2 Vehicles | 976 (41.4%) | 806 (34.7%) |
| 3 Vehicles | 375 (15.9%) | 358 (15.4%) |
| 4 Vehicles | 168 (7.1%) | 235 (10.1%) |
| 5 or more Vehicles | 92 (3.9%) | 87 (3.7%) |
| Total | 2,358 (100.0%) | 2,320 (100.0%) |
Commute Time in Kewanee
The most frequently occuring commute durations in Kewanee are 5 to 9 minutes (1,535 commuters, 34.7%), less than 5 minutes (561 commuters, 12.7%), and 10 to 14 minutes (555 commuters, 12.6%).
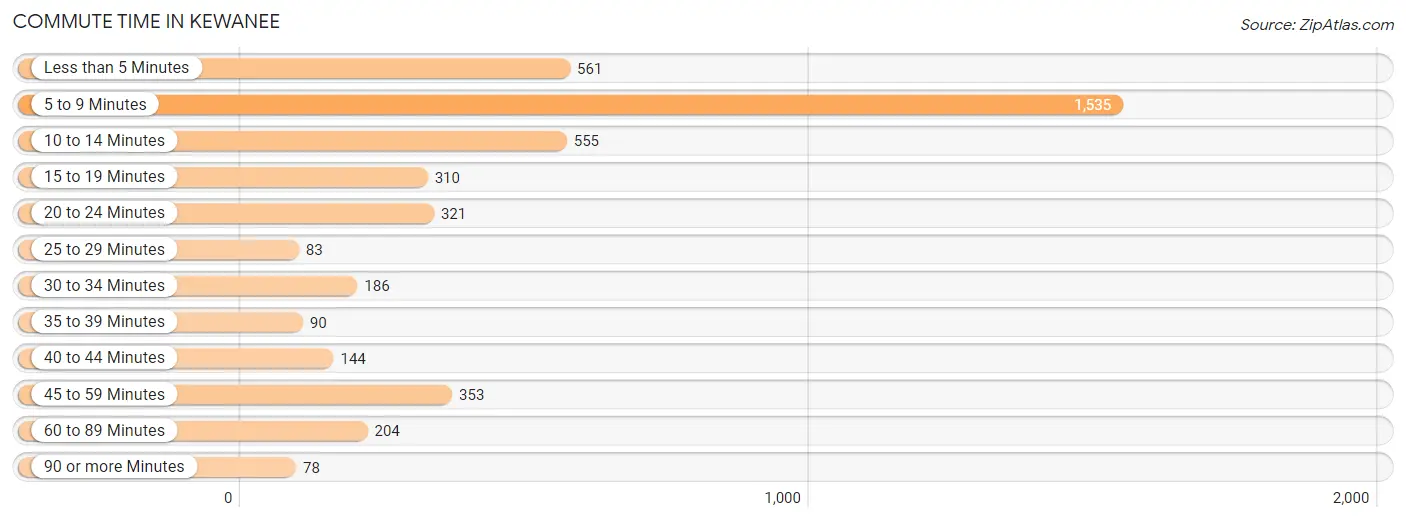
| Commute Time | # Commuters | % Commuters |
| Less than 5 Minutes | 561 | 12.7% |
| 5 to 9 Minutes | 1,535 | 34.7% |
| 10 to 14 Minutes | 555 | 12.6% |
| 15 to 19 Minutes | 310 | 7.0% |
| 20 to 24 Minutes | 321 | 7.3% |
| 25 to 29 Minutes | 83 | 1.9% |
| 30 to 34 Minutes | 186 | 4.2% |
| 35 to 39 Minutes | 90 | 2.0% |
| 40 to 44 Minutes | 144 | 3.3% |
| 45 to 59 Minutes | 353 | 8.0% |
| 60 to 89 Minutes | 204 | 4.6% |
| 90 or more Minutes | 78 | 1.8% |
Commute Time by Sex in Kewanee
The most common commute times in Kewanee are 5 to 9 minutes (554 commuters, 24.8%) for males and 5 to 9 minutes (981 commuters, 44.9%) for females.
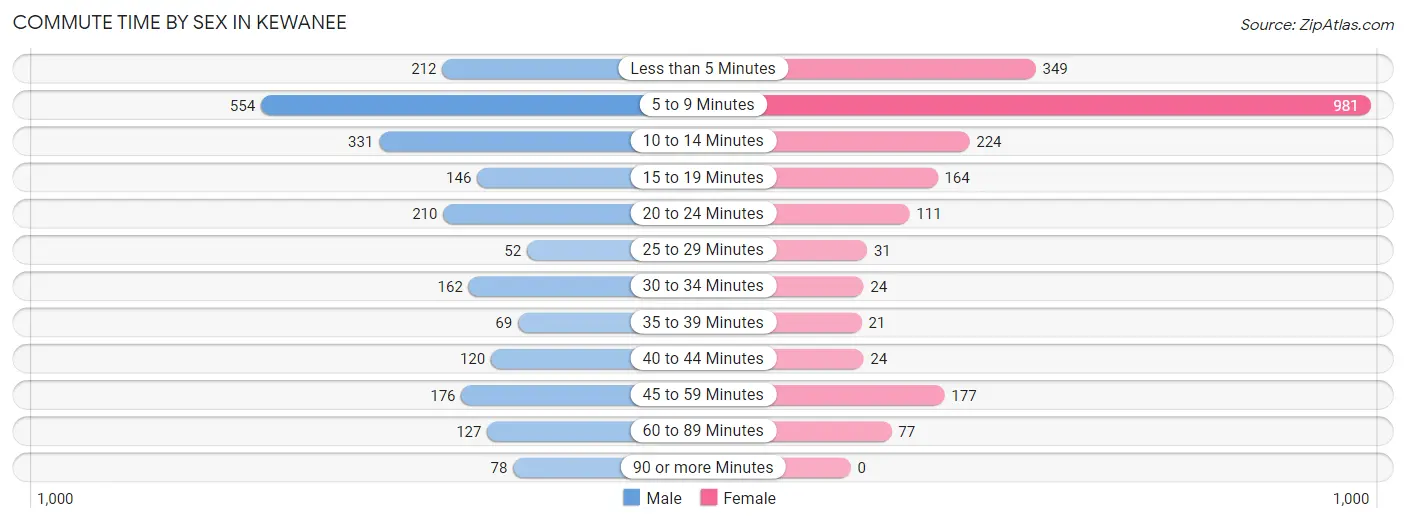
| Commute Time | Male | Female |
| Less than 5 Minutes | 212 (9.5%) | 349 (16.0%) |
| 5 to 9 Minutes | 554 (24.8%) | 981 (44.9%) |
| 10 to 14 Minutes | 331 (14.8%) | 224 (10.3%) |
| 15 to 19 Minutes | 146 (6.5%) | 164 (7.5%) |
| 20 to 24 Minutes | 210 (9.4%) | 111 (5.1%) |
| 25 to 29 Minutes | 52 (2.3%) | 31 (1.4%) |
| 30 to 34 Minutes | 162 (7.2%) | 24 (1.1%) |
| 35 to 39 Minutes | 69 (3.1%) | 21 (1.0%) |
| 40 to 44 Minutes | 120 (5.4%) | 24 (1.1%) |
| 45 to 59 Minutes | 176 (7.9%) | 177 (8.1%) |
| 60 to 89 Minutes | 127 (5.7%) | 77 (3.5%) |
| 90 or more Minutes | 78 (3.5%) | 0 (0.0%) |
Time of Departure to Work by Sex in Kewanee
The most frequent times of departure to work in Kewanee are 6:00 AM to 6:29 AM (407, 18.2%) for males and 7:00 AM to 7:29 AM (391, 17.9%) for females.
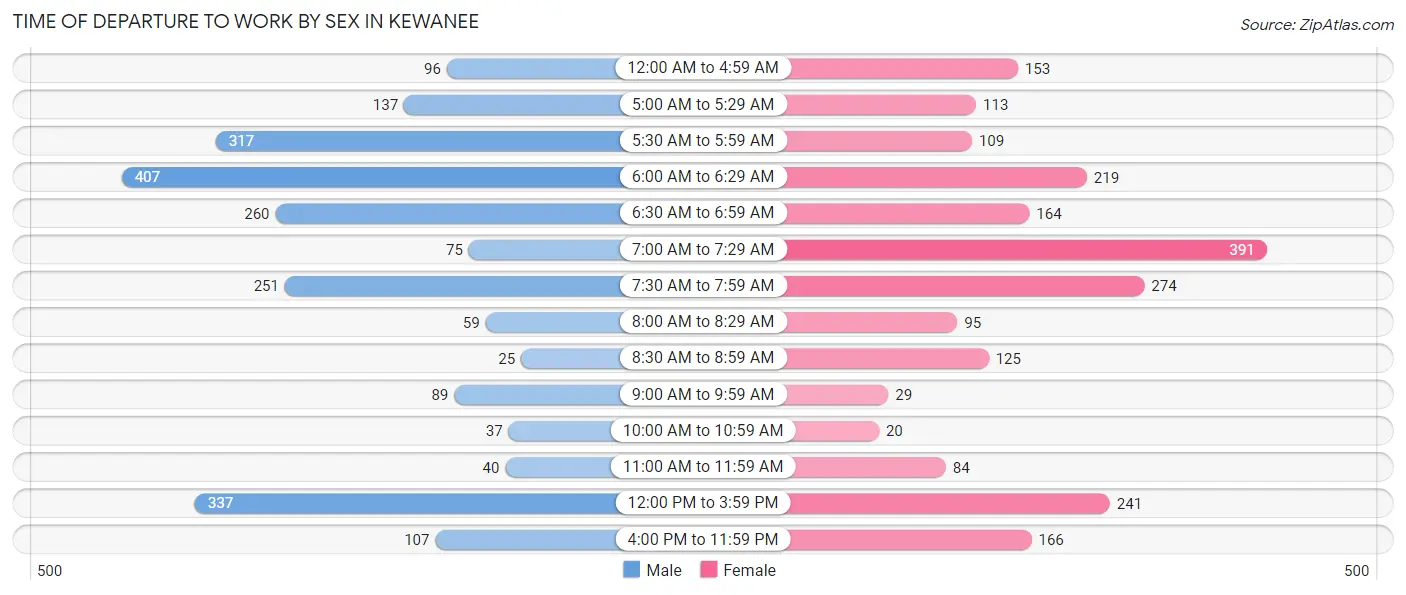
| Time of Departure | Male | Female |
| 12:00 AM to 4:59 AM | 96 (4.3%) | 153 (7.0%) |
| 5:00 AM to 5:29 AM | 137 (6.1%) | 113 (5.2%) |
| 5:30 AM to 5:59 AM | 317 (14.2%) | 109 (5.0%) |
| 6:00 AM to 6:29 AM | 407 (18.2%) | 219 (10.0%) |
| 6:30 AM to 6:59 AM | 260 (11.6%) | 164 (7.5%) |
| 7:00 AM to 7:29 AM | 75 (3.4%) | 391 (17.9%) |
| 7:30 AM to 7:59 AM | 251 (11.2%) | 274 (12.6%) |
| 8:00 AM to 8:29 AM | 59 (2.6%) | 95 (4.3%) |
| 8:30 AM to 8:59 AM | 25 (1.1%) | 125 (5.7%) |
| 9:00 AM to 9:59 AM | 89 (4.0%) | 29 (1.3%) |
| 10:00 AM to 10:59 AM | 37 (1.7%) | 20 (0.9%) |
| 11:00 AM to 11:59 AM | 40 (1.8%) | 84 (3.8%) |
| 12:00 PM to 3:59 PM | 337 (15.1%) | 241 (11.0%) |
| 4:00 PM to 11:59 PM | 107 (4.8%) | 166 (7.6%) |
| Total | 2,237 (100.0%) | 2,183 (100.0%) |
Housing Occupancy in Kewanee
Occupancy by Ownership in Kewanee
Of the total 5,084 dwellings in Kewanee, owner-occupied units account for 3,469 (68.2%), while renter-occupied units make up 1,615 (31.8%).
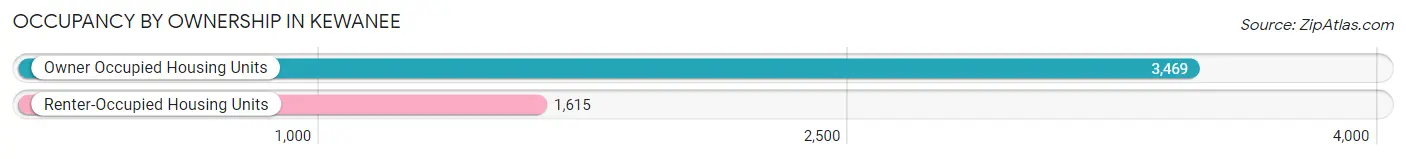
| Occupancy | # Housing Units | % Housing Units |
| Owner Occupied Housing Units | 3,469 | 68.2% |
| Renter-Occupied Housing Units | 1,615 | 31.8% |
| Total Occupied Housing Units | 5,084 | 100.0% |
Occupancy by Household Size in Kewanee
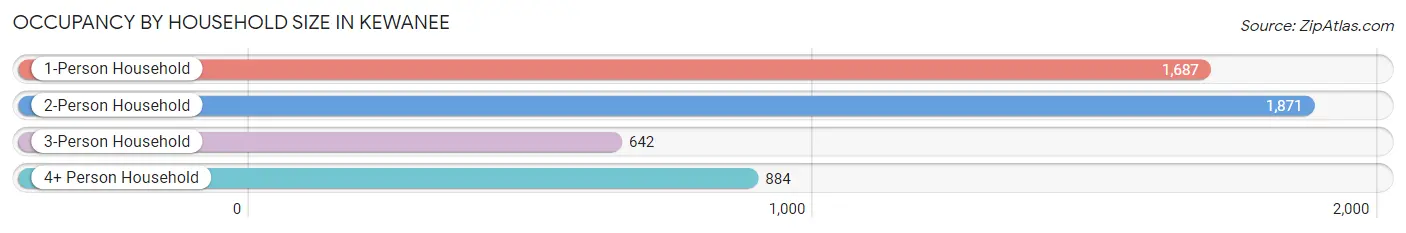
| Household Size | # Housing Units | % Housing Units |
| 1-Person Household | 1,687 | 33.2% |
| 2-Person Household | 1,871 | 36.8% |
| 3-Person Household | 642 | 12.6% |
| 4+ Person Household | 884 | 17.4% |
| Total Housing Units | 5,084 | 100.0% |
Occupancy by Ownership by Household Size in Kewanee
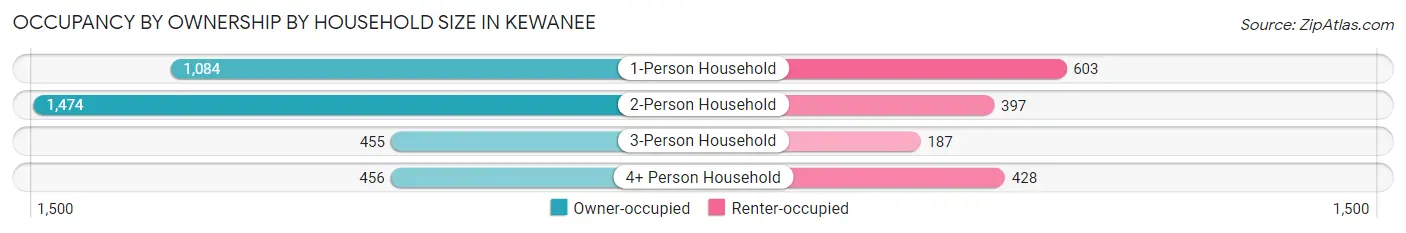
| Household Size | Owner-occupied | Renter-occupied |
| 1-Person Household | 1,084 (64.3%) | 603 (35.7%) |
| 2-Person Household | 1,474 (78.8%) | 397 (21.2%) |
| 3-Person Household | 455 (70.9%) | 187 (29.1%) |
| 4+ Person Household | 456 (51.6%) | 428 (48.4%) |
| Total Housing Units | 3,469 (68.2%) | 1,615 (31.8%) |
Occupancy by Educational Attainment in Kewanee
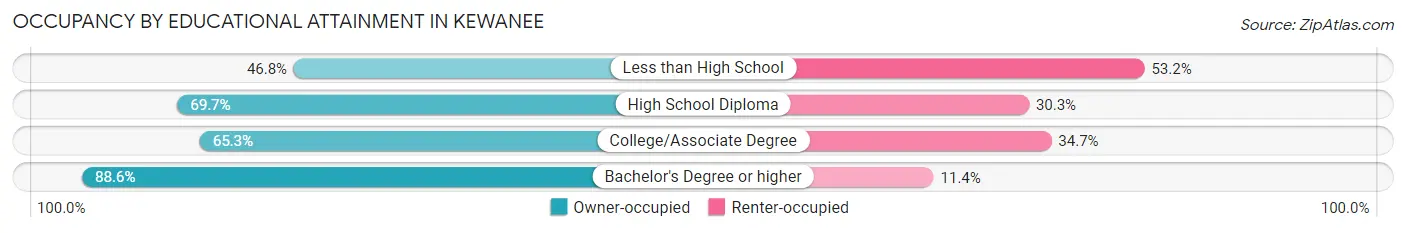
| Household Size | Owner-occupied | Renter-occupied |
| Less than High School | 336 (46.8%) | 382 (53.2%) |
| High School Diploma | 1,429 (69.7%) | 621 (30.3%) |
| College/Associate Degree | 973 (65.3%) | 518 (34.7%) |
| Bachelor's Degree or higher | 731 (88.6%) | 94 (11.4%) |
Occupancy by Age of Householder in Kewanee
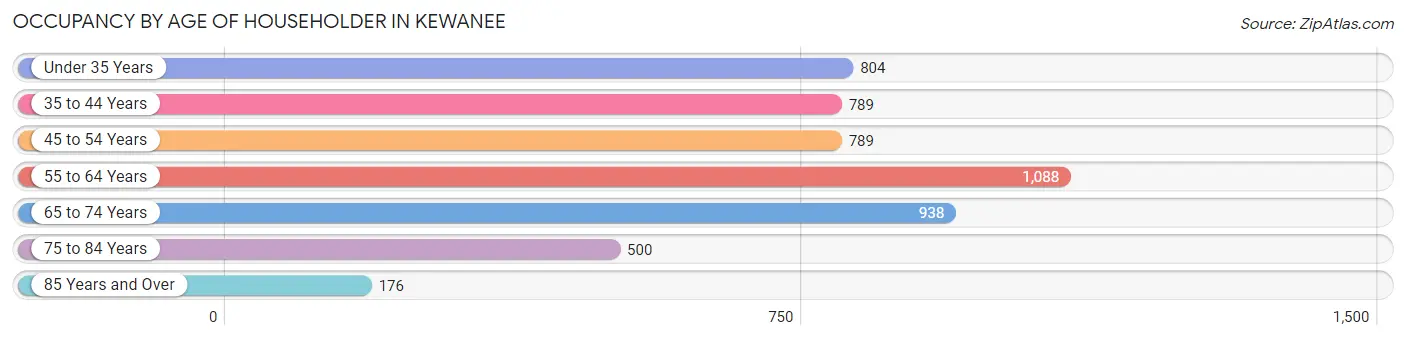
| Age Bracket | # Households | % Households |
| Under 35 Years | 804 | 15.8% |
| 35 to 44 Years | 789 | 15.5% |
| 45 to 54 Years | 789 | 15.5% |
| 55 to 64 Years | 1,088 | 21.4% |
| 65 to 74 Years | 938 | 18.4% |
| 75 to 84 Years | 500 | 9.8% |
| 85 Years and Over | 176 | 3.5% |
| Total | 5,084 | 100.0% |
Housing Finances in Kewanee
Median Income by Occupancy in Kewanee
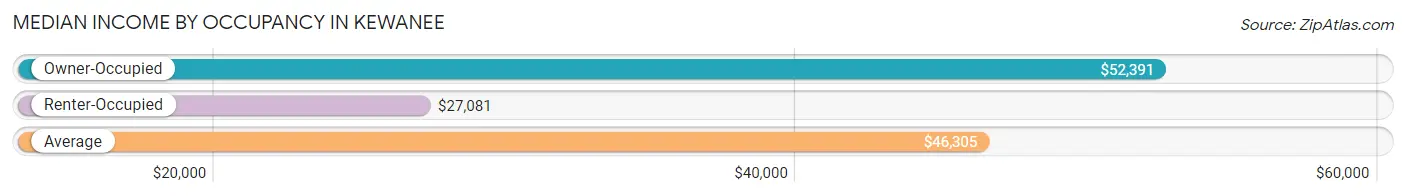
| Occupancy Type | # Households | Median Income |
| Owner-Occupied | 3,469 (68.2%) | $52,391 |
| Renter-Occupied | 1,615 (31.8%) | $27,081 |
| Average | 5,084 (100.0%) | $46,305 |
Occupancy by Householder Income Bracket in Kewanee
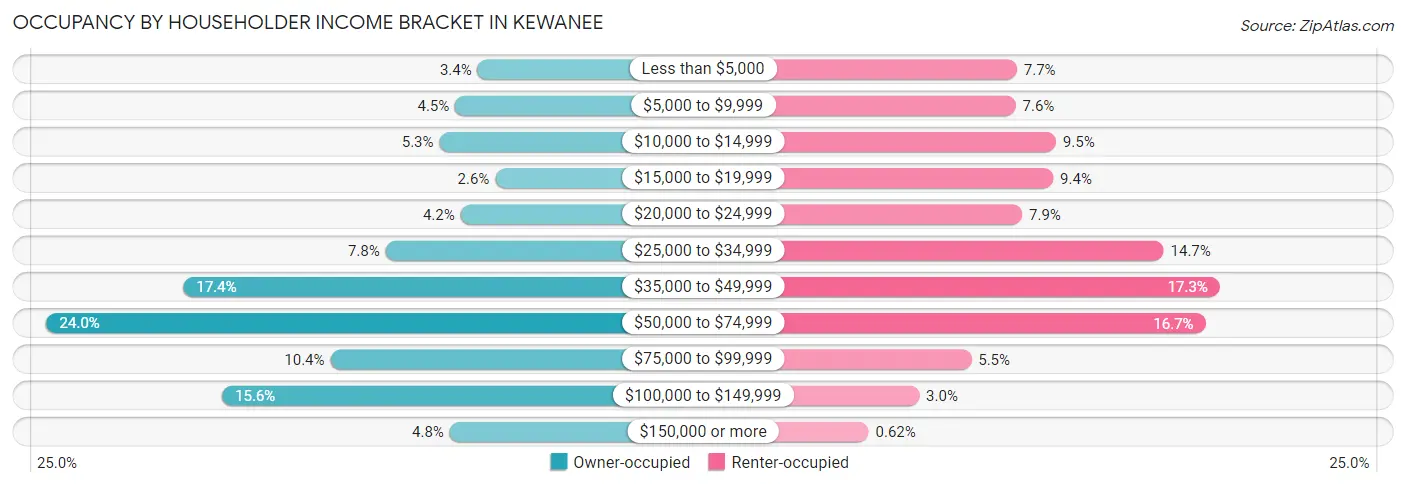
| Income Bracket | Owner-occupied | Renter-occupied |
| Less than $5,000 | 119 (3.4%) | 124 (7.7%) |
| $5,000 to $9,999 | 156 (4.5%) | 123 (7.6%) |
| $10,000 to $14,999 | 182 (5.2%) | 154 (9.5%) |
| $15,000 to $19,999 | 90 (2.6%) | 152 (9.4%) |
| $20,000 to $24,999 | 147 (4.2%) | 128 (7.9%) |
| $25,000 to $34,999 | 271 (7.8%) | 237 (14.7%) |
| $35,000 to $49,999 | 605 (17.4%) | 280 (17.3%) |
| $50,000 to $74,999 | 831 (24.0%) | 269 (16.7%) |
| $75,000 to $99,999 | 362 (10.4%) | 89 (5.5%) |
| $100,000 to $149,999 | 541 (15.6%) | 49 (3.0%) |
| $150,000 or more | 165 (4.8%) | 10 (0.6%) |
| Total | 3,469 (100.0%) | 1,615 (100.0%) |
Monthly Housing Cost Tiers in Kewanee
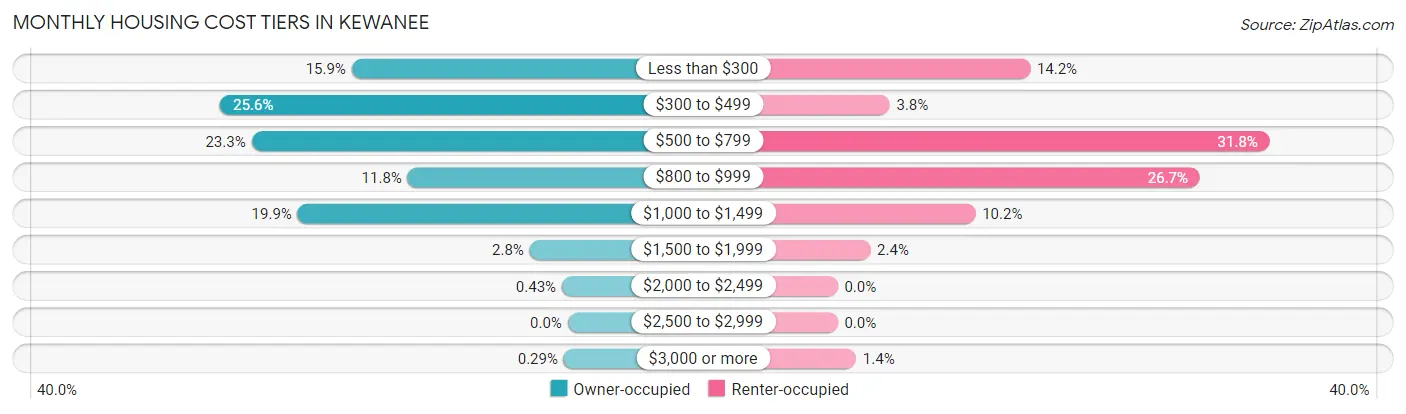
| Monthly Cost | Owner-occupied | Renter-occupied |
| Less than $300 | 552 (15.9%) | 229 (14.2%) |
| $300 to $499 | 888 (25.6%) | 62 (3.8%) |
| $500 to $799 | 808 (23.3%) | 514 (31.8%) |
| $800 to $999 | 409 (11.8%) | 431 (26.7%) |
| $1,000 to $1,499 | 690 (19.9%) | 164 (10.2%) |
| $1,500 to $1,999 | 97 (2.8%) | 39 (2.4%) |
| $2,000 to $2,499 | 15 (0.4%) | 0 (0.0%) |
| $2,500 to $2,999 | 0 (0.0%) | 0 (0.0%) |
| $3,000 or more | 10 (0.3%) | 22 (1.4%) |
| Total | 3,469 (100.0%) | 1,615 (100.0%) |
Physical Housing Characteristics in Kewanee
Housing Structures in Kewanee
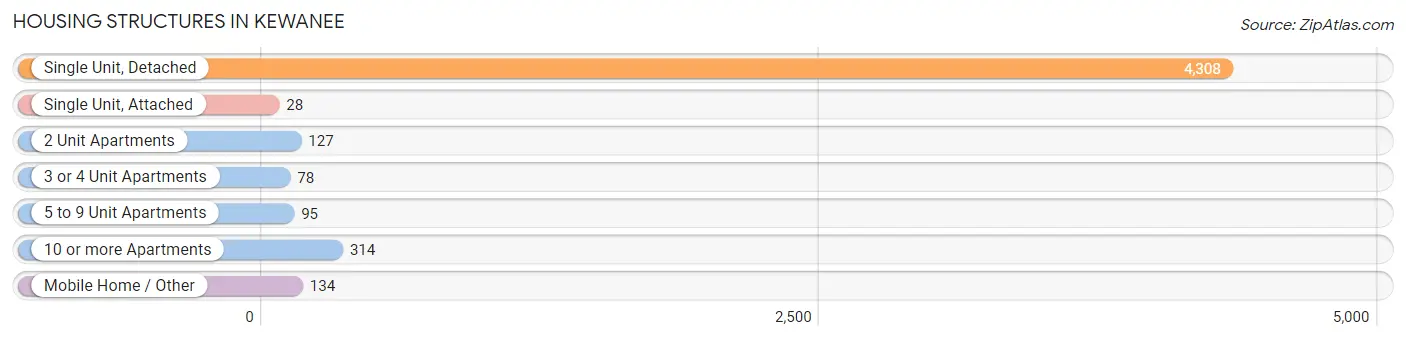
| Structure Type | # Housing Units | % Housing Units |
| Single Unit, Detached | 4,308 | 84.7% |
| Single Unit, Attached | 28 | 0.5% |
| 2 Unit Apartments | 127 | 2.5% |
| 3 or 4 Unit Apartments | 78 | 1.5% |
| 5 to 9 Unit Apartments | 95 | 1.9% |
| 10 or more Apartments | 314 | 6.2% |
| Mobile Home / Other | 134 | 2.6% |
| Total | 5,084 | 100.0% |
Housing Structures by Occupancy in Kewanee
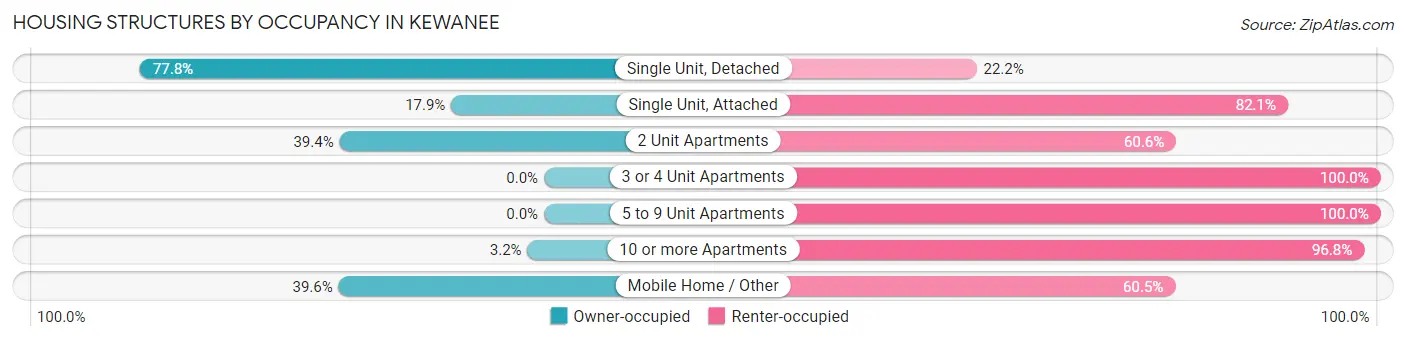
| Structure Type | Owner-occupied | Renter-occupied |
| Single Unit, Detached | 3,351 (77.8%) | 957 (22.2%) |
| Single Unit, Attached | 5 (17.9%) | 23 (82.1%) |
| 2 Unit Apartments | 50 (39.4%) | 77 (60.6%) |
| 3 or 4 Unit Apartments | 0 (0.0%) | 78 (100.0%) |
| 5 to 9 Unit Apartments | 0 (0.0%) | 95 (100.0%) |
| 10 or more Apartments | 10 (3.2%) | 304 (96.8%) |
| Mobile Home / Other | 53 (39.6%) | 81 (60.5%) |
| Total | 3,469 (68.2%) | 1,615 (31.8%) |
Housing Structures by Number of Rooms in Kewanee
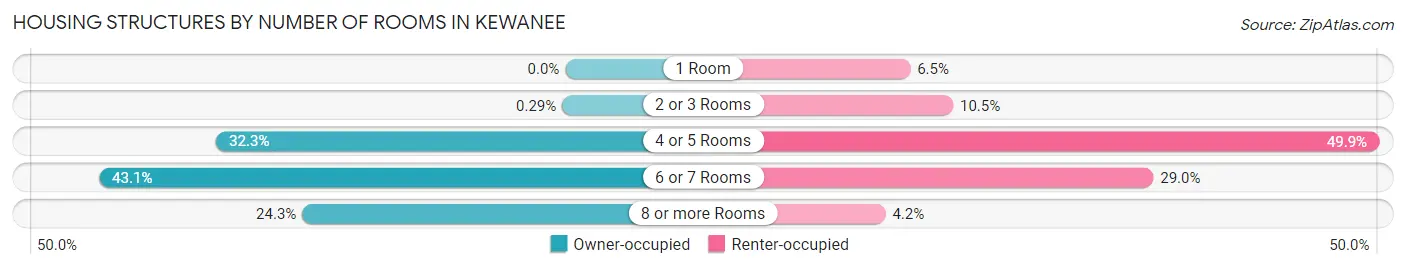
| Number of Rooms | Owner-occupied | Renter-occupied |
| 1 Room | 0 (0.0%) | 105 (6.5%) |
| 2 or 3 Rooms | 10 (0.3%) | 169 (10.5%) |
| 4 or 5 Rooms | 1,120 (32.3%) | 805 (49.8%) |
| 6 or 7 Rooms | 1,495 (43.1%) | 468 (29.0%) |
| 8 or more Rooms | 844 (24.3%) | 68 (4.2%) |
| Total | 3,469 (100.0%) | 1,615 (100.0%) |
Housing Structure by Heating Type in Kewanee
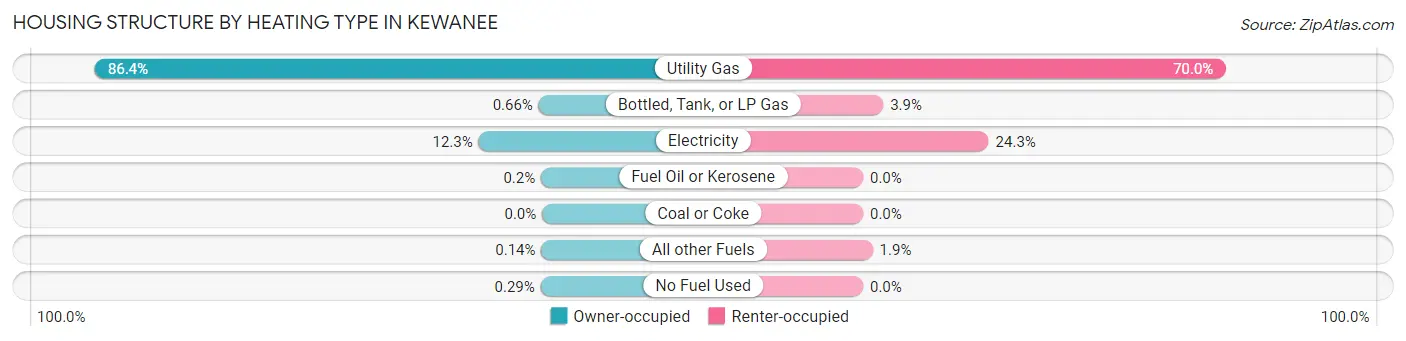
| Heating Type | Owner-occupied | Renter-occupied |
| Utility Gas | 2,998 (86.4%) | 1,130 (70.0%) |
| Bottled, Tank, or LP Gas | 23 (0.7%) | 63 (3.9%) |
| Electricity | 426 (12.3%) | 392 (24.3%) |
| Fuel Oil or Kerosene | 7 (0.2%) | 0 (0.0%) |
| Coal or Coke | 0 (0.0%) | 0 (0.0%) |
| All other Fuels | 5 (0.1%) | 30 (1.9%) |
| No Fuel Used | 10 (0.3%) | 0 (0.0%) |
| Total | 3,469 (100.0%) | 1,615 (100.0%) |
Household Vehicle Usage in Kewanee
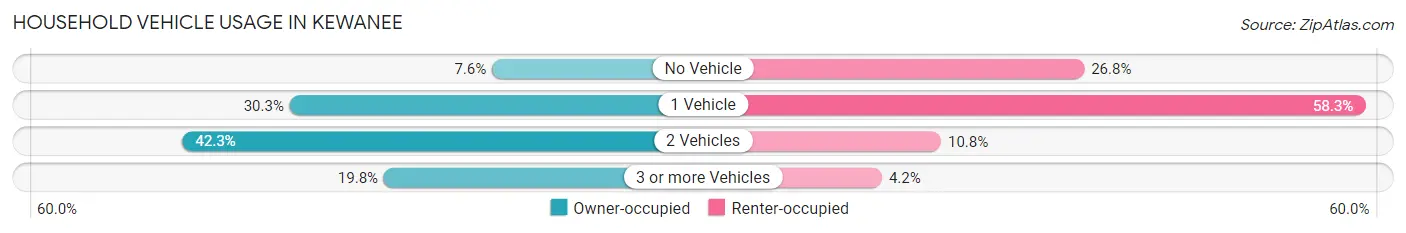
| Vehicles per Household | Owner-occupied | Renter-occupied |
| No Vehicle | 265 (7.6%) | 433 (26.8%) |
| 1 Vehicle | 1,051 (30.3%) | 941 (58.3%) |
| 2 Vehicles | 1,468 (42.3%) | 174 (10.8%) |
| 3 or more Vehicles | 685 (19.8%) | 67 (4.2%) |
| Total | 3,469 (100.0%) | 1,615 (100.0%) |
Real Estate & Mortgages in Kewanee
Real Estate and Mortgage Overview in Kewanee
| Characteristic | Without Mortgage | With Mortgage |
| Housing Units | 2,129 | 1,340 |
| Median Property Value | $57,700 | $77,200 |
| Median Household Income | $42,792 | $93 |
| Monthly Housing Costs | $422 | $10 |
| Real Estate Taxes | $1,119 | $25 |
Property Value by Mortgage Status in Kewanee
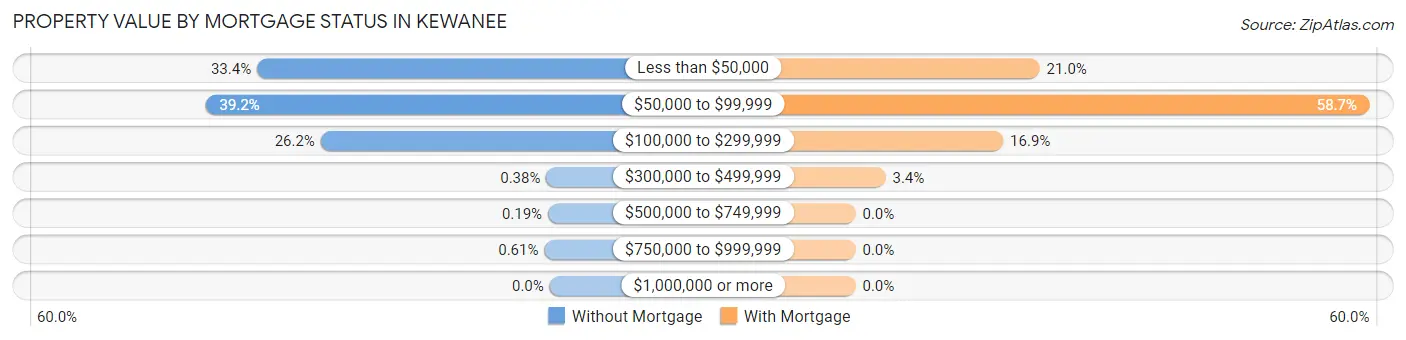
| Property Value | Without Mortgage | With Mortgage |
| Less than $50,000 | 712 (33.4%) | 282 (21.0%) |
| $50,000 to $99,999 | 835 (39.2%) | 786 (58.7%) |
| $100,000 to $299,999 | 557 (26.2%) | 226 (16.9%) |
| $300,000 to $499,999 | 8 (0.4%) | 46 (3.4%) |
| $500,000 to $749,999 | 4 (0.2%) | 0 (0.0%) |
| $750,000 to $999,999 | 13 (0.6%) | 0 (0.0%) |
| $1,000,000 or more | 0 (0.0%) | 0 (0.0%) |
| Total | 2,129 (100.0%) | 1,340 (100.0%) |
Household Income by Mortgage Status in Kewanee
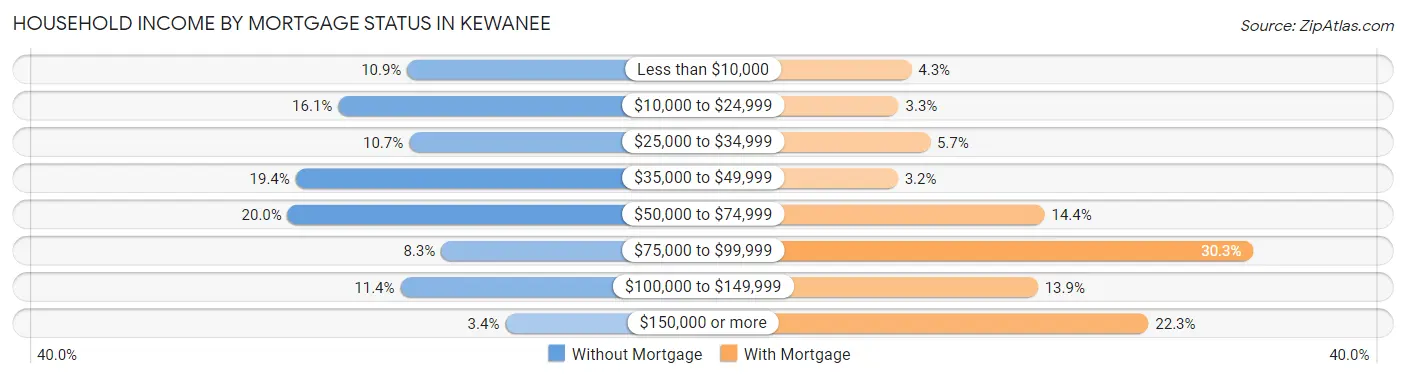
| Household Income | Without Mortgage | With Mortgage |
| Less than $10,000 | 231 (10.8%) | 57 (4.3%) |
| $10,000 to $24,999 | 343 (16.1%) | 44 (3.3%) |
| $25,000 to $34,999 | 228 (10.7%) | 76 (5.7%) |
| $35,000 to $49,999 | 412 (19.4%) | 43 (3.2%) |
| $50,000 to $74,999 | 425 (20.0%) | 193 (14.4%) |
| $75,000 to $99,999 | 176 (8.3%) | 406 (30.3%) |
| $100,000 to $149,999 | 242 (11.4%) | 186 (13.9%) |
| $150,000 or more | 72 (3.4%) | 299 (22.3%) |
| Total | 2,129 (100.0%) | 1,340 (100.0%) |
Property Value to Household Income Ratio in Kewanee
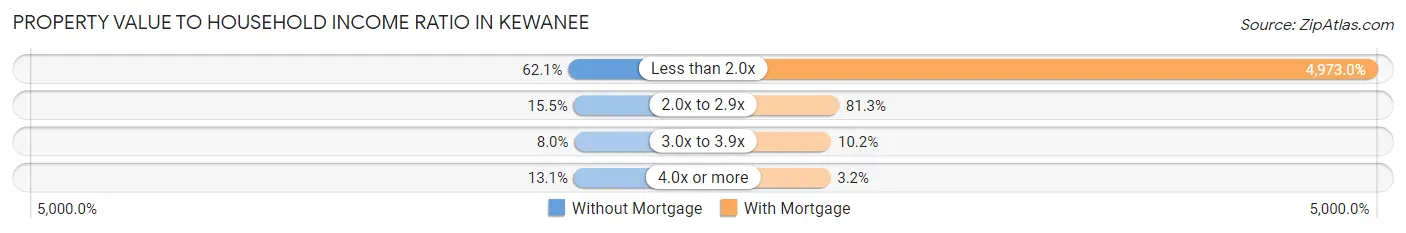
| Value-to-Income Ratio | Without Mortgage | With Mortgage |
| Less than 2.0x | 1,322 (62.1%) | 66,638 (4,973.0%) |
| 2.0x to 2.9x | 330 (15.5%) | 1,090 (81.3%) |
| 3.0x to 3.9x | 170 (8.0%) | 137 (10.2%) |
| 4.0x or more | 278 (13.1%) | 43 (3.2%) |
| Total | 2,129 (100.0%) | 1,340 (100.0%) |
Real Estate Taxes by Mortgage Status in Kewanee
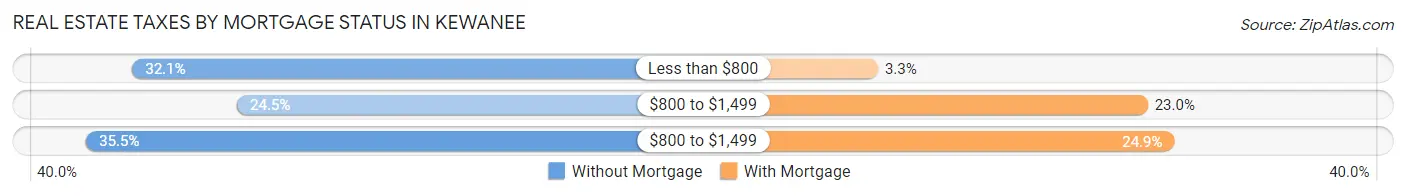
| Property Taxes | Without Mortgage | With Mortgage |
| Less than $800 | 684 (32.1%) | 44 (3.3%) |
| $800 to $1,499 | 521 (24.5%) | 308 (23.0%) |
| $800 to $1,499 | 756 (35.5%) | 334 (24.9%) |
| Total | 2,129 (100.0%) | 1,340 (100.0%) |
Health & Disability in Kewanee
Health Insurance Coverage by Age in Kewanee
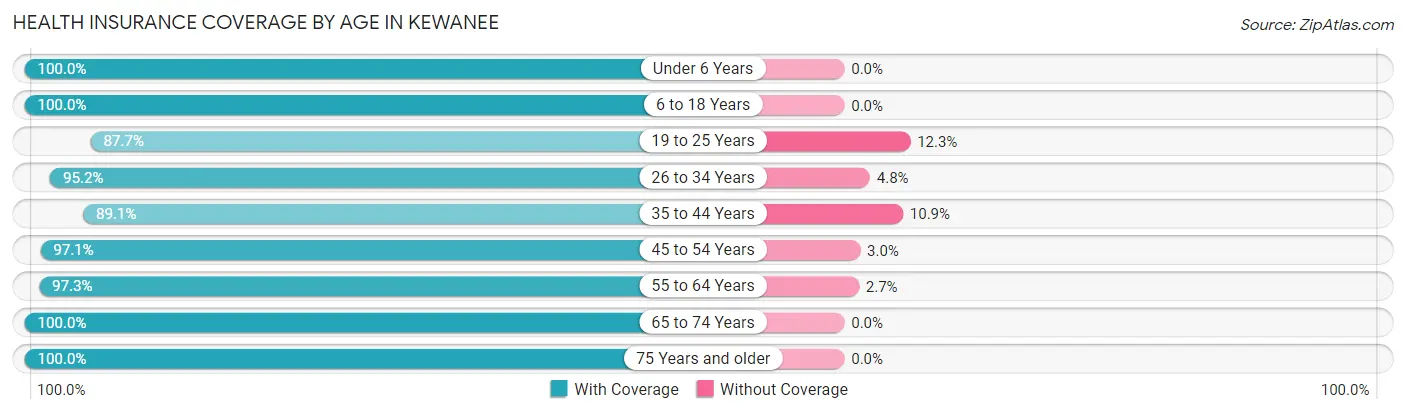
| Age Bracket | With Coverage | Without Coverage |
| Under 6 Years | 1,016 (100.0%) | 0 (0.0%) |
| 6 to 18 Years | 1,689 (100.0%) | 0 (0.0%) |
| 19 to 25 Years | 956 (87.7%) | 134 (12.3%) |
| 26 to 34 Years | 1,097 (95.2%) | 55 (4.8%) |
| 35 to 44 Years | 1,101 (89.1%) | 135 (10.9%) |
| 45 to 54 Years | 1,382 (97.1%) | 42 (2.9%) |
| 55 to 64 Years | 1,611 (97.3%) | 45 (2.7%) |
| 65 to 74 Years | 1,531 (100.0%) | 0 (0.0%) |
| 75 Years and older | 1,041 (100.0%) | 0 (0.0%) |
| Total | 11,424 (96.5%) | 411 (3.5%) |
Health Insurance Coverage by Citizenship Status in Kewanee
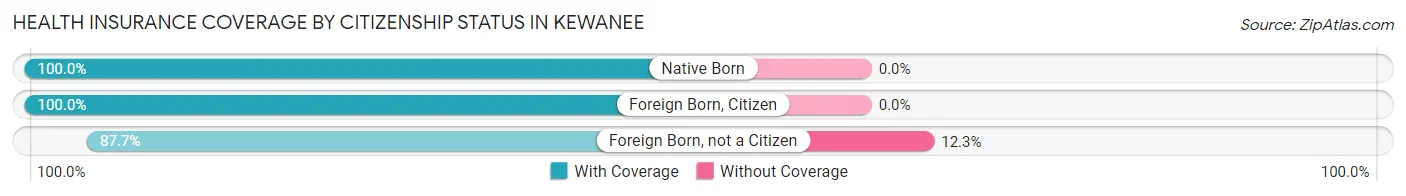
| Citizenship Status | With Coverage | Without Coverage |
| Native Born | 1,016 (100.0%) | 0 (0.0%) |
| Foreign Born, Citizen | 1,689 (100.0%) | 0 (0.0%) |
| Foreign Born, not a Citizen | 956 (87.7%) | 134 (12.3%) |
Health Insurance Coverage by Household Income in Kewanee
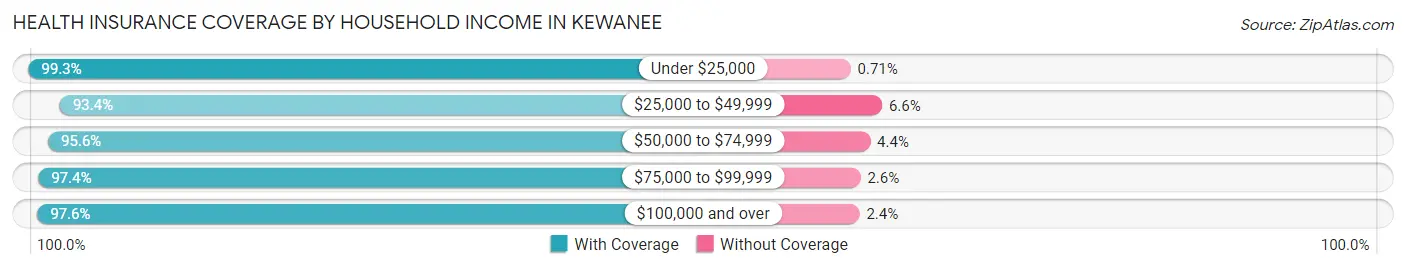
| Household Income | With Coverage | Without Coverage |
| Under $25,000 | 2,526 (99.3%) | 18 (0.7%) |
| $25,000 to $49,999 | 2,507 (93.4%) | 177 (6.6%) |
| $50,000 to $74,999 | 2,774 (95.6%) | 127 (4.4%) |
| $75,000 to $99,999 | 1,144 (97.4%) | 30 (2.6%) |
| $100,000 and over | 2,432 (97.6%) | 59 (2.4%) |
Public vs Private Health Insurance Coverage by Age in Kewanee
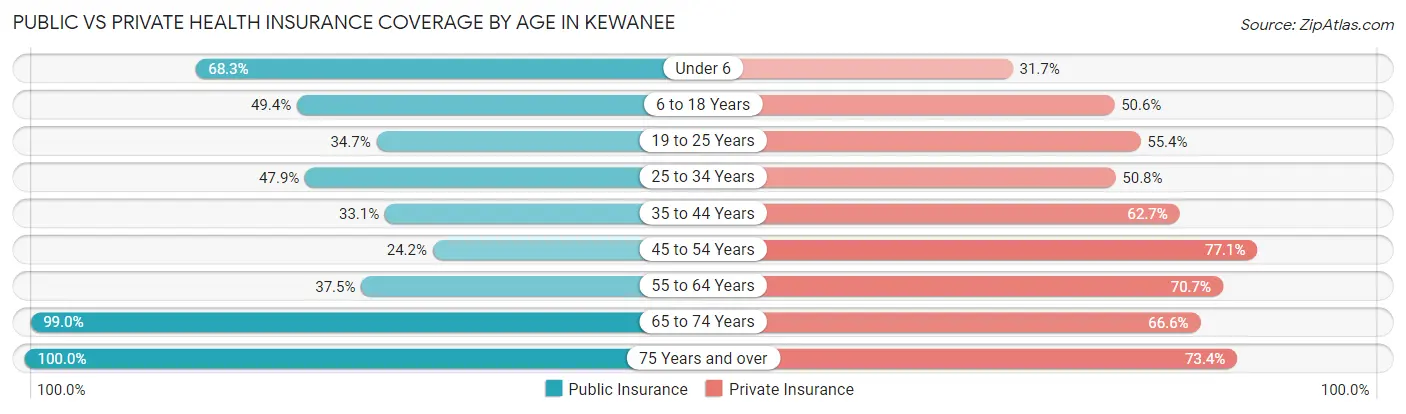
| Age Bracket | Public Insurance | Private Insurance |
| Under 6 | 694 (68.3%) | 322 (31.7%) |
| 6 to 18 Years | 835 (49.4%) | 854 (50.6%) |
| 19 to 25 Years | 378 (34.7%) | 604 (55.4%) |
| 25 to 34 Years | 552 (47.9%) | 585 (50.8%) |
| 35 to 44 Years | 409 (33.1%) | 775 (62.7%) |
| 45 to 54 Years | 345 (24.2%) | 1,098 (77.1%) |
| 55 to 64 Years | 621 (37.5%) | 1,171 (70.7%) |
| 65 to 74 Years | 1,515 (99.0%) | 1,019 (66.6%) |
| 75 Years and over | 1,041 (100.0%) | 764 (73.4%) |
| Total | 6,390 (54.0%) | 7,192 (60.8%) |
Disability Status by Sex by Age in Kewanee
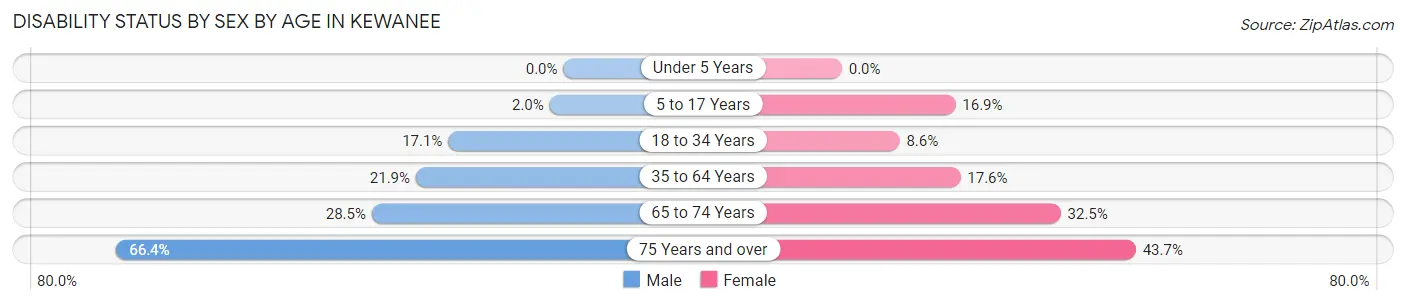
| Age Bracket | Male | Female |
| Under 5 Years | 0 (0.0%) | 0 (0.0%) |
| 5 to 17 Years | 15 (2.0%) | 160 (16.9%) |
| 18 to 34 Years | 196 (17.1%) | 105 (8.6%) |
| 35 to 64 Years | 479 (21.9%) | 375 (17.6%) |
| 65 to 74 Years | 200 (28.4%) | 269 (32.5%) |
| 75 Years and over | 367 (66.4%) | 213 (43.6%) |
Disability Class by Sex by Age in Kewanee
Disability Class: Hearing Difficulty
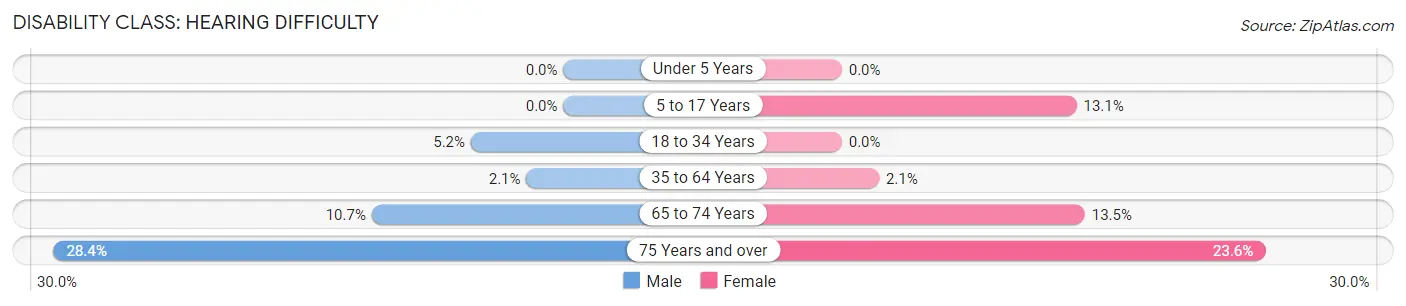
| Age Bracket | Male | Female |
| Under 5 Years | 0 (0.0%) | 0 (0.0%) |
| 5 to 17 Years | 0 (0.0%) | 124 (13.1%) |
| 18 to 34 Years | 59 (5.1%) | 0 (0.0%) |
| 35 to 64 Years | 45 (2.1%) | 44 (2.1%) |
| 65 to 74 Years | 75 (10.7%) | 112 (13.5%) |
| 75 Years and over | 157 (28.4%) | 115 (23.6%) |
Disability Class: Vision Difficulty
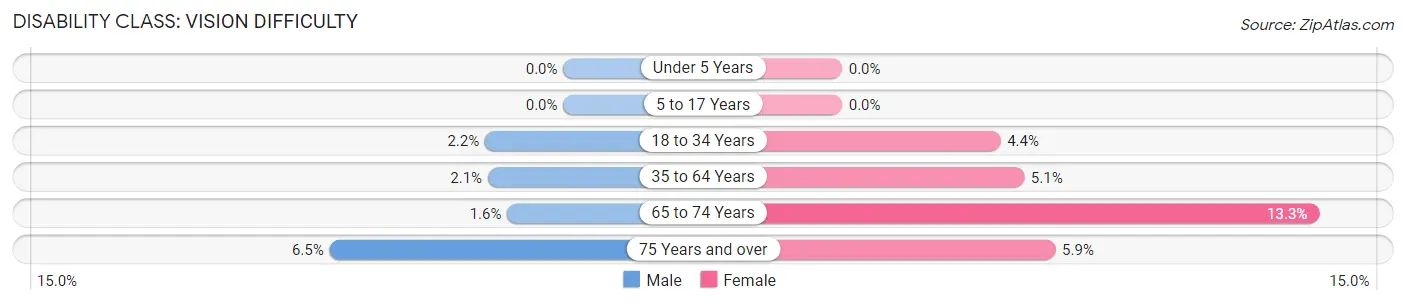
| Age Bracket | Male | Female |
| Under 5 Years | 0 (0.0%) | 0 (0.0%) |
| 5 to 17 Years | 0 (0.0%) | 0 (0.0%) |
| 18 to 34 Years | 25 (2.2%) | 54 (4.4%) |
| 35 to 64 Years | 46 (2.1%) | 108 (5.1%) |
| 65 to 74 Years | 11 (1.6%) | 110 (13.3%) |
| 75 Years and over | 36 (6.5%) | 29 (5.9%) |
Disability Class: Cognitive Difficulty
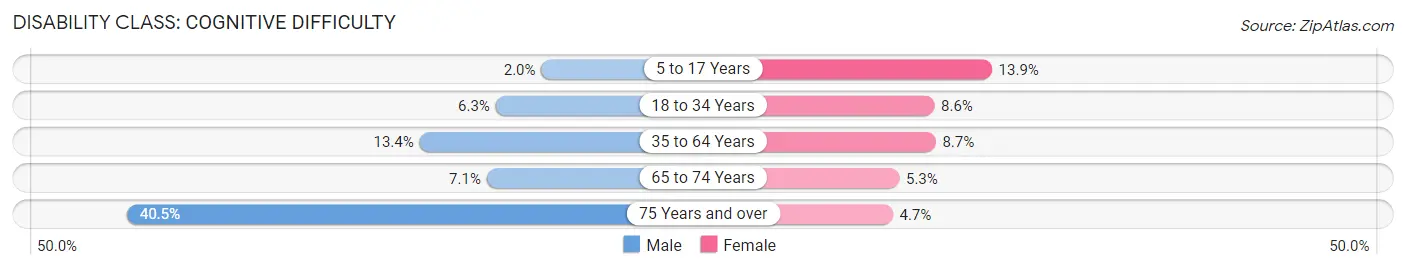
| Age Bracket | Male | Female |
| 5 to 17 Years | 15 (2.0%) | 132 (13.9%) |
| 18 to 34 Years | 72 (6.3%) | 105 (8.6%) |
| 35 to 64 Years | 292 (13.4%) | 185 (8.7%) |
| 65 to 74 Years | 50 (7.1%) | 44 (5.3%) |
| 75 Years and over | 224 (40.5%) | 23 (4.7%) |
Disability Class: Ambulatory Difficulty
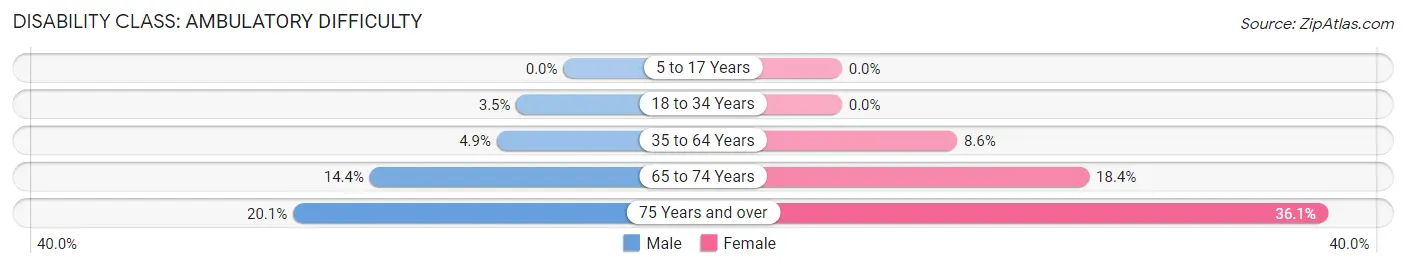
| Age Bracket | Male | Female |
| 5 to 17 Years | 0 (0.0%) | 0 (0.0%) |
| 18 to 34 Years | 40 (3.5%) | 0 (0.0%) |
| 35 to 64 Years | 108 (4.9%) | 182 (8.6%) |
| 65 to 74 Years | 101 (14.4%) | 152 (18.4%) |
| 75 Years and over | 111 (20.1%) | 176 (36.1%) |
Disability Class: Self-Care Difficulty
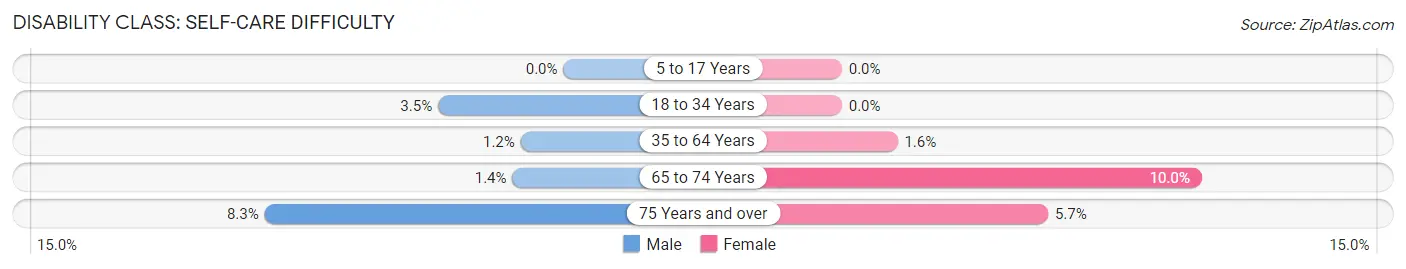
| Age Bracket | Male | Female |
| 5 to 17 Years | 0 (0.0%) | 0 (0.0%) |
| 18 to 34 Years | 40 (3.5%) | 0 (0.0%) |
| 35 to 64 Years | 26 (1.2%) | 33 (1.5%) |
| 65 to 74 Years | 10 (1.4%) | 83 (10.0%) |
| 75 Years and over | 46 (8.3%) | 28 (5.7%) |
Technology Access in Kewanee
Computing Device Access in Kewanee
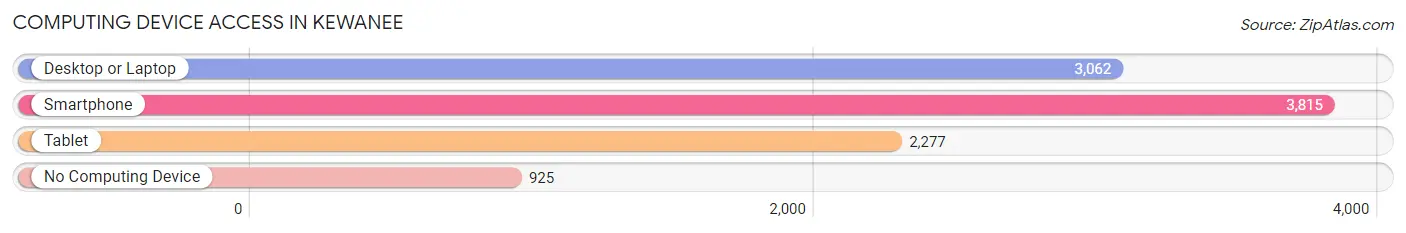
| Device Type | # Households | % Households |
| Desktop or Laptop | 3,062 | 60.2% |
| Smartphone | 3,815 | 75.0% |
| Tablet | 2,277 | 44.8% |
| No Computing Device | 925 | 18.2% |
| Total | 5,084 | 100.0% |
Internet Access in Kewanee
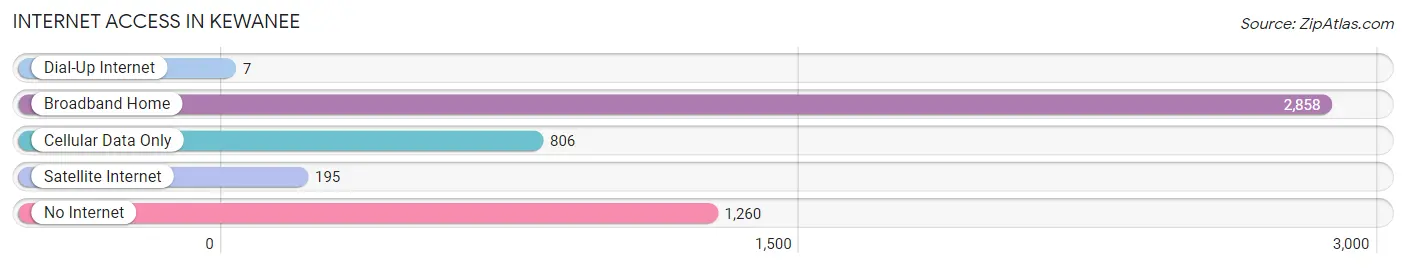
| Internet Type | # Households | % Households |
| Dial-Up Internet | 7 | 0.1% |
| Broadband Home | 2,858 | 56.2% |
| Cellular Data Only | 806 | 15.9% |
| Satellite Internet | 195 | 3.8% |
| No Internet | 1,260 | 24.8% |
| Total | 5,084 | 100.0% |
Kewanee Summary
Kewanee, Illinois is a small city located in Henry County in the northwestern part of the state. It is situated on the banks of the Wabash River, about halfway between Chicago and St. Louis. The city has a population of 12,916 as of the 2010 census, making it the largest city in Henry County.
Kewanee was founded in 1854 by a group of settlers from New York. The city was named after the Potawatomi word for “prairie chicken”, which was abundant in the area at the time. The city was incorporated in 1855 and quickly grew to become an important agricultural and industrial center.
Geography
Kewanee is located at 41°14′N 89°59′W (41.23, -89.98). According to the United States Census Bureau, the city has a total area of 5.2 square miles (13.4 km2), of which 5.1 square miles (13.2 km2) is land and 0.1 square miles (0.2 km2) is water.
The city is located in the Wabash Valley, which is part of the larger Illinois River Valley. The Wabash River forms the western boundary of the city, while the Kewanee Creek flows through the city from the north. The city is located in the Central Till Plain, a flat, fertile region of the Midwest.
Economy
Kewanee has a diverse economy, with a mix of manufacturing, retail, and service industries. The city is home to several large employers, including Kewanee Boiler, a manufacturer of industrial boilers; Kewanee Hospital, a regional medical center; and Kewanee Public Schools, the city’s public school system.
Kewanee is also home to several small businesses, including restaurants, retail stores, and professional services. The city is also home to several industrial parks, which provide jobs for many of the city’s residents.
Demographics
As of the 2010 census, Kewanee had a population of 12,916. The racial makeup of the city was 87.2% White, 8.2% African American, 0.4% Native American, 0.7% Asian, 0.1% Pacific Islander, 1.3% from other races, and 2.1% from two or more races. Hispanic or Latino of any race were 4.2% of the population.
The median income for a household in the city was $37,945, and the median income for a family was $45,945. The per capita income for the city was $19,845. About 11.2% of families and 14.2% of the population were below the poverty line, including 20.2% of those under age 18 and 8.2% of those age 65 or over.
Kewanee is served by the Kewanee Public Library, which is part of the Illinois Heartland Library System. The city is also home to several parks, including the Kewanee Park District, which offers a variety of recreational activities. The city is also home to several churches, including the First United Methodist Church, the First Presbyterian Church, and the First Baptist Church.
Common Questions
What is Per Capita Income in Kewanee?
Per Capita income in Kewanee is $23,645.
What is the Median Family Income in Kewanee?
Median Family Income in Kewanee is $52,721.
What is the Median Household income in Kewanee?
Median Household Income in Kewanee is $46,305.
What is Income or Wage Gap in Kewanee?
Income or Wage Gap in Kewanee is 33.2%.
Women in Kewanee earn 66.8 cents for every dollar earned by a man.
What is Family Income Deficit in Kewanee?
Family Income Deficit in Kewanee is $13,523.
Families that are below poverty line in Kewanee earn $13,523 less on average than the poverty threshold level.
What is Inequality or Gini Index in Kewanee?
Inequality or Gini Index in Kewanee is 0.43.
What is the Total Population of Kewanee?
Total Population of Kewanee is 12,179.
What is the Total Male Population of Kewanee?
Total Male Population of Kewanee is 6,046.
What is the Total Female Population of Kewanee?
Total Female Population of Kewanee is 6,133.
What is the Ratio of Males per 100 Females in Kewanee?
There are 98.58 Males per 100 Females in Kewanee.
What is the Ratio of Females per 100 Males in Kewanee?
There are 101.44 Females per 100 Males in Kewanee.
What is the Median Population Age in Kewanee?
Median Population Age in Kewanee is 43.5 Years.
What is the Average Family Size in Kewanee
Average Family Size in Kewanee is 3.0 People.
What is the Average Household Size in Kewanee
Average Household Size in Kewanee is 2.3 People.
How Large is the Labor Force in Kewanee?
There are 5,118 People in the Labor Forcein in Kewanee.
What is the Percentage of People in the Labor Force in Kewanee?
51.8% of People are in the Labor Force in Kewanee.
What is the Unemployment Rate in Kewanee?
Unemployment Rate in Kewanee is 6.9%.