Zip Codes with the Lowest Poverty Level Among Children Under the Age of 5 in Illinois
RELATED REPORTS & OPTIONS
Lowest Poverty | Child 0-5
Illinois
Compare Zip Codes
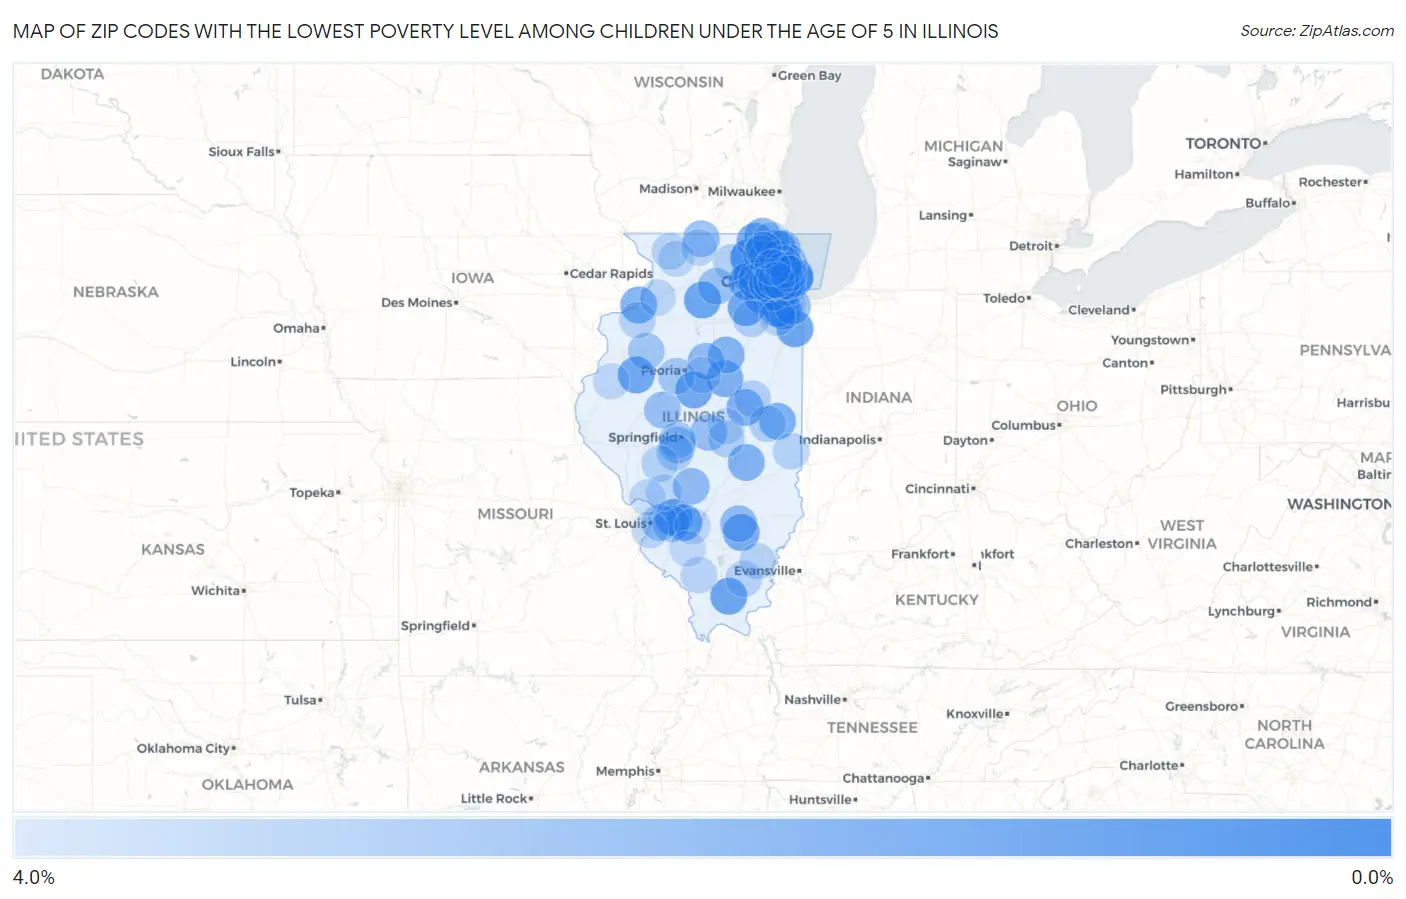
Map of Zip Codes with the Lowest Poverty Level Among Children Under the Age of 5 in Illinois
4.0%
0.0%
Zip Codes with the Lowest Poverty Level Among Children Under the Age of 5 in Illinois
| Zip Code | Child Poverty | vs State | vs National | |
| 1. | 60142 | 0.15% | 16.9%(-16.8)#1 | 18.1%(-17.9)#2 |
| 2. | 60657 | 0.16% | 16.9%(-16.8)#2 | 18.1%(-17.9)#3 |
| 3. | 60175 | 0.45% | 16.9%(-16.5)#3 | 18.1%(-17.6)#45 |
| 4. | 60119 | 0.50% | 16.9%(-16.4)#4 | 18.1%(-17.6)#60 |
| 5. | 60048 | 0.57% | 16.9%(-16.3)#5 | 18.1%(-17.5)#84 |
| 6. | 60565 | 0.70% | 16.9%(-16.2)#6 | 18.1%(-17.4)#127 |
| 7. | 60515 | 0.76% | 16.9%(-16.2)#7 | 18.1%(-17.3)#155 |
| 8. | 61367 | 0.78% | 16.9%(-16.1)#8 | 18.1%(-17.3)#164 |
| 9. | 60015 | 0.81% | 16.9%(-16.1)#9 | 18.1%(-17.2)#182 |
| 10. | 60541 | 0.82% | 16.9%(-16.1)#10 | 18.1%(-17.2)#186 |
| 11. | 62922 | 0.83% | 16.9%(-16.1)#11 | 18.1%(-17.2)#193 |
| 12. | 60940 | 0.85% | 16.9%(-16.1)#12 | 18.1%(-17.2)#208 |
| 13. | 60056 | 0.86% | 16.9%(-16.1)#13 | 18.1%(-17.2)#210 |
| 14. | 62281 | 0.88% | 16.9%(-16.0)#14 | 18.1%(-17.2)#219 |
| 15. | 61747 | 0.88% | 16.9%(-16.0)#15 | 18.1%(-17.2)#220 |
| 16. | 60585 | 0.88% | 16.9%(-16.0)#16 | 18.1%(-17.2)#222 |
| 17. | 61415 | 0.91% | 16.9%(-16.0)#17 | 18.1%(-17.2)#233 |
| 18. | 62216 | 1.00% | 16.9%(-15.9)#18 | 18.1%(-17.1)#274 |
| 19. | 60193 | 1.1% | 16.9%(-15.8)#19 | 18.1%(-17.0)#317 |
| 20. | 62850 | 1.1% | 16.9%(-15.8)#20 | 18.1%(-16.9)#337 |
| 21. | 60097 | 1.1% | 16.9%(-15.8)#21 | 18.1%(-16.9)#355 |
| 22. | 60174 | 1.3% | 16.9%(-15.7)#22 | 18.1%(-16.8)#403 |
| 23. | 61256 | 1.3% | 16.9%(-15.6)#23 | 18.1%(-16.8)#420 |
| 24. | 61849 | 1.3% | 16.9%(-15.6)#24 | 18.1%(-16.7)#437 |
| 25. | 61776 | 1.3% | 16.9%(-15.6)#25 | 18.1%(-16.7)#439 |
| 26. | 61854 | 1.4% | 16.9%(-15.5)#26 | 18.1%(-16.7)#479 |
| 27. | 60526 | 1.4% | 16.9%(-15.5)#27 | 18.1%(-16.6)#481 |
| 28. | 61928 | 1.4% | 16.9%(-15.5)#28 | 18.1%(-16.6)#489 |
| 29. | 60126 | 1.4% | 16.9%(-15.5)#29 | 18.1%(-16.6)#491 |
| 30. | 60448 | 1.5% | 16.9%(-15.4)#30 | 18.1%(-16.6)#536 |
| 31. | 60423 | 1.5% | 16.9%(-15.4)#31 | 18.1%(-16.5)#546 |
| 32. | 61740 | 1.5% | 16.9%(-15.4)#32 | 18.1%(-16.5)#556 |
| 33. | 60516 | 1.5% | 16.9%(-15.4)#33 | 18.1%(-16.5)#562 |
| 34. | 60081 | 1.6% | 16.9%(-15.4)#34 | 18.1%(-16.5)#567 |
| 35. | 60525 | 1.6% | 16.9%(-15.3)#35 | 18.1%(-16.4)#609 |
| 36. | 60451 | 1.7% | 16.9%(-15.2)#36 | 18.1%(-16.4)#650 |
| 37. | 62049 | 1.8% | 16.9%(-15.1)#37 | 18.1%(-16.2)#719 |
| 38. | 62899 | 1.8% | 16.9%(-15.1)#38 | 18.1%(-16.2)#720 |
| 39. | 60656 | 1.8% | 16.9%(-15.1)#39 | 18.1%(-16.2)#726 |
| 40. | 61561 | 1.9% | 16.9%(-15.0)#40 | 18.1%(-16.2)#759 |
| 41. | 60130 | 1.9% | 16.9%(-15.0)#41 | 18.1%(-16.2)#769 |
| 42. | 60044 | 1.9% | 16.9%(-15.0)#42 | 18.1%(-16.1)#775 |
| 43. | 60190 | 2.0% | 16.9%(-15.0)#43 | 18.1%(-16.1)#800 |
| 44. | 61024 | 2.0% | 16.9%(-15.0)#44 | 18.1%(-16.1)#803 |
| 45. | 60422 | 2.0% | 16.9%(-15.0)#45 | 18.1%(-16.1)#807 |
| 46. | 60010 | 2.0% | 16.9%(-14.9)#46 | 18.1%(-16.1)#816 |
| 47. | 62551 | 2.0% | 16.9%(-14.9)#47 | 18.1%(-16.1)#829 |
| 48. | 60517 | 2.1% | 16.9%(-14.8)#48 | 18.1%(-16.0)#879 |
| 49. | 62655 | 2.1% | 16.9%(-14.8)#49 | 18.1%(-16.0)#890 |
| 50. | 60103 | 2.1% | 16.9%(-14.8)#50 | 18.1%(-16.0)#892 |
| 51. | 62629 | 2.1% | 16.9%(-14.8)#51 | 18.1%(-16.0)#901 |
| 52. | 60553 | 2.1% | 16.9%(-14.8)#52 | 18.1%(-15.9)#923 |
| 53. | 60013 | 2.2% | 16.9%(-14.7)#53 | 18.1%(-15.8)#987 |
| 54. | 62254 | 2.2% | 16.9%(-14.7)#54 | 18.1%(-15.8)#988 |
| 55. | 60638 | 2.3% | 16.9%(-14.6)#55 | 18.1%(-15.8)#1,033 |
| 56. | 60134 | 2.3% | 16.9%(-14.6)#56 | 18.1%(-15.8)#1,037 |
| 57. | 61448 | 2.4% | 16.9%(-14.6)#57 | 18.1%(-15.7)#1,066 |
| 58. | 60642 | 2.4% | 16.9%(-14.5)#58 | 18.1%(-15.7)#1,087 |
| 59. | 60093 | 2.4% | 16.9%(-14.5)#59 | 18.1%(-15.7)#1,097 |
| 60. | 62232 | 2.4% | 16.9%(-14.5)#60 | 18.1%(-15.6)#1,107 |
| 61. | 61547 | 2.4% | 16.9%(-14.5)#61 | 18.1%(-15.6)#1,108 |
| 62. | 60189 | 2.4% | 16.9%(-14.5)#62 | 18.1%(-15.6)#1,110 |
| 63. | 60304 | 2.4% | 16.9%(-14.5)#63 | 18.1%(-15.6)#1,119 |
| 64. | 62711 | 2.5% | 16.9%(-14.4)#64 | 18.1%(-15.6)#1,154 |
| 65. | 60714 | 2.6% | 16.9%(-14.4)#65 | 18.1%(-15.5)#1,205 |
| 66. | 62615 | 2.7% | 16.9%(-14.3)#66 | 18.1%(-15.4)#1,266 |
| 67. | 60450 | 2.8% | 16.9%(-14.2)#67 | 18.1%(-15.3)#1,337 |
| 68. | 62549 | 2.8% | 16.9%(-14.2)#68 | 18.1%(-15.3)#1,341 |
| 69. | 60137 | 2.8% | 16.9%(-14.1)#69 | 18.1%(-15.3)#1,366 |
| 70. | 60154 | 2.8% | 16.9%(-14.1)#70 | 18.1%(-15.2)#1,375 |
| 71. | 61843 | 2.8% | 16.9%(-14.1)#71 | 18.1%(-15.2)#1,378 |
| 72. | 60089 | 2.8% | 16.9%(-14.1)#72 | 18.1%(-15.2)#1,382 |
| 73. | 61864 | 2.8% | 16.9%(-14.1)#73 | 18.1%(-15.2)#1,387 |
| 74. | 61273 | 2.9% | 16.9%(-14.1)#74 | 18.1%(-15.2)#1,406 |
| 75. | 60026 | 2.9% | 16.9%(-14.1)#75 | 18.1%(-15.2)#1,422 |
| 76. | 61944 | 2.9% | 16.9%(-14.1)#76 | 18.1%(-15.2)#1,423 |
| 77. | 62674 | 2.9% | 16.9%(-14.0)#77 | 18.1%(-15.2)#1,443 |
| 78. | 60145 | 2.9% | 16.9%(-14.0)#78 | 18.1%(-15.2)#1,445 |
| 79. | 60046 | 2.9% | 16.9%(-14.0)#79 | 18.1%(-15.2)#1,447 |
| 80. | 61062 | 2.9% | 16.9%(-14.0)#80 | 18.1%(-15.1)#1,453 |
| 81. | 62977 | 2.9% | 16.9%(-14.0)#81 | 18.1%(-15.1)#1,468 |
| 82. | 60068 | 3.0% | 16.9%(-14.0)#82 | 18.1%(-15.1)#1,474 |
| 83. | 62835 | 3.0% | 16.9%(-13.9)#83 | 18.1%(-15.1)#1,490 |
| 84. | 62240 | 3.0% | 16.9%(-13.9)#84 | 18.1%(-15.1)#1,496 |
| 85. | 60630 | 3.0% | 16.9%(-13.9)#85 | 18.1%(-15.0)#1,513 |
| 86. | 62994 | 3.0% | 16.9%(-13.9)#86 | 18.1%(-15.0)#1,526 |
| 87. | 60042 | 3.1% | 16.9%(-13.8)#87 | 18.1%(-15.0)#1,563 |
| 88. | 60181 | 3.1% | 16.9%(-13.8)#88 | 18.1%(-15.0)#1,576 |
| 89. | 62014 | 3.1% | 16.9%(-13.8)#89 | 18.1%(-14.9)#1,584 |
| 90. | 61742 | 3.1% | 16.9%(-13.8)#90 | 18.1%(-14.9)#1,588 |
| 91. | 61078 | 3.1% | 16.9%(-13.8)#91 | 18.1%(-14.9)#1,589 |
| 92. | 60442 | 3.1% | 16.9%(-13.8)#92 | 18.1%(-14.9)#1,604 |
| 93. | 61250 | 3.2% | 16.9%(-13.8)#93 | 18.1%(-14.9)#1,619 |
| 94. | 62035 | 3.2% | 16.9%(-13.8)#94 | 18.1%(-14.9)#1,623 |
| 95. | 62219 | 3.2% | 16.9%(-13.7)#95 | 18.1%(-14.9)#1,629 |
| 96. | 61420 | 3.2% | 16.9%(-13.7)#96 | 18.1%(-14.9)#1,630 |
| 97. | 61063 | 3.2% | 16.9%(-13.7)#97 | 18.1%(-14.9)#1,644 |
| 98. | 62554 | 3.2% | 16.9%(-13.7)#98 | 18.1%(-14.8)#1,656 |
| 99. | 62268 | 3.2% | 16.9%(-13.7)#99 | 18.1%(-14.8)#1,659 |
| 100. | 60173 | 3.2% | 16.9%(-13.7)#100 | 18.1%(-14.8)#1,666 |
Common Questions
What are the Top 10 Zip Codes with the Lowest Poverty Level Among Children Under the Age of 5 in Illinois?
Top 10 Zip Codes with the Lowest Poverty Level Among Children Under the Age of 5 in Illinois are:
What zip code has the Lowest Poverty Level Among Children Under the Age of 5 in Illinois?
60142 has the Lowest Poverty Level Among Children Under the Age of 5 in Illinois with 0.15%.
What is the Poverty Level Among Children Under the Age of 5 in the State of Illinois?
Poverty Level Among Children Under the Age of 5 in Illinois is 16.9%.
What is the Poverty Level Among Children Under the Age of 5 in the United States?
Poverty Level Among Children Under the Age of 5 in the United States is 18.1%.