Mount Zion, IL Map & Demographics
Mount Zion Map
Mount Zion Overview
$39,546
PER CAPITA INCOME
$114,938
AVG FAMILY INCOME
$99,798
AVG HOUSEHOLD INCOME
20.5%
WAGE / INCOME GAP [ % ]
79.5¢/ $1
WAGE / INCOME GAP [ $ ]
0.36
INEQUALITY / GINI INDEX
6,255
TOTAL POPULATION
2,916
MALE POPULATION
3,339
FEMALE POPULATION
87.33
MALES / 100 FEMALES
114.51
FEMALES / 100 MALES
39.8
MEDIAN AGE
3.2
AVG FAMILY SIZE
2.8
AVG HOUSEHOLD SIZE
2,945
LABOR FORCE [ PEOPLE ]
66.8%
PERCENT IN LABOR FORCE
4.0%
UNEMPLOYMENT RATE
Mount Zion Area Codes
Income in Mount Zion
Income Overview in Mount Zion
Per Capita Income in Mount Zion is $39,546, while median incomes of families and households are $114,938 and $99,798 respectively.
| Characteristic | Number | Measure |
| Per Capita Income | 6,255 | $39,546 |
| Median Family Income | 1,764 | $114,938 |
| Mean Family Income | 1,764 | $123,576 |
| Median Household Income | 2,198 | $99,798 |
| Mean Household Income | 2,198 | $111,550 |
| Income Deficit | 1,764 | $0 |
| Wage / Income Gap (%) | 6,255 | 20.50% |
| Wage / Income Gap ($) | 6,255 | 79.50¢ per $1 |
| Gini / Inequality Index | 6,255 | 0.36 |
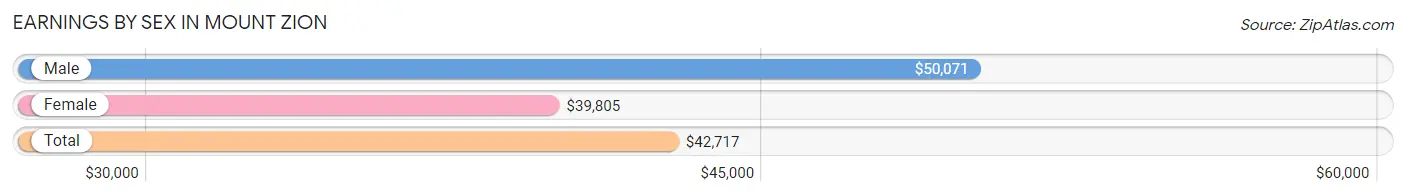
Earnings by Sex in Mount Zion
Average Earnings in Mount Zion are $42,717, $50,071 for men and $39,805 for women, a difference of 20.5%.
| Sex | Number | Average Earnings |
| Male | 1,638 (53.7%) | $50,071 |
| Female | 1,412 (46.3%) | $39,805 |
| Total | 3,050 (100.0%) | $42,717 |
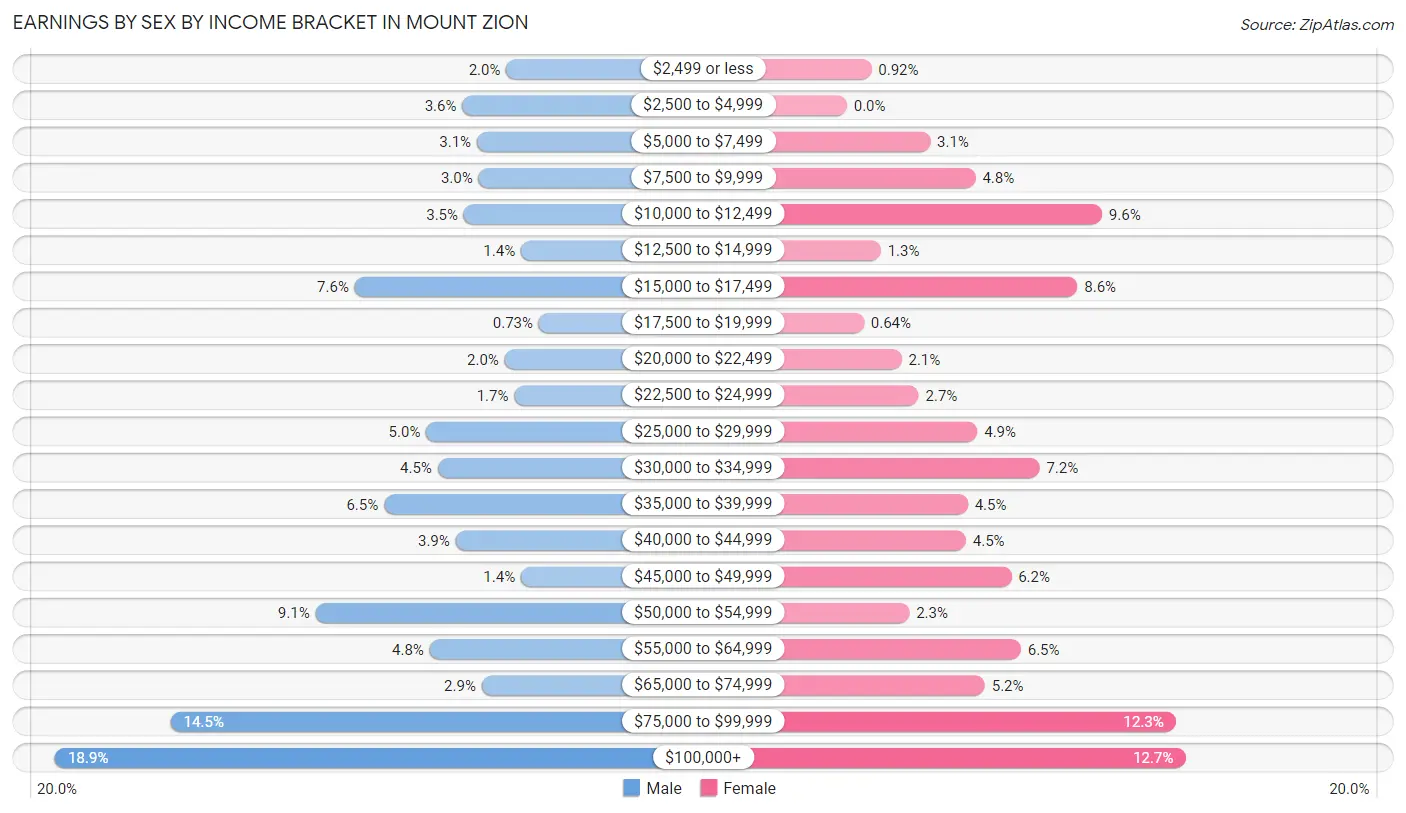
Earnings by Sex by Income Bracket in Mount Zion
The most common earnings brackets in Mount Zion are $100,000+ for men (309 | 18.9%) and $100,000+ for women (179 | 12.7%).
| Income | Male | Female |
| $2,499 or less | 32 (1.9%) | 13 (0.9%) |
| $2,500 to $4,999 | 59 (3.6%) | 0 (0.0%) |
| $5,000 to $7,499 | 50 (3.0%) | 44 (3.1%) |
| $7,500 to $9,999 | 49 (3.0%) | 68 (4.8%) |
| $10,000 to $12,499 | 58 (3.5%) | 135 (9.6%) |
| $12,500 to $14,999 | 23 (1.4%) | 18 (1.3%) |
| $15,000 to $17,499 | 125 (7.6%) | 122 (8.6%) |
| $17,500 to $19,999 | 12 (0.7%) | 9 (0.6%) |
| $20,000 to $22,499 | 33 (2.0%) | 29 (2.1%) |
| $22,500 to $24,999 | 27 (1.7%) | 38 (2.7%) |
| $25,000 to $29,999 | 81 (5.0%) | 69 (4.9%) |
| $30,000 to $34,999 | 74 (4.5%) | 102 (7.2%) |
| $35,000 to $39,999 | 107 (6.5%) | 64 (4.5%) |
| $40,000 to $44,999 | 63 (3.8%) | 63 (4.5%) |
| $45,000 to $49,999 | 23 (1.4%) | 87 (6.2%) |
| $50,000 to $54,999 | 149 (9.1%) | 33 (2.3%) |
| $55,000 to $64,999 | 79 (4.8%) | 92 (6.5%) |
| $65,000 to $74,999 | 47 (2.9%) | 73 (5.2%) |
| $75,000 to $99,999 | 238 (14.5%) | 174 (12.3%) |
| $100,000+ | 309 (18.9%) | 179 (12.7%) |
| Total | 1,638 (100.0%) | 1,412 (100.0%) |
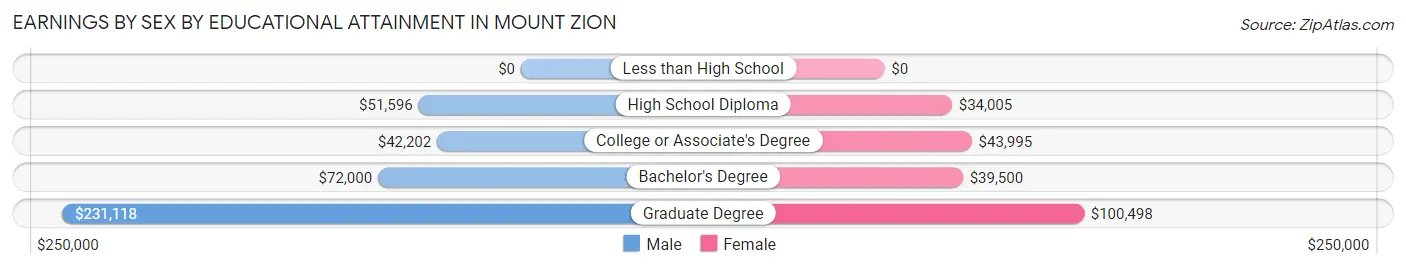
Earnings by Sex by Educational Attainment in Mount Zion
Average earnings in Mount Zion are $54,489 for men and $44,511 for women, a difference of 18.3%. Men with an educational attainment of graduate degree enjoy the highest average annual earnings of $231,118, while those with college or associate's degree education earn the least with $42,202. Women with an educational attainment of graduate degree earn the most with the average annual earnings of $100,498, while those with high school diploma education have the smallest earnings of $34,005.
| Educational Attainment | Male Income | Female Income |
| Less than High School | - | - |
| High School Diploma | $51,596 | $34,005 |
| College or Associate's Degree | $42,202 | $43,995 |
| Bachelor's Degree | $72,000 | $39,500 |
| Graduate Degree | $231,118 | $100,498 |
| Total | $54,489 | $44,511 |
Family Income in Mount Zion
Family Income Brackets in Mount Zion
According to the Mount Zion family income data, there are 669 families falling into the $100,000 to $149,999 income range, which is the most common income bracket and makes up 37.9% of all families.
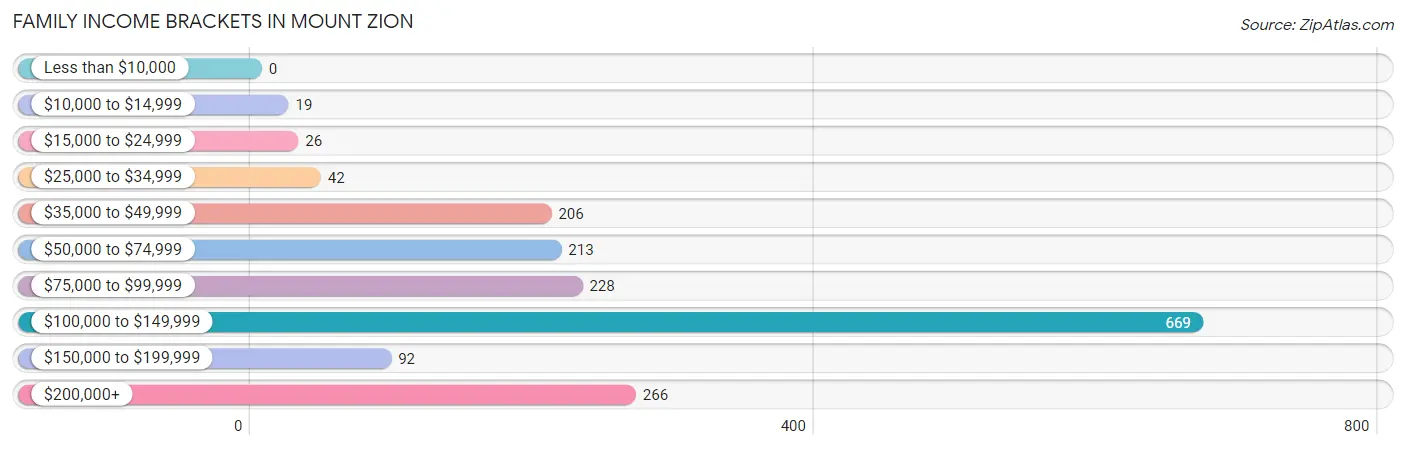
| Income Bracket | # Families | % Families |
| Less than $10,000 | 0 | 0.0% |
| $10,000 to $14,999 | 19 | 1.1% |
| $15,000 to $24,999 | 26 | 1.5% |
| $25,000 to $34,999 | 42 | 2.4% |
| $35,000 to $49,999 | 206 | 11.7% |
| $50,000 to $74,999 | 213 | 12.1% |
| $75,000 to $99,999 | 228 | 12.9% |
| $100,000 to $149,999 | 669 | 37.9% |
| $150,000 to $199,999 | 92 | 5.2% |
| $200,000+ | 266 | 15.1% |
Family Income by Famaliy Size in Mount Zion
5-person families (101 | 5.7%) account for the highest median family income in Mount Zion with $136,140 per family, while 2-person families (825 | 46.8%) have the highest median income of $45,559 per family member.
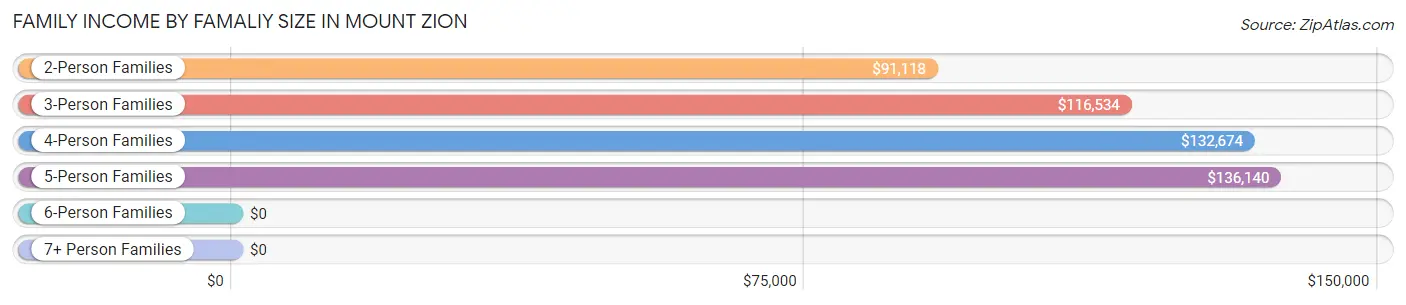
| Income Bracket | # Families | Median Income |
| 2-Person Families | 825 (46.8%) | $91,118 |
| 3-Person Families | 384 (21.8%) | $116,534 |
| 4-Person Families | 375 (21.3%) | $132,674 |
| 5-Person Families | 101 (5.7%) | $136,140 |
| 6-Person Families | 26 (1.5%) | $0 |
| 7+ Person Families | 53 (3.0%) | $0 |
| Total | 1,764 (100.0%) | $114,938 |
Family Income by Number of Earners in Mount Zion
The median family income in Mount Zion is $114,938, with families comprising 3+ earners (117) having the highest median family income of $132,670, while families with no earners (240) have the lowest median family income of $61,591, accounting for 6.6% and 13.6% of families, respectively.
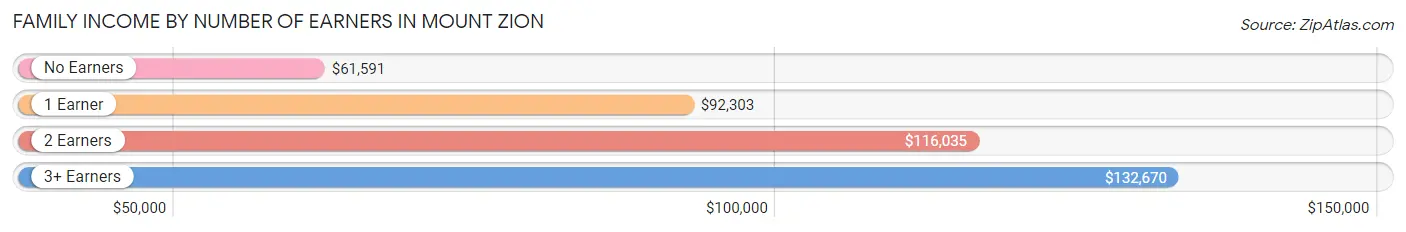
| Number of Earners | # Families | Median Income |
| No Earners | 240 (13.6%) | $61,591 |
| 1 Earner | 557 (31.6%) | $92,303 |
| 2 Earners | 850 (48.2%) | $116,035 |
| 3+ Earners | 117 (6.6%) | $132,670 |
| Total | 1,764 (100.0%) | $114,938 |
Household Income in Mount Zion
Household Income Brackets in Mount Zion
With 708 households falling in the category, the $100,000 to $149,999 income range is the most frequent in Mount Zion, accounting for 32.2% of all households. In contrast, only 20 households (0.9%) fall into the less than $10,000 income bracket, making it the least populous group.
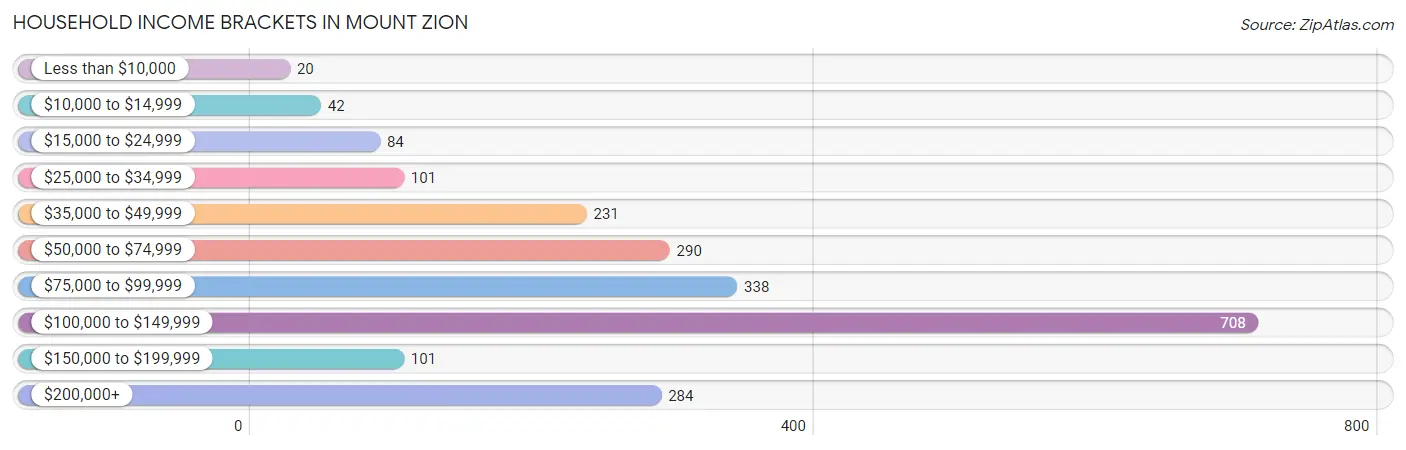
| Income Bracket | # Households | % Households |
| Less than $10,000 | 20 | 0.9% |
| $10,000 to $14,999 | 42 | 1.9% |
| $15,000 to $24,999 | 84 | 3.8% |
| $25,000 to $34,999 | 101 | 4.6% |
| $35,000 to $49,999 | 231 | 10.5% |
| $50,000 to $74,999 | 290 | 13.2% |
| $75,000 to $99,999 | 338 | 15.4% |
| $100,000 to $149,999 | 708 | 32.2% |
| $150,000 to $199,999 | 101 | 4.6% |
| $200,000+ | 284 | 12.9% |
Household Income by Householder Age in Mount Zion
The median household income in Mount Zion is $99,798, with the highest median household income of $116,797 found in the 45 to 64 years age bracket for the primary householder. A total of 726 households (33.0%) fall into this category. Meanwhile, the 15 to 24 years age bracket for the primary householder has the lowest median household income of $51,063, with 63 households (2.9%) in this group.
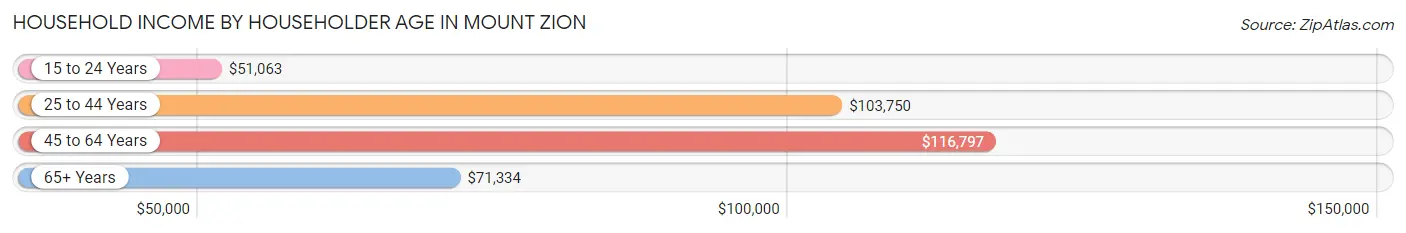
| Income Bracket | # Households | Median Income |
| 15 to 24 Years | 63 (2.9%) | $51,063 |
| 25 to 44 Years | 766 (34.8%) | $103,750 |
| 45 to 64 Years | 726 (33.0%) | $116,797 |
| 65+ Years | 643 (29.2%) | $71,334 |
| Total | 2,198 (100.0%) | $99,798 |
Poverty in Mount Zion
Income Below Poverty by Sex and Age in Mount Zion
With 10.2% poverty level for males and 10.7% for females among the residents of Mount Zion, 6 to 11 year old males and 16 and 17 year old females are the most vulnerable to poverty, with 178 males (35.0%) and 19 females (59.4%) in their respective age groups living below the poverty level.
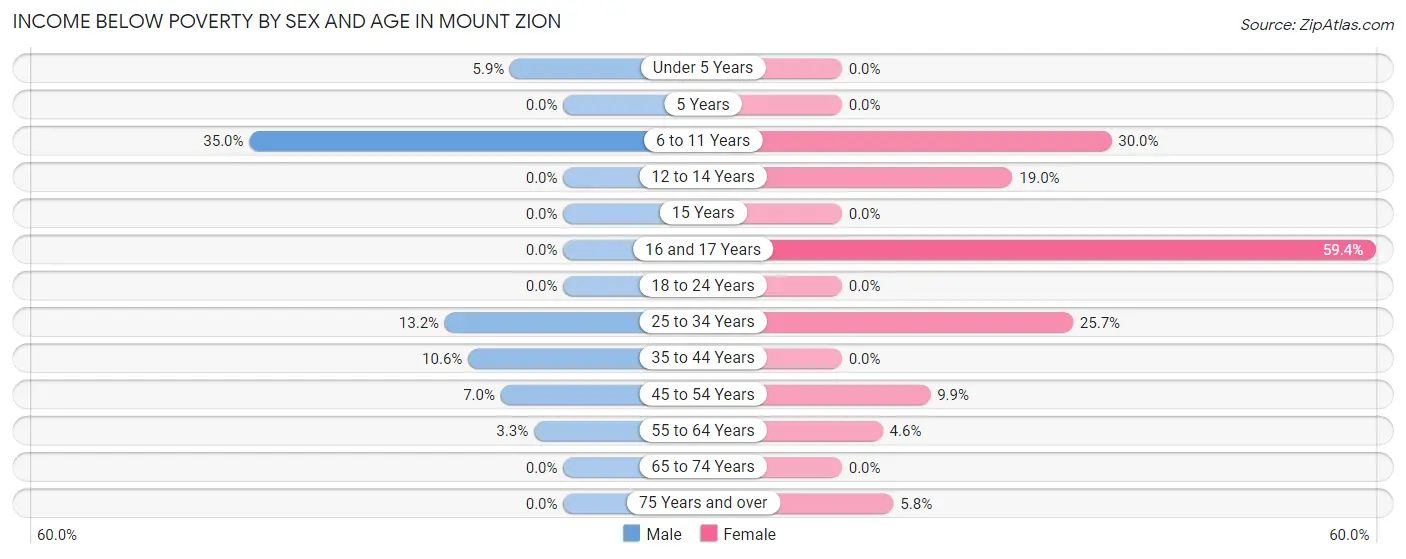
| Age Bracket | Male | Female |
| Under 5 Years | 9 (5.9%) | 0 (0.0%) |
| 5 Years | 0 (0.0%) | 0 (0.0%) |
| 6 to 11 Years | 178 (35.0%) | 157 (30.0%) |
| 12 to 14 Years | 0 (0.0%) | 53 (19.0%) |
| 15 Years | 0 (0.0%) | 0 (0.0%) |
| 16 and 17 Years | 0 (0.0%) | 19 (59.4%) |
| 18 to 24 Years | 0 (0.0%) | 0 (0.0%) |
| 25 to 34 Years | 19 (13.2%) | 61 (25.7%) |
| 35 to 44 Years | 53 (10.6%) | 0 (0.0%) |
| 45 to 54 Years | 26 (7.0%) | 32 (9.9%) |
| 55 to 64 Years | 10 (3.3%) | 16 (4.5%) |
| 65 to 74 Years | 0 (0.0%) | 0 (0.0%) |
| 75 Years and over | 0 (0.0%) | 15 (5.8%) |
| Total | 295 (10.2%) | 353 (10.7%) |
Income Above Poverty by Sex and Age in Mount Zion
According to the poverty statistics in Mount Zion, males aged 5 years and females aged under 5 years are the age groups that are most secure financially, with 100.0% of males and 100.0% of females in these age groups living above the poverty line.
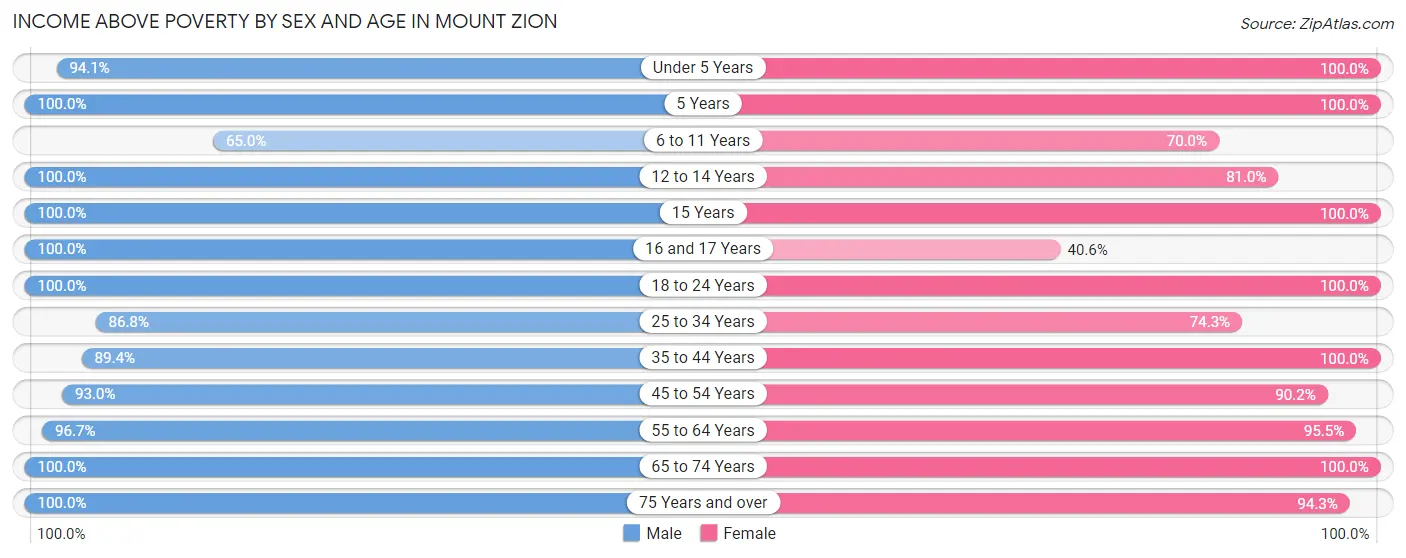
| Age Bracket | Male | Female |
| Under 5 Years | 143 (94.1%) | 46 (100.0%) |
| 5 Years | 30 (100.0%) | 90 (100.0%) |
| 6 to 11 Years | 331 (65.0%) | 366 (70.0%) |
| 12 to 14 Years | 114 (100.0%) | 226 (81.0%) |
| 15 Years | 28 (100.0%) | 76 (100.0%) |
| 16 and 17 Years | 31 (100.0%) | 13 (40.6%) |
| 18 to 24 Years | 243 (100.0%) | 156 (100.0%) |
| 25 to 34 Years | 125 (86.8%) | 176 (74.3%) |
| 35 to 44 Years | 447 (89.4%) | 569 (100.0%) |
| 45 to 54 Years | 347 (93.0%) | 293 (90.1%) |
| 55 to 64 Years | 296 (96.7%) | 336 (95.5%) |
| 65 to 74 Years | 321 (100.0%) | 347 (100.0%) |
| 75 Years and over | 139 (100.0%) | 246 (94.3%) |
| Total | 2,595 (89.8%) | 2,940 (89.3%) |
Income Below Poverty Among Married-Couple Families in Mount Zion
The poverty statistics for married-couple families in Mount Zion show that 5.8% or 89 of the total 1,543 families live below the poverty line. Families with 5 or more children have the highest poverty rate of 100.0%, comprising of 53 families. On the other hand, families with 3 or 4 children have the lowest poverty rate of 0.0%, which includes 0 families.
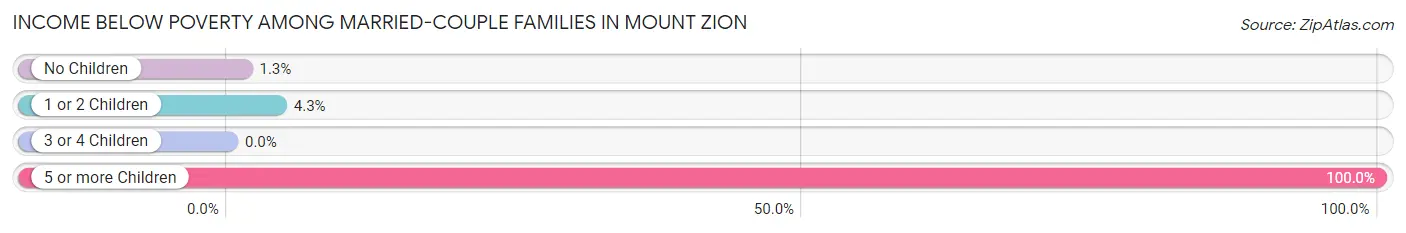
| Children | Above Poverty | Below Poverty |
| No Children | 786 (98.7%) | 10 (1.3%) |
| 1 or 2 Children | 586 (95.8%) | 26 (4.3%) |
| 3 or 4 Children | 82 (100.0%) | 0 (0.0%) |
| 5 or more Children | 0 (0.0%) | 53 (100.0%) |
| Total | 1,454 (94.2%) | 89 (5.8%) |
Income Below Poverty Among Single-Parent Households in Mount Zion
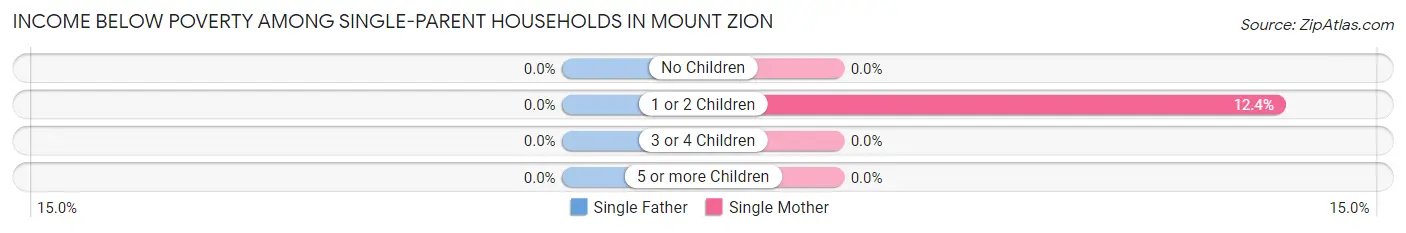
| Children | Single Father | Single Mother |
| No Children | 0 (0.0%) | 0 (0.0%) |
| 1 or 2 Children | 0 (0.0%) | 10 (12.3%) |
| 3 or 4 Children | 0 (0.0%) | 0 (0.0%) |
| 5 or more Children | 0 (0.0%) | 0 (0.0%) |
| Total | 0 (0.0%) | 10 (5.8%) |
Income Below Poverty Among Married-Couple vs Single-Parent Households in Mount Zion
The poverty data for Mount Zion shows that 89 of the married-couple family households (5.8%) and 10 of the single-parent households (4.5%) are living below the poverty level. Within the married-couple family households, those with 5 or more children have the highest poverty rate, with 53 households (100.0%) falling below the poverty line. Among the single-parent households, those with 1 or 2 children have the highest poverty rate, with 10 household (9.1%) living below poverty.
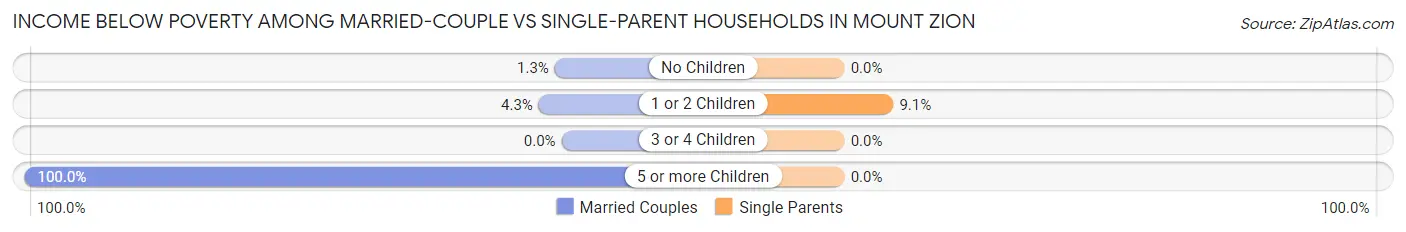
| Children | Married-Couple Families | Single-Parent Households |
| No Children | 10 (1.3%) | 0 (0.0%) |
| 1 or 2 Children | 26 (4.3%) | 10 (9.1%) |
| 3 or 4 Children | 0 (0.0%) | 0 (0.0%) |
| 5 or more Children | 53 (100.0%) | 0 (0.0%) |
| Total | 89 (5.8%) | 10 (4.5%) |
Race in Mount Zion
The most populous races in Mount Zion are White / Caucasian (5,843 | 93.4%), Black / African American (163 | 2.6%), and Asian (150 | 2.4%).
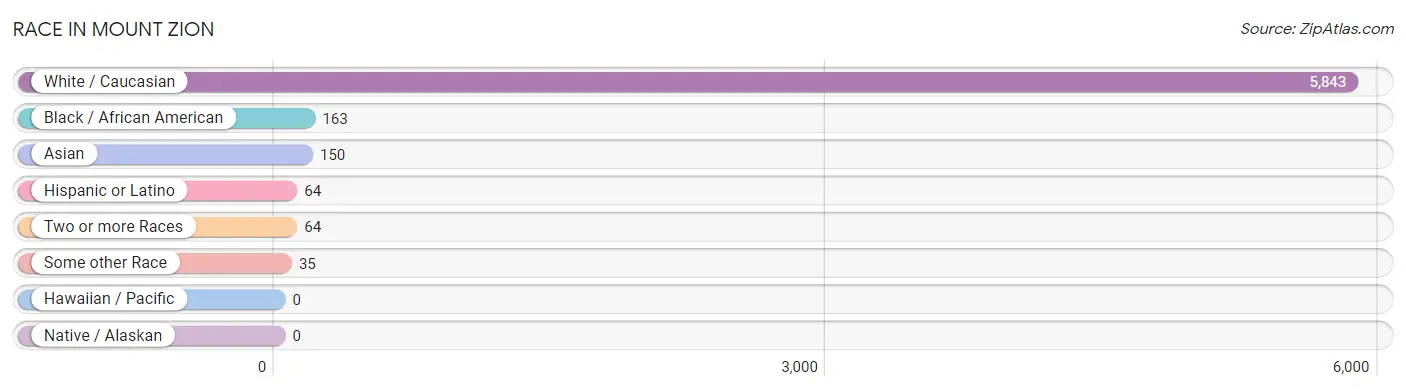
| Race | # Population | % Population |
| Asian | 150 | 2.4% |
| Black / African American | 163 | 2.6% |
| Hawaiian / Pacific | 0 | 0.0% |
| Hispanic or Latino | 64 | 1.0% |
| Native / Alaskan | 0 | 0.0% |
| White / Caucasian | 5,843 | 93.4% |
| Two or more Races | 64 | 1.0% |
| Some other Race | 35 | 0.6% |
| Total | 6,255 | 100.0% |
Ancestry in Mount Zion
The most populous ancestries reported in Mount Zion are German (1,446 | 23.1%), Irish (786 | 12.6%), English (742 | 11.9%), American (456 | 7.3%), and European (279 | 4.5%), together accounting for 59.3% of all Mount Zion residents.
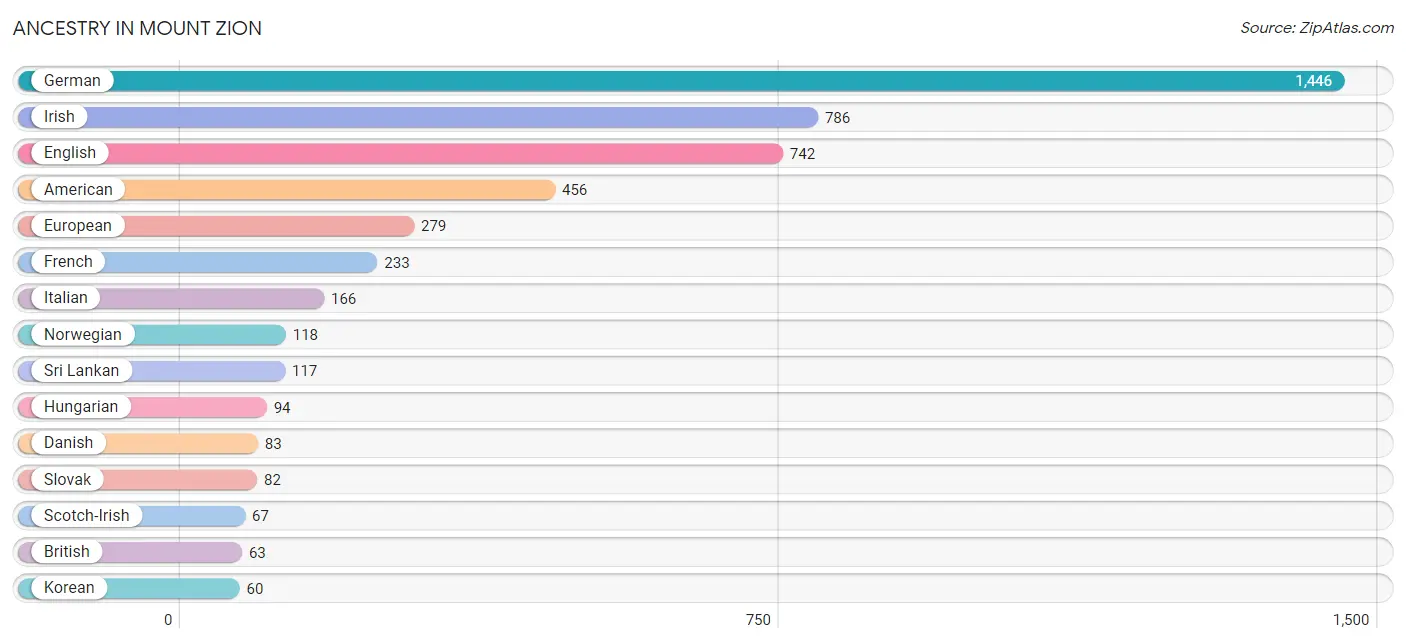
| Ancestry | # Population | % Population |
| American | 456 | 7.3% |
| Belgian | 20 | 0.3% |
| British | 63 | 1.0% |
| Czechoslovakian | 15 | 0.2% |
| Danish | 83 | 1.3% |
| Dutch | 55 | 0.9% |
| Eastern European | 38 | 0.6% |
| English | 742 | 11.9% |
| European | 279 | 4.5% |
| French | 233 | 3.7% |
| German | 1,446 | 23.1% |
| Greek | 10 | 0.2% |
| Hungarian | 94 | 1.5% |
| Irish | 786 | 12.6% |
| Italian | 166 | 2.6% |
| Korean | 60 | 1.0% |
| Mexican | 35 | 0.6% |
| Norwegian | 118 | 1.9% |
| Polish | 58 | 0.9% |
| Romanian | 22 | 0.4% |
| Russian | 11 | 0.2% |
| Scotch-Irish | 67 | 1.1% |
| Scottish | 34 | 0.5% |
| Slovak | 82 | 1.3% |
| Spanish | 29 | 0.5% |
| Sri Lankan | 117 | 1.9% |
| Swedish | 39 | 0.6% |
| Swiss | 21 | 0.3% |
| Turkish | 29 | 0.5% |
| Welsh | 18 | 0.3% | View All 30 Rows |
Immigrants in Mount Zion
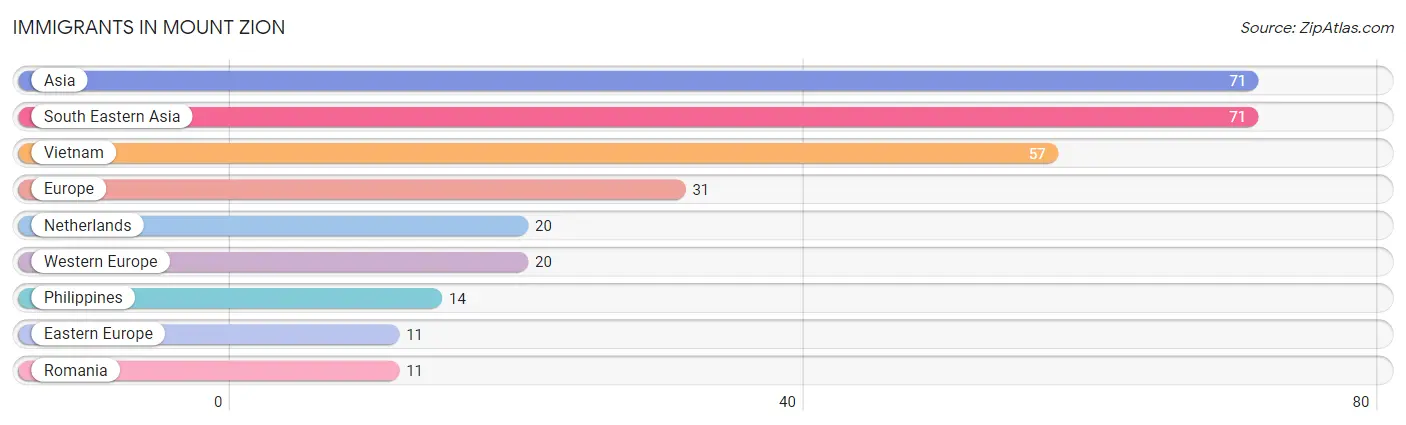
The most numerous immigrant groups reported in Mount Zion came from Asia (71 | 1.1%), South Eastern Asia (71 | 1.1%), Vietnam (57 | 0.9%), Europe (31 | 0.5%), and Netherlands (20 | 0.3%), together accounting for 4.0% of all Mount Zion residents.
| Immigration Origin | # Population | % Population |
| Asia | 71 | 1.1% |
| Eastern Europe | 11 | 0.2% |
| Europe | 31 | 0.5% |
| Netherlands | 20 | 0.3% |
| Philippines | 14 | 0.2% |
| Romania | 11 | 0.2% |
| South Eastern Asia | 71 | 1.1% |
| Vietnam | 57 | 0.9% |
| Western Europe | 20 | 0.3% | View All 9 Rows |
Sex and Age in Mount Zion
Sex and Age in Mount Zion
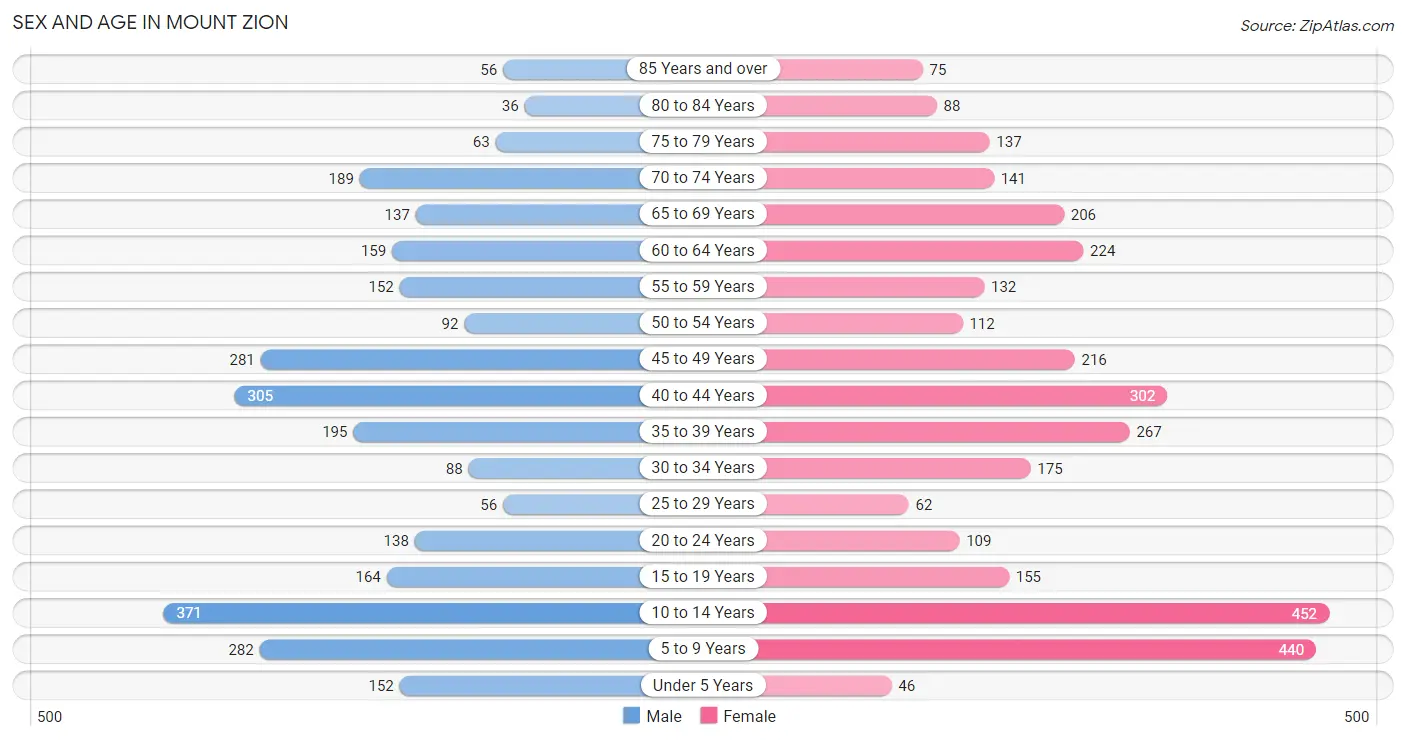
The most populous age groups in Mount Zion are 10 to 14 Years (371 | 12.7%) for men and 10 to 14 Years (452 | 13.5%) for women.
| Age Bracket | Male | Female |
| Under 5 Years | 152 (5.2%) | 46 (1.4%) |
| 5 to 9 Years | 282 (9.7%) | 440 (13.2%) |
| 10 to 14 Years | 371 (12.7%) | 452 (13.5%) |
| 15 to 19 Years | 164 (5.6%) | 155 (4.6%) |
| 20 to 24 Years | 138 (4.7%) | 109 (3.3%) |
| 25 to 29 Years | 56 (1.9%) | 62 (1.9%) |
| 30 to 34 Years | 88 (3.0%) | 175 (5.2%) |
| 35 to 39 Years | 195 (6.7%) | 267 (8.0%) |
| 40 to 44 Years | 305 (10.5%) | 302 (9.0%) |
| 45 to 49 Years | 281 (9.6%) | 216 (6.5%) |
| 50 to 54 Years | 92 (3.2%) | 112 (3.4%) |
| 55 to 59 Years | 152 (5.2%) | 132 (4.0%) |
| 60 to 64 Years | 159 (5.4%) | 224 (6.7%) |
| 65 to 69 Years | 137 (4.7%) | 206 (6.2%) |
| 70 to 74 Years | 189 (6.5%) | 141 (4.2%) |
| 75 to 79 Years | 63 (2.2%) | 137 (4.1%) |
| 80 to 84 Years | 36 (1.2%) | 88 (2.6%) |
| 85 Years and over | 56 (1.9%) | 75 (2.2%) |
| Total | 2,916 (100.0%) | 3,339 (100.0%) |
Families and Households in Mount Zion
Median Family Size in Mount Zion
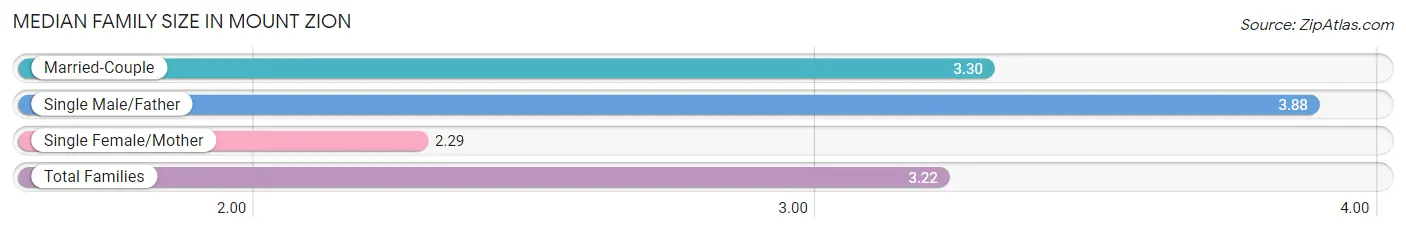
The median family size in Mount Zion is 3.22 persons per family, with single male/father families (48 | 2.7%) accounting for the largest median family size of 3.88 persons per family. On the other hand, single female/mother families (173 | 9.8%) represent the smallest median family size with 2.29 persons per family.
| Family Type | # Families | Family Size |
| Married-Couple | 1,543 (87.5%) | 3.30 |
| Single Male/Father | 48 (2.7%) | 3.88 |
| Single Female/Mother | 173 (9.8%) | 2.29 |
| Total Families | 1,764 (100.0%) | 3.22 |
Median Household Size in Mount Zion
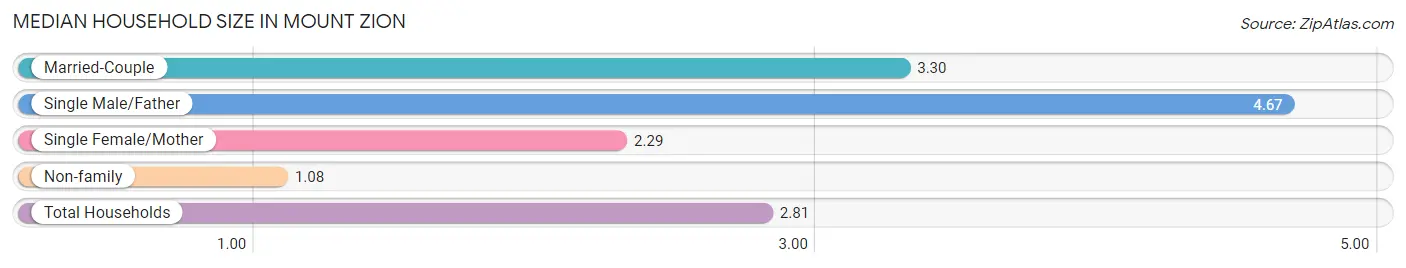
The median household size in Mount Zion is 2.81 persons per household, with single male/father households (48 | 2.2%) accounting for the largest median household size of 4.67 persons per household. non-family households (434 | 19.8%) represent the smallest median household size with 1.08 persons per household.
| Household Type | # Households | Household Size |
| Married-Couple | 1,543 (70.2%) | 3.30 |
| Single Male/Father | 48 (2.2%) | 4.67 |
| Single Female/Mother | 173 (7.9%) | 2.29 |
| Non-family | 434 (19.8%) | 1.08 |
| Total Households | 2,198 (100.0%) | 2.81 |
Household Size by Marriage Status in Mount Zion
Out of a total of 2,198 households in Mount Zion, 1,764 (80.2%) are family households, while 434 (19.8%) are nonfamily households. The most numerous type of family households are 2-person households, comprising 806, and the most common type of nonfamily households are 1-person households, comprising 404.
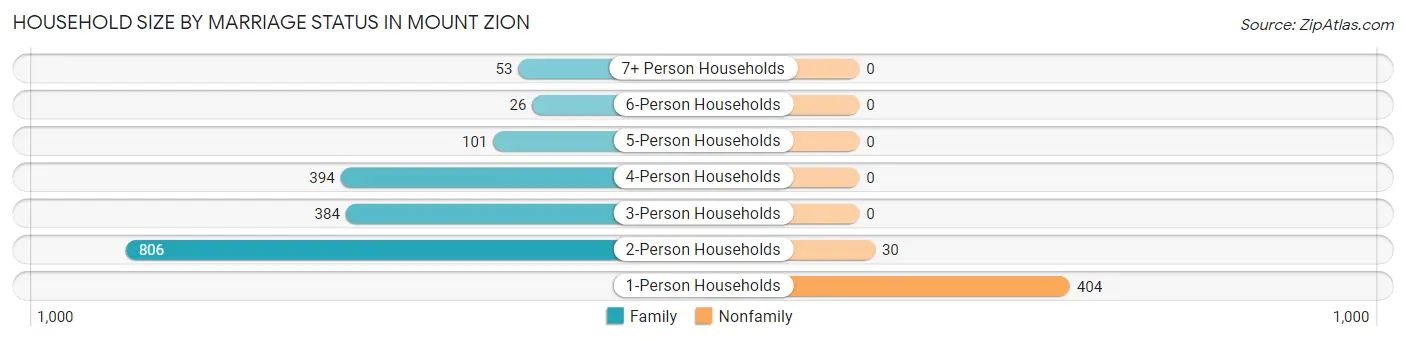
| Household Size | Family Households | Nonfamily Households |
| 1-Person Households | - | 404 (18.4%) |
| 2-Person Households | 806 (36.7%) | 30 (1.4%) |
| 3-Person Households | 384 (17.5%) | 0 (0.0%) |
| 4-Person Households | 394 (17.9%) | 0 (0.0%) |
| 5-Person Households | 101 (4.6%) | 0 (0.0%) |
| 6-Person Households | 26 (1.2%) | 0 (0.0%) |
| 7+ Person Households | 53 (2.4%) | 0 (0.0%) |
| Total | 1,764 (80.2%) | 434 (19.8%) |
Female Fertility in Mount Zion
Fertility by Age in Mount Zion
Average fertility rate in Mount Zion is 11.0 births per 1,000 women. Women in the age bracket of 20 to 34 years have the highest fertility rate with 43.0 births per 1,000 women. Women in the age bracket of 20 to 34 years acount for 100.0% of all women with births.
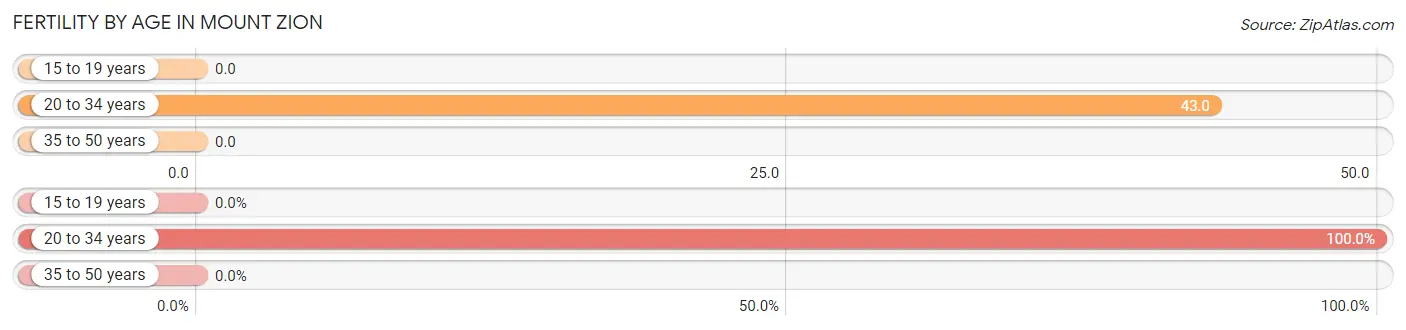
| Age Bracket | Women with Births | Births / 1,000 Women |
| 15 to 19 years | 0 (0.0%) | 0.0 |
| 20 to 34 years | 15 (100.0%) | 43.0 |
| 35 to 50 years | 0 (0.0%) | 0.0 |
| Total | 15 (100.0%) | 11.0 |
Fertility by Age by Marriage Status in Mount Zion
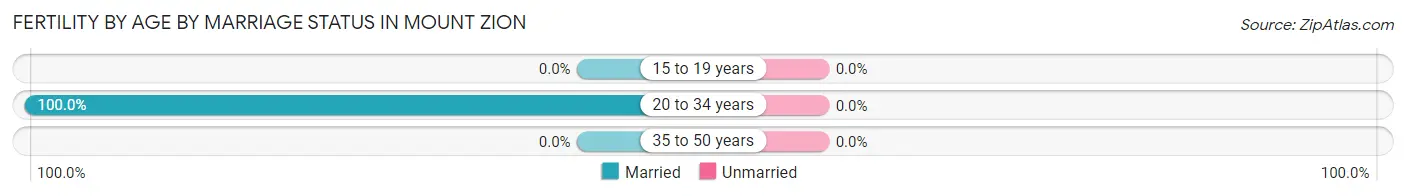
| Age Bracket | Married | Unmarried |
| 15 to 19 years | 0 (0.0%) | 0 (0.0%) |
| 20 to 34 years | 15 (100.0%) | 0 (0.0%) |
| 35 to 50 years | 0 (0.0%) | 0 (0.0%) |
| Total | 15 (100.0%) | 0 (0.0%) |
Fertility by Education in Mount Zion
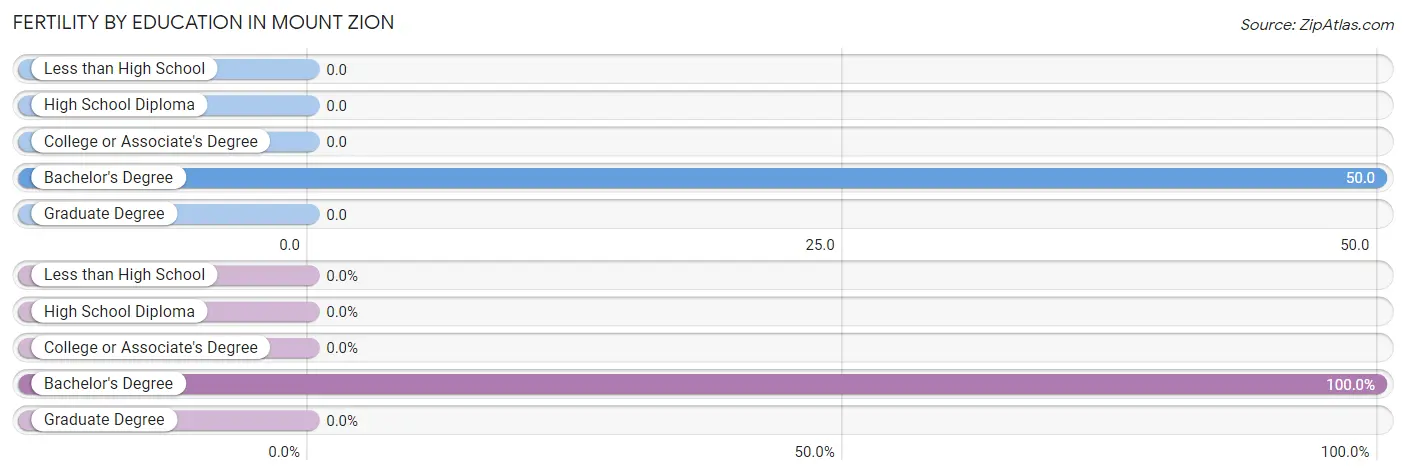
| Educational Attainment | Women with Births | Births / 1,000 Women |
| Less than High School | 0 (0.0%) | 0.0 |
| High School Diploma | 0 (0.0%) | 0.0 |
| College or Associate's Degree | 0 (0.0%) | 0.0 |
| Bachelor's Degree | 15 (100.0%) | 50.0 |
| Graduate Degree | 0 (0.0%) | 0.0 |
| Total | 15 (100.0%) | 11.0 |
Fertility by Education by Marriage Status in Mount Zion
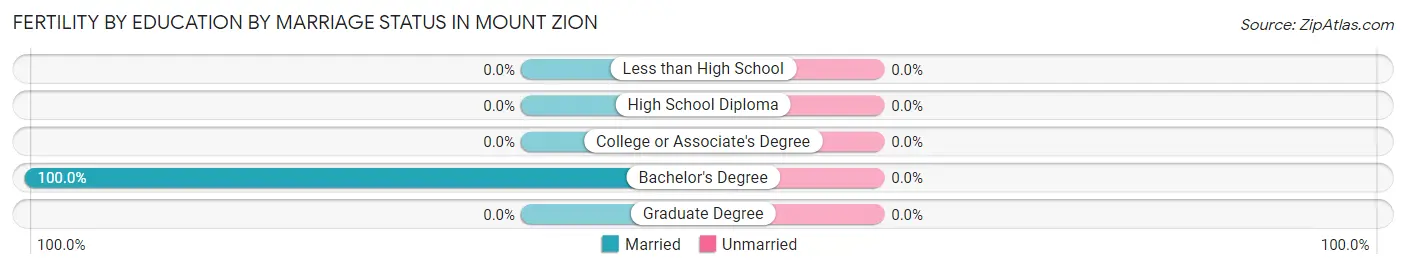
| Educational Attainment | Married | Unmarried |
| Less than High School | 0 (0.0%) | 0 (0.0%) |
| High School Diploma | 0 (0.0%) | 0 (0.0%) |
| College or Associate's Degree | 0 (0.0%) | 0 (0.0%) |
| Bachelor's Degree | 15 (100.0%) | 0 (0.0%) |
| Graduate Degree | 0 (0.0%) | 0 (0.0%) |
| Total | 15 (100.0%) | 0 (0.0%) |
Employment Characteristics in Mount Zion
Employment by Class of Employer in Mount Zion
Among the 2,779 employed individuals in Mount Zion, private company employees (2,116 | 76.1%), local government employees (247 | 8.9%), and not-for-profit organizations (187 | 6.7%) make up the most common classes of employment.
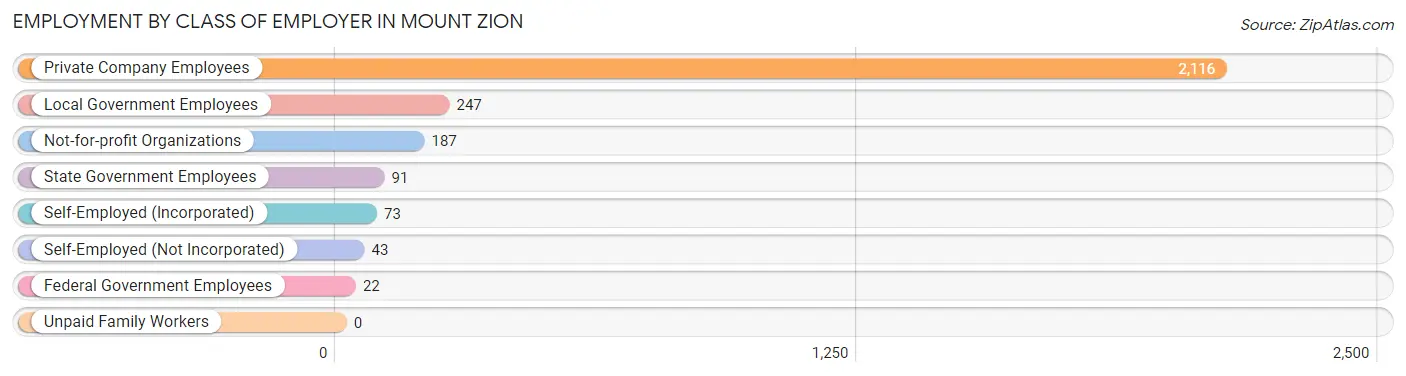
| Employer Class | # Employees | % Employees |
| Private Company Employees | 2,116 | 76.1% |
| Self-Employed (Incorporated) | 73 | 2.6% |
| Self-Employed (Not Incorporated) | 43 | 1.5% |
| Not-for-profit Organizations | 187 | 6.7% |
| Local Government Employees | 247 | 8.9% |
| State Government Employees | 91 | 3.3% |
| Federal Government Employees | 22 | 0.8% |
| Unpaid Family Workers | 0 | 0.0% |
| Total | 2,779 | 100.0% |
Employment Status by Age in Mount Zion
According to the labor force statistics for Mount Zion, out of the total population over 16 years of age (4,408), 66.8% or 2,945 individuals are in the labor force, with 4.0% or 118 of them unemployed. The age group with the highest labor force participation rate is 20 to 24 years, with 100.0% or 247 individuals in the labor force. Within the labor force, the 16 to 19 years age range has the highest percentage of unemployed individuals, with 9.3% or 19 of them being unemployed.
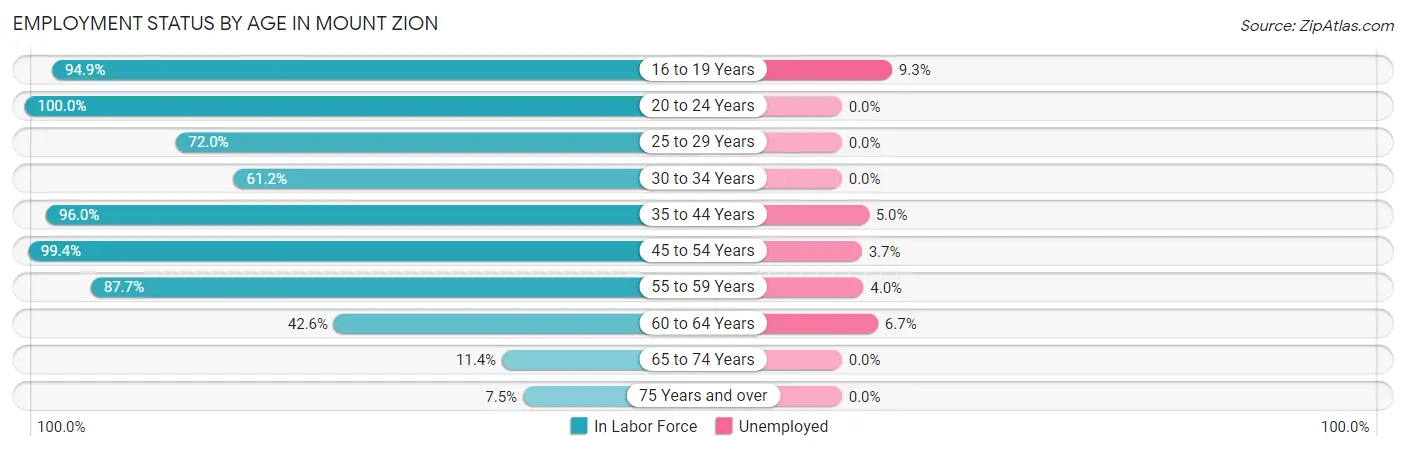
| Age Bracket | In Labor Force | Unemployed |
| 16 to 19 Years | 204 (94.9%) | 19 (9.3%) |
| 20 to 24 Years | 247 (100.0%) | 0 (0.0%) |
| 25 to 29 Years | 85 (72.0%) | 0 (0.0%) |
| 30 to 34 Years | 161 (61.2%) | 0 (0.0%) |
| 35 to 44 Years | 1,026 (96.0%) | 51 (5.0%) |
| 45 to 54 Years | 697 (99.4%) | 26 (3.7%) |
| 55 to 59 Years | 249 (87.7%) | 10 (4.0%) |
| 60 to 64 Years | 163 (42.6%) | 11 (6.7%) |
| 65 to 74 Years | 77 (11.4%) | 0 (0.0%) |
| 75 Years and over | 34 (7.5%) | 0 (0.0%) |
| Total | 2,945 (66.8%) | 118 (4.0%) |
Employment Status by Educational Attainment in Mount Zion
According to labor force statistics for Mount Zion, 84.5% of individuals (2,381) out of the total population between 25 and 64 years of age (2,818) are in the labor force, with 4.1% or 98 of them being unemployed. The group with the highest labor force participation rate are those with the educational attainment of bachelor's degree or higher, with 91.9% or 816 individuals in the labor force. Within the labor force, individuals with less than high school education have the highest percentage of unemployment, with 45.6% or 26 of them being unemployed.
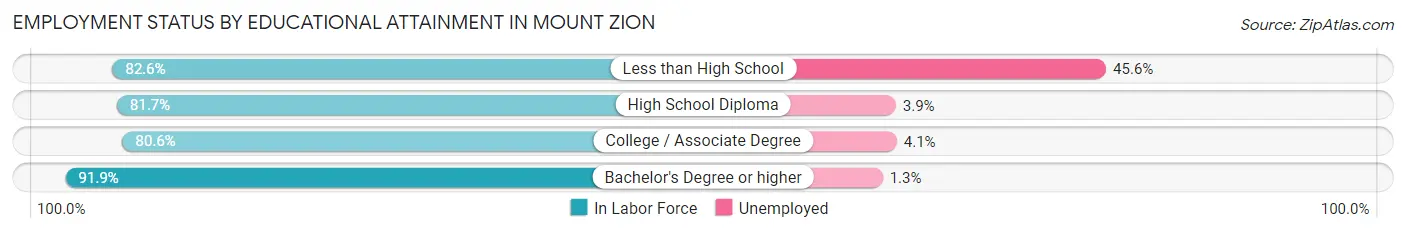
| Educational Attainment | In Labor Force | Unemployed |
| Less than High School | 57 (82.6%) | 31 (45.6%) |
| High School Diploma | 592 (81.7%) | 28 (3.9%) |
| College / Associate Degree | 916 (80.6%) | 47 (4.1%) |
| Bachelor's Degree or higher | 816 (91.9%) | 12 (1.3%) |
| Total | 2,381 (84.5%) | 116 (4.1%) |
Employment Occupations by Sex in Mount Zion
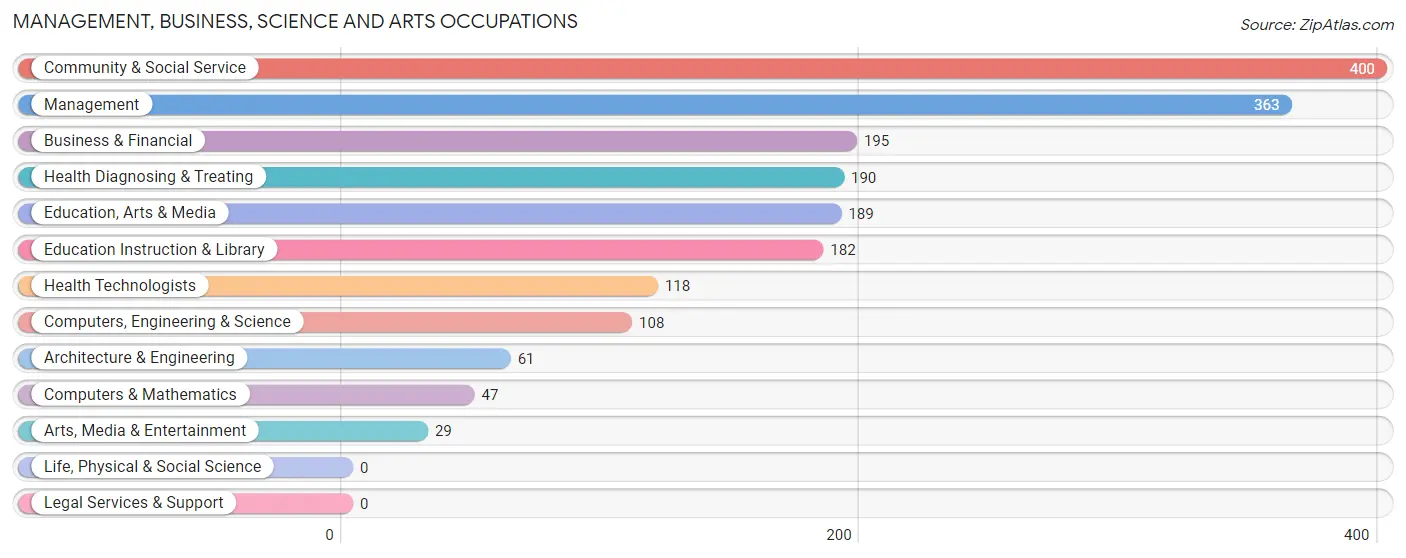
Management, Business, Science and Arts Occupations
The most common Management, Business, Science and Arts occupations in Mount Zion are Community & Social Service (400 | 14.1%), Management (363 | 12.9%), Business & Financial (195 | 6.9%), Health Diagnosing & Treating (190 | 6.7%), and Education, Arts & Media (189 | 6.7%).
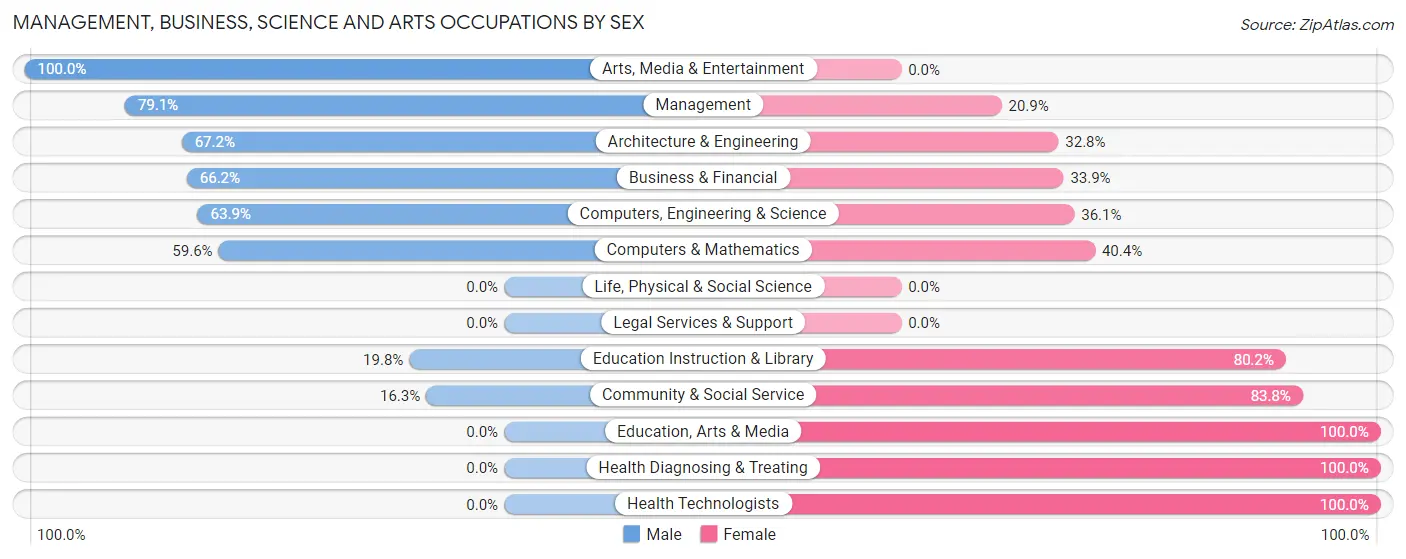
Management, Business, Science and Arts Occupations by Sex
Within the Management, Business, Science and Arts occupations in Mount Zion, the most male-oriented occupations are Arts, Media & Entertainment (100.0%), Management (79.1%), and Architecture & Engineering (67.2%), while the most female-oriented occupations are Education, Arts & Media (100.0%), Health Diagnosing & Treating (100.0%), and Health Technologists (100.0%).
| Occupation | Male | Female |
| Management | 287 (79.1%) | 76 (20.9%) |
| Business & Financial | 129 (66.1%) | 66 (33.9%) |
| Computers, Engineering & Science | 69 (63.9%) | 39 (36.1%) |
| Computers & Mathematics | 28 (59.6%) | 19 (40.4%) |
| Architecture & Engineering | 41 (67.2%) | 20 (32.8%) |
| Life, Physical & Social Science | 0 (0.0%) | 0 (0.0%) |
| Community & Social Service | 65 (16.3%) | 335 (83.8%) |
| Education, Arts & Media | 0 (0.0%) | 189 (100.0%) |
| Legal Services & Support | 0 (0.0%) | 0 (0.0%) |
| Education Instruction & Library | 36 (19.8%) | 146 (80.2%) |
| Arts, Media & Entertainment | 29 (100.0%) | 0 (0.0%) |
| Health Diagnosing & Treating | 0 (0.0%) | 190 (100.0%) |
| Health Technologists | 0 (0.0%) | 118 (100.0%) |
| Total (Category) | 550 (43.8%) | 706 (56.2%) |
| Total (Overall) | 1,529 (54.1%) | 1,297 (45.9%) |
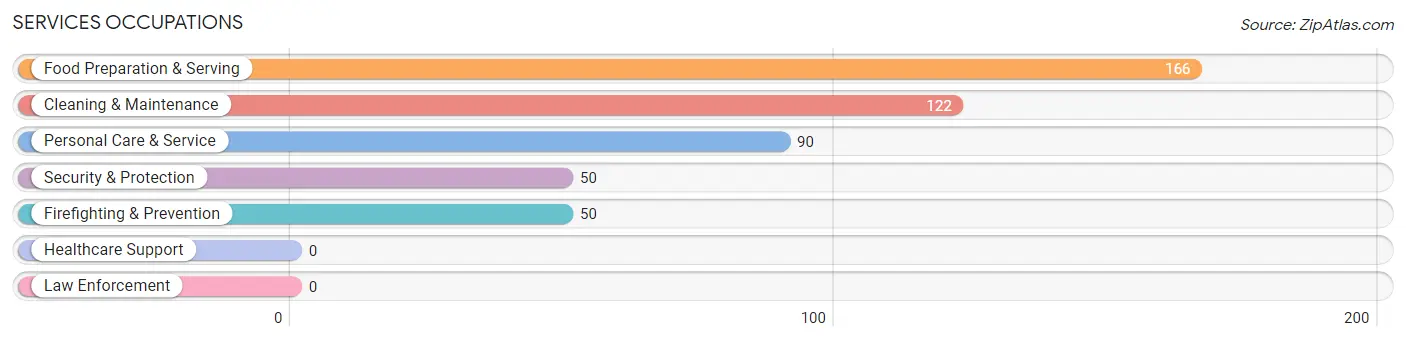
Services Occupations
The most common Services occupations in Mount Zion are Food Preparation & Serving (166 | 5.9%), Cleaning & Maintenance (122 | 4.3%), Personal Care & Service (90 | 3.2%), Security & Protection (50 | 1.8%), and Firefighting & Prevention (50 | 1.8%).
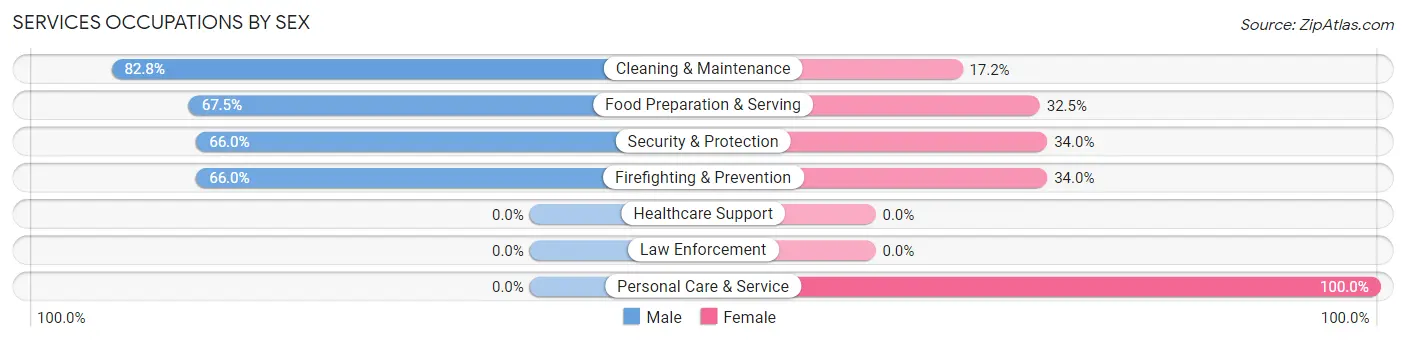
Services Occupations by Sex
Within the Services occupations in Mount Zion, the most male-oriented occupations are Cleaning & Maintenance (82.8%), Food Preparation & Serving (67.5%), and Security & Protection (66.0%), while the most female-oriented occupations are Personal Care & Service (100.0%), Security & Protection (34.0%), and Firefighting & Prevention (34.0%).
| Occupation | Male | Female |
| Healthcare Support | 0 (0.0%) | 0 (0.0%) |
| Security & Protection | 33 (66.0%) | 17 (34.0%) |
| Firefighting & Prevention | 33 (66.0%) | 17 (34.0%) |
| Law Enforcement | 0 (0.0%) | 0 (0.0%) |
| Food Preparation & Serving | 112 (67.5%) | 54 (32.5%) |
| Cleaning & Maintenance | 101 (82.8%) | 21 (17.2%) |
| Personal Care & Service | 0 (0.0%) | 90 (100.0%) |
| Total (Category) | 246 (57.5%) | 182 (42.5%) |
| Total (Overall) | 1,529 (54.1%) | 1,297 (45.9%) |
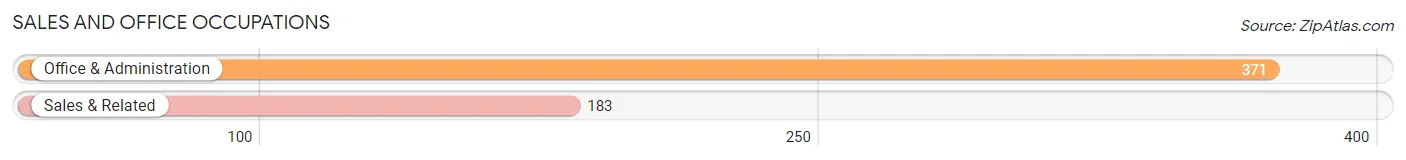
Sales and Office Occupations
The most common Sales and Office occupations in Mount Zion are Office & Administration (371 | 13.1%), and Sales & Related (183 | 6.5%).
Sales and Office Occupations by Sex
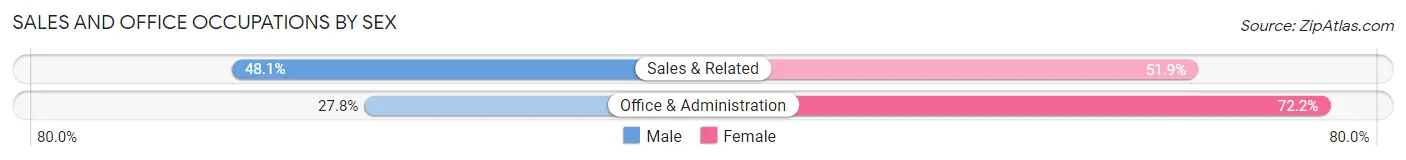
| Occupation | Male | Female |
| Sales & Related | 88 (48.1%) | 95 (51.9%) |
| Office & Administration | 103 (27.8%) | 268 (72.2%) |
| Total (Category) | 191 (34.5%) | 363 (65.5%) |
| Total (Overall) | 1,529 (54.1%) | 1,297 (45.9%) |
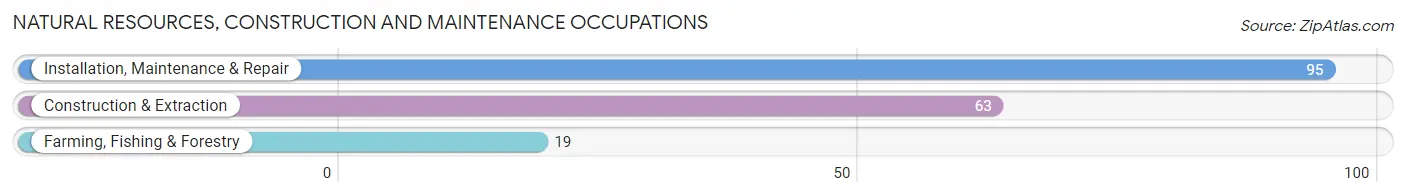
Natural Resources, Construction and Maintenance Occupations
The most common Natural Resources, Construction and Maintenance occupations in Mount Zion are Installation, Maintenance & Repair (95 | 3.4%), Construction & Extraction (63 | 2.2%), and Farming, Fishing & Forestry (19 | 0.7%).
Natural Resources, Construction and Maintenance Occupations by Sex
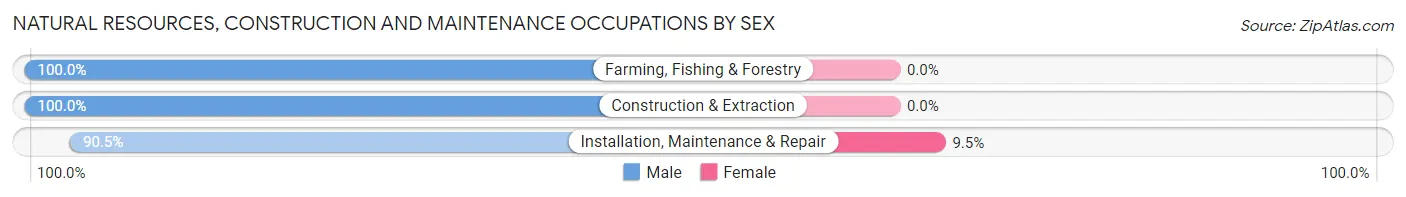
| Occupation | Male | Female |
| Farming, Fishing & Forestry | 19 (100.0%) | 0 (0.0%) |
| Construction & Extraction | 63 (100.0%) | 0 (0.0%) |
| Installation, Maintenance & Repair | 86 (90.5%) | 9 (9.5%) |
| Total (Category) | 168 (94.9%) | 9 (5.1%) |
| Total (Overall) | 1,529 (54.1%) | 1,297 (45.9%) |
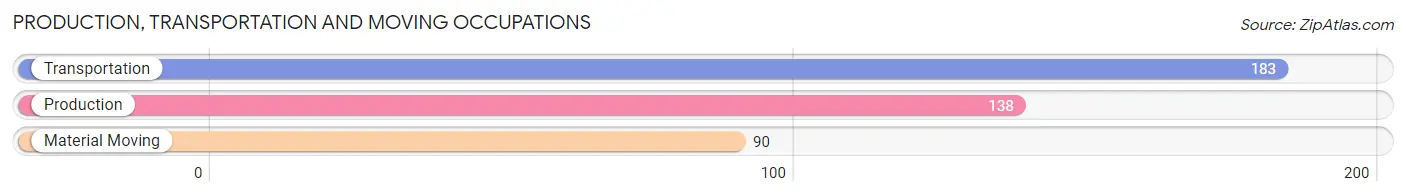
Production, Transportation and Moving Occupations
The most common Production, Transportation and Moving occupations in Mount Zion are Transportation (183 | 6.5%), Production (138 | 4.9%), and Material Moving (90 | 3.2%).
Production, Transportation and Moving Occupations by Sex
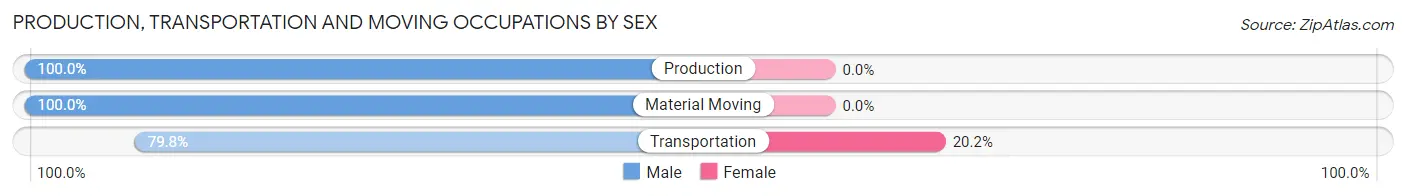
| Occupation | Male | Female |
| Production | 138 (100.0%) | 0 (0.0%) |
| Transportation | 146 (79.8%) | 37 (20.2%) |
| Material Moving | 90 (100.0%) | 0 (0.0%) |
| Total (Category) | 374 (91.0%) | 37 (9.0%) |
| Total (Overall) | 1,529 (54.1%) | 1,297 (45.9%) |
Employment Industries by Sex in Mount Zion
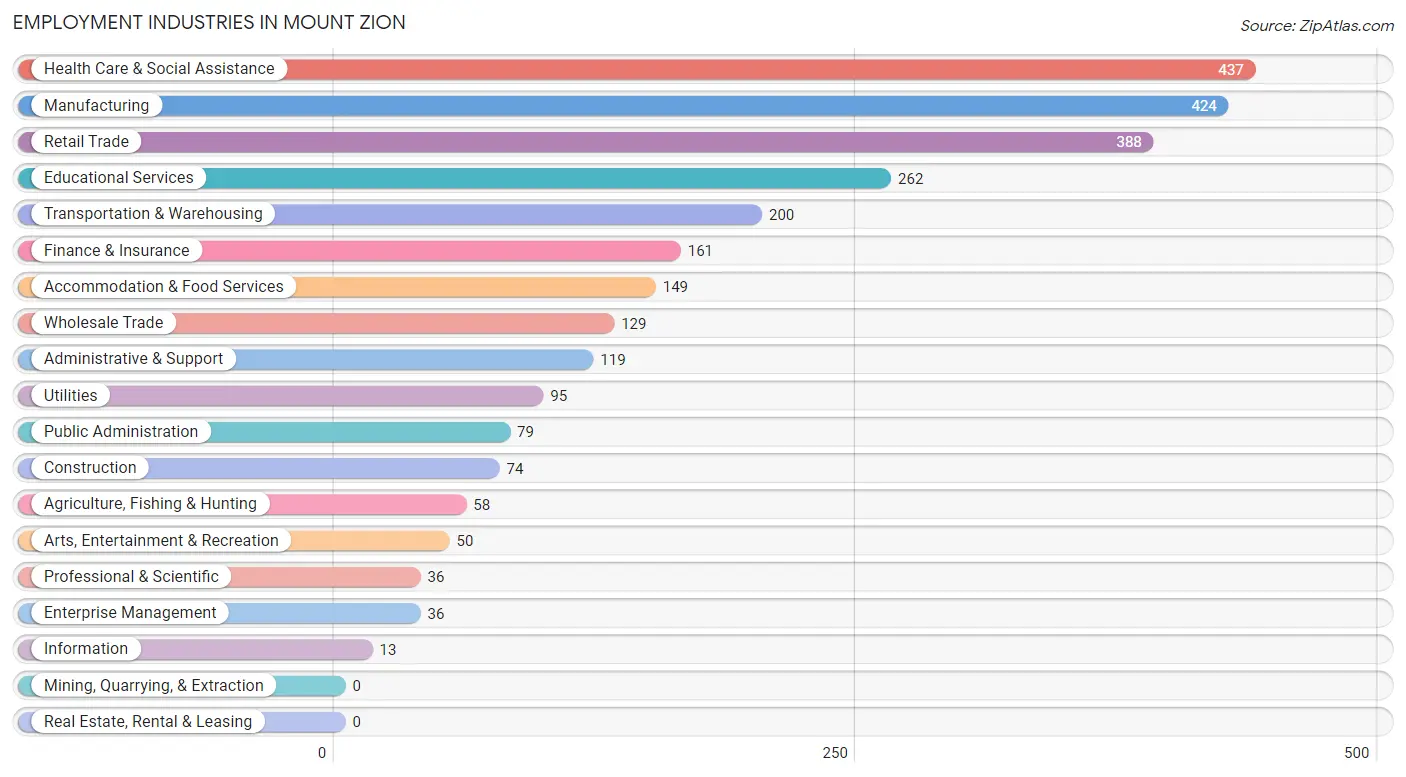
Employment Industries in Mount Zion
The major employment industries in Mount Zion include Health Care & Social Assistance (437 | 15.5%), Manufacturing (424 | 15.0%), Retail Trade (388 | 13.7%), Educational Services (262 | 9.3%), and Transportation & Warehousing (200 | 7.1%).
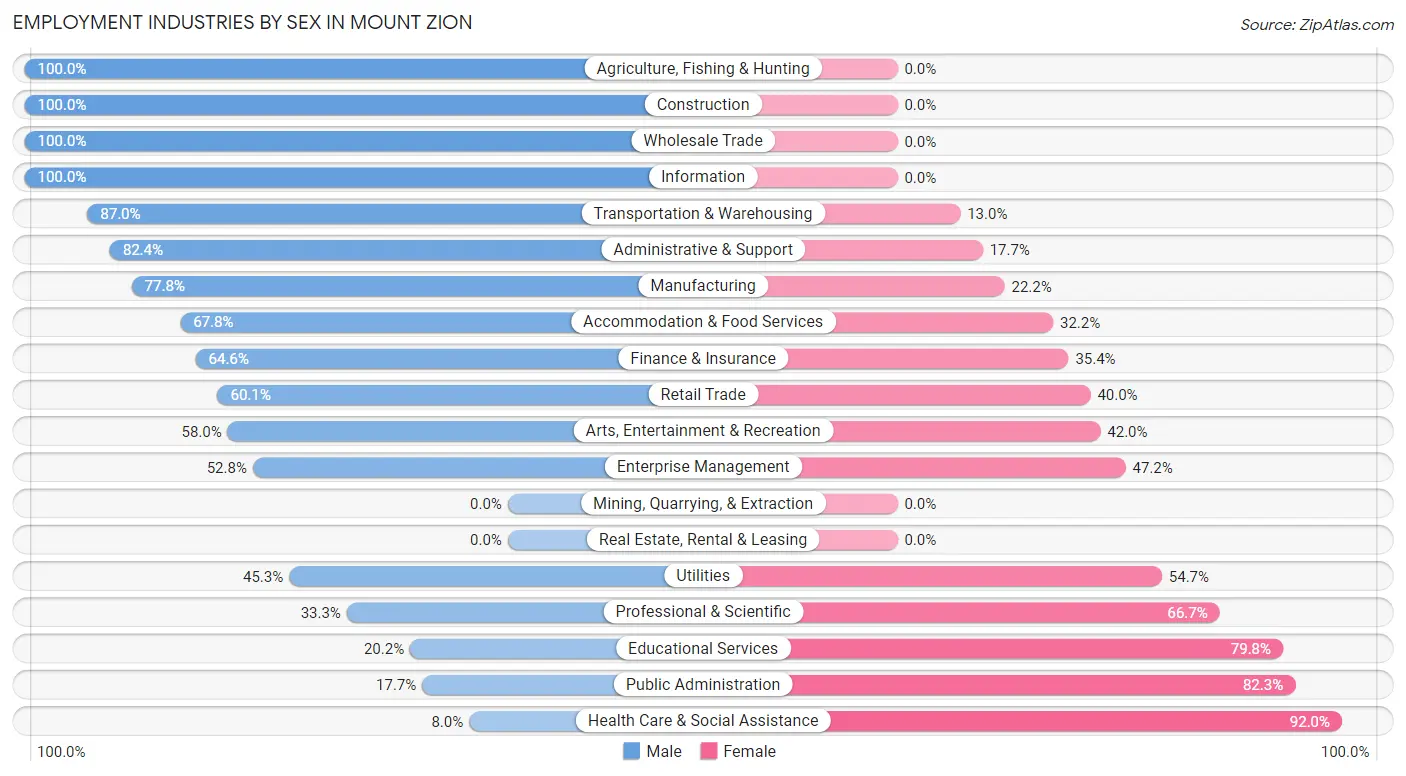
Employment Industries by Sex in Mount Zion
The Mount Zion industries that see more men than women are Agriculture, Fishing & Hunting (100.0%), Construction (100.0%), and Wholesale Trade (100.0%), whereas the industries that tend to have a higher number of women are Health Care & Social Assistance (92.0%), Public Administration (82.3%), and Educational Services (79.8%).
| Industry | Male | Female |
| Agriculture, Fishing & Hunting | 58 (100.0%) | 0 (0.0%) |
| Mining, Quarrying, & Extraction | 0 (0.0%) | 0 (0.0%) |
| Construction | 74 (100.0%) | 0 (0.0%) |
| Manufacturing | 330 (77.8%) | 94 (22.2%) |
| Wholesale Trade | 129 (100.0%) | 0 (0.0%) |
| Retail Trade | 233 (60.1%) | 155 (40.0%) |
| Transportation & Warehousing | 174 (87.0%) | 26 (13.0%) |
| Utilities | 43 (45.3%) | 52 (54.7%) |
| Information | 13 (100.0%) | 0 (0.0%) |
| Finance & Insurance | 104 (64.6%) | 57 (35.4%) |
| Real Estate, Rental & Leasing | 0 (0.0%) | 0 (0.0%) |
| Professional & Scientific | 12 (33.3%) | 24 (66.7%) |
| Enterprise Management | 19 (52.8%) | 17 (47.2%) |
| Administrative & Support | 98 (82.4%) | 21 (17.6%) |
| Educational Services | 53 (20.2%) | 209 (79.8%) |
| Health Care & Social Assistance | 35 (8.0%) | 402 (92.0%) |
| Arts, Entertainment & Recreation | 29 (58.0%) | 21 (42.0%) |
| Accommodation & Food Services | 101 (67.8%) | 48 (32.2%) |
| Public Administration | 14 (17.7%) | 65 (82.3%) |
| Total | 1,529 (54.1%) | 1,297 (45.9%) |
Education in Mount Zion
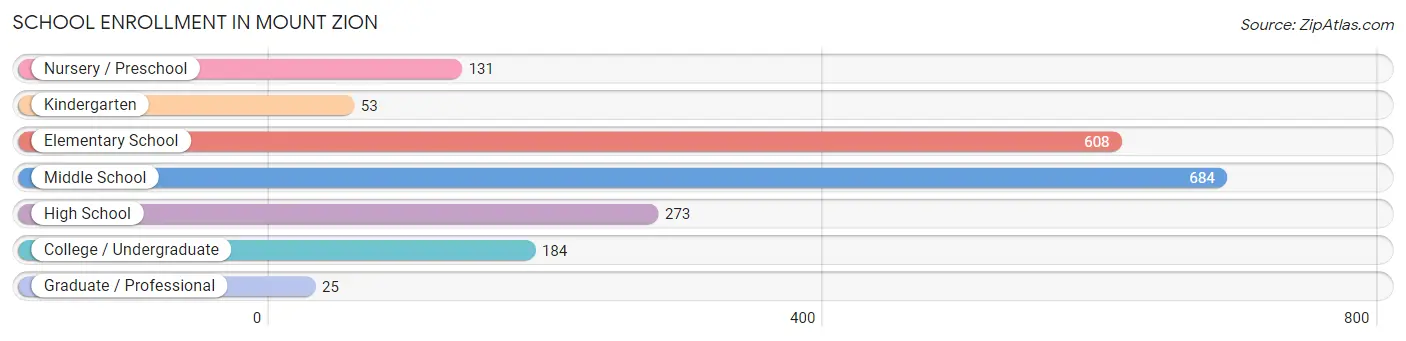
School Enrollment in Mount Zion
The most common levels of schooling among the 1,958 students in Mount Zion are middle school (684 | 34.9%), elementary school (608 | 31.0%), and high school (273 | 13.9%).
| School Level | # Students | % Students |
| Nursery / Preschool | 131 | 6.7% |
| Kindergarten | 53 | 2.7% |
| Elementary School | 608 | 31.0% |
| Middle School | 684 | 34.9% |
| High School | 273 | 13.9% |
| College / Undergraduate | 184 | 9.4% |
| Graduate / Professional | 25 | 1.3% |
| Total | 1,958 | 100.0% |
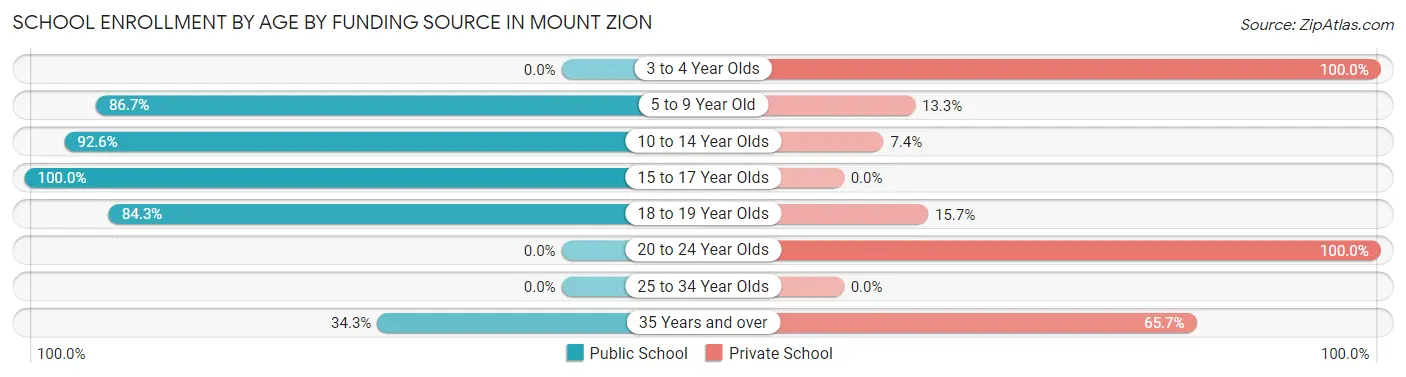
School Enrollment by Age by Funding Source in Mount Zion
Out of a total of 1,958 students who are enrolled in schools in Mount Zion, 335 (17.1%) attend a private institution, while the remaining 1,623 (82.9%) are enrolled in public schools. The age group of 3 to 4 year olds has the highest likelihood of being enrolled in private schools, with 52 (100.0% in the age bracket) enrolled. Conversely, the age group of 15 to 17 year olds has the lowest likelihood of being enrolled in a private school, with 167 (100.0% in the age bracket) attending a public institution.
| Age Bracket | Public School | Private School |
| 3 to 4 Year Olds | 0 (0.0%) | 52 (100.0%) |
| 5 to 9 Year Old | 613 (86.7%) | 94 (13.3%) |
| 10 to 14 Year Olds | 762 (92.6%) | 61 (7.4%) |
| 15 to 17 Year Olds | 167 (100.0%) | 0 (0.0%) |
| 18 to 19 Year Olds | 59 (84.3%) | 11 (15.7%) |
| 20 to 24 Year Olds | 0 (0.0%) | 72 (100.0%) |
| 25 to 34 Year Olds | 0 (0.0%) | 0 (0.0%) |
| 35 Years and over | 23 (34.3%) | 44 (65.7%) |
| Total | 1,623 (82.9%) | 335 (17.1%) |
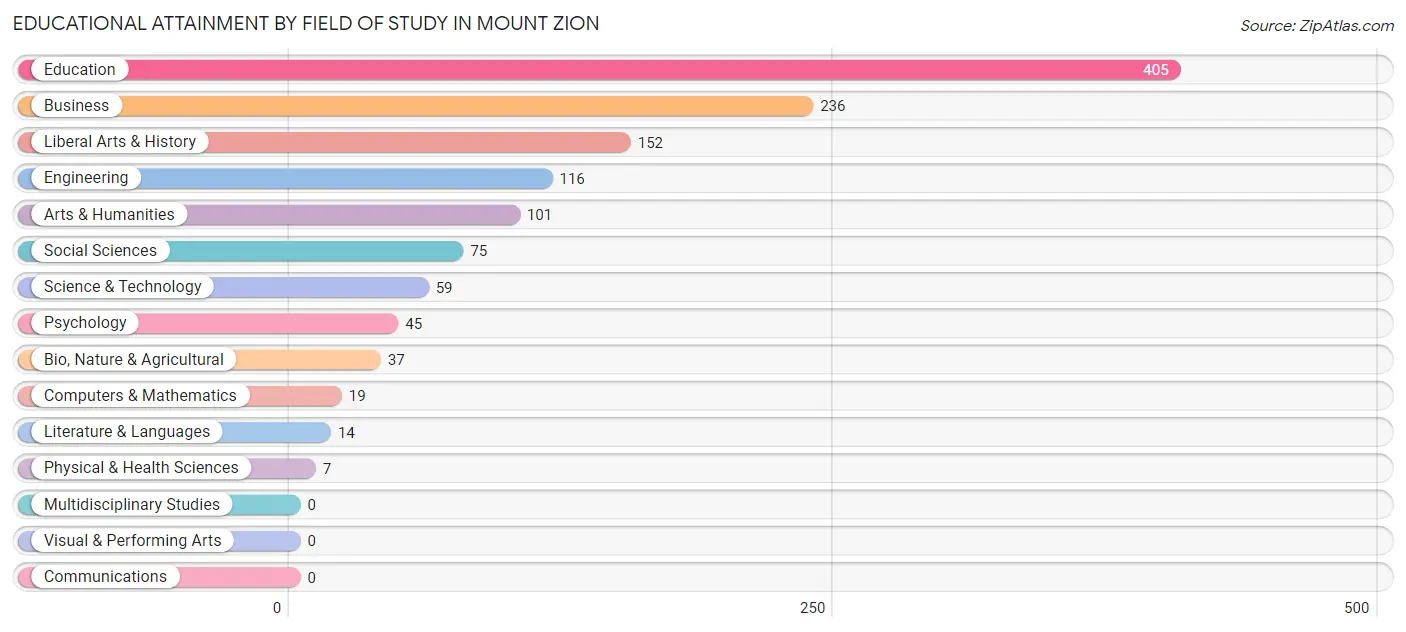
Educational Attainment by Field of Study in Mount Zion
Education (405 | 32.0%), business (236 | 18.6%), liberal arts & history (152 | 12.0%), engineering (116 | 9.2%), and arts & humanities (101 | 8.0%) are the most common fields of study among 1,266 individuals in Mount Zion who have obtained a bachelor's degree or higher.
| Field of Study | # Graduates | % Graduates |
| Computers & Mathematics | 19 | 1.5% |
| Bio, Nature & Agricultural | 37 | 2.9% |
| Physical & Health Sciences | 7 | 0.5% |
| Psychology | 45 | 3.5% |
| Social Sciences | 75 | 5.9% |
| Engineering | 116 | 9.2% |
| Multidisciplinary Studies | 0 | 0.0% |
| Science & Technology | 59 | 4.7% |
| Business | 236 | 18.6% |
| Education | 405 | 32.0% |
| Literature & Languages | 14 | 1.1% |
| Liberal Arts & History | 152 | 12.0% |
| Visual & Performing Arts | 0 | 0.0% |
| Communications | 0 | 0.0% |
| Arts & Humanities | 101 | 8.0% |
| Total | 1,266 | 100.0% |
Transportation & Commute in Mount Zion
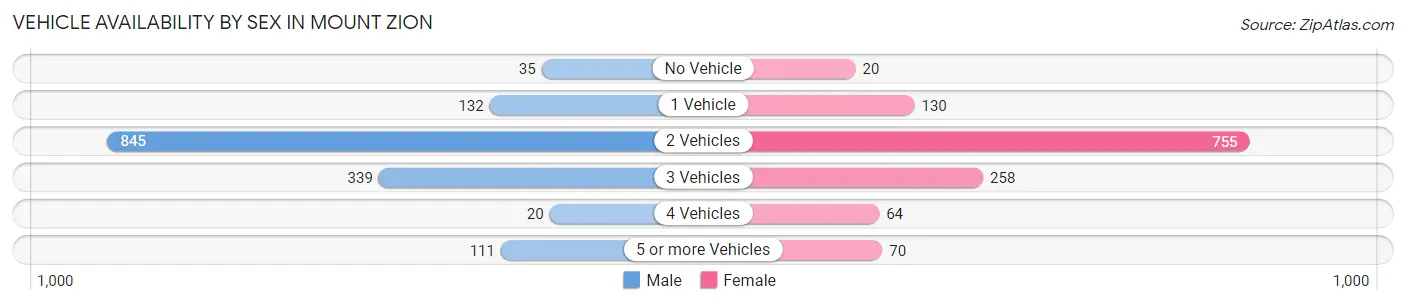
Vehicle Availability by Sex in Mount Zion
The most prevalent vehicle ownership categories in Mount Zion are males with 2 vehicles (845, accounting for 57.0%) and females with 2 vehicles (755, making up 65.1%).
| Vehicles Available | Male | Female |
| No Vehicle | 35 (2.4%) | 20 (1.5%) |
| 1 Vehicle | 132 (8.9%) | 130 (10.0%) |
| 2 Vehicles | 845 (57.0%) | 755 (58.2%) |
| 3 Vehicles | 339 (22.9%) | 258 (19.9%) |
| 4 Vehicles | 20 (1.3%) | 64 (4.9%) |
| 5 or more Vehicles | 111 (7.5%) | 70 (5.4%) |
| Total | 1,482 (100.0%) | 1,297 (100.0%) |
Commute Time in Mount Zion
The most frequently occuring commute durations in Mount Zion are 15 to 19 minutes (895 commuters, 33.4%), 20 to 24 minutes (820 commuters, 30.6%), and 10 to 14 minutes (345 commuters, 12.9%).
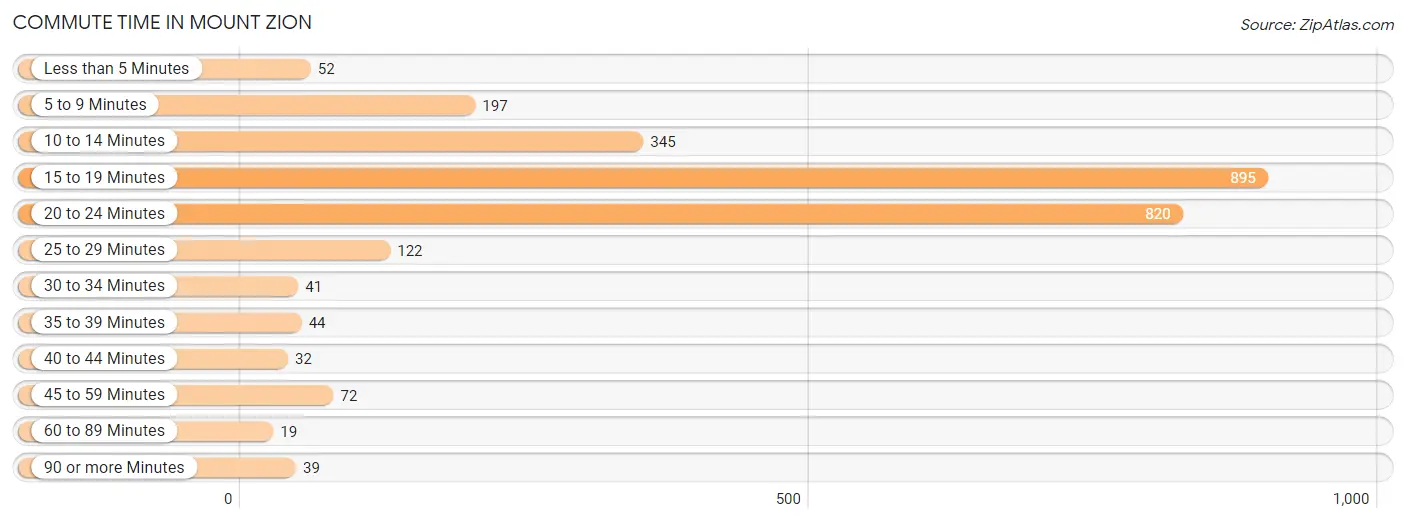
| Commute Time | # Commuters | % Commuters |
| Less than 5 Minutes | 52 | 1.9% |
| 5 to 9 Minutes | 197 | 7.4% |
| 10 to 14 Minutes | 345 | 12.9% |
| 15 to 19 Minutes | 895 | 33.4% |
| 20 to 24 Minutes | 820 | 30.6% |
| 25 to 29 Minutes | 122 | 4.6% |
| 30 to 34 Minutes | 41 | 1.5% |
| 35 to 39 Minutes | 44 | 1.6% |
| 40 to 44 Minutes | 32 | 1.2% |
| 45 to 59 Minutes | 72 | 2.7% |
| 60 to 89 Minutes | 19 | 0.7% |
| 90 or more Minutes | 39 | 1.5% |
Commute Time by Sex in Mount Zion
The most common commute times in Mount Zion are 15 to 19 minutes (536 commuters, 37.3%) for males and 20 to 24 minutes (459 commuters, 37.0%) for females.
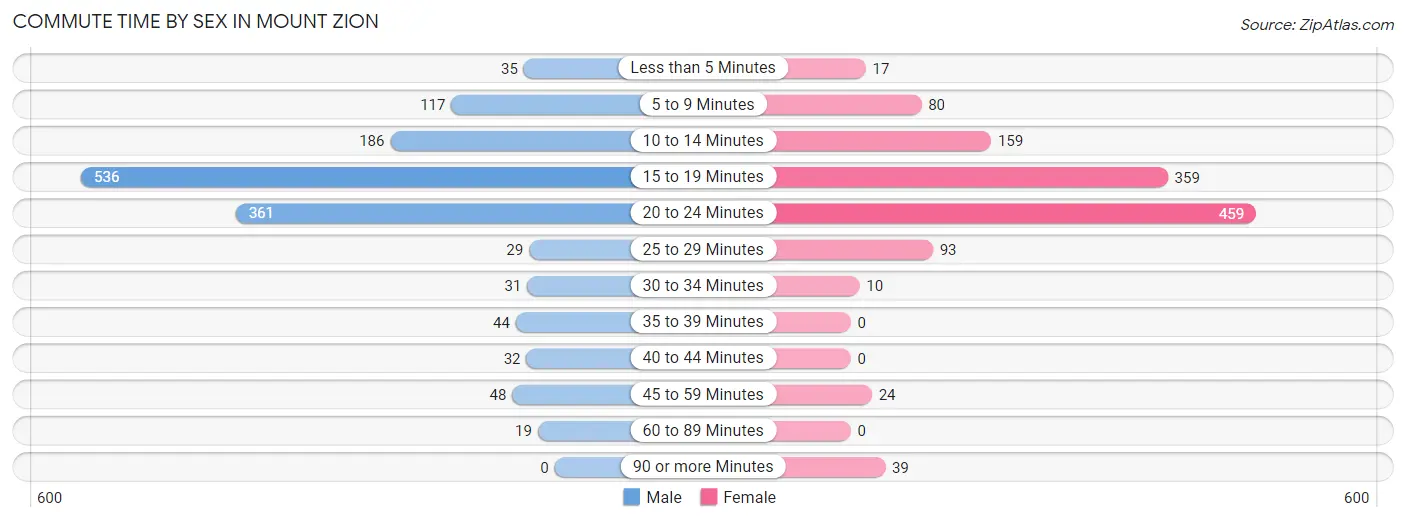
| Commute Time | Male | Female |
| Less than 5 Minutes | 35 (2.4%) | 17 (1.4%) |
| 5 to 9 Minutes | 117 (8.1%) | 80 (6.5%) |
| 10 to 14 Minutes | 186 (12.9%) | 159 (12.8%) |
| 15 to 19 Minutes | 536 (37.3%) | 359 (28.9%) |
| 20 to 24 Minutes | 361 (25.1%) | 459 (37.0%) |
| 25 to 29 Minutes | 29 (2.0%) | 93 (7.5%) |
| 30 to 34 Minutes | 31 (2.2%) | 10 (0.8%) |
| 35 to 39 Minutes | 44 (3.1%) | 0 (0.0%) |
| 40 to 44 Minutes | 32 (2.2%) | 0 (0.0%) |
| 45 to 59 Minutes | 48 (3.3%) | 24 (1.9%) |
| 60 to 89 Minutes | 19 (1.3%) | 0 (0.0%) |
| 90 or more Minutes | 0 (0.0%) | 39 (3.2%) |
Time of Departure to Work by Sex in Mount Zion
The most frequent times of departure to work in Mount Zion are 6:30 AM to 6:59 AM (346, 24.1%) for males and 7:30 AM to 7:59 AM (336, 27.1%) for females.
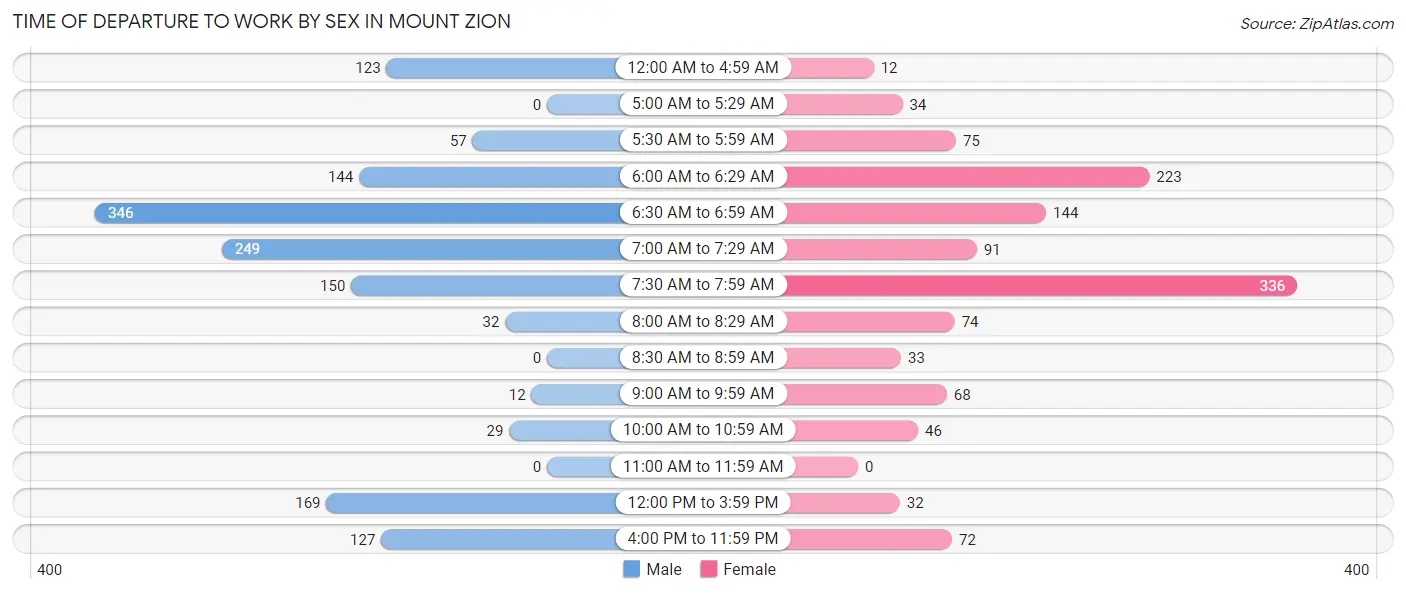
| Time of Departure | Male | Female |
| 12:00 AM to 4:59 AM | 123 (8.6%) | 12 (1.0%) |
| 5:00 AM to 5:29 AM | 0 (0.0%) | 34 (2.7%) |
| 5:30 AM to 5:59 AM | 57 (4.0%) | 75 (6.0%) |
| 6:00 AM to 6:29 AM | 144 (10.0%) | 223 (18.0%) |
| 6:30 AM to 6:59 AM | 346 (24.1%) | 144 (11.6%) |
| 7:00 AM to 7:29 AM | 249 (17.3%) | 91 (7.3%) |
| 7:30 AM to 7:59 AM | 150 (10.4%) | 336 (27.1%) |
| 8:00 AM to 8:29 AM | 32 (2.2%) | 74 (6.0%) |
| 8:30 AM to 8:59 AM | 0 (0.0%) | 33 (2.7%) |
| 9:00 AM to 9:59 AM | 12 (0.8%) | 68 (5.5%) |
| 10:00 AM to 10:59 AM | 29 (2.0%) | 46 (3.7%) |
| 11:00 AM to 11:59 AM | 0 (0.0%) | 0 (0.0%) |
| 12:00 PM to 3:59 PM | 169 (11.7%) | 32 (2.6%) |
| 4:00 PM to 11:59 PM | 127 (8.8%) | 72 (5.8%) |
| Total | 1,438 (100.0%) | 1,240 (100.0%) |
Housing Occupancy in Mount Zion
Occupancy by Ownership in Mount Zion
Of the total 2,198 dwellings in Mount Zion, owner-occupied units account for 1,763 (80.2%), while renter-occupied units make up 435 (19.8%).
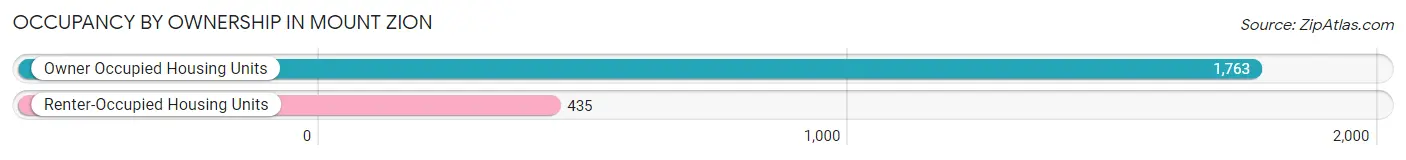
| Occupancy | # Housing Units | % Housing Units |
| Owner Occupied Housing Units | 1,763 | 80.2% |
| Renter-Occupied Housing Units | 435 | 19.8% |
| Total Occupied Housing Units | 2,198 | 100.0% |
Occupancy by Household Size in Mount Zion
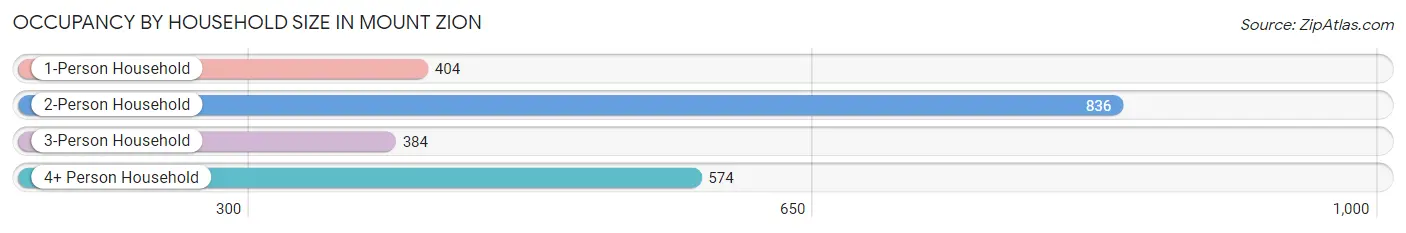
| Household Size | # Housing Units | % Housing Units |
| 1-Person Household | 404 | 18.4% |
| 2-Person Household | 836 | 38.0% |
| 3-Person Household | 384 | 17.5% |
| 4+ Person Household | 574 | 26.1% |
| Total Housing Units | 2,198 | 100.0% |
Occupancy by Ownership by Household Size in Mount Zion
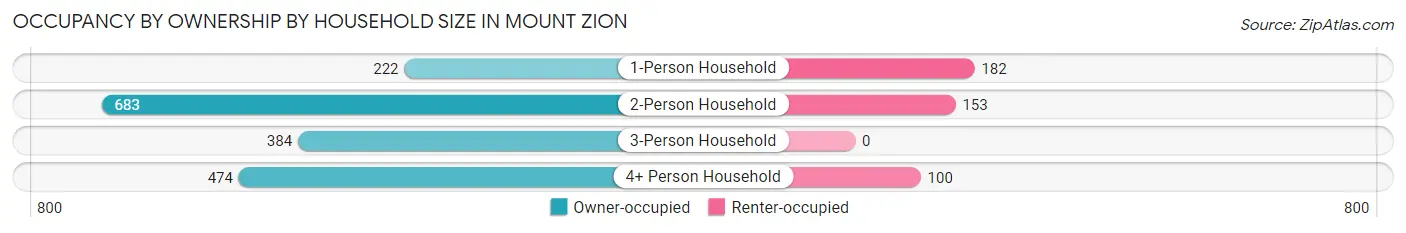
| Household Size | Owner-occupied | Renter-occupied |
| 1-Person Household | 222 (54.9%) | 182 (45.1%) |
| 2-Person Household | 683 (81.7%) | 153 (18.3%) |
| 3-Person Household | 384 (100.0%) | 0 (0.0%) |
| 4+ Person Household | 474 (82.6%) | 100 (17.4%) |
| Total Housing Units | 1,763 (80.2%) | 435 (19.8%) |
Occupancy by Educational Attainment in Mount Zion
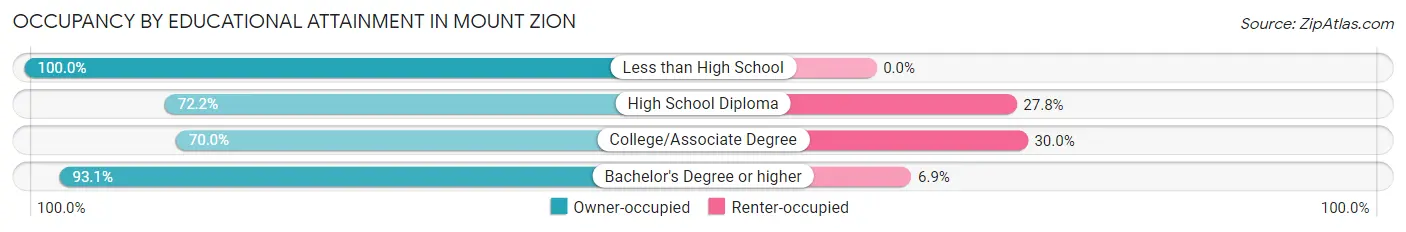
| Household Size | Owner-occupied | Renter-occupied |
| Less than High School | 53 (100.0%) | 0 (0.0%) |
| High School Diploma | 400 (72.2%) | 154 (27.8%) |
| College/Associate Degree | 518 (70.0%) | 222 (30.0%) |
| Bachelor's Degree or higher | 792 (93.1%) | 59 (6.9%) |
Occupancy by Age of Householder in Mount Zion
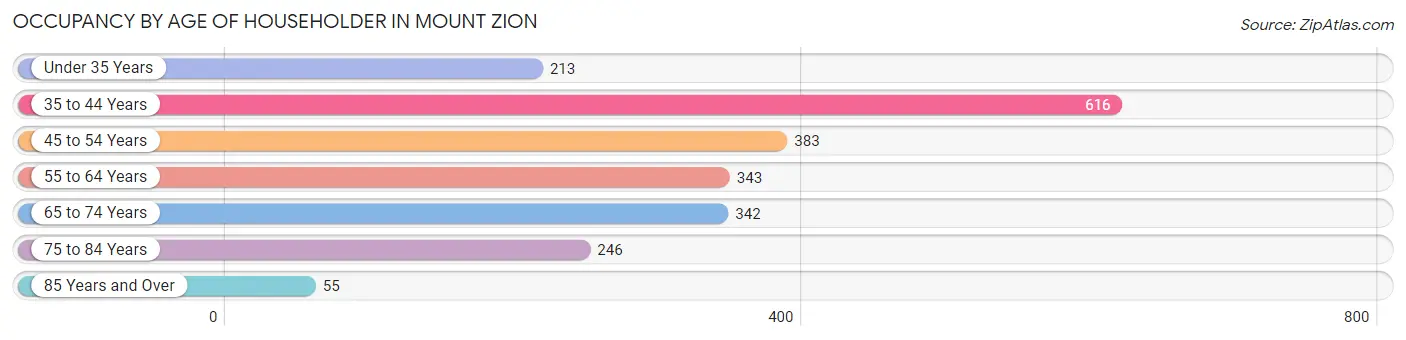
| Age Bracket | # Households | % Households |
| Under 35 Years | 213 | 9.7% |
| 35 to 44 Years | 616 | 28.0% |
| 45 to 54 Years | 383 | 17.4% |
| 55 to 64 Years | 343 | 15.6% |
| 65 to 74 Years | 342 | 15.6% |
| 75 to 84 Years | 246 | 11.2% |
| 85 Years and Over | 55 | 2.5% |
| Total | 2,198 | 100.0% |
Housing Finances in Mount Zion
Median Income by Occupancy in Mount Zion
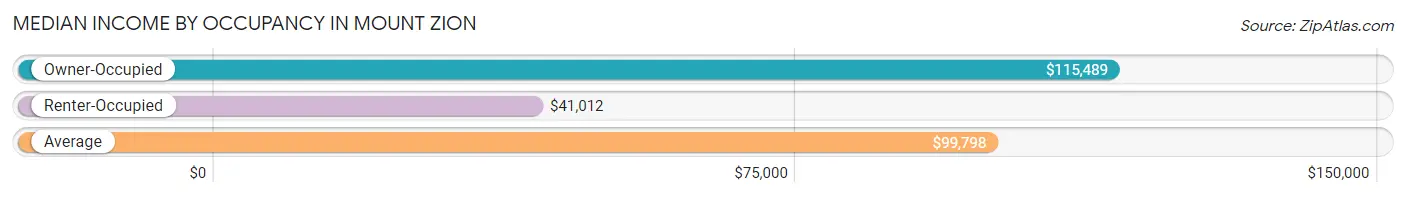
| Occupancy Type | # Households | Median Income |
| Owner-Occupied | 1,763 (80.2%) | $115,489 |
| Renter-Occupied | 435 (19.8%) | $41,012 |
| Average | 2,198 (100.0%) | $99,798 |
Occupancy by Householder Income Bracket in Mount Zion
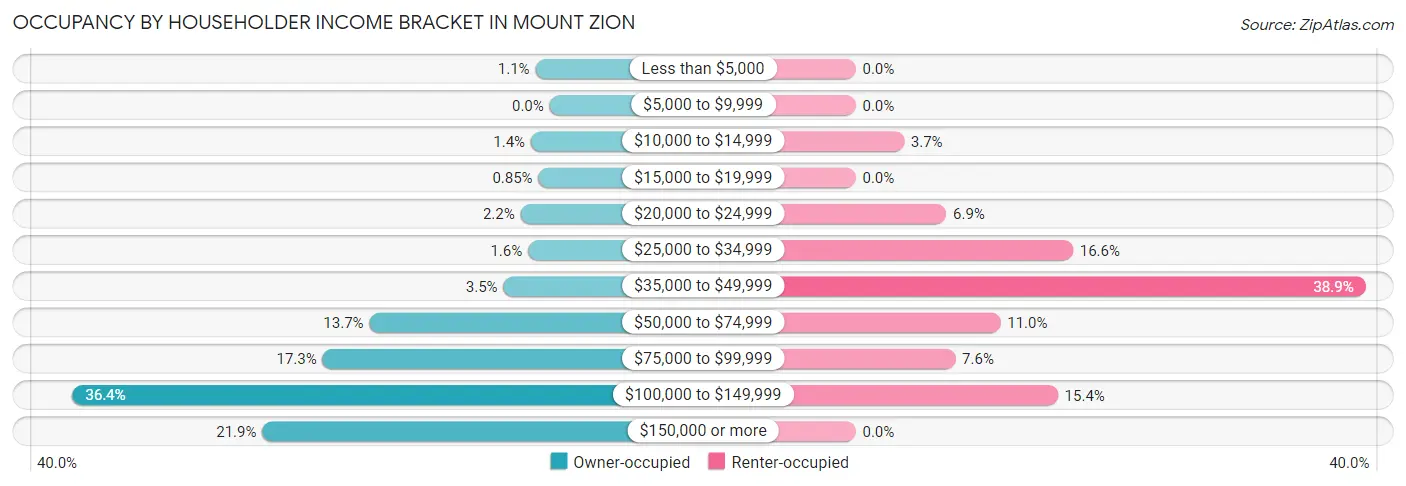
| Income Bracket | Owner-occupied | Renter-occupied |
| Less than $5,000 | 19 (1.1%) | 0 (0.0%) |
| $5,000 to $9,999 | 0 (0.0%) | 0 (0.0%) |
| $10,000 to $14,999 | 25 (1.4%) | 16 (3.7%) |
| $15,000 to $19,999 | 15 (0.9%) | 0 (0.0%) |
| $20,000 to $24,999 | 39 (2.2%) | 30 (6.9%) |
| $25,000 to $34,999 | 29 (1.6%) | 72 (16.6%) |
| $35,000 to $49,999 | 62 (3.5%) | 169 (38.9%) |
| $50,000 to $74,999 | 242 (13.7%) | 48 (11.0%) |
| $75,000 to $99,999 | 305 (17.3%) | 33 (7.6%) |
| $100,000 to $149,999 | 641 (36.4%) | 67 (15.4%) |
| $150,000 or more | 386 (21.9%) | 0 (0.0%) |
| Total | 1,763 (100.0%) | 435 (100.0%) |
Monthly Housing Cost Tiers in Mount Zion
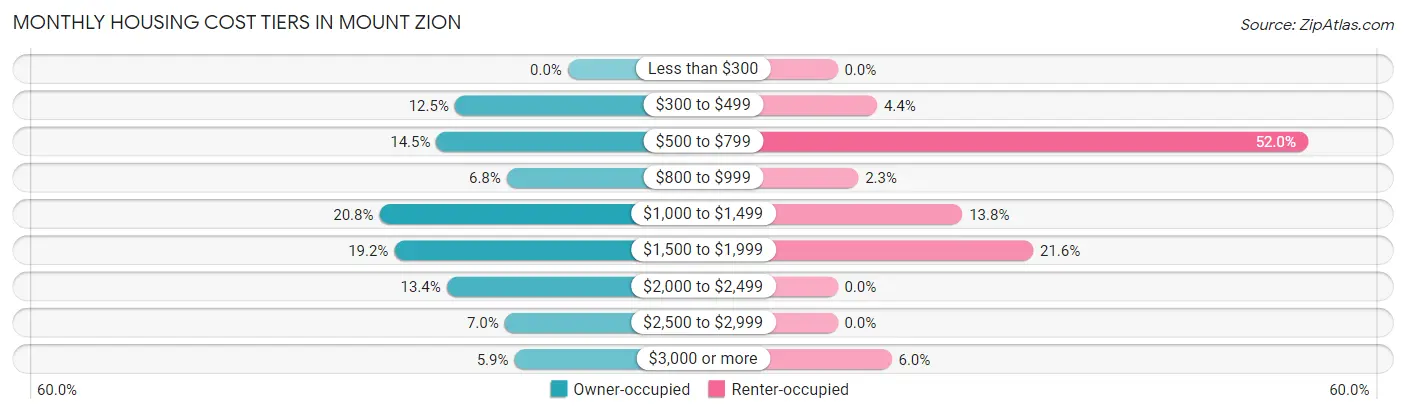
| Monthly Cost | Owner-occupied | Renter-occupied |
| Less than $300 | 0 (0.0%) | 0 (0.0%) |
| $300 to $499 | 220 (12.5%) | 19 (4.4%) |
| $500 to $799 | 256 (14.5%) | 226 (51.9%) |
| $800 to $999 | 119 (6.8%) | 10 (2.3%) |
| $1,000 to $1,499 | 367 (20.8%) | 60 (13.8%) |
| $1,500 to $1,999 | 338 (19.2%) | 94 (21.6%) |
| $2,000 to $2,499 | 236 (13.4%) | 0 (0.0%) |
| $2,500 to $2,999 | 123 (7.0%) | 0 (0.0%) |
| $3,000 or more | 104 (5.9%) | 26 (6.0%) |
| Total | 1,763 (100.0%) | 435 (100.0%) |
Physical Housing Characteristics in Mount Zion
Housing Structures in Mount Zion
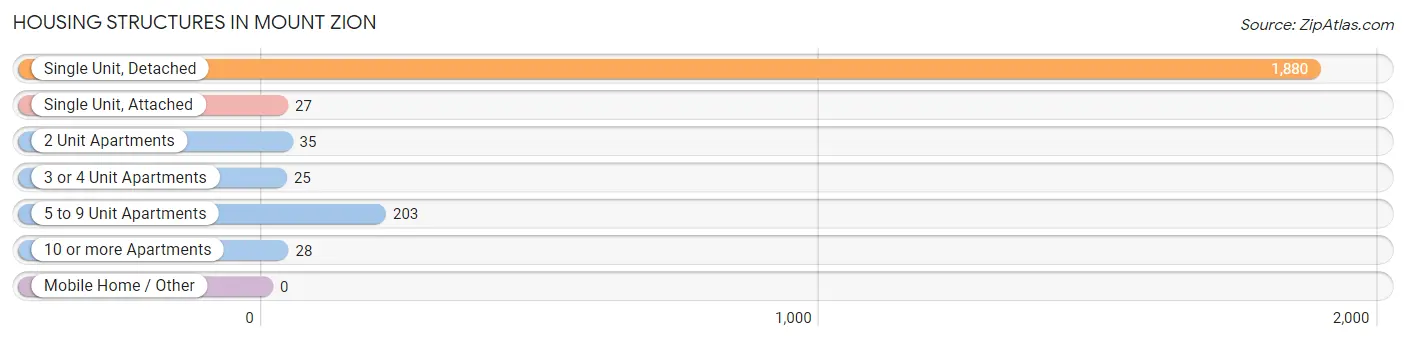
| Structure Type | # Housing Units | % Housing Units |
| Single Unit, Detached | 1,880 | 85.5% |
| Single Unit, Attached | 27 | 1.2% |
| 2 Unit Apartments | 35 | 1.6% |
| 3 or 4 Unit Apartments | 25 | 1.1% |
| 5 to 9 Unit Apartments | 203 | 9.2% |
| 10 or more Apartments | 28 | 1.3% |
| Mobile Home / Other | 0 | 0.0% |
| Total | 2,198 | 100.0% |
Housing Structures by Occupancy in Mount Zion
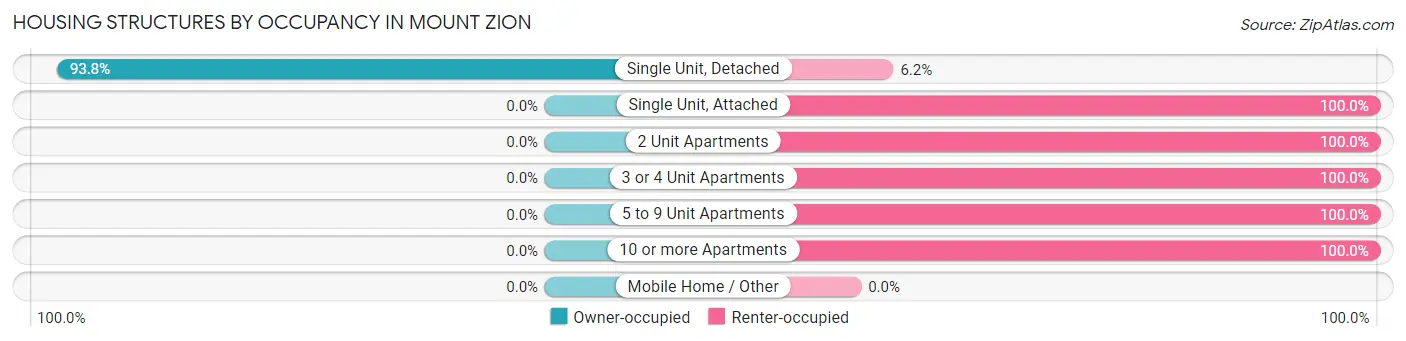
| Structure Type | Owner-occupied | Renter-occupied |
| Single Unit, Detached | 1,763 (93.8%) | 117 (6.2%) |
| Single Unit, Attached | 0 (0.0%) | 27 (100.0%) |
| 2 Unit Apartments | 0 (0.0%) | 35 (100.0%) |
| 3 or 4 Unit Apartments | 0 (0.0%) | 25 (100.0%) |
| 5 to 9 Unit Apartments | 0 (0.0%) | 203 (100.0%) |
| 10 or more Apartments | 0 (0.0%) | 28 (100.0%) |
| Mobile Home / Other | 0 (0.0%) | 0 (0.0%) |
| Total | 1,763 (80.2%) | 435 (19.8%) |
Housing Structures by Number of Rooms in Mount Zion
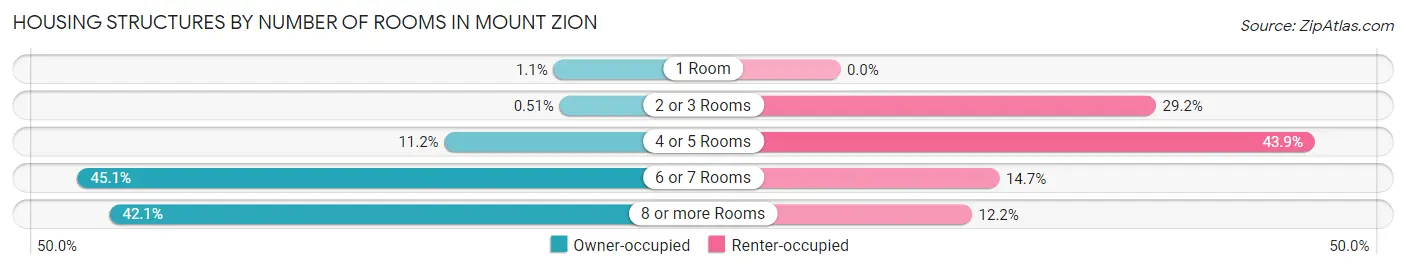
| Number of Rooms | Owner-occupied | Renter-occupied |
| 1 Room | 19 (1.1%) | 0 (0.0%) |
| 2 or 3 Rooms | 9 (0.5%) | 127 (29.2%) |
| 4 or 5 Rooms | 197 (11.2%) | 191 (43.9%) |
| 6 or 7 Rooms | 795 (45.1%) | 64 (14.7%) |
| 8 or more Rooms | 743 (42.1%) | 53 (12.2%) |
| Total | 1,763 (100.0%) | 435 (100.0%) |
Housing Structure by Heating Type in Mount Zion
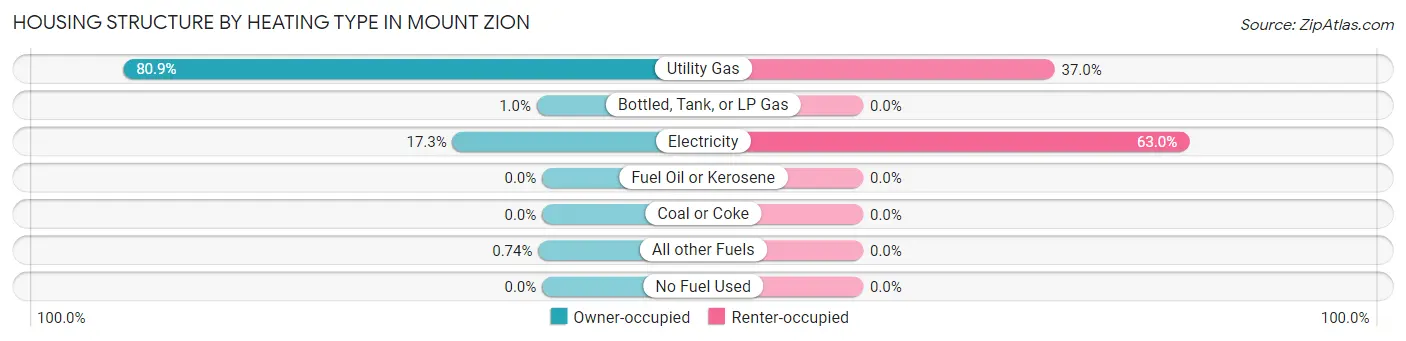
| Heating Type | Owner-occupied | Renter-occupied |
| Utility Gas | 1,427 (80.9%) | 161 (37.0%) |
| Bottled, Tank, or LP Gas | 18 (1.0%) | 0 (0.0%) |
| Electricity | 305 (17.3%) | 274 (63.0%) |
| Fuel Oil or Kerosene | 0 (0.0%) | 0 (0.0%) |
| Coal or Coke | 0 (0.0%) | 0 (0.0%) |
| All other Fuels | 13 (0.7%) | 0 (0.0%) |
| No Fuel Used | 0 (0.0%) | 0 (0.0%) |
| Total | 1,763 (100.0%) | 435 (100.0%) |
Household Vehicle Usage in Mount Zion
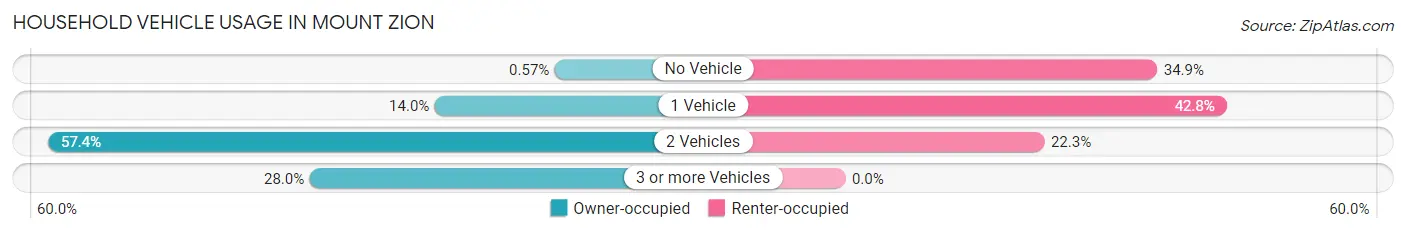
| Vehicles per Household | Owner-occupied | Renter-occupied |
| No Vehicle | 10 (0.6%) | 152 (34.9%) |
| 1 Vehicle | 247 (14.0%) | 186 (42.8%) |
| 2 Vehicles | 1,012 (57.4%) | 97 (22.3%) |
| 3 or more Vehicles | 494 (28.0%) | 0 (0.0%) |
| Total | 1,763 (100.0%) | 435 (100.0%) |
Real Estate & Mortgages in Mount Zion
Real Estate and Mortgage Overview in Mount Zion
| Characteristic | Without Mortgage | With Mortgage |
| Housing Units | 567 | 1,196 |
| Median Property Value | $138,600 | $213,000 |
| Median Household Income | $79,323 | $280 |
| Monthly Housing Costs | $571 | $89 |
| Real Estate Taxes | $3,071 | $19 |
Property Value by Mortgage Status in Mount Zion
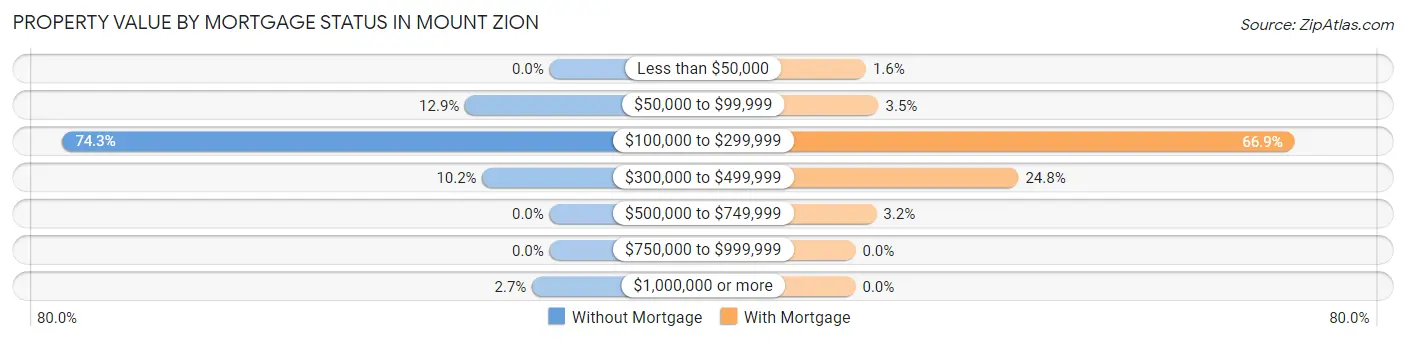
| Property Value | Without Mortgage | With Mortgage |
| Less than $50,000 | 0 (0.0%) | 19 (1.6%) |
| $50,000 to $99,999 | 73 (12.9%) | 42 (3.5%) |
| $100,000 to $299,999 | 421 (74.3%) | 800 (66.9%) |
| $300,000 to $499,999 | 58 (10.2%) | 297 (24.8%) |
| $500,000 to $749,999 | 0 (0.0%) | 38 (3.2%) |
| $750,000 to $999,999 | 0 (0.0%) | 0 (0.0%) |
| $1,000,000 or more | 15 (2.6%) | 0 (0.0%) |
| Total | 567 (100.0%) | 1,196 (100.0%) |
Household Income by Mortgage Status in Mount Zion
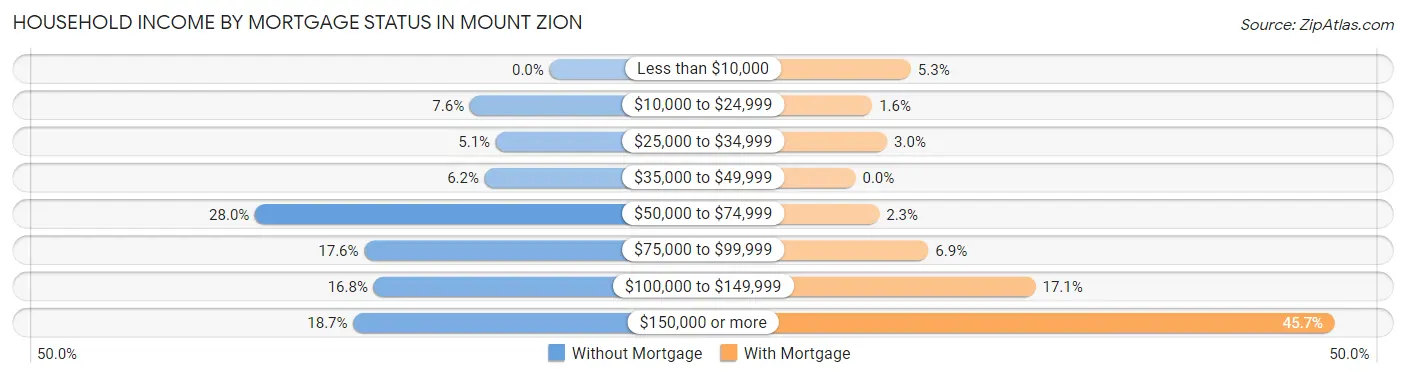
| Household Income | Without Mortgage | With Mortgage |
| Less than $10,000 | 0 (0.0%) | 63 (5.3%) |
| $10,000 to $24,999 | 43 (7.6%) | 19 (1.6%) |
| $25,000 to $34,999 | 29 (5.1%) | 36 (3.0%) |
| $35,000 to $49,999 | 35 (6.2%) | 0 (0.0%) |
| $50,000 to $74,999 | 159 (28.0%) | 27 (2.3%) |
| $75,000 to $99,999 | 100 (17.6%) | 83 (6.9%) |
| $100,000 to $149,999 | 95 (16.8%) | 205 (17.1%) |
| $150,000 or more | 106 (18.7%) | 546 (45.7%) |
| Total | 567 (100.0%) | 1,196 (100.0%) |
Property Value to Household Income Ratio in Mount Zion
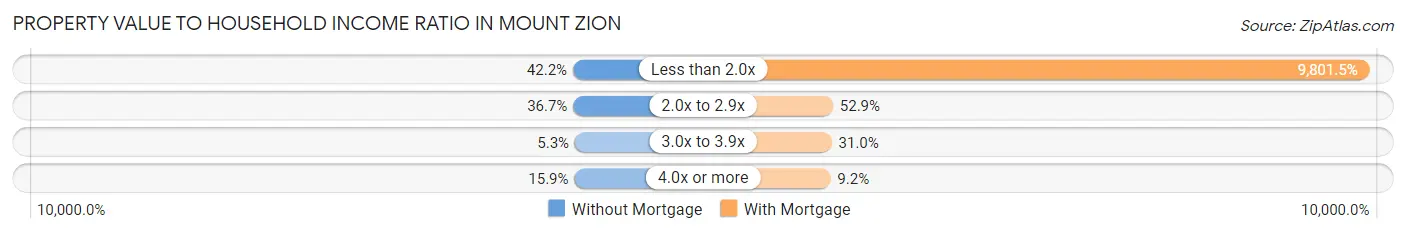
| Value-to-Income Ratio | Without Mortgage | With Mortgage |
| Less than 2.0x | 239 (42.1%) | 117,226 (9,801.5%) |
| 2.0x to 2.9x | 208 (36.7%) | 633 (52.9%) |
| 3.0x to 3.9x | 30 (5.3%) | 371 (31.0%) |
| 4.0x or more | 90 (15.9%) | 110 (9.2%) |
| Total | 567 (100.0%) | 1,196 (100.0%) |
Real Estate Taxes by Mortgage Status in Mount Zion
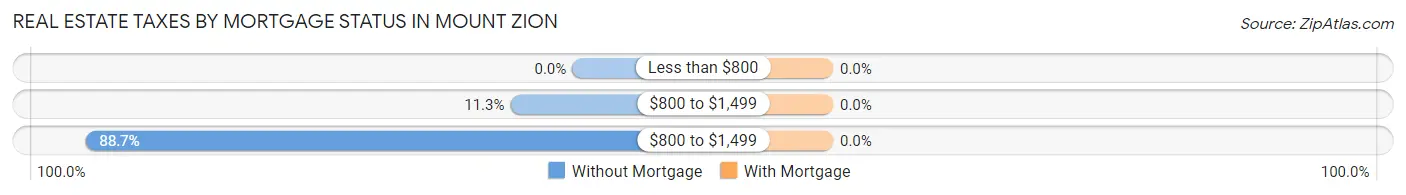
| Property Taxes | Without Mortgage | With Mortgage |
| Less than $800 | 0 (0.0%) | 0 (0.0%) |
| $800 to $1,499 | 64 (11.3%) | 0 (0.0%) |
| $800 to $1,499 | 503 (88.7%) | 0 (0.0%) |
| Total | 567 (100.0%) | 1,196 (100.0%) |
Health & Disability in Mount Zion
Health Insurance Coverage by Age in Mount Zion
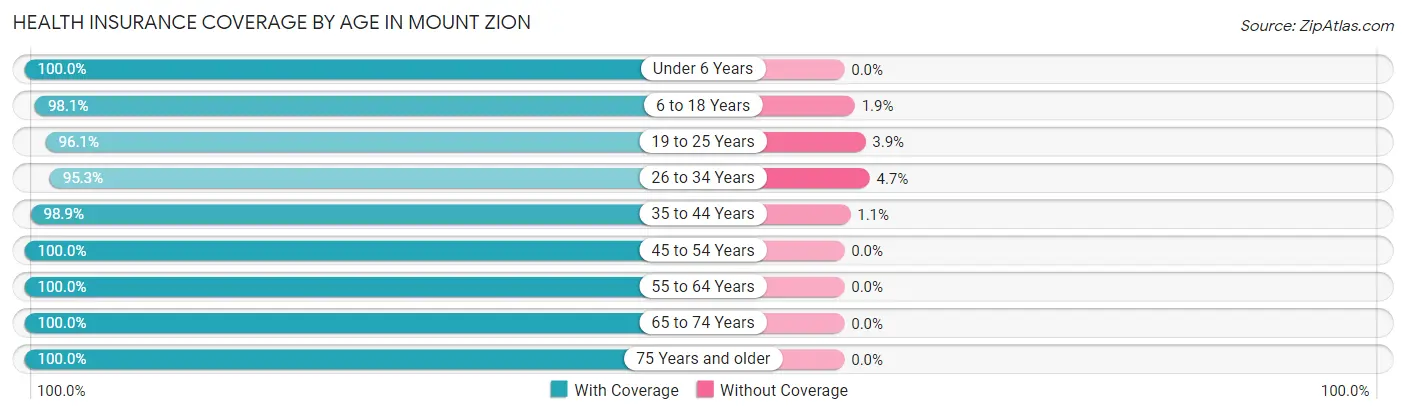
| Age Bracket | With Coverage | Without Coverage |
| Under 6 Years | 318 (100.0%) | 0 (0.0%) |
| 6 to 18 Years | 1,617 (98.1%) | 32 (1.9%) |
| 19 to 25 Years | 368 (96.1%) | 15 (3.9%) |
| 26 to 34 Years | 324 (95.3%) | 16 (4.7%) |
| 35 to 44 Years | 1,057 (98.9%) | 12 (1.1%) |
| 45 to 54 Years | 698 (100.0%) | 0 (0.0%) |
| 55 to 64 Years | 658 (100.0%) | 0 (0.0%) |
| 65 to 74 Years | 668 (100.0%) | 0 (0.0%) |
| 75 Years and older | 400 (100.0%) | 0 (0.0%) |
| Total | 6,108 (98.8%) | 75 (1.2%) |
Health Insurance Coverage by Citizenship Status in Mount Zion
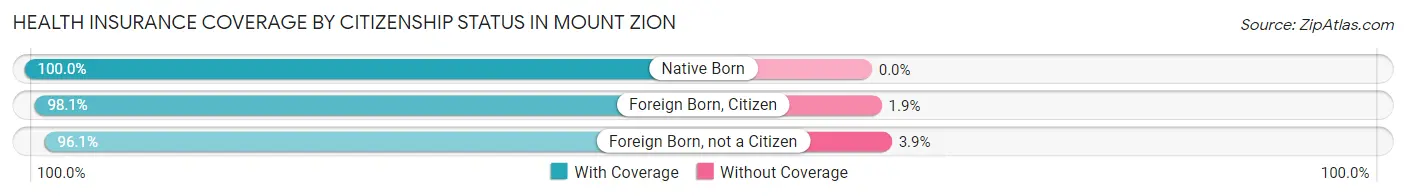
| Citizenship Status | With Coverage | Without Coverage |
| Native Born | 318 (100.0%) | 0 (0.0%) |
| Foreign Born, Citizen | 1,617 (98.1%) | 32 (1.9%) |
| Foreign Born, not a Citizen | 368 (96.1%) | 15 (3.9%) |
Health Insurance Coverage by Household Income in Mount Zion
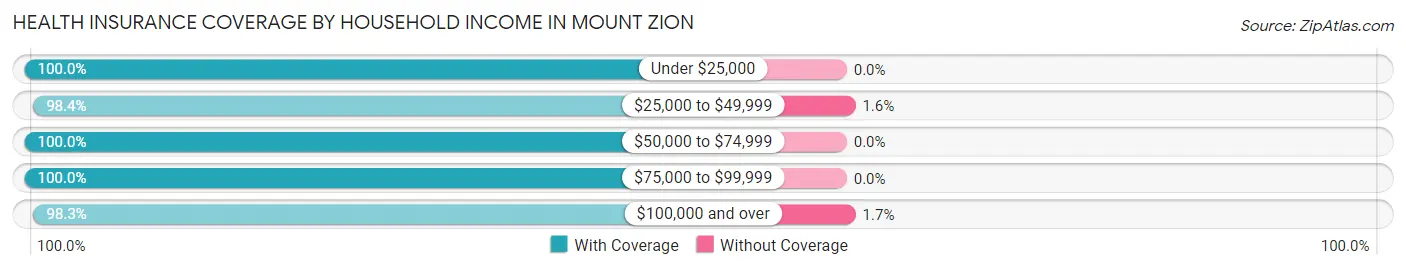
| Household Income | With Coverage | Without Coverage |
| Under $25,000 | 254 (100.0%) | 0 (0.0%) |
| $25,000 to $49,999 | 909 (98.4%) | 15 (1.6%) |
| $50,000 to $74,999 | 585 (100.0%) | 0 (0.0%) |
| $75,000 to $99,999 | 810 (100.0%) | 0 (0.0%) |
| $100,000 and over | 3,549 (98.3%) | 60 (1.7%) |
Public vs Private Health Insurance Coverage by Age in Mount Zion
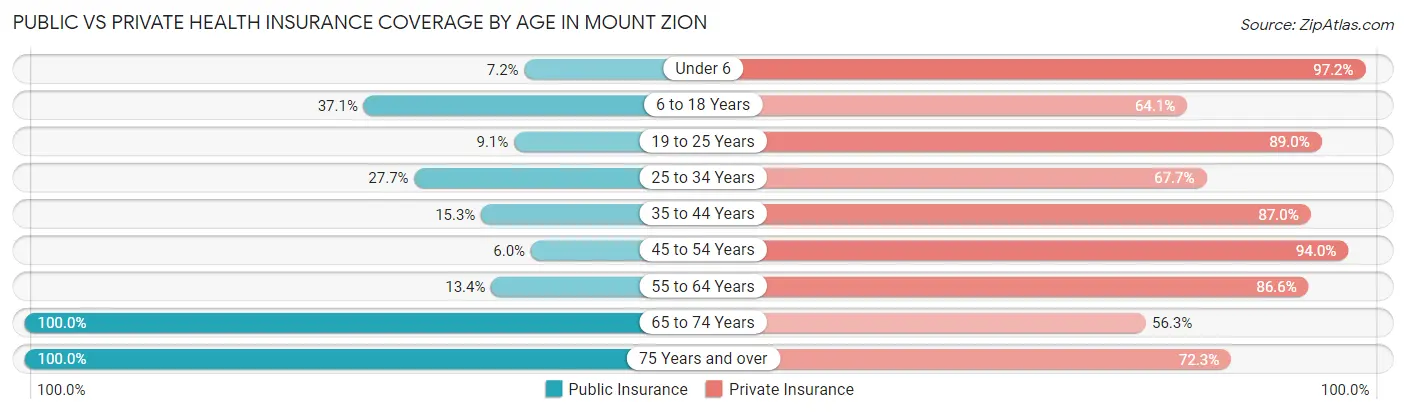
| Age Bracket | Public Insurance | Private Insurance |
| Under 6 | 23 (7.2%) | 309 (97.2%) |
| 6 to 18 Years | 611 (37.0%) | 1,057 (64.1%) |
| 19 to 25 Years | 35 (9.1%) | 341 (89.0%) |
| 25 to 34 Years | 94 (27.7%) | 230 (67.6%) |
| 35 to 44 Years | 163 (15.2%) | 930 (87.0%) |
| 45 to 54 Years | 42 (6.0%) | 656 (94.0%) |
| 55 to 64 Years | 88 (13.4%) | 570 (86.6%) |
| 65 to 74 Years | 668 (100.0%) | 376 (56.3%) |
| 75 Years and over | 400 (100.0%) | 289 (72.3%) |
| Total | 2,124 (34.4%) | 4,758 (76.9%) |
Disability Status by Sex by Age in Mount Zion
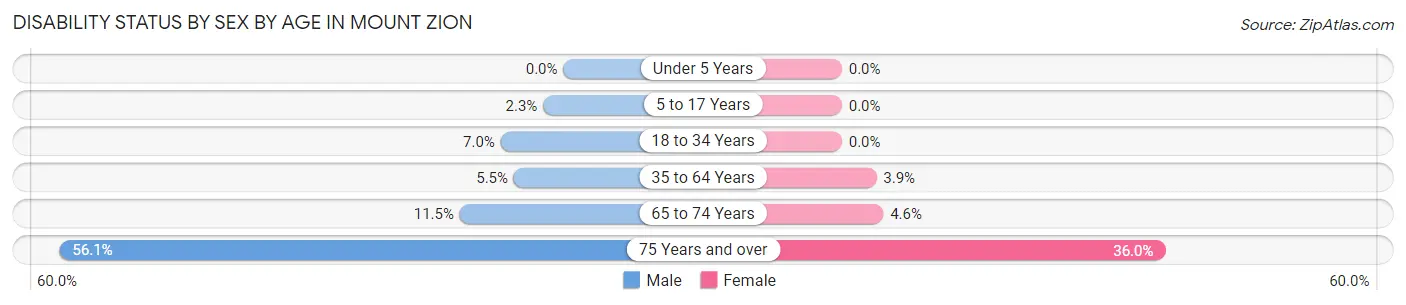
| Age Bracket | Male | Female |
| Under 5 Years | 0 (0.0%) | 0 (0.0%) |
| 5 to 17 Years | 16 (2.2%) | 0 (0.0%) |
| 18 to 34 Years | 27 (7.0%) | 0 (0.0%) |
| 35 to 64 Years | 65 (5.5%) | 48 (3.8%) |
| 65 to 74 Years | 37 (11.5%) | 16 (4.6%) |
| 75 Years and over | 78 (56.1%) | 94 (36.0%) |
Disability Class by Sex by Age in Mount Zion
Disability Class: Hearing Difficulty
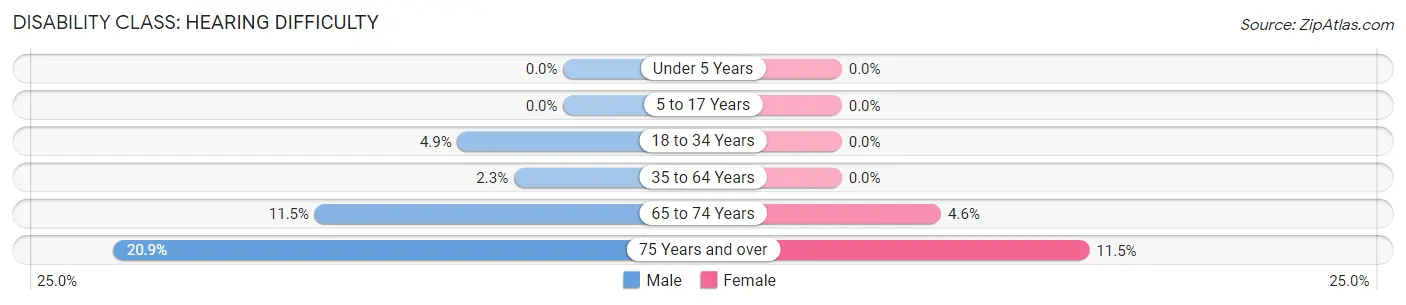
| Age Bracket | Male | Female |
| Under 5 Years | 0 (0.0%) | 0 (0.0%) |
| 5 to 17 Years | 0 (0.0%) | 0 (0.0%) |
| 18 to 34 Years | 19 (4.9%) | 0 (0.0%) |
| 35 to 64 Years | 27 (2.3%) | 0 (0.0%) |
| 65 to 74 Years | 37 (11.5%) | 16 (4.6%) |
| 75 Years and over | 29 (20.9%) | 30 (11.5%) |
Disability Class: Vision Difficulty
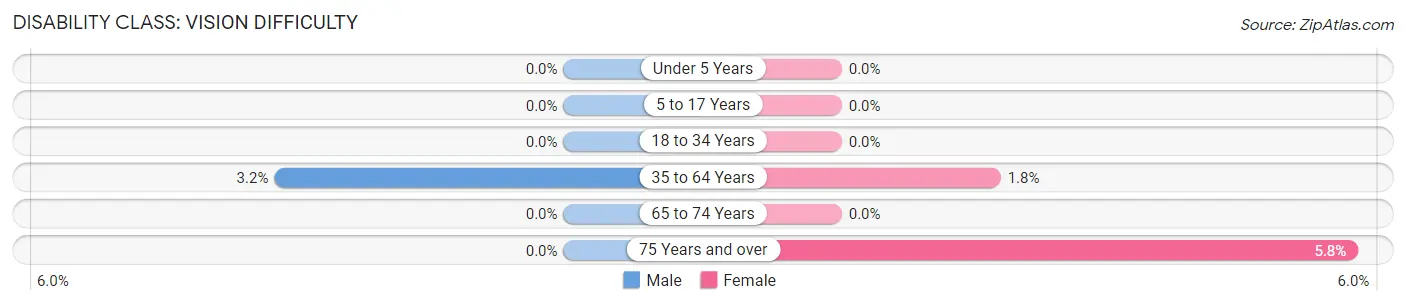
| Age Bracket | Male | Female |
| Under 5 Years | 0 (0.0%) | 0 (0.0%) |
| 5 to 17 Years | 0 (0.0%) | 0 (0.0%) |
| 18 to 34 Years | 0 (0.0%) | 0 (0.0%) |
| 35 to 64 Years | 38 (3.2%) | 22 (1.8%) |
| 65 to 74 Years | 0 (0.0%) | 0 (0.0%) |
| 75 Years and over | 0 (0.0%) | 15 (5.8%) |
Disability Class: Cognitive Difficulty
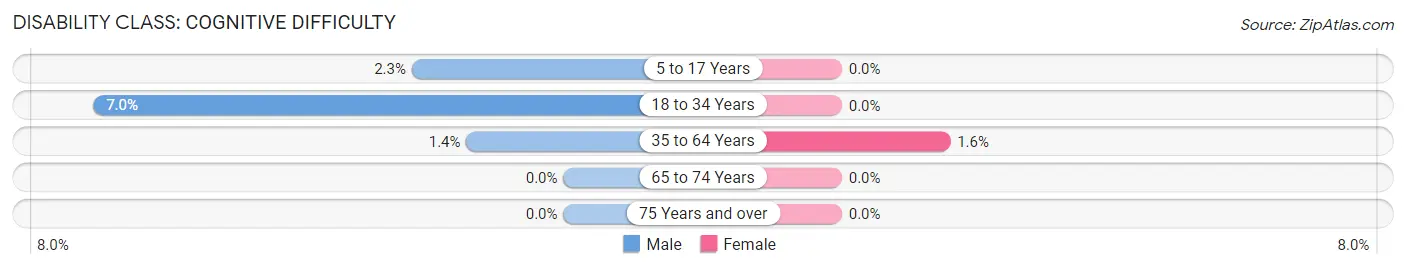
| Age Bracket | Male | Female |
| 5 to 17 Years | 16 (2.2%) | 0 (0.0%) |
| 18 to 34 Years | 27 (7.0%) | 0 (0.0%) |
| 35 to 64 Years | 17 (1.4%) | 20 (1.6%) |
| 65 to 74 Years | 0 (0.0%) | 0 (0.0%) |
| 75 Years and over | 0 (0.0%) | 0 (0.0%) |
Disability Class: Ambulatory Difficulty
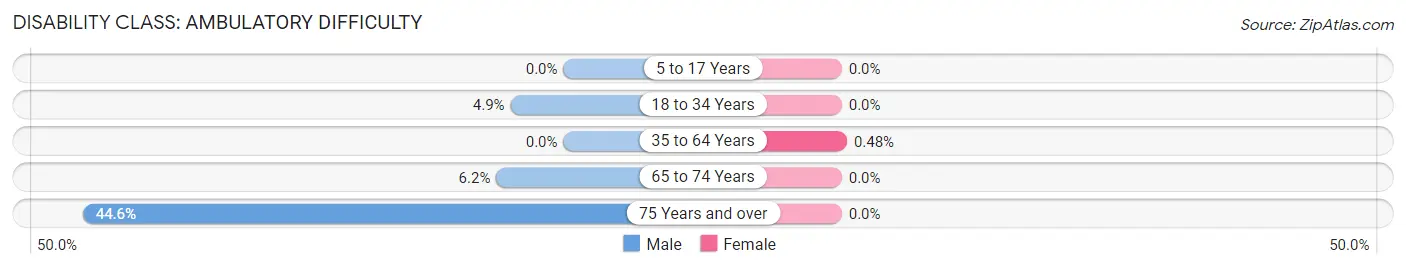
| Age Bracket | Male | Female |
| 5 to 17 Years | 0 (0.0%) | 0 (0.0%) |
| 18 to 34 Years | 19 (4.9%) | 0 (0.0%) |
| 35 to 64 Years | 0 (0.0%) | 6 (0.5%) |
| 65 to 74 Years | 20 (6.2%) | 0 (0.0%) |
| 75 Years and over | 62 (44.6%) | 0 (0.0%) |
Disability Class: Self-Care Difficulty
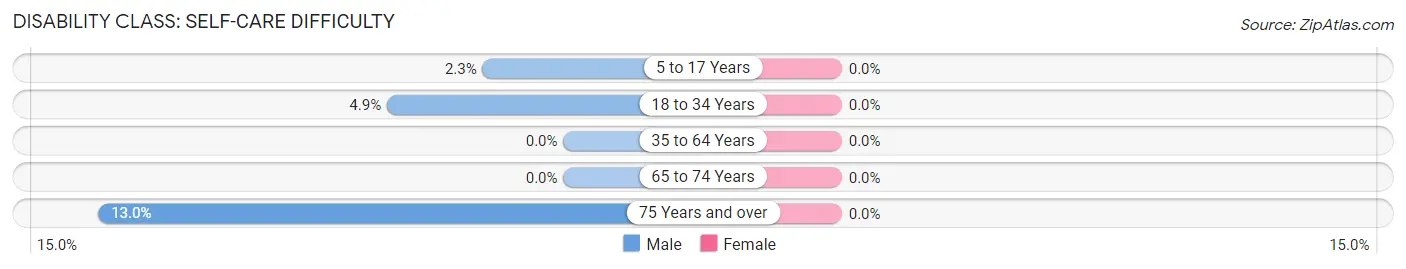
| Age Bracket | Male | Female |
| 5 to 17 Years | 16 (2.2%) | 0 (0.0%) |
| 18 to 34 Years | 19 (4.9%) | 0 (0.0%) |
| 35 to 64 Years | 0 (0.0%) | 0 (0.0%) |
| 65 to 74 Years | 0 (0.0%) | 0 (0.0%) |
| 75 Years and over | 18 (13.0%) | 0 (0.0%) |
Technology Access in Mount Zion
Computing Device Access in Mount Zion
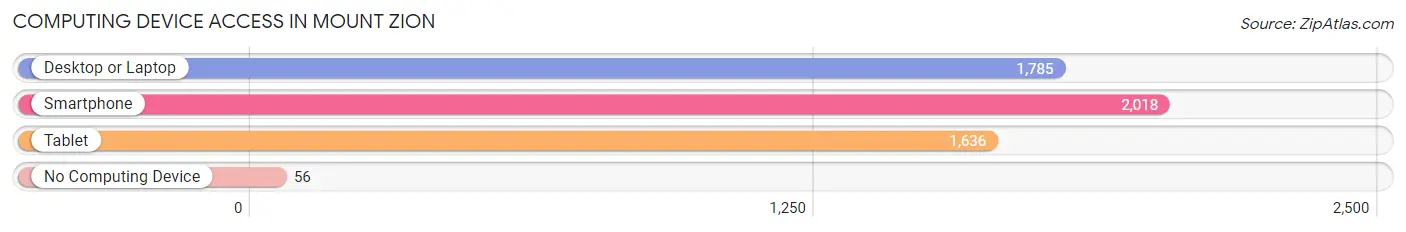
| Device Type | # Households | % Households |
| Desktop or Laptop | 1,785 | 81.2% |
| Smartphone | 2,018 | 91.8% |
| Tablet | 1,636 | 74.4% |
| No Computing Device | 56 | 2.5% |
| Total | 2,198 | 100.0% |
Internet Access in Mount Zion
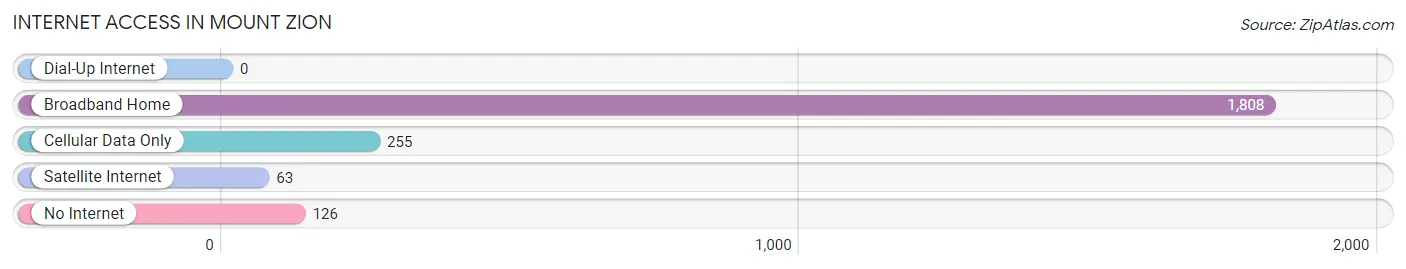
| Internet Type | # Households | % Households |
| Dial-Up Internet | 0 | 0.0% |
| Broadband Home | 1,808 | 82.3% |
| Cellular Data Only | 255 | 11.6% |
| Satellite Internet | 63 | 2.9% |
| No Internet | 126 | 5.7% |
| Total | 2,198 | 100.0% |
Mount Zion Summary
Mt. Zion is a small village located in Macon County, Illinois. It is situated in the center of the state, about 25 miles south of Decatur and about 40 miles northeast of Springfield. The village has a population of about 4,000 people and is part of the Decatur Metropolitan Statistical Area.
History
Mt. Zion was founded in 1837 by a group of settlers from North Carolina. The village was named after the nearby Mt. Zion Church, which was built in 1836. The village was incorporated in 1867 and has remained a small, rural community ever since.
The village was an important stop on the Illinois Central Railroad, which ran through the area in the late 19th century. The railroad brought new settlers to the area and helped to spur economic growth. The village also had a thriving agricultural industry, with many farmers growing corn, wheat, and other crops.
In the early 20th century, the village began to experience a decline in population as people moved away to larger cities. However, the village has seen a resurgence in recent years, with new businesses and housing developments being built.
Geography
Mt. Zion is located in the center of Macon County, Illinois. It is situated on the banks of the Sangamon River, which flows through the village. The village is surrounded by rolling hills and farmland, with the nearest major city being Decatur, which is about 25 miles away.
The village has a total area of 1.3 square miles, all of which is land. The village has a humid continental climate, with hot, humid summers and cold, snowy winters.
Economy
Mt. Zion has a small, but diverse economy. The village is home to several small businesses, including a grocery store, a hardware store, and a few restaurants. The village also has a few manufacturing companies, including a plastics factory and a metal fabrication plant.
The village is also home to a few large employers, including a hospital and a nursing home. The village also has a few retail stores, including a Walmart Supercenter.
Demographics
As of the 2010 census, the village had a population of 4,000 people. The population is mostly white (94.2%), with small percentages of African Americans (2.2%), Asians (1.2%), and Hispanics (1.4%). The median household income is $45,000, and the median home value is $125,000.
The village has a low crime rate and a high rate of homeownership. The village also has a high rate of educational attainment, with over 90% of adults having at least a high school diploma.
Conclusion
Mt. Zion is a small village located in Macon County, Illinois. It was founded in 1837 and has remained a small, rural community ever since. The village has a diverse economy and a low crime rate. The population is mostly white, with small percentages of African Americans, Asians, and Hispanics. The village has a high rate of educational attainment and a high rate of homeownership.
Common Questions
What is Per Capita Income in Mount Zion?
Per Capita income in Mount Zion is $39,546.
What is the Median Family Income in Mount Zion?
Median Family Income in Mount Zion is $114,938.
What is the Median Household income in Mount Zion?
Median Household Income in Mount Zion is $99,798.
What is Income or Wage Gap in Mount Zion?
Income or Wage Gap in Mount Zion is 20.5%.
Women in Mount Zion earn 79.5 cents for every dollar earned by a man.
What is Inequality or Gini Index in Mount Zion?
Inequality or Gini Index in Mount Zion is 0.36.
What is the Total Population of Mount Zion?
Total Population of Mount Zion is 6,255.
What is the Total Male Population of Mount Zion?
Total Male Population of Mount Zion is 2,916.
What is the Total Female Population of Mount Zion?
Total Female Population of Mount Zion is 3,339.
What is the Ratio of Males per 100 Females in Mount Zion?
There are 87.33 Males per 100 Females in Mount Zion.
What is the Ratio of Females per 100 Males in Mount Zion?
There are 114.51 Females per 100 Males in Mount Zion.
What is the Median Population Age in Mount Zion?
Median Population Age in Mount Zion is 39.8 Years.
What is the Average Family Size in Mount Zion
Average Family Size in Mount Zion is 3.2 People.
What is the Average Household Size in Mount Zion
Average Household Size in Mount Zion is 2.8 People.
How Large is the Labor Force in Mount Zion?
There are 2,945 People in the Labor Forcein in Mount Zion.
What is the Percentage of People in the Labor Force in Mount Zion?
66.8% of People are in the Labor Force in Mount Zion.
What is the Unemployment Rate in Mount Zion?
Unemployment Rate in Mount Zion is 4.0%.