Pawnee, IL Map & Demographics
Pawnee Map
Pawnee Overview
$36,112
PER CAPITA INCOME
$90,000
AVG FAMILY INCOME
$75,602
AVG HOUSEHOLD INCOME
14.9%
WAGE / INCOME GAP [ % ]
85.1¢/ $1
WAGE / INCOME GAP [ $ ]
$10,336
FAMILY INCOME DEFICIT
0.39
INEQUALITY / GINI INDEX
2,626
TOTAL POPULATION
1,309
MALE POPULATION
1,317
FEMALE POPULATION
99.39
MALES / 100 FEMALES
100.61
FEMALES / 100 MALES
40.0
MEDIAN AGE
2.8
AVG FAMILY SIZE
2.4
AVG HOUSEHOLD SIZE
1,349
LABOR FORCE [ PEOPLE ]
63.3%
PERCENT IN LABOR FORCE
3.2%
UNEMPLOYMENT RATE
Pawnee Zip Codes
Pawnee Area Codes
Income in Pawnee
Income Overview in Pawnee
Per Capita Income in Pawnee is $36,112, while median incomes of families and households are $90,000 and $75,602 respectively.
| Characteristic | Number | Measure |
| Per Capita Income | 2,626 | $36,112 |
| Median Family Income | 770 | $90,000 |
| Mean Family Income | 770 | $97,145 |
| Median Household Income | 1,115 | $75,602 |
| Mean Household Income | 1,115 | $84,795 |
| Income Deficit | 770 | $10,336 |
| Wage / Income Gap (%) | 2,626 | 14.87% |
| Wage / Income Gap ($) | 2,626 | 85.13¢ per $1 |
| Gini / Inequality Index | 2,626 | 0.39 |
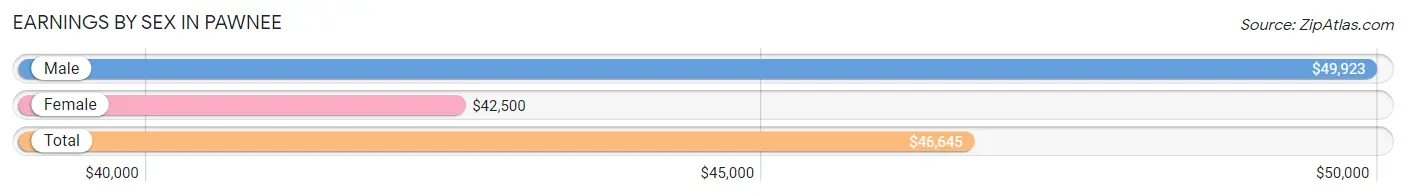
Earnings by Sex in Pawnee
Average Earnings in Pawnee are $46,645, $49,923 for men and $42,500 for women, a difference of 14.9%.
| Sex | Number | Average Earnings |
| Male | 703 (51.2%) | $49,923 |
| Female | 670 (48.8%) | $42,500 |
| Total | 1,373 (100.0%) | $46,645 |
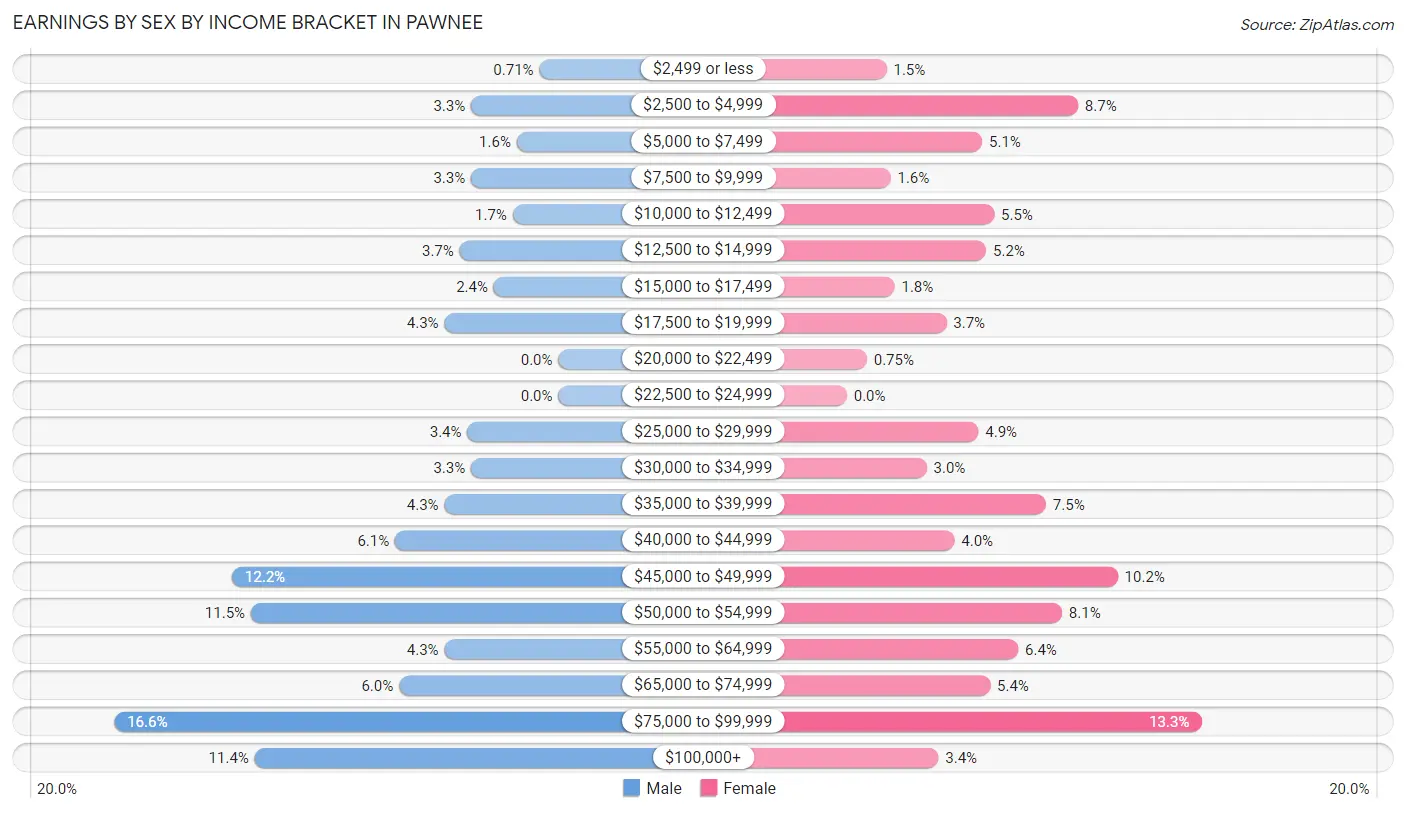
Earnings by Sex by Income Bracket in Pawnee
The most common earnings brackets in Pawnee are $75,000 to $99,999 for men (117 | 16.6%) and $75,000 to $99,999 for women (89 | 13.3%).
| Income | Male | Female |
| $2,499 or less | 5 (0.7%) | 10 (1.5%) |
| $2,500 to $4,999 | 23 (3.3%) | 58 (8.7%) |
| $5,000 to $7,499 | 11 (1.6%) | 34 (5.1%) |
| $7,500 to $9,999 | 23 (3.3%) | 11 (1.6%) |
| $10,000 to $12,499 | 12 (1.7%) | 37 (5.5%) |
| $12,500 to $14,999 | 26 (3.7%) | 35 (5.2%) |
| $15,000 to $17,499 | 17 (2.4%) | 12 (1.8%) |
| $17,500 to $19,999 | 30 (4.3%) | 25 (3.7%) |
| $20,000 to $22,499 | 0 (0.0%) | 5 (0.7%) |
| $22,500 to $24,999 | 0 (0.0%) | 0 (0.0%) |
| $25,000 to $29,999 | 24 (3.4%) | 33 (4.9%) |
| $30,000 to $34,999 | 23 (3.3%) | 20 (3.0%) |
| $35,000 to $39,999 | 30 (4.3%) | 50 (7.5%) |
| $40,000 to $44,999 | 43 (6.1%) | 27 (4.0%) |
| $45,000 to $49,999 | 86 (12.2%) | 68 (10.2%) |
| $50,000 to $54,999 | 81 (11.5%) | 54 (8.1%) |
| $55,000 to $64,999 | 30 (4.3%) | 43 (6.4%) |
| $65,000 to $74,999 | 42 (6.0%) | 36 (5.4%) |
| $75,000 to $99,999 | 117 (16.6%) | 89 (13.3%) |
| $100,000+ | 80 (11.4%) | 23 (3.4%) |
| Total | 703 (100.0%) | 670 (100.0%) |
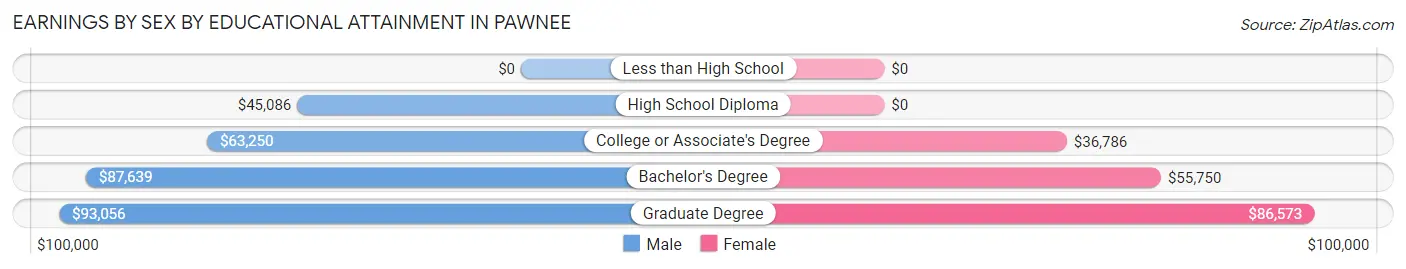
Earnings by Sex by Educational Attainment in Pawnee
Average earnings in Pawnee are $54,437 for men and $46,111 for women, a difference of 15.3%. Men with an educational attainment of graduate degree enjoy the highest average annual earnings of $93,056, while those with high school diploma education earn the least with $45,086. Women with an educational attainment of graduate degree earn the most with the average annual earnings of $86,573, while those with college or associate's degree education have the smallest earnings of $36,786.
| Educational Attainment | Male Income | Female Income |
| Less than High School | - | - |
| High School Diploma | $45,086 | $0 |
| College or Associate's Degree | $63,250 | $36,786 |
| Bachelor's Degree | $87,639 | $55,750 |
| Graduate Degree | $93,056 | $86,573 |
| Total | $54,437 | $46,111 |
Family Income in Pawnee
Family Income Brackets in Pawnee
According to the Pawnee family income data, there are 188 families falling into the $100,000 to $149,999 income range, which is the most common income bracket and makes up 24.4% of all families. Conversely, the $25,000 to $34,999 income bracket is the least frequent group with only 15 families (1.9%) belonging to this category.
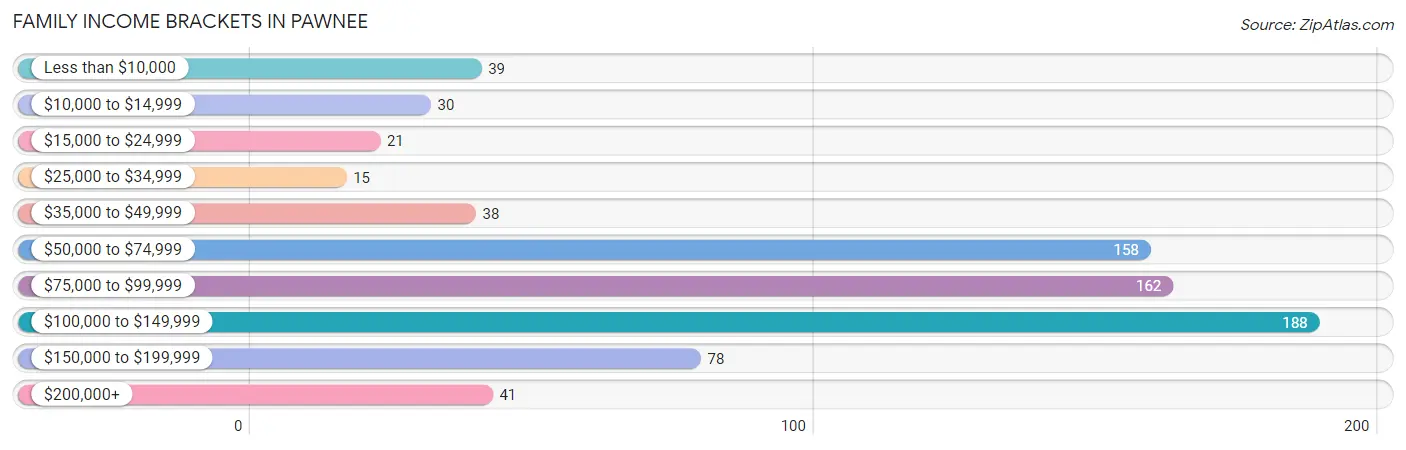
| Income Bracket | # Families | % Families |
| Less than $10,000 | 39 | 5.1% |
| $10,000 to $14,999 | 30 | 3.9% |
| $15,000 to $24,999 | 21 | 2.7% |
| $25,000 to $34,999 | 15 | 1.9% |
| $35,000 to $49,999 | 38 | 4.9% |
| $50,000 to $74,999 | 158 | 20.5% |
| $75,000 to $99,999 | 162 | 21.0% |
| $100,000 to $149,999 | 188 | 24.4% |
| $150,000 to $199,999 | 78 | 10.1% |
| $200,000+ | 41 | 5.3% |
Family Income by Famaliy Size in Pawnee
5-person families (63 | 8.2%) account for the highest median family income in Pawnee with $122,212 per family, while 2-person families (462 | 60.0%) have the highest median income of $39,125 per family member.
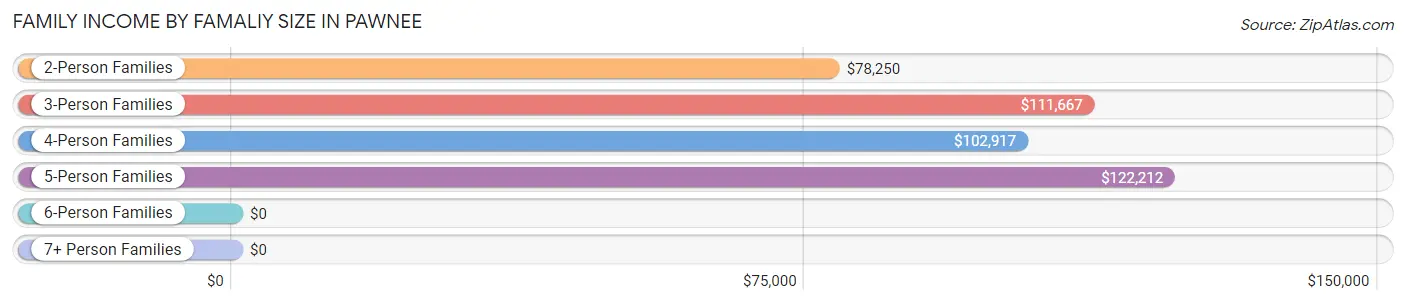
| Income Bracket | # Families | Median Income |
| 2-Person Families | 462 (60.0%) | $78,250 |
| 3-Person Families | 108 (14.0%) | $111,667 |
| 4-Person Families | 126 (16.4%) | $102,917 |
| 5-Person Families | 63 (8.2%) | $122,212 |
| 6-Person Families | 7 (0.9%) | $0 |
| 7+ Person Families | 4 (0.5%) | $0 |
| Total | 770 (100.0%) | $90,000 |
Family Income by Number of Earners in Pawnee
The median family income in Pawnee is $90,000, with families comprising 3+ earners (84) having the highest median family income of $163,167, while families with 1 earner (245) have the lowest median family income of $67,813, accounting for 10.9% and 31.8% of families, respectively.
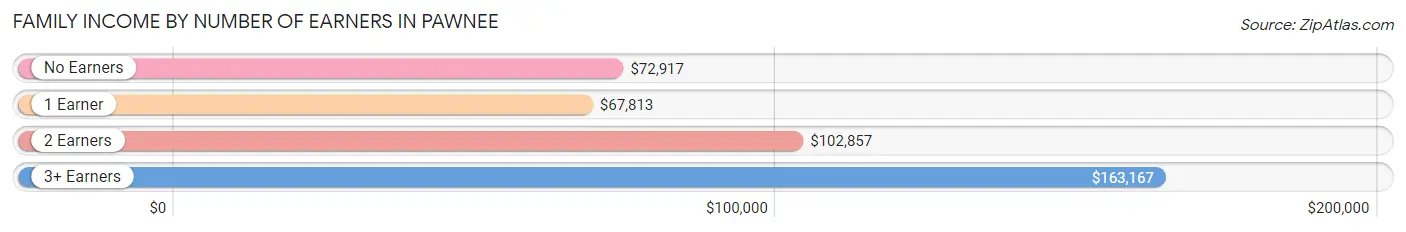
| Number of Earners | # Families | Median Income |
| No Earners | 151 (19.6%) | $72,917 |
| 1 Earner | 245 (31.8%) | $67,813 |
| 2 Earners | 290 (37.7%) | $102,857 |
| 3+ Earners | 84 (10.9%) | $163,167 |
| Total | 770 (100.0%) | $90,000 |
Household Income in Pawnee
Household Income Brackets in Pawnee
With 220 households falling in the category, the $75,000 to $99,999 income range is the most frequent in Pawnee, accounting for 19.7% of all households. In contrast, only 35 households (3.1%) fall into the $10,000 to $14,999 income bracket, making it the least populous group.
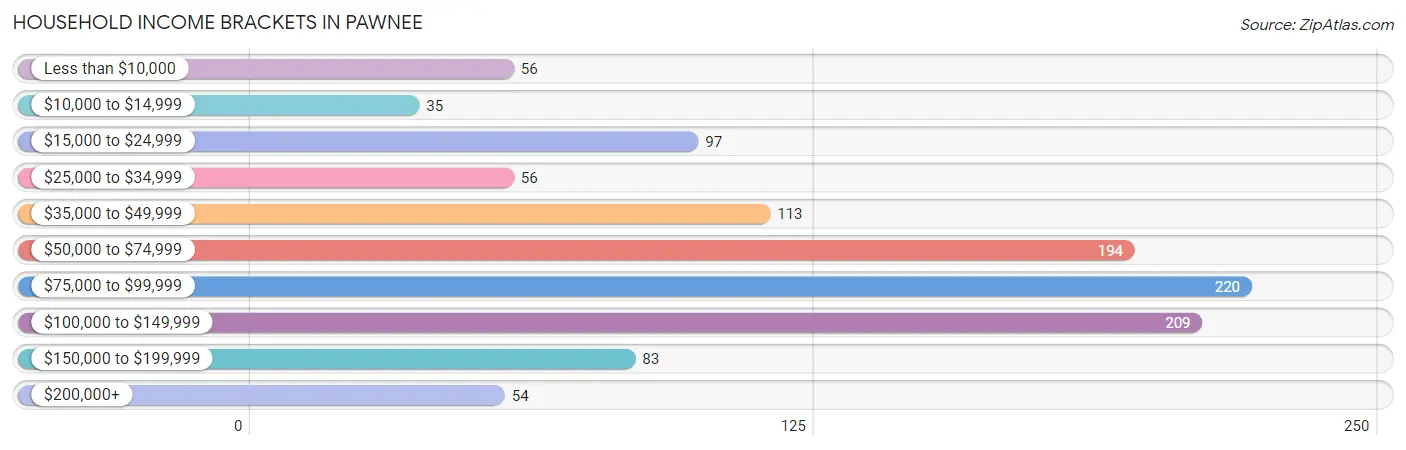
| Income Bracket | # Households | % Households |
| Less than $10,000 | 56 | 5.0% |
| $10,000 to $14,999 | 35 | 3.1% |
| $15,000 to $24,999 | 97 | 8.7% |
| $25,000 to $34,999 | 56 | 5.0% |
| $35,000 to $49,999 | 113 | 10.1% |
| $50,000 to $74,999 | 194 | 17.4% |
| $75,000 to $99,999 | 220 | 19.7% |
| $100,000 to $149,999 | 209 | 18.7% |
| $150,000 to $199,999 | 83 | 7.4% |
| $200,000+ | 54 | 4.8% |
Household Income by Householder Age in Pawnee
The median household income in Pawnee is $75,602, with the highest median household income of $96,359 found in the 45 to 64 years age bracket for the primary householder. A total of 465 households (41.7%) fall into this category. Meanwhile, the 65+ years age bracket for the primary householder has the lowest median household income of $54,250, with 265 households (23.8%) in this group.
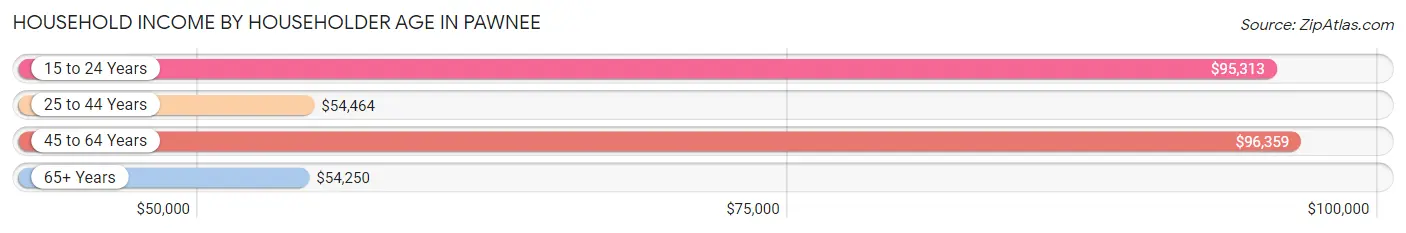
| Income Bracket | # Households | Median Income |
| 15 to 24 Years | 56 (5.0%) | $95,313 |
| 25 to 44 Years | 329 (29.5%) | $54,464 |
| 45 to 64 Years | 465 (41.7%) | $96,359 |
| 65+ Years | 265 (23.8%) | $54,250 |
| Total | 1,115 (100.0%) | $75,602 |
Poverty in Pawnee
Income Below Poverty by Sex and Age in Pawnee
With 6.0% poverty level for males and 13.9% for females among the residents of Pawnee, 25 to 34 year old males and 5 year old females are the most vulnerable to poverty, with 30 males (19.0%) and 15 females (100.0%) in their respective age groups living below the poverty level.
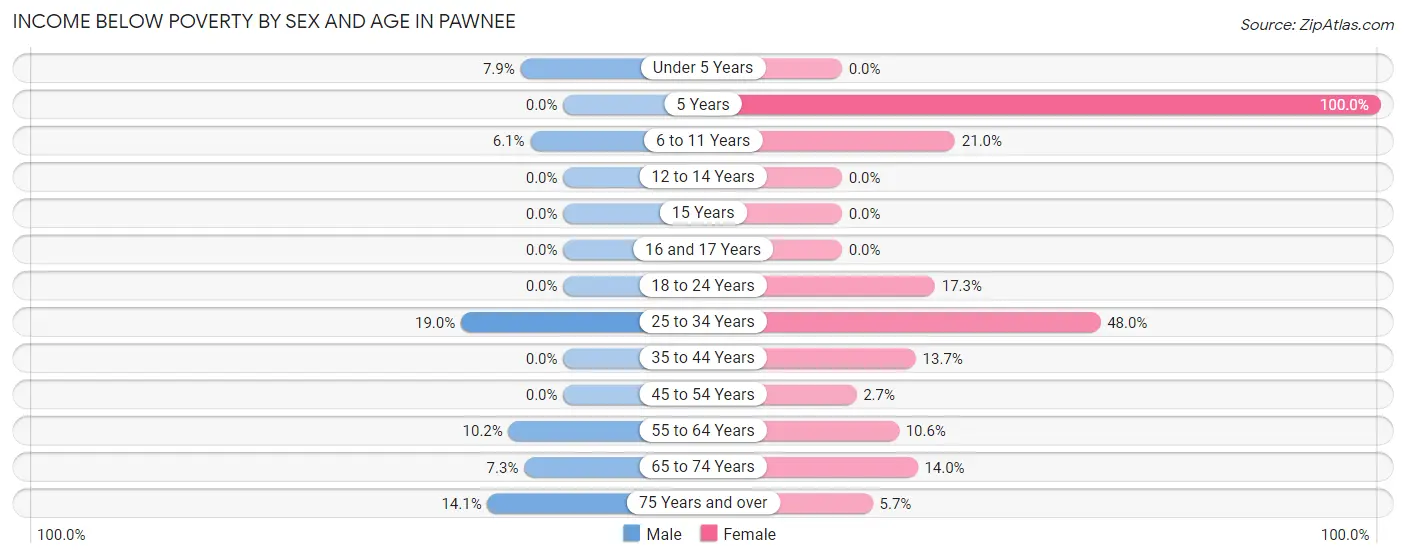
| Age Bracket | Male | Female |
| Under 5 Years | 5 (7.9%) | 0 (0.0%) |
| 5 Years | 0 (0.0%) | 15 (100.0%) |
| 6 to 11 Years | 6 (6.1%) | 17 (21.0%) |
| 12 to 14 Years | 0 (0.0%) | 0 (0.0%) |
| 15 Years | 0 (0.0%) | 0 (0.0%) |
| 16 and 17 Years | 0 (0.0%) | 0 (0.0%) |
| 18 to 24 Years | 0 (0.0%) | 34 (17.3%) |
| 25 to 34 Years | 30 (19.0%) | 47 (48.0%) |
| 35 to 44 Years | 0 (0.0%) | 27 (13.7%) |
| 45 to 54 Years | 0 (0.0%) | 6 (2.7%) |
| 55 to 64 Years | 19 (10.2%) | 15 (10.6%) |
| 65 to 74 Years | 9 (7.3%) | 16 (14.0%) |
| 75 Years and over | 10 (14.1%) | 6 (5.7%) |
| Total | 79 (6.0%) | 183 (13.9%) |
Income Above Poverty by Sex and Age in Pawnee
According to the poverty statistics in Pawnee, males aged 5 years and females aged under 5 years are the age groups that are most secure financially, with 100.0% of males and 100.0% of females in these age groups living above the poverty line.
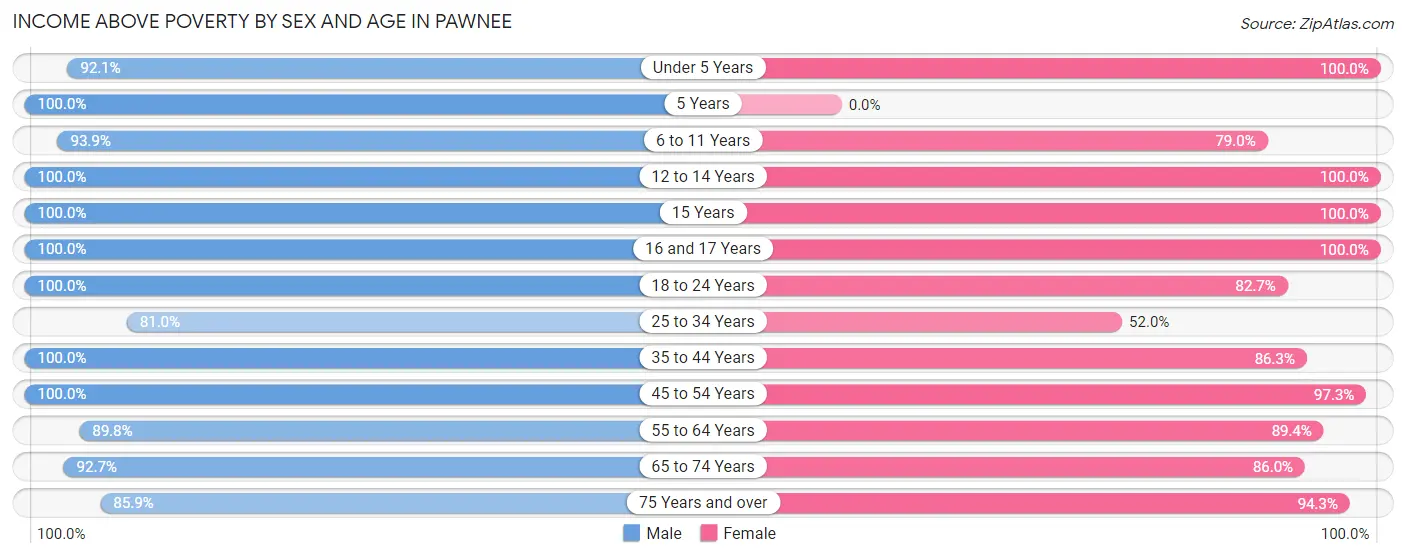
| Age Bracket | Male | Female |
| Under 5 Years | 58 (92.1%) | 61 (100.0%) |
| 5 Years | 10 (100.0%) | 0 (0.0%) |
| 6 to 11 Years | 92 (93.9%) | 64 (79.0%) |
| 12 to 14 Years | 72 (100.0%) | 58 (100.0%) |
| 15 Years | 17 (100.0%) | 20 (100.0%) |
| 16 and 17 Years | 17 (100.0%) | 5 (100.0%) |
| 18 to 24 Years | 160 (100.0%) | 163 (82.7%) |
| 25 to 34 Years | 128 (81.0%) | 51 (52.0%) |
| 35 to 44 Years | 98 (100.0%) | 170 (86.3%) |
| 45 to 54 Years | 234 (100.0%) | 218 (97.3%) |
| 55 to 64 Years | 168 (89.8%) | 127 (89.4%) |
| 65 to 74 Years | 115 (92.7%) | 98 (86.0%) |
| 75 Years and over | 61 (85.9%) | 99 (94.3%) |
| Total | 1,230 (94.0%) | 1,134 (86.1%) |
Income Below Poverty Among Married-Couple Families in Pawnee
The poverty statistics for married-couple families in Pawnee show that 3.1% or 16 of the total 521 families live below the poverty line. Families with no children have the highest poverty rate of 4.7%, comprising of 16 families. On the other hand, families with 1 or 2 children have the lowest poverty rate of 0.0%, which includes 0 families.
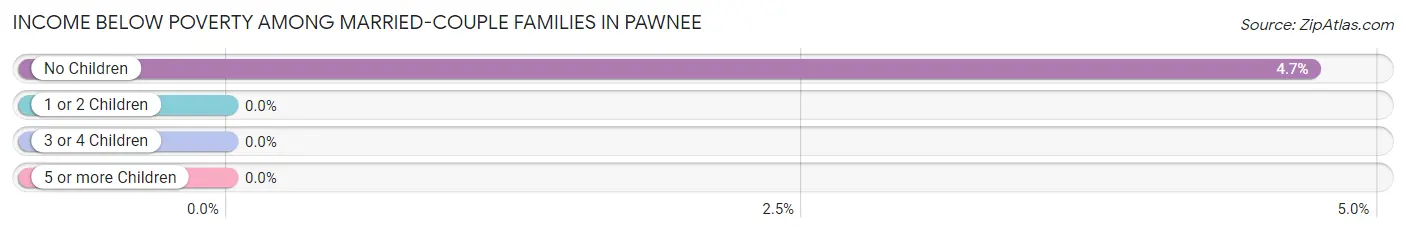
| Children | Above Poverty | Below Poverty |
| No Children | 324 (95.3%) | 16 (4.7%) |
| 1 or 2 Children | 162 (100.0%) | 0 (0.0%) |
| 3 or 4 Children | 15 (100.0%) | 0 (0.0%) |
| 5 or more Children | 4 (100.0%) | 0 (0.0%) |
| Total | 505 (96.9%) | 16 (3.1%) |
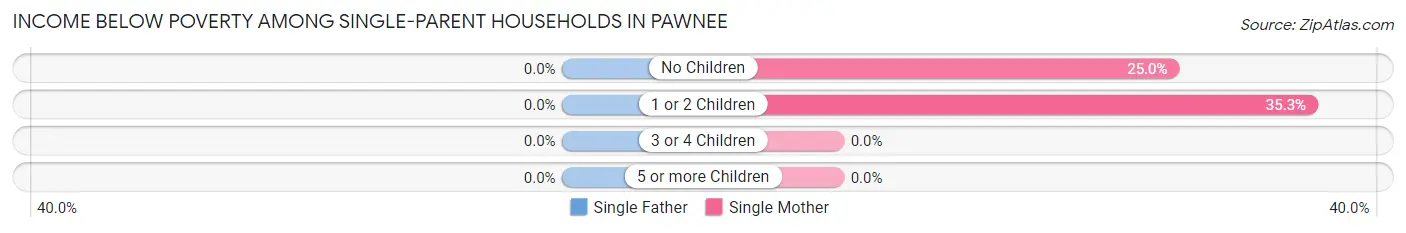
Income Below Poverty Among Single-Parent Households in Pawnee
| Children | Single Father | Single Mother |
| No Children | 0 (0.0%) | 9 (25.0%) |
| 1 or 2 Children | 0 (0.0%) | 53 (35.3%) |
| 3 or 4 Children | 0 (0.0%) | 0 (0.0%) |
| 5 or more Children | 0 (0.0%) | 0 (0.0%) |
| Total | 0 (0.0%) | 62 (32.5%) |
Income Below Poverty Among Married-Couple vs Single-Parent Households in Pawnee
The poverty data for Pawnee shows that 16 of the married-couple family households (3.1%) and 62 of the single-parent households (24.9%) are living below the poverty level. Within the married-couple family households, those with no children have the highest poverty rate, with 16 households (4.7%) falling below the poverty line. Among the single-parent households, those with 1 or 2 children have the highest poverty rate, with 53 household (31.7%) living below poverty.
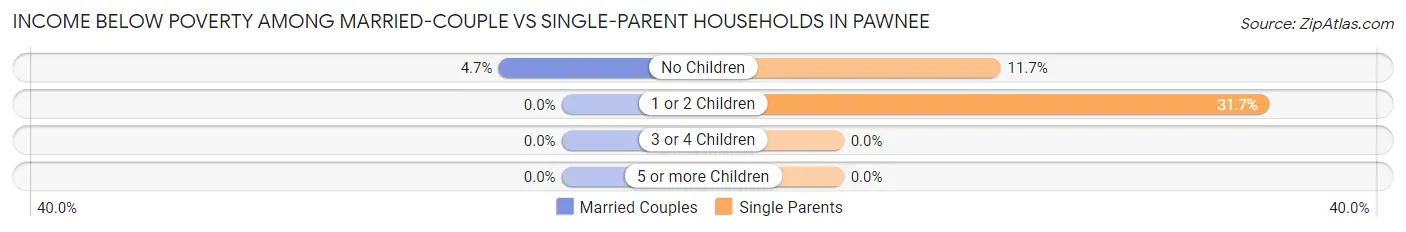
| Children | Married-Couple Families | Single-Parent Households |
| No Children | 16 (4.7%) | 9 (11.7%) |
| 1 or 2 Children | 0 (0.0%) | 53 (31.7%) |
| 3 or 4 Children | 0 (0.0%) | 0 (0.0%) |
| 5 or more Children | 0 (0.0%) | 0 (0.0%) |
| Total | 16 (3.1%) | 62 (24.9%) |
Race in Pawnee
The most populous races in Pawnee are White / Caucasian (2,443 | 93.0%), Two or more Races (155 | 5.9%), and Hispanic or Latino (38 | 1.5%).
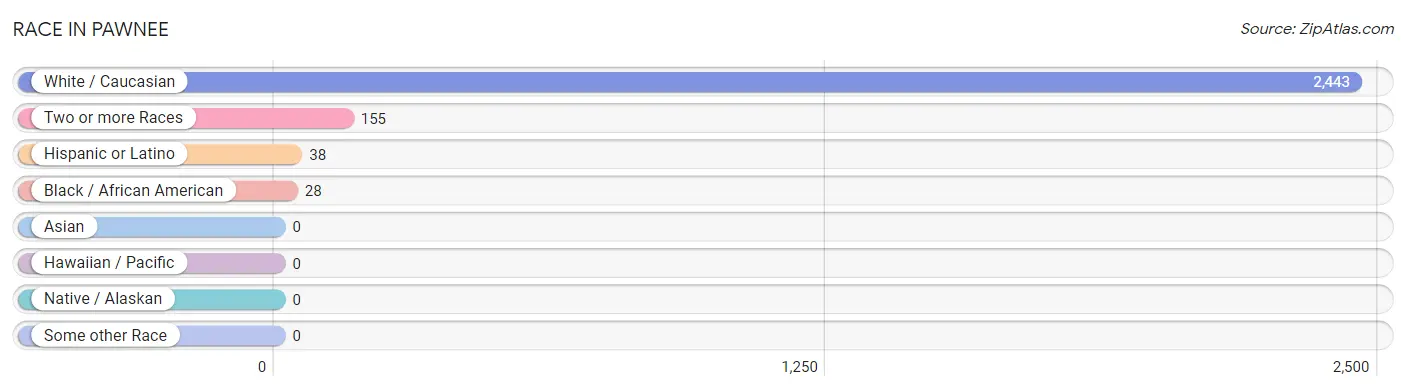
| Race | # Population | % Population |
| Asian | 0 | 0.0% |
| Black / African American | 28 | 1.1% |
| Hawaiian / Pacific | 0 | 0.0% |
| Hispanic or Latino | 38 | 1.5% |
| Native / Alaskan | 0 | 0.0% |
| White / Caucasian | 2,443 | 93.0% |
| Two or more Races | 155 | 5.9% |
| Some other Race | 0 | 0.0% |
| Total | 2,626 | 100.0% |
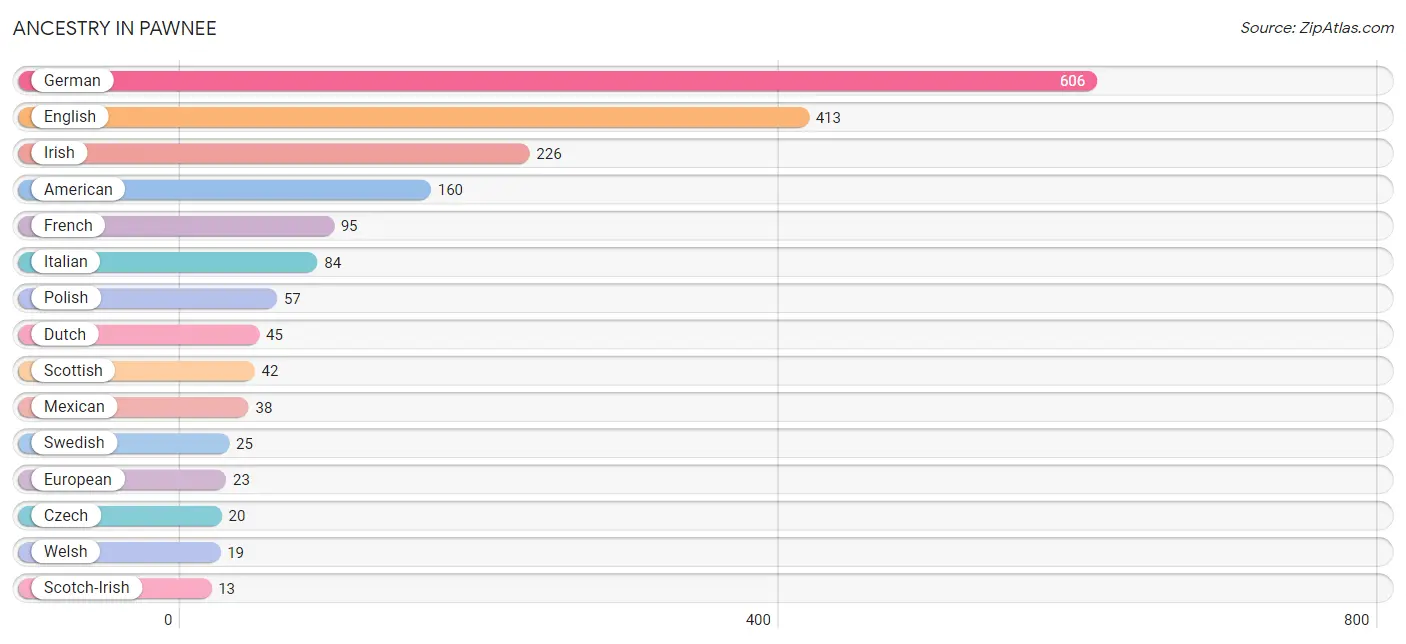
Ancestry in Pawnee
The most populous ancestries reported in Pawnee are German (606 | 23.1%), English (413 | 15.7%), Irish (226 | 8.6%), American (160 | 6.1%), and French (95 | 3.6%), together accounting for 57.1% of all Pawnee residents.
| Ancestry | # Population | % Population |
| American | 160 | 6.1% |
| Austrian | 5 | 0.2% |
| British | 6 | 0.2% |
| Canadian | 6 | 0.2% |
| Cherokee | 3 | 0.1% |
| Croatian | 4 | 0.2% |
| Czech | 20 | 0.8% |
| Danish | 6 | 0.2% |
| Dutch | 45 | 1.7% |
| English | 413 | 15.7% |
| European | 23 | 0.9% |
| French | 95 | 3.6% |
| German | 606 | 23.1% |
| Hungarian | 10 | 0.4% |
| Irish | 226 | 8.6% |
| Italian | 84 | 3.2% |
| Mexican | 38 | 1.5% |
| Norwegian | 12 | 0.5% |
| Polish | 57 | 2.2% |
| Pueblo | 5 | 0.2% |
| Scandinavian | 4 | 0.2% |
| Scotch-Irish | 13 | 0.5% |
| Scottish | 42 | 1.6% |
| Swedish | 25 | 0.9% |
| Swiss | 6 | 0.2% |
| Welsh | 19 | 0.7% | View All 26 Rows |
Immigrants in Pawnee

| Immigration Origin | # Population | % Population | View All 0 Rows |
Sex and Age in Pawnee
Sex and Age in Pawnee
The most populous age groups in Pawnee are 45 to 49 Years (167 | 12.8%) for men and 20 to 24 Years (162 | 12.3%) for women.
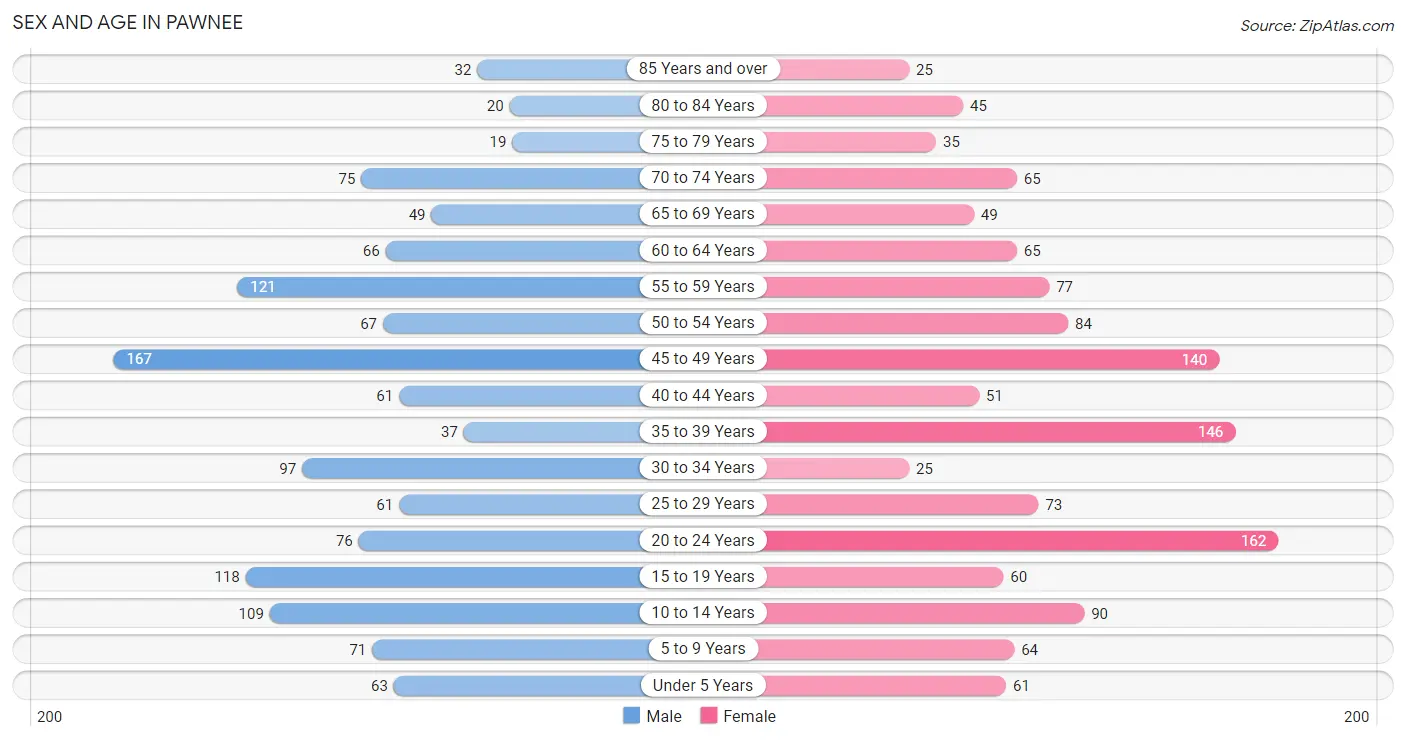
| Age Bracket | Male | Female |
| Under 5 Years | 63 (4.8%) | 61 (4.6%) |
| 5 to 9 Years | 71 (5.4%) | 64 (4.9%) |
| 10 to 14 Years | 109 (8.3%) | 90 (6.8%) |
| 15 to 19 Years | 118 (9.0%) | 60 (4.6%) |
| 20 to 24 Years | 76 (5.8%) | 162 (12.3%) |
| 25 to 29 Years | 61 (4.7%) | 73 (5.5%) |
| 30 to 34 Years | 97 (7.4%) | 25 (1.9%) |
| 35 to 39 Years | 37 (2.8%) | 146 (11.1%) |
| 40 to 44 Years | 61 (4.7%) | 51 (3.9%) |
| 45 to 49 Years | 167 (12.8%) | 140 (10.6%) |
| 50 to 54 Years | 67 (5.1%) | 84 (6.4%) |
| 55 to 59 Years | 121 (9.2%) | 77 (5.9%) |
| 60 to 64 Years | 66 (5.0%) | 65 (4.9%) |
| 65 to 69 Years | 49 (3.7%) | 49 (3.7%) |
| 70 to 74 Years | 75 (5.7%) | 65 (4.9%) |
| 75 to 79 Years | 19 (1.5%) | 35 (2.7%) |
| 80 to 84 Years | 20 (1.5%) | 45 (3.4%) |
| 85 Years and over | 32 (2.4%) | 25 (1.9%) |
| Total | 1,309 (100.0%) | 1,317 (100.0%) |
Families and Households in Pawnee
Median Family Size in Pawnee
The median family size in Pawnee is 2.76 persons per family, with single male/father families (58 | 7.5%) accounting for the largest median family size of 2.9 persons per family. On the other hand, single female/mother families (191 | 24.8%) represent the smallest median family size with 2.51 persons per family.
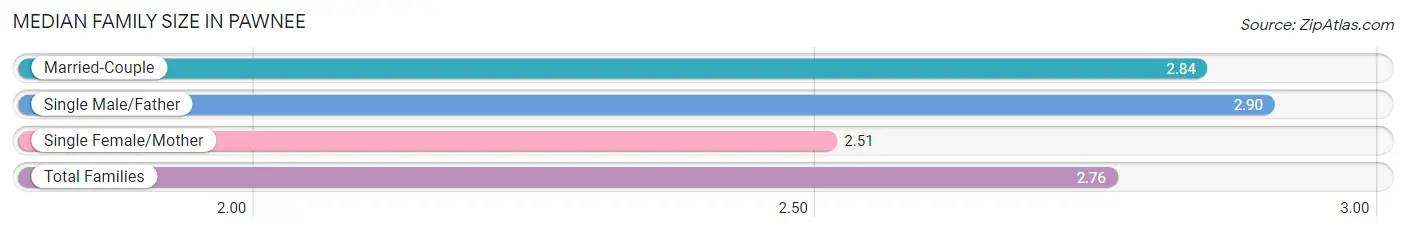
| Family Type | # Families | Family Size |
| Married-Couple | 521 (67.7%) | 2.84 |
| Single Male/Father | 58 (7.5%) | 2.90 |
| Single Female/Mother | 191 (24.8%) | 2.51 |
| Total Families | 770 (100.0%) | 2.76 |
Median Household Size in Pawnee
The median household size in Pawnee is 2.36 persons per household, with single male/father households (58 | 5.2%) accounting for the largest median household size of 3.29 persons per household. non-family households (345 | 30.9%) represent the smallest median household size with 1.25 persons per household.
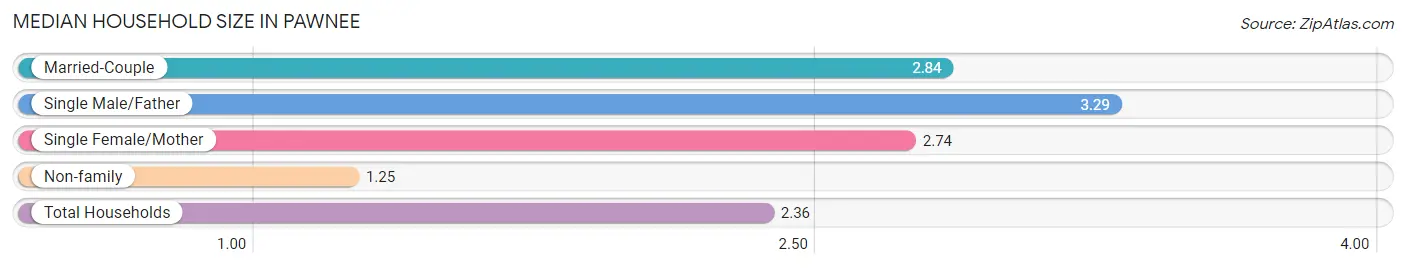
| Household Type | # Households | Household Size |
| Married-Couple | 521 (46.7%) | 2.84 |
| Single Male/Father | 58 (5.2%) | 3.29 |
| Single Female/Mother | 191 (17.1%) | 2.74 |
| Non-family | 345 (30.9%) | 1.25 |
| Total Households | 1,115 (100.0%) | 2.36 |
Household Size by Marriage Status in Pawnee
Out of a total of 1,115 households in Pawnee, 770 (69.1%) are family households, while 345 (30.9%) are nonfamily households. The most numerous type of family households are 2-person households, comprising 423, and the most common type of nonfamily households are 1-person households, comprising 268.
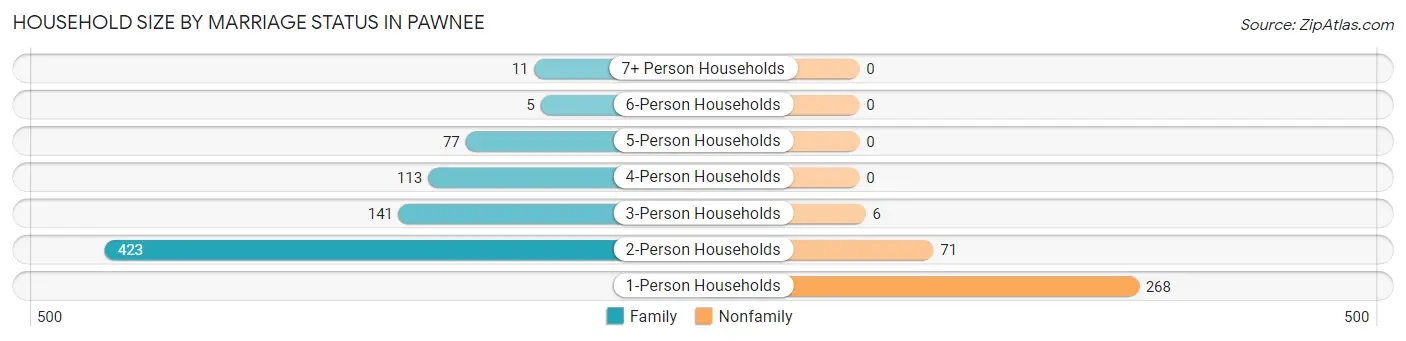
| Household Size | Family Households | Nonfamily Households |
| 1-Person Households | - | 268 (24.0%) |
| 2-Person Households | 423 (37.9%) | 71 (6.4%) |
| 3-Person Households | 141 (12.7%) | 6 (0.5%) |
| 4-Person Households | 113 (10.1%) | 0 (0.0%) |
| 5-Person Households | 77 (6.9%) | 0 (0.0%) |
| 6-Person Households | 5 (0.4%) | 0 (0.0%) |
| 7+ Person Households | 11 (1.0%) | 0 (0.0%) |
| Total | 770 (69.1%) | 345 (30.9%) |
Female Fertility in Pawnee
Fertility by Age in Pawnee
Average fertility rate in Pawnee is 38.0 births per 1,000 women. Women in the age bracket of 20 to 34 years have the highest fertility rate with 100.0 births per 1,000 women. Women in the age bracket of 20 to 34 years acount for 100.0% of all women with births.
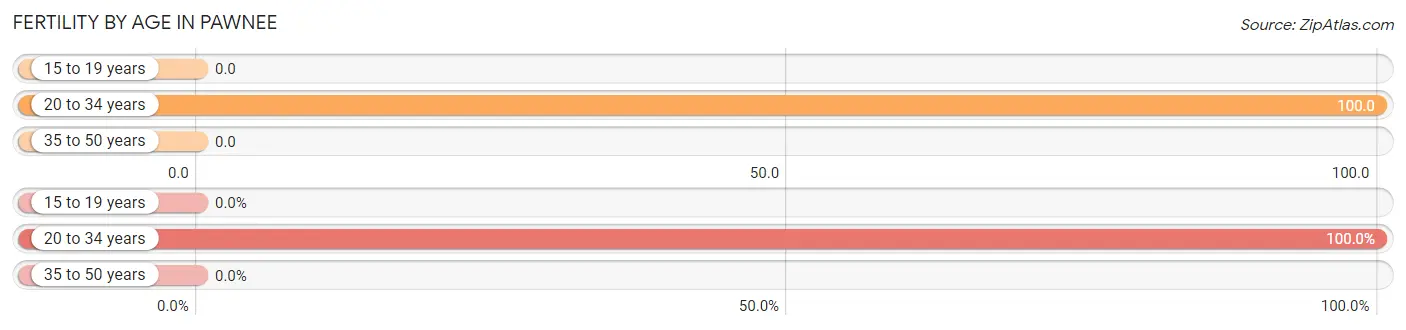
| Age Bracket | Women with Births | Births / 1,000 Women |
| 15 to 19 years | 0 (0.0%) | 0.0 |
| 20 to 34 years | 26 (100.0%) | 100.0 |
| 35 to 50 years | 0 (0.0%) | 0.0 |
| Total | 26 (100.0%) | 38.0 |
Fertility by Age by Marriage Status in Pawnee
23.1% of women with births (26) in Pawnee are married. The highest percentage of unmarried women with births falls into 20 to 34 years age bracket with 76.9% of them unmarried at the time of birth, while the lowest percentage of unmarried women with births belong to 20 to 34 years age bracket with 76.9% of them unmarried.
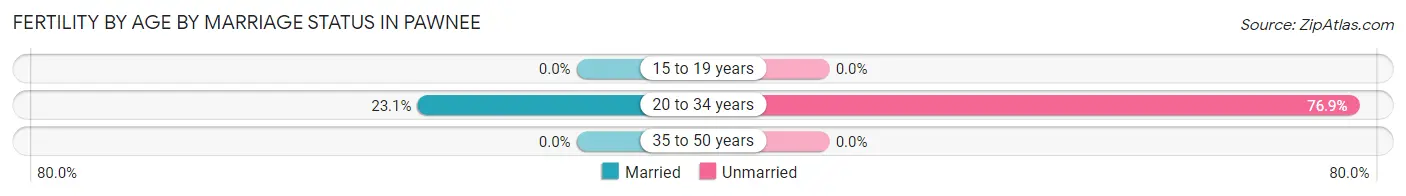
| Age Bracket | Married | Unmarried |
| 15 to 19 years | 0 (0.0%) | 0 (0.0%) |
| 20 to 34 years | 6 (23.1%) | 20 (76.9%) |
| 35 to 50 years | 0 (0.0%) | 0 (0.0%) |
| Total | 6 (23.1%) | 20 (76.9%) |
Fertility by Education in Pawnee
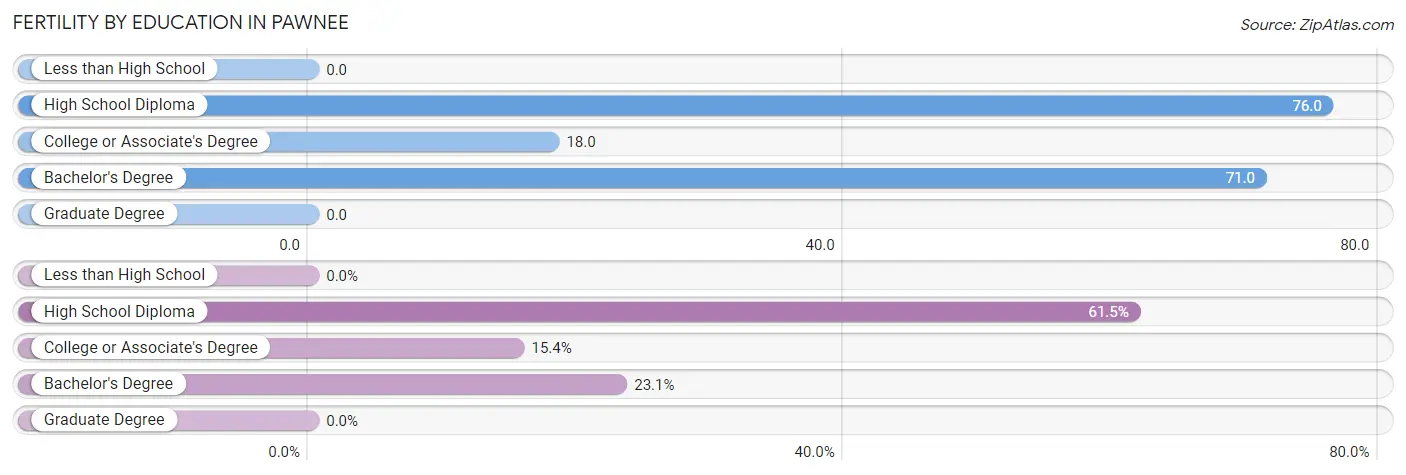
| Educational Attainment | Women with Births | Births / 1,000 Women |
| Less than High School | 0 (0.0%) | 0.0 |
| High School Diploma | 16 (61.5%) | 76.0 |
| College or Associate's Degree | 4 (15.4%) | 18.0 |
| Bachelor's Degree | 6 (23.1%) | 71.0 |
| Graduate Degree | 0 (0.0%) | 0.0 |
| Total | 26 (100.0%) | 38.0 |
Fertility by Education by Marriage Status in Pawnee
76.9% of women with births in Pawnee are unmarried. Women with the educational attainment of bachelor's degree are most likely to be married with 100.0% of them married at childbirth, while women with the educational attainment of high school diploma are least likely to be married with 100.0% of them unmarried at childbirth.
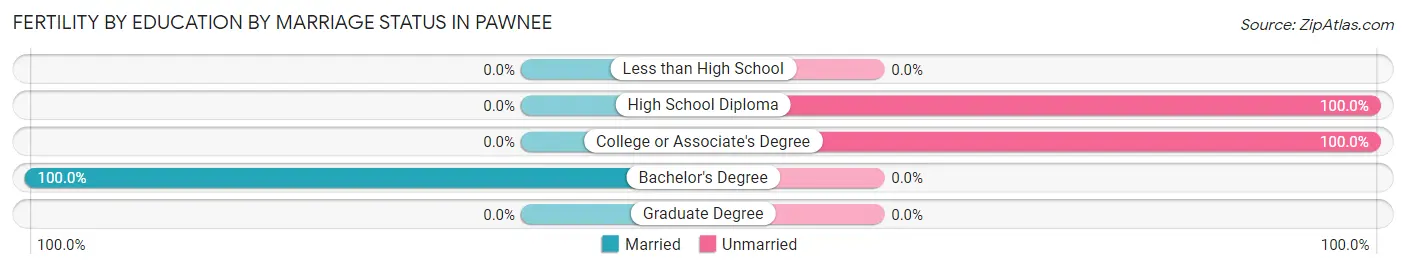
| Educational Attainment | Married | Unmarried |
| Less than High School | 0 (0.0%) | 0 (0.0%) |
| High School Diploma | 0 (0.0%) | 16 (100.0%) |
| College or Associate's Degree | 0 (0.0%) | 4 (100.0%) |
| Bachelor's Degree | 6 (100.0%) | 0 (0.0%) |
| Graduate Degree | 0 (0.0%) | 0 (0.0%) |
| Total | 6 (23.1%) | 20 (76.9%) |
Employment Characteristics in Pawnee
Employment by Class of Employer in Pawnee
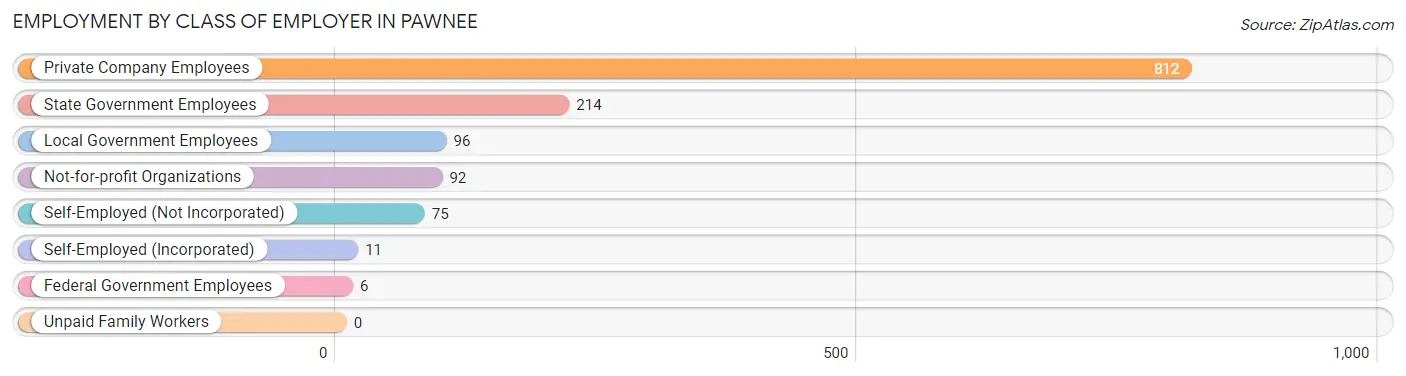
Among the 1,306 employed individuals in Pawnee, private company employees (812 | 62.2%), state government employees (214 | 16.4%), and local government employees (96 | 7.3%) make up the most common classes of employment.
| Employer Class | # Employees | % Employees |
| Private Company Employees | 812 | 62.2% |
| Self-Employed (Incorporated) | 11 | 0.8% |
| Self-Employed (Not Incorporated) | 75 | 5.7% |
| Not-for-profit Organizations | 92 | 7.0% |
| Local Government Employees | 96 | 7.3% |
| State Government Employees | 214 | 16.4% |
| Federal Government Employees | 6 | 0.5% |
| Unpaid Family Workers | 0 | 0.0% |
| Total | 1,306 | 100.0% |
Employment Status by Age in Pawnee
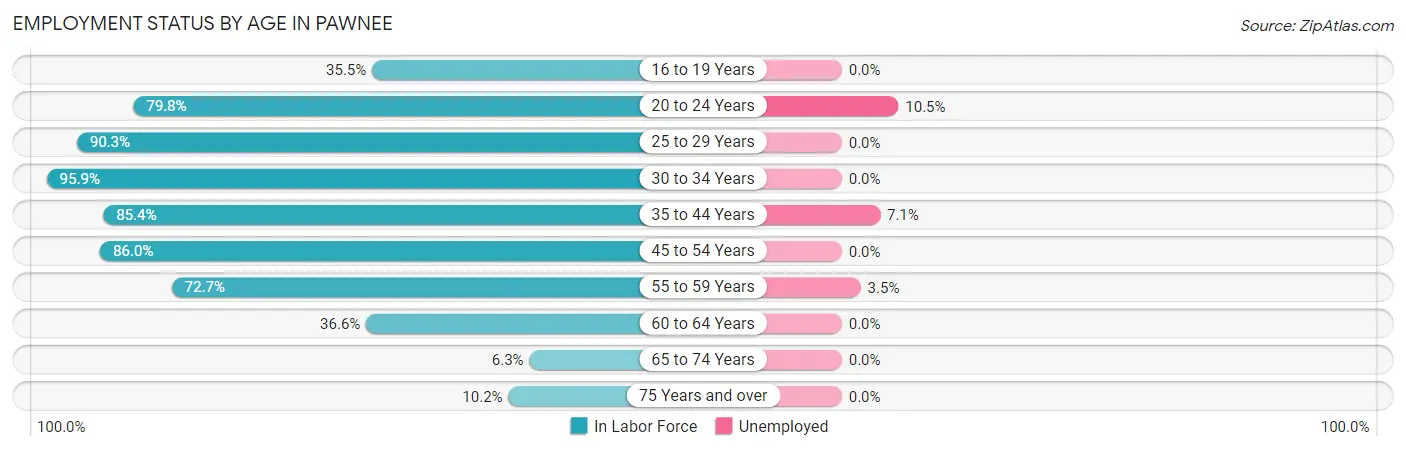
According to the labor force statistics for Pawnee, out of the total population over 16 years of age (2,131), 63.3% or 1,349 individuals are in the labor force, with 3.2% or 43 of them unemployed. The age group with the highest labor force participation rate is 30 to 34 years, with 95.9% or 117 individuals in the labor force. Within the labor force, the 20 to 24 years age range has the highest percentage of unemployed individuals, with 10.5% or 20 of them being unemployed.
| Age Bracket | In Labor Force | Unemployed |
| 16 to 19 Years | 50 (35.5%) | 0 (0.0%) |
| 20 to 24 Years | 190 (79.8%) | 20 (10.5%) |
| 25 to 29 Years | 121 (90.3%) | 0 (0.0%) |
| 30 to 34 Years | 117 (95.9%) | 0 (0.0%) |
| 35 to 44 Years | 252 (85.4%) | 18 (7.1%) |
| 45 to 54 Years | 394 (86.0%) | 0 (0.0%) |
| 55 to 59 Years | 144 (72.7%) | 5 (3.5%) |
| 60 to 64 Years | 48 (36.6%) | 0 (0.0%) |
| 65 to 74 Years | 15 (6.3%) | 0 (0.0%) |
| 75 Years and over | 18 (10.2%) | 0 (0.0%) |
| Total | 1,349 (63.3%) | 43 (3.2%) |
Employment Status by Educational Attainment in Pawnee
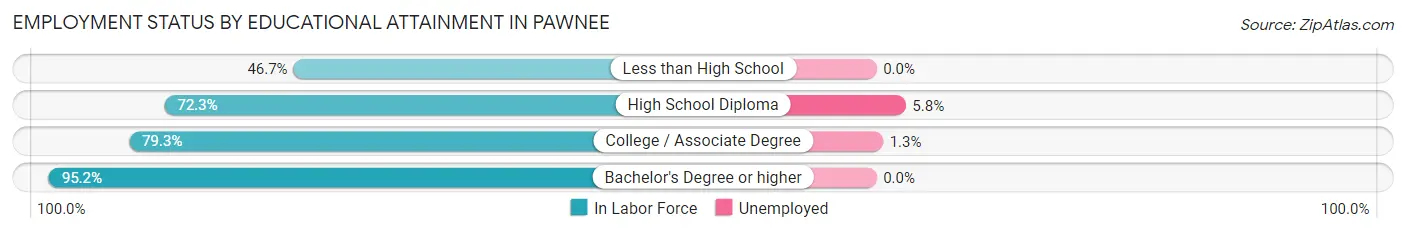
According to labor force statistics for Pawnee, 80.4% of individuals (1,076) out of the total population between 25 and 64 years of age (1,338) are in the labor force, with 2.1% or 23 of them being unemployed. The group with the highest labor force participation rate are those with the educational attainment of bachelor's degree or higher, with 95.2% or 358 individuals in the labor force. Within the labor force, individuals with high school diploma education have the highest percentage of unemployment, with 5.8% or 18 of them being unemployed.
| Educational Attainment | In Labor Force | Unemployed |
| Less than High School | 21 (46.7%) | 0 (0.0%) |
| High School Diploma | 313 (72.3%) | 25 (5.8%) |
| College / Associate Degree | 384 (79.3%) | 6 (1.3%) |
| Bachelor's Degree or higher | 358 (95.2%) | 0 (0.0%) |
| Total | 1,076 (80.4%) | 28 (2.1%) |
Employment Occupations by Sex in Pawnee
Management, Business, Science and Arts Occupations
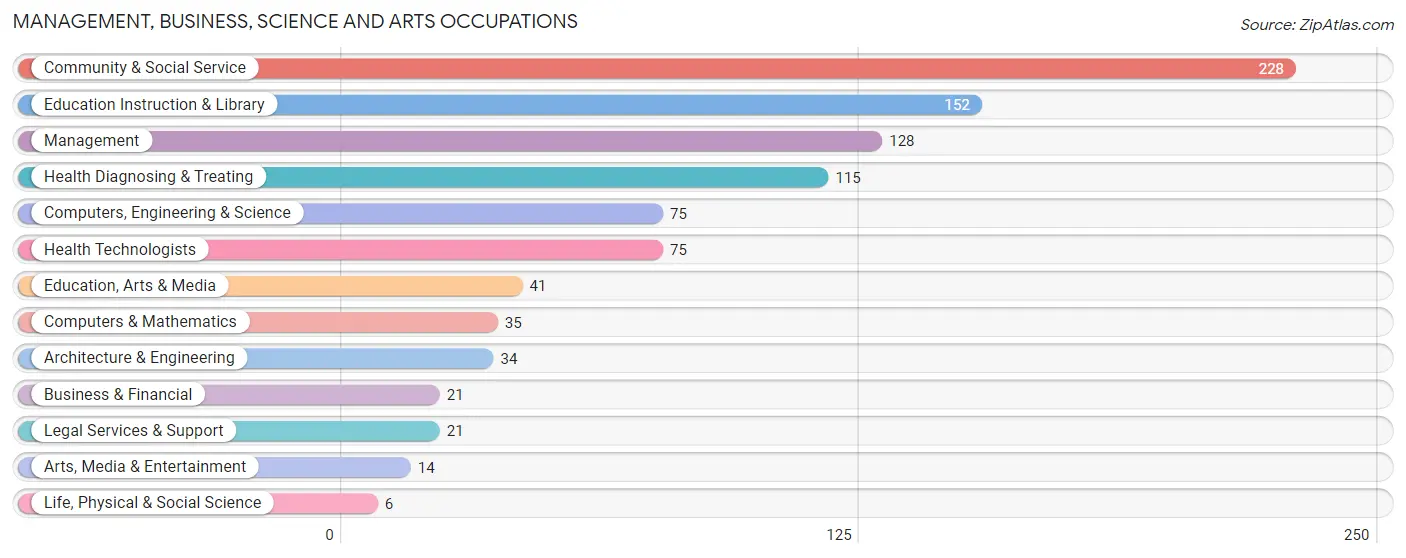
The most common Management, Business, Science and Arts occupations in Pawnee are Community & Social Service (228 | 17.5%), Education Instruction & Library (152 | 11.6%), Management (128 | 9.8%), Health Diagnosing & Treating (115 | 8.8%), and Computers, Engineering & Science (75 | 5.7%).
Management, Business, Science and Arts Occupations by Sex
Within the Management, Business, Science and Arts occupations in Pawnee, the most male-oriented occupations are Architecture & Engineering (100.0%), Business & Financial (85.7%), and Computers, Engineering & Science (74.7%), while the most female-oriented occupations are Life, Physical & Social Science (100.0%), Education, Arts & Media (100.0%), and Arts, Media & Entertainment (100.0%).
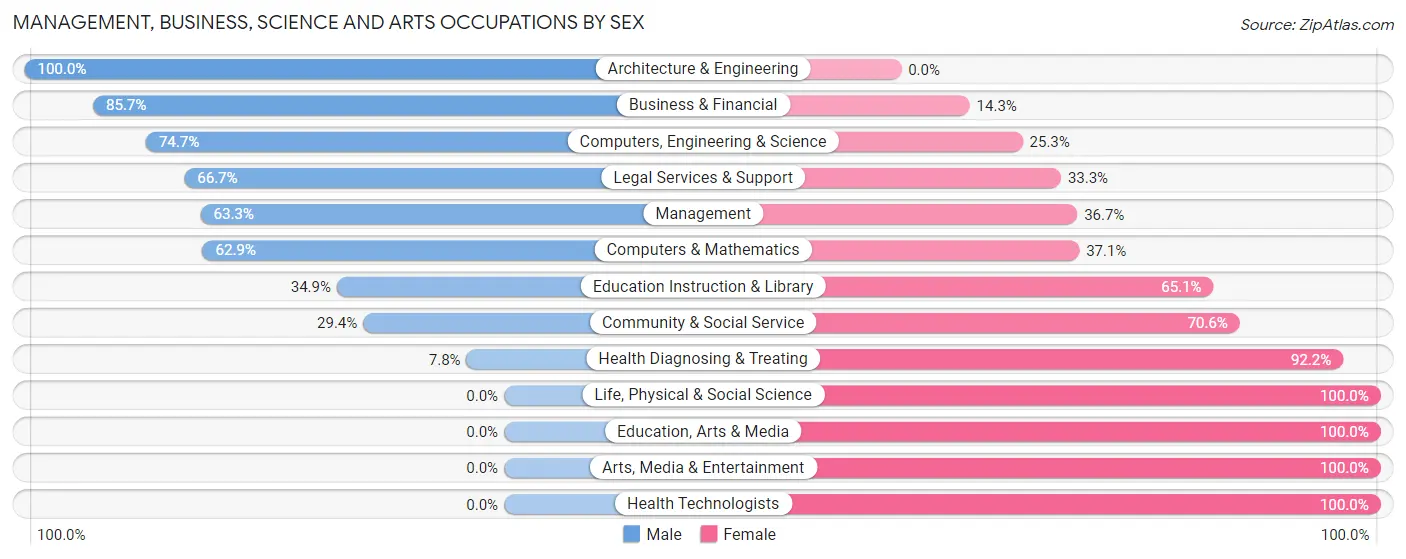
| Occupation | Male | Female |
| Management | 81 (63.3%) | 47 (36.7%) |
| Business & Financial | 18 (85.7%) | 3 (14.3%) |
| Computers, Engineering & Science | 56 (74.7%) | 19 (25.3%) |
| Computers & Mathematics | 22 (62.9%) | 13 (37.1%) |
| Architecture & Engineering | 34 (100.0%) | 0 (0.0%) |
| Life, Physical & Social Science | 0 (0.0%) | 6 (100.0%) |
| Community & Social Service | 67 (29.4%) | 161 (70.6%) |
| Education, Arts & Media | 0 (0.0%) | 41 (100.0%) |
| Legal Services & Support | 14 (66.7%) | 7 (33.3%) |
| Education Instruction & Library | 53 (34.9%) | 99 (65.1%) |
| Arts, Media & Entertainment | 0 (0.0%) | 14 (100.0%) |
| Health Diagnosing & Treating | 9 (7.8%) | 106 (92.2%) |
| Health Technologists | 0 (0.0%) | 75 (100.0%) |
| Total (Category) | 231 (40.7%) | 336 (59.3%) |
| Total (Overall) | 659 (50.5%) | 647 (49.5%) |
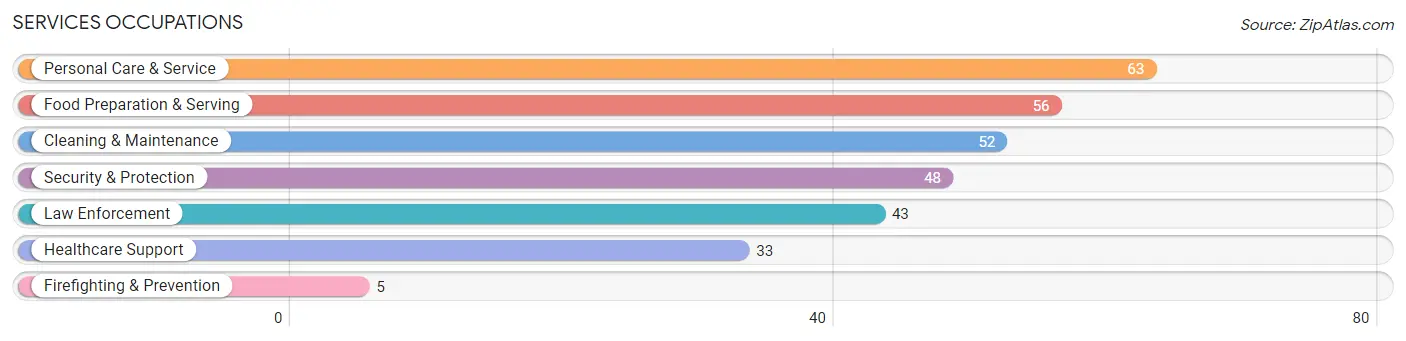
Services Occupations
The most common Services occupations in Pawnee are Personal Care & Service (63 | 4.8%), Food Preparation & Serving (56 | 4.3%), Cleaning & Maintenance (52 | 4.0%), Security & Protection (48 | 3.7%), and Law Enforcement (43 | 3.3%).
Services Occupations by Sex
Within the Services occupations in Pawnee, the most male-oriented occupations are Security & Protection (100.0%), Firefighting & Prevention (100.0%), and Law Enforcement (100.0%), while the most female-oriented occupations are Personal Care & Service (80.9%), Healthcare Support (66.7%), and Food Preparation & Serving (48.2%).
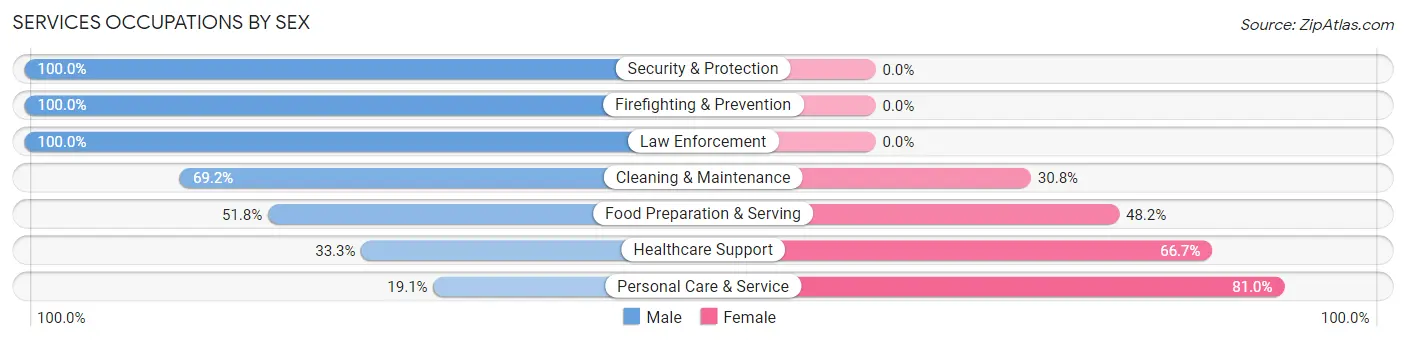
| Occupation | Male | Female |
| Healthcare Support | 11 (33.3%) | 22 (66.7%) |
| Security & Protection | 48 (100.0%) | 0 (0.0%) |
| Firefighting & Prevention | 5 (100.0%) | 0 (0.0%) |
| Law Enforcement | 43 (100.0%) | 0 (0.0%) |
| Food Preparation & Serving | 29 (51.8%) | 27 (48.2%) |
| Cleaning & Maintenance | 36 (69.2%) | 16 (30.8%) |
| Personal Care & Service | 12 (19.1%) | 51 (80.9%) |
| Total (Category) | 136 (54.0%) | 116 (46.0%) |
| Total (Overall) | 659 (50.5%) | 647 (49.5%) |
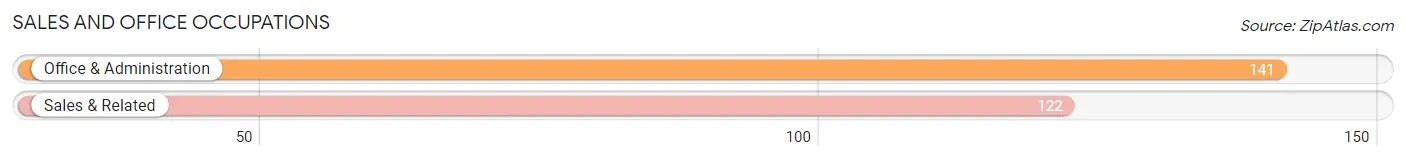
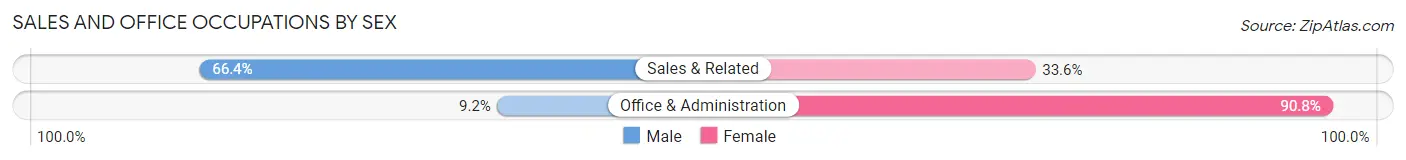
Sales and Office Occupations
The most common Sales and Office occupations in Pawnee are Office & Administration (141 | 10.8%), and Sales & Related (122 | 9.3%).
Sales and Office Occupations by Sex
| Occupation | Male | Female |
| Sales & Related | 81 (66.4%) | 41 (33.6%) |
| Office & Administration | 13 (9.2%) | 128 (90.8%) |
| Total (Category) | 94 (35.7%) | 169 (64.3%) |
| Total (Overall) | 659 (50.5%) | 647 (49.5%) |
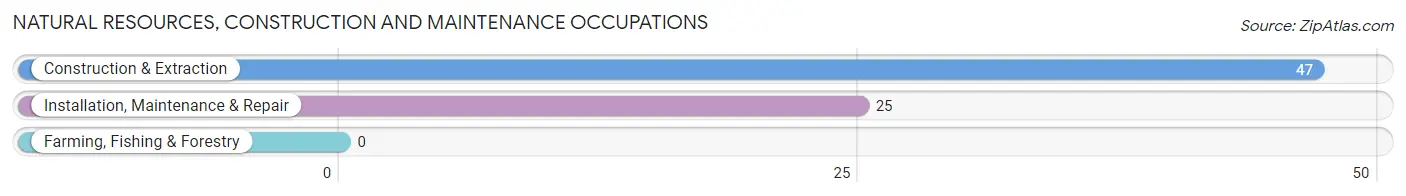
Natural Resources, Construction and Maintenance Occupations
The most common Natural Resources, Construction and Maintenance occupations in Pawnee are Construction & Extraction (47 | 3.6%), and Installation, Maintenance & Repair (25 | 1.9%).
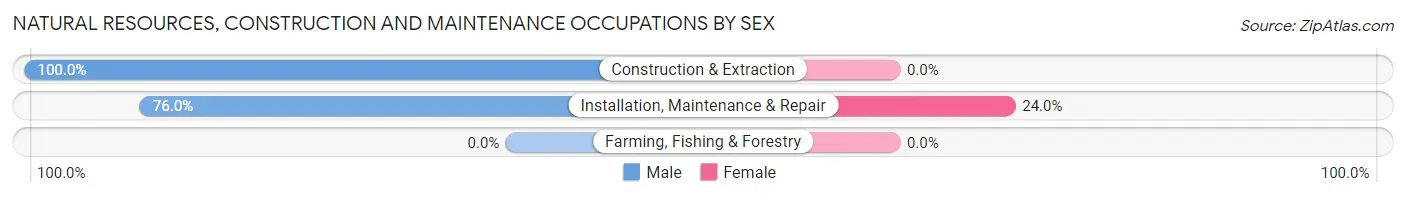
Natural Resources, Construction and Maintenance Occupations by Sex
| Occupation | Male | Female |
| Farming, Fishing & Forestry | 0 (0.0%) | 0 (0.0%) |
| Construction & Extraction | 47 (100.0%) | 0 (0.0%) |
| Installation, Maintenance & Repair | 19 (76.0%) | 6 (24.0%) |
| Total (Category) | 66 (91.7%) | 6 (8.3%) |
| Total (Overall) | 659 (50.5%) | 647 (49.5%) |
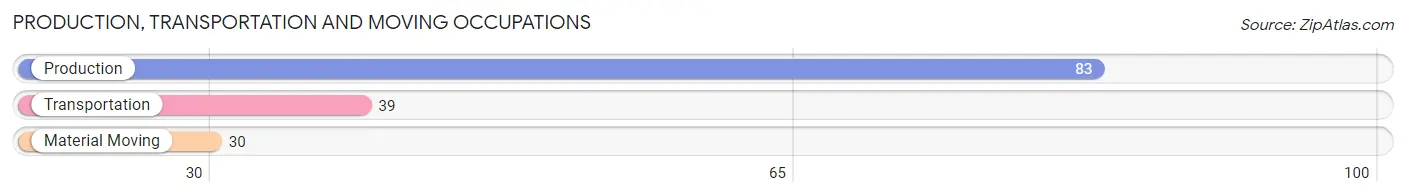
Production, Transportation and Moving Occupations
The most common Production, Transportation and Moving occupations in Pawnee are Production (83 | 6.4%), Transportation (39 | 3.0%), and Material Moving (30 | 2.3%).
Production, Transportation and Moving Occupations by Sex
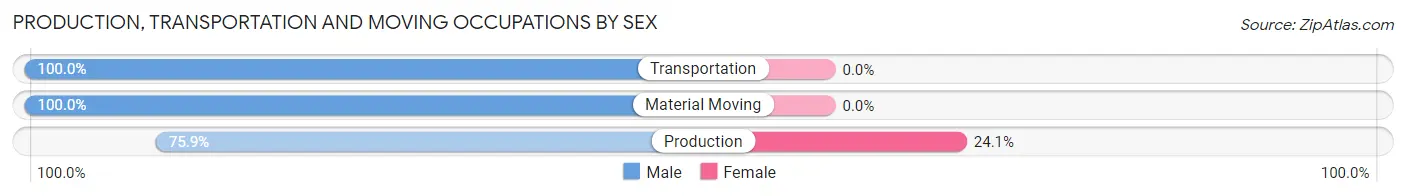
| Occupation | Male | Female |
| Production | 63 (75.9%) | 20 (24.1%) |
| Transportation | 39 (100.0%) | 0 (0.0%) |
| Material Moving | 30 (100.0%) | 0 (0.0%) |
| Total (Category) | 132 (86.8%) | 20 (13.2%) |
| Total (Overall) | 659 (50.5%) | 647 (49.5%) |
Employment Industries by Sex in Pawnee
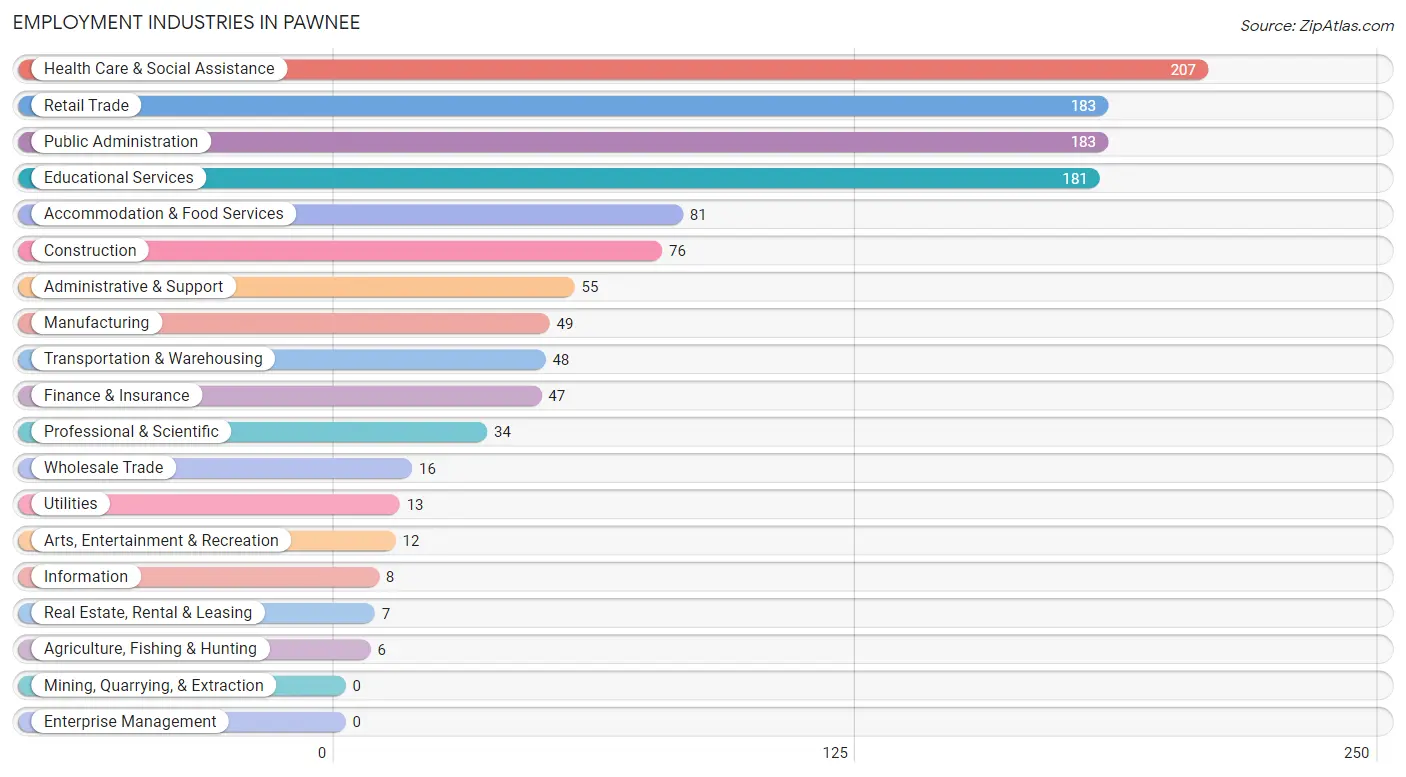
Employment Industries in Pawnee
The major employment industries in Pawnee include Health Care & Social Assistance (207 | 15.9%), Retail Trade (183 | 14.0%), Public Administration (183 | 14.0%), Educational Services (181 | 13.9%), and Accommodation & Food Services (81 | 6.2%).
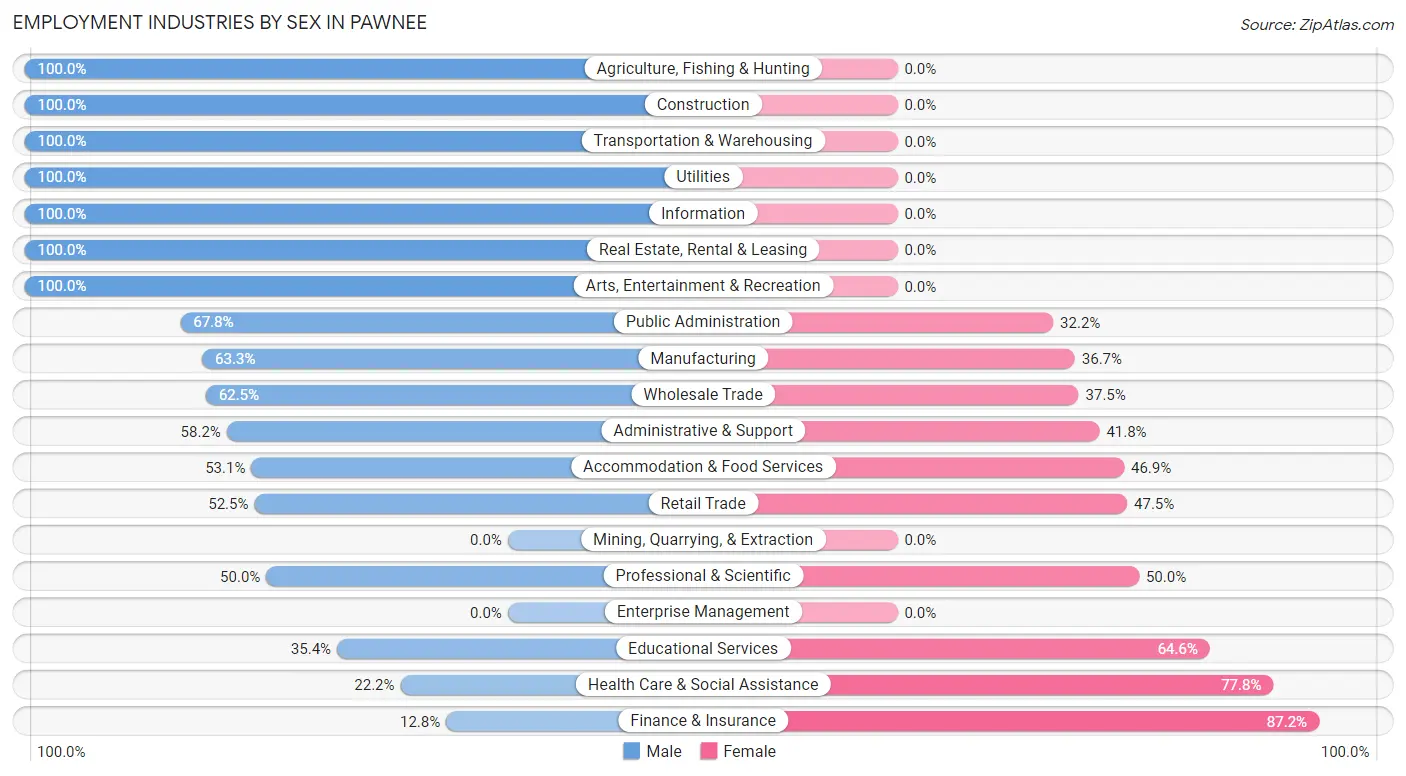
Employment Industries by Sex in Pawnee
The Pawnee industries that see more men than women are Agriculture, Fishing & Hunting (100.0%), Construction (100.0%), and Transportation & Warehousing (100.0%), whereas the industries that tend to have a higher number of women are Finance & Insurance (87.2%), Health Care & Social Assistance (77.8%), and Educational Services (64.6%).
| Industry | Male | Female |
| Agriculture, Fishing & Hunting | 6 (100.0%) | 0 (0.0%) |
| Mining, Quarrying, & Extraction | 0 (0.0%) | 0 (0.0%) |
| Construction | 76 (100.0%) | 0 (0.0%) |
| Manufacturing | 31 (63.3%) | 18 (36.7%) |
| Wholesale Trade | 10 (62.5%) | 6 (37.5%) |
| Retail Trade | 96 (52.5%) | 87 (47.5%) |
| Transportation & Warehousing | 48 (100.0%) | 0 (0.0%) |
| Utilities | 13 (100.0%) | 0 (0.0%) |
| Information | 8 (100.0%) | 0 (0.0%) |
| Finance & Insurance | 6 (12.8%) | 41 (87.2%) |
| Real Estate, Rental & Leasing | 7 (100.0%) | 0 (0.0%) |
| Professional & Scientific | 17 (50.0%) | 17 (50.0%) |
| Enterprise Management | 0 (0.0%) | 0 (0.0%) |
| Administrative & Support | 32 (58.2%) | 23 (41.8%) |
| Educational Services | 64 (35.4%) | 117 (64.6%) |
| Health Care & Social Assistance | 46 (22.2%) | 161 (77.8%) |
| Arts, Entertainment & Recreation | 12 (100.0%) | 0 (0.0%) |
| Accommodation & Food Services | 43 (53.1%) | 38 (46.9%) |
| Public Administration | 124 (67.8%) | 59 (32.2%) |
| Total | 659 (50.5%) | 647 (49.5%) |
Education in Pawnee
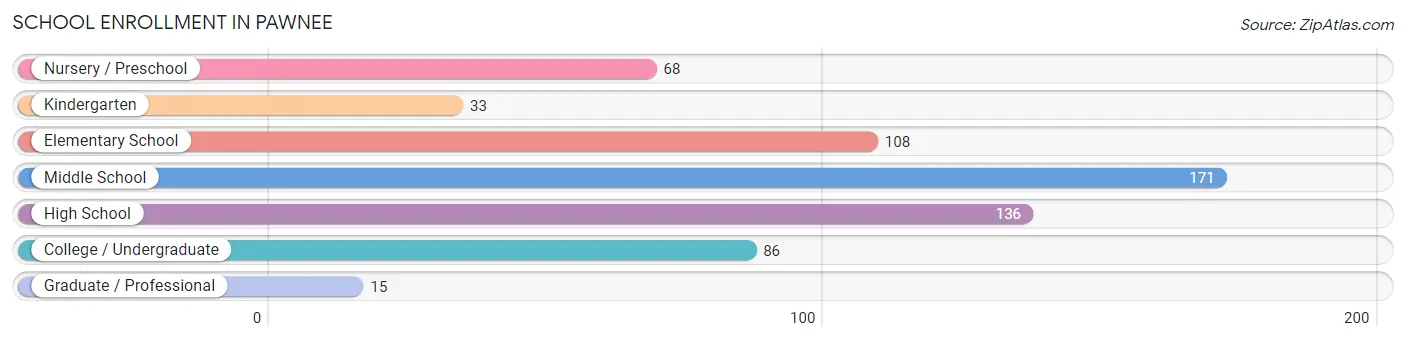
School Enrollment in Pawnee
The most common levels of schooling among the 617 students in Pawnee are middle school (171 | 27.7%), high school (136 | 22.0%), and elementary school (108 | 17.5%).
| School Level | # Students | % Students |
| Nursery / Preschool | 68 | 11.0% |
| Kindergarten | 33 | 5.3% |
| Elementary School | 108 | 17.5% |
| Middle School | 171 | 27.7% |
| High School | 136 | 22.0% |
| College / Undergraduate | 86 | 13.9% |
| Graduate / Professional | 15 | 2.4% |
| Total | 617 | 100.0% |
School Enrollment by Age by Funding Source in Pawnee
Out of a total of 617 students who are enrolled in schools in Pawnee, 45 (7.3%) attend a private institution, while the remaining 572 (92.7%) are enrolled in public schools. The age group of 35 years and over has the highest likelihood of being enrolled in private schools, with 4 (44.4% in the age bracket) enrolled. Conversely, the age group of 25 to 34 year olds has the lowest likelihood of being enrolled in a private school, with 8 (100.0% in the age bracket) attending a public institution.
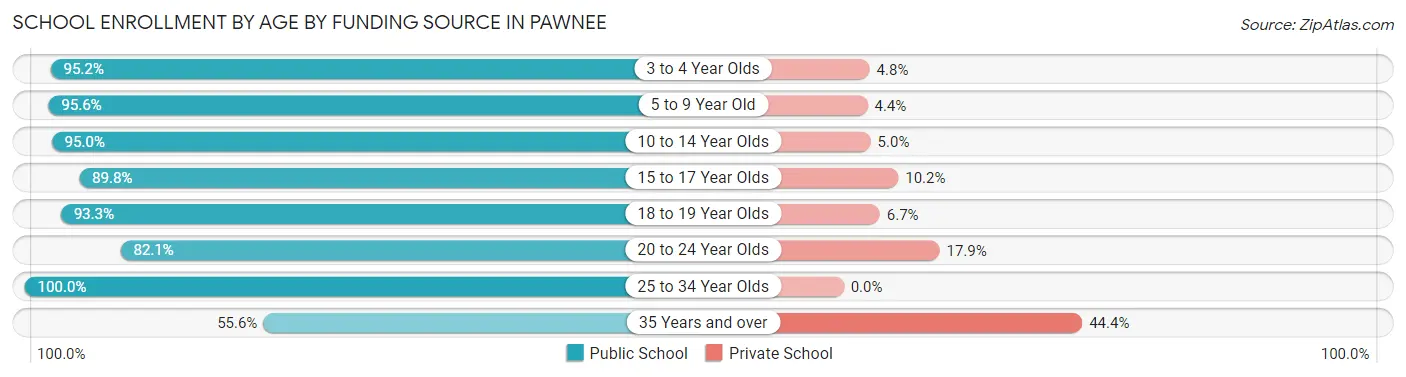
| Age Bracket | Public School | Private School |
| 3 to 4 Year Olds | 59 (95.2%) | 3 (4.8%) |
| 5 to 9 Year Old | 129 (95.6%) | 6 (4.4%) |
| 10 to 14 Year Olds | 189 (95.0%) | 10 (5.0%) |
| 15 to 17 Year Olds | 53 (89.8%) | 6 (10.2%) |
| 18 to 19 Year Olds | 83 (93.3%) | 6 (6.7%) |
| 20 to 24 Year Olds | 46 (82.1%) | 10 (17.9%) |
| 25 to 34 Year Olds | 8 (100.0%) | 0 (0.0%) |
| 35 Years and over | 5 (55.6%) | 4 (44.4%) |
| Total | 572 (92.7%) | 45 (7.3%) |
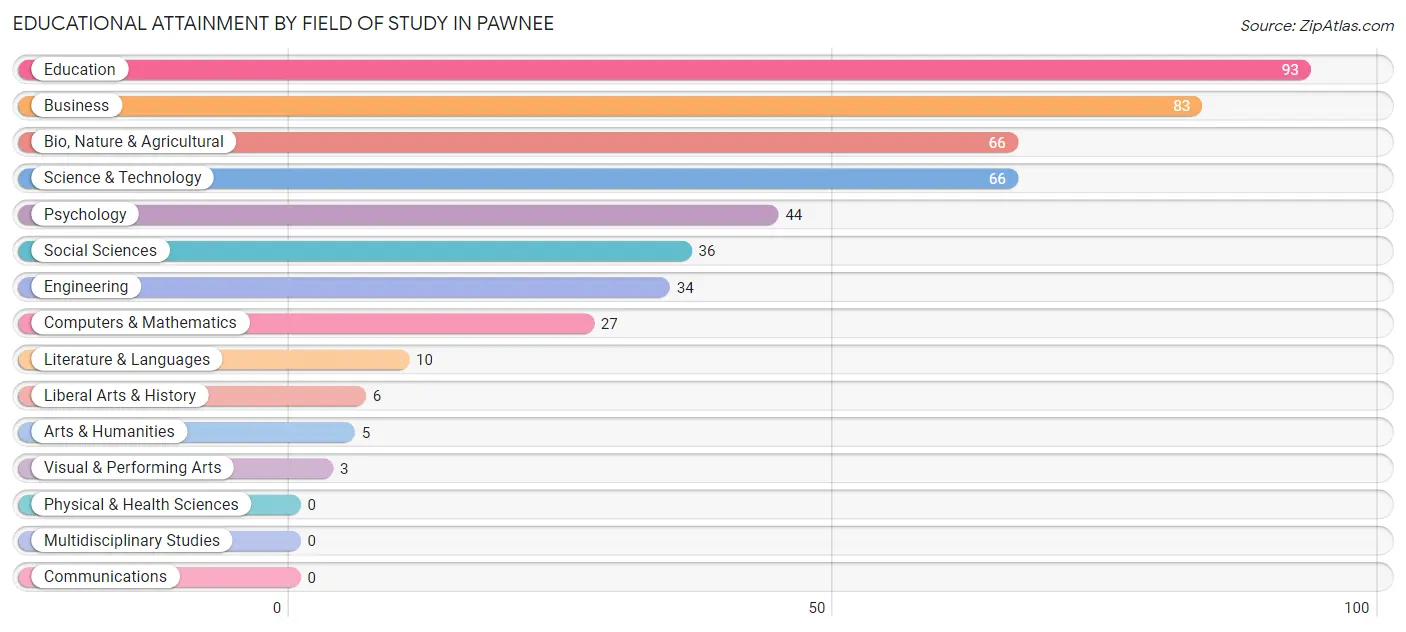
Educational Attainment by Field of Study in Pawnee
Education (93 | 19.7%), business (83 | 17.5%), bio, nature & agricultural (66 | 14.0%), science & technology (66 | 14.0%), and psychology (44 | 9.3%) are the most common fields of study among 473 individuals in Pawnee who have obtained a bachelor's degree or higher.
| Field of Study | # Graduates | % Graduates |
| Computers & Mathematics | 27 | 5.7% |
| Bio, Nature & Agricultural | 66 | 14.0% |
| Physical & Health Sciences | 0 | 0.0% |
| Psychology | 44 | 9.3% |
| Social Sciences | 36 | 7.6% |
| Engineering | 34 | 7.2% |
| Multidisciplinary Studies | 0 | 0.0% |
| Science & Technology | 66 | 14.0% |
| Business | 83 | 17.5% |
| Education | 93 | 19.7% |
| Literature & Languages | 10 | 2.1% |
| Liberal Arts & History | 6 | 1.3% |
| Visual & Performing Arts | 3 | 0.6% |
| Communications | 0 | 0.0% |
| Arts & Humanities | 5 | 1.1% |
| Total | 473 | 100.0% |
Transportation & Commute in Pawnee
Vehicle Availability by Sex in Pawnee
The most prevalent vehicle ownership categories in Pawnee are males with 2 vehicles (279, accounting for 42.3%) and females with 2 vehicles (258, making up 43.1%).
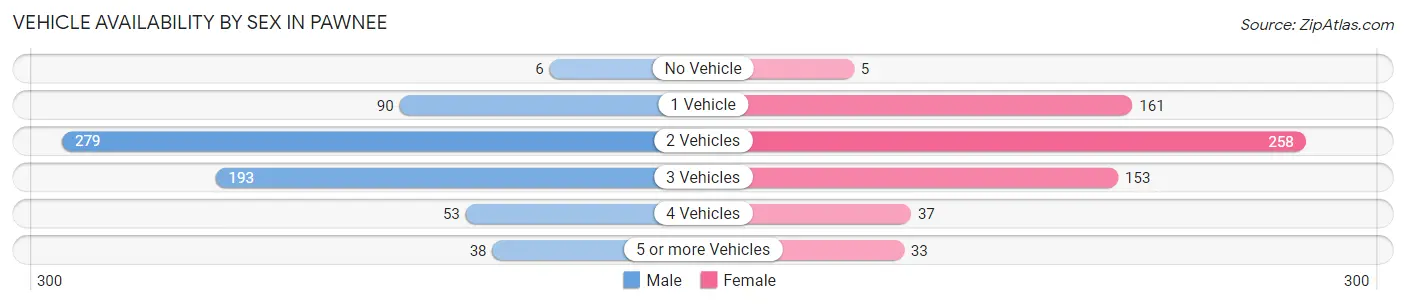
| Vehicles Available | Male | Female |
| No Vehicle | 6 (0.9%) | 5 (0.8%) |
| 1 Vehicle | 90 (13.7%) | 161 (24.9%) |
| 2 Vehicles | 279 (42.3%) | 258 (39.9%) |
| 3 Vehicles | 193 (29.3%) | 153 (23.6%) |
| 4 Vehicles | 53 (8.0%) | 37 (5.7%) |
| 5 or more Vehicles | 38 (5.8%) | 33 (5.1%) |
| Total | 659 (100.0%) | 647 (100.0%) |
Commute Time in Pawnee
The most frequently occuring commute durations in Pawnee are 30 to 34 minutes (376 commuters, 31.4%), 20 to 24 minutes (228 commuters, 19.1%), and 25 to 29 minutes (173 commuters, 14.5%).
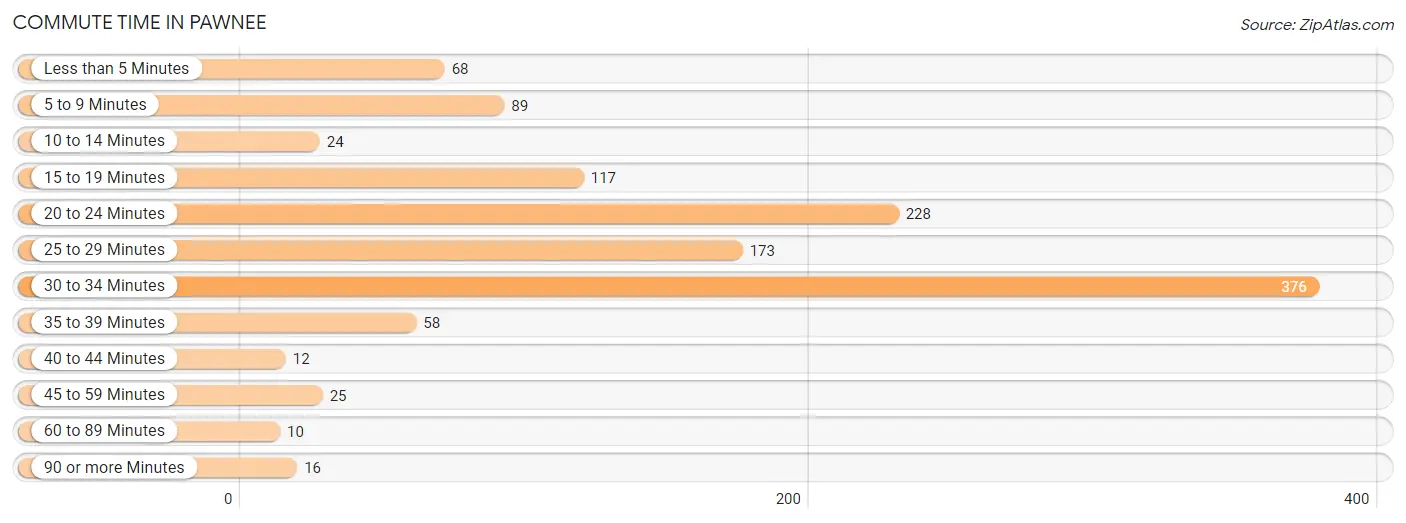
| Commute Time | # Commuters | % Commuters |
| Less than 5 Minutes | 68 | 5.7% |
| 5 to 9 Minutes | 89 | 7.4% |
| 10 to 14 Minutes | 24 | 2.0% |
| 15 to 19 Minutes | 117 | 9.8% |
| 20 to 24 Minutes | 228 | 19.1% |
| 25 to 29 Minutes | 173 | 14.5% |
| 30 to 34 Minutes | 376 | 31.4% |
| 35 to 39 Minutes | 58 | 4.9% |
| 40 to 44 Minutes | 12 | 1.0% |
| 45 to 59 Minutes | 25 | 2.1% |
| 60 to 89 Minutes | 10 | 0.8% |
| 90 or more Minutes | 16 | 1.3% |
Commute Time by Sex in Pawnee
The most common commute times in Pawnee are 30 to 34 minutes (199 commuters, 31.8%) for males and 30 to 34 minutes (177 commuters, 31.0%) for females.
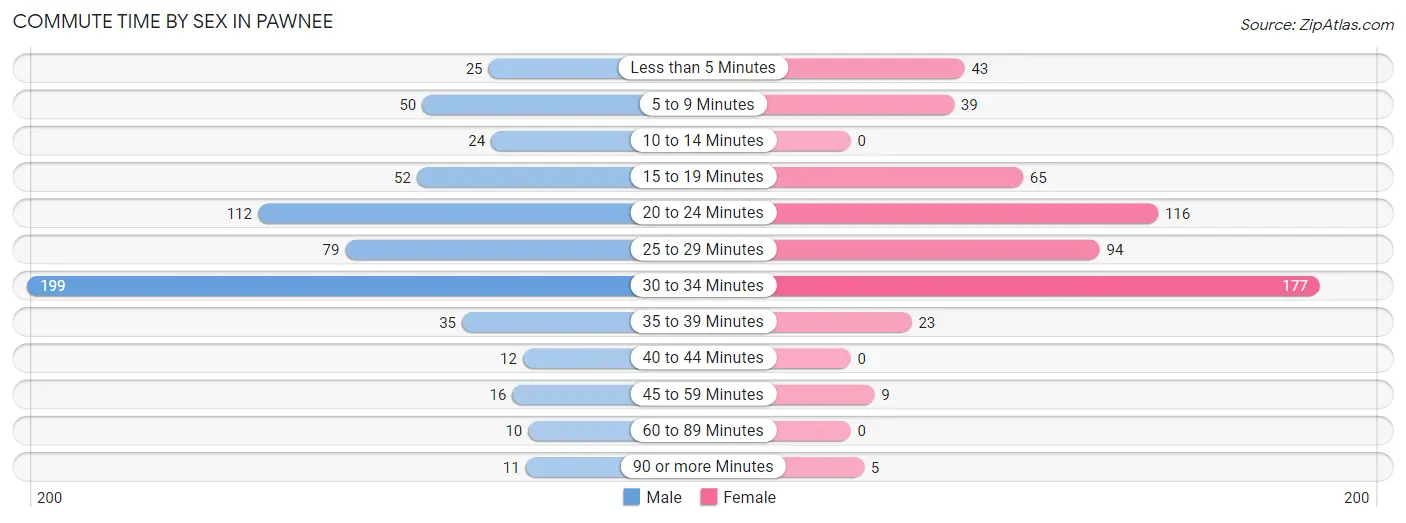
| Commute Time | Male | Female |
| Less than 5 Minutes | 25 (4.0%) | 43 (7.5%) |
| 5 to 9 Minutes | 50 (8.0%) | 39 (6.8%) |
| 10 to 14 Minutes | 24 (3.8%) | 0 (0.0%) |
| 15 to 19 Minutes | 52 (8.3%) | 65 (11.4%) |
| 20 to 24 Minutes | 112 (17.9%) | 116 (20.3%) |
| 25 to 29 Minutes | 79 (12.6%) | 94 (16.5%) |
| 30 to 34 Minutes | 199 (31.8%) | 177 (31.0%) |
| 35 to 39 Minutes | 35 (5.6%) | 23 (4.0%) |
| 40 to 44 Minutes | 12 (1.9%) | 0 (0.0%) |
| 45 to 59 Minutes | 16 (2.6%) | 9 (1.6%) |
| 60 to 89 Minutes | 10 (1.6%) | 0 (0.0%) |
| 90 or more Minutes | 11 (1.8%) | 5 (0.9%) |
Time of Departure to Work by Sex in Pawnee
The most frequent times of departure to work in Pawnee are 6:00 AM to 6:29 AM (108, 17.3%) for males and 7:30 AM to 7:59 AM (141, 24.7%) for females.
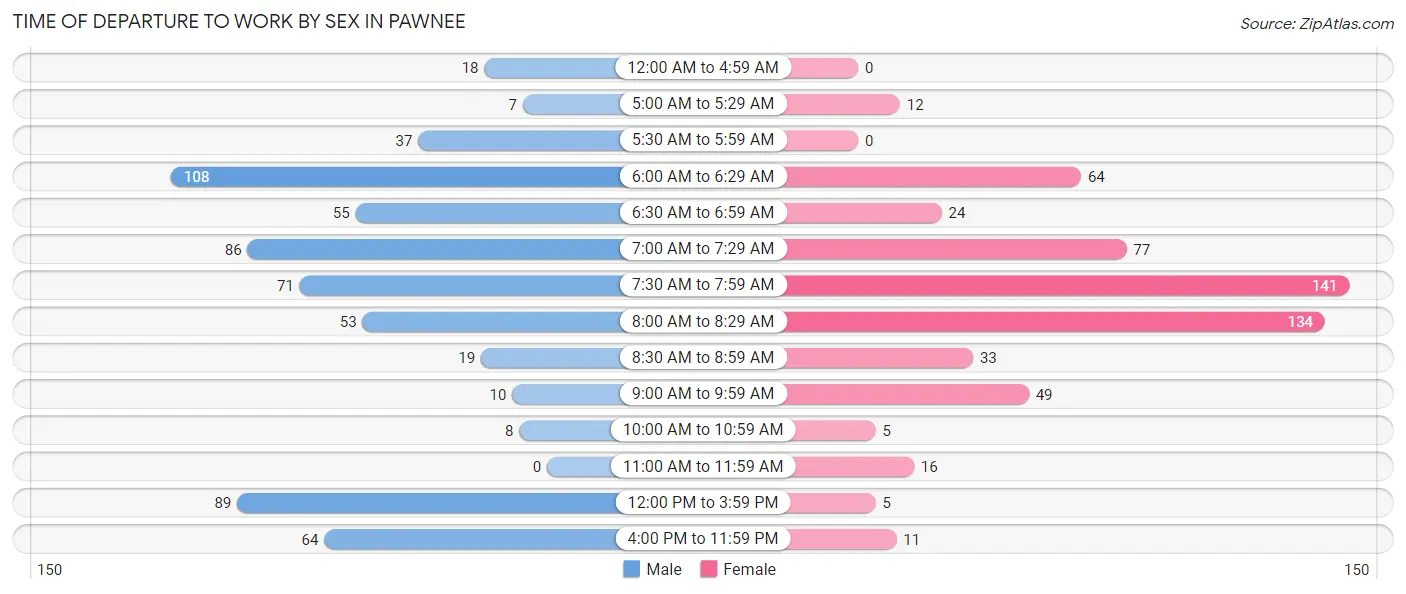
| Time of Departure | Male | Female |
| 12:00 AM to 4:59 AM | 18 (2.9%) | 0 (0.0%) |
| 5:00 AM to 5:29 AM | 7 (1.1%) | 12 (2.1%) |
| 5:30 AM to 5:59 AM | 37 (5.9%) | 0 (0.0%) |
| 6:00 AM to 6:29 AM | 108 (17.3%) | 64 (11.2%) |
| 6:30 AM to 6:59 AM | 55 (8.8%) | 24 (4.2%) |
| 7:00 AM to 7:29 AM | 86 (13.8%) | 77 (13.5%) |
| 7:30 AM to 7:59 AM | 71 (11.4%) | 141 (24.7%) |
| 8:00 AM to 8:29 AM | 53 (8.5%) | 134 (23.5%) |
| 8:30 AM to 8:59 AM | 19 (3.0%) | 33 (5.8%) |
| 9:00 AM to 9:59 AM | 10 (1.6%) | 49 (8.6%) |
| 10:00 AM to 10:59 AM | 8 (1.3%) | 5 (0.9%) |
| 11:00 AM to 11:59 AM | 0 (0.0%) | 16 (2.8%) |
| 12:00 PM to 3:59 PM | 89 (14.2%) | 5 (0.9%) |
| 4:00 PM to 11:59 PM | 64 (10.2%) | 11 (1.9%) |
| Total | 625 (100.0%) | 571 (100.0%) |
Housing Occupancy in Pawnee
Occupancy by Ownership in Pawnee
Of the total 1,115 dwellings in Pawnee, owner-occupied units account for 872 (78.2%), while renter-occupied units make up 243 (21.8%).
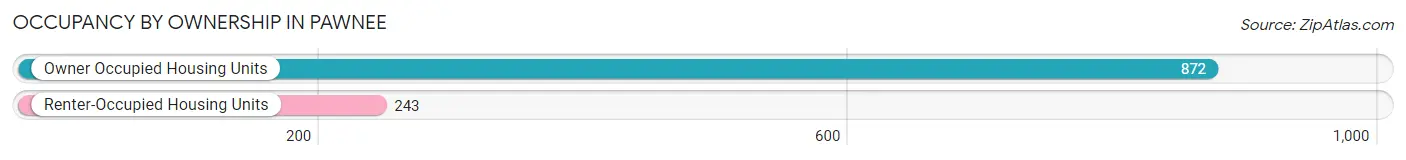
| Occupancy | # Housing Units | % Housing Units |
| Owner Occupied Housing Units | 872 | 78.2% |
| Renter-Occupied Housing Units | 243 | 21.8% |
| Total Occupied Housing Units | 1,115 | 100.0% |
Occupancy by Household Size in Pawnee
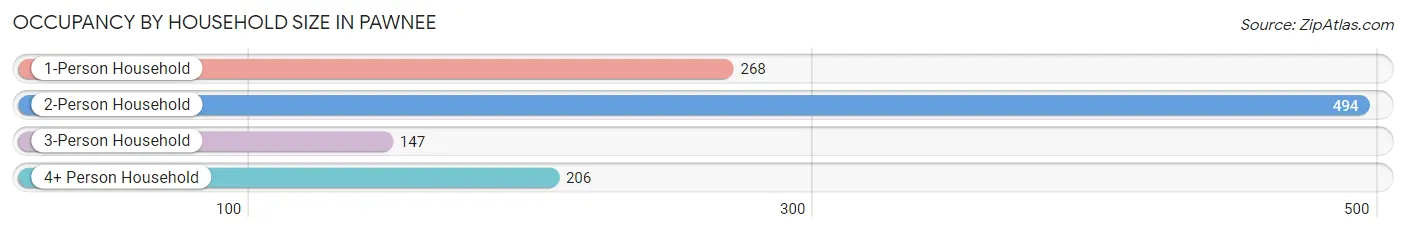
| Household Size | # Housing Units | % Housing Units |
| 1-Person Household | 268 | 24.0% |
| 2-Person Household | 494 | 44.3% |
| 3-Person Household | 147 | 13.2% |
| 4+ Person Household | 206 | 18.5% |
| Total Housing Units | 1,115 | 100.0% |
Occupancy by Ownership by Household Size in Pawnee
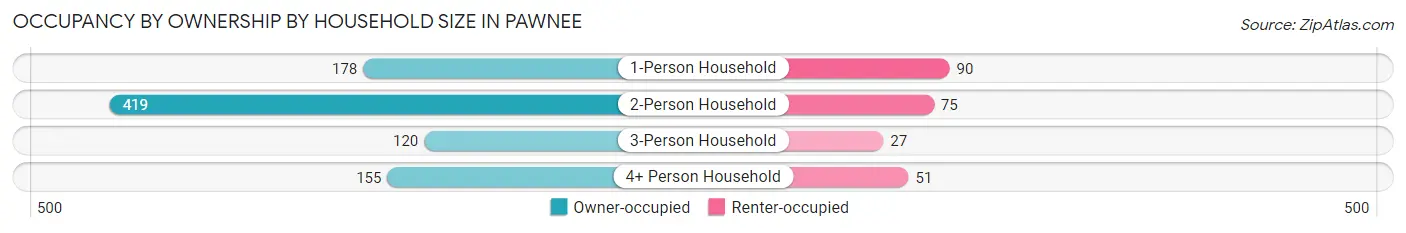
| Household Size | Owner-occupied | Renter-occupied |
| 1-Person Household | 178 (66.4%) | 90 (33.6%) |
| 2-Person Household | 419 (84.8%) | 75 (15.2%) |
| 3-Person Household | 120 (81.6%) | 27 (18.4%) |
| 4+ Person Household | 155 (75.2%) | 51 (24.8%) |
| Total Housing Units | 872 (78.2%) | 243 (21.8%) |
Occupancy by Educational Attainment in Pawnee
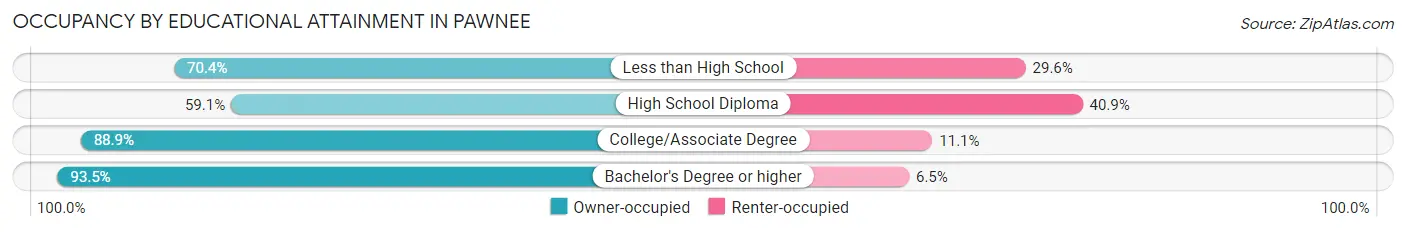
| Household Size | Owner-occupied | Renter-occupied |
| Less than High School | 38 (70.4%) | 16 (29.6%) |
| High School Diploma | 244 (59.1%) | 169 (40.9%) |
| College/Associate Degree | 303 (88.9%) | 38 (11.1%) |
| Bachelor's Degree or higher | 287 (93.5%) | 20 (6.5%) |
Occupancy by Age of Householder in Pawnee
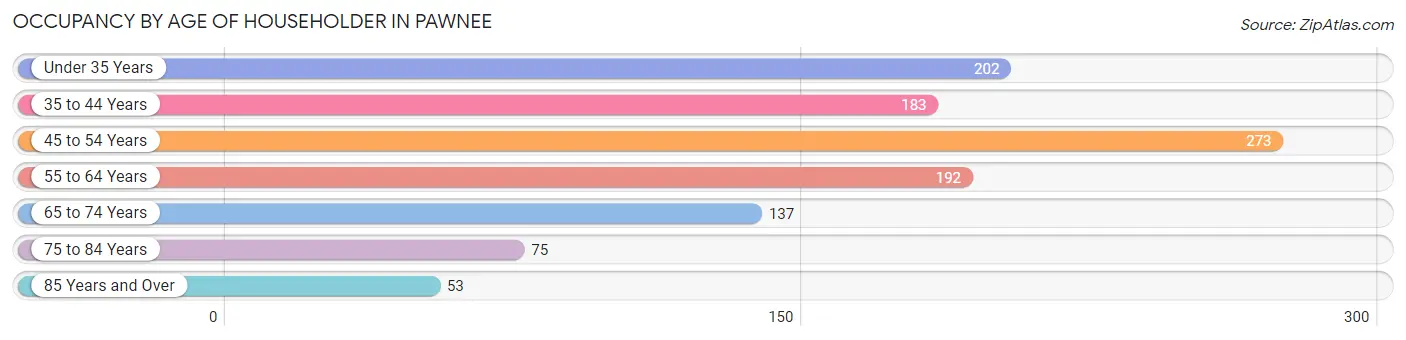
| Age Bracket | # Households | % Households |
| Under 35 Years | 202 | 18.1% |
| 35 to 44 Years | 183 | 16.4% |
| 45 to 54 Years | 273 | 24.5% |
| 55 to 64 Years | 192 | 17.2% |
| 65 to 74 Years | 137 | 12.3% |
| 75 to 84 Years | 75 | 6.7% |
| 85 Years and Over | 53 | 4.8% |
| Total | 1,115 | 100.0% |
Housing Finances in Pawnee
Median Income by Occupancy in Pawnee
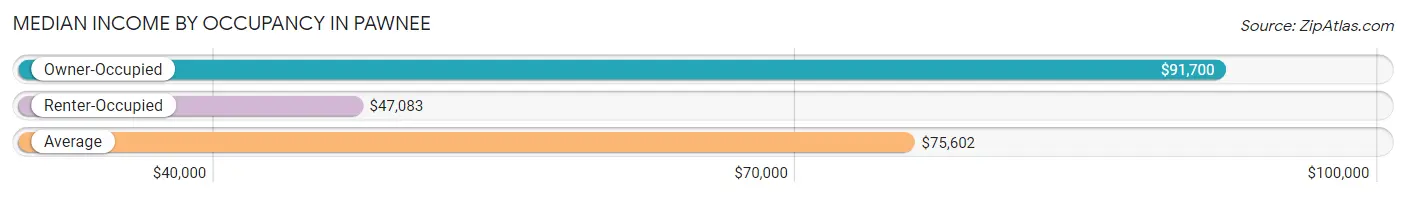
| Occupancy Type | # Households | Median Income |
| Owner-Occupied | 872 (78.2%) | $91,700 |
| Renter-Occupied | 243 (21.8%) | $47,083 |
| Average | 1,115 (100.0%) | $75,602 |
Occupancy by Householder Income Bracket in Pawnee
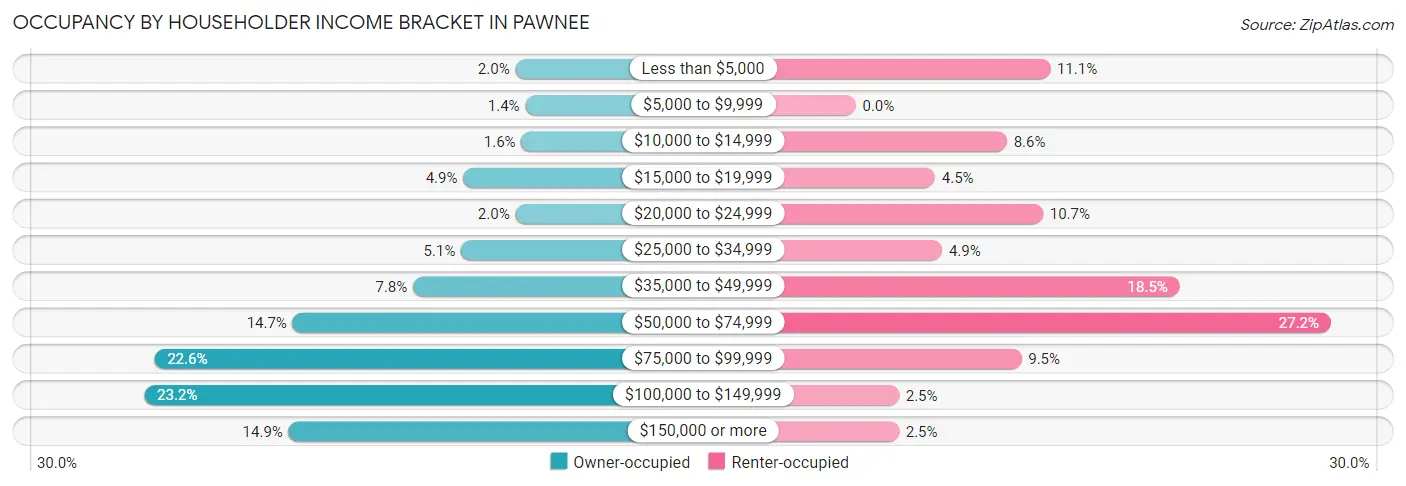
| Income Bracket | Owner-occupied | Renter-occupied |
| Less than $5,000 | 17 (1.9%) | 27 (11.1%) |
| $5,000 to $9,999 | 12 (1.4%) | 0 (0.0%) |
| $10,000 to $14,999 | 14 (1.6%) | 21 (8.6%) |
| $15,000 to $19,999 | 43 (4.9%) | 11 (4.5%) |
| $20,000 to $24,999 | 17 (1.9%) | 26 (10.7%) |
| $25,000 to $34,999 | 44 (5.1%) | 12 (4.9%) |
| $35,000 to $49,999 | 68 (7.8%) | 45 (18.5%) |
| $50,000 to $74,999 | 128 (14.7%) | 66 (27.2%) |
| $75,000 to $99,999 | 197 (22.6%) | 23 (9.5%) |
| $100,000 to $149,999 | 202 (23.2%) | 6 (2.5%) |
| $150,000 or more | 130 (14.9%) | 6 (2.5%) |
| Total | 872 (100.0%) | 243 (100.0%) |
Monthly Housing Cost Tiers in Pawnee
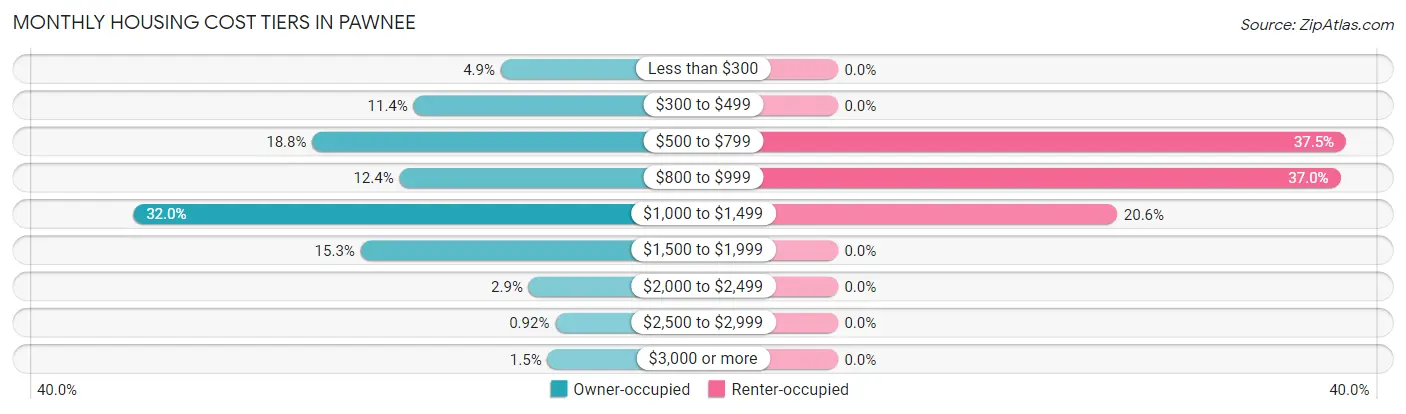
| Monthly Cost | Owner-occupied | Renter-occupied |
| Less than $300 | 43 (4.9%) | 0 (0.0%) |
| $300 to $499 | 99 (11.4%) | 0 (0.0%) |
| $500 to $799 | 164 (18.8%) | 91 (37.4%) |
| $800 to $999 | 108 (12.4%) | 90 (37.0%) |
| $1,000 to $1,499 | 279 (32.0%) | 50 (20.6%) |
| $1,500 to $1,999 | 133 (15.2%) | 0 (0.0%) |
| $2,000 to $2,499 | 25 (2.9%) | 0 (0.0%) |
| $2,500 to $2,999 | 8 (0.9%) | 0 (0.0%) |
| $3,000 or more | 13 (1.5%) | 0 (0.0%) |
| Total | 872 (100.0%) | 243 (100.0%) |
Physical Housing Characteristics in Pawnee
Housing Structures in Pawnee
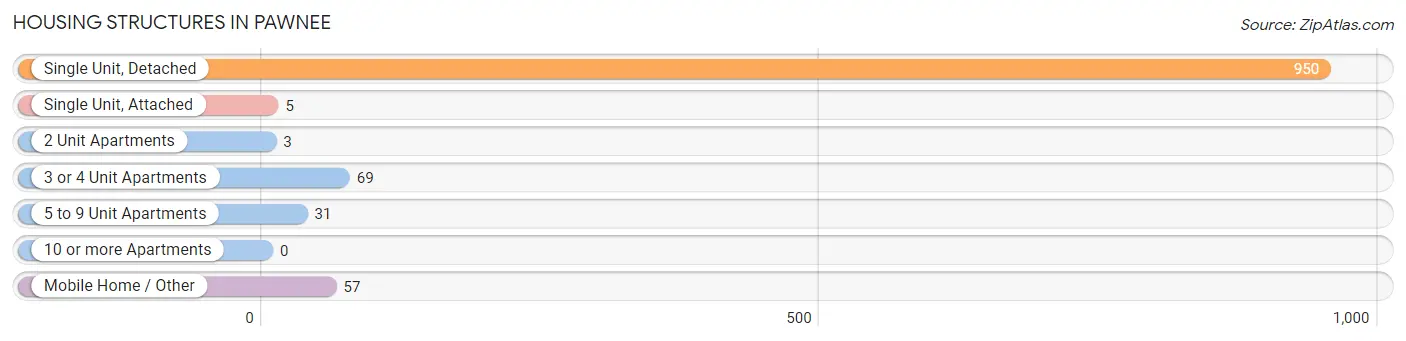
| Structure Type | # Housing Units | % Housing Units |
| Single Unit, Detached | 950 | 85.2% |
| Single Unit, Attached | 5 | 0.4% |
| 2 Unit Apartments | 3 | 0.3% |
| 3 or 4 Unit Apartments | 69 | 6.2% |
| 5 to 9 Unit Apartments | 31 | 2.8% |
| 10 or more Apartments | 0 | 0.0% |
| Mobile Home / Other | 57 | 5.1% |
| Total | 1,115 | 100.0% |
Housing Structures by Occupancy in Pawnee
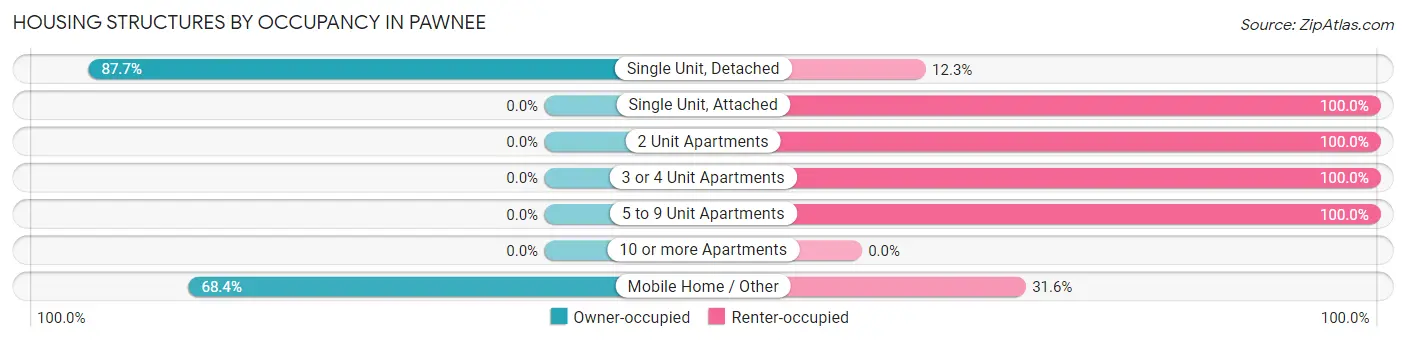
| Structure Type | Owner-occupied | Renter-occupied |
| Single Unit, Detached | 833 (87.7%) | 117 (12.3%) |
| Single Unit, Attached | 0 (0.0%) | 5 (100.0%) |
| 2 Unit Apartments | 0 (0.0%) | 3 (100.0%) |
| 3 or 4 Unit Apartments | 0 (0.0%) | 69 (100.0%) |
| 5 to 9 Unit Apartments | 0 (0.0%) | 31 (100.0%) |
| 10 or more Apartments | 0 (0.0%) | 0 (0.0%) |
| Mobile Home / Other | 39 (68.4%) | 18 (31.6%) |
| Total | 872 (78.2%) | 243 (21.8%) |
Housing Structures by Number of Rooms in Pawnee
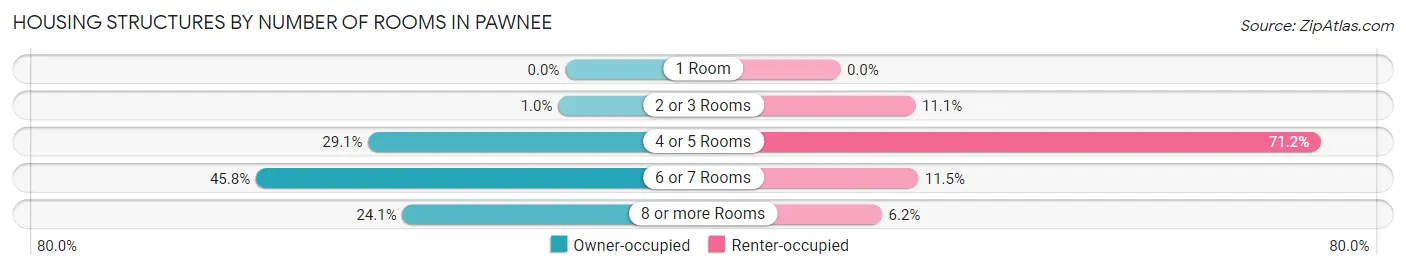
| Number of Rooms | Owner-occupied | Renter-occupied |
| 1 Room | 0 (0.0%) | 0 (0.0%) |
| 2 or 3 Rooms | 9 (1.0%) | 27 (11.1%) |
| 4 or 5 Rooms | 254 (29.1%) | 173 (71.2%) |
| 6 or 7 Rooms | 399 (45.8%) | 28 (11.5%) |
| 8 or more Rooms | 210 (24.1%) | 15 (6.2%) |
| Total | 872 (100.0%) | 243 (100.0%) |
Housing Structure by Heating Type in Pawnee
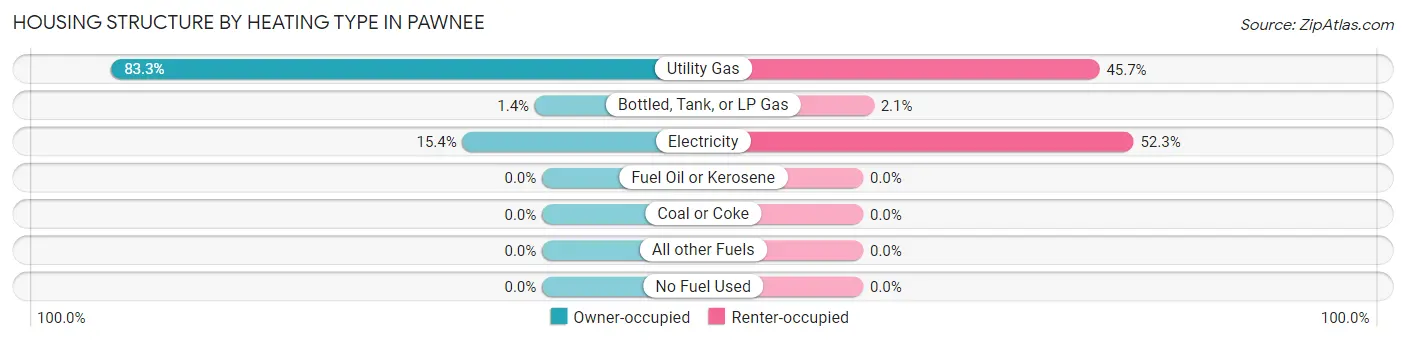
| Heating Type | Owner-occupied | Renter-occupied |
| Utility Gas | 726 (83.3%) | 111 (45.7%) |
| Bottled, Tank, or LP Gas | 12 (1.4%) | 5 (2.1%) |
| Electricity | 134 (15.4%) | 127 (52.3%) |
| Fuel Oil or Kerosene | 0 (0.0%) | 0 (0.0%) |
| Coal or Coke | 0 (0.0%) | 0 (0.0%) |
| All other Fuels | 0 (0.0%) | 0 (0.0%) |
| No Fuel Used | 0 (0.0%) | 0 (0.0%) |
| Total | 872 (100.0%) | 243 (100.0%) |
Household Vehicle Usage in Pawnee
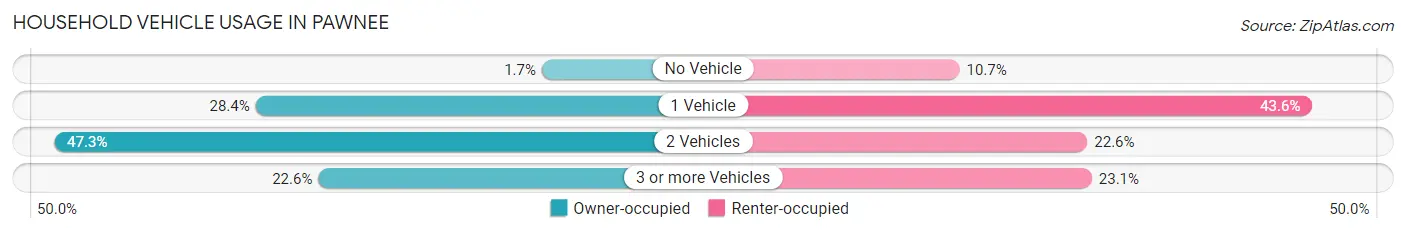
| Vehicles per Household | Owner-occupied | Renter-occupied |
| No Vehicle | 15 (1.7%) | 26 (10.7%) |
| 1 Vehicle | 248 (28.4%) | 106 (43.6%) |
| 2 Vehicles | 412 (47.2%) | 55 (22.6%) |
| 3 or more Vehicles | 197 (22.6%) | 56 (23.1%) |
| Total | 872 (100.0%) | 243 (100.0%) |
Real Estate & Mortgages in Pawnee
Real Estate and Mortgage Overview in Pawnee
| Characteristic | Without Mortgage | With Mortgage |
| Housing Units | 369 | 503 |
| Median Property Value | $133,100 | $153,400 |
| Median Household Income | $76,375 | $66 |
| Monthly Housing Costs | $574 | $13 |
| Real Estate Taxes | $2,436 | $11 |
Property Value by Mortgage Status in Pawnee
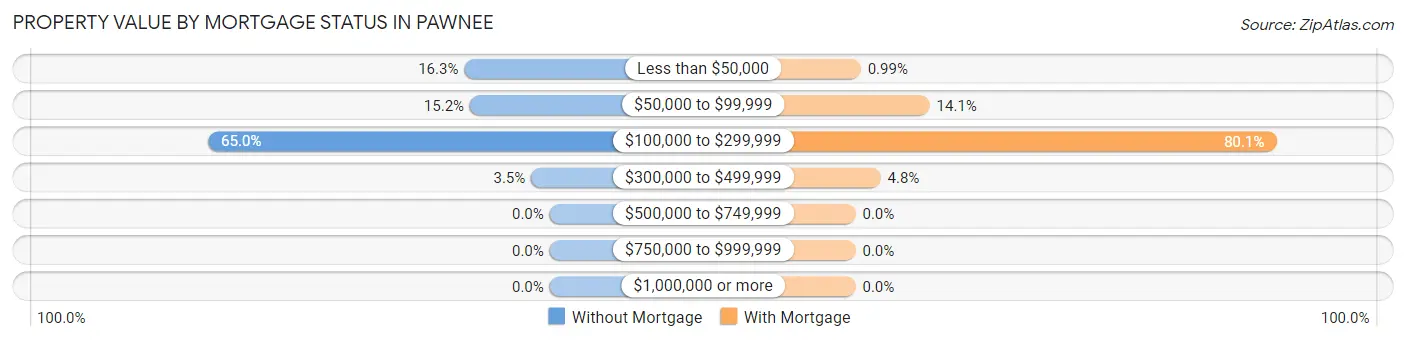
| Property Value | Without Mortgage | With Mortgage |
| Less than $50,000 | 60 (16.3%) | 5 (1.0%) |
| $50,000 to $99,999 | 56 (15.2%) | 71 (14.1%) |
| $100,000 to $299,999 | 240 (65.0%) | 403 (80.1%) |
| $300,000 to $499,999 | 13 (3.5%) | 24 (4.8%) |
| $500,000 to $749,999 | 0 (0.0%) | 0 (0.0%) |
| $750,000 to $999,999 | 0 (0.0%) | 0 (0.0%) |
| $1,000,000 or more | 0 (0.0%) | 0 (0.0%) |
| Total | 369 (100.0%) | 503 (100.0%) |
Household Income by Mortgage Status in Pawnee
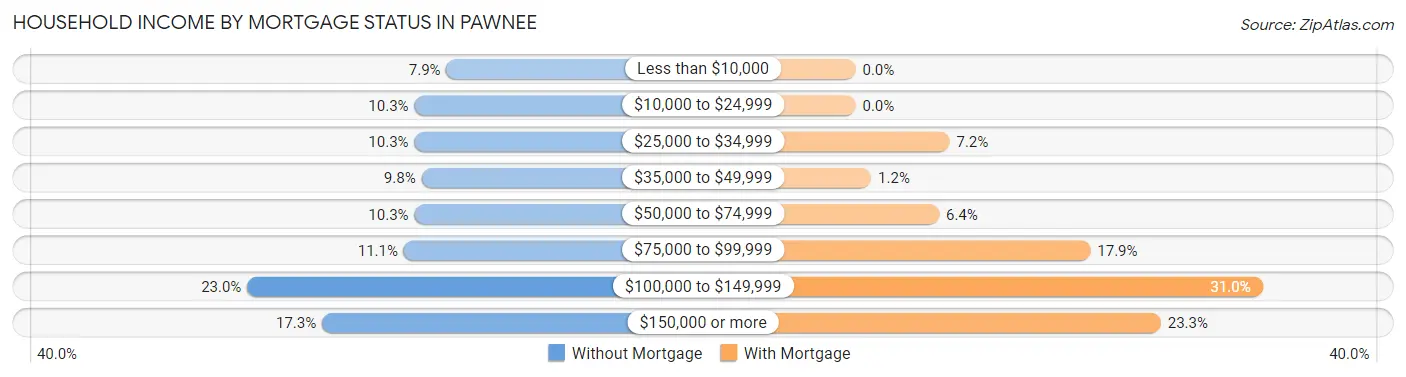
| Household Income | Without Mortgage | With Mortgage |
| Less than $10,000 | 29 (7.9%) | 0 (0.0%) |
| $10,000 to $24,999 | 38 (10.3%) | 0 (0.0%) |
| $25,000 to $34,999 | 38 (10.3%) | 36 (7.2%) |
| $35,000 to $49,999 | 36 (9.8%) | 6 (1.2%) |
| $50,000 to $74,999 | 38 (10.3%) | 32 (6.4%) |
| $75,000 to $99,999 | 41 (11.1%) | 90 (17.9%) |
| $100,000 to $149,999 | 85 (23.0%) | 156 (31.0%) |
| $150,000 or more | 64 (17.3%) | 117 (23.3%) |
| Total | 369 (100.0%) | 503 (100.0%) |
Property Value to Household Income Ratio in Pawnee
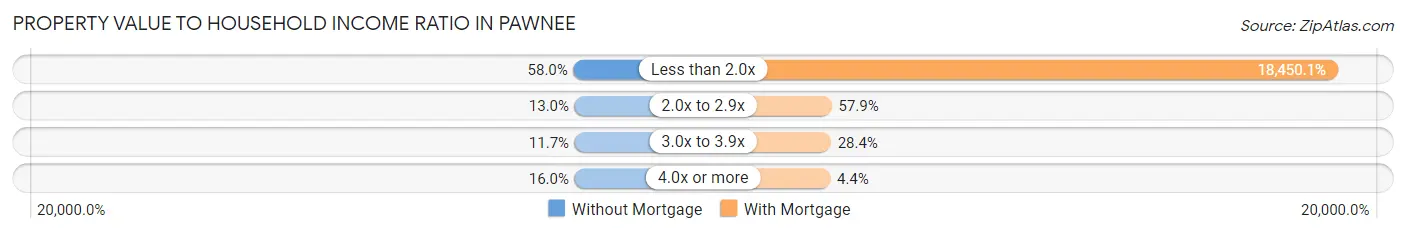
| Value-to-Income Ratio | Without Mortgage | With Mortgage |
| Less than 2.0x | 214 (58.0%) | 92,804 (18,450.1%) |
| 2.0x to 2.9x | 48 (13.0%) | 291 (57.9%) |
| 3.0x to 3.9x | 43 (11.7%) | 143 (28.4%) |
| 4.0x or more | 59 (16.0%) | 22 (4.4%) |
| Total | 369 (100.0%) | 503 (100.0%) |
Real Estate Taxes by Mortgage Status in Pawnee
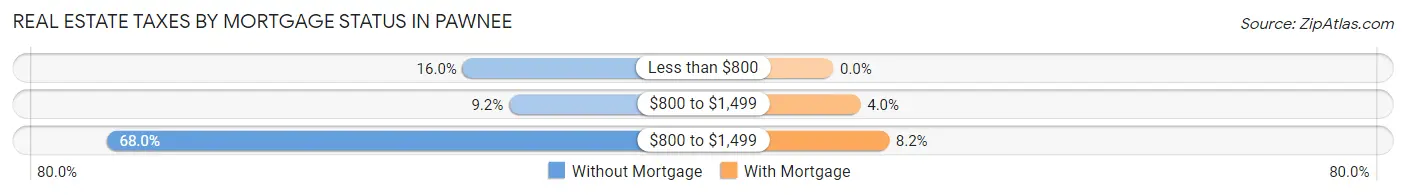
| Property Taxes | Without Mortgage | With Mortgage |
| Less than $800 | 59 (16.0%) | 0 (0.0%) |
| $800 to $1,499 | 34 (9.2%) | 20 (4.0%) |
| $800 to $1,499 | 251 (68.0%) | 41 (8.2%) |
| Total | 369 (100.0%) | 503 (100.0%) |
Health & Disability in Pawnee
Health Insurance Coverage by Age in Pawnee
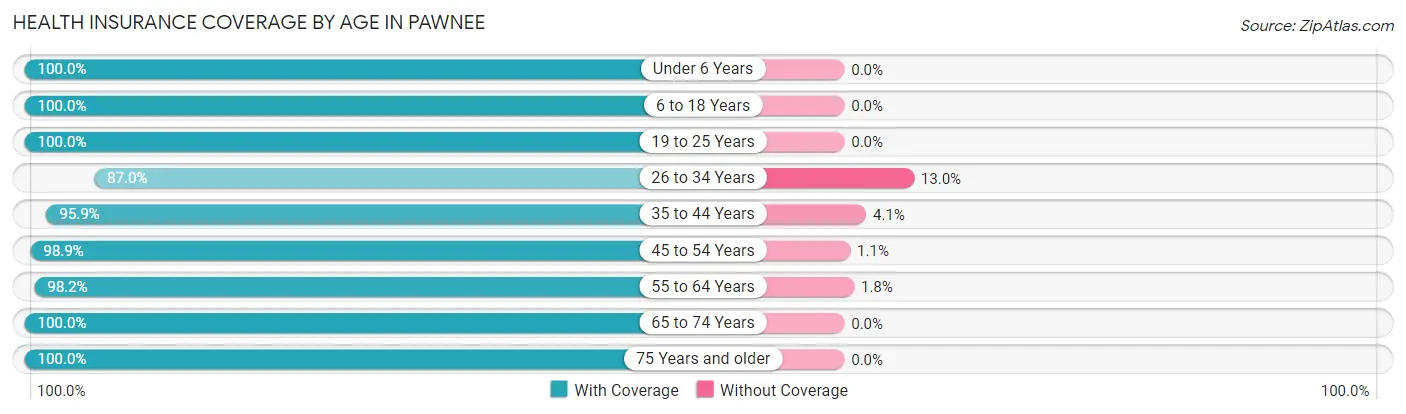
| Age Bracket | With Coverage | Without Coverage |
| Under 6 Years | 149 (100.0%) | 0 (0.0%) |
| 6 to 18 Years | 464 (100.0%) | 0 (0.0%) |
| 19 to 25 Years | 309 (100.0%) | 0 (0.0%) |
| 26 to 34 Years | 181 (87.0%) | 27 (13.0%) |
| 35 to 44 Years | 283 (95.9%) | 12 (4.1%) |
| 45 to 54 Years | 453 (98.9%) | 5 (1.1%) |
| 55 to 64 Years | 323 (98.2%) | 6 (1.8%) |
| 65 to 74 Years | 238 (100.0%) | 0 (0.0%) |
| 75 Years and older | 176 (100.0%) | 0 (0.0%) |
| Total | 2,576 (98.1%) | 50 (1.9%) |
Health Insurance Coverage by Citizenship Status in Pawnee
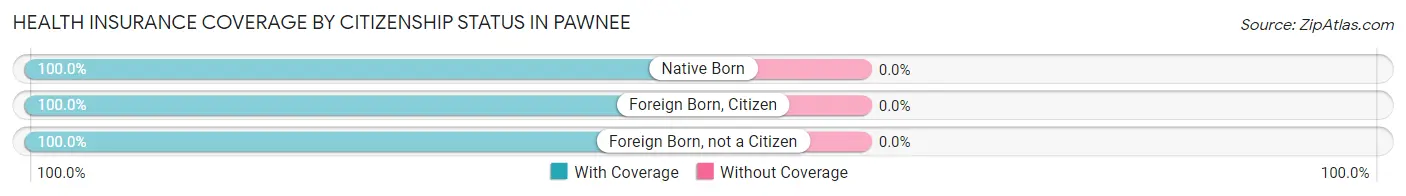
| Citizenship Status | With Coverage | Without Coverage |
| Native Born | 149 (100.0%) | 0 (0.0%) |
| Foreign Born, Citizen | 464 (100.0%) | 0 (0.0%) |
| Foreign Born, not a Citizen | 309 (100.0%) | 0 (0.0%) |
Health Insurance Coverage by Household Income in Pawnee
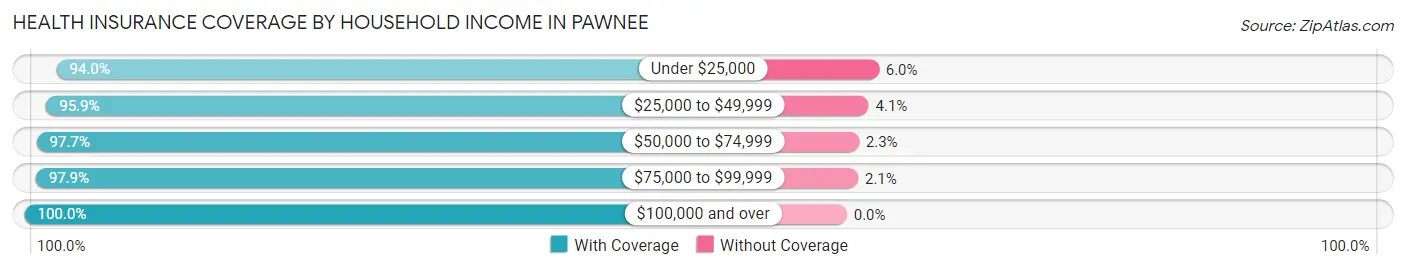
| Household Income | With Coverage | Without Coverage |
| Under $25,000 | 267 (94.0%) | 17 (6.0%) |
| $25,000 to $49,999 | 282 (95.9%) | 12 (4.1%) |
| $50,000 to $74,999 | 476 (97.7%) | 11 (2.3%) |
| $75,000 to $99,999 | 464 (97.9%) | 10 (2.1%) |
| $100,000 and over | 1,087 (100.0%) | 0 (0.0%) |
Public vs Private Health Insurance Coverage by Age in Pawnee
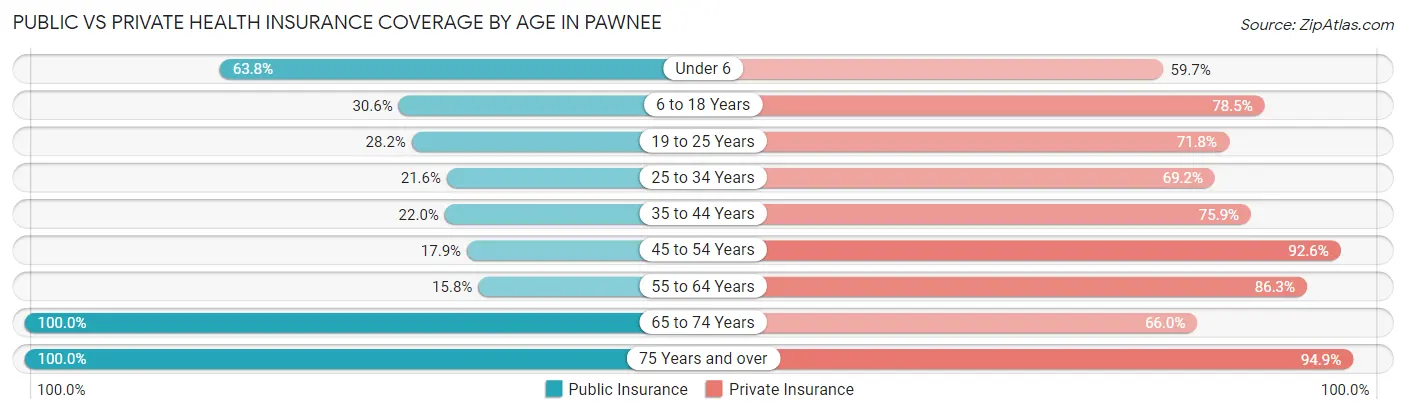
| Age Bracket | Public Insurance | Private Insurance |
| Under 6 | 95 (63.8%) | 89 (59.7%) |
| 6 to 18 Years | 142 (30.6%) | 364 (78.4%) |
| 19 to 25 Years | 87 (28.2%) | 222 (71.8%) |
| 25 to 34 Years | 45 (21.6%) | 144 (69.2%) |
| 35 to 44 Years | 65 (22.0%) | 224 (75.9%) |
| 45 to 54 Years | 82 (17.9%) | 424 (92.6%) |
| 55 to 64 Years | 52 (15.8%) | 284 (86.3%) |
| 65 to 74 Years | 238 (100.0%) | 157 (66.0%) |
| 75 Years and over | 176 (100.0%) | 167 (94.9%) |
| Total | 982 (37.4%) | 2,075 (79.0%) |
Disability Status by Sex by Age in Pawnee
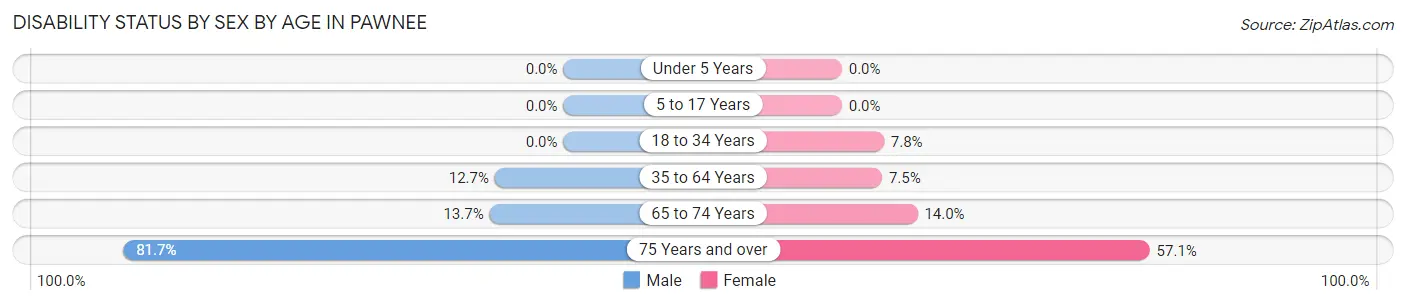
| Age Bracket | Male | Female |
| Under 5 Years | 0 (0.0%) | 0 (0.0%) |
| 5 to 17 Years | 0 (0.0%) | 0 (0.0%) |
| 18 to 34 Years | 0 (0.0%) | 23 (7.8%) |
| 35 to 64 Years | 66 (12.7%) | 42 (7.5%) |
| 65 to 74 Years | 17 (13.7%) | 16 (14.0%) |
| 75 Years and over | 58 (81.7%) | 60 (57.1%) |
Disability Class by Sex by Age in Pawnee
Disability Class: Hearing Difficulty
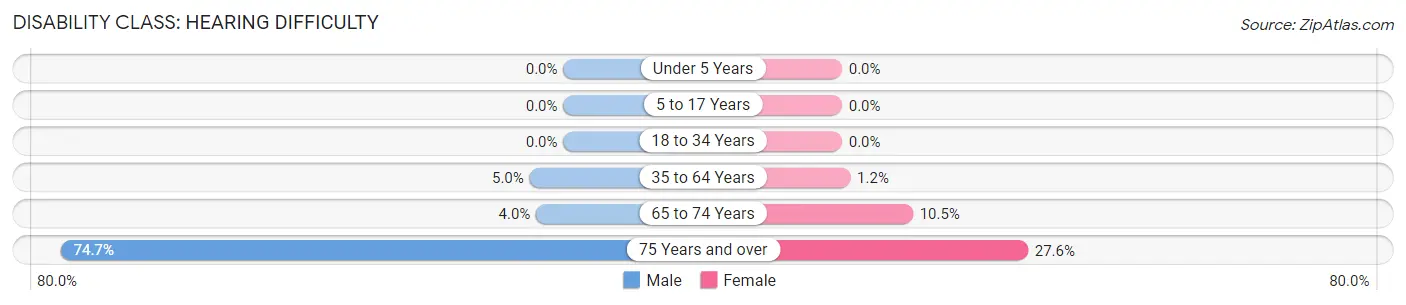
| Age Bracket | Male | Female |
| Under 5 Years | 0 (0.0%) | 0 (0.0%) |
| 5 to 17 Years | 0 (0.0%) | 0 (0.0%) |
| 18 to 34 Years | 0 (0.0%) | 0 (0.0%) |
| 35 to 64 Years | 26 (5.0%) | 7 (1.2%) |
| 65 to 74 Years | 5 (4.0%) | 12 (10.5%) |
| 75 Years and over | 53 (74.7%) | 29 (27.6%) |
Disability Class: Vision Difficulty
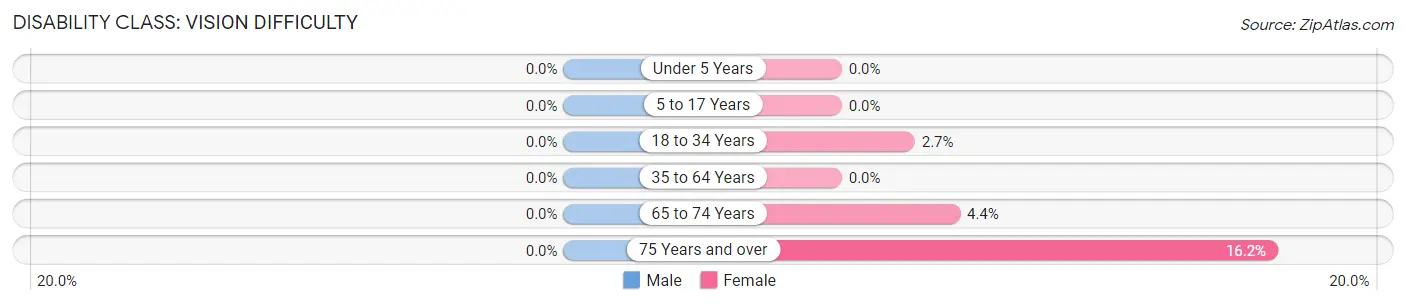
| Age Bracket | Male | Female |
| Under 5 Years | 0 (0.0%) | 0 (0.0%) |
| 5 to 17 Years | 0 (0.0%) | 0 (0.0%) |
| 18 to 34 Years | 0 (0.0%) | 8 (2.7%) |
| 35 to 64 Years | 0 (0.0%) | 0 (0.0%) |
| 65 to 74 Years | 0 (0.0%) | 5 (4.4%) |
| 75 Years and over | 0 (0.0%) | 17 (16.2%) |
Disability Class: Cognitive Difficulty
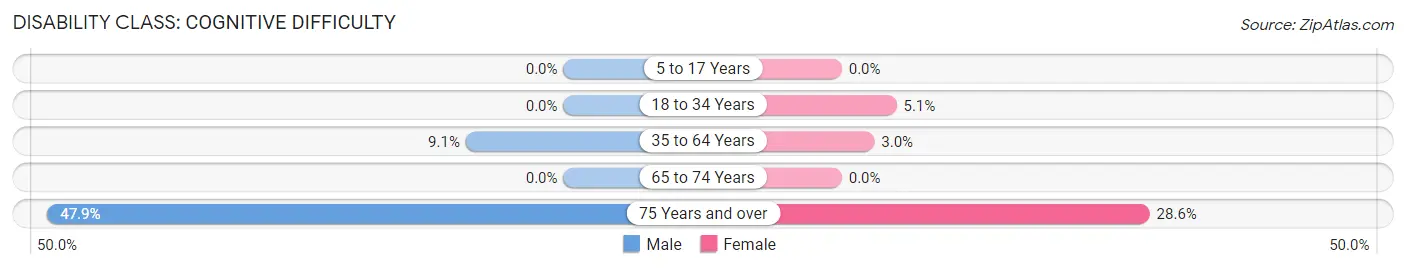
| Age Bracket | Male | Female |
| 5 to 17 Years | 0 (0.0%) | 0 (0.0%) |
| 18 to 34 Years | 0 (0.0%) | 15 (5.1%) |
| 35 to 64 Years | 47 (9.1%) | 17 (3.0%) |
| 65 to 74 Years | 0 (0.0%) | 0 (0.0%) |
| 75 Years and over | 34 (47.9%) | 30 (28.6%) |
Disability Class: Ambulatory Difficulty
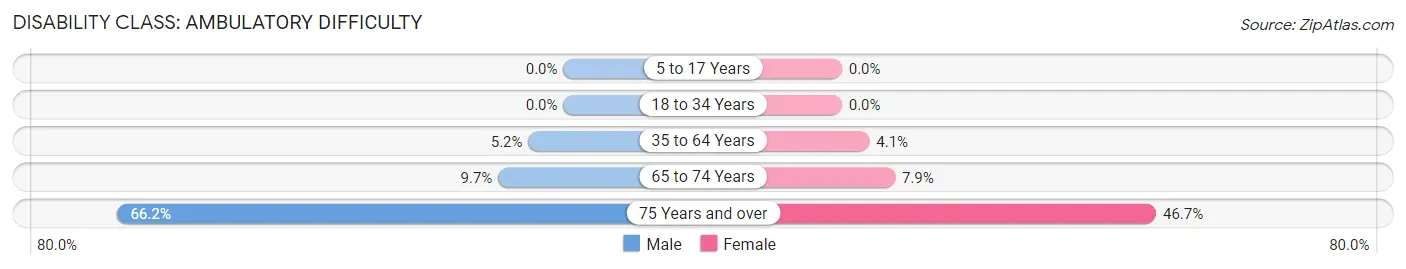
| Age Bracket | Male | Female |
| 5 to 17 Years | 0 (0.0%) | 0 (0.0%) |
| 18 to 34 Years | 0 (0.0%) | 0 (0.0%) |
| 35 to 64 Years | 27 (5.2%) | 23 (4.1%) |
| 65 to 74 Years | 12 (9.7%) | 9 (7.9%) |
| 75 Years and over | 47 (66.2%) | 49 (46.7%) |
Disability Class: Self-Care Difficulty
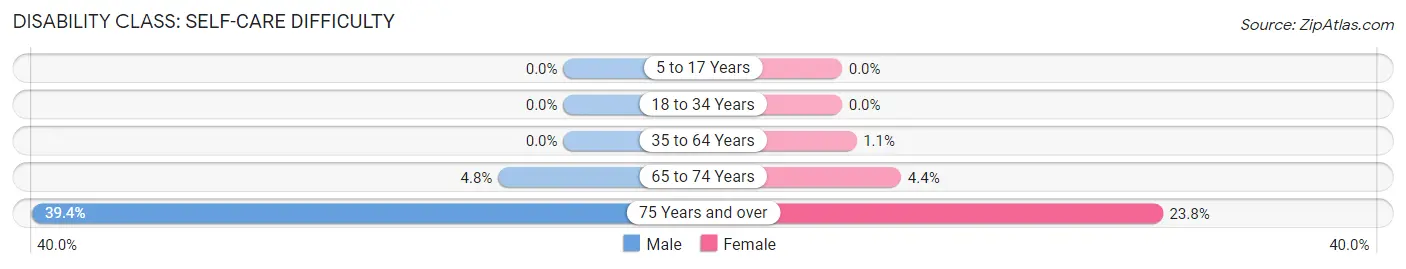
| Age Bracket | Male | Female |
| 5 to 17 Years | 0 (0.0%) | 0 (0.0%) |
| 18 to 34 Years | 0 (0.0%) | 0 (0.0%) |
| 35 to 64 Years | 0 (0.0%) | 6 (1.1%) |
| 65 to 74 Years | 6 (4.8%) | 5 (4.4%) |
| 75 Years and over | 28 (39.4%) | 25 (23.8%) |
Technology Access in Pawnee
Computing Device Access in Pawnee
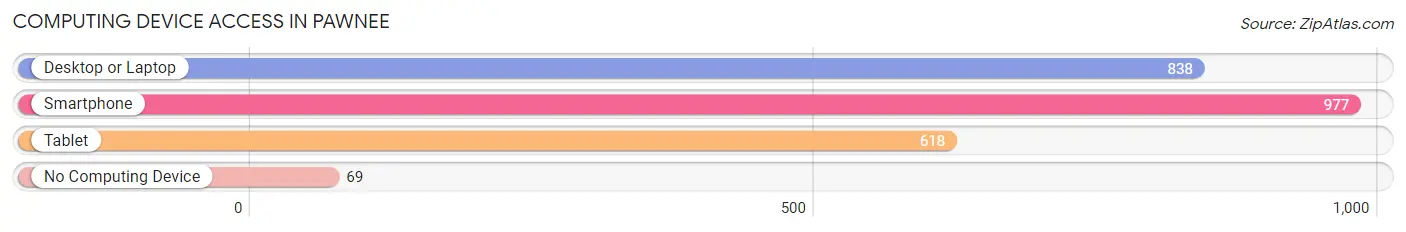
| Device Type | # Households | % Households |
| Desktop or Laptop | 838 | 75.2% |
| Smartphone | 977 | 87.6% |
| Tablet | 618 | 55.4% |
| No Computing Device | 69 | 6.2% |
| Total | 1,115 | 100.0% |
Internet Access in Pawnee
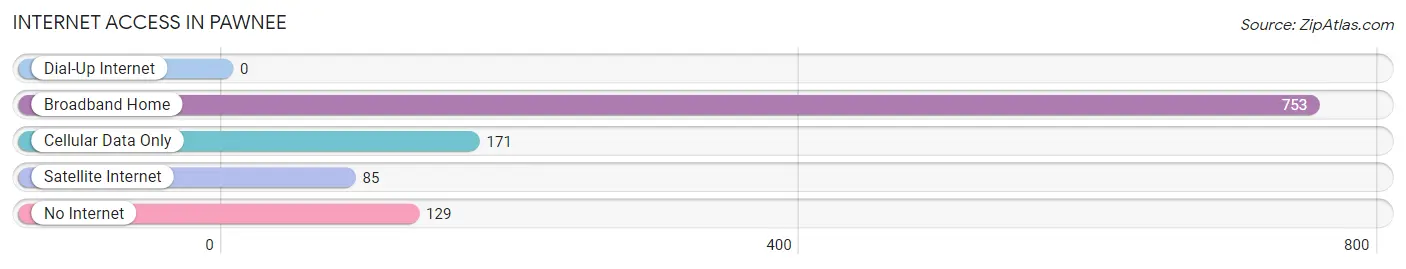
| Internet Type | # Households | % Households |
| Dial-Up Internet | 0 | 0.0% |
| Broadband Home | 753 | 67.5% |
| Cellular Data Only | 171 | 15.3% |
| Satellite Internet | 85 | 7.6% |
| No Internet | 129 | 11.6% |
| Total | 1,115 | 100.0% |
Pawnee Summary
Pawnee, Illinois is a small town located in the central part of the state, about 25 miles south of Springfield. It is part of the Sangamon County and is home to a population of just over 2,000 people. The town was founded in 1854 and has a rich history that is still evident today.
Geography
Pawnee is located in the central part of Illinois, about 25 miles south of Springfield. It is part of the Sangamon County and is home to a population of just over 2,000 people. The town is situated on the Sangamon River, which is a tributary of the Illinois River. The town is surrounded by rolling hills and farmland, and is located in the heart of the Midwest.
The climate in Pawnee is typical of the Midwest, with hot summers and cold winters. The average temperature in the summer is around 80 degrees Fahrenheit, while the average temperature in the winter is around 30 degrees Fahrenheit. The town receives an average of 40 inches of precipitation each year, with most of it falling in the spring and summer months.
Economy
Pawnee’s economy is largely based on agriculture and manufacturing. The town is home to several large farms, which produce a variety of crops, including corn, soybeans, and wheat. The town also has several manufacturing plants, which produce a variety of products, including furniture, clothing, and automotive parts.
The town also has a thriving tourism industry, with many visitors coming to the area to enjoy the natural beauty of the area. The town is home to several parks, including the Pawnee State Park, which offers camping, fishing, and hiking opportunities. The town also has several restaurants, shops, and other attractions that draw visitors from all over the state.
Demographics
As of the 2010 census, the population of Pawnee was 2,072. The town is predominantly white, with 92.3% of the population identifying as such. The remaining population is made up of African Americans (3.2%), Hispanics (2.2%), and other races (2.3%).
The median household income in Pawnee is $45,813, which is slightly lower than the national average. The median age of the population is 40.7 years, which is slightly higher than the national average. The town has a higher than average poverty rate, with 17.2% of the population living below the poverty line.
Conclusion
Pawnee, Illinois is a small town located in the central part of the state, about 25 miles south of Springfield. It is part of the Sangamon County and is home to a population of just over 2,000 people. The town was founded in 1854 and has a rich history that is still evident today. The town’s economy is largely based on agriculture and manufacturing, and it also has a thriving tourism industry. The population of Pawnee is predominantly white, with a median household income of $45,813 and a median age of 40.7 years. The town has a higher than average poverty rate, with 17.2% of the population living below the poverty line.
Common Questions
What is Per Capita Income in Pawnee?
Per Capita income in Pawnee is $36,112.
What is the Median Family Income in Pawnee?
Median Family Income in Pawnee is $90,000.
What is the Median Household income in Pawnee?
Median Household Income in Pawnee is $75,602.
What is Income or Wage Gap in Pawnee?
Income or Wage Gap in Pawnee is 14.9%.
Women in Pawnee earn 85.1 cents for every dollar earned by a man.
What is Family Income Deficit in Pawnee?
Family Income Deficit in Pawnee is $10,336.
Families that are below poverty line in Pawnee earn $10,336 less on average than the poverty threshold level.
What is Inequality or Gini Index in Pawnee?
Inequality or Gini Index in Pawnee is 0.39.
What is the Total Population of Pawnee?
Total Population of Pawnee is 2,626.
What is the Total Male Population of Pawnee?
Total Male Population of Pawnee is 1,309.
What is the Total Female Population of Pawnee?
Total Female Population of Pawnee is 1,317.
What is the Ratio of Males per 100 Females in Pawnee?
There are 99.39 Males per 100 Females in Pawnee.
What is the Ratio of Females per 100 Males in Pawnee?
There are 100.61 Females per 100 Males in Pawnee.
What is the Median Population Age in Pawnee?
Median Population Age in Pawnee is 40.0 Years.
What is the Average Family Size in Pawnee
Average Family Size in Pawnee is 2.8 People.
What is the Average Household Size in Pawnee
Average Household Size in Pawnee is 2.4 People.
How Large is the Labor Force in Pawnee?
There are 1,349 People in the Labor Forcein in Pawnee.
What is the Percentage of People in the Labor Force in Pawnee?
63.3% of People are in the Labor Force in Pawnee.
What is the Unemployment Rate in Pawnee?
Unemployment Rate in Pawnee is 3.2%.