Westchester, IL Map & Demographics
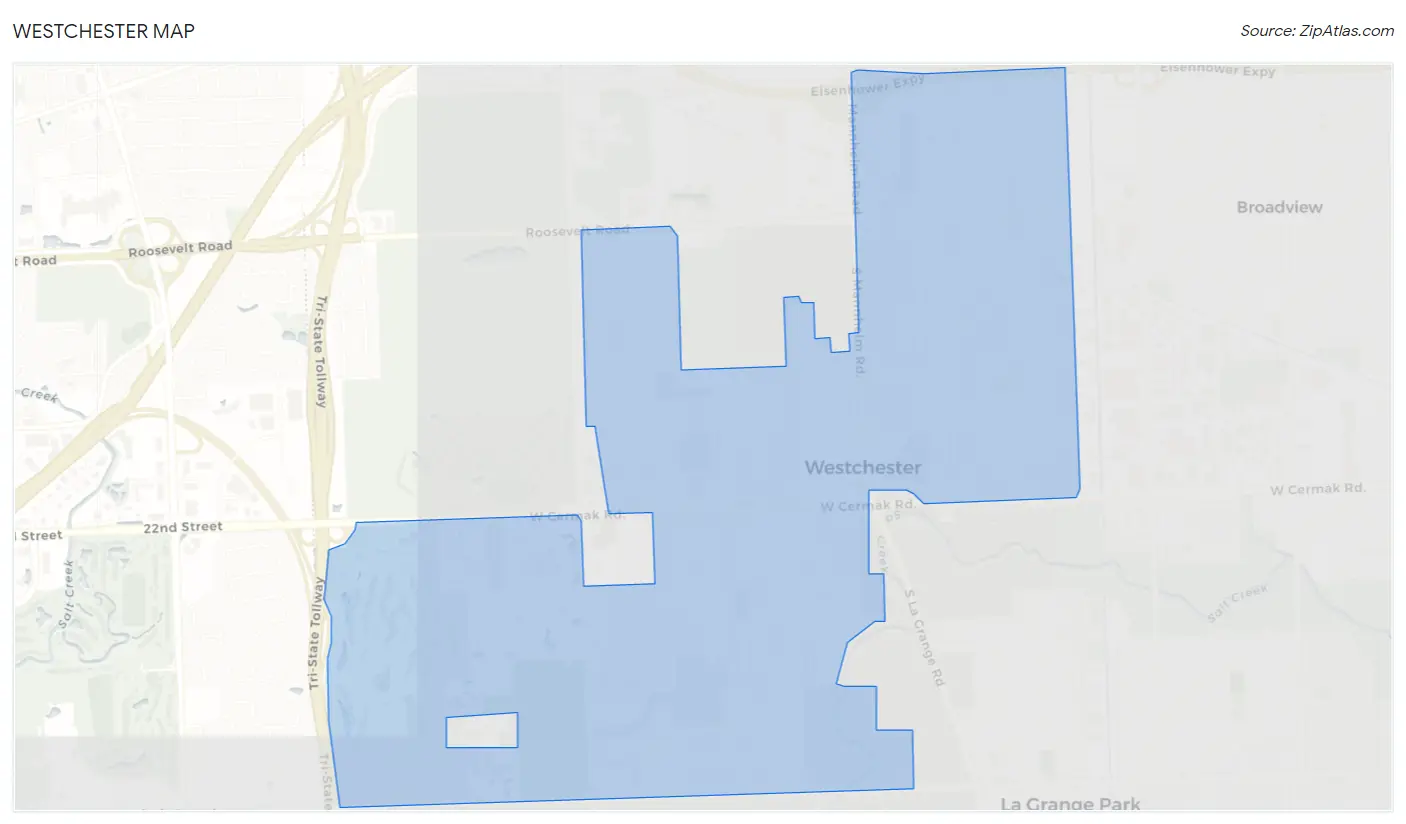
Westchester Map
Westchester Overview
$50,889
PER CAPITA INCOME
$116,300
AVG FAMILY INCOME
$101,414
AVG HOUSEHOLD INCOME
29.2%
WAGE / INCOME GAP [ % ]
70.8¢/ $1
WAGE / INCOME GAP [ $ ]
0.38
INEQUALITY / GINI INDEX
16,694
TOTAL POPULATION
7,617
MALE POPULATION
9,077
FEMALE POPULATION
83.92
MALES / 100 FEMALES
119.17
FEMALES / 100 MALES
51.7
MEDIAN AGE
2.9
AVG FAMILY SIZE
2.3
AVG HOUSEHOLD SIZE
9,343
LABOR FORCE [ PEOPLE ]
63.5%
PERCENT IN LABOR FORCE
5.4%
UNEMPLOYMENT RATE
Westchester Zip Codes
Income in Westchester
Income Overview in Westchester
Per Capita Income in Westchester is $50,889, while median incomes of families and households are $116,300 and $101,414 respectively.
| Characteristic | Number | Measure |
| Per Capita Income | 16,694 | $50,889 |
| Median Family Income | 4,824 | $116,300 |
| Mean Family Income | 4,824 | $136,969 |
| Median Household Income | 7,145 | $101,414 |
| Mean Household Income | 7,145 | $116,745 |
| Income Deficit | 4,824 | $0 |
| Wage / Income Gap (%) | 16,694 | 29.20% |
| Wage / Income Gap ($) | 16,694 | 70.80¢ per $1 |
| Gini / Inequality Index | 16,694 | 0.38 |
Earnings by Sex in Westchester
Average Earnings in Westchester are $59,070, $70,467 for men and $49,894 for women, a difference of 29.2%.
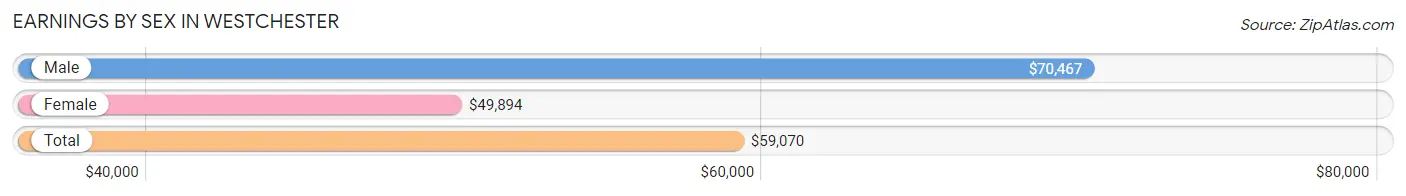
| Sex | Number | Average Earnings |
| Male | 4,614 (49.9%) | $70,467 |
| Female | 4,636 (50.1%) | $49,894 |
| Total | 9,250 (100.0%) | $59,070 |
Earnings by Sex by Income Bracket in Westchester
The most common earnings brackets in Westchester are $100,000+ for men (1,543 | 33.4%) and $75,000 to $99,999 for women (784 | 16.9%).
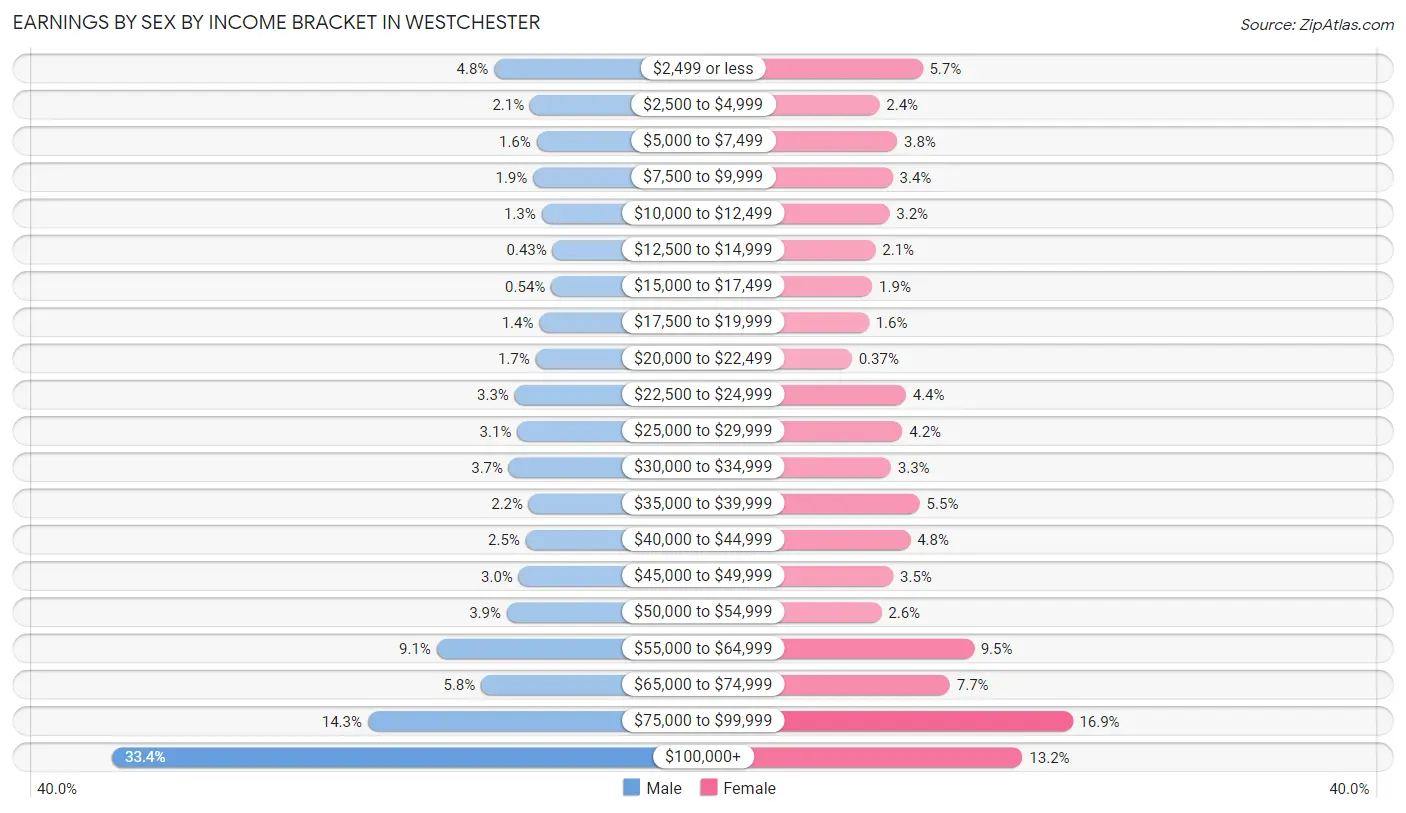
| Income | Male | Female |
| $2,499 or less | 222 (4.8%) | 263 (5.7%) |
| $2,500 to $4,999 | 98 (2.1%) | 113 (2.4%) |
| $5,000 to $7,499 | 75 (1.6%) | 175 (3.8%) |
| $7,500 to $9,999 | 87 (1.9%) | 159 (3.4%) |
| $10,000 to $12,499 | 58 (1.3%) | 148 (3.2%) |
| $12,500 to $14,999 | 20 (0.4%) | 99 (2.1%) |
| $15,000 to $17,499 | 25 (0.5%) | 88 (1.9%) |
| $17,500 to $19,999 | 66 (1.4%) | 76 (1.6%) |
| $20,000 to $22,499 | 79 (1.7%) | 17 (0.4%) |
| $22,500 to $24,999 | 151 (3.3%) | 205 (4.4%) |
| $25,000 to $29,999 | 142 (3.1%) | 193 (4.2%) |
| $30,000 to $34,999 | 171 (3.7%) | 153 (3.3%) |
| $35,000 to $39,999 | 102 (2.2%) | 253 (5.5%) |
| $40,000 to $44,999 | 113 (2.5%) | 220 (4.8%) |
| $45,000 to $49,999 | 137 (3.0%) | 161 (3.5%) |
| $50,000 to $54,999 | 178 (3.9%) | 120 (2.6%) |
| $55,000 to $64,999 | 421 (9.1%) | 441 (9.5%) |
| $65,000 to $74,999 | 267 (5.8%) | 358 (7.7%) |
| $75,000 to $99,999 | 659 (14.3%) | 784 (16.9%) |
| $100,000+ | 1,543 (33.4%) | 610 (13.2%) |
| Total | 4,614 (100.0%) | 4,636 (100.0%) |
Earnings by Sex by Educational Attainment in Westchester
Average earnings in Westchester are $76,097 for men and $58,519 for women, a difference of 23.1%. Men with an educational attainment of bachelor's degree enjoy the highest average annual earnings of $105,846, while those with less than high school education earn the least with $34,063. Women with an educational attainment of graduate degree earn the most with the average annual earnings of $86,941, while those with high school diploma education have the smallest earnings of $37,292.
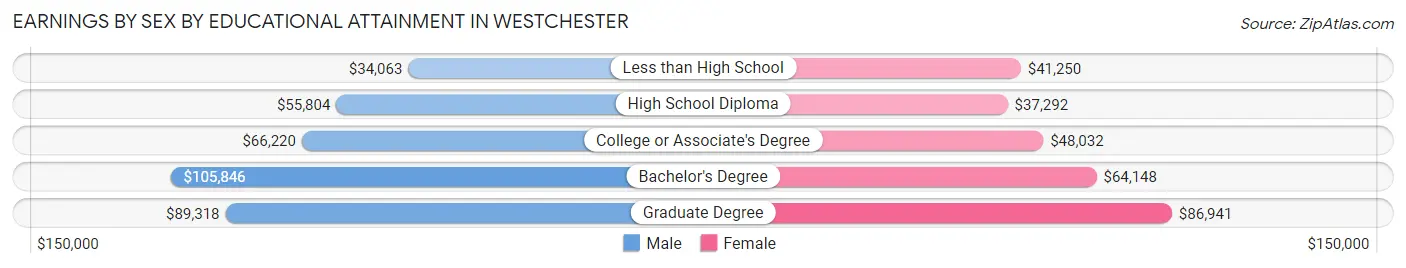
| Educational Attainment | Male Income | Female Income |
| Less than High School | $34,063 | $41,250 |
| High School Diploma | $55,804 | $37,292 |
| College or Associate's Degree | $66,220 | $48,032 |
| Bachelor's Degree | $105,846 | $64,148 |
| Graduate Degree | $89,318 | $86,941 |
| Total | $76,097 | $58,519 |
Family Income in Westchester
Family Income Brackets in Westchester
According to the Westchester family income data, there are 1,447 families falling into the $100,000 to $149,999 income range, which is the most common income bracket and makes up 30.0% of all families. Conversely, the less than $10,000 income bracket is the least frequent group with only 24 families (0.5%) belonging to this category.
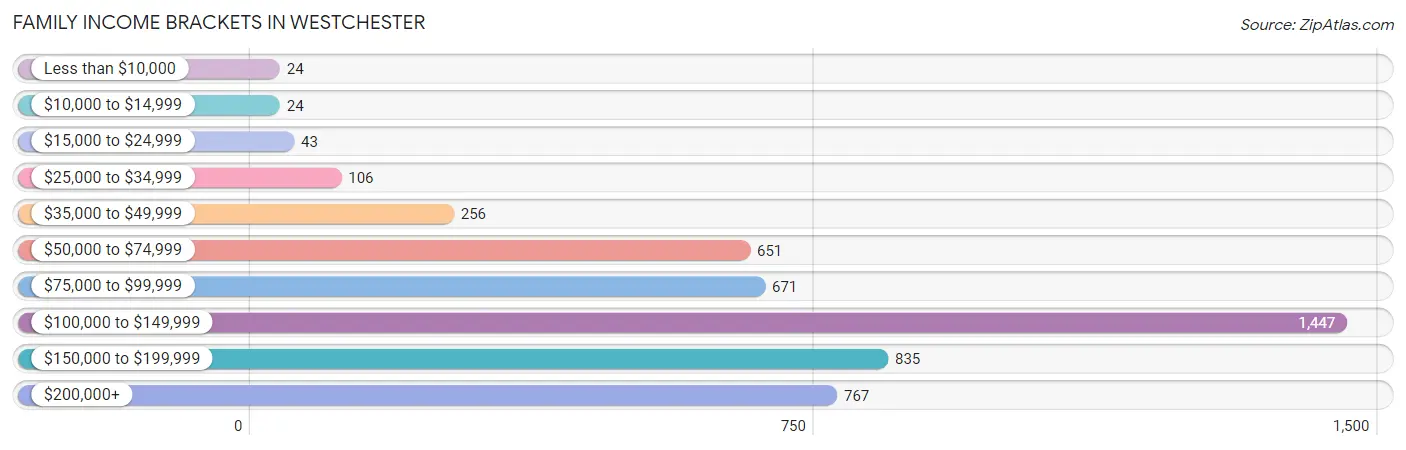
| Income Bracket | # Families | % Families |
| Less than $10,000 | 24 | 0.5% |
| $10,000 to $14,999 | 24 | 0.5% |
| $15,000 to $24,999 | 43 | 0.9% |
| $25,000 to $34,999 | 106 | 2.2% |
| $35,000 to $49,999 | 256 | 5.3% |
| $50,000 to $74,999 | 651 | 13.5% |
| $75,000 to $99,999 | 671 | 13.9% |
| $100,000 to $149,999 | 1,447 | 30.0% |
| $150,000 to $199,999 | 835 | 17.3% |
| $200,000+ | 767 | 15.9% |
Family Income by Famaliy Size in Westchester
6-person families (30 | 0.6%) account for the highest median family income in Westchester with $250,001 per family, while 2-person families (2,607 | 54.0%) have the highest median income of $51,808 per family member.
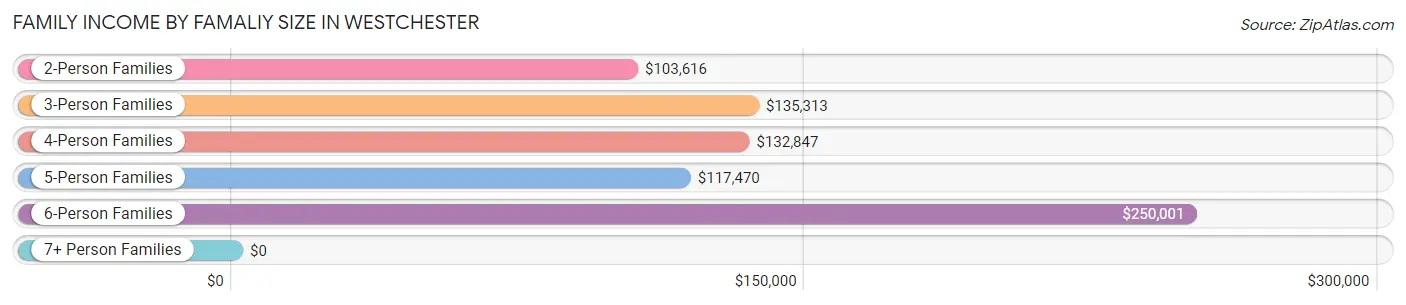
| Income Bracket | # Families | Median Income |
| 2-Person Families | 2,607 (54.0%) | $103,616 |
| 3-Person Families | 1,255 (26.0%) | $135,313 |
| 4-Person Families | 577 (12.0%) | $132,847 |
| 5-Person Families | 301 (6.2%) | $117,470 |
| 6-Person Families | 30 (0.6%) | $250,001 |
| 7+ Person Families | 54 (1.1%) | $0 |
| Total | 4,824 (100.0%) | $116,300 |
Family Income by Number of Earners in Westchester
The median family income in Westchester is $116,300, with families comprising 3+ earners (574) having the highest median family income of $175,875, while families with no earners (885) have the lowest median family income of $74,135, accounting for 11.9% and 18.3% of families, respectively.
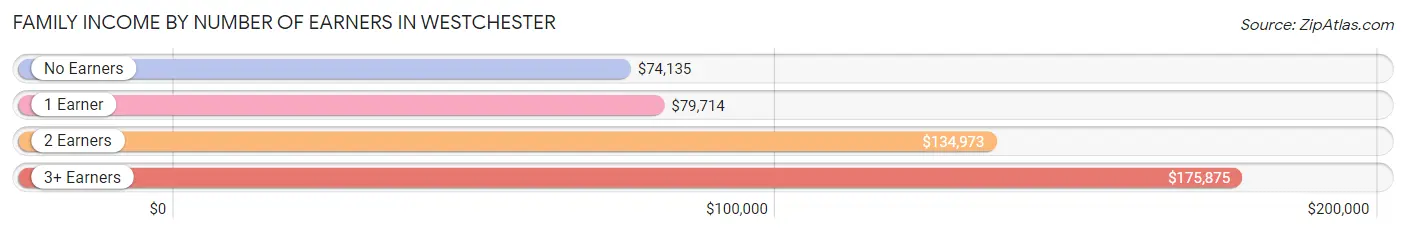
| Number of Earners | # Families | Median Income |
| No Earners | 885 (18.3%) | $74,135 |
| 1 Earner | 1,182 (24.5%) | $79,714 |
| 2 Earners | 2,183 (45.3%) | $134,973 |
| 3+ Earners | 574 (11.9%) | $175,875 |
| Total | 4,824 (100.0%) | $116,300 |
Household Income in Westchester
Household Income Brackets in Westchester
With 1,858 households falling in the category, the $100,000 to $149,999 income range is the most frequent in Westchester, accounting for 26.0% of all households. In contrast, only 129 households (1.8%) fall into the less than $10,000 income bracket, making it the least populous group.
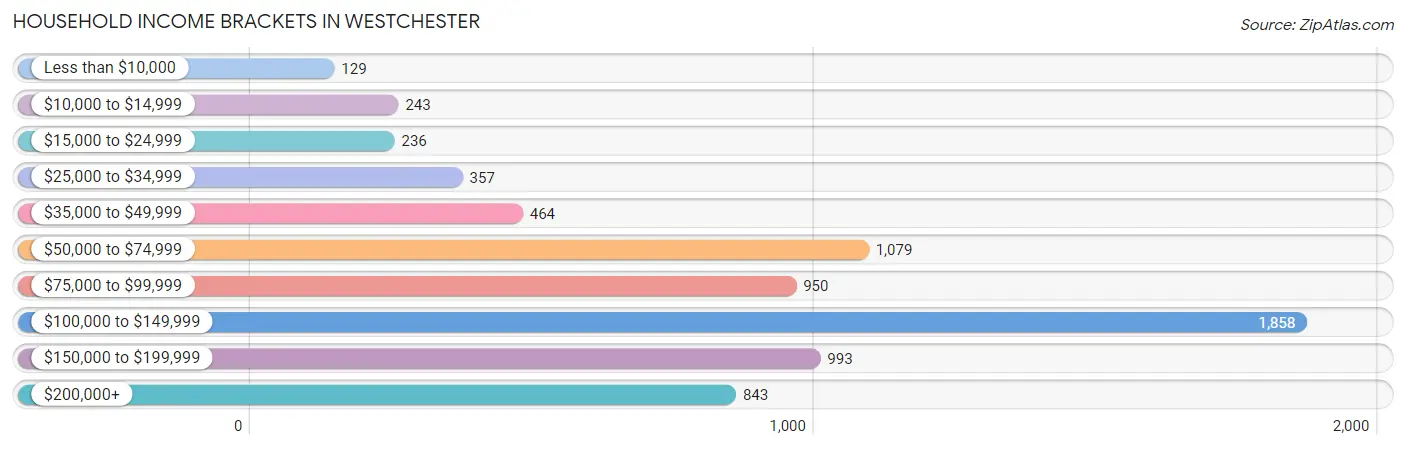
| Income Bracket | # Households | % Households |
| Less than $10,000 | 129 | 1.8% |
| $10,000 to $14,999 | 243 | 3.4% |
| $15,000 to $24,999 | 236 | 3.3% |
| $25,000 to $34,999 | 357 | 5.0% |
| $35,000 to $49,999 | 464 | 6.5% |
| $50,000 to $74,999 | 1,079 | 15.1% |
| $75,000 to $99,999 | 950 | 13.3% |
| $100,000 to $149,999 | 1,858 | 26.0% |
| $150,000 to $199,999 | 993 | 13.9% |
| $200,000+ | 843 | 11.8% |
Household Income by Householder Age in Westchester
The median household income in Westchester is $101,414, with the highest median household income of $118,583 found in the 25 to 44 years age bracket for the primary householder. A total of 1,394 households (19.5%) fall into this category. Meanwhile, the 15 to 24 years age bracket for the primary householder has the lowest median household income of $0, with 85 households (1.2%) in this group.
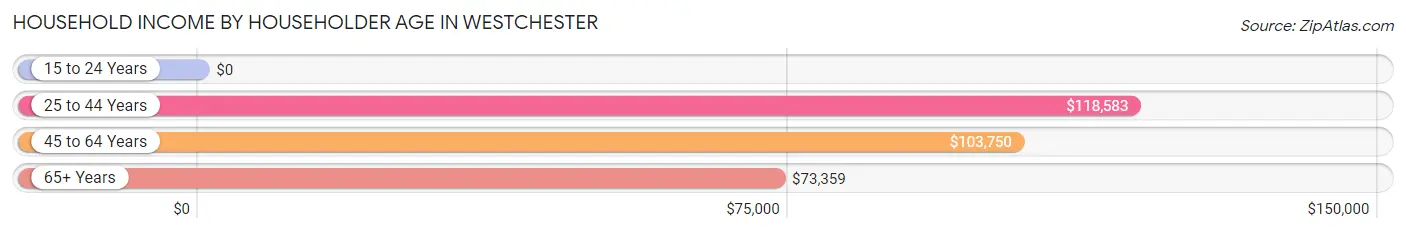
| Income Bracket | # Households | Median Income |
| 15 to 24 Years | 85 (1.2%) | $0 |
| 25 to 44 Years | 1,394 (19.5%) | $118,583 |
| 45 to 64 Years | 2,802 (39.2%) | $103,750 |
| 65+ Years | 2,864 (40.1%) | $73,359 |
| Total | 7,145 (100.0%) | $101,414 |
Poverty in Westchester
Income Below Poverty by Sex and Age in Westchester
With 4.2% poverty level for males and 2.7% for females among the residents of Westchester, 6 to 11 year old males and 75 year old and over females are the most vulnerable to poverty, with 33 males (11.1%) and 89 females (7.6%) in their respective age groups living below the poverty level.
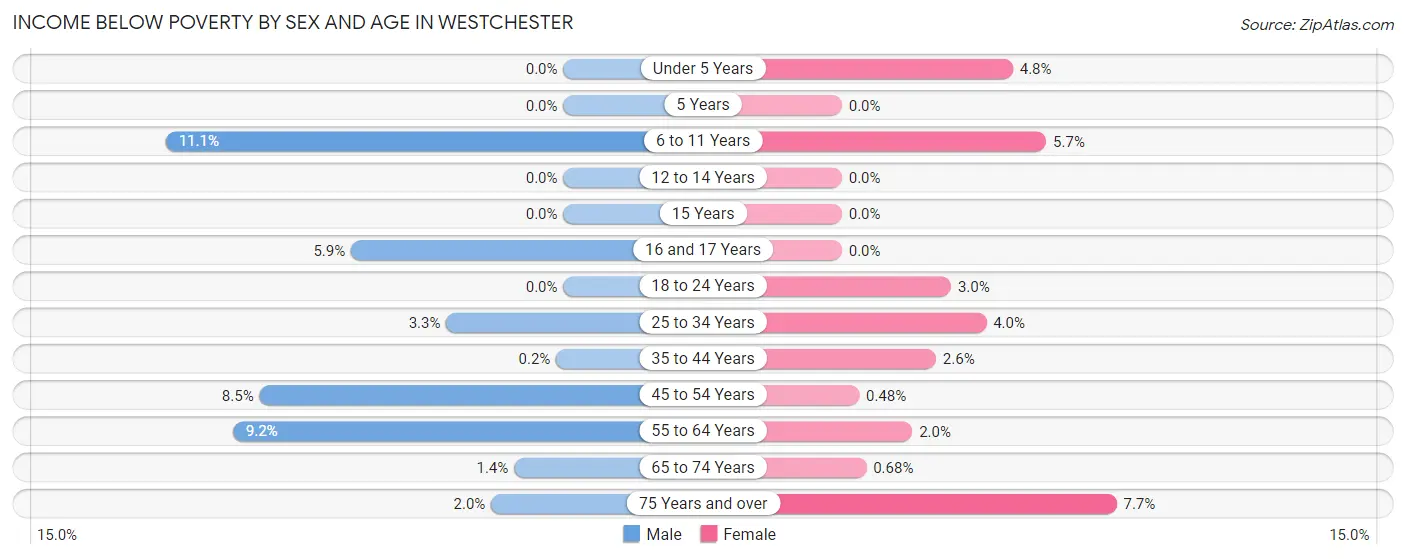
| Age Bracket | Male | Female |
| Under 5 Years | 0 (0.0%) | 15 (4.8%) |
| 5 Years | 0 (0.0%) | 0 (0.0%) |
| 6 to 11 Years | 33 (11.1%) | 17 (5.7%) |
| 12 to 14 Years | 0 (0.0%) | 0 (0.0%) |
| 15 Years | 0 (0.0%) | 0 (0.0%) |
| 16 and 17 Years | 12 (5.9%) | 0 (0.0%) |
| 18 to 24 Years | 0 (0.0%) | 19 (3.0%) |
| 25 to 34 Years | 24 (3.3%) | 32 (4.0%) |
| 35 to 44 Years | 2 (0.2%) | 21 (2.6%) |
| 45 to 54 Years | 87 (8.5%) | 5 (0.5%) |
| 55 to 64 Years | 132 (9.2%) | 31 (2.0%) |
| 65 to 74 Years | 17 (1.4%) | 10 (0.7%) |
| 75 Years and over | 14 (2.0%) | 89 (7.6%) |
| Total | 321 (4.2%) | 239 (2.7%) |
Income Above Poverty by Sex and Age in Westchester
According to the poverty statistics in Westchester, males aged under 5 years and females aged 5 years are the age groups that are most secure financially, with 100.0% of males and 100.0% of females in these age groups living above the poverty line.
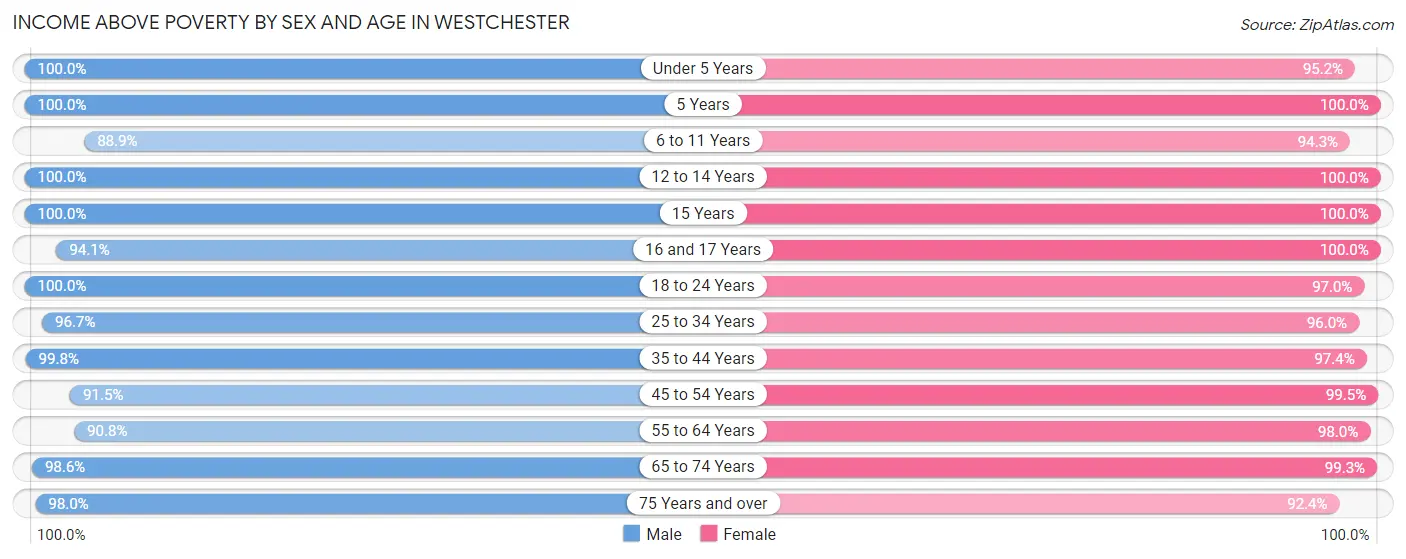
| Age Bracket | Male | Female |
| Under 5 Years | 218 (100.0%) | 300 (95.2%) |
| 5 Years | 29 (100.0%) | 120 (100.0%) |
| 6 to 11 Years | 265 (88.9%) | 282 (94.3%) |
| 12 to 14 Years | 129 (100.0%) | 385 (100.0%) |
| 15 Years | 70 (100.0%) | 54 (100.0%) |
| 16 and 17 Years | 191 (94.1%) | 312 (100.0%) |
| 18 to 24 Years | 512 (100.0%) | 605 (97.0%) |
| 25 to 34 Years | 712 (96.7%) | 765 (96.0%) |
| 35 to 44 Years | 983 (99.8%) | 779 (97.4%) |
| 45 to 54 Years | 941 (91.5%) | 1,030 (99.5%) |
| 55 to 64 Years | 1,303 (90.8%) | 1,549 (98.0%) |
| 65 to 74 Years | 1,225 (98.6%) | 1,455 (99.3%) |
| 75 Years and over | 682 (98.0%) | 1,075 (92.3%) |
| Total | 7,260 (95.8%) | 8,711 (97.3%) |
Income Below Poverty Among Married-Couple Families in Westchester
The poverty statistics for married-couple families in Westchester show that 0.9% or 32 of the total 3,597 families live below the poverty line. Families with 3 or 4 children have the highest poverty rate of 6.6%, comprising of 13 families. On the other hand, families with 1 or 2 children have the lowest poverty rate of 0.0%, which includes 0 families.
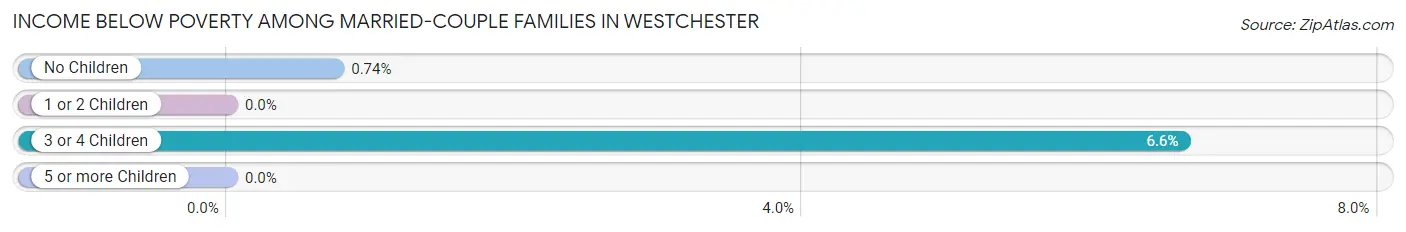
| Children | Above Poverty | Below Poverty |
| No Children | 2,549 (99.3%) | 19 (0.7%) |
| 1 or 2 Children | 833 (100.0%) | 0 (0.0%) |
| 3 or 4 Children | 183 (93.4%) | 13 (6.6%) |
| 5 or more Children | 0 (0.0%) | 0 (0.0%) |
| Total | 3,565 (99.1%) | 32 (0.9%) |
Income Below Poverty Among Single-Parent Households in Westchester
According to the poverty data in Westchester, 8.2% or 24 single-father households and 1.3% or 12 single-mother households are living below the poverty line. Among single-father households, those with 1 or 2 children have the highest poverty rate, with 13 households (54.2%) experiencing poverty. Likewise, among single-mother households, those with 1 or 2 children have the highest poverty rate, with 12 households (4.0%) falling below the poverty line.
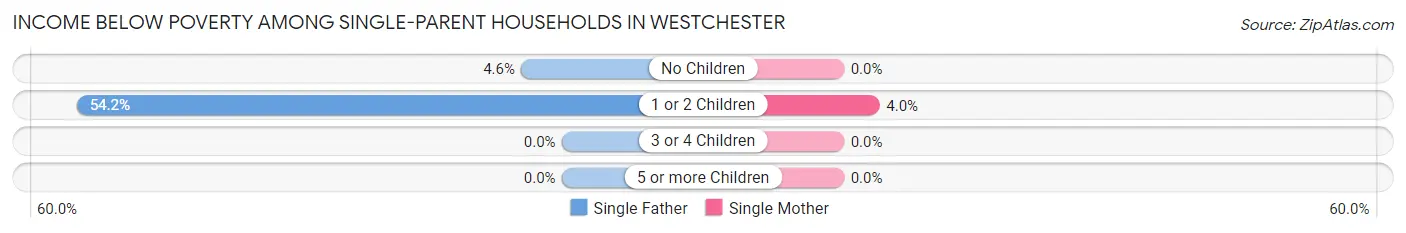
| Children | Single Father | Single Mother |
| No Children | 11 (4.5%) | 0 (0.0%) |
| 1 or 2 Children | 13 (54.2%) | 12 (4.0%) |
| 3 or 4 Children | 0 (0.0%) | 0 (0.0%) |
| 5 or more Children | 0 (0.0%) | 0 (0.0%) |
| Total | 24 (8.2%) | 12 (1.3%) |
Income Below Poverty Among Married-Couple vs Single-Parent Households in Westchester
The poverty data for Westchester shows that 32 of the married-couple family households (0.9%) and 36 of the single-parent households (2.9%) are living below the poverty level. Within the married-couple family households, those with 3 or 4 children have the highest poverty rate, with 13 households (6.6%) falling below the poverty line. Among the single-parent households, those with 1 or 2 children have the highest poverty rate, with 25 household (7.7%) living below poverty.
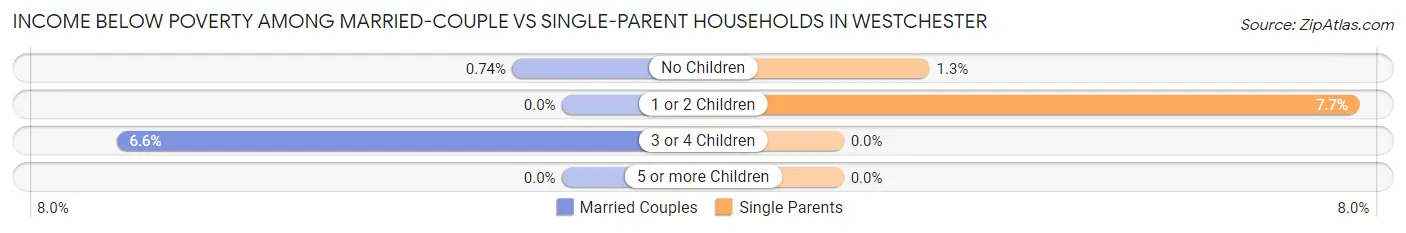
| Children | Married-Couple Families | Single-Parent Households |
| No Children | 19 (0.7%) | 11 (1.3%) |
| 1 or 2 Children | 0 (0.0%) | 25 (7.7%) |
| 3 or 4 Children | 13 (6.6%) | 0 (0.0%) |
| 5 or more Children | 0 (0.0%) | 0 (0.0%) |
| Total | 32 (0.9%) | 36 (2.9%) |
Race in Westchester
The most populous races in Westchester are White / Caucasian (10,901 | 65.3%), Black / African American (3,244 | 19.4%), and Hispanic or Latino (3,130 | 18.8%).
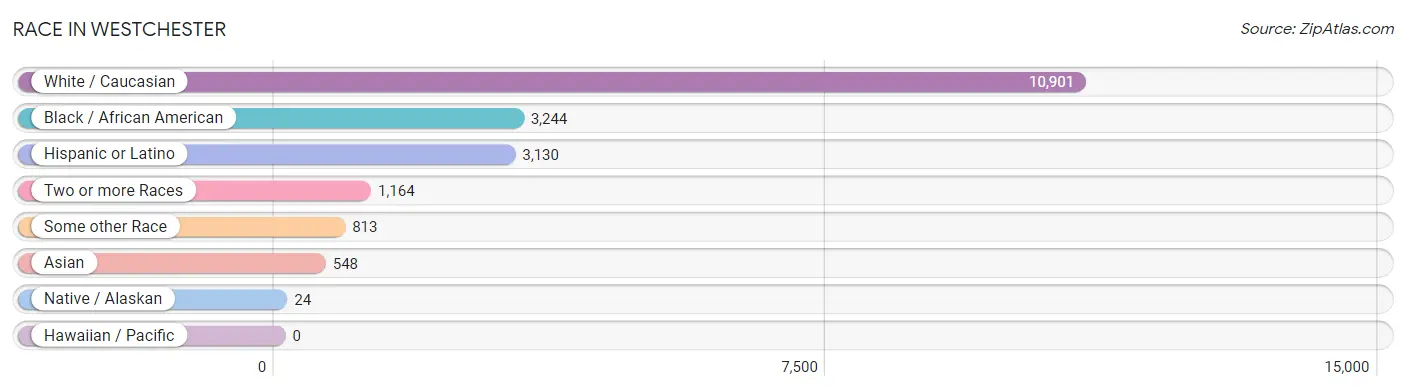
| Race | # Population | % Population |
| Asian | 548 | 3.3% |
| Black / African American | 3,244 | 19.4% |
| Hawaiian / Pacific | 0 | 0.0% |
| Hispanic or Latino | 3,130 | 18.8% |
| Native / Alaskan | 24 | 0.1% |
| White / Caucasian | 10,901 | 65.3% |
| Two or more Races | 1,164 | 7.0% |
| Some other Race | 813 | 4.9% |
| Total | 16,694 | 100.0% |
Ancestry in Westchester
The most populous ancestries reported in Westchester are Mexican (2,422 | 14.5%), Italian (2,299 | 13.8%), Irish (2,269 | 13.6%), German (1,954 | 11.7%), and Polish (1,886 | 11.3%), together accounting for 64.9% of all Westchester residents.
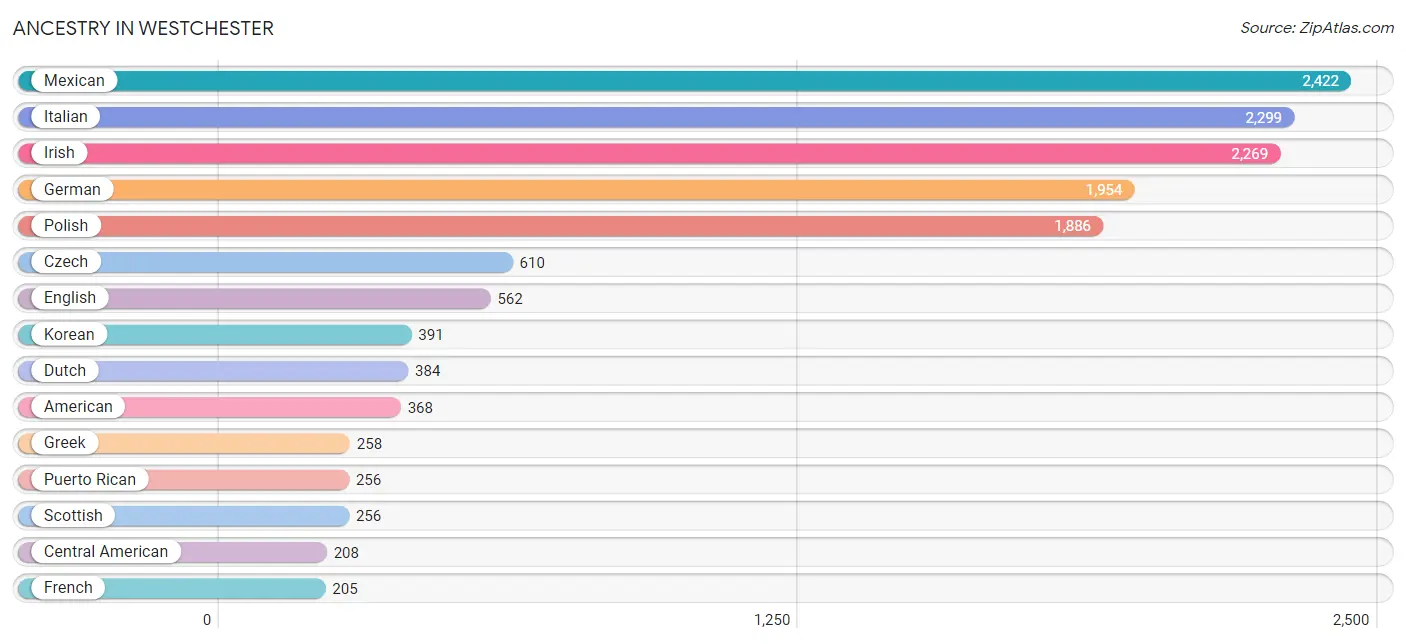
| Ancestry | # Population | % Population |
| African | 37 | 0.2% |
| Albanian | 13 | 0.1% |
| American | 368 | 2.2% |
| Arab | 59 | 0.4% |
| Armenian | 185 | 1.1% |
| Austrian | 93 | 0.6% |
| Belgian | 7 | 0.0% |
| British | 12 | 0.1% |
| Bulgarian | 21 | 0.1% |
| Burmese | 17 | 0.1% |
| Canadian | 22 | 0.1% |
| Central American | 208 | 1.3% |
| Central American Indian | 9 | 0.1% |
| Chippewa | 4 | 0.0% |
| Colombian | 13 | 0.1% |
| Costa Rican | 8 | 0.1% |
| Creek | 10 | 0.1% |
| Croatian | 74 | 0.4% |
| Cuban | 78 | 0.5% |
| Czech | 610 | 3.6% |
| Czechoslovakian | 49 | 0.3% |
| Danish | 17 | 0.1% |
| Dominican | 5 | 0.0% |
| Dutch | 384 | 2.3% |
| Eastern European | 59 | 0.4% |
| Ecuadorian | 70 | 0.4% |
| Egyptian | 23 | 0.1% |
| English | 562 | 3.4% |
| European | 158 | 0.9% |
| Finnish | 8 | 0.1% |
| French | 205 | 1.2% |
| French Canadian | 32 | 0.2% |
| German | 1,954 | 11.7% |
| Greek | 258 | 1.5% |
| Guatemalan | 70 | 0.4% |
| Honduran | 130 | 0.8% |
| Hungarian | 15 | 0.1% |
| Indian (Asian) | 30 | 0.2% |
| Iranian | 29 | 0.2% |
| Irish | 2,269 | 13.6% |
| Italian | 2,299 | 13.8% |
| Korean | 391 | 2.3% |
| Lithuanian | 133 | 0.8% |
| Mexican | 2,422 | 14.5% |
| Mexican American Indian | 24 | 0.1% |
| Native Hawaiian | 14 | 0.1% |
| Nigerian | 92 | 0.5% |
| Norwegian | 76 | 0.5% |
| Polish | 1,886 | 11.3% |
| Portuguese | 26 | 0.2% |
| Pueblo | 11 | 0.1% |
| Puerto Rican | 256 | 1.5% |
| Romanian | 36 | 0.2% |
| Russian | 82 | 0.5% |
| Scandinavian | 26 | 0.2% |
| Scotch-Irish | 23 | 0.1% |
| Scottish | 256 | 1.5% |
| Serbian | 159 | 0.9% |
| Slovak | 72 | 0.4% |
| Slovene | 97 | 0.6% |
| South American | 83 | 0.5% |
| Spaniard | 14 | 0.1% |
| Subsaharan African | 166 | 1.0% |
| Swedish | 129 | 0.8% |
| Swiss | 5 | 0.0% |
| Thai | 63 | 0.4% |
| Turkish | 70 | 0.4% |
| Ugandan | 6 | 0.0% |
| Ukrainian | 42 | 0.3% |
| Welsh | 19 | 0.1% |
| West Indian | 40 | 0.2% |
| Yugoslavian | 24 | 0.1% | View All 72 Rows |
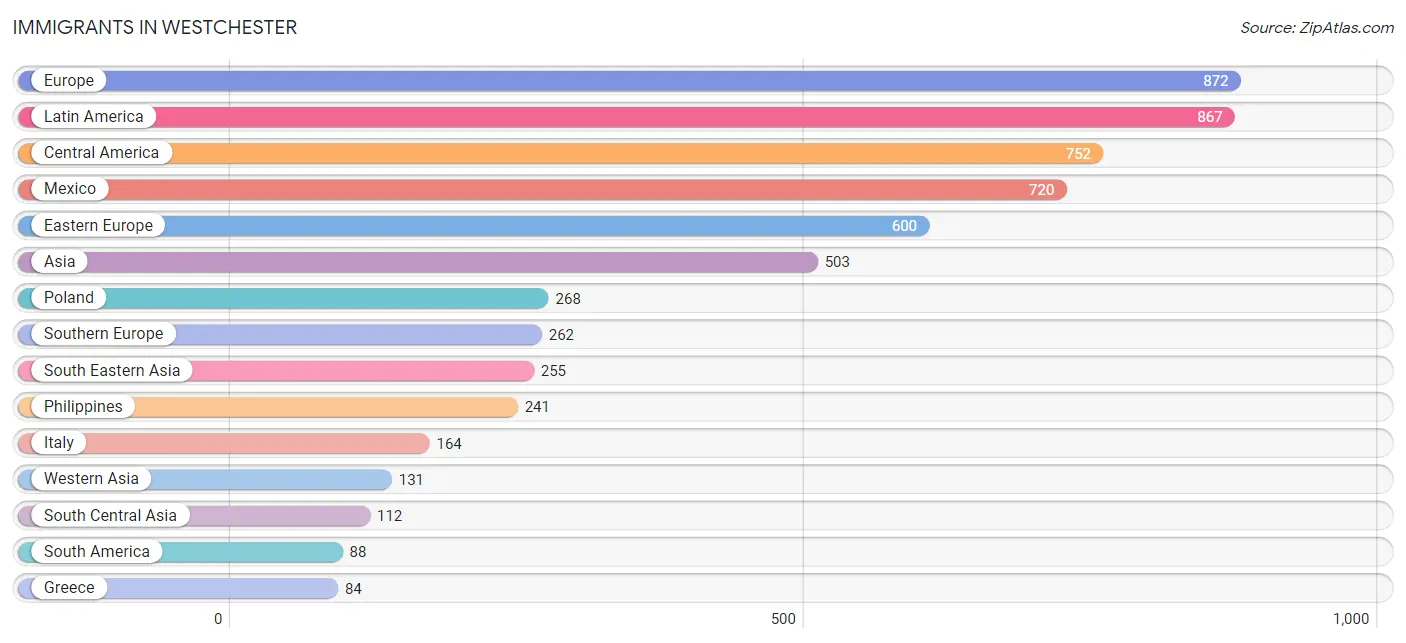
Immigrants in Westchester
The most numerous immigrant groups reported in Westchester came from Europe (872 | 5.2%), Latin America (867 | 5.2%), Central America (752 | 4.5%), Mexico (720 | 4.3%), and Eastern Europe (600 | 3.6%), together accounting for 22.8% of all Westchester residents.
| Immigration Origin | # Population | % Population |
| Africa | 47 | 0.3% |
| Argentina | 38 | 0.2% |
| Asia | 503 | 3.0% |
| Bosnia and Herzegovina | 24 | 0.1% |
| Bulgaria | 4 | 0.0% |
| Canada | 15 | 0.1% |
| Caribbean | 27 | 0.2% |
| Central America | 752 | 4.5% |
| Chile | 11 | 0.1% |
| China | 5 | 0.0% |
| Colombia | 13 | 0.1% |
| Costa Rica | 4 | 0.0% |
| Croatia | 24 | 0.1% |
| Cuba | 22 | 0.1% |
| Czechoslovakia | 18 | 0.1% |
| Dominican Republic | 5 | 0.0% |
| Eastern Africa | 6 | 0.0% |
| Eastern Asia | 5 | 0.0% |
| Eastern Europe | 600 | 3.6% |
| Ecuador | 21 | 0.1% |
| Egypt | 23 | 0.1% |
| Europe | 872 | 5.2% |
| Germany | 10 | 0.1% |
| Greece | 84 | 0.5% |
| Guatemala | 28 | 0.2% |
| Hungary | 7 | 0.0% |
| India | 54 | 0.3% |
| Indonesia | 14 | 0.1% |
| Iran | 29 | 0.2% |
| Italy | 164 | 1.0% |
| Jordan | 34 | 0.2% |
| Latin America | 867 | 5.2% |
| Lithuania | 14 | 0.1% |
| Mexico | 720 | 4.3% |
| Nigeria | 18 | 0.1% |
| Northern Africa | 23 | 0.1% |
| Pakistan | 29 | 0.2% |
| Peru | 5 | 0.0% |
| Philippines | 241 | 1.4% |
| Poland | 268 | 1.6% |
| Romania | 40 | 0.2% |
| Russia | 17 | 0.1% |
| Serbia | 34 | 0.2% |
| South America | 88 | 0.5% |
| South Central Asia | 112 | 0.7% |
| South Eastern Asia | 255 | 1.5% |
| Southern Europe | 262 | 1.6% |
| Spain | 14 | 0.1% |
| Turkey | 61 | 0.4% |
| Uganda | 6 | 0.0% |
| Ukraine | 8 | 0.1% |
| Western Africa | 18 | 0.1% |
| Western Asia | 131 | 0.8% |
| Western Europe | 10 | 0.1% |
| Yemen | 36 | 0.2% | View All 55 Rows |
Sex and Age in Westchester
Sex and Age in Westchester
The most populous age groups in Westchester are 60 to 64 Years (890 | 11.7%) for men and 65 to 69 Years (839 | 9.2%) for women.
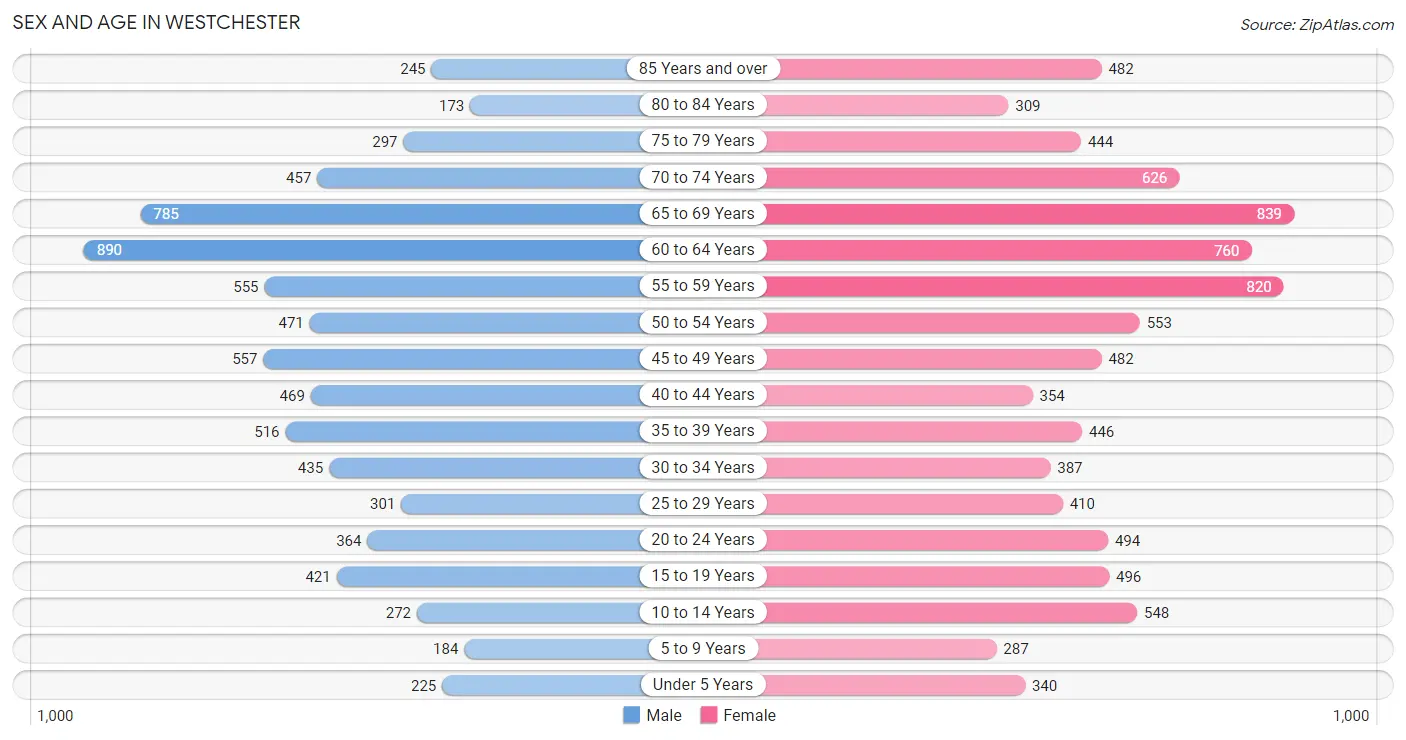
| Age Bracket | Male | Female |
| Under 5 Years | 225 (2.9%) | 340 (3.7%) |
| 5 to 9 Years | 184 (2.4%) | 287 (3.2%) |
| 10 to 14 Years | 272 (3.6%) | 548 (6.0%) |
| 15 to 19 Years | 421 (5.5%) | 496 (5.5%) |
| 20 to 24 Years | 364 (4.8%) | 494 (5.4%) |
| 25 to 29 Years | 301 (4.0%) | 410 (4.5%) |
| 30 to 34 Years | 435 (5.7%) | 387 (4.3%) |
| 35 to 39 Years | 516 (6.8%) | 446 (4.9%) |
| 40 to 44 Years | 469 (6.2%) | 354 (3.9%) |
| 45 to 49 Years | 557 (7.3%) | 482 (5.3%) |
| 50 to 54 Years | 471 (6.2%) | 553 (6.1%) |
| 55 to 59 Years | 555 (7.3%) | 820 (9.0%) |
| 60 to 64 Years | 890 (11.7%) | 760 (8.4%) |
| 65 to 69 Years | 785 (10.3%) | 839 (9.2%) |
| 70 to 74 Years | 457 (6.0%) | 626 (6.9%) |
| 75 to 79 Years | 297 (3.9%) | 444 (4.9%) |
| 80 to 84 Years | 173 (2.3%) | 309 (3.4%) |
| 85 Years and over | 245 (3.2%) | 482 (5.3%) |
| Total | 7,617 (100.0%) | 9,077 (100.0%) |
Families and Households in Westchester
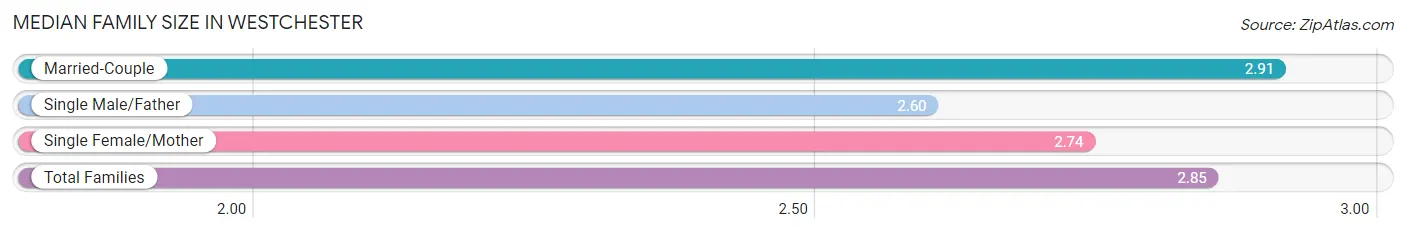
Median Family Size in Westchester
The median family size in Westchester is 2.85 persons per family, with married-couple families (3,597 | 74.6%) accounting for the largest median family size of 2.91 persons per family. On the other hand, single male/father families (292 | 6.0%) represent the smallest median family size with 2.60 persons per family.
| Family Type | # Families | Family Size |
| Married-Couple | 3,597 (74.6%) | 2.91 |
| Single Male/Father | 292 (6.0%) | 2.60 |
| Single Female/Mother | 935 (19.4%) | 2.74 |
| Total Families | 4,824 (100.0%) | 2.85 |
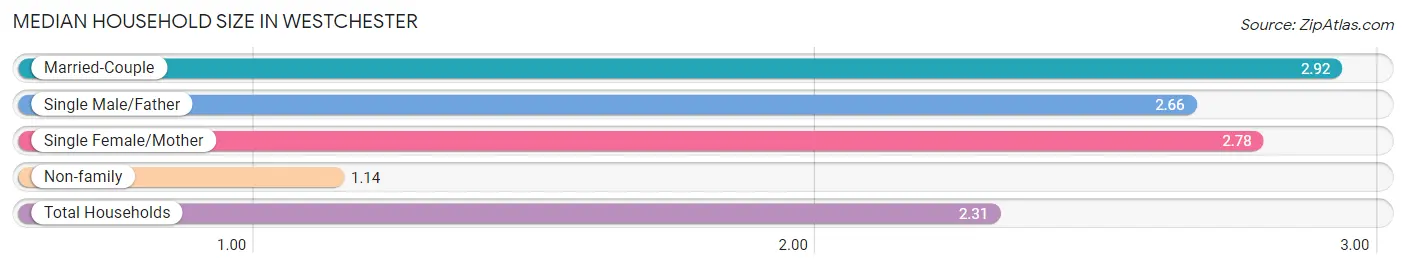
Median Household Size in Westchester
The median household size in Westchester is 2.31 persons per household, with married-couple households (3,597 | 50.3%) accounting for the largest median household size of 2.92 persons per household. non-family households (2,321 | 32.5%) represent the smallest median household size with 1.14 persons per household.
| Household Type | # Households | Household Size |
| Married-Couple | 3,597 (50.3%) | 2.92 |
| Single Male/Father | 292 (4.1%) | 2.66 |
| Single Female/Mother | 935 (13.1%) | 2.78 |
| Non-family | 2,321 (32.5%) | 1.14 |
| Total Households | 7,145 (100.0%) | 2.31 |
Household Size by Marriage Status in Westchester
Out of a total of 7,145 households in Westchester, 4,824 (67.5%) are family households, while 2,321 (32.5%) are nonfamily households. The most numerous type of family households are 2-person households, comprising 2,574, and the most common type of nonfamily households are 1-person households, comprising 2,063.
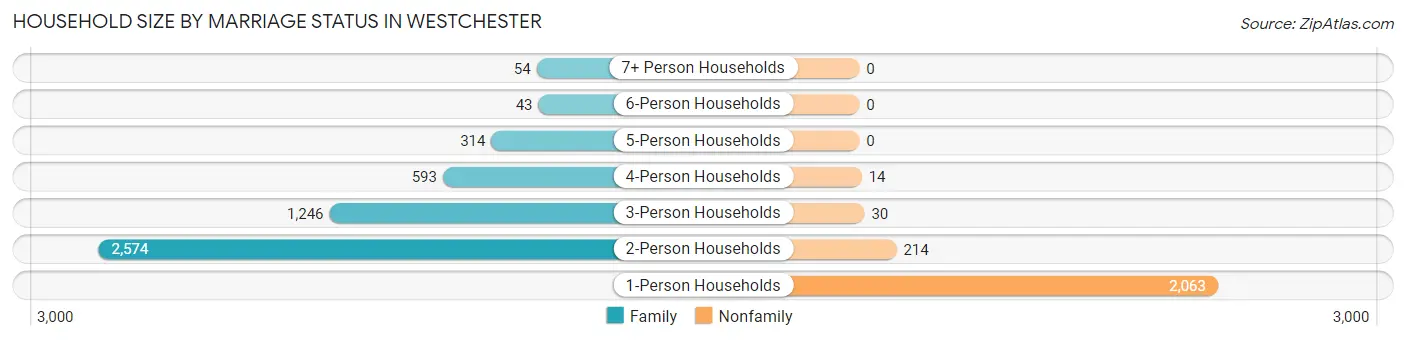
| Household Size | Family Households | Nonfamily Households |
| 1-Person Households | - | 2,063 (28.9%) |
| 2-Person Households | 2,574 (36.0%) | 214 (3.0%) |
| 3-Person Households | 1,246 (17.4%) | 30 (0.4%) |
| 4-Person Households | 593 (8.3%) | 14 (0.2%) |
| 5-Person Households | 314 (4.4%) | 0 (0.0%) |
| 6-Person Households | 43 (0.6%) | 0 (0.0%) |
| 7+ Person Households | 54 (0.8%) | 0 (0.0%) |
| Total | 4,824 (67.5%) | 2,321 (32.5%) |
Female Fertility in Westchester
Fertility by Age in Westchester
Average fertility rate in Westchester is 22.0 births per 1,000 women. Women in the age bracket of 20 to 34 years have the highest fertility rate with 45.0 births per 1,000 women. Women in the age bracket of 20 to 34 years acount for 81.7% of all women with births.
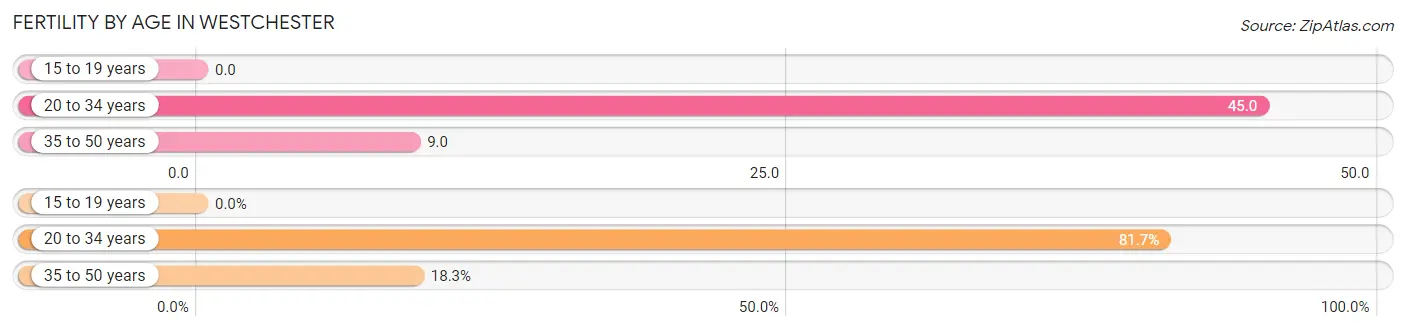
| Age Bracket | Women with Births | Births / 1,000 Women |
| 15 to 19 years | 0 (0.0%) | 0.0 |
| 20 to 34 years | 58 (81.7%) | 45.0 |
| 35 to 50 years | 13 (18.3%) | 9.0 |
| Total | 71 (100.0%) | 22.0 |
Fertility by Age by Marriage Status in Westchester
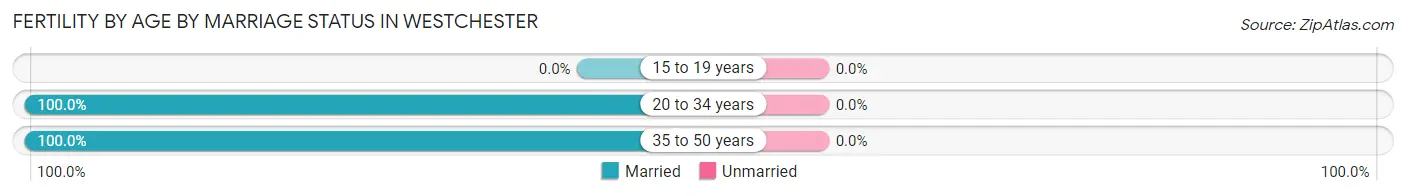
| Age Bracket | Married | Unmarried |
| 15 to 19 years | 0 (0.0%) | 0 (0.0%) |
| 20 to 34 years | 58 (100.0%) | 0 (0.0%) |
| 35 to 50 years | 13 (100.0%) | 0 (0.0%) |
| Total | 71 (100.0%) | 0 (0.0%) |
Fertility by Education in Westchester
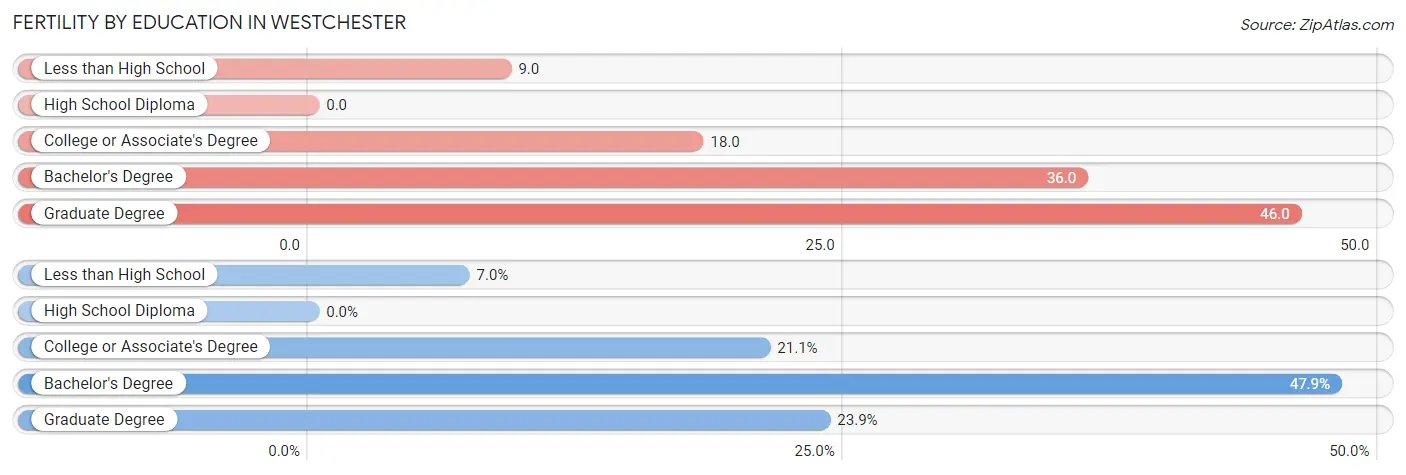
| Educational Attainment | Women with Births | Births / 1,000 Women |
| Less than High School | 5 (7.0%) | 9.0 |
| High School Diploma | 0 (0.0%) | 0.0 |
| College or Associate's Degree | 15 (21.1%) | 18.0 |
| Bachelor's Degree | 34 (47.9%) | 36.0 |
| Graduate Degree | 17 (23.9%) | 46.0 |
| Total | 71 (100.0%) | 22.0 |
Fertility by Education by Marriage Status in Westchester
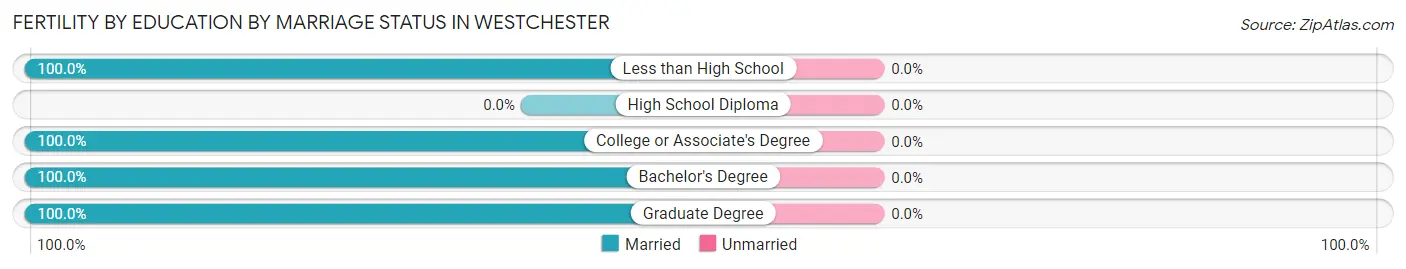
| Educational Attainment | Married | Unmarried |
| Less than High School | 5 (100.0%) | 0 (0.0%) |
| High School Diploma | 0 (0.0%) | 0 (0.0%) |
| College or Associate's Degree | 15 (100.0%) | 0 (0.0%) |
| Bachelor's Degree | 34 (100.0%) | 0 (0.0%) |
| Graduate Degree | 17 (100.0%) | 0 (0.0%) |
| Total | 71 (100.0%) | 0 (0.0%) |
Employment Characteristics in Westchester
Employment by Class of Employer in Westchester
Among the 8,632 employed individuals in Westchester, private company employees (5,511 | 63.8%), not-for-profit organizations (913 | 10.6%), and local government employees (687 | 8.0%) make up the most common classes of employment.
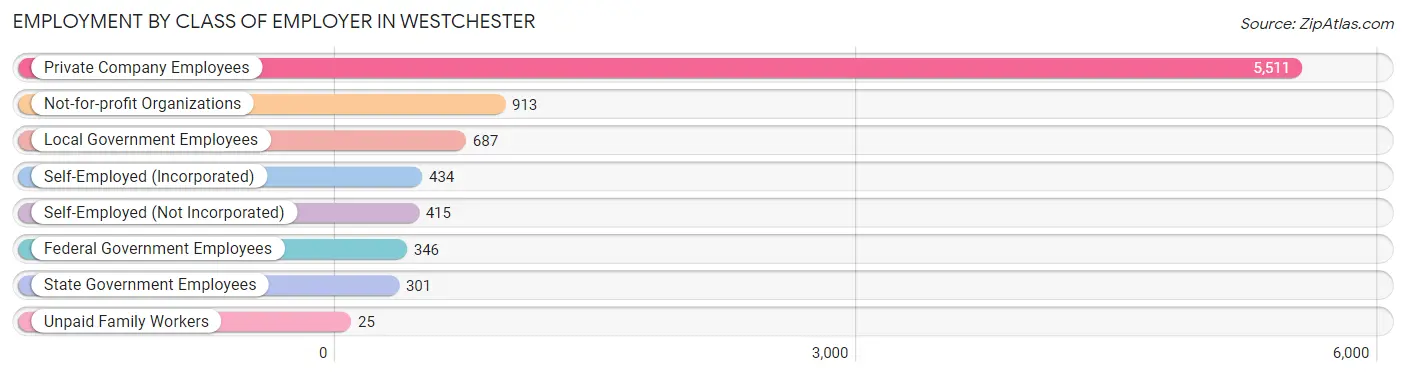
| Employer Class | # Employees | % Employees |
| Private Company Employees | 5,511 | 63.8% |
| Self-Employed (Incorporated) | 434 | 5.0% |
| Self-Employed (Not Incorporated) | 415 | 4.8% |
| Not-for-profit Organizations | 913 | 10.6% |
| Local Government Employees | 687 | 8.0% |
| State Government Employees | 301 | 3.5% |
| Federal Government Employees | 346 | 4.0% |
| Unpaid Family Workers | 25 | 0.3% |
| Total | 8,632 | 100.0% |
Employment Status by Age in Westchester
According to the labor force statistics for Westchester, out of the total population over 16 years of age (14,714), 63.5% or 9,343 individuals are in the labor force, with 5.4% or 505 of them unemployed. The age group with the highest labor force participation rate is 30 to 34 years, with 94.6% or 778 individuals in the labor force. Within the labor force, the 55 to 59 years age range has the highest percentage of unemployed individuals, with 13.1% or 149 of them being unemployed.
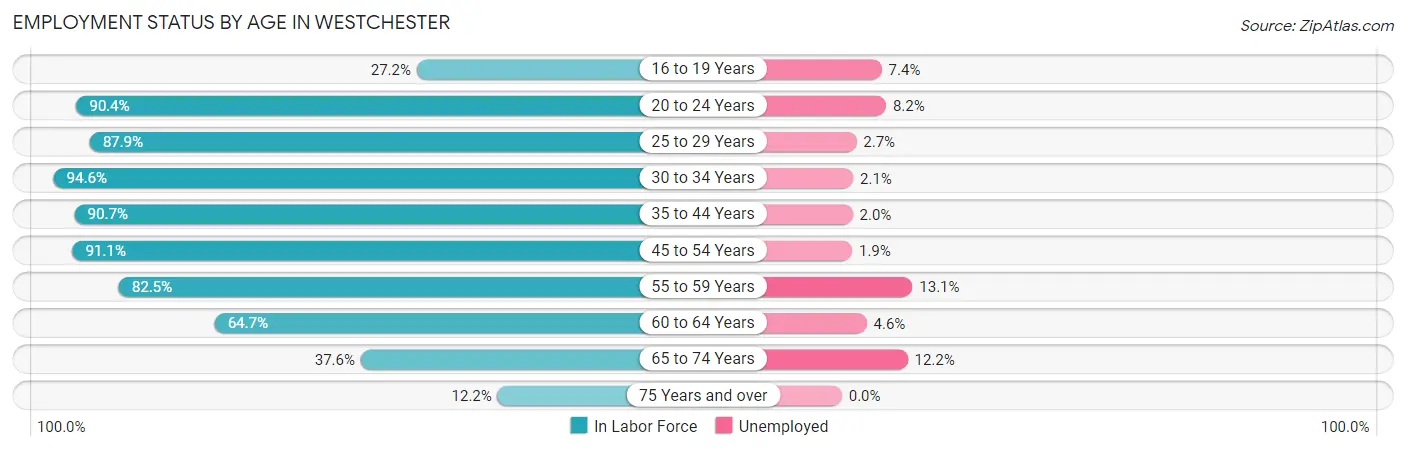
| Age Bracket | In Labor Force | Unemployed |
| 16 to 19 Years | 216 (27.2%) | 16 (7.4%) |
| 20 to 24 Years | 776 (90.4%) | 64 (8.2%) |
| 25 to 29 Years | 625 (87.9%) | 17 (2.7%) |
| 30 to 34 Years | 778 (94.6%) | 16 (2.1%) |
| 35 to 44 Years | 1,619 (90.7%) | 32 (2.0%) |
| 45 to 54 Years | 1,879 (91.1%) | 36 (1.9%) |
| 55 to 59 Years | 1,134 (82.5%) | 149 (13.1%) |
| 60 to 64 Years | 1,068 (64.7%) | 49 (4.6%) |
| 65 to 74 Years | 1,018 (37.6%) | 124 (12.2%) |
| 75 Years and over | 238 (12.2%) | 0 (0.0%) |
| Total | 9,343 (63.5%) | 505 (5.4%) |
Employment Status by Educational Attainment in Westchester
According to labor force statistics for Westchester, 84.5% of individuals (7,103) out of the total population between 25 and 64 years of age (8,406) are in the labor force, with 4.2% or 298 of them being unemployed. The group with the highest labor force participation rate are those with the educational attainment of bachelor's degree or higher, with 88.5% or 3,784 individuals in the labor force. Within the labor force, individuals with high school diploma education have the highest percentage of unemployment, with 6.7% or 70 of them being unemployed.
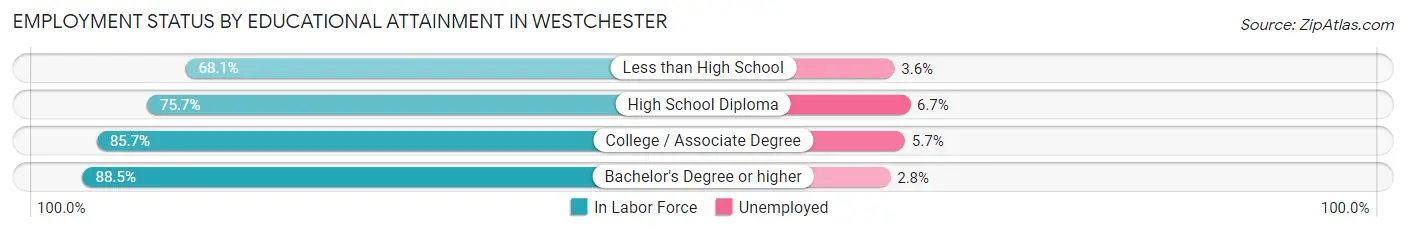
| Educational Attainment | In Labor Force | Unemployed |
| Less than High School | 307 (68.1%) | 16 (3.6%) |
| High School Diploma | 1,048 (75.7%) | 93 (6.7%) |
| College / Associate Degree | 1,966 (85.7%) | 131 (5.7%) |
| Bachelor's Degree or higher | 3,784 (88.5%) | 120 (2.8%) |
| Total | 7,103 (84.5%) | 353 (4.2%) |
Employment Occupations by Sex in Westchester
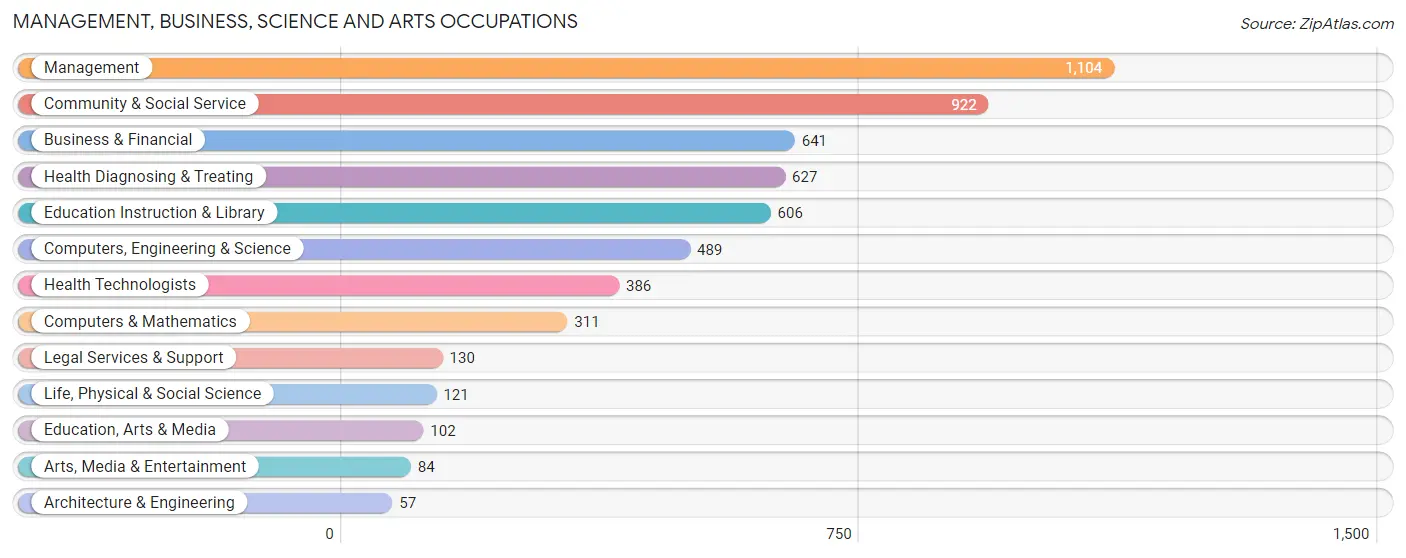
Management, Business, Science and Arts Occupations
The most common Management, Business, Science and Arts occupations in Westchester are Management (1,104 | 12.5%), Community & Social Service (922 | 10.4%), Business & Financial (641 | 7.2%), Health Diagnosing & Treating (627 | 7.1%), and Education Instruction & Library (606 | 6.9%).
Management, Business, Science and Arts Occupations by Sex
Within the Management, Business, Science and Arts occupations in Westchester, the most male-oriented occupations are Architecture & Engineering (100.0%), Computers & Mathematics (77.5%), and Management (75.1%), while the most female-oriented occupations are Education Instruction & Library (80.2%), Health Technologists (79.5%), and Health Diagnosing & Treating (75.9%).
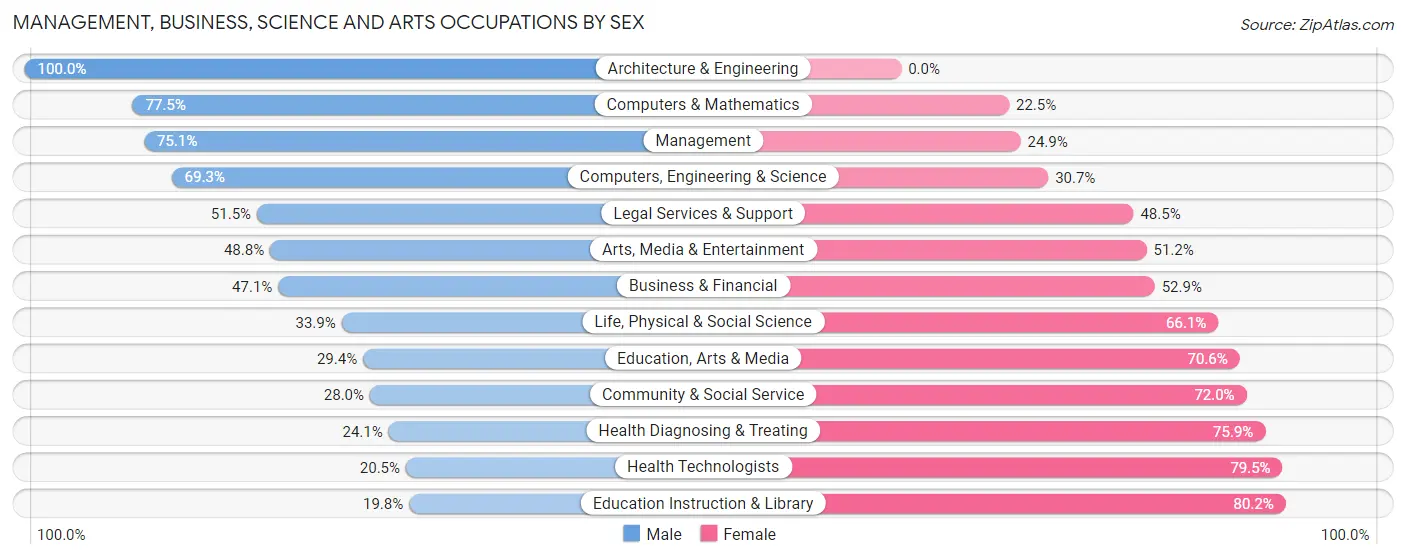
| Occupation | Male | Female |
| Management | 829 (75.1%) | 275 (24.9%) |
| Business & Financial | 302 (47.1%) | 339 (52.9%) |
| Computers, Engineering & Science | 339 (69.3%) | 150 (30.7%) |
| Computers & Mathematics | 241 (77.5%) | 70 (22.5%) |
| Architecture & Engineering | 57 (100.0%) | 0 (0.0%) |
| Life, Physical & Social Science | 41 (33.9%) | 80 (66.1%) |
| Community & Social Service | 258 (28.0%) | 664 (72.0%) |
| Education, Arts & Media | 30 (29.4%) | 72 (70.6%) |
| Legal Services & Support | 67 (51.5%) | 63 (48.5%) |
| Education Instruction & Library | 120 (19.8%) | 486 (80.2%) |
| Arts, Media & Entertainment | 41 (48.8%) | 43 (51.2%) |
| Health Diagnosing & Treating | 151 (24.1%) | 476 (75.9%) |
| Health Technologists | 79 (20.5%) | 307 (79.5%) |
| Total (Category) | 1,879 (49.7%) | 1,904 (50.3%) |
| Total (Overall) | 4,383 (49.5%) | 4,464 (50.5%) |
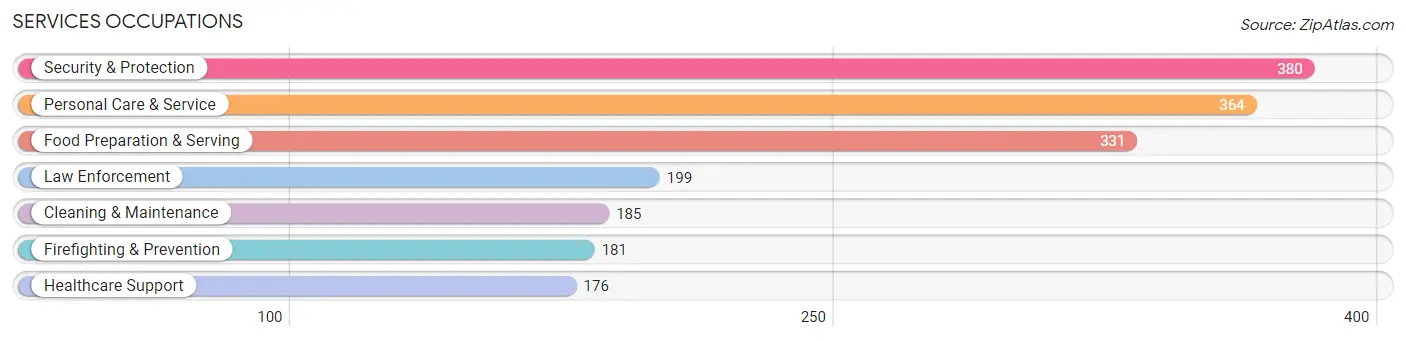
Services Occupations
The most common Services occupations in Westchester are Security & Protection (380 | 4.3%), Personal Care & Service (364 | 4.1%), Food Preparation & Serving (331 | 3.7%), Law Enforcement (199 | 2.2%), and Cleaning & Maintenance (185 | 2.1%).
Services Occupations by Sex
Within the Services occupations in Westchester, the most male-oriented occupations are Firefighting & Prevention (91.2%), Cleaning & Maintenance (84.9%), and Security & Protection (72.6%), while the most female-oriented occupations are Healthcare Support (100.0%), Personal Care & Service (87.1%), and Food Preparation & Serving (53.5%).
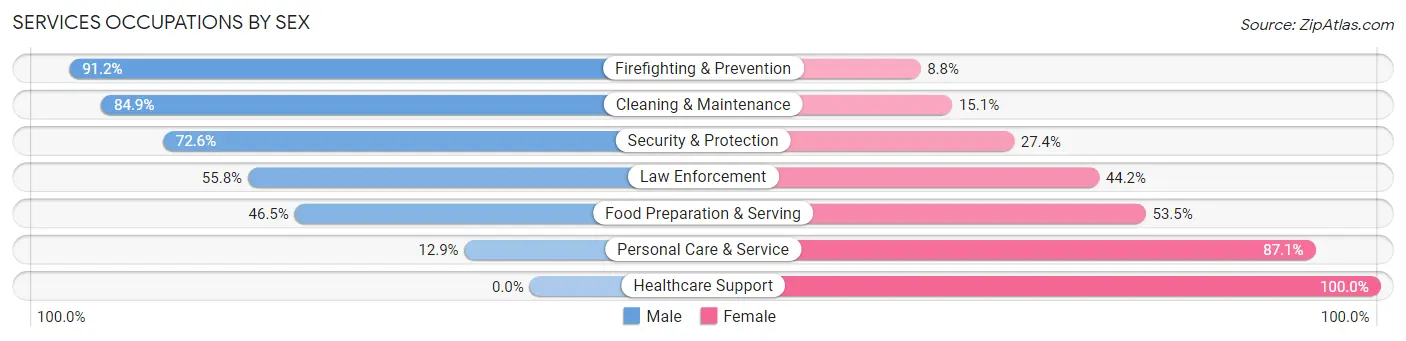
| Occupation | Male | Female |
| Healthcare Support | 0 (0.0%) | 176 (100.0%) |
| Security & Protection | 276 (72.6%) | 104 (27.4%) |
| Firefighting & Prevention | 165 (91.2%) | 16 (8.8%) |
| Law Enforcement | 111 (55.8%) | 88 (44.2%) |
| Food Preparation & Serving | 154 (46.5%) | 177 (53.5%) |
| Cleaning & Maintenance | 157 (84.9%) | 28 (15.1%) |
| Personal Care & Service | 47 (12.9%) | 317 (87.1%) |
| Total (Category) | 634 (44.2%) | 802 (55.8%) |
| Total (Overall) | 4,383 (49.5%) | 4,464 (50.5%) |
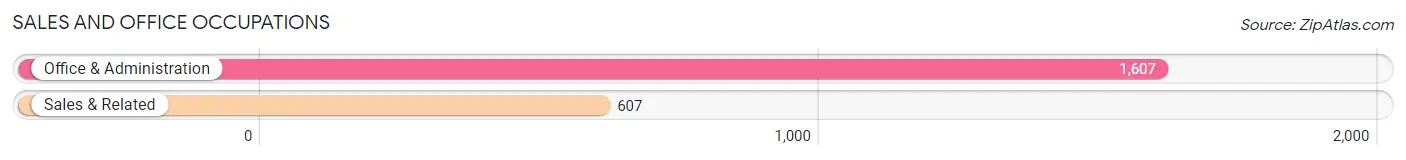
Sales and Office Occupations
The most common Sales and Office occupations in Westchester are Office & Administration (1,607 | 18.2%), and Sales & Related (607 | 6.9%).
Sales and Office Occupations by Sex
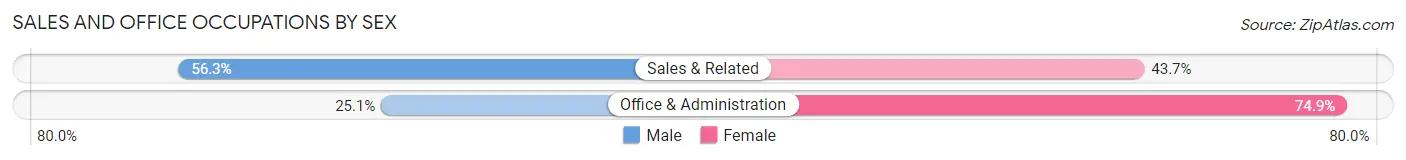
| Occupation | Male | Female |
| Sales & Related | 342 (56.3%) | 265 (43.7%) |
| Office & Administration | 404 (25.1%) | 1,203 (74.9%) |
| Total (Category) | 746 (33.7%) | 1,468 (66.3%) |
| Total (Overall) | 4,383 (49.5%) | 4,464 (50.5%) |
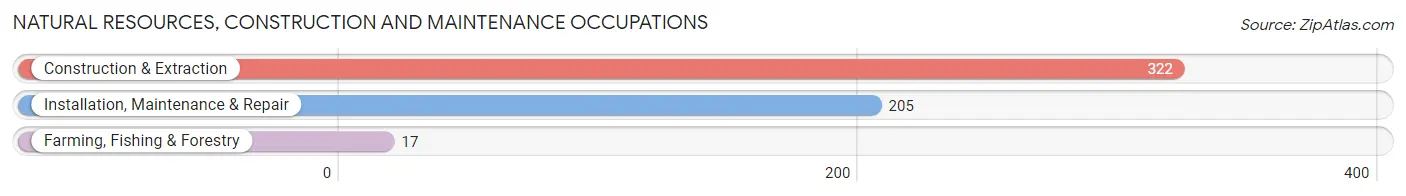
Natural Resources, Construction and Maintenance Occupations
The most common Natural Resources, Construction and Maintenance occupations in Westchester are Construction & Extraction (322 | 3.6%), Installation, Maintenance & Repair (205 | 2.3%), and Farming, Fishing & Forestry (17 | 0.2%).
Natural Resources, Construction and Maintenance Occupations by Sex
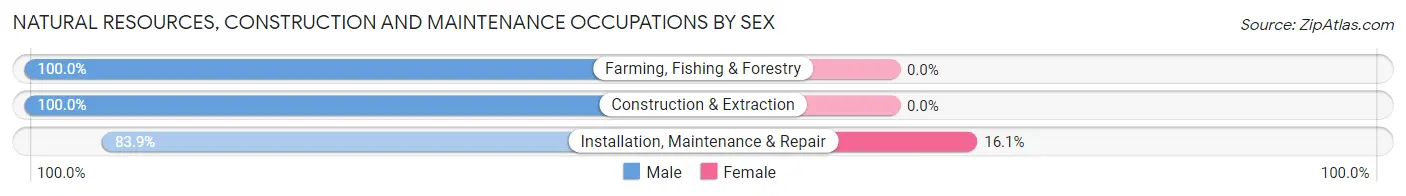
| Occupation | Male | Female |
| Farming, Fishing & Forestry | 17 (100.0%) | 0 (0.0%) |
| Construction & Extraction | 322 (100.0%) | 0 (0.0%) |
| Installation, Maintenance & Repair | 172 (83.9%) | 33 (16.1%) |
| Total (Category) | 511 (93.9%) | 33 (6.1%) |
| Total (Overall) | 4,383 (49.5%) | 4,464 (50.5%) |
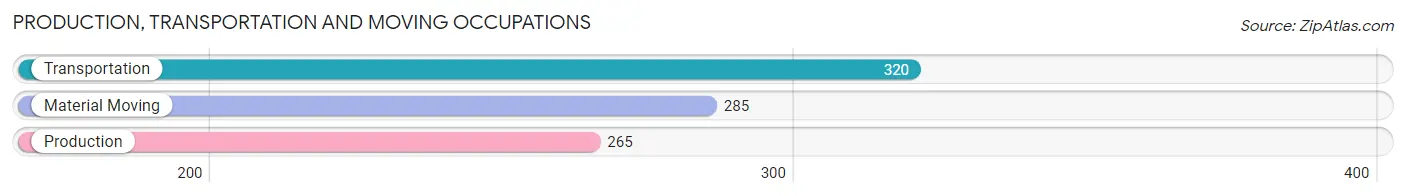
Production, Transportation and Moving Occupations
The most common Production, Transportation and Moving occupations in Westchester are Transportation (320 | 3.6%), Material Moving (285 | 3.2%), and Production (265 | 3.0%).
Production, Transportation and Moving Occupations by Sex
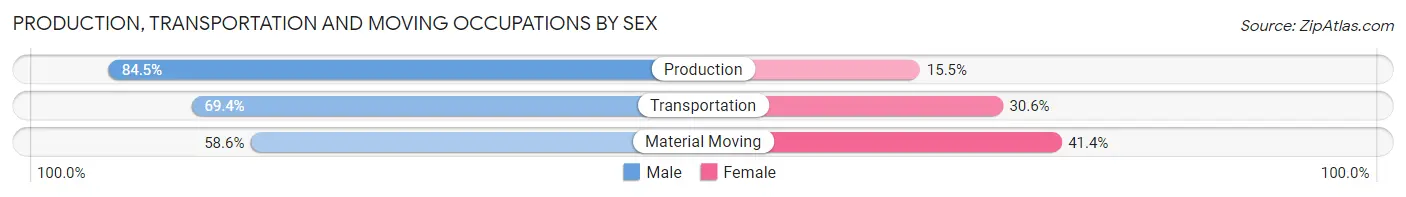
| Occupation | Male | Female |
| Production | 224 (84.5%) | 41 (15.5%) |
| Transportation | 222 (69.4%) | 98 (30.6%) |
| Material Moving | 167 (58.6%) | 118 (41.4%) |
| Total (Category) | 613 (70.5%) | 257 (29.5%) |
| Total (Overall) | 4,383 (49.5%) | 4,464 (50.5%) |
Employment Industries by Sex in Westchester
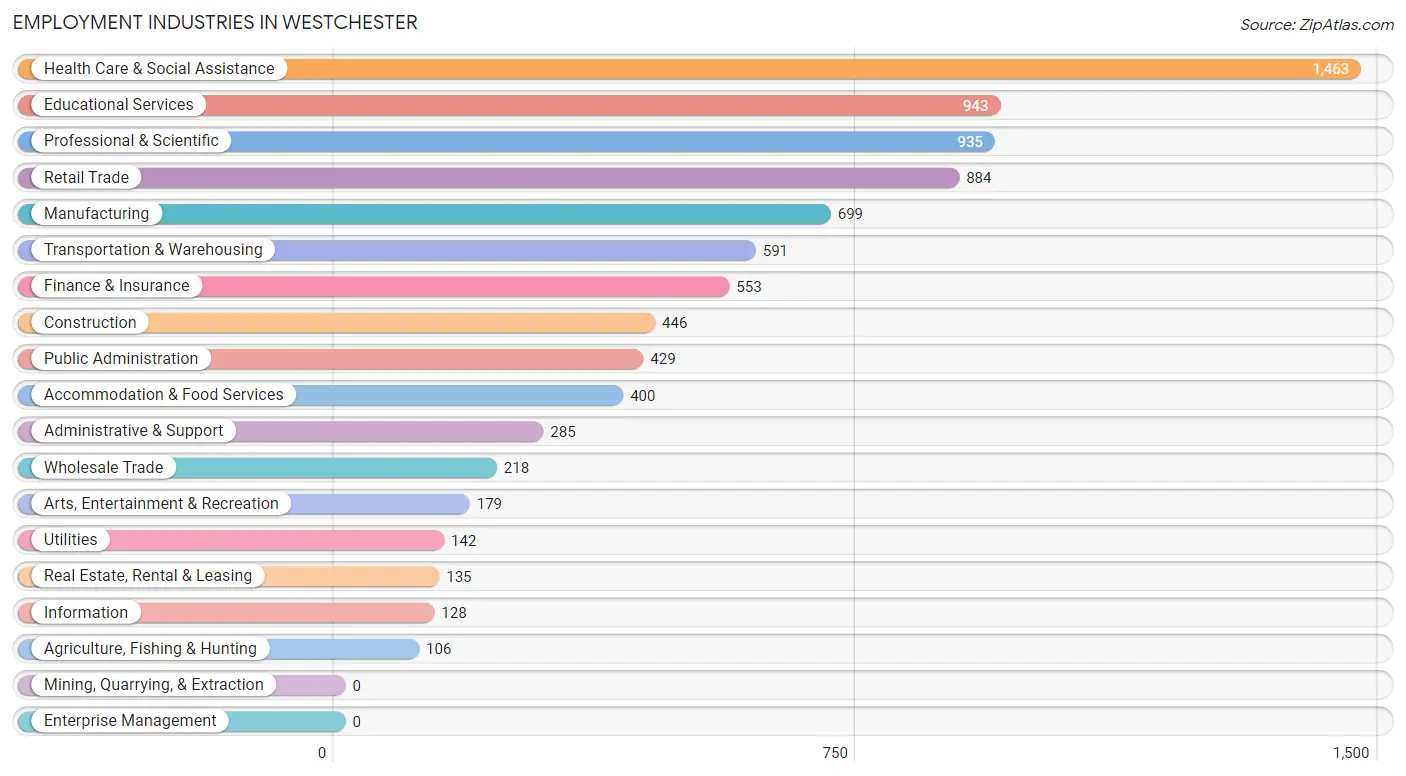
Employment Industries in Westchester
The major employment industries in Westchester include Health Care & Social Assistance (1,463 | 16.5%), Educational Services (943 | 10.7%), Professional & Scientific (935 | 10.6%), Retail Trade (884 | 10.0%), and Manufacturing (699 | 7.9%).
Employment Industries by Sex in Westchester
The Westchester industries that see more men than women are Construction (84.1%), Information (80.5%), and Utilities (73.9%), whereas the industries that tend to have a higher number of women are Health Care & Social Assistance (82.8%), Educational Services (64.9%), and Accommodation & Food Services (57.0%).
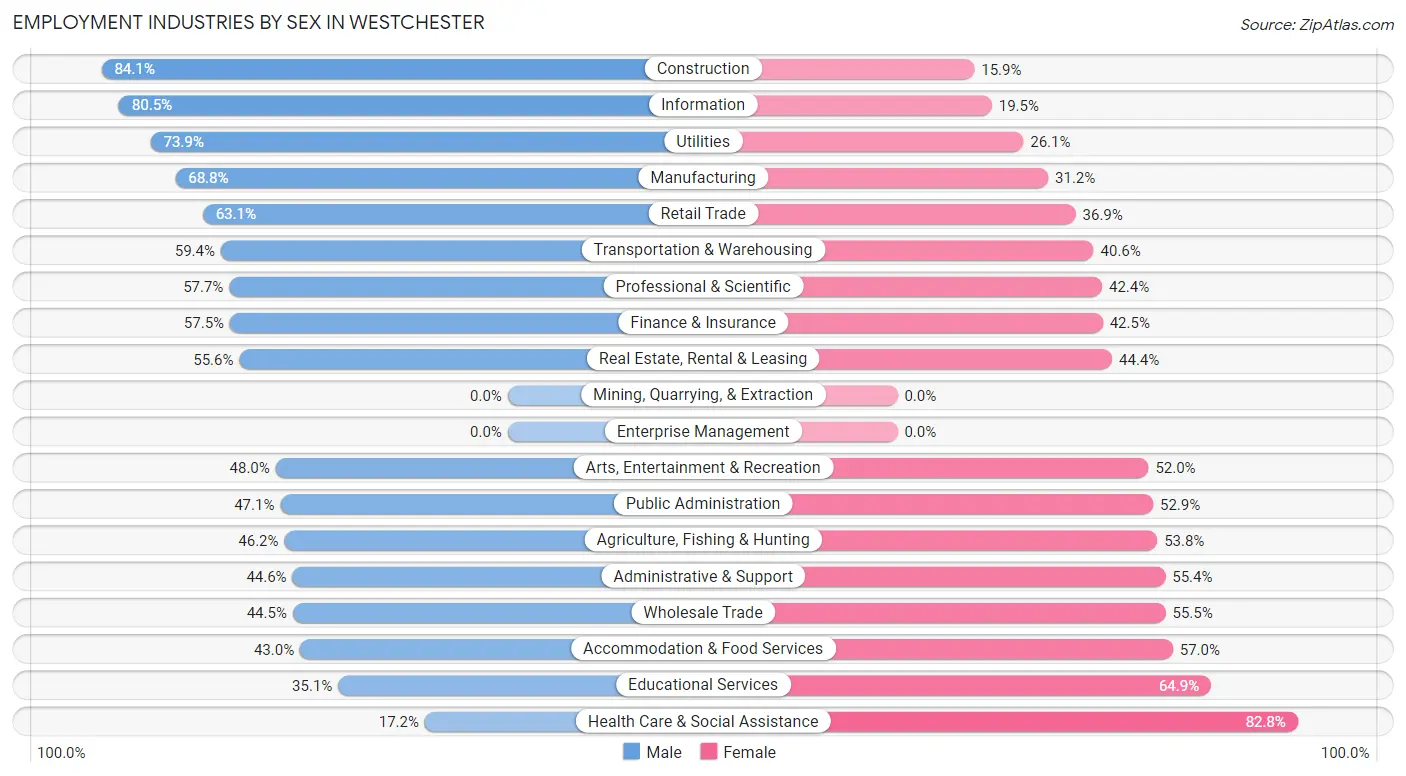
| Industry | Male | Female |
| Agriculture, Fishing & Hunting | 49 (46.2%) | 57 (53.8%) |
| Mining, Quarrying, & Extraction | 0 (0.0%) | 0 (0.0%) |
| Construction | 375 (84.1%) | 71 (15.9%) |
| Manufacturing | 481 (68.8%) | 218 (31.2%) |
| Wholesale Trade | 97 (44.5%) | 121 (55.5%) |
| Retail Trade | 558 (63.1%) | 326 (36.9%) |
| Transportation & Warehousing | 351 (59.4%) | 240 (40.6%) |
| Utilities | 105 (73.9%) | 37 (26.1%) |
| Information | 103 (80.5%) | 25 (19.5%) |
| Finance & Insurance | 318 (57.5%) | 235 (42.5%) |
| Real Estate, Rental & Leasing | 75 (55.6%) | 60 (44.4%) |
| Professional & Scientific | 539 (57.7%) | 396 (42.3%) |
| Enterprise Management | 0 (0.0%) | 0 (0.0%) |
| Administrative & Support | 127 (44.6%) | 158 (55.4%) |
| Educational Services | 331 (35.1%) | 612 (64.9%) |
| Health Care & Social Assistance | 251 (17.2%) | 1,212 (82.8%) |
| Arts, Entertainment & Recreation | 86 (48.0%) | 93 (52.0%) |
| Accommodation & Food Services | 172 (43.0%) | 228 (57.0%) |
| Public Administration | 202 (47.1%) | 227 (52.9%) |
| Total | 4,383 (49.5%) | 4,464 (50.5%) |
Education in Westchester
School Enrollment in Westchester
The most common levels of schooling among the 2,699 students in Westchester are high school (978 | 36.2%), college / undergraduate (492 | 18.2%), and middle school (463 | 17.2%).
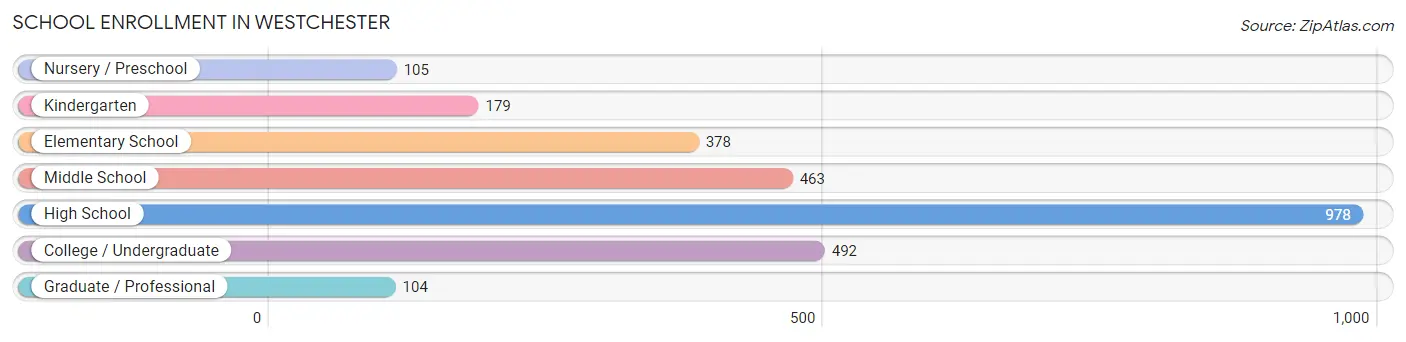
| School Level | # Students | % Students |
| Nursery / Preschool | 105 | 3.9% |
| Kindergarten | 179 | 6.6% |
| Elementary School | 378 | 14.0% |
| Middle School | 463 | 17.2% |
| High School | 978 | 36.2% |
| College / Undergraduate | 492 | 18.2% |
| Graduate / Professional | 104 | 3.8% |
| Total | 2,699 | 100.0% |
School Enrollment by Age by Funding Source in Westchester
Out of a total of 2,699 students who are enrolled in schools in Westchester, 829 (30.7%) attend a private institution, while the remaining 1,870 (69.3%) are enrolled in public schools. The age group of 25 to 34 year olds has the highest likelihood of being enrolled in private schools, with 73 (70.2% in the age bracket) enrolled. Conversely, the age group of 5 to 9 year old has the lowest likelihood of being enrolled in a private school, with 393 (91.8% in the age bracket) attending a public institution.
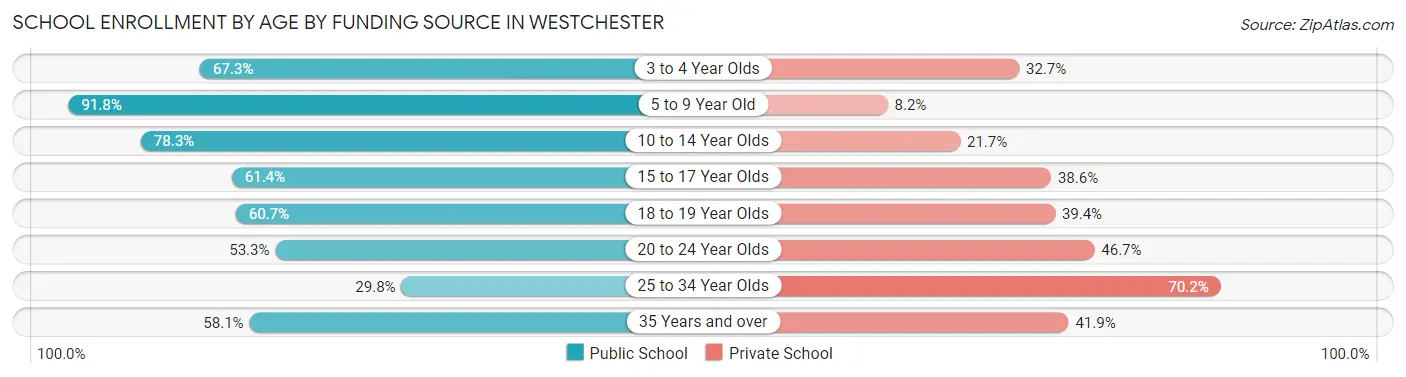
| Age Bracket | Public School | Private School |
| 3 to 4 Year Olds | 68 (67.3%) | 33 (32.7%) |
| 5 to 9 Year Old | 393 (91.8%) | 35 (8.2%) |
| 10 to 14 Year Olds | 629 (78.3%) | 174 (21.7%) |
| 15 to 17 Year Olds | 388 (61.4%) | 244 (38.6%) |
| 18 to 19 Year Olds | 131 (60.7%) | 85 (39.4%) |
| 20 to 24 Year Olds | 113 (53.3%) | 99 (46.7%) |
| 25 to 34 Year Olds | 31 (29.8%) | 73 (70.2%) |
| 35 Years and over | 118 (58.1%) | 85 (41.9%) |
| Total | 1,870 (69.3%) | 829 (30.7%) |
Educational Attainment by Field of Study in Westchester
Business (1,407 | 23.3%), education (747 | 12.4%), science & technology (493 | 8.2%), communications (479 | 7.9%), and social sciences (468 | 7.7%) are the most common fields of study among 6,045 individuals in Westchester who have obtained a bachelor's degree or higher.
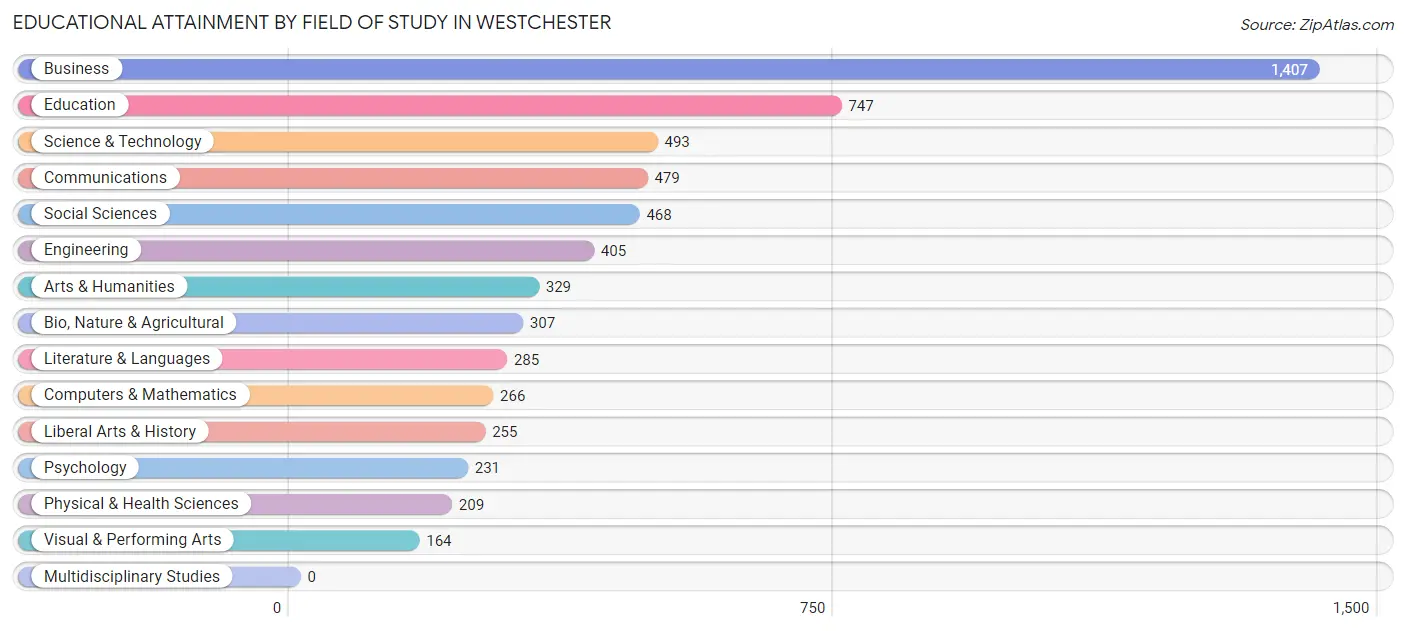
| Field of Study | # Graduates | % Graduates |
| Computers & Mathematics | 266 | 4.4% |
| Bio, Nature & Agricultural | 307 | 5.1% |
| Physical & Health Sciences | 209 | 3.5% |
| Psychology | 231 | 3.8% |
| Social Sciences | 468 | 7.7% |
| Engineering | 405 | 6.7% |
| Multidisciplinary Studies | 0 | 0.0% |
| Science & Technology | 493 | 8.2% |
| Business | 1,407 | 23.3% |
| Education | 747 | 12.4% |
| Literature & Languages | 285 | 4.7% |
| Liberal Arts & History | 255 | 4.2% |
| Visual & Performing Arts | 164 | 2.7% |
| Communications | 479 | 7.9% |
| Arts & Humanities | 329 | 5.4% |
| Total | 6,045 | 100.0% |
Transportation & Commute in Westchester
Vehicle Availability by Sex in Westchester
The most prevalent vehicle ownership categories in Westchester are males with 2 vehicles (2,273, accounting for 52.9%) and females with 2 vehicles (2,091, making up 52.5%).
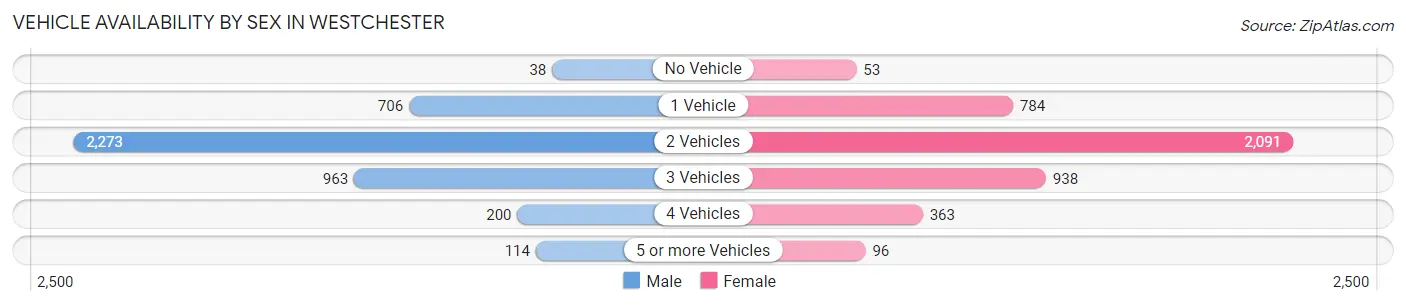
| Vehicles Available | Male | Female |
| No Vehicle | 38 (0.9%) | 53 (1.2%) |
| 1 Vehicle | 706 (16.4%) | 784 (18.1%) |
| 2 Vehicles | 2,273 (52.9%) | 2,091 (48.3%) |
| 3 Vehicles | 963 (22.4%) | 938 (21.7%) |
| 4 Vehicles | 200 (4.7%) | 363 (8.4%) |
| 5 or more Vehicles | 114 (2.6%) | 96 (2.2%) |
| Total | 4,294 (100.0%) | 4,325 (100.0%) |
Commute Time in Westchester
The most frequently occuring commute durations in Westchester are 30 to 34 minutes (1,278 commuters, 16.9%), 20 to 24 minutes (1,002 commuters, 13.3%), and 10 to 14 minutes (993 commuters, 13.2%).
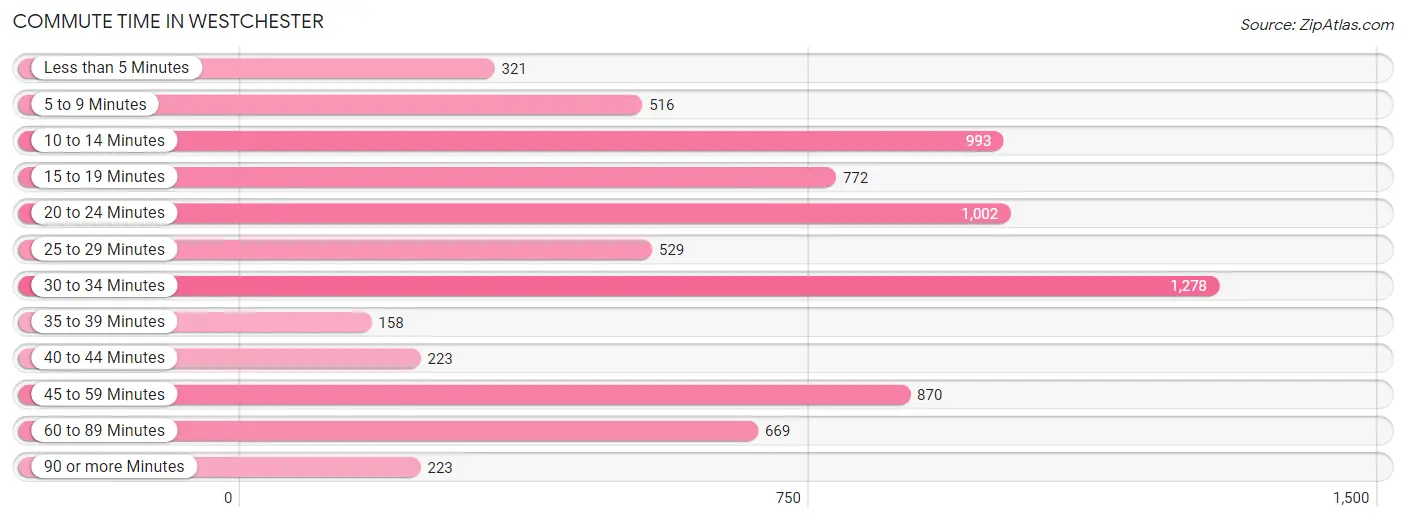
| Commute Time | # Commuters | % Commuters |
| Less than 5 Minutes | 321 | 4.3% |
| 5 to 9 Minutes | 516 | 6.8% |
| 10 to 14 Minutes | 993 | 13.2% |
| 15 to 19 Minutes | 772 | 10.2% |
| 20 to 24 Minutes | 1,002 | 13.3% |
| 25 to 29 Minutes | 529 | 7.0% |
| 30 to 34 Minutes | 1,278 | 16.9% |
| 35 to 39 Minutes | 158 | 2.1% |
| 40 to 44 Minutes | 223 | 2.9% |
| 45 to 59 Minutes | 870 | 11.5% |
| 60 to 89 Minutes | 669 | 8.9% |
| 90 or more Minutes | 223 | 2.9% |
Commute Time by Sex in Westchester
The most common commute times in Westchester are 30 to 34 minutes (587 commuters, 15.2%) for males and 30 to 34 minutes (691 commuters, 18.7%) for females.
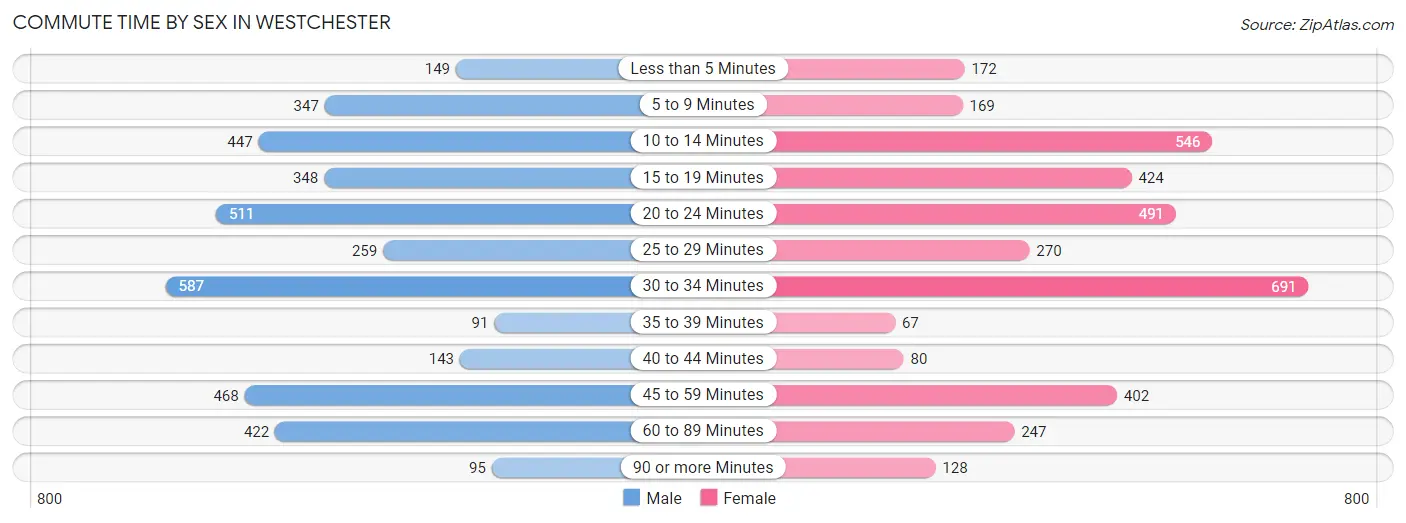
| Commute Time | Male | Female |
| Less than 5 Minutes | 149 (3.8%) | 172 (4.7%) |
| 5 to 9 Minutes | 347 (9.0%) | 169 (4.6%) |
| 10 to 14 Minutes | 447 (11.6%) | 546 (14.8%) |
| 15 to 19 Minutes | 348 (9.0%) | 424 (11.5%) |
| 20 to 24 Minutes | 511 (13.2%) | 491 (13.3%) |
| 25 to 29 Minutes | 259 (6.7%) | 270 (7.3%) |
| 30 to 34 Minutes | 587 (15.2%) | 691 (18.7%) |
| 35 to 39 Minutes | 91 (2.4%) | 67 (1.8%) |
| 40 to 44 Minutes | 143 (3.7%) | 80 (2.2%) |
| 45 to 59 Minutes | 468 (12.1%) | 402 (10.9%) |
| 60 to 89 Minutes | 422 (10.9%) | 247 (6.7%) |
| 90 or more Minutes | 95 (2.5%) | 128 (3.5%) |
Time of Departure to Work by Sex in Westchester
The most frequent times of departure to work in Westchester are 7:00 AM to 7:29 AM (475, 12.3%) for males and 7:00 AM to 7:29 AM (590, 16.0%) for females.
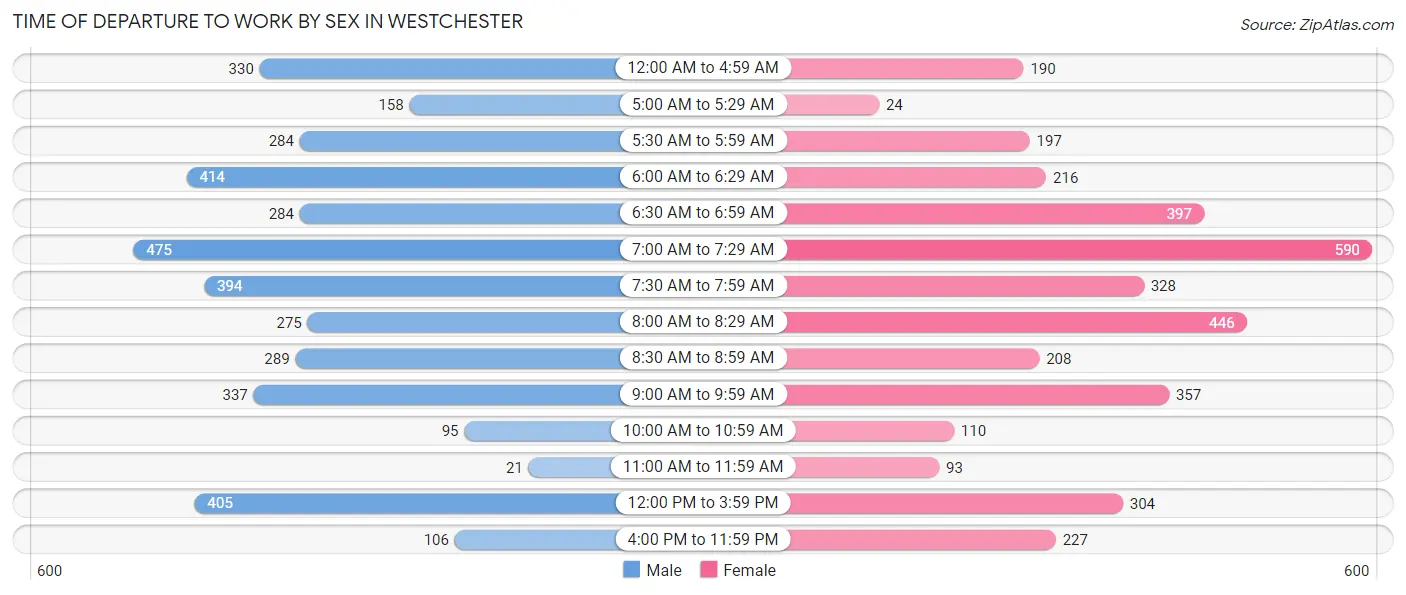
| Time of Departure | Male | Female |
| 12:00 AM to 4:59 AM | 330 (8.5%) | 190 (5.1%) |
| 5:00 AM to 5:29 AM | 158 (4.1%) | 24 (0.6%) |
| 5:30 AM to 5:59 AM | 284 (7.3%) | 197 (5.3%) |
| 6:00 AM to 6:29 AM | 414 (10.7%) | 216 (5.9%) |
| 6:30 AM to 6:59 AM | 284 (7.3%) | 397 (10.8%) |
| 7:00 AM to 7:29 AM | 475 (12.3%) | 590 (16.0%) |
| 7:30 AM to 7:59 AM | 394 (10.2%) | 328 (8.9%) |
| 8:00 AM to 8:29 AM | 275 (7.1%) | 446 (12.1%) |
| 8:30 AM to 8:59 AM | 289 (7.5%) | 208 (5.6%) |
| 9:00 AM to 9:59 AM | 337 (8.7%) | 357 (9.7%) |
| 10:00 AM to 10:59 AM | 95 (2.5%) | 110 (3.0%) |
| 11:00 AM to 11:59 AM | 21 (0.5%) | 93 (2.5%) |
| 12:00 PM to 3:59 PM | 405 (10.5%) | 304 (8.3%) |
| 4:00 PM to 11:59 PM | 106 (2.7%) | 227 (6.2%) |
| Total | 3,867 (100.0%) | 3,687 (100.0%) |
Housing Occupancy in Westchester
Occupancy by Ownership in Westchester
Of the total 7,145 dwellings in Westchester, owner-occupied units account for 6,502 (91.0%), while renter-occupied units make up 643 (9.0%).
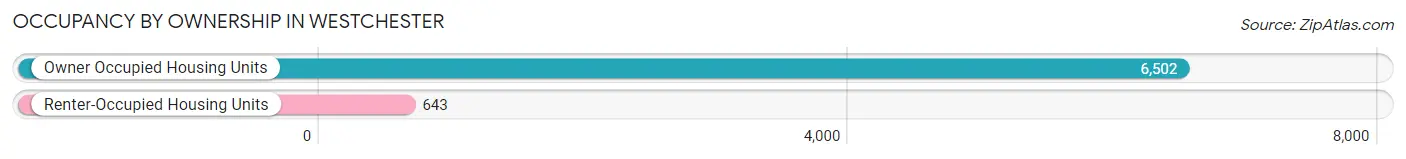
| Occupancy | # Housing Units | % Housing Units |
| Owner Occupied Housing Units | 6,502 | 91.0% |
| Renter-Occupied Housing Units | 643 | 9.0% |
| Total Occupied Housing Units | 7,145 | 100.0% |
Occupancy by Household Size in Westchester
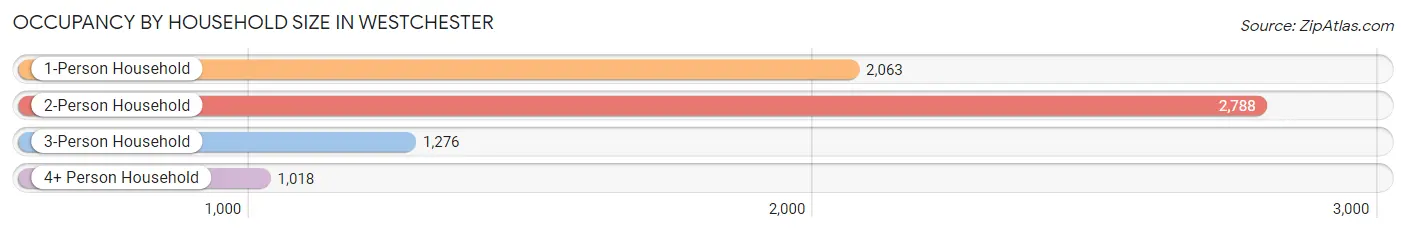
| Household Size | # Housing Units | % Housing Units |
| 1-Person Household | 2,063 | 28.9% |
| 2-Person Household | 2,788 | 39.0% |
| 3-Person Household | 1,276 | 17.9% |
| 4+ Person Household | 1,018 | 14.2% |
| Total Housing Units | 7,145 | 100.0% |
Occupancy by Ownership by Household Size in Westchester
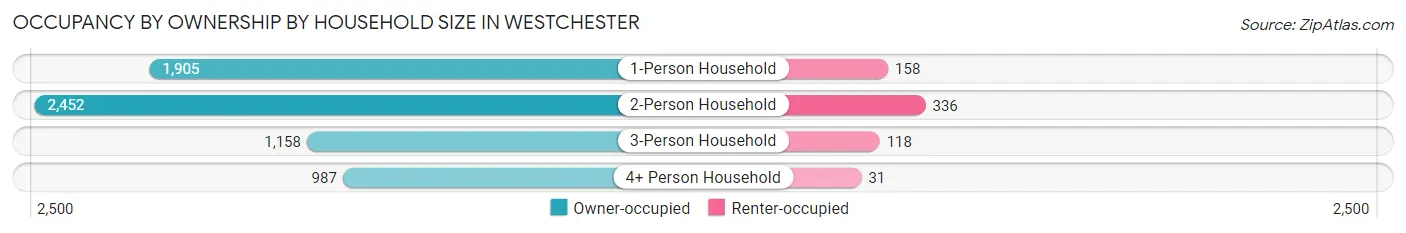
| Household Size | Owner-occupied | Renter-occupied |
| 1-Person Household | 1,905 (92.3%) | 158 (7.7%) |
| 2-Person Household | 2,452 (87.9%) | 336 (12.0%) |
| 3-Person Household | 1,158 (90.7%) | 118 (9.2%) |
| 4+ Person Household | 987 (97.0%) | 31 (3.0%) |
| Total Housing Units | 6,502 (91.0%) | 643 (9.0%) |
Occupancy by Educational Attainment in Westchester

| Household Size | Owner-occupied | Renter-occupied |
| Less than High School | 372 (90.5%) | 39 (9.5%) |
| High School Diploma | 1,105 (87.7%) | 155 (12.3%) |
| College/Associate Degree | 1,946 (90.8%) | 197 (9.2%) |
| Bachelor's Degree or higher | 3,079 (92.4%) | 252 (7.6%) |
Occupancy by Age of Householder in Westchester
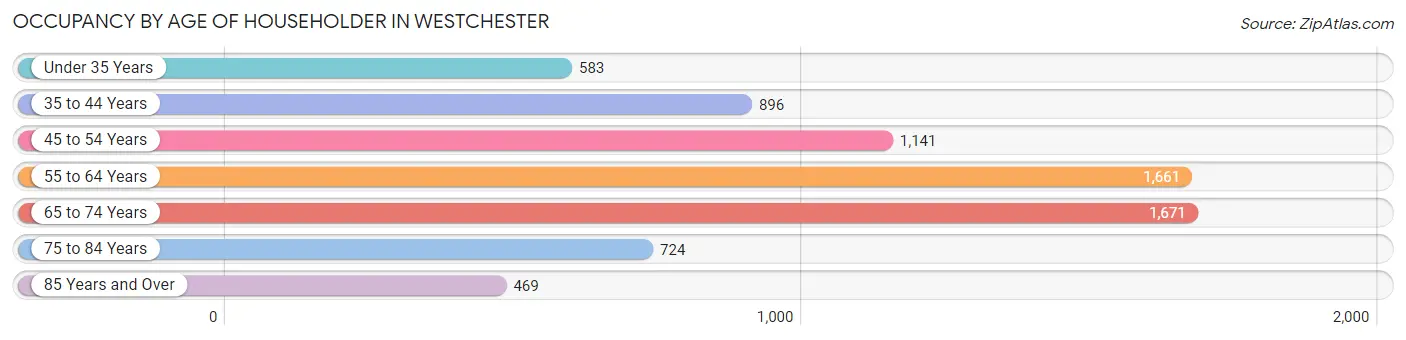
| Age Bracket | # Households | % Households |
| Under 35 Years | 583 | 8.2% |
| 35 to 44 Years | 896 | 12.5% |
| 45 to 54 Years | 1,141 | 16.0% |
| 55 to 64 Years | 1,661 | 23.3% |
| 65 to 74 Years | 1,671 | 23.4% |
| 75 to 84 Years | 724 | 10.1% |
| 85 Years and Over | 469 | 6.6% |
| Total | 7,145 | 100.0% |
Housing Finances in Westchester
Median Income by Occupancy in Westchester
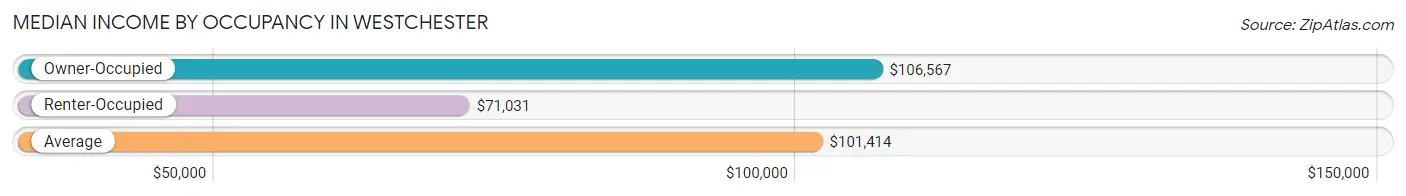
| Occupancy Type | # Households | Median Income |
| Owner-Occupied | 6,502 (91.0%) | $106,567 |
| Renter-Occupied | 643 (9.0%) | $71,031 |
| Average | 7,145 (100.0%) | $101,414 |
Occupancy by Householder Income Bracket in Westchester
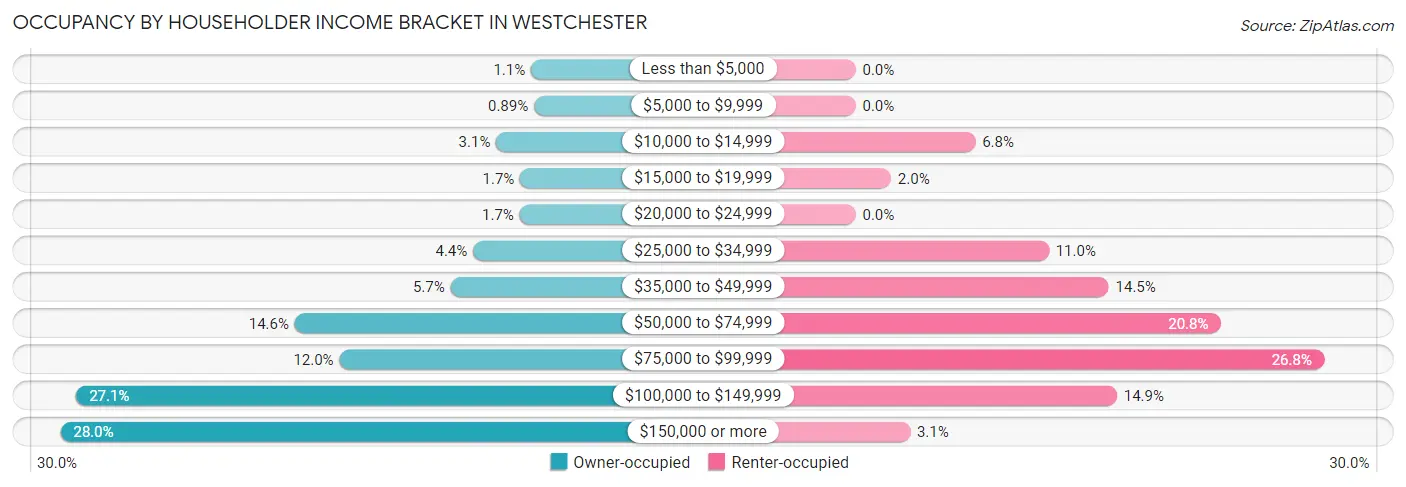
| Income Bracket | Owner-occupied | Renter-occupied |
| Less than $5,000 | 69 (1.1%) | 0 (0.0%) |
| $5,000 to $9,999 | 58 (0.9%) | 0 (0.0%) |
| $10,000 to $14,999 | 198 (3.0%) | 44 (6.8%) |
| $15,000 to $19,999 | 109 (1.7%) | 13 (2.0%) |
| $20,000 to $24,999 | 111 (1.7%) | 0 (0.0%) |
| $25,000 to $34,999 | 284 (4.4%) | 71 (11.0%) |
| $35,000 to $49,999 | 368 (5.7%) | 93 (14.5%) |
| $50,000 to $74,999 | 947 (14.6%) | 134 (20.8%) |
| $75,000 to $99,999 | 781 (12.0%) | 172 (26.8%) |
| $100,000 to $149,999 | 1,759 (27.1%) | 96 (14.9%) |
| $150,000 or more | 1,818 (28.0%) | 20 (3.1%) |
| Total | 6,502 (100.0%) | 643 (100.0%) |
Monthly Housing Cost Tiers in Westchester
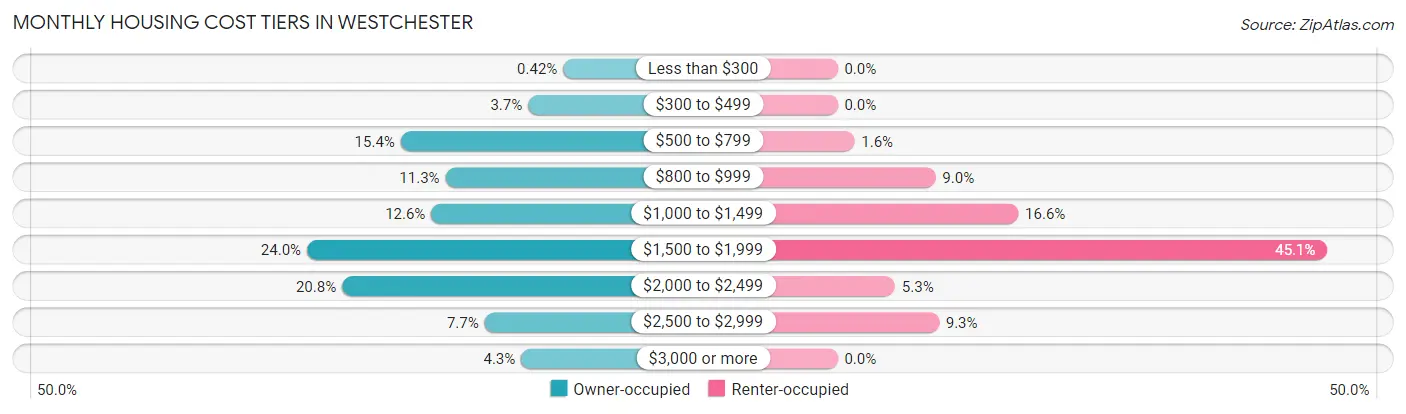
| Monthly Cost | Owner-occupied | Renter-occupied |
| Less than $300 | 27 (0.4%) | 0 (0.0%) |
| $300 to $499 | 237 (3.6%) | 0 (0.0%) |
| $500 to $799 | 1,000 (15.4%) | 10 (1.6%) |
| $800 to $999 | 732 (11.3%) | 58 (9.0%) |
| $1,000 to $1,499 | 817 (12.6%) | 107 (16.6%) |
| $1,500 to $1,999 | 1,561 (24.0%) | 290 (45.1%) |
| $2,000 to $2,499 | 1,351 (20.8%) | 34 (5.3%) |
| $2,500 to $2,999 | 498 (7.7%) | 60 (9.3%) |
| $3,000 or more | 279 (4.3%) | 0 (0.0%) |
| Total | 6,502 (100.0%) | 643 (100.0%) |
Physical Housing Characteristics in Westchester
Housing Structures in Westchester
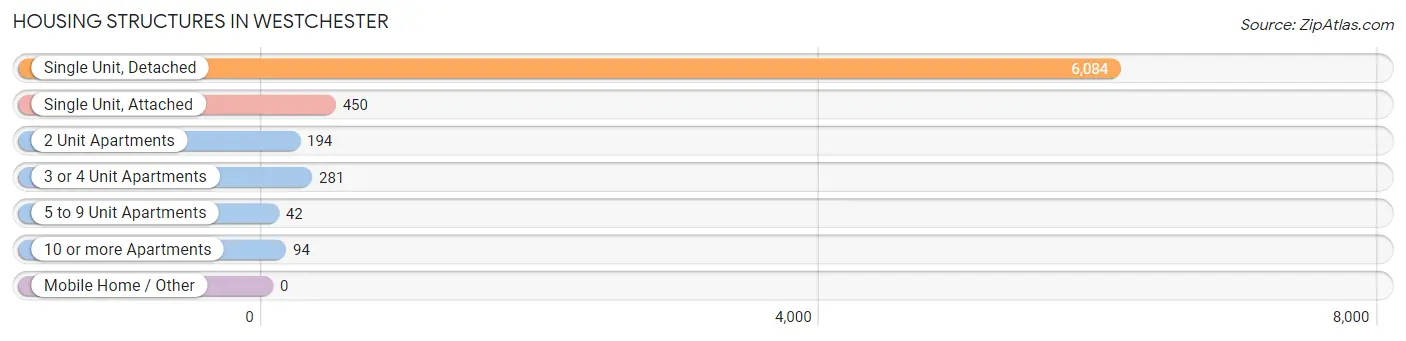
| Structure Type | # Housing Units | % Housing Units |
| Single Unit, Detached | 6,084 | 85.2% |
| Single Unit, Attached | 450 | 6.3% |
| 2 Unit Apartments | 194 | 2.7% |
| 3 or 4 Unit Apartments | 281 | 3.9% |
| 5 to 9 Unit Apartments | 42 | 0.6% |
| 10 or more Apartments | 94 | 1.3% |
| Mobile Home / Other | 0 | 0.0% |
| Total | 7,145 | 100.0% |
Housing Structures by Occupancy in Westchester
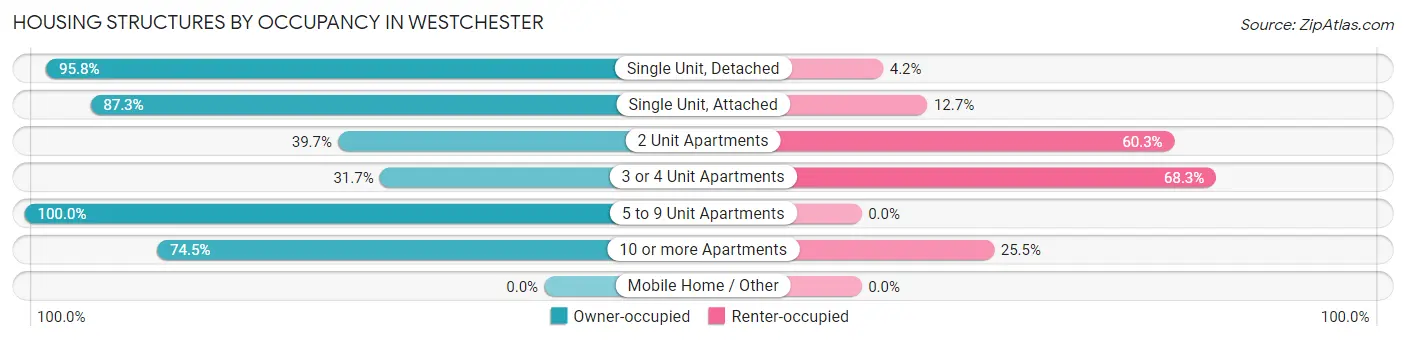
| Structure Type | Owner-occupied | Renter-occupied |
| Single Unit, Detached | 5,831 (95.8%) | 253 (4.2%) |
| Single Unit, Attached | 393 (87.3%) | 57 (12.7%) |
| 2 Unit Apartments | 77 (39.7%) | 117 (60.3%) |
| 3 or 4 Unit Apartments | 89 (31.7%) | 192 (68.3%) |
| 5 to 9 Unit Apartments | 42 (100.0%) | 0 (0.0%) |
| 10 or more Apartments | 70 (74.5%) | 24 (25.5%) |
| Mobile Home / Other | 0 (0.0%) | 0 (0.0%) |
| Total | 6,502 (91.0%) | 643 (9.0%) |
Housing Structures by Number of Rooms in Westchester
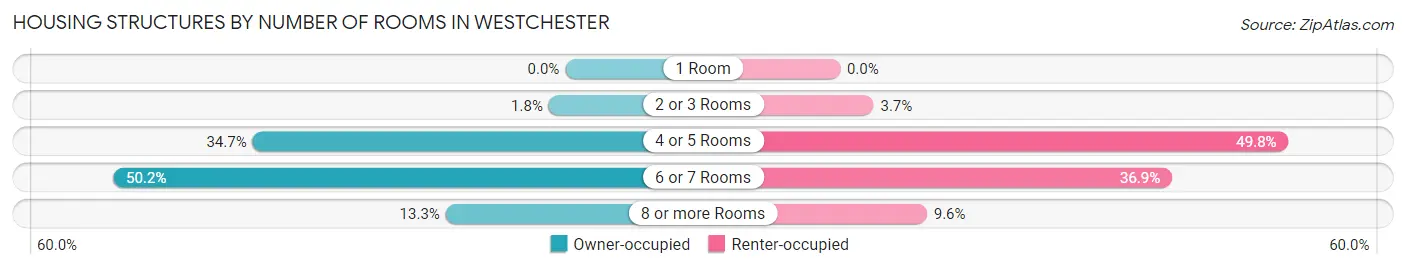
| Number of Rooms | Owner-occupied | Renter-occupied |
| 1 Room | 0 (0.0%) | 0 (0.0%) |
| 2 or 3 Rooms | 119 (1.8%) | 24 (3.7%) |
| 4 or 5 Rooms | 2,257 (34.7%) | 320 (49.8%) |
| 6 or 7 Rooms | 3,263 (50.2%) | 237 (36.9%) |
| 8 or more Rooms | 863 (13.3%) | 62 (9.6%) |
| Total | 6,502 (100.0%) | 643 (100.0%) |
Housing Structure by Heating Type in Westchester
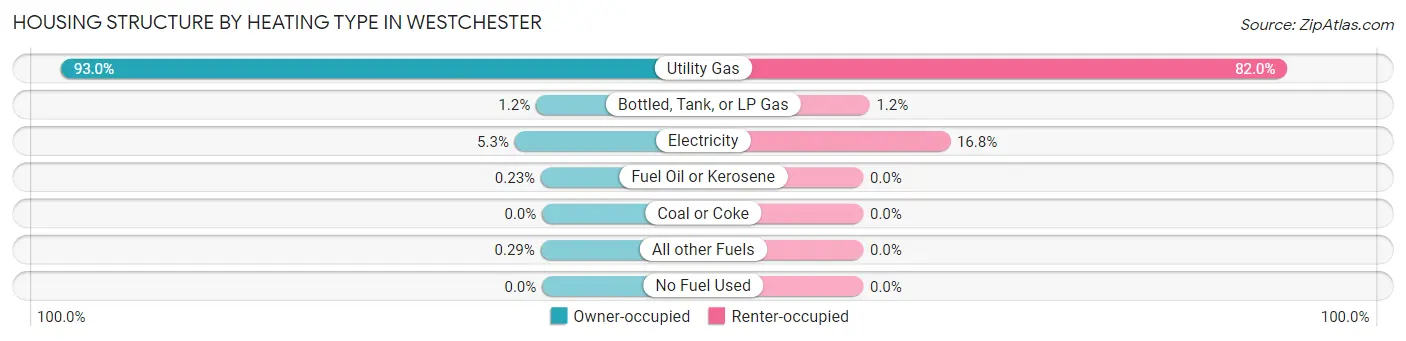
| Heating Type | Owner-occupied | Renter-occupied |
| Utility Gas | 6,047 (93.0%) | 527 (82.0%) |
| Bottled, Tank, or LP Gas | 77 (1.2%) | 8 (1.2%) |
| Electricity | 344 (5.3%) | 108 (16.8%) |
| Fuel Oil or Kerosene | 15 (0.2%) | 0 (0.0%) |
| Coal or Coke | 0 (0.0%) | 0 (0.0%) |
| All other Fuels | 19 (0.3%) | 0 (0.0%) |
| No Fuel Used | 0 (0.0%) | 0 (0.0%) |
| Total | 6,502 (100.0%) | 643 (100.0%) |
Household Vehicle Usage in Westchester
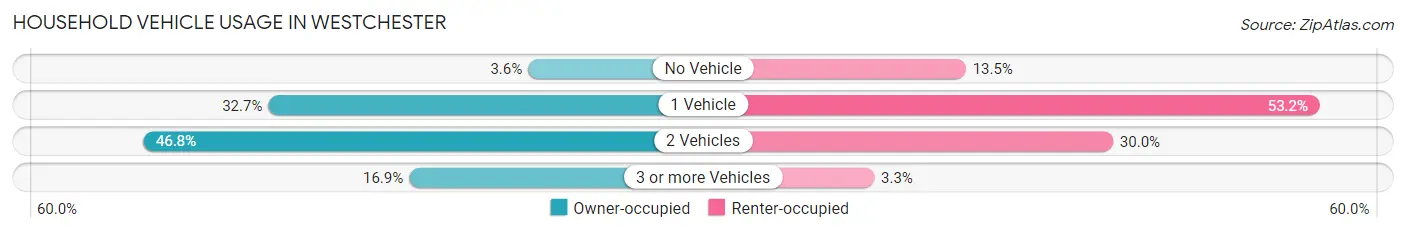
| Vehicles per Household | Owner-occupied | Renter-occupied |
| No Vehicle | 234 (3.6%) | 87 (13.5%) |
| 1 Vehicle | 2,127 (32.7%) | 342 (53.2%) |
| 2 Vehicles | 3,040 (46.8%) | 193 (30.0%) |
| 3 or more Vehicles | 1,101 (16.9%) | 21 (3.3%) |
| Total | 6,502 (100.0%) | 643 (100.0%) |
Real Estate & Mortgages in Westchester
Real Estate and Mortgage Overview in Westchester
| Characteristic | Without Mortgage | With Mortgage |
| Housing Units | 2,176 | 4,326 |
| Median Property Value | $279,000 | $287,200 |
| Median Household Income | $65,921 | $1,545 |
| Monthly Housing Costs | $771 | $279 |
| Real Estate Taxes | $5,717 | $17 |
Property Value by Mortgage Status in Westchester
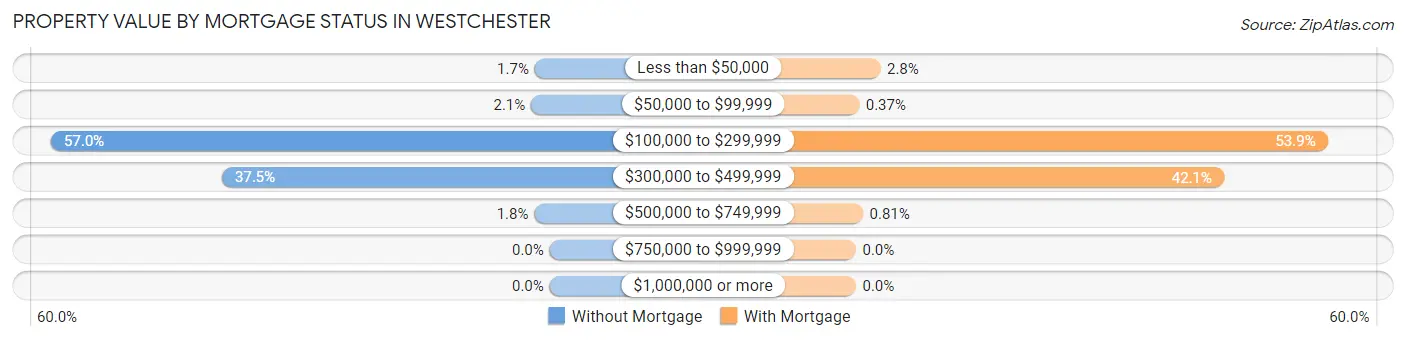
| Property Value | Without Mortgage | With Mortgage |
| Less than $50,000 | 37 (1.7%) | 121 (2.8%) |
| $50,000 to $99,999 | 46 (2.1%) | 16 (0.4%) |
| $100,000 to $299,999 | 1,240 (57.0%) | 2,333 (53.9%) |
| $300,000 to $499,999 | 815 (37.4%) | 1,821 (42.1%) |
| $500,000 to $749,999 | 38 (1.8%) | 35 (0.8%) |
| $750,000 to $999,999 | 0 (0.0%) | 0 (0.0%) |
| $1,000,000 or more | 0 (0.0%) | 0 (0.0%) |
| Total | 2,176 (100.0%) | 4,326 (100.0%) |
Household Income by Mortgage Status in Westchester
| Household Income | Without Mortgage | With Mortgage |
| Less than $10,000 | 56 (2.6%) | 117 (2.7%) |
| $10,000 to $24,999 | 220 (10.1%) | 71 (1.6%) |
| $25,000 to $34,999 | 273 (12.6%) | 198 (4.6%) |
| $35,000 to $49,999 | 162 (7.4%) | 11 (0.3%) |
| $50,000 to $74,999 | 540 (24.8%) | 206 (4.8%) |
| $75,000 to $99,999 | 222 (10.2%) | 407 (9.4%) |
| $100,000 to $149,999 | 430 (19.8%) | 559 (12.9%) |
| $150,000 or more | 273 (12.6%) | 1,329 (30.7%) |
| Total | 2,176 (100.0%) | 4,326 (100.0%) |
Property Value to Household Income Ratio in Westchester
| Value-to-Income Ratio | Without Mortgage | With Mortgage |
| Less than 2.0x | 329 (15.1%) | 121,563 (2,810.1%) |
| 2.0x to 2.9x | 402 (18.5%) | 1,661 (38.4%) |
| 3.0x to 3.9x | 320 (14.7%) | 1,272 (29.4%) |
| 4.0x or more | 1,113 (51.1%) | 565 (13.1%) |
| Total | 2,176 (100.0%) | 4,326 (100.0%) |
Real Estate Taxes by Mortgage Status in Westchester
| Property Taxes | Without Mortgage | With Mortgage |
| Less than $800 | 37 (1.7%) | 0 (0.0%) |
| $800 to $1,499 | 78 (3.6%) | 64 (1.5%) |
| $800 to $1,499 | 1,974 (90.7%) | 29 (0.7%) |
| Total | 2,176 (100.0%) | 4,326 (100.0%) |
Health & Disability in Westchester
Health Insurance Coverage by Age in Westchester
| Age Bracket | With Coverage | Without Coverage |
| Under 6 Years | 702 (98.3%) | 12 (1.7%) |
| 6 to 18 Years | 1,942 (100.0%) | 0 (0.0%) |
| 19 to 25 Years | 1,155 (98.7%) | 15 (1.3%) |
| 26 to 34 Years | 1,319 (98.6%) | 19 (1.4%) |
| 35 to 44 Years | 1,677 (94.0%) | 108 (6.0%) |
| 45 to 54 Years | 2,027 (98.3%) | 36 (1.8%) |
| 55 to 64 Years | 3,003 (99.6%) | 12 (0.4%) |
| 65 to 74 Years | 2,707 (100.0%) | 0 (0.0%) |
| 75 Years and older | 1,860 (100.0%) | 0 (0.0%) |
| Total | 16,392 (98.8%) | 202 (1.2%) |
Health Insurance Coverage by Citizenship Status in Westchester
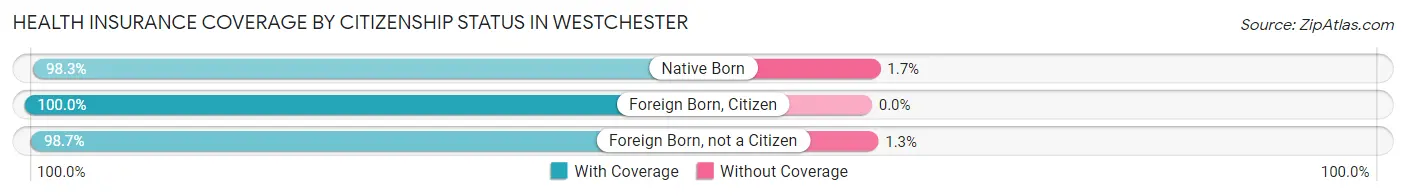
| Citizenship Status | With Coverage | Without Coverage |
| Native Born | 702 (98.3%) | 12 (1.7%) |
| Foreign Born, Citizen | 1,942 (100.0%) | 0 (0.0%) |
| Foreign Born, not a Citizen | 1,155 (98.7%) | 15 (1.3%) |
Health Insurance Coverage by Household Income in Westchester
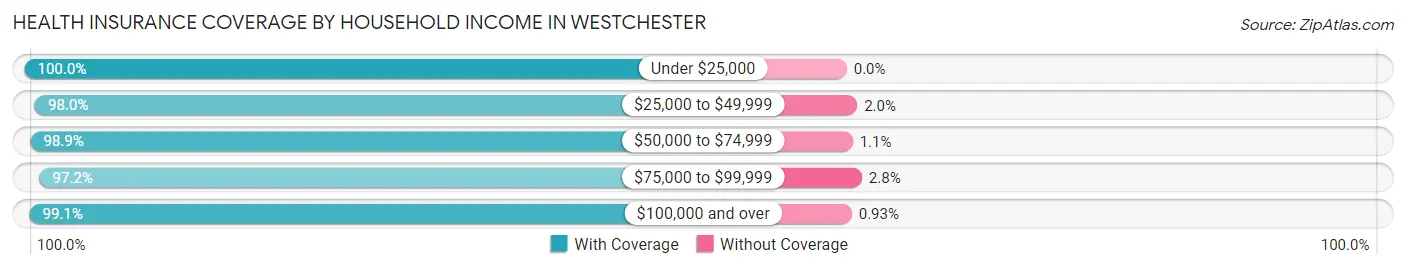
| Household Income | With Coverage | Without Coverage |
| Under $25,000 | 821 (100.0%) | 0 (0.0%) |
| $25,000 to $49,999 | 1,349 (98.0%) | 27 (2.0%) |
| $50,000 to $74,999 | 2,058 (98.9%) | 23 (1.1%) |
| $75,000 to $99,999 | 1,921 (97.2%) | 56 (2.8%) |
| $100,000 and over | 10,184 (99.1%) | 96 (0.9%) |
Public vs Private Health Insurance Coverage by Age in Westchester
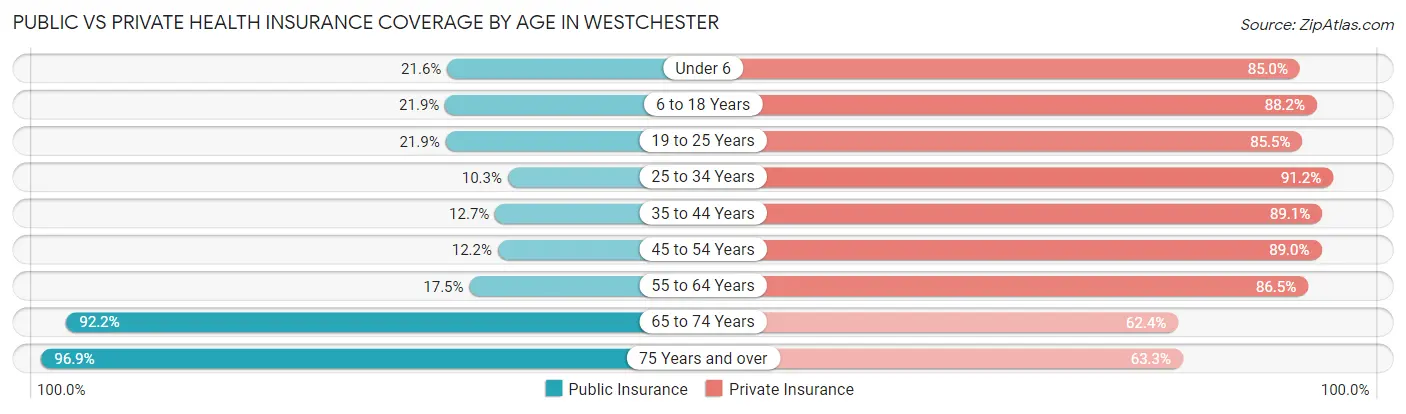
| Age Bracket | Public Insurance | Private Insurance |
| Under 6 | 154 (21.6%) | 607 (85.0%) |
| 6 to 18 Years | 426 (21.9%) | 1,712 (88.2%) |
| 19 to 25 Years | 256 (21.9%) | 1,000 (85.5%) |
| 25 to 34 Years | 138 (10.3%) | 1,220 (91.2%) |
| 35 to 44 Years | 226 (12.7%) | 1,591 (89.1%) |
| 45 to 54 Years | 251 (12.2%) | 1,836 (89.0%) |
| 55 to 64 Years | 526 (17.4%) | 2,609 (86.5%) |
| 65 to 74 Years | 2,497 (92.2%) | 1,690 (62.4%) |
| 75 Years and over | 1,802 (96.9%) | 1,177 (63.3%) |
| Total | 6,276 (37.8%) | 13,442 (81.0%) |
Disability Status by Sex by Age in Westchester
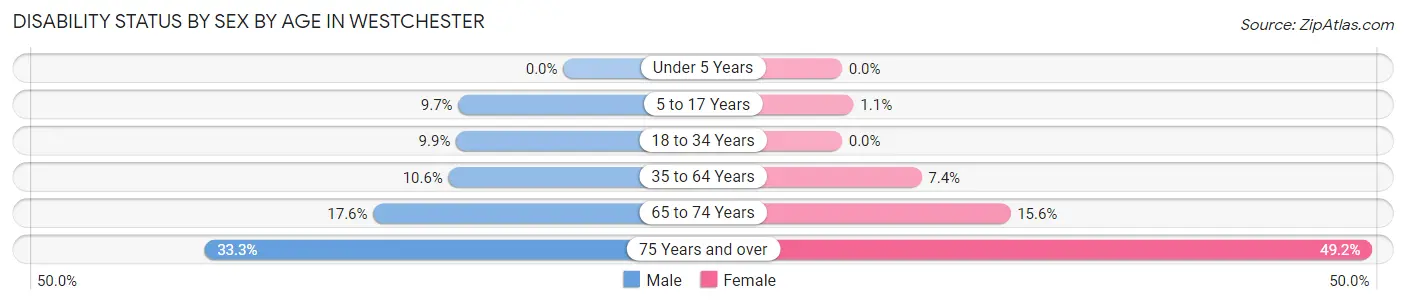
| Age Bracket | Male | Female |
| Under 5 Years | 0 (0.0%) | 0 (0.0%) |
| 5 to 17 Years | 71 (9.7%) | 13 (1.1%) |
| 18 to 34 Years | 124 (9.9%) | 0 (0.0%) |
| 35 to 64 Years | 367 (10.6%) | 252 (7.4%) |
| 65 to 74 Years | 219 (17.6%) | 229 (15.6%) |
| 75 Years and over | 232 (33.3%) | 573 (49.2%) |
Disability Class by Sex by Age in Westchester
Disability Class: Hearing Difficulty
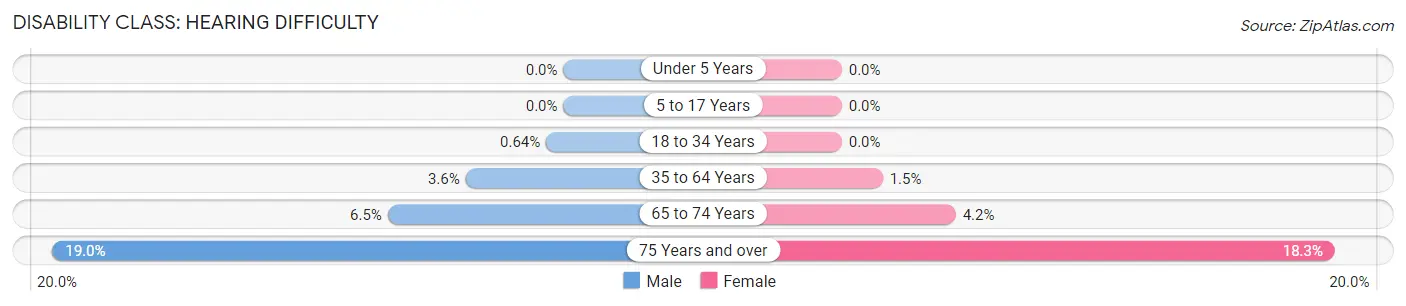
| Age Bracket | Male | Female |
| Under 5 Years | 0 (0.0%) | 0 (0.0%) |
| 5 to 17 Years | 0 (0.0%) | 0 (0.0%) |
| 18 to 34 Years | 8 (0.6%) | 0 (0.0%) |
| 35 to 64 Years | 125 (3.6%) | 52 (1.5%) |
| 65 to 74 Years | 81 (6.5%) | 62 (4.2%) |
| 75 Years and over | 132 (19.0%) | 213 (18.3%) |
Disability Class: Vision Difficulty
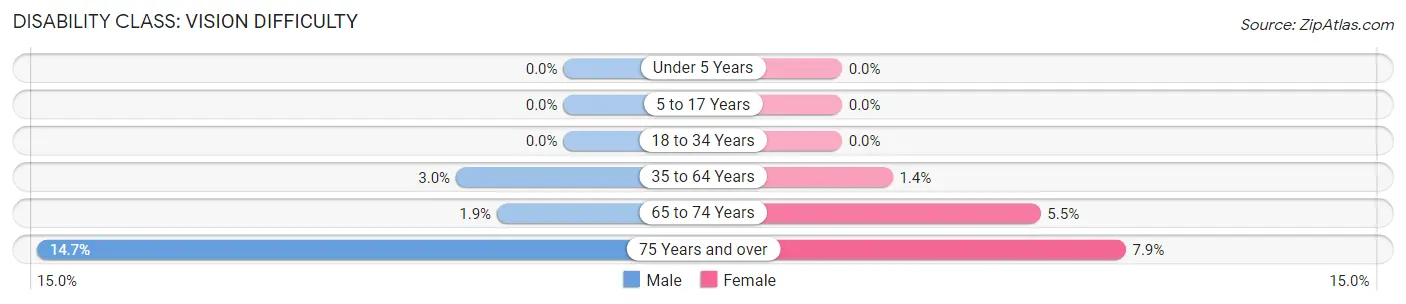
| Age Bracket | Male | Female |
| Under 5 Years | 0 (0.0%) | 0 (0.0%) |
| 5 to 17 Years | 0 (0.0%) | 0 (0.0%) |
| 18 to 34 Years | 0 (0.0%) | 0 (0.0%) |
| 35 to 64 Years | 103 (3.0%) | 48 (1.4%) |
| 65 to 74 Years | 23 (1.8%) | 81 (5.5%) |
| 75 Years and over | 102 (14.7%) | 92 (7.9%) |
Disability Class: Cognitive Difficulty
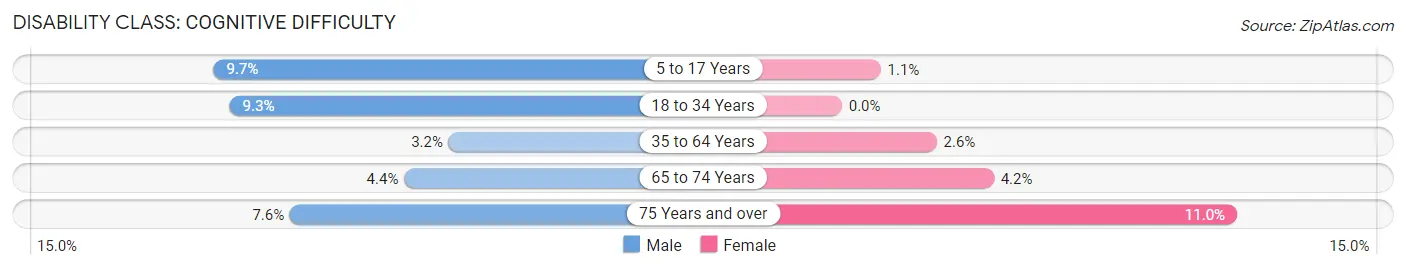
| Age Bracket | Male | Female |
| 5 to 17 Years | 71 (9.7%) | 13 (1.1%) |
| 18 to 34 Years | 116 (9.3%) | 0 (0.0%) |
| 35 to 64 Years | 110 (3.2%) | 90 (2.6%) |
| 65 to 74 Years | 55 (4.4%) | 62 (4.2%) |
| 75 Years and over | 53 (7.6%) | 128 (11.0%) |
Disability Class: Ambulatory Difficulty
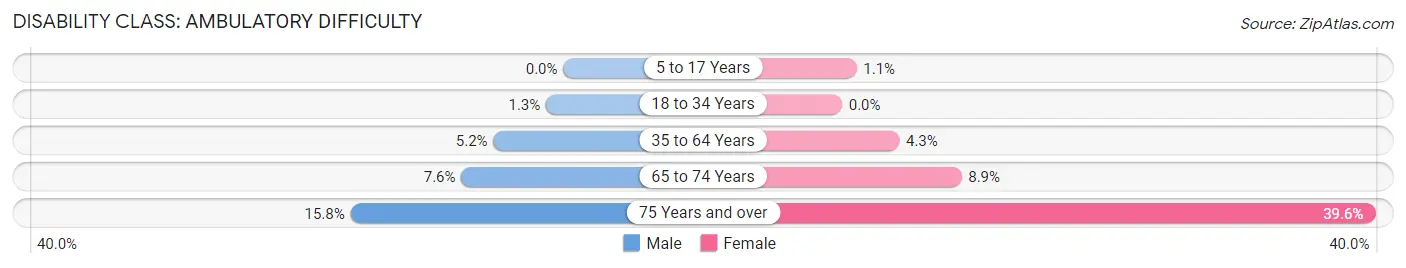
| Age Bracket | Male | Female |
| 5 to 17 Years | 0 (0.0%) | 13 (1.1%) |
| 18 to 34 Years | 16 (1.3%) | 0 (0.0%) |
| 35 to 64 Years | 179 (5.2%) | 145 (4.3%) |
| 65 to 74 Years | 94 (7.6%) | 130 (8.9%) |
| 75 Years and over | 110 (15.8%) | 461 (39.6%) |
Disability Class: Self-Care Difficulty
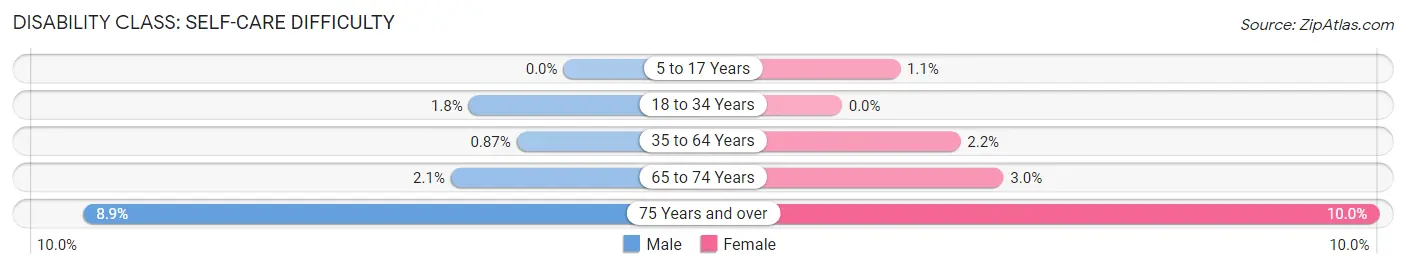
| Age Bracket | Male | Female |
| 5 to 17 Years | 0 (0.0%) | 13 (1.1%) |
| 18 to 34 Years | 22 (1.8%) | 0 (0.0%) |
| 35 to 64 Years | 30 (0.9%) | 75 (2.2%) |
| 65 to 74 Years | 26 (2.1%) | 44 (3.0%) |
| 75 Years and over | 62 (8.9%) | 116 (10.0%) |
Technology Access in Westchester
Computing Device Access in Westchester
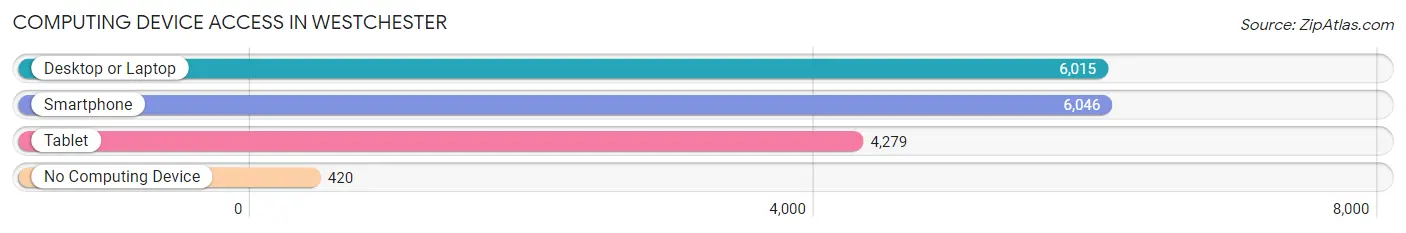
| Device Type | # Households | % Households |
| Desktop or Laptop | 6,015 | 84.2% |
| Smartphone | 6,046 | 84.6% |
| Tablet | 4,279 | 59.9% |
| No Computing Device | 420 | 5.9% |
| Total | 7,145 | 100.0% |
Internet Access in Westchester
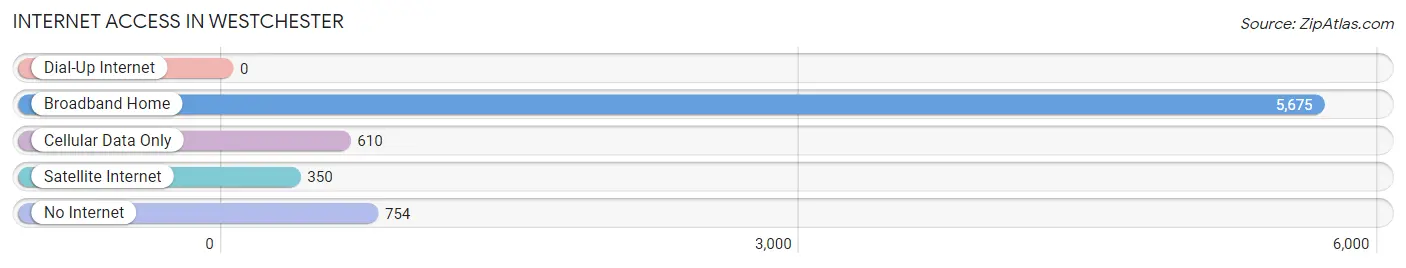
| Internet Type | # Households | % Households |
| Dial-Up Internet | 0 | 0.0% |
| Broadband Home | 5,675 | 79.4% |
| Cellular Data Only | 610 | 8.5% |
| Satellite Internet | 350 | 4.9% |
| No Internet | 754 | 10.5% |
| Total | 7,145 | 100.0% |
Westchester Summary
Westchester, Illinois is a village located in Cook County, Illinois, United States. It is a suburb of Chicago, located approximately 17 miles west of the city. The population was 16,718 at the 2010 census.
History
Westchester was first settled in the 1830s by German immigrants. The village was incorporated in 1926. The village was named after the city of Westchester, England.
Geography
Westchester is located at 41°51'25" North, 87°55'17" West (41.857, -87.921). According to the 2010 census, the village has a total area of 4.3 square miles, all land.
Economy
Westchester is home to a variety of businesses, including manufacturing, retail, and service industries. The village is also home to a number of corporate headquarters, including the headquarters of the American Bottling Company, the largest independent bottler of Pepsi-Cola products in the United States.
Demographics
As of the 2010 census, there were 16,718 people, 6,717 households, and 4,541 families residing in the village. The population density was 3,890.7 people per square mile. The racial makeup of the village was 79.2% White, 8.2% African American, 0.3% Native American, 5.2% Asian, 0.1% Pacific Islander, 4.3% from other races, and 2.9% from two or more races. Hispanic or Latino of any race were 11.7% of the population.
The median income for a household in the village was $62,917, and the median income for a family was $76,917. The per capita income for the village was $30,917. About 4.2% of families and 5.7% of the population were below the poverty line, including 7.2% of those under age 18 and 4.2% of those age 65 or over.
Common Questions
What is Per Capita Income in Westchester?
Per Capita income in Westchester is $50,889.
What is the Median Family Income in Westchester?
Median Family Income in Westchester is $116,300.
What is the Median Household income in Westchester?
Median Household Income in Westchester is $101,414.
What is Income or Wage Gap in Westchester?
Income or Wage Gap in Westchester is 29.2%.
Women in Westchester earn 70.8 cents for every dollar earned by a man.
What is Inequality or Gini Index in Westchester?
Inequality or Gini Index in Westchester is 0.38.
What is the Total Population of Westchester?
Total Population of Westchester is 16,694.
What is the Total Male Population of Westchester?
Total Male Population of Westchester is 7,617.
What is the Total Female Population of Westchester?
Total Female Population of Westchester is 9,077.
What is the Ratio of Males per 100 Females in Westchester?
There are 83.92 Males per 100 Females in Westchester.
What is the Ratio of Females per 100 Males in Westchester?
There are 119.17 Females per 100 Males in Westchester.
What is the Median Population Age in Westchester?
Median Population Age in Westchester is 51.7 Years.
What is the Average Family Size in Westchester
Average Family Size in Westchester is 2.9 People.
What is the Average Household Size in Westchester
Average Household Size in Westchester is 2.3 People.
How Large is the Labor Force in Westchester?
There are 9,343 People in the Labor Forcein in Westchester.
What is the Percentage of People in the Labor Force in Westchester?
63.5% of People are in the Labor Force in Westchester.
What is the Unemployment Rate in Westchester?
Unemployment Rate in Westchester is 5.4%.