Shiloh, IL Map & Demographics
Shiloh Map
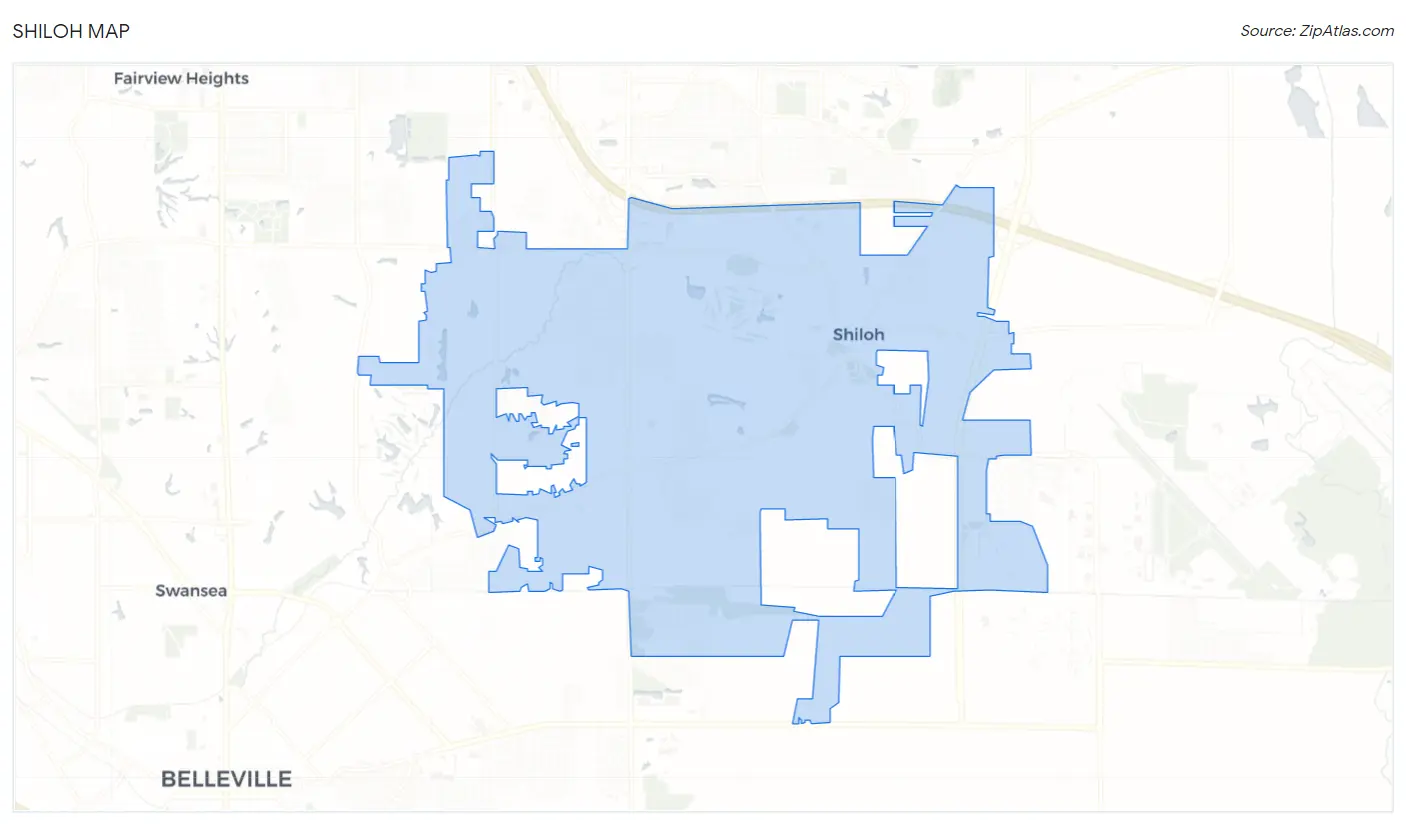
Shiloh Overview
$45,495
PER CAPITA INCOME
$107,398
AVG FAMILY INCOME
$94,539
AVG HOUSEHOLD INCOME
22.2%
WAGE / INCOME GAP [ % ]
77.8¢/ $1
WAGE / INCOME GAP [ $ ]
$10,968
FAMILY INCOME DEFICIT
0.41
INEQUALITY / GINI INDEX
13,892
TOTAL POPULATION
7,044
MALE POPULATION
6,848
FEMALE POPULATION
102.86
MALES / 100 FEMALES
97.22
FEMALES / 100 MALES
40.6
MEDIAN AGE
3.0
AVG FAMILY SIZE
2.5
AVG HOUSEHOLD SIZE
7,728
LABOR FORCE [ PEOPLE ]
68.4%
PERCENT IN LABOR FORCE
1.9%
UNEMPLOYMENT RATE
Shiloh Area Codes
Income in Shiloh
Income Overview in Shiloh
Per Capita Income in Shiloh is $45,495, while median incomes of families and households are $107,398 and $94,539 respectively.
| Characteristic | Number | Measure |
| Per Capita Income | 13,892 | $45,495 |
| Median Family Income | 3,723 | $107,398 |
| Mean Family Income | 3,723 | $133,206 |
| Median Household Income | 5,418 | $94,539 |
| Mean Household Income | 5,418 | $113,034 |
| Income Deficit | 3,723 | $10,968 |
| Wage / Income Gap (%) | 13,892 | 22.22% |
| Wage / Income Gap ($) | 13,892 | 77.78¢ per $1 |
| Gini / Inequality Index | 13,892 | 0.41 |
Earnings by Sex in Shiloh
Average Earnings in Shiloh are $45,970, $51,585 for men and $40,124 for women, a difference of 22.2%.
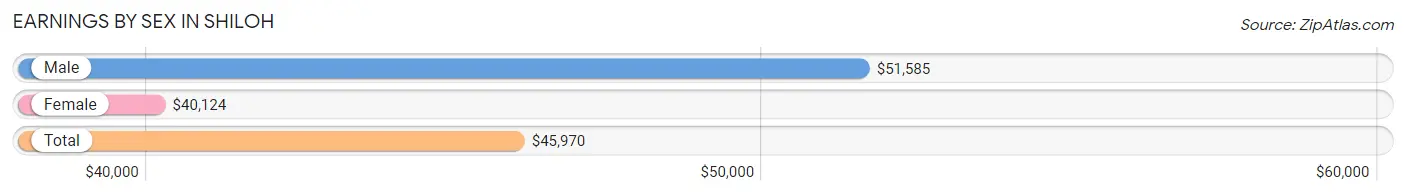
| Sex | Number | Average Earnings |
| Male | 4,387 (53.4%) | $51,585 |
| Female | 3,828 (46.6%) | $40,124 |
| Total | 8,215 (100.0%) | $45,970 |
Earnings by Sex by Income Bracket in Shiloh
The most common earnings brackets in Shiloh are $100,000+ for men (1,107 | 25.2%) and $65,000 to $74,999 for women (436 | 11.4%).
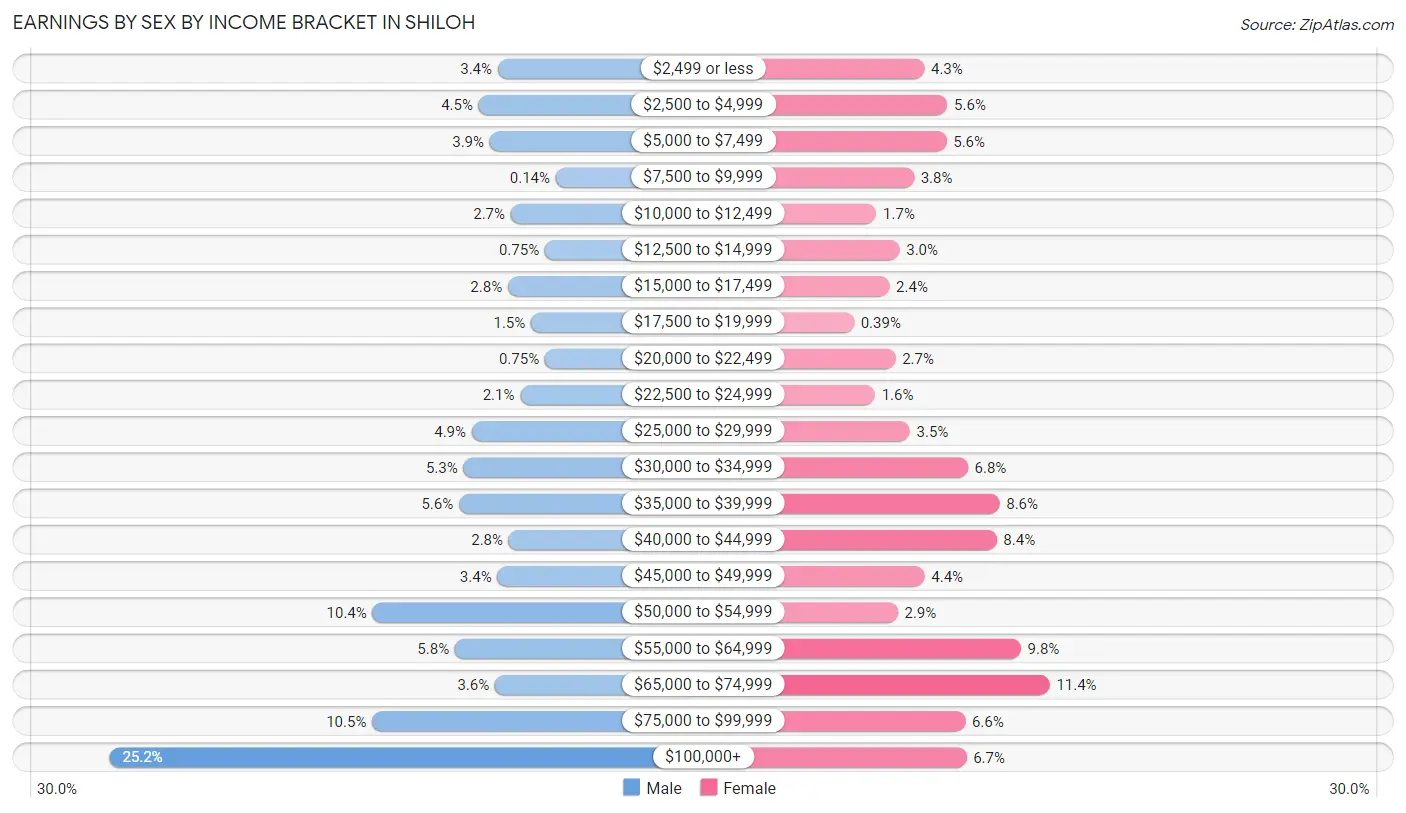
| Income | Male | Female |
| $2,499 or less | 149 (3.4%) | 166 (4.3%) |
| $2,500 to $4,999 | 196 (4.5%) | 216 (5.6%) |
| $5,000 to $7,499 | 169 (3.8%) | 214 (5.6%) |
| $7,500 to $9,999 | 6 (0.1%) | 144 (3.8%) |
| $10,000 to $12,499 | 117 (2.7%) | 63 (1.7%) |
| $12,500 to $14,999 | 33 (0.7%) | 113 (2.9%) |
| $15,000 to $17,499 | 124 (2.8%) | 91 (2.4%) |
| $17,500 to $19,999 | 67 (1.5%) | 15 (0.4%) |
| $20,000 to $22,499 | 33 (0.7%) | 104 (2.7%) |
| $22,500 to $24,999 | 94 (2.1%) | 60 (1.6%) |
| $25,000 to $29,999 | 213 (4.9%) | 135 (3.5%) |
| $30,000 to $34,999 | 234 (5.3%) | 260 (6.8%) |
| $35,000 to $39,999 | 245 (5.6%) | 328 (8.6%) |
| $40,000 to $44,999 | 122 (2.8%) | 322 (8.4%) |
| $45,000 to $49,999 | 150 (3.4%) | 167 (4.4%) |
| $50,000 to $54,999 | 458 (10.4%) | 109 (2.9%) |
| $55,000 to $64,999 | 255 (5.8%) | 374 (9.8%) |
| $65,000 to $74,999 | 156 (3.6%) | 436 (11.4%) |
| $75,000 to $99,999 | 459 (10.5%) | 254 (6.6%) |
| $100,000+ | 1,107 (25.2%) | 257 (6.7%) |
| Total | 4,387 (100.0%) | 3,828 (100.0%) |
Earnings by Sex by Educational Attainment in Shiloh
Average earnings in Shiloh are $58,418 for men and $44,356 for women, a difference of 24.1%. Men with an educational attainment of graduate degree enjoy the highest average annual earnings of $107,271, while those with high school diploma education earn the least with $45,586. Women with an educational attainment of graduate degree earn the most with the average annual earnings of $63,162, while those with less than high school education have the smallest earnings of $11,250.
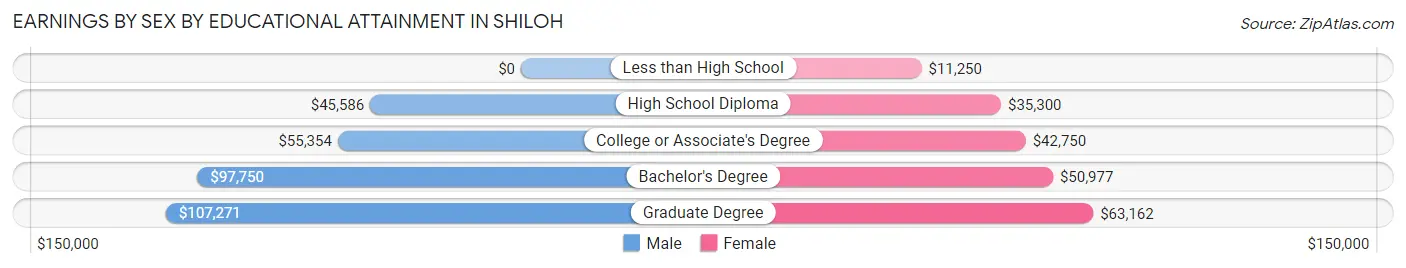
| Educational Attainment | Male Income | Female Income |
| Less than High School | - | - |
| High School Diploma | $45,586 | $35,300 |
| College or Associate's Degree | $55,354 | $42,750 |
| Bachelor's Degree | $97,750 | $50,977 |
| Graduate Degree | $107,271 | $63,162 |
| Total | $58,418 | $44,356 |
Family Income in Shiloh
Family Income Brackets in Shiloh
According to the Shiloh family income data, there are 871 families falling into the $100,000 to $149,999 income range, which is the most common income bracket and makes up 23.4% of all families.
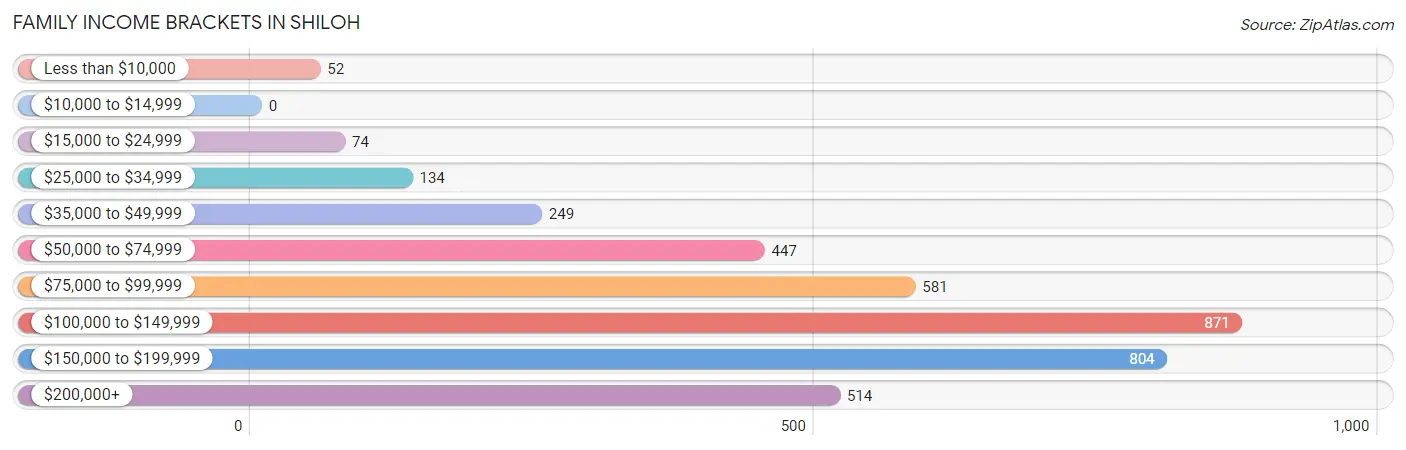
| Income Bracket | # Families | % Families |
| Less than $10,000 | 52 | 1.4% |
| $10,000 to $14,999 | 0 | 0.0% |
| $15,000 to $24,999 | 74 | 2.0% |
| $25,000 to $34,999 | 134 | 3.6% |
| $35,000 to $49,999 | 249 | 6.7% |
| $50,000 to $74,999 | 447 | 12.0% |
| $75,000 to $99,999 | 581 | 15.6% |
| $100,000 to $149,999 | 871 | 23.4% |
| $150,000 to $199,999 | 804 | 21.6% |
| $200,000+ | 514 | 13.8% |
Family Income by Famaliy Size in Shiloh
4-person families (680 | 18.3%) account for the highest median family income in Shiloh with $150,875 per family, while 2-person families (1,899 | 51.0%) have the highest median income of $51,600 per family member.
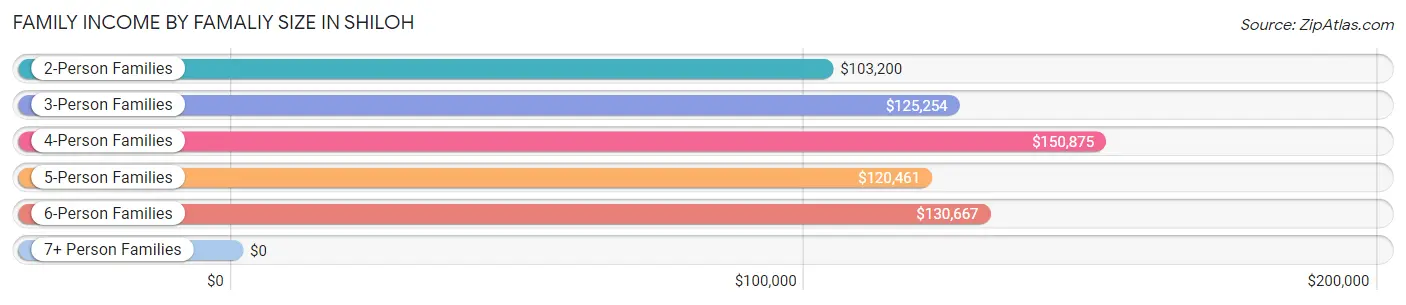
| Income Bracket | # Families | Median Income |
| 2-Person Families | 1,899 (51.0%) | $103,200 |
| 3-Person Families | 727 (19.5%) | $125,254 |
| 4-Person Families | 680 (18.3%) | $150,875 |
| 5-Person Families | 221 (5.9%) | $120,461 |
| 6-Person Families | 164 (4.4%) | $130,667 |
| 7+ Person Families | 32 (0.9%) | $0 |
| Total | 3,723 (100.0%) | $107,398 |
Family Income by Number of Earners in Shiloh
The median family income in Shiloh is $107,398, with families comprising 3+ earners (619) having the highest median family income of $179,448, while families with no earners (490) have the lowest median family income of $73,649, accounting for 16.6% and 13.2% of families, respectively.
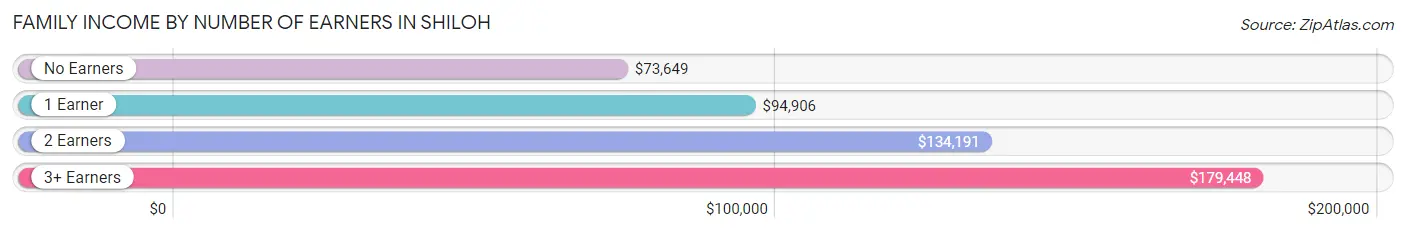
| Number of Earners | # Families | Median Income |
| No Earners | 490 (13.2%) | $73,649 |
| 1 Earner | 1,071 (28.8%) | $94,906 |
| 2 Earners | 1,543 (41.4%) | $134,191 |
| 3+ Earners | 619 (16.6%) | $179,448 |
| Total | 3,723 (100.0%) | $107,398 |
Household Income in Shiloh
Household Income Brackets in Shiloh
With 948 households falling in the category, the $100,000 to $149,999 income range is the most frequent in Shiloh, accounting for 17.5% of all households. In contrast, only 70 households (1.3%) fall into the $10,000 to $14,999 income bracket, making it the least populous group.
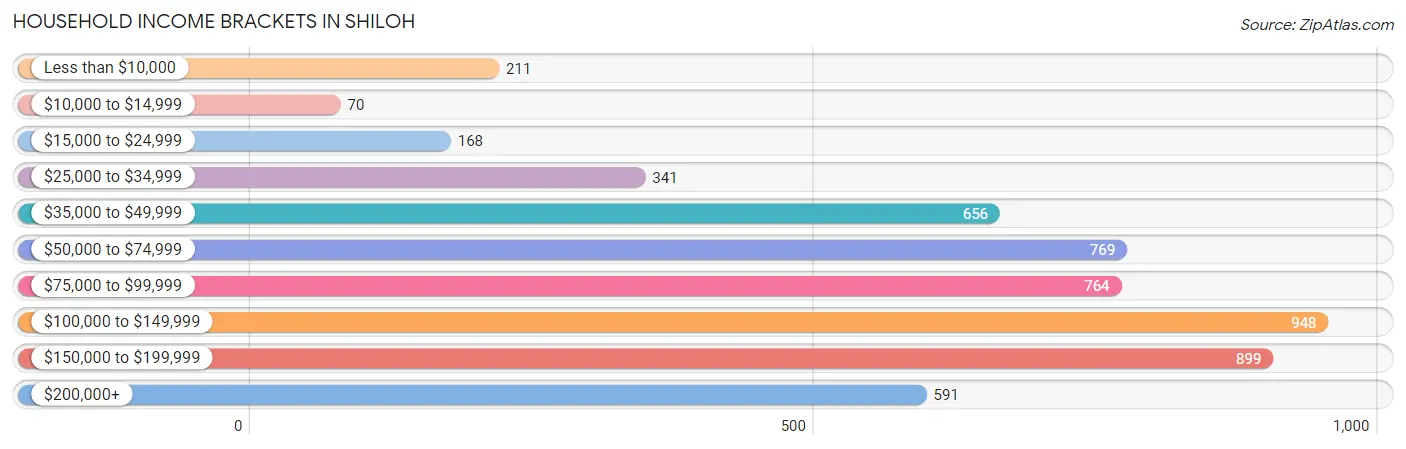
| Income Bracket | # Households | % Households |
| Less than $10,000 | 211 | 3.9% |
| $10,000 to $14,999 | 70 | 1.3% |
| $15,000 to $24,999 | 168 | 3.1% |
| $25,000 to $34,999 | 341 | 6.3% |
| $35,000 to $49,999 | 656 | 12.1% |
| $50,000 to $74,999 | 769 | 14.2% |
| $75,000 to $99,999 | 764 | 14.1% |
| $100,000 to $149,999 | 948 | 17.5% |
| $150,000 to $199,999 | 899 | 16.6% |
| $200,000+ | 591 | 10.9% |
Household Income by Householder Age in Shiloh
The median household income in Shiloh is $94,539, with the highest median household income of $107,243 found in the 45 to 64 years age bracket for the primary householder. A total of 2,266 households (41.8%) fall into this category. Meanwhile, the 15 to 24 years age bracket for the primary householder has the lowest median household income of $67,632, with 94 households (1.7%) in this group.
| Income Bracket | # Households | Median Income |
| 15 to 24 Years | 94 (1.7%) | $67,632 |
| 25 to 44 Years | 1,805 (33.3%) | $99,211 |
| 45 to 64 Years | 2,266 (41.8%) | $107,243 |
| 65+ Years | 1,253 (23.1%) | $70,524 |
| Total | 5,418 (100.0%) | $94,539 |
Poverty in Shiloh
Income Below Poverty by Sex and Age in Shiloh
With 4.4% poverty level for males and 7.7% for females among the residents of Shiloh, 15 year old males and 16 and 17 year old females are the most vulnerable to poverty, with 33 males (27.3%) and 53 females (45.3%) in their respective age groups living below the poverty level.
| Age Bracket | Male | Female |
| Under 5 Years | 16 (4.1%) | 0 (0.0%) |
| 5 Years | 0 (0.0%) | 0 (0.0%) |
| 6 to 11 Years | 4 (0.7%) | 4 (1.1%) |
| 12 to 14 Years | 55 (16.8%) | 0 (0.0%) |
| 15 Years | 33 (27.3%) | 0 (0.0%) |
| 16 and 17 Years | 0 (0.0%) | 53 (45.3%) |
| 18 to 24 Years | 15 (2.9%) | 62 (13.6%) |
| 25 to 34 Years | 55 (6.8%) | 20 (2.9%) |
| 35 to 44 Years | 29 (4.2%) | 46 (5.0%) |
| 45 to 54 Years | 14 (1.6%) | 127 (13.9%) |
| 55 to 64 Years | 22 (2.1%) | 123 (10.3%) |
| 65 to 74 Years | 46 (6.4%) | 0 (0.0%) |
| 75 Years and over | 3 (1.1%) | 76 (17.1%) |
| Total | 292 (4.4%) | 511 (7.7%) |
Income Above Poverty by Sex and Age in Shiloh
According to the poverty statistics in Shiloh, males aged 5 years and females aged under 5 years are the age groups that are most secure financially, with 100.0% of males and 100.0% of females in these age groups living above the poverty line.
| Age Bracket | Male | Female |
| Under 5 Years | 371 (95.9%) | 180 (100.0%) |
| 5 Years | 52 (100.0%) | 114 (100.0%) |
| 6 to 11 Years | 528 (99.3%) | 366 (98.9%) |
| 12 to 14 Years | 272 (83.2%) | 305 (100.0%) |
| 15 Years | 88 (72.7%) | 95 (100.0%) |
| 16 and 17 Years | 361 (100.0%) | 64 (54.7%) |
| 18 to 24 Years | 493 (97.1%) | 393 (86.4%) |
| 25 to 34 Years | 753 (93.2%) | 678 (97.1%) |
| 35 to 44 Years | 664 (95.8%) | 869 (95.0%) |
| 45 to 54 Years | 841 (98.4%) | 789 (86.1%) |
| 55 to 64 Years | 1,010 (97.9%) | 1,067 (89.7%) |
| 65 to 74 Years | 670 (93.6%) | 799 (100.0%) |
| 75 Years and over | 277 (98.9%) | 368 (82.9%) |
| Total | 6,380 (95.6%) | 6,087 (92.3%) |
Income Below Poverty Among Married-Couple Families in Shiloh
The poverty statistics for married-couple families in Shiloh show that 1.2% or 37 of the total 3,059 families live below the poverty line. Families with 1 or 2 children have the highest poverty rate of 2.9%, comprising of 19 families. On the other hand, families with no children have the lowest poverty rate of 0.6%, which includes 13 families.
| Children | Above Poverty | Below Poverty |
| No Children | 2,156 (99.4%) | 13 (0.6%) |
| 1 or 2 Children | 641 (97.1%) | 19 (2.9%) |
| 3 or 4 Children | 225 (97.8%) | 5 (2.2%) |
| 5 or more Children | 0 (0.0%) | 0 (0.0%) |
| Total | 3,022 (98.8%) | 37 (1.2%) |
Income Below Poverty Among Single-Parent Households in Shiloh
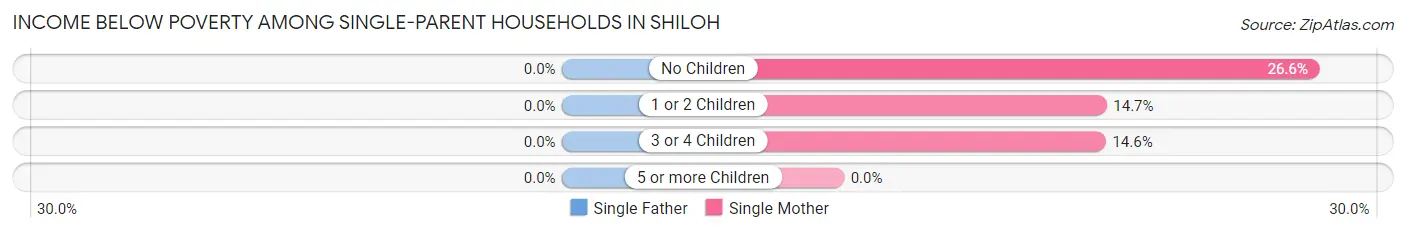
| Children | Single Father | Single Mother |
| No Children | 0 (0.0%) | 25 (26.6%) |
| 1 or 2 Children | 0 (0.0%) | 37 (14.7%) |
| 3 or 4 Children | 0 (0.0%) | 12 (14.6%) |
| 5 or more Children | 0 (0.0%) | 0 (0.0%) |
| Total | 0 (0.0%) | 74 (17.3%) |
Income Below Poverty Among Married-Couple vs Single-Parent Households in Shiloh
The poverty data for Shiloh shows that 37 of the married-couple family households (1.2%) and 74 of the single-parent households (11.1%) are living below the poverty level. Within the married-couple family households, those with 1 or 2 children have the highest poverty rate, with 19 households (2.9%) falling below the poverty line. Among the single-parent households, those with no children have the highest poverty rate, with 25 household (18.0%) living below poverty.
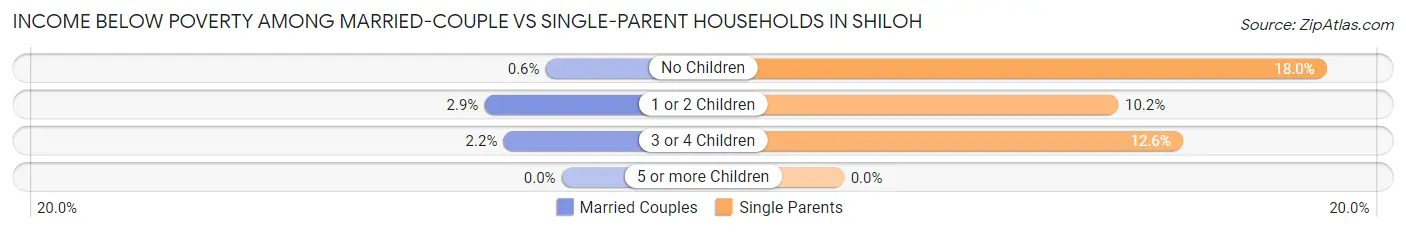
| Children | Married-Couple Families | Single-Parent Households |
| No Children | 13 (0.6%) | 25 (18.0%) |
| 1 or 2 Children | 19 (2.9%) | 37 (10.2%) |
| 3 or 4 Children | 5 (2.2%) | 12 (12.6%) |
| 5 or more Children | 0 (0.0%) | 0 (0.0%) |
| Total | 37 (1.2%) | 74 (11.1%) |
Race in Shiloh
The most populous races in Shiloh are White / Caucasian (9,396 | 67.6%), Black / African American (3,039 | 21.9%), and Two or more Races (1,047 | 7.5%).
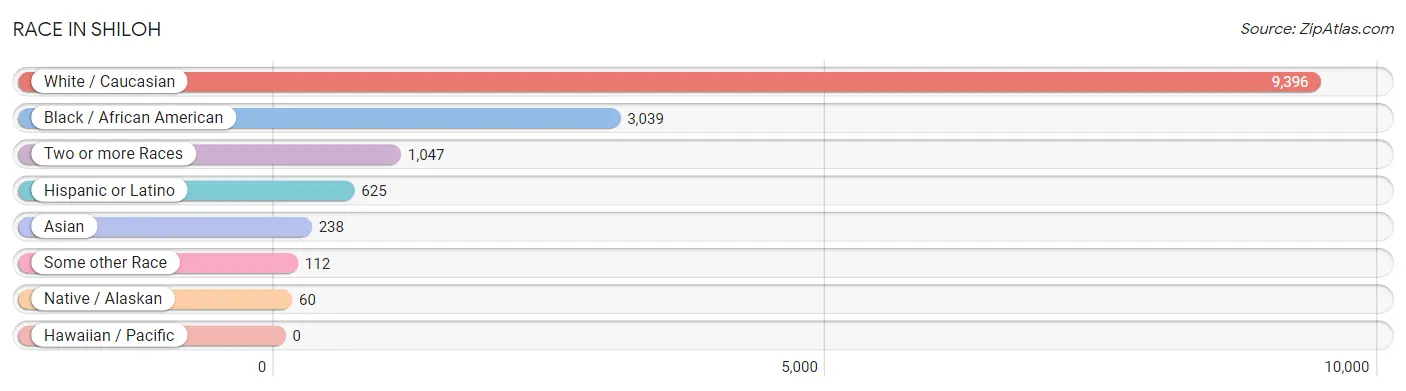
| Race | # Population | % Population |
| Asian | 238 | 1.7% |
| Black / African American | 3,039 | 21.9% |
| Hawaiian / Pacific | 0 | 0.0% |
| Hispanic or Latino | 625 | 4.5% |
| Native / Alaskan | 60 | 0.4% |
| White / Caucasian | 9,396 | 67.6% |
| Two or more Races | 1,047 | 7.5% |
| Some other Race | 112 | 0.8% |
| Total | 13,892 | 100.0% |
Ancestry in Shiloh
The most populous ancestries reported in Shiloh are German (3,006 | 21.6%), English (1,329 | 9.6%), Irish (1,188 | 8.6%), French (913 | 6.6%), and Italian (609 | 4.4%), together accounting for 50.7% of all Shiloh residents.
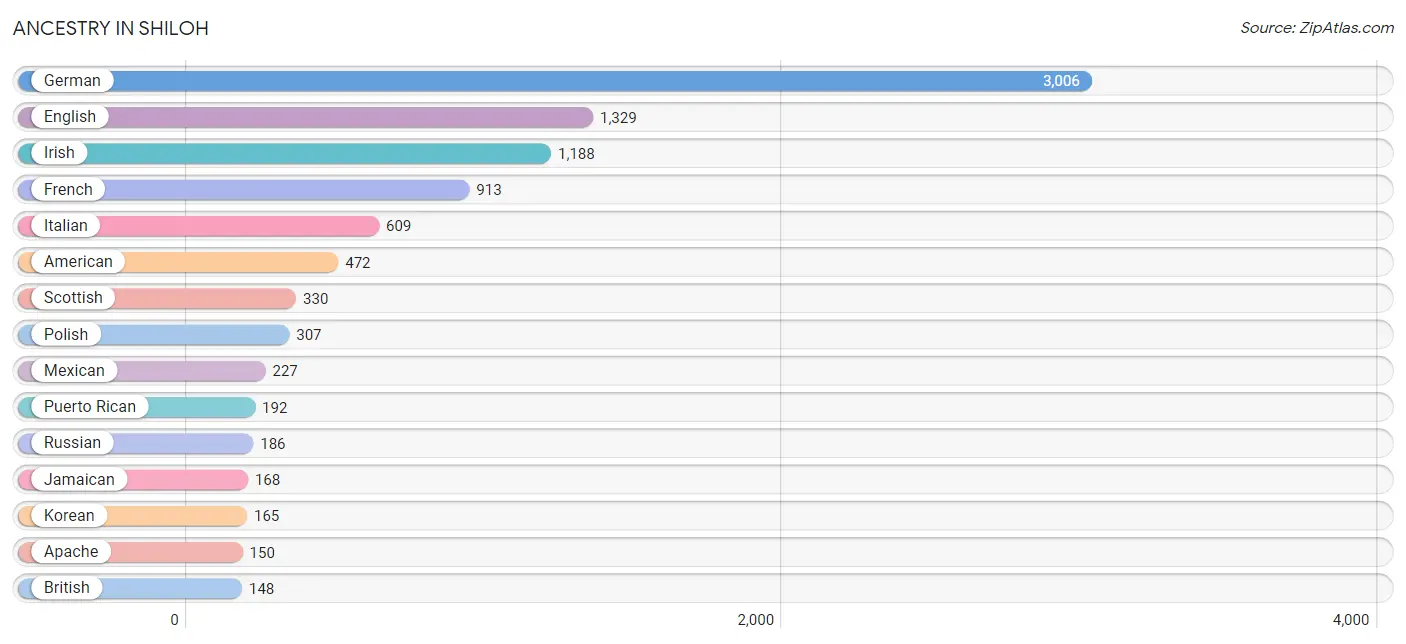
| Ancestry | # Population | % Population |
| African | 24 | 0.2% |
| American | 472 | 3.4% |
| Apache | 150 | 1.1% |
| Arab | 34 | 0.2% |
| Armenian | 17 | 0.1% |
| Blackfeet | 53 | 0.4% |
| British | 148 | 1.1% |
| Burmese | 110 | 0.8% |
| Central American | 47 | 0.3% |
| Cherokee | 95 | 0.7% |
| Colombian | 28 | 0.2% |
| Creek | 127 | 0.9% |
| Croatian | 35 | 0.3% |
| Cuban | 101 | 0.7% |
| Czech | 148 | 1.1% |
| Danish | 43 | 0.3% |
| Dominican | 20 | 0.1% |
| Dutch | 43 | 0.3% |
| Eastern European | 81 | 0.6% |
| Ecuadorian | 10 | 0.1% |
| English | 1,329 | 9.6% |
| European | 113 | 0.8% |
| French | 913 | 6.6% |
| French Canadian | 20 | 0.1% |
| German | 3,006 | 21.6% |
| Ghanaian | 33 | 0.2% |
| Greek | 132 | 0.9% |
| Hungarian | 122 | 0.9% |
| Indian (Asian) | 6 | 0.0% |
| Irish | 1,188 | 8.6% |
| Iroquois | 52 | 0.4% |
| Italian | 609 | 4.4% |
| Jamaican | 168 | 1.2% |
| Jordanian | 28 | 0.2% |
| Korean | 165 | 1.2% |
| Mexican | 227 | 1.6% |
| Nigerian | 22 | 0.2% |
| Norwegian | 44 | 0.3% |
| Pakistani | 29 | 0.2% |
| Palestinian | 6 | 0.0% |
| Polish | 307 | 2.2% |
| Puerto Rican | 192 | 1.4% |
| Russian | 186 | 1.3% |
| Salvadoran | 47 | 0.3% |
| Scandinavian | 71 | 0.5% |
| Scotch-Irish | 102 | 0.7% |
| Scottish | 330 | 2.4% |
| Sioux | 127 | 0.9% |
| Slovak | 16 | 0.1% |
| South American | 38 | 0.3% |
| Subsaharan African | 79 | 0.6% |
| Swedish | 39 | 0.3% |
| Swiss | 14 | 0.1% |
| Welsh | 42 | 0.3% | View All 54 Rows |
Immigrants in Shiloh
The most numerous immigrant groups reported in Shiloh came from Asia (244 | 1.8%), Latin America (143 | 1.0%), Philippines (122 | 0.9%), South Eastern Asia (122 | 0.9%), and Eastern Asia (101 | 0.7%), together accounting for 5.3% of all Shiloh residents.
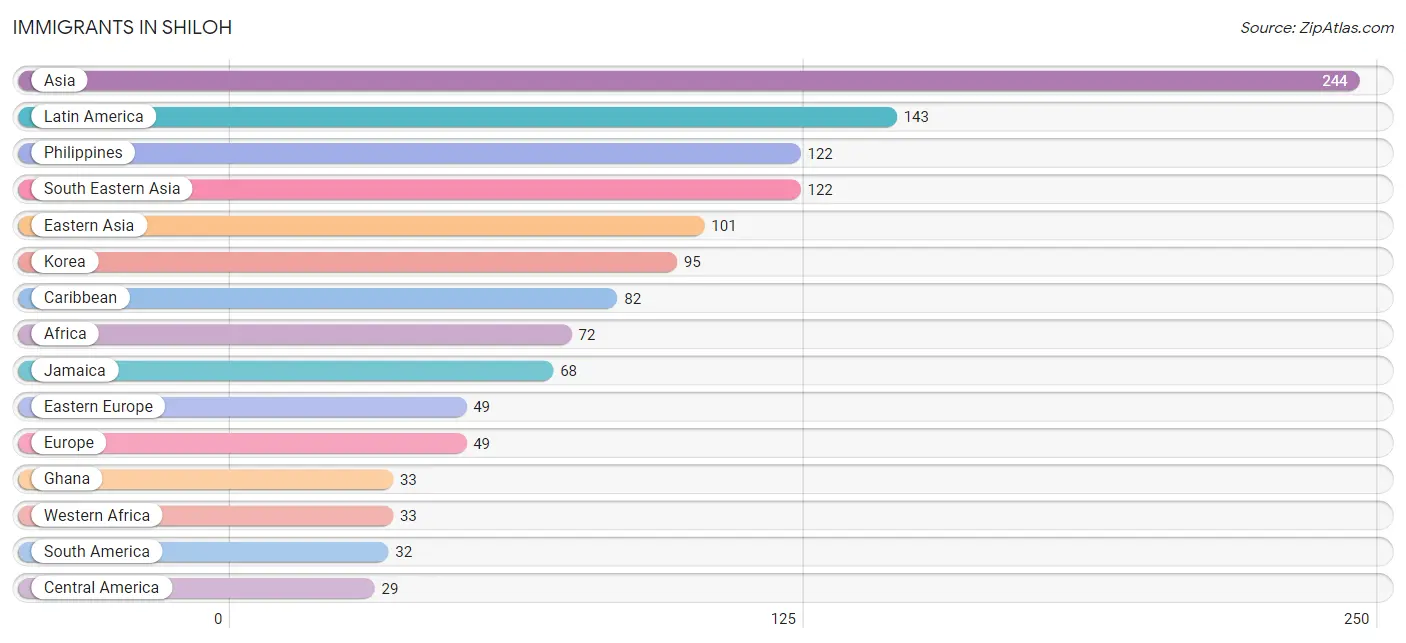
| Immigration Origin | # Population | % Population |
| Africa | 72 | 0.5% |
| Asia | 244 | 1.8% |
| Canada | 16 | 0.1% |
| Caribbean | 82 | 0.6% |
| Central America | 29 | 0.2% |
| China | 6 | 0.0% |
| Colombia | 22 | 0.2% |
| Croatia | 3 | 0.0% |
| Cuba | 14 | 0.1% |
| Eastern Africa | 24 | 0.2% |
| Eastern Asia | 101 | 0.7% |
| Eastern Europe | 49 | 0.4% |
| Ecuador | 10 | 0.1% |
| El Salvador | 26 | 0.2% |
| Europe | 49 | 0.4% |
| Ghana | 33 | 0.2% |
| Hungary | 25 | 0.2% |
| Jamaica | 68 | 0.5% |
| Jordan | 4 | 0.0% |
| Kenya | 24 | 0.2% |
| Korea | 95 | 0.7% |
| Kuwait | 11 | 0.1% |
| Latin America | 143 | 1.0% |
| Mexico | 3 | 0.0% |
| Philippines | 122 | 0.9% |
| Russia | 21 | 0.2% |
| South Africa | 15 | 0.1% |
| South America | 32 | 0.2% |
| South Eastern Asia | 122 | 0.9% |
| Western Africa | 33 | 0.2% |
| Western Asia | 15 | 0.1% | View All 31 Rows |
Sex and Age in Shiloh
Sex and Age in Shiloh
The most populous age groups in Shiloh are 15 to 19 Years (731 | 10.4%) for men and 55 to 59 Years (704 | 10.3%) for women.
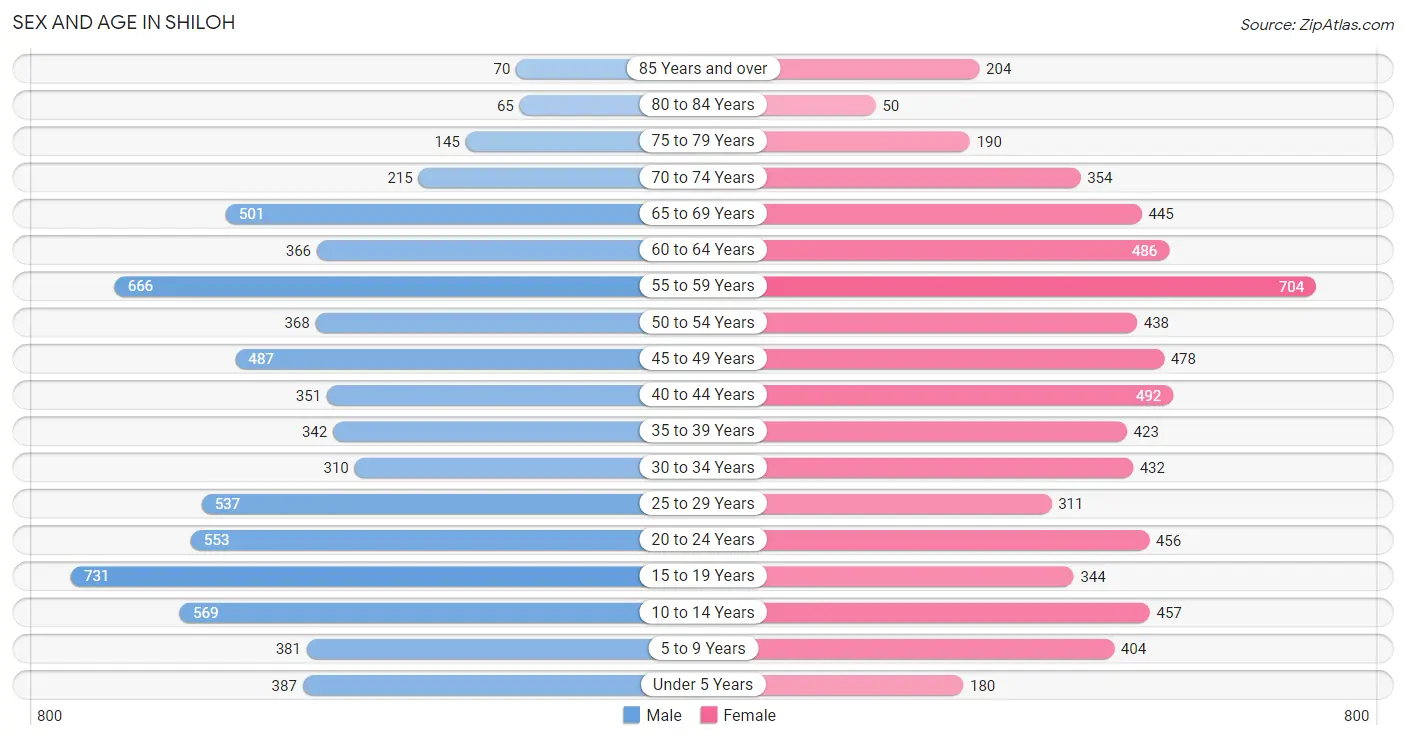
| Age Bracket | Male | Female |
| Under 5 Years | 387 (5.5%) | 180 (2.6%) |
| 5 to 9 Years | 381 (5.4%) | 404 (5.9%) |
| 10 to 14 Years | 569 (8.1%) | 457 (6.7%) |
| 15 to 19 Years | 731 (10.4%) | 344 (5.0%) |
| 20 to 24 Years | 553 (7.9%) | 456 (6.7%) |
| 25 to 29 Years | 537 (7.6%) | 311 (4.5%) |
| 30 to 34 Years | 310 (4.4%) | 432 (6.3%) |
| 35 to 39 Years | 342 (4.9%) | 423 (6.2%) |
| 40 to 44 Years | 351 (5.0%) | 492 (7.2%) |
| 45 to 49 Years | 487 (6.9%) | 478 (7.0%) |
| 50 to 54 Years | 368 (5.2%) | 438 (6.4%) |
| 55 to 59 Years | 666 (9.5%) | 704 (10.3%) |
| 60 to 64 Years | 366 (5.2%) | 486 (7.1%) |
| 65 to 69 Years | 501 (7.1%) | 445 (6.5%) |
| 70 to 74 Years | 215 (3.0%) | 354 (5.2%) |
| 75 to 79 Years | 145 (2.1%) | 190 (2.8%) |
| 80 to 84 Years | 65 (0.9%) | 50 (0.7%) |
| 85 Years and over | 70 (1.0%) | 204 (3.0%) |
| Total | 7,044 (100.0%) | 6,848 (100.0%) |
Families and Households in Shiloh
Median Family Size in Shiloh
The median family size in Shiloh is 2.98 persons per family, with single male/father families (236 | 6.3%) accounting for the largest median family size of 3.58 persons per family. On the other hand, single female/mother families (428 | 11.5%) represent the smallest median family size with 2.90 persons per family.
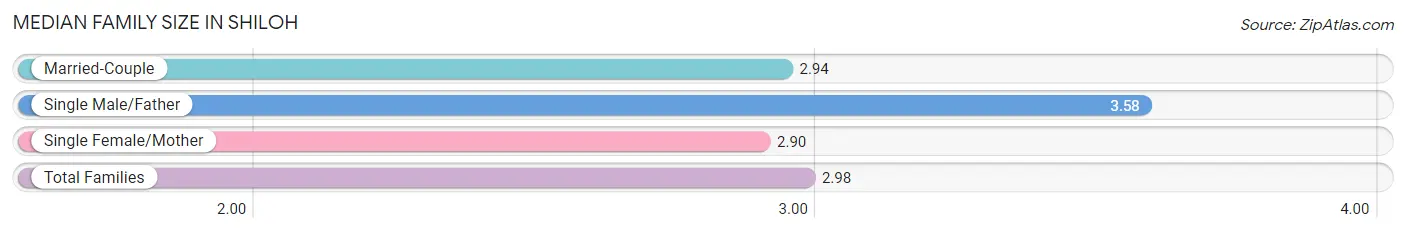
| Family Type | # Families | Family Size |
| Married-Couple | 3,059 (82.2%) | 2.94 |
| Single Male/Father | 236 (6.3%) | 3.58 |
| Single Female/Mother | 428 (11.5%) | 2.90 |
| Total Families | 3,723 (100.0%) | 2.98 |
Median Household Size in Shiloh
The median household size in Shiloh is 2.47 persons per household, with single male/father households (236 | 4.4%) accounting for the largest median household size of 4.39 persons per household. non-family households (1,695 | 31.3%) represent the smallest median household size with 1.13 persons per household.
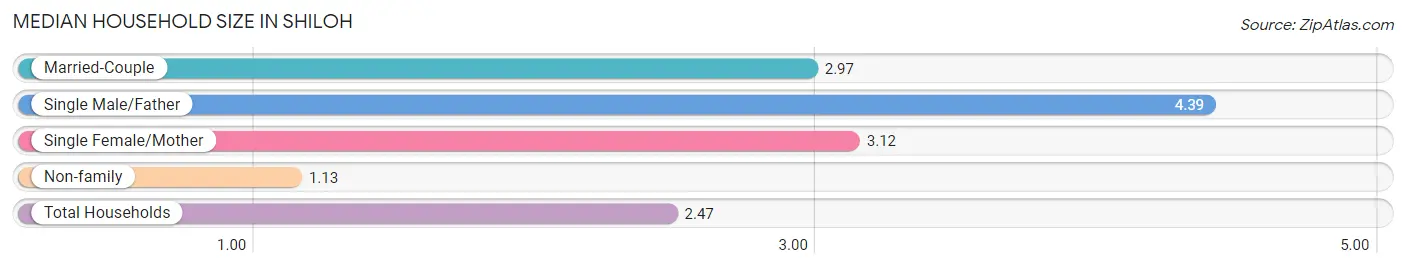
| Household Type | # Households | Household Size |
| Married-Couple | 3,059 (56.5%) | 2.97 |
| Single Male/Father | 236 (4.4%) | 4.39 |
| Single Female/Mother | 428 (7.9%) | 3.12 |
| Non-family | 1,695 (31.3%) | 1.13 |
| Total Households | 5,418 (100.0%) | 2.47 |
Household Size by Marriage Status in Shiloh
Out of a total of 5,418 households in Shiloh, 3,723 (68.7%) are family households, while 1,695 (31.3%) are nonfamily households. The most numerous type of family households are 2-person households, comprising 1,755, and the most common type of nonfamily households are 1-person households, comprising 1,482.
| Household Size | Family Households | Nonfamily Households |
| 1-Person Households | - | 1,482 (27.4%) |
| 2-Person Households | 1,755 (32.4%) | 213 (3.9%) |
| 3-Person Households | 817 (15.1%) | 0 (0.0%) |
| 4-Person Households | 668 (12.3%) | 0 (0.0%) |
| 5-Person Households | 265 (4.9%) | 0 (0.0%) |
| 6-Person Households | 164 (3.0%) | 0 (0.0%) |
| 7+ Person Households | 54 (1.0%) | 0 (0.0%) |
| Total | 3,723 (68.7%) | 1,695 (31.3%) |
Female Fertility in Shiloh
Fertility by Age in Shiloh
Average fertility rate in Shiloh is 18.0 births per 1,000 women. Women in the age bracket of 20 to 34 years have the highest fertility rate with 46.0 births per 1,000 women. Women in the age bracket of 20 to 34 years acount for 100.0% of all women with births.
| Age Bracket | Women with Births | Births / 1,000 Women |
| 15 to 19 years | 0 (0.0%) | 0.0 |
| 20 to 34 years | 55 (100.0%) | 46.0 |
| 35 to 50 years | 0 (0.0%) | 0.0 |
| Total | 55 (100.0%) | 18.0 |
Fertility by Age by Marriage Status in Shiloh
| Age Bracket | Married | Unmarried |
| 15 to 19 years | 0 (0.0%) | 0 (0.0%) |
| 20 to 34 years | 55 (100.0%) | 0 (0.0%) |
| 35 to 50 years | 0 (0.0%) | 0 (0.0%) |
| Total | 55 (100.0%) | 0 (0.0%) |
Fertility by Education in Shiloh
| Educational Attainment | Women with Births | Births / 1,000 Women |
| Less than High School | 0 (0.0%) | 0.0 |
| High School Diploma | 0 (0.0%) | 0.0 |
| College or Associate's Degree | 0 (0.0%) | 0.0 |
| Bachelor's Degree | 0 (0.0%) | 0.0 |
| Graduate Degree | 55 (100.0%) | 118.0 |
| Total | 55 (100.0%) | 18.0 |
Fertility by Education by Marriage Status in Shiloh
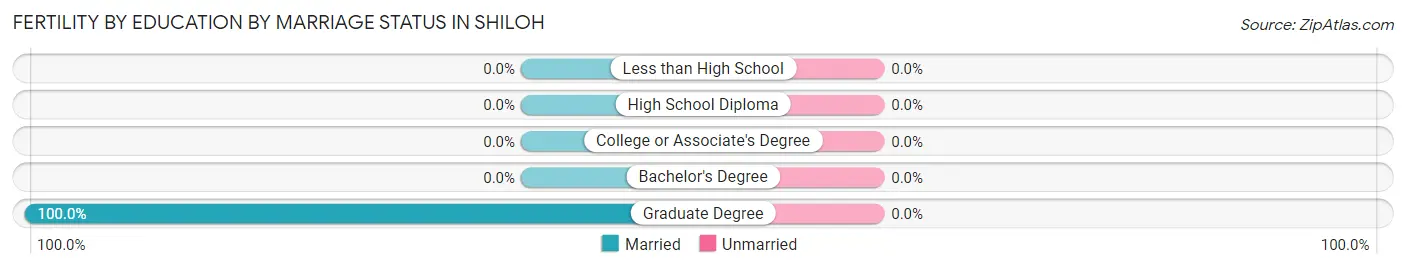
| Educational Attainment | Married | Unmarried |
| Less than High School | 0 (0.0%) | 0 (0.0%) |
| High School Diploma | 0 (0.0%) | 0 (0.0%) |
| College or Associate's Degree | 0 (0.0%) | 0 (0.0%) |
| Bachelor's Degree | 0 (0.0%) | 0 (0.0%) |
| Graduate Degree | 55 (100.0%) | 0 (0.0%) |
| Total | 55 (100.0%) | 0 (0.0%) |
Employment Characteristics in Shiloh
Employment by Class of Employer in Shiloh
Among the 7,566 employed individuals in Shiloh, private company employees (4,325 | 57.2%), federal government employees (1,349 | 17.8%), and not-for-profit organizations (811 | 10.7%) make up the most common classes of employment.
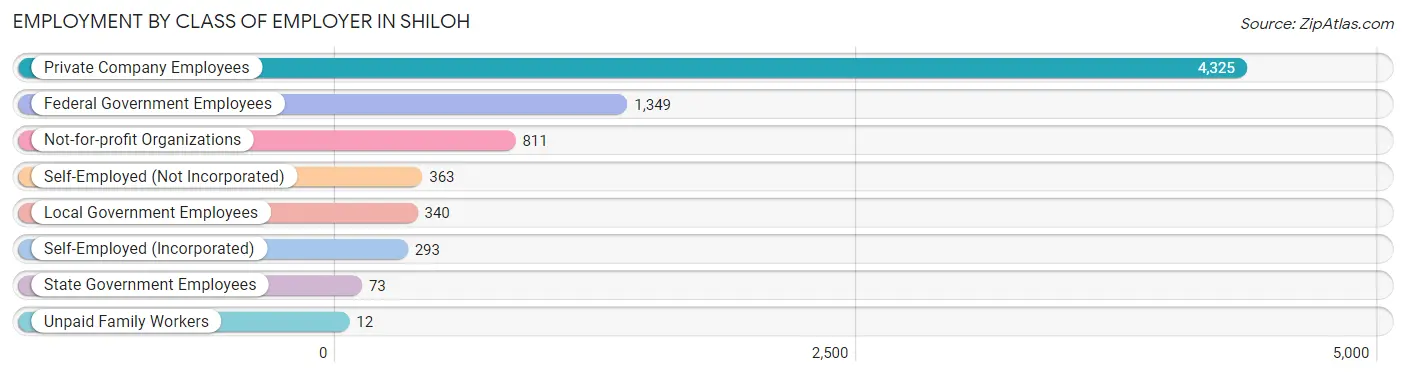
| Employer Class | # Employees | % Employees |
| Private Company Employees | 4,325 | 57.2% |
| Self-Employed (Incorporated) | 293 | 3.9% |
| Self-Employed (Not Incorporated) | 363 | 4.8% |
| Not-for-profit Organizations | 811 | 10.7% |
| Local Government Employees | 340 | 4.5% |
| State Government Employees | 73 | 1.0% |
| Federal Government Employees | 1,349 | 17.8% |
| Unpaid Family Workers | 12 | 0.2% |
| Total | 7,566 | 100.0% |
Employment Status by Age in Shiloh
According to the labor force statistics for Shiloh, out of the total population over 16 years of age (11,298), 68.4% or 7,728 individuals are in the labor force, with 1.9% or 147 of them unemployed. The age group with the highest labor force participation rate is 30 to 34 years, with 99.5% or 738 individuals in the labor force. Within the labor force, the 16 to 19 years age range has the highest percentage of unemployed individuals, with 8.4% or 29 of them being unemployed.
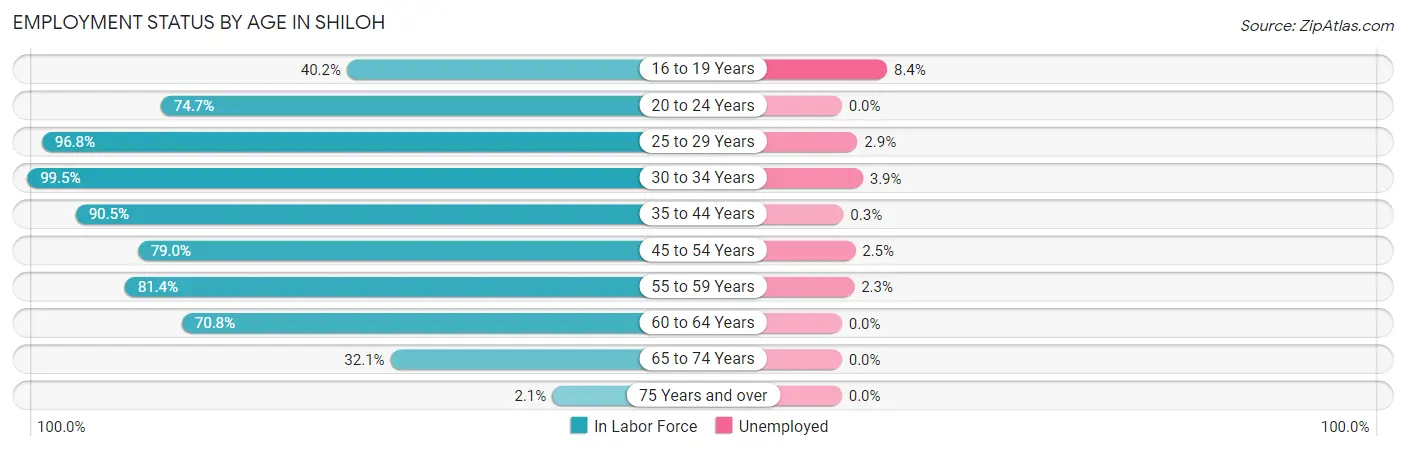
| Age Bracket | In Labor Force | Unemployed |
| 16 to 19 Years | 345 (40.2%) | 29 (8.4%) |
| 20 to 24 Years | 754 (74.7%) | 0 (0.0%) |
| 25 to 29 Years | 821 (96.8%) | 24 (2.9%) |
| 30 to 34 Years | 738 (99.5%) | 29 (3.9%) |
| 35 to 44 Years | 1,455 (90.5%) | 4 (0.3%) |
| 45 to 54 Years | 1,399 (79.0%) | 35 (2.5%) |
| 55 to 59 Years | 1,115 (81.4%) | 26 (2.3%) |
| 60 to 64 Years | 603 (70.8%) | 0 (0.0%) |
| 65 to 74 Years | 486 (32.1%) | 0 (0.0%) |
| 75 Years and over | 15 (2.1%) | 0 (0.0%) |
| Total | 7,728 (68.4%) | 147 (1.9%) |
Employment Status by Educational Attainment in Shiloh
According to labor force statistics for Shiloh, 85.3% of individuals (6,134) out of the total population between 25 and 64 years of age (7,191) are in the labor force, with 1.9% or 117 of them being unemployed. The group with the highest labor force participation rate are those with the educational attainment of bachelor's degree or higher, with 88.9% or 2,615 individuals in the labor force. Within the labor force, individuals with college / associate degree education have the highest percentage of unemployment, with 3.5% or 82 of them being unemployed.
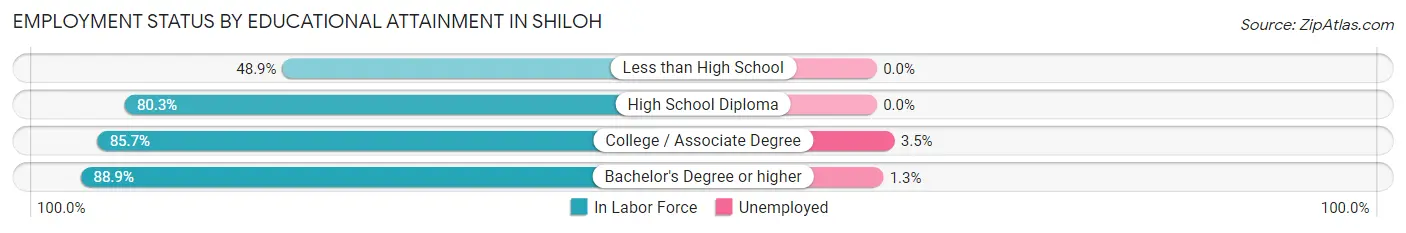
| Educational Attainment | In Labor Force | Unemployed |
| Less than High School | 68 (48.9%) | 0 (0.0%) |
| High School Diploma | 1,107 (80.3%) | 0 (0.0%) |
| College / Associate Degree | 2,342 (85.7%) | 96 (3.5%) |
| Bachelor's Degree or higher | 2,615 (88.9%) | 38 (1.3%) |
| Total | 6,134 (85.3%) | 137 (1.9%) |
Employment Occupations by Sex in Shiloh
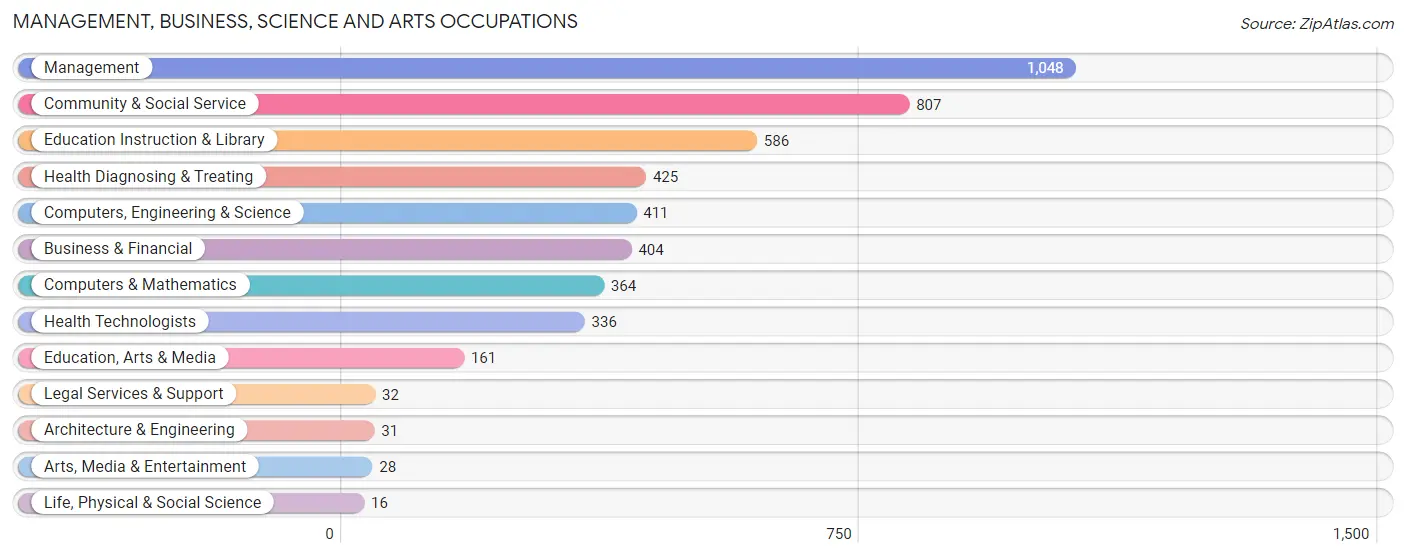
Management, Business, Science and Arts Occupations
The most common Management, Business, Science and Arts occupations in Shiloh are Management (1,048 | 15.2%), Community & Social Service (807 | 11.7%), Education Instruction & Library (586 | 8.5%), Health Diagnosing & Treating (425 | 6.2%), and Computers, Engineering & Science (411 | 6.0%).
Management, Business, Science and Arts Occupations by Sex
Within the Management, Business, Science and Arts occupations in Shiloh, the most male-oriented occupations are Architecture & Engineering (100.0%), Life, Physical & Social Science (100.0%), and Computers, Engineering & Science (85.9%), while the most female-oriented occupations are Arts, Media & Entertainment (100.0%), Health Technologists (86.6%), and Education, Arts & Media (85.7%).
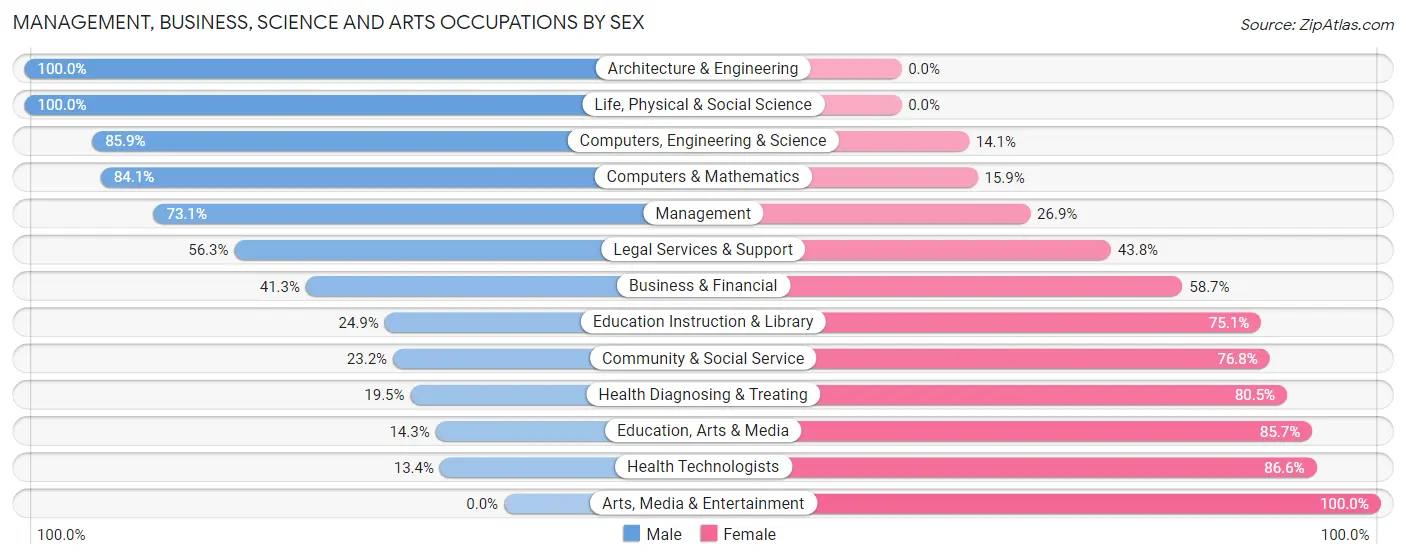
| Occupation | Male | Female |
| Management | 766 (73.1%) | 282 (26.9%) |
| Business & Financial | 167 (41.3%) | 237 (58.7%) |
| Computers, Engineering & Science | 353 (85.9%) | 58 (14.1%) |
| Computers & Mathematics | 306 (84.1%) | 58 (15.9%) |
| Architecture & Engineering | 31 (100.0%) | 0 (0.0%) |
| Life, Physical & Social Science | 16 (100.0%) | 0 (0.0%) |
| Community & Social Service | 187 (23.2%) | 620 (76.8%) |
| Education, Arts & Media | 23 (14.3%) | 138 (85.7%) |
| Legal Services & Support | 18 (56.2%) | 14 (43.8%) |
| Education Instruction & Library | 146 (24.9%) | 440 (75.1%) |
| Arts, Media & Entertainment | 0 (0.0%) | 28 (100.0%) |
| Health Diagnosing & Treating | 83 (19.5%) | 342 (80.5%) |
| Health Technologists | 45 (13.4%) | 291 (86.6%) |
| Total (Category) | 1,556 (50.3%) | 1,539 (49.7%) |
| Total (Overall) | 3,565 (51.7%) | 3,326 (48.3%) |
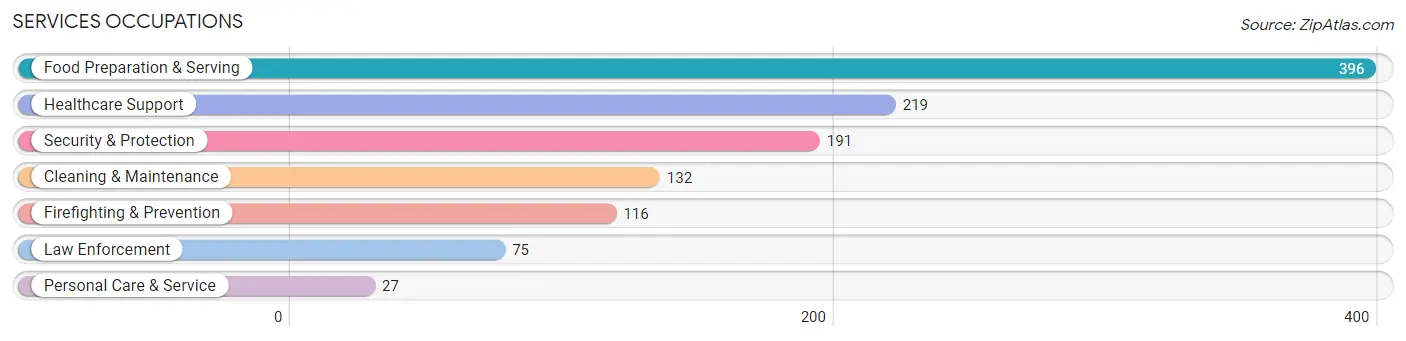
Services Occupations
The most common Services occupations in Shiloh are Food Preparation & Serving (396 | 5.8%), Healthcare Support (219 | 3.2%), Security & Protection (191 | 2.8%), Cleaning & Maintenance (132 | 1.9%), and Firefighting & Prevention (116 | 1.7%).
Services Occupations by Sex
Within the Services occupations in Shiloh, the most male-oriented occupations are Law Enforcement (100.0%), Cleaning & Maintenance (98.5%), and Food Preparation & Serving (70.7%), while the most female-oriented occupations are Personal Care & Service (100.0%), Healthcare Support (88.1%), and Firefighting & Prevention (62.9%).
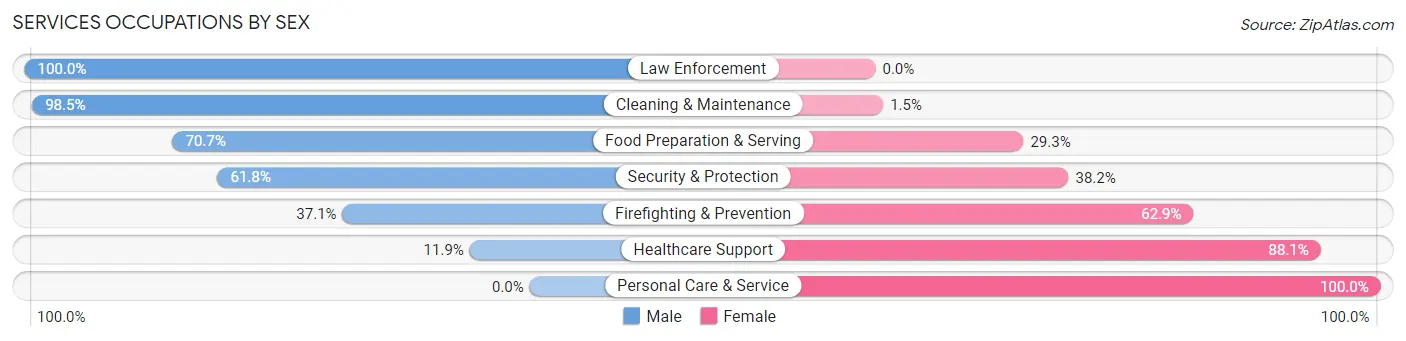
| Occupation | Male | Female |
| Healthcare Support | 26 (11.9%) | 193 (88.1%) |
| Security & Protection | 118 (61.8%) | 73 (38.2%) |
| Firefighting & Prevention | 43 (37.1%) | 73 (62.9%) |
| Law Enforcement | 75 (100.0%) | 0 (0.0%) |
| Food Preparation & Serving | 280 (70.7%) | 116 (29.3%) |
| Cleaning & Maintenance | 130 (98.5%) | 2 (1.5%) |
| Personal Care & Service | 0 (0.0%) | 27 (100.0%) |
| Total (Category) | 554 (57.4%) | 411 (42.6%) |
| Total (Overall) | 3,565 (51.7%) | 3,326 (48.3%) |
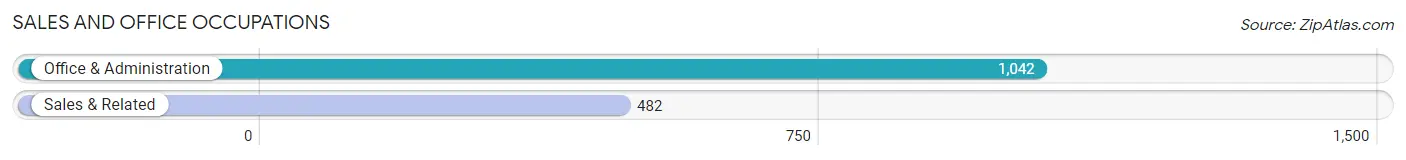
Sales and Office Occupations
The most common Sales and Office occupations in Shiloh are Office & Administration (1,042 | 15.1%), and Sales & Related (482 | 7.0%).
Sales and Office Occupations by Sex
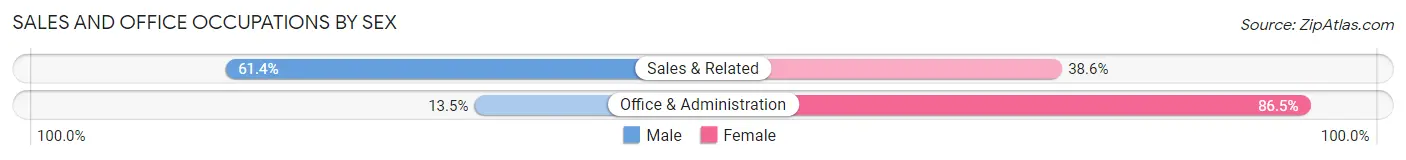
| Occupation | Male | Female |
| Sales & Related | 296 (61.4%) | 186 (38.6%) |
| Office & Administration | 141 (13.5%) | 901 (86.5%) |
| Total (Category) | 437 (28.7%) | 1,087 (71.3%) |
| Total (Overall) | 3,565 (51.7%) | 3,326 (48.3%) |
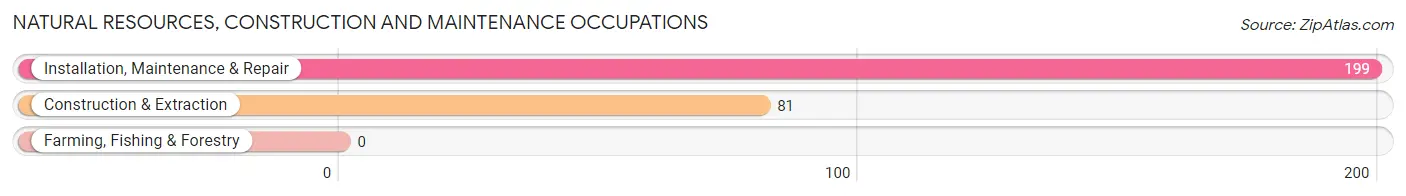
Natural Resources, Construction and Maintenance Occupations
The most common Natural Resources, Construction and Maintenance occupations in Shiloh are Installation, Maintenance & Repair (199 | 2.9%), and Construction & Extraction (81 | 1.2%).
Natural Resources, Construction and Maintenance Occupations by Sex
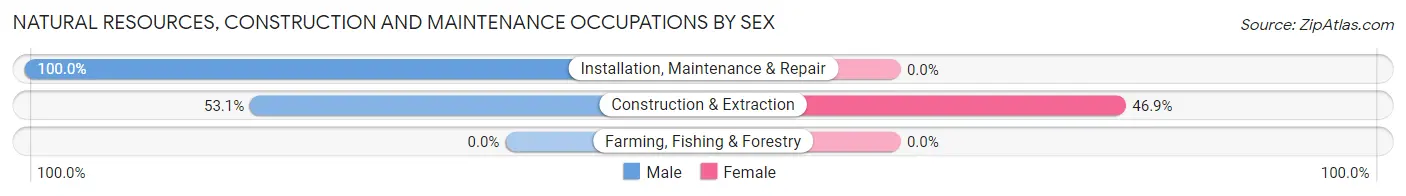
| Occupation | Male | Female |
| Farming, Fishing & Forestry | 0 (0.0%) | 0 (0.0%) |
| Construction & Extraction | 43 (53.1%) | 38 (46.9%) |
| Installation, Maintenance & Repair | 199 (100.0%) | 0 (0.0%) |
| Total (Category) | 242 (86.4%) | 38 (13.6%) |
| Total (Overall) | 3,565 (51.7%) | 3,326 (48.3%) |
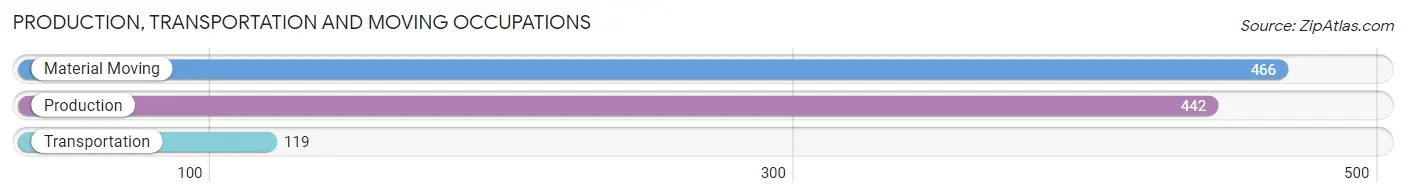
Production, Transportation and Moving Occupations
The most common Production, Transportation and Moving occupations in Shiloh are Material Moving (466 | 6.8%), Production (442 | 6.4%), and Transportation (119 | 1.7%).
Production, Transportation and Moving Occupations by Sex
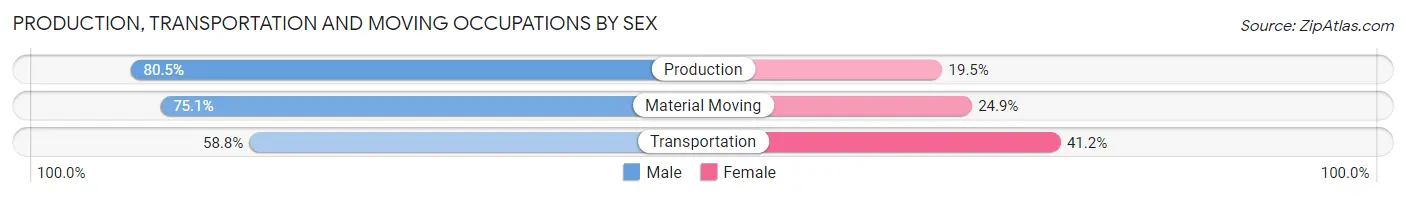
| Occupation | Male | Female |
| Production | 356 (80.5%) | 86 (19.5%) |
| Transportation | 70 (58.8%) | 49 (41.2%) |
| Material Moving | 350 (75.1%) | 116 (24.9%) |
| Total (Category) | 776 (75.6%) | 251 (24.4%) |
| Total (Overall) | 3,565 (51.7%) | 3,326 (48.3%) |
Employment Industries by Sex in Shiloh
Employment Industries in Shiloh
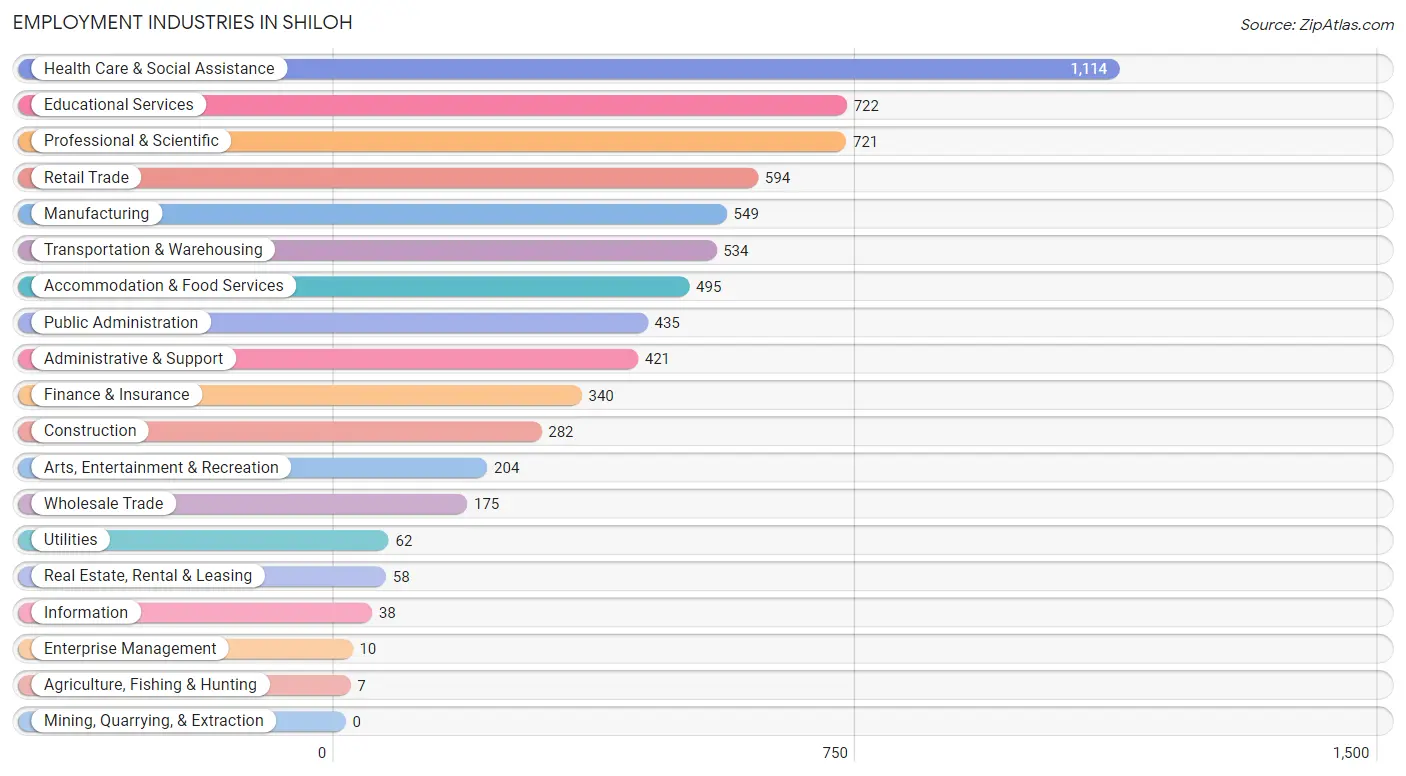
The major employment industries in Shiloh include Health Care & Social Assistance (1,114 | 16.2%), Educational Services (722 | 10.5%), Professional & Scientific (721 | 10.5%), Retail Trade (594 | 8.6%), and Manufacturing (549 | 8.0%).
Employment Industries by Sex in Shiloh
The Shiloh industries that see more men than women are Agriculture, Fishing & Hunting (100.0%), Enterprise Management (100.0%), and Construction (93.6%), whereas the industries that tend to have a higher number of women are Health Care & Social Assistance (80.0%), Arts, Entertainment & Recreation (78.9%), and Educational Services (73.6%).
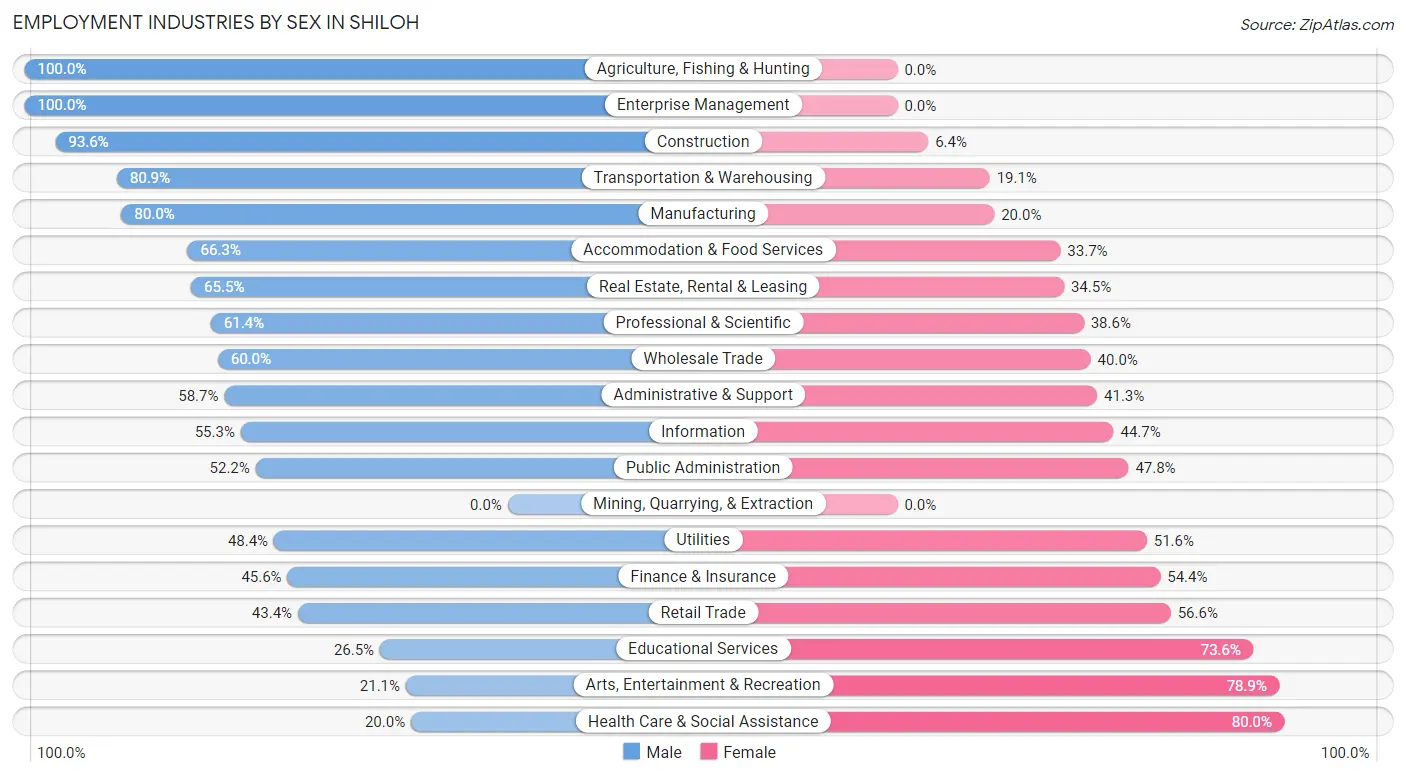
| Industry | Male | Female |
| Agriculture, Fishing & Hunting | 7 (100.0%) | 0 (0.0%) |
| Mining, Quarrying, & Extraction | 0 (0.0%) | 0 (0.0%) |
| Construction | 264 (93.6%) | 18 (6.4%) |
| Manufacturing | 439 (80.0%) | 110 (20.0%) |
| Wholesale Trade | 105 (60.0%) | 70 (40.0%) |
| Retail Trade | 258 (43.4%) | 336 (56.6%) |
| Transportation & Warehousing | 432 (80.9%) | 102 (19.1%) |
| Utilities | 30 (48.4%) | 32 (51.6%) |
| Information | 21 (55.3%) | 17 (44.7%) |
| Finance & Insurance | 155 (45.6%) | 185 (54.4%) |
| Real Estate, Rental & Leasing | 38 (65.5%) | 20 (34.5%) |
| Professional & Scientific | 443 (61.4%) | 278 (38.6%) |
| Enterprise Management | 10 (100.0%) | 0 (0.0%) |
| Administrative & Support | 247 (58.7%) | 174 (41.3%) |
| Educational Services | 191 (26.5%) | 531 (73.6%) |
| Health Care & Social Assistance | 223 (20.0%) | 891 (80.0%) |
| Arts, Entertainment & Recreation | 43 (21.1%) | 161 (78.9%) |
| Accommodation & Food Services | 328 (66.3%) | 167 (33.7%) |
| Public Administration | 227 (52.2%) | 208 (47.8%) |
| Total | 3,565 (51.7%) | 3,326 (48.3%) |
Education in Shiloh
School Enrollment in Shiloh
The most common levels of schooling among the 4,048 students in Shiloh are high school (892 | 22.0%), college / undergraduate (815 | 20.1%), and middle school (797 | 19.7%).
| School Level | # Students | % Students |
| Nursery / Preschool | 345 | 8.5% |
| Kindergarten | 173 | 4.3% |
| Elementary School | 689 | 17.0% |
| Middle School | 797 | 19.7% |
| High School | 892 | 22.0% |
| College / Undergraduate | 815 | 20.1% |
| Graduate / Professional | 337 | 8.3% |
| Total | 4,048 | 100.0% |
School Enrollment by Age by Funding Source in Shiloh
Out of a total of 4,048 students who are enrolled in schools in Shiloh, 1,150 (28.4%) attend a private institution, while the remaining 2,898 (71.6%) are enrolled in public schools. The age group of 3 to 4 year olds has the highest likelihood of being enrolled in private schools, with 237 (78.5% in the age bracket) enrolled. Conversely, the age group of 15 to 17 year olds has the lowest likelihood of being enrolled in a private school, with 637 (91.1% in the age bracket) attending a public institution.
| Age Bracket | Public School | Private School |
| 3 to 4 Year Olds | 65 (21.5%) | 237 (78.5%) |
| 5 to 9 Year Old | 592 (75.4%) | 193 (24.6%) |
| 10 to 14 Year Olds | 853 (83.1%) | 173 (16.9%) |
| 15 to 17 Year Olds | 637 (91.1%) | 62 (8.9%) |
| 18 to 19 Year Olds | 180 (59.8%) | 121 (40.2%) |
| 20 to 24 Year Olds | 141 (58.0%) | 102 (42.0%) |
| 25 to 34 Year Olds | 230 (67.2%) | 112 (32.8%) |
| 35 Years and over | 202 (57.7%) | 148 (42.3%) |
| Total | 2,898 (71.6%) | 1,150 (28.4%) |
Educational Attainment by Field of Study in Shiloh
Business (1,439 | 34.6%), education (833 | 20.1%), computers & mathematics (375 | 9.0%), science & technology (324 | 7.8%), and bio, nature & agricultural (205 | 4.9%) are the most common fields of study among 4,154 individuals in Shiloh who have obtained a bachelor's degree or higher.
| Field of Study | # Graduates | % Graduates |
| Computers & Mathematics | 375 | 9.0% |
| Bio, Nature & Agricultural | 205 | 4.9% |
| Physical & Health Sciences | 57 | 1.4% |
| Psychology | 150 | 3.6% |
| Social Sciences | 118 | 2.8% |
| Engineering | 161 | 3.9% |
| Multidisciplinary Studies | 43 | 1.0% |
| Science & Technology | 324 | 7.8% |
| Business | 1,439 | 34.6% |
| Education | 833 | 20.1% |
| Literature & Languages | 14 | 0.3% |
| Liberal Arts & History | 112 | 2.7% |
| Visual & Performing Arts | 96 | 2.3% |
| Communications | 51 | 1.2% |
| Arts & Humanities | 176 | 4.2% |
| Total | 4,154 | 100.0% |
Transportation & Commute in Shiloh
Vehicle Availability by Sex in Shiloh
The most prevalent vehicle ownership categories in Shiloh are males with 2 vehicles (1,847, accounting for 49.7%) and females with 2 vehicles (1,522, making up 55.1%).
| Vehicles Available | Male | Female |
| No Vehicle | 33 (0.9%) | 79 (2.4%) |
| 1 Vehicle | 705 (19.0%) | 720 (21.5%) |
| 2 Vehicles | 1,847 (49.7%) | 1,522 (45.4%) |
| 3 Vehicles | 642 (17.3%) | 611 (18.2%) |
| 4 Vehicles | 286 (7.7%) | 259 (7.7%) |
| 5 or more Vehicles | 206 (5.5%) | 160 (4.8%) |
| Total | 3,719 (100.0%) | 3,351 (100.0%) |
Commute Time in Shiloh
The most frequently occuring commute durations in Shiloh are 15 to 19 minutes (1,238 commuters, 19.5%), 30 to 34 minutes (1,130 commuters, 17.8%), and 10 to 14 minutes (745 commuters, 11.7%).
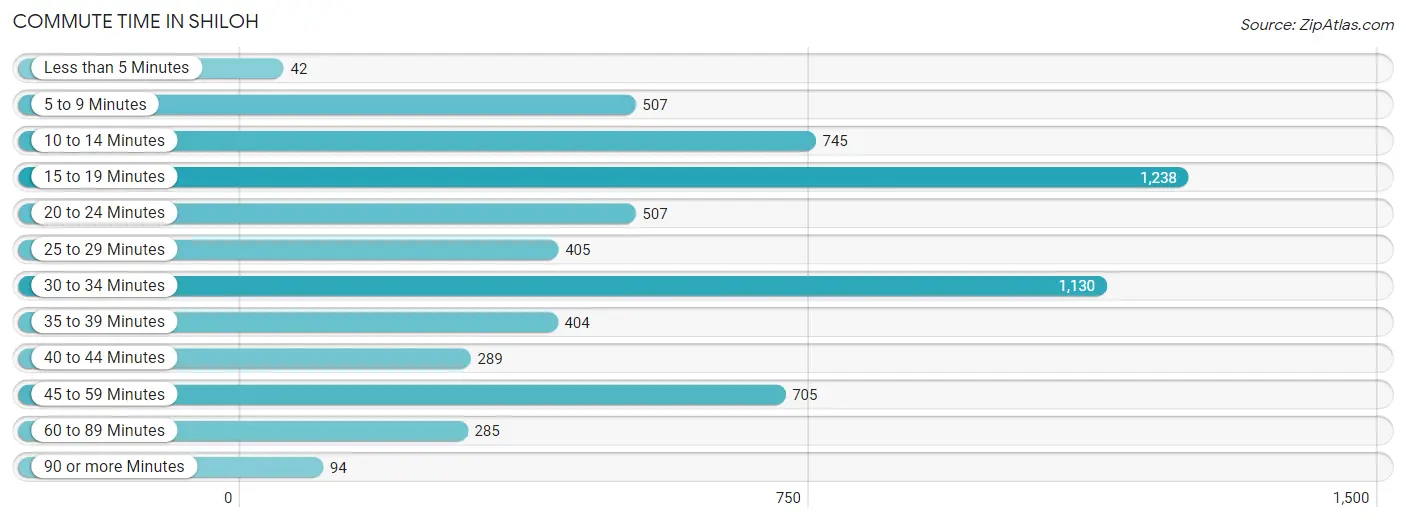
| Commute Time | # Commuters | % Commuters |
| Less than 5 Minutes | 42 | 0.7% |
| 5 to 9 Minutes | 507 | 8.0% |
| 10 to 14 Minutes | 745 | 11.7% |
| 15 to 19 Minutes | 1,238 | 19.5% |
| 20 to 24 Minutes | 507 | 8.0% |
| 25 to 29 Minutes | 405 | 6.4% |
| 30 to 34 Minutes | 1,130 | 17.8% |
| 35 to 39 Minutes | 404 | 6.4% |
| 40 to 44 Minutes | 289 | 4.5% |
| 45 to 59 Minutes | 705 | 11.1% |
| 60 to 89 Minutes | 285 | 4.5% |
| 90 or more Minutes | 94 | 1.5% |
Commute Time by Sex in Shiloh
The most common commute times in Shiloh are 15 to 19 minutes (693 commuters, 20.2%) for males and 30 to 34 minutes (553 commuters, 18.9%) for females.
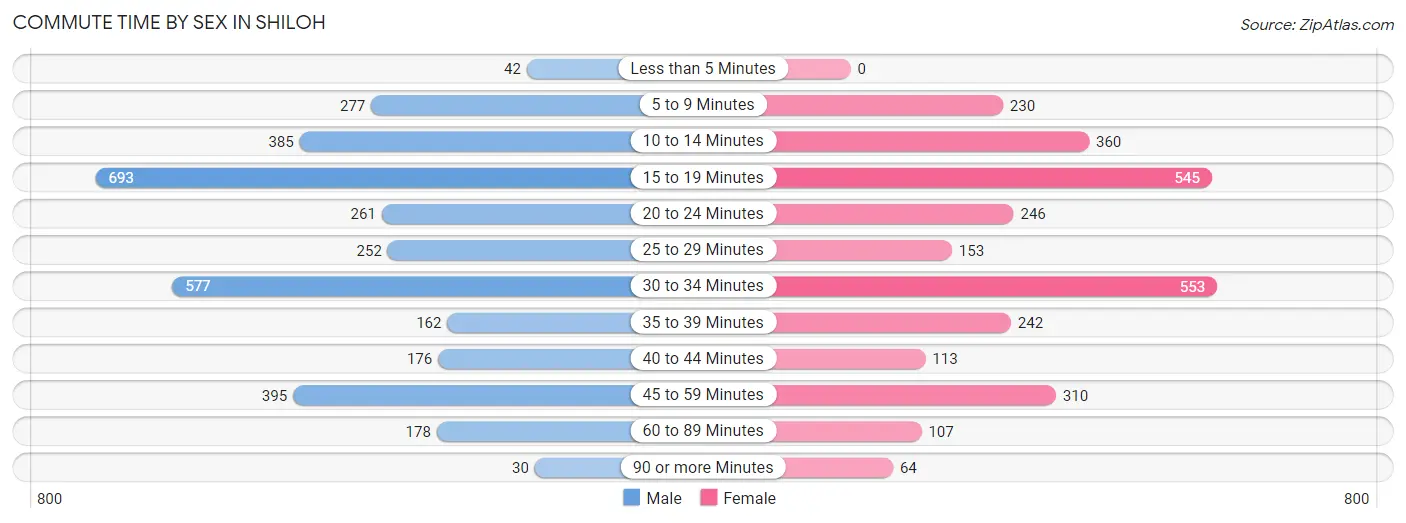
| Commute Time | Male | Female |
| Less than 5 Minutes | 42 (1.2%) | 0 (0.0%) |
| 5 to 9 Minutes | 277 (8.1%) | 230 (7.9%) |
| 10 to 14 Minutes | 385 (11.2%) | 360 (12.3%) |
| 15 to 19 Minutes | 693 (20.2%) | 545 (18.6%) |
| 20 to 24 Minutes | 261 (7.6%) | 246 (8.4%) |
| 25 to 29 Minutes | 252 (7.3%) | 153 (5.2%) |
| 30 to 34 Minutes | 577 (16.8%) | 553 (18.9%) |
| 35 to 39 Minutes | 162 (4.7%) | 242 (8.3%) |
| 40 to 44 Minutes | 176 (5.1%) | 113 (3.9%) |
| 45 to 59 Minutes | 395 (11.5%) | 310 (10.6%) |
| 60 to 89 Minutes | 178 (5.2%) | 107 (3.7%) |
| 90 or more Minutes | 30 (0.9%) | 64 (2.2%) |
Time of Departure to Work by Sex in Shiloh
The most frequent times of departure to work in Shiloh are 6:00 AM to 6:29 AM (703, 20.5%) for males and 7:00 AM to 7:29 AM (493, 16.9%) for females.
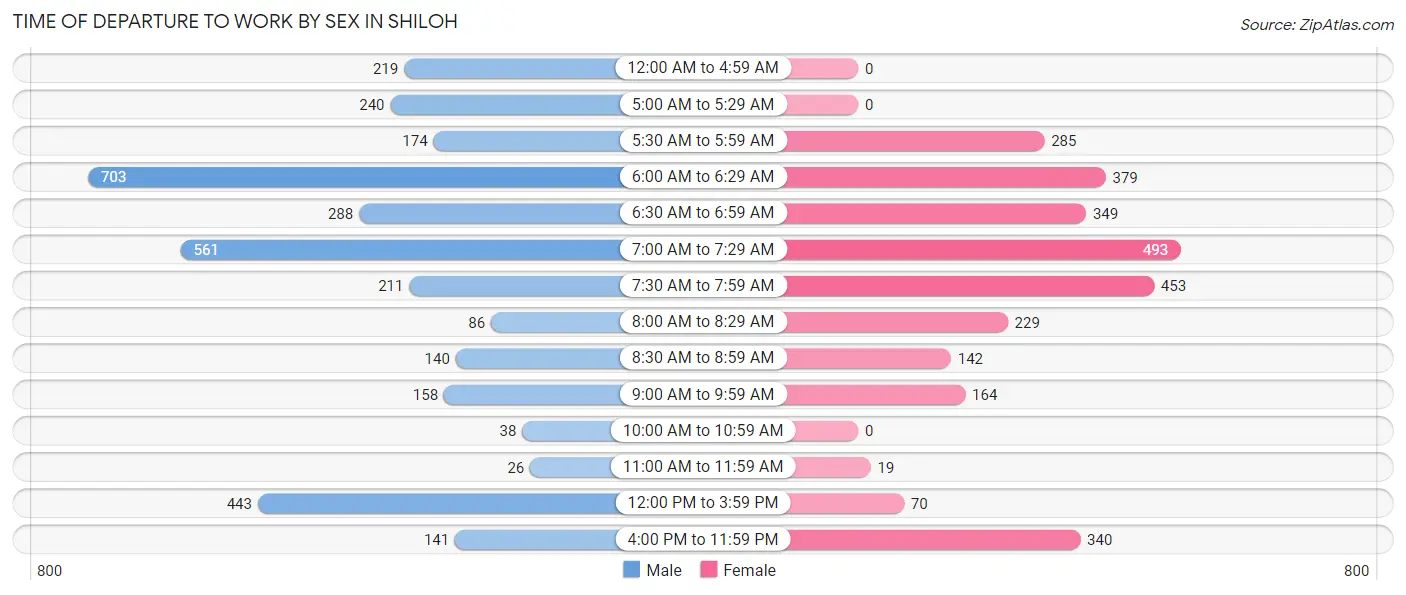
| Time of Departure | Male | Female |
| 12:00 AM to 4:59 AM | 219 (6.4%) | 0 (0.0%) |
| 5:00 AM to 5:29 AM | 240 (7.0%) | 0 (0.0%) |
| 5:30 AM to 5:59 AM | 174 (5.1%) | 285 (9.8%) |
| 6:00 AM to 6:29 AM | 703 (20.5%) | 379 (13.0%) |
| 6:30 AM to 6:59 AM | 288 (8.4%) | 349 (11.9%) |
| 7:00 AM to 7:29 AM | 561 (16.4%) | 493 (16.9%) |
| 7:30 AM to 7:59 AM | 211 (6.2%) | 453 (15.5%) |
| 8:00 AM to 8:29 AM | 86 (2.5%) | 229 (7.8%) |
| 8:30 AM to 8:59 AM | 140 (4.1%) | 142 (4.9%) |
| 9:00 AM to 9:59 AM | 158 (4.6%) | 164 (5.6%) |
| 10:00 AM to 10:59 AM | 38 (1.1%) | 0 (0.0%) |
| 11:00 AM to 11:59 AM | 26 (0.8%) | 19 (0.6%) |
| 12:00 PM to 3:59 PM | 443 (12.9%) | 70 (2.4%) |
| 4:00 PM to 11:59 PM | 141 (4.1%) | 340 (11.6%) |
| Total | 3,428 (100.0%) | 2,923 (100.0%) |
Housing Occupancy in Shiloh
Occupancy by Ownership in Shiloh
Of the total 5,418 dwellings in Shiloh, owner-occupied units account for 3,630 (67.0%), while renter-occupied units make up 1,788 (33.0%).
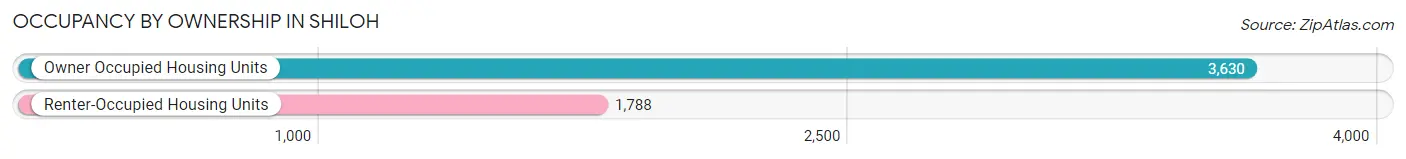
| Occupancy | # Housing Units | % Housing Units |
| Owner Occupied Housing Units | 3,630 | 67.0% |
| Renter-Occupied Housing Units | 1,788 | 33.0% |
| Total Occupied Housing Units | 5,418 | 100.0% |
Occupancy by Household Size in Shiloh
| Household Size | # Housing Units | % Housing Units |
| 1-Person Household | 1,482 | 27.4% |
| 2-Person Household | 1,968 | 36.3% |
| 3-Person Household | 817 | 15.1% |
| 4+ Person Household | 1,151 | 21.2% |
| Total Housing Units | 5,418 | 100.0% |
Occupancy by Ownership by Household Size in Shiloh
| Household Size | Owner-occupied | Renter-occupied |
| 1-Person Household | 787 (53.1%) | 695 (46.9%) |
| 2-Person Household | 1,345 (68.3%) | 623 (31.7%) |
| 3-Person Household | 623 (76.2%) | 194 (23.7%) |
| 4+ Person Household | 875 (76.0%) | 276 (24.0%) |
| Total Housing Units | 3,630 (67.0%) | 1,788 (33.0%) |
Occupancy by Educational Attainment in Shiloh
| Household Size | Owner-occupied | Renter-occupied |
| Less than High School | 13 (100.0%) | 0 (0.0%) |
| High School Diploma | 544 (70.9%) | 223 (29.1%) |
| College/Associate Degree | 1,280 (58.6%) | 905 (41.4%) |
| Bachelor's Degree or higher | 1,793 (73.1%) | 660 (26.9%) |
Occupancy by Age of Householder in Shiloh
| Age Bracket | # Households | % Households |
| Under 35 Years | 867 | 16.0% |
| 35 to 44 Years | 1,032 | 19.1% |
| 45 to 54 Years | 914 | 16.9% |
| 55 to 64 Years | 1,352 | 24.9% |
| 65 to 74 Years | 816 | 15.1% |
| 75 to 84 Years | 248 | 4.6% |
| 85 Years and Over | 189 | 3.5% |
| Total | 5,418 | 100.0% |
Housing Finances in Shiloh
Median Income by Occupancy in Shiloh
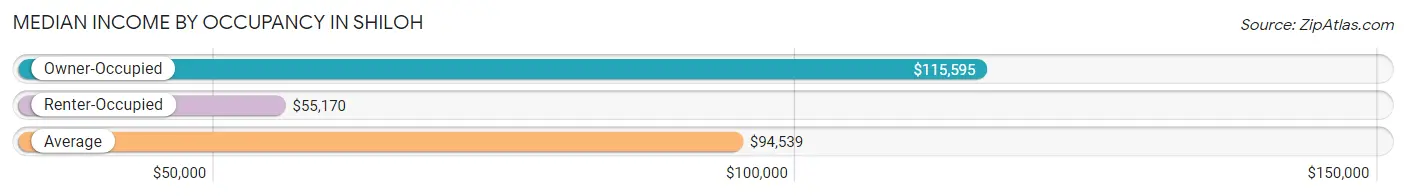
| Occupancy Type | # Households | Median Income |
| Owner-Occupied | 3,630 (67.0%) | $115,595 |
| Renter-Occupied | 1,788 (33.0%) | $55,170 |
| Average | 5,418 (100.0%) | $94,539 |
Occupancy by Householder Income Bracket in Shiloh
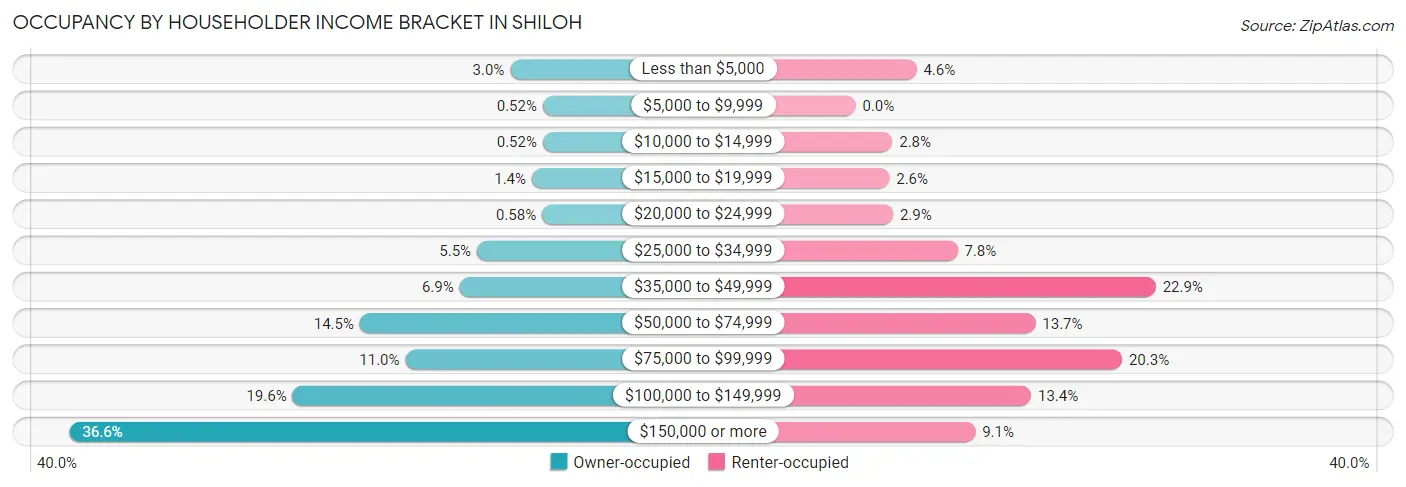
| Income Bracket | Owner-occupied | Renter-occupied |
| Less than $5,000 | 109 (3.0%) | 83 (4.6%) |
| $5,000 to $9,999 | 19 (0.5%) | 0 (0.0%) |
| $10,000 to $14,999 | 19 (0.5%) | 50 (2.8%) |
| $15,000 to $19,999 | 49 (1.3%) | 46 (2.6%) |
| $20,000 to $24,999 | 21 (0.6%) | 51 (2.9%) |
| $25,000 to $34,999 | 201 (5.5%) | 139 (7.8%) |
| $35,000 to $49,999 | 249 (6.9%) | 409 (22.9%) |
| $50,000 to $74,999 | 525 (14.5%) | 245 (13.7%) |
| $75,000 to $99,999 | 399 (11.0%) | 363 (20.3%) |
| $100,000 to $149,999 | 711 (19.6%) | 239 (13.4%) |
| $150,000 or more | 1,328 (36.6%) | 163 (9.1%) |
| Total | 3,630 (100.0%) | 1,788 (100.0%) |
Monthly Housing Cost Tiers in Shiloh
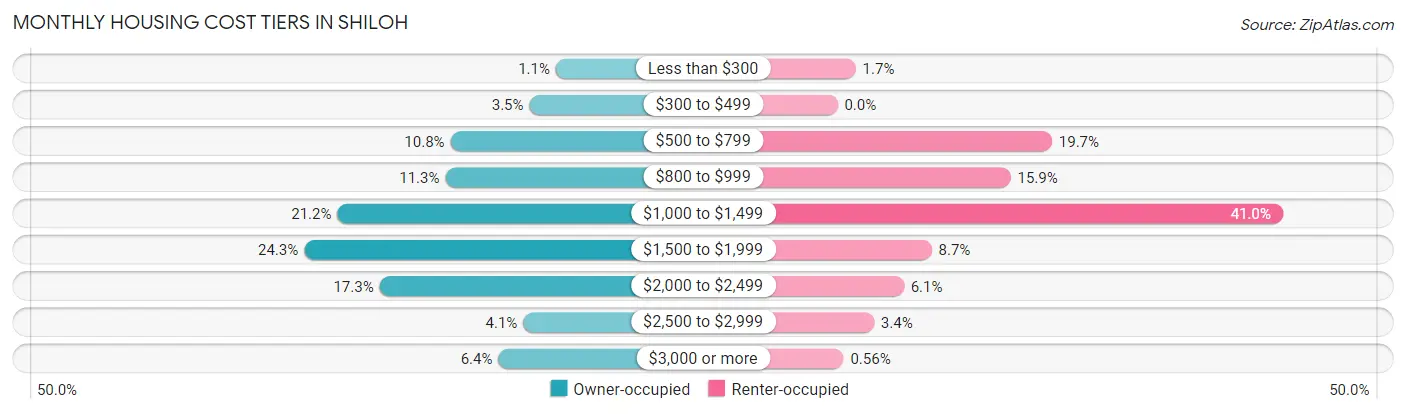
| Monthly Cost | Owner-occupied | Renter-occupied |
| Less than $300 | 40 (1.1%) | 30 (1.7%) |
| $300 to $499 | 128 (3.5%) | 0 (0.0%) |
| $500 to $799 | 392 (10.8%) | 353 (19.7%) |
| $800 to $999 | 409 (11.3%) | 285 (15.9%) |
| $1,000 to $1,499 | 770 (21.2%) | 733 (41.0%) |
| $1,500 to $1,999 | 881 (24.3%) | 155 (8.7%) |
| $2,000 to $2,499 | 629 (17.3%) | 109 (6.1%) |
| $2,500 to $2,999 | 149 (4.1%) | 60 (3.4%) |
| $3,000 or more | 232 (6.4%) | 10 (0.6%) |
| Total | 3,630 (100.0%) | 1,788 (100.0%) |
Physical Housing Characteristics in Shiloh
Housing Structures in Shiloh
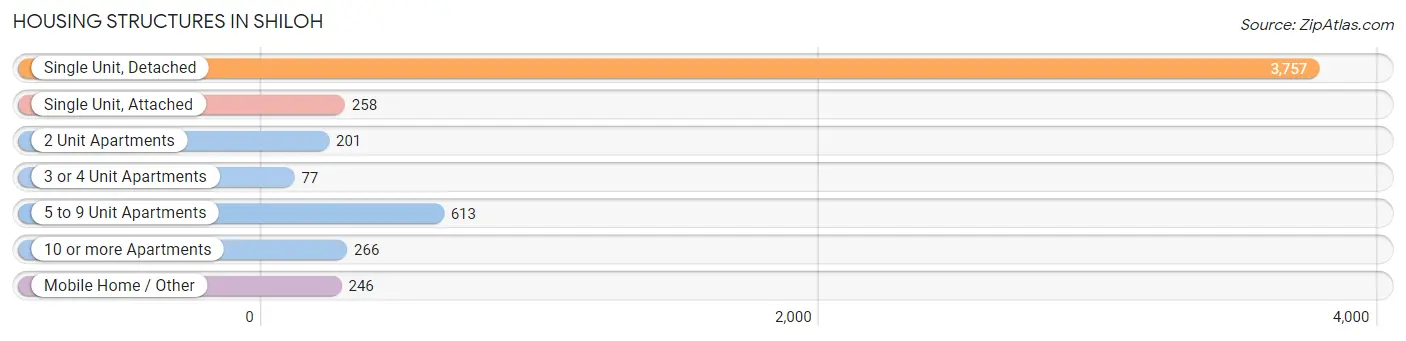
| Structure Type | # Housing Units | % Housing Units |
| Single Unit, Detached | 3,757 | 69.3% |
| Single Unit, Attached | 258 | 4.8% |
| 2 Unit Apartments | 201 | 3.7% |
| 3 or 4 Unit Apartments | 77 | 1.4% |
| 5 to 9 Unit Apartments | 613 | 11.3% |
| 10 or more Apartments | 266 | 4.9% |
| Mobile Home / Other | 246 | 4.5% |
| Total | 5,418 | 100.0% |
Housing Structures by Occupancy in Shiloh
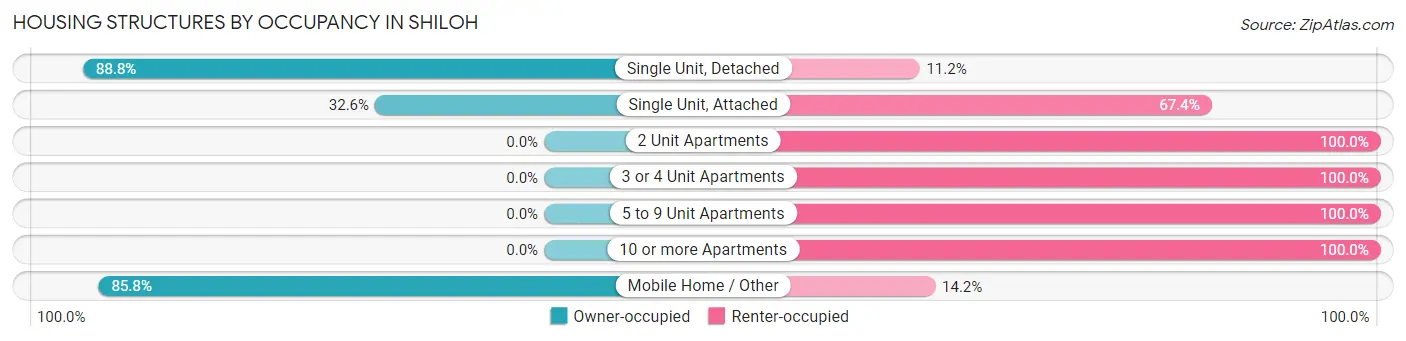
| Structure Type | Owner-occupied | Renter-occupied |
| Single Unit, Detached | 3,335 (88.8%) | 422 (11.2%) |
| Single Unit, Attached | 84 (32.6%) | 174 (67.4%) |
| 2 Unit Apartments | 0 (0.0%) | 201 (100.0%) |
| 3 or 4 Unit Apartments | 0 (0.0%) | 77 (100.0%) |
| 5 to 9 Unit Apartments | 0 (0.0%) | 613 (100.0%) |
| 10 or more Apartments | 0 (0.0%) | 266 (100.0%) |
| Mobile Home / Other | 211 (85.8%) | 35 (14.2%) |
| Total | 3,630 (67.0%) | 1,788 (33.0%) |
Housing Structures by Number of Rooms in Shiloh
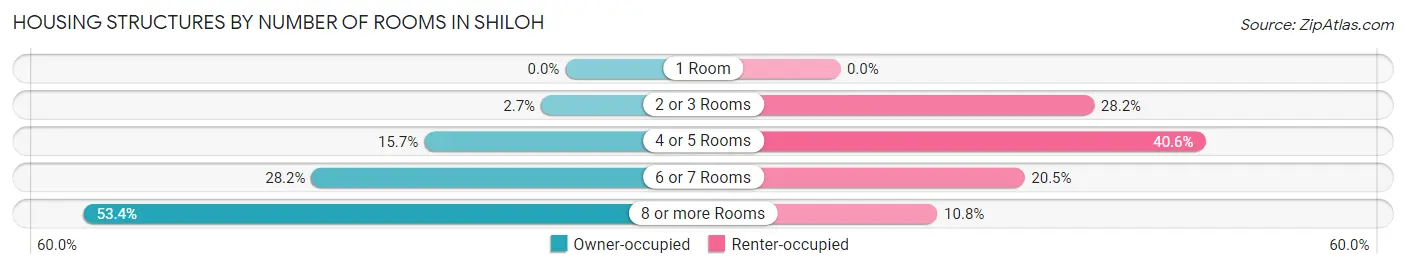
| Number of Rooms | Owner-occupied | Renter-occupied |
| 1 Room | 0 (0.0%) | 0 (0.0%) |
| 2 or 3 Rooms | 98 (2.7%) | 504 (28.2%) |
| 4 or 5 Rooms | 569 (15.7%) | 725 (40.6%) |
| 6 or 7 Rooms | 1,023 (28.2%) | 366 (20.5%) |
| 8 or more Rooms | 1,940 (53.4%) | 193 (10.8%) |
| Total | 3,630 (100.0%) | 1,788 (100.0%) |
Housing Structure by Heating Type in Shiloh
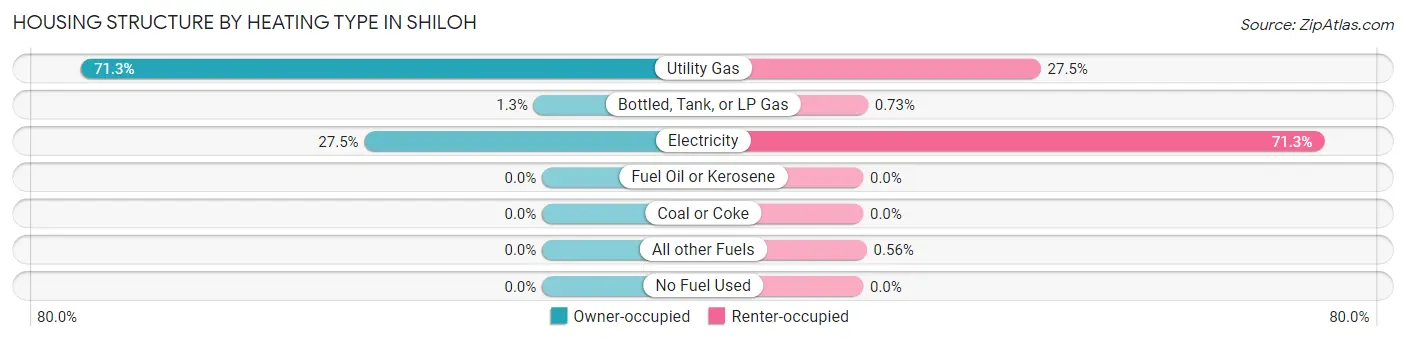
| Heating Type | Owner-occupied | Renter-occupied |
| Utility Gas | 2,587 (71.3%) | 491 (27.5%) |
| Bottled, Tank, or LP Gas | 46 (1.3%) | 13 (0.7%) |
| Electricity | 997 (27.5%) | 1,274 (71.3%) |
| Fuel Oil or Kerosene | 0 (0.0%) | 0 (0.0%) |
| Coal or Coke | 0 (0.0%) | 0 (0.0%) |
| All other Fuels | 0 (0.0%) | 10 (0.6%) |
| No Fuel Used | 0 (0.0%) | 0 (0.0%) |
| Total | 3,630 (100.0%) | 1,788 (100.0%) |
Household Vehicle Usage in Shiloh
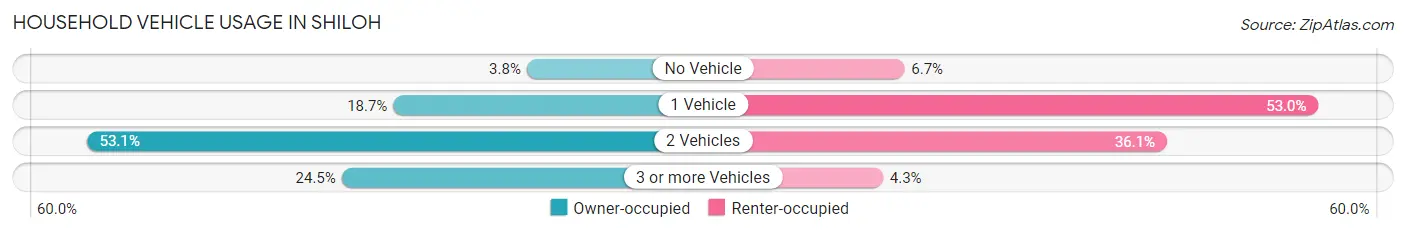
| Vehicles per Household | Owner-occupied | Renter-occupied |
| No Vehicle | 136 (3.7%) | 119 (6.7%) |
| 1 Vehicle | 679 (18.7%) | 948 (53.0%) |
| 2 Vehicles | 1,926 (53.1%) | 645 (36.1%) |
| 3 or more Vehicles | 889 (24.5%) | 76 (4.3%) |
| Total | 3,630 (100.0%) | 1,788 (100.0%) |
Real Estate & Mortgages in Shiloh
Real Estate and Mortgage Overview in Shiloh
| Characteristic | Without Mortgage | With Mortgage |
| Housing Units | 1,217 | 2,413 |
| Median Property Value | $207,600 | $277,700 |
| Median Household Income | $75,885 | $953 |
| Monthly Housing Costs | $815 | $232 |
| Real Estate Taxes | $4,486 | $108 |
Property Value by Mortgage Status in Shiloh
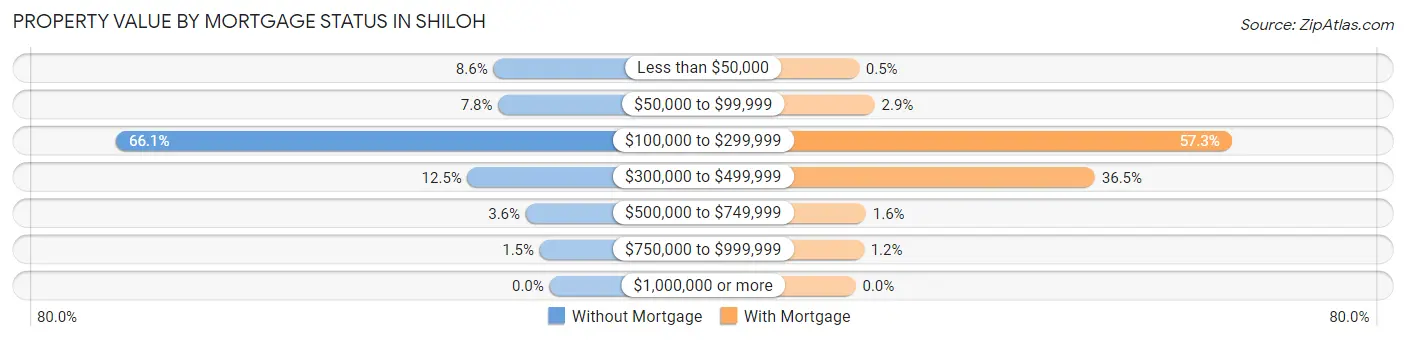
| Property Value | Without Mortgage | With Mortgage |
| Less than $50,000 | 104 (8.6%) | 12 (0.5%) |
| $50,000 to $99,999 | 95 (7.8%) | 70 (2.9%) |
| $100,000 to $299,999 | 804 (66.1%) | 1,383 (57.3%) |
| $300,000 to $499,999 | 152 (12.5%) | 880 (36.5%) |
| $500,000 to $749,999 | 44 (3.6%) | 38 (1.6%) |
| $750,000 to $999,999 | 18 (1.5%) | 30 (1.2%) |
| $1,000,000 or more | 0 (0.0%) | 0 (0.0%) |
| Total | 1,217 (100.0%) | 2,413 (100.0%) |
Household Income by Mortgage Status in Shiloh
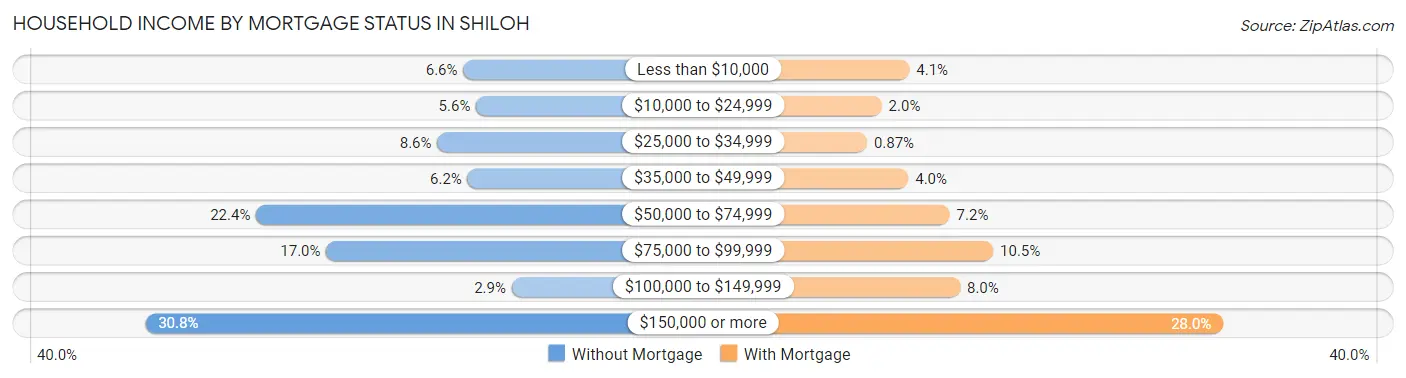
| Household Income | Without Mortgage | With Mortgage |
| Less than $10,000 | 80 (6.6%) | 99 (4.1%) |
| $10,000 to $24,999 | 68 (5.6%) | 48 (2.0%) |
| $25,000 to $34,999 | 104 (8.6%) | 21 (0.9%) |
| $35,000 to $49,999 | 76 (6.2%) | 97 (4.0%) |
| $50,000 to $74,999 | 272 (22.4%) | 173 (7.2%) |
| $75,000 to $99,999 | 207 (17.0%) | 253 (10.5%) |
| $100,000 to $149,999 | 35 (2.9%) | 192 (8.0%) |
| $150,000 or more | 375 (30.8%) | 676 (28.0%) |
| Total | 1,217 (100.0%) | 2,413 (100.0%) |
Property Value to Household Income Ratio in Shiloh
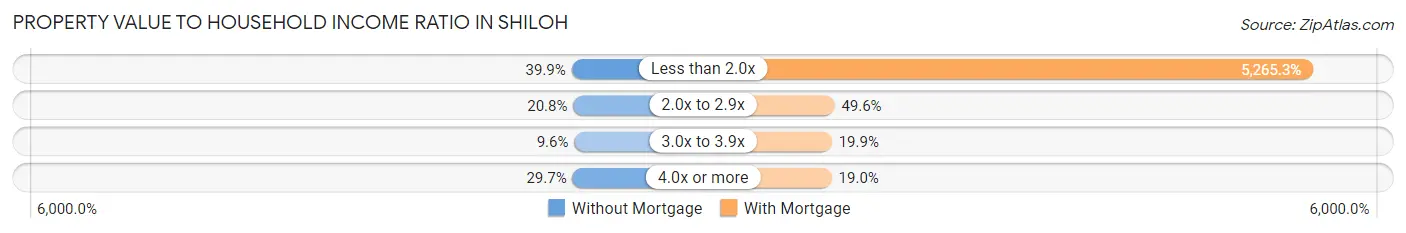
| Value-to-Income Ratio | Without Mortgage | With Mortgage |
| Less than 2.0x | 486 (39.9%) | 127,051 (5,265.3%) |
| 2.0x to 2.9x | 253 (20.8%) | 1,196 (49.6%) |
| 3.0x to 3.9x | 117 (9.6%) | 481 (19.9%) |
| 4.0x or more | 361 (29.7%) | 459 (19.0%) |
| Total | 1,217 (100.0%) | 2,413 (100.0%) |
Real Estate Taxes by Mortgage Status in Shiloh
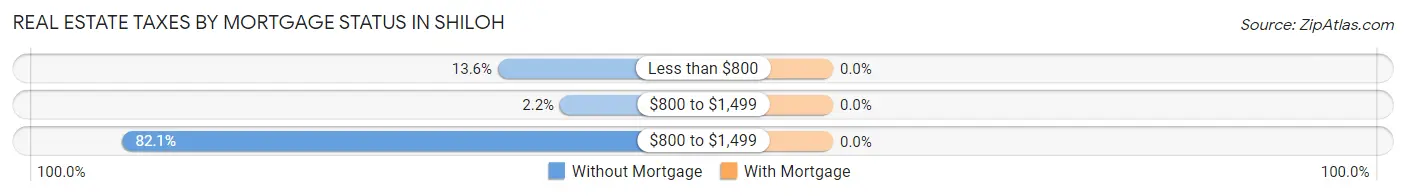
| Property Taxes | Without Mortgage | With Mortgage |
| Less than $800 | 165 (13.6%) | 0 (0.0%) |
| $800 to $1,499 | 27 (2.2%) | 0 (0.0%) |
| $800 to $1,499 | 999 (82.1%) | 0 (0.0%) |
| Total | 1,217 (100.0%) | 2,413 (100.0%) |
Health & Disability in Shiloh
Health Insurance Coverage by Age in Shiloh
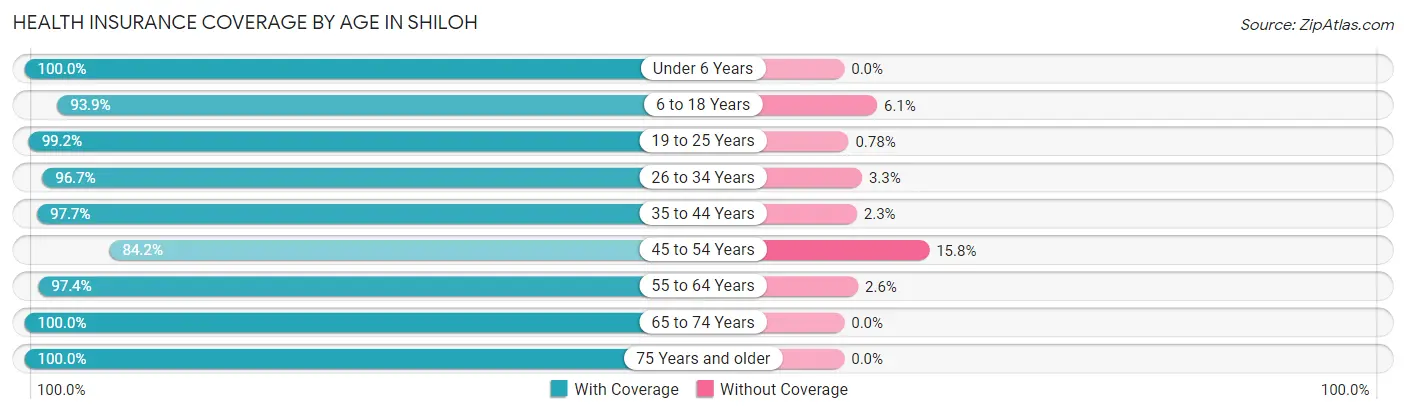
| Age Bracket | With Coverage | Without Coverage |
| Under 6 Years | 733 (100.0%) | 0 (0.0%) |
| 6 to 18 Years | 2,445 (93.9%) | 159 (6.1%) |
| 19 to 25 Years | 767 (99.2%) | 6 (0.8%) |
| 26 to 34 Years | 1,201 (96.7%) | 41 (3.3%) |
| 35 to 44 Years | 1,544 (97.7%) | 37 (2.3%) |
| 45 to 54 Years | 1,472 (84.2%) | 277 (15.8%) |
| 55 to 64 Years | 2,165 (97.4%) | 57 (2.6%) |
| 65 to 74 Years | 1,515 (100.0%) | 0 (0.0%) |
| 75 Years and older | 724 (100.0%) | 0 (0.0%) |
| Total | 12,566 (95.6%) | 577 (4.4%) |
Health Insurance Coverage by Citizenship Status in Shiloh
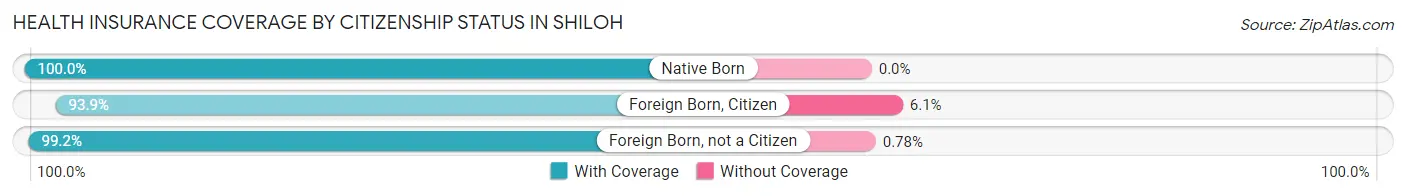
| Citizenship Status | With Coverage | Without Coverage |
| Native Born | 733 (100.0%) | 0 (0.0%) |
| Foreign Born, Citizen | 2,445 (93.9%) | 159 (6.1%) |
| Foreign Born, not a Citizen | 767 (99.2%) | 6 (0.8%) |
Health Insurance Coverage by Household Income in Shiloh
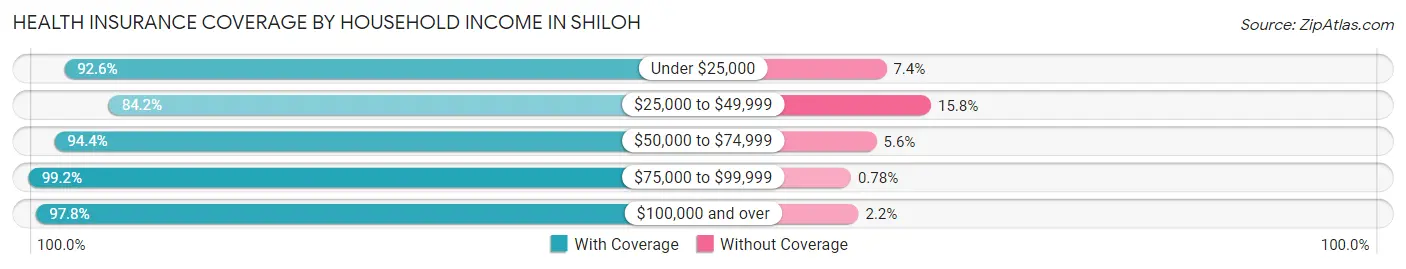
| Household Income | With Coverage | Without Coverage |
| Under $25,000 | 536 (92.6%) | 43 (7.4%) |
| $25,000 to $49,999 | 1,393 (84.2%) | 261 (15.8%) |
| $50,000 to $74,999 | 1,536 (94.4%) | 91 (5.6%) |
| $75,000 to $99,999 | 1,916 (99.2%) | 15 (0.8%) |
| $100,000 and over | 7,172 (97.8%) | 161 (2.2%) |
Public vs Private Health Insurance Coverage by Age in Shiloh
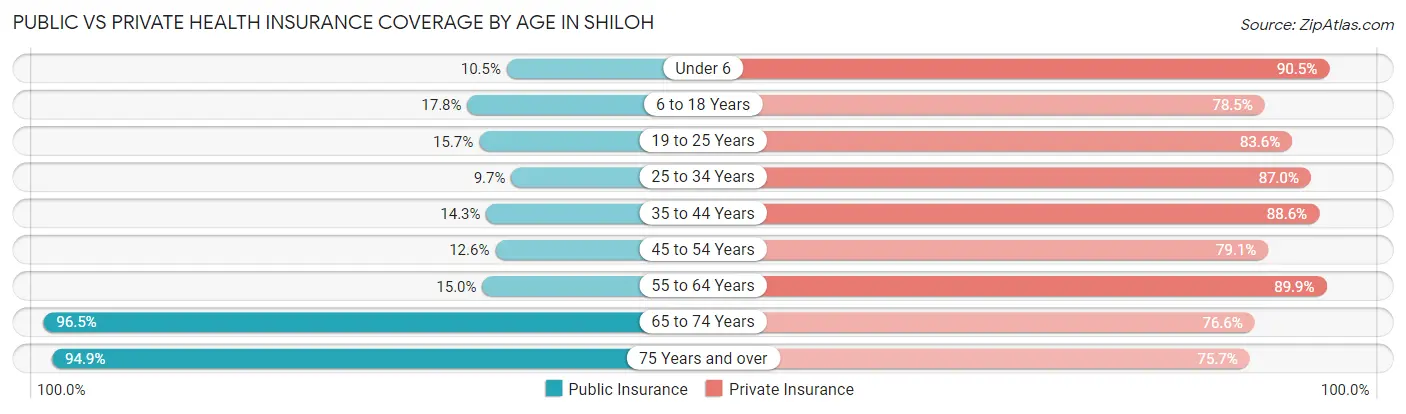
| Age Bracket | Public Insurance | Private Insurance |
| Under 6 | 77 (10.5%) | 663 (90.4%) |
| 6 to 18 Years | 464 (17.8%) | 2,043 (78.5%) |
| 19 to 25 Years | 121 (15.7%) | 646 (83.6%) |
| 25 to 34 Years | 120 (9.7%) | 1,081 (87.0%) |
| 35 to 44 Years | 226 (14.3%) | 1,400 (88.5%) |
| 45 to 54 Years | 221 (12.6%) | 1,384 (79.1%) |
| 55 to 64 Years | 334 (15.0%) | 1,998 (89.9%) |
| 65 to 74 Years | 1,462 (96.5%) | 1,161 (76.6%) |
| 75 Years and over | 687 (94.9%) | 548 (75.7%) |
| Total | 3,712 (28.2%) | 10,924 (83.1%) |
Disability Status by Sex by Age in Shiloh
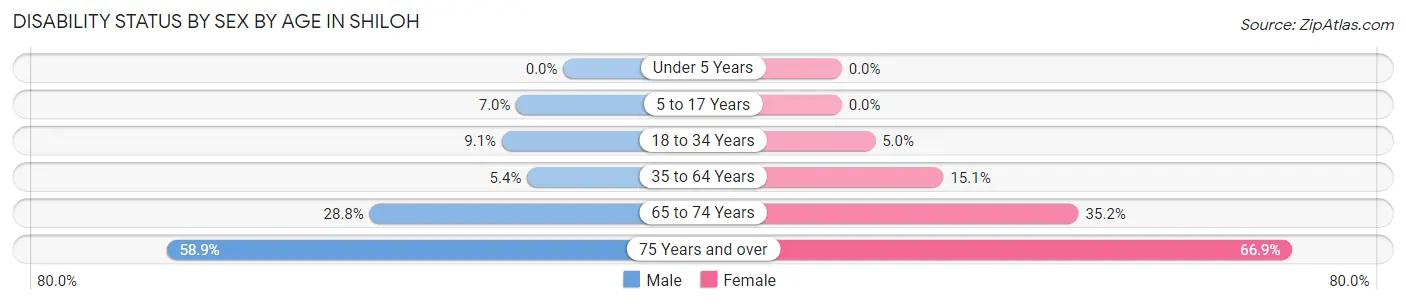
| Age Bracket | Male | Female |
| Under 5 Years | 0 (0.0%) | 0 (0.0%) |
| 5 to 17 Years | 100 (7.0%) | 0 (0.0%) |
| 18 to 34 Years | 105 (9.1%) | 56 (5.0%) |
| 35 to 64 Years | 136 (5.4%) | 455 (15.1%) |
| 65 to 74 Years | 206 (28.8%) | 281 (35.2%) |
| 75 Years and over | 165 (58.9%) | 297 (66.9%) |
Disability Class by Sex by Age in Shiloh
Disability Class: Hearing Difficulty
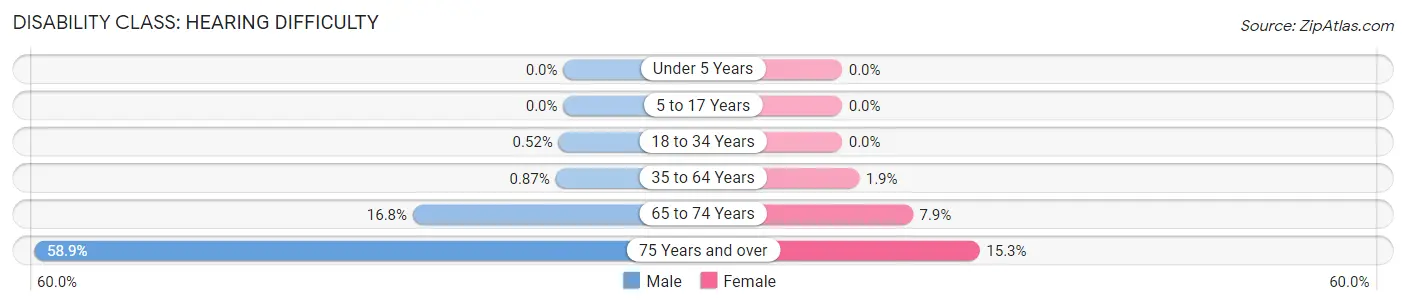
| Age Bracket | Male | Female |
| Under 5 Years | 0 (0.0%) | 0 (0.0%) |
| 5 to 17 Years | 0 (0.0%) | 0 (0.0%) |
| 18 to 34 Years | 6 (0.5%) | 0 (0.0%) |
| 35 to 64 Years | 22 (0.9%) | 57 (1.9%) |
| 65 to 74 Years | 120 (16.8%) | 63 (7.9%) |
| 75 Years and over | 165 (58.9%) | 68 (15.3%) |
Disability Class: Vision Difficulty
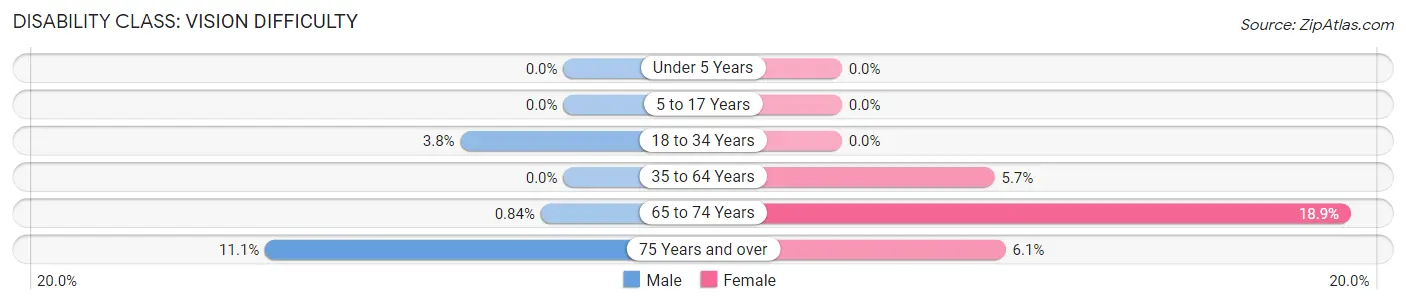
| Age Bracket | Male | Female |
| Under 5 Years | 0 (0.0%) | 0 (0.0%) |
| 5 to 17 Years | 0 (0.0%) | 0 (0.0%) |
| 18 to 34 Years | 44 (3.8%) | 0 (0.0%) |
| 35 to 64 Years | 0 (0.0%) | 171 (5.7%) |
| 65 to 74 Years | 6 (0.8%) | 151 (18.9%) |
| 75 Years and over | 31 (11.1%) | 27 (6.1%) |
Disability Class: Cognitive Difficulty
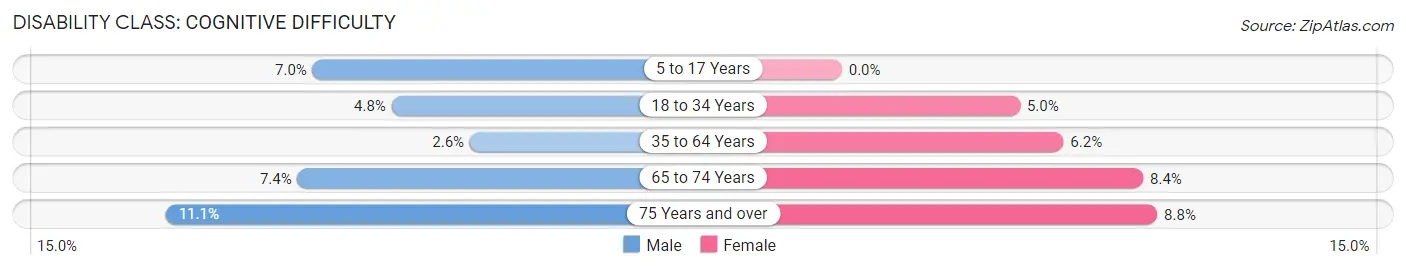
| Age Bracket | Male | Female |
| 5 to 17 Years | 100 (7.0%) | 0 (0.0%) |
| 18 to 34 Years | 55 (4.8%) | 56 (5.0%) |
| 35 to 64 Years | 66 (2.6%) | 186 (6.2%) |
| 65 to 74 Years | 53 (7.4%) | 67 (8.4%) |
| 75 Years and over | 31 (11.1%) | 39 (8.8%) |
Disability Class: Ambulatory Difficulty
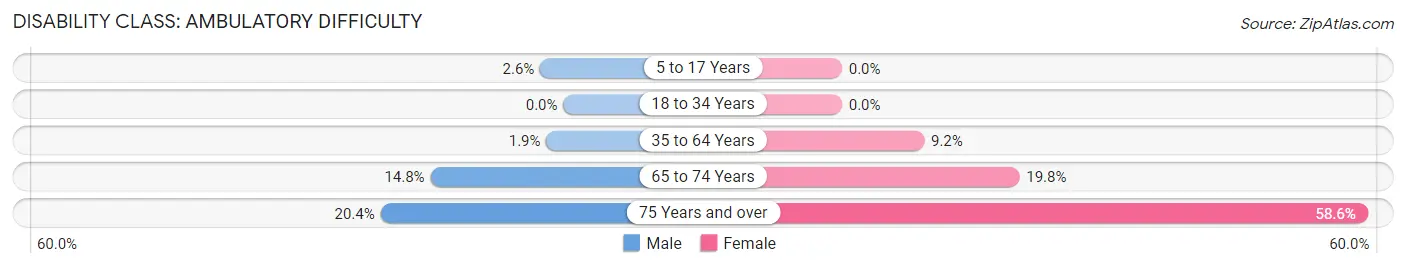
| Age Bracket | Male | Female |
| 5 to 17 Years | 37 (2.6%) | 0 (0.0%) |
| 18 to 34 Years | 0 (0.0%) | 0 (0.0%) |
| 35 to 64 Years | 48 (1.9%) | 276 (9.2%) |
| 65 to 74 Years | 106 (14.8%) | 158 (19.8%) |
| 75 Years and over | 57 (20.4%) | 260 (58.6%) |
Disability Class: Self-Care Difficulty
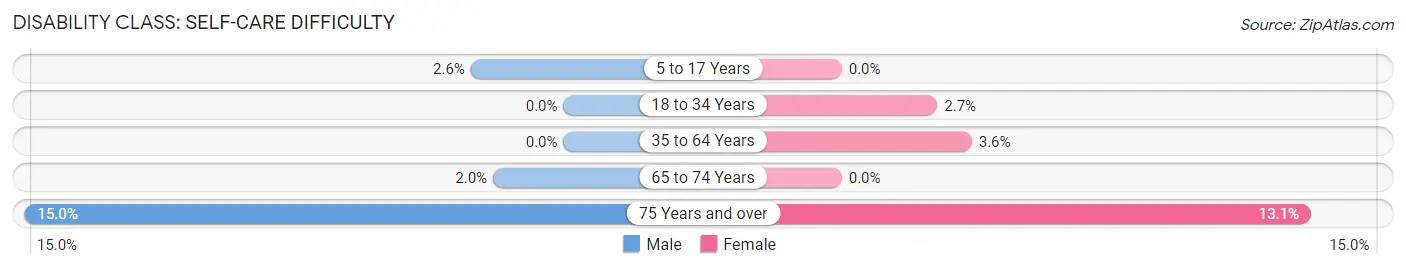
| Age Bracket | Male | Female |
| 5 to 17 Years | 37 (2.6%) | 0 (0.0%) |
| 18 to 34 Years | 0 (0.0%) | 30 (2.7%) |
| 35 to 64 Years | 0 (0.0%) | 109 (3.6%) |
| 65 to 74 Years | 14 (2.0%) | 0 (0.0%) |
| 75 Years and over | 42 (15.0%) | 58 (13.1%) |
Technology Access in Shiloh
Computing Device Access in Shiloh
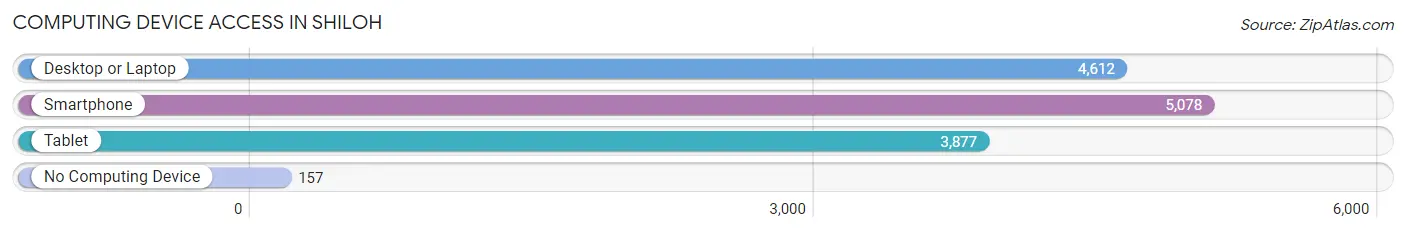
| Device Type | # Households | % Households |
| Desktop or Laptop | 4,612 | 85.1% |
| Smartphone | 5,078 | 93.7% |
| Tablet | 3,877 | 71.6% |
| No Computing Device | 157 | 2.9% |
| Total | 5,418 | 100.0% |
Internet Access in Shiloh
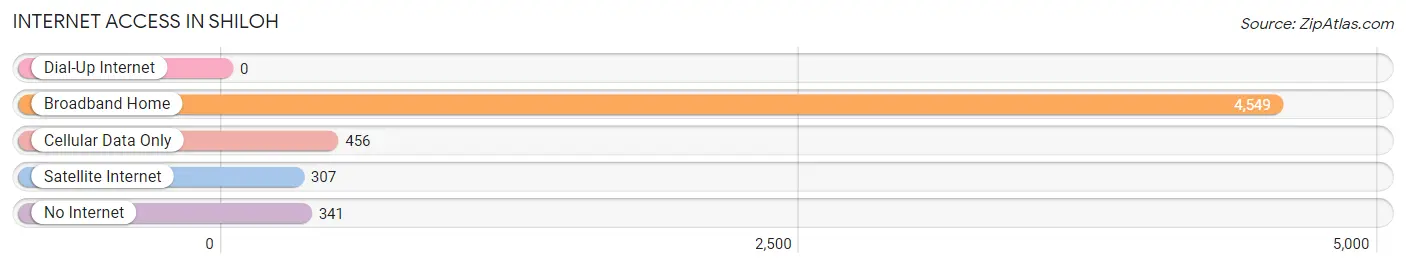
| Internet Type | # Households | % Households |
| Dial-Up Internet | 0 | 0.0% |
| Broadband Home | 4,549 | 84.0% |
| Cellular Data Only | 456 | 8.4% |
| Satellite Internet | 307 | 5.7% |
| No Internet | 341 | 6.3% |
| Total | 5,418 | 100.0% |
Shiloh Summary
Shiloh, Illinois is a small village located in St. Clair County, Illinois, United States. It is located approximately 25 miles east of St. Louis, Missouri. The population of Shiloh was 12,651 at the 2010 census.
History
Shiloh was founded in 1819 by a group of settlers from Kentucky and Tennessee. The village was named after the biblical city of Shiloh, which was located in the ancient kingdom of Israel. The first settlers were mostly farmers and the village grew slowly over the years. In 1837, the village was incorporated and the first post office was established.
In the late 19th century, Shiloh became a popular summer resort for St. Louisans. The village was known for its mineral springs, which were believed to have healing properties. The village also had several hotels and resorts, which attracted visitors from all over the country.
In the early 20th century, Shiloh began to experience rapid growth. The village was connected to St. Louis by a trolley line and the population increased from 1,000 in 1900 to over 5,000 by 1920. The village was also home to several factories, including a shoe factory, a brickyard, and a canning factory.
Geography
Shiloh is located in St. Clair County, Illinois, approximately 25 miles east of St. Louis, Missouri. The village is situated on the banks of the Kaskaskia River. The village has a total area of 4.2 square miles, all of which is land.
The climate in Shiloh is humid continental, with hot, humid summers and cold, snowy winters. The average annual temperature is 54°F and the average annual precipitation is 40 inches.
Economy
The economy of Shiloh is largely based on manufacturing and retail. The village is home to several factories, including a shoe factory, a brickyard, and a canning factory. The village also has several retail stores, including a grocery store, a hardware store, and a pharmacy.
The village is also home to several small businesses, including restaurants, bars, and a movie theater. The village also has several parks and recreational facilities, including a golf course, a swimming pool, and a tennis court.
Demographics
As of the 2010 census, the population of Shiloh was 12,651. The racial makeup of the village was 87.3% White, 8.2% African American, 0.7% Native American, 0.7% Asian, 0.1% Pacific Islander, 1.2% from other races, and 1.9% from two or more races. Hispanic or Latino of any race were 3.2% of the population.
The median income for a household in Shiloh was $50,945 and the median income for a family was $60,945. The per capita income for the village was $24,945. About 5.2% of families and 6.7% of the population were below the poverty line, including 8.2% of those under age 18 and 4.2% of those age 65 or over.
Common Questions
What is Per Capita Income in Shiloh?
Per Capita income in Shiloh is $45,495.
What is the Median Family Income in Shiloh?
Median Family Income in Shiloh is $107,398.
What is the Median Household income in Shiloh?
Median Household Income in Shiloh is $94,539.
What is Income or Wage Gap in Shiloh?
Income or Wage Gap in Shiloh is 22.2%.
Women in Shiloh earn 77.8 cents for every dollar earned by a man.
What is Family Income Deficit in Shiloh?
Family Income Deficit in Shiloh is $10,968.
Families that are below poverty line in Shiloh earn $10,968 less on average than the poverty threshold level.
What is Inequality or Gini Index in Shiloh?
Inequality or Gini Index in Shiloh is 0.41.
What is the Total Population of Shiloh?
Total Population of Shiloh is 13,892.
What is the Total Male Population of Shiloh?
Total Male Population of Shiloh is 7,044.
What is the Total Female Population of Shiloh?
Total Female Population of Shiloh is 6,848.
What is the Ratio of Males per 100 Females in Shiloh?
There are 102.86 Males per 100 Females in Shiloh.
What is the Ratio of Females per 100 Males in Shiloh?
There are 97.22 Females per 100 Males in Shiloh.
What is the Median Population Age in Shiloh?
Median Population Age in Shiloh is 40.6 Years.
What is the Average Family Size in Shiloh
Average Family Size in Shiloh is 3.0 People.
What is the Average Household Size in Shiloh
Average Household Size in Shiloh is 2.5 People.
How Large is the Labor Force in Shiloh?
There are 7,728 People in the Labor Forcein in Shiloh.
What is the Percentage of People in the Labor Force in Shiloh?
68.4% of People are in the Labor Force in Shiloh.
What is the Unemployment Rate in Shiloh?
Unemployment Rate in Shiloh is 1.9%.