Robinson, IL Map & Demographics
Robinson Map
Robinson Overview
$28,249
PER CAPITA INCOME
$77,750
AVG FAMILY INCOME
$57,500
AVG HOUSEHOLD INCOME
18.5%
WAGE / INCOME GAP [ % ]
81.5¢/ $1
WAGE / INCOME GAP [ $ ]
0.41
INEQUALITY / GINI INDEX
7,089
TOTAL POPULATION
4,226
MALE POPULATION
2,863
FEMALE POPULATION
147.61
MALES / 100 FEMALES
67.75
FEMALES / 100 MALES
39.9
MEDIAN AGE
2.7
AVG FAMILY SIZE
2.1
AVG HOUSEHOLD SIZE
2,995
LABOR FORCE [ PEOPLE ]
49.8%
PERCENT IN LABOR FORCE
5.1%
UNEMPLOYMENT RATE
Robinson Zip Codes
Robinson Area Codes
Income in Robinson
Income Overview in Robinson
Per Capita Income in Robinson is $28,249, while median incomes of families and households are $77,750 and $57,500 respectively.
| Characteristic | Number | Measure |
| Per Capita Income | 7,089 | $28,249 |
| Median Family Income | 1,630 | $77,750 |
| Mean Family Income | 1,630 | $93,774 |
| Median Household Income | 2,600 | $57,500 |
| Mean Household Income | 2,600 | $74,893 |
| Income Deficit | 1,630 | $0 |
| Wage / Income Gap (%) | 7,089 | 18.54% |
| Wage / Income Gap ($) | 7,089 | 81.46¢ per $1 |
| Gini / Inequality Index | 7,089 | 0.41 |
Earnings by Sex in Robinson
Average Earnings in Robinson are $41,649, $44,271 for men and $36,063 for women, a difference of 18.5%.
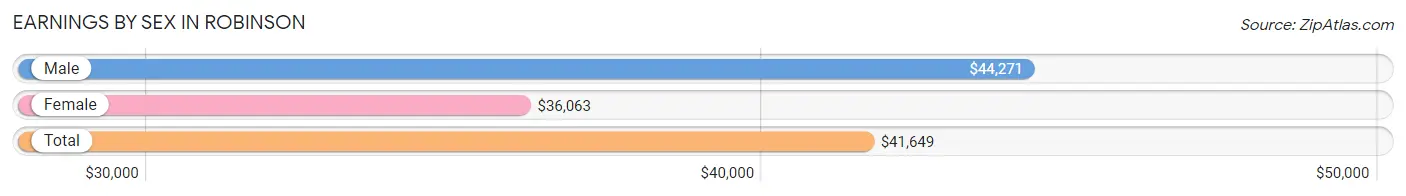
| Sex | Number | Average Earnings |
| Male | 1,736 (52.8%) | $44,271 |
| Female | 1,553 (47.2%) | $36,063 |
| Total | 3,289 (100.0%) | $41,649 |
Earnings by Sex by Income Bracket in Robinson
The most common earnings brackets in Robinson are $100,000+ for men (216 | 12.4%) and $55,000 to $64,999 for women (238 | 15.3%).
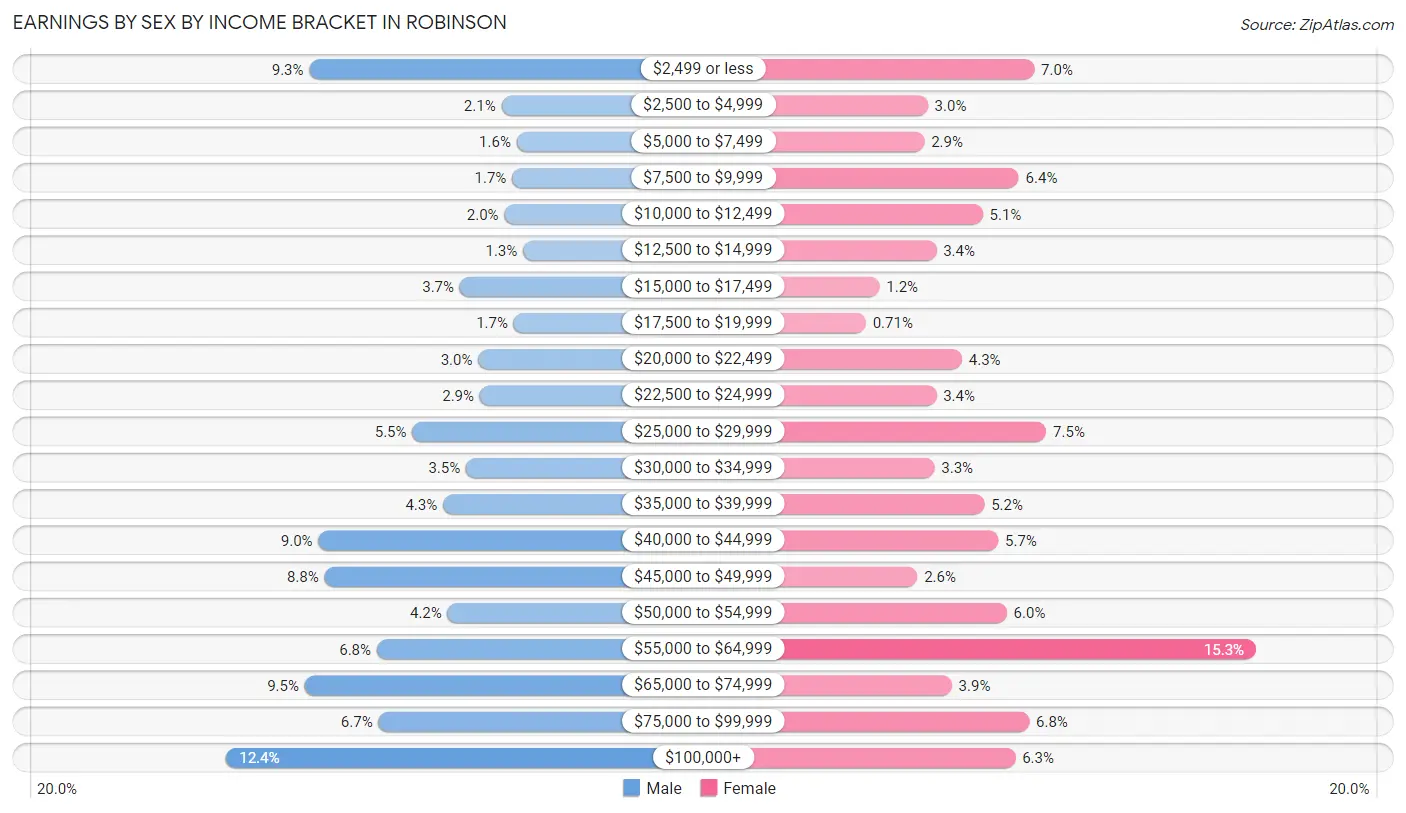
| Income | Male | Female |
| $2,499 or less | 162 (9.3%) | 109 (7.0%) |
| $2,500 to $4,999 | 37 (2.1%) | 47 (3.0%) |
| $5,000 to $7,499 | 27 (1.6%) | 45 (2.9%) |
| $7,500 to $9,999 | 30 (1.7%) | 100 (6.4%) |
| $10,000 to $12,499 | 35 (2.0%) | 79 (5.1%) |
| $12,500 to $14,999 | 23 (1.3%) | 52 (3.4%) |
| $15,000 to $17,499 | 64 (3.7%) | 19 (1.2%) |
| $17,500 to $19,999 | 29 (1.7%) | 11 (0.7%) |
| $20,000 to $22,499 | 52 (3.0%) | 67 (4.3%) |
| $22,500 to $24,999 | 51 (2.9%) | 52 (3.4%) |
| $25,000 to $29,999 | 95 (5.5%) | 116 (7.5%) |
| $30,000 to $34,999 | 60 (3.5%) | 51 (3.3%) |
| $35,000 to $39,999 | 75 (4.3%) | 80 (5.1%) |
| $40,000 to $44,999 | 156 (9.0%) | 88 (5.7%) |
| $45,000 to $49,999 | 152 (8.8%) | 41 (2.6%) |
| $50,000 to $54,999 | 72 (4.2%) | 93 (6.0%) |
| $55,000 to $64,999 | 118 (6.8%) | 238 (15.3%) |
| $65,000 to $74,999 | 165 (9.5%) | 61 (3.9%) |
| $75,000 to $99,999 | 117 (6.7%) | 106 (6.8%) |
| $100,000+ | 216 (12.4%) | 98 (6.3%) |
| Total | 1,736 (100.0%) | 1,553 (100.0%) |
Earnings by Sex by Educational Attainment in Robinson
Average earnings in Robinson are $44,583 for men and $41,875 for women, a difference of 6.1%. Men with an educational attainment of graduate degree enjoy the highest average annual earnings of $86,469, while those with less than high school education earn the least with $15,438. Women with an educational attainment of graduate degree earn the most with the average annual earnings of $60,441, while those with high school diploma education have the smallest earnings of $24,091.
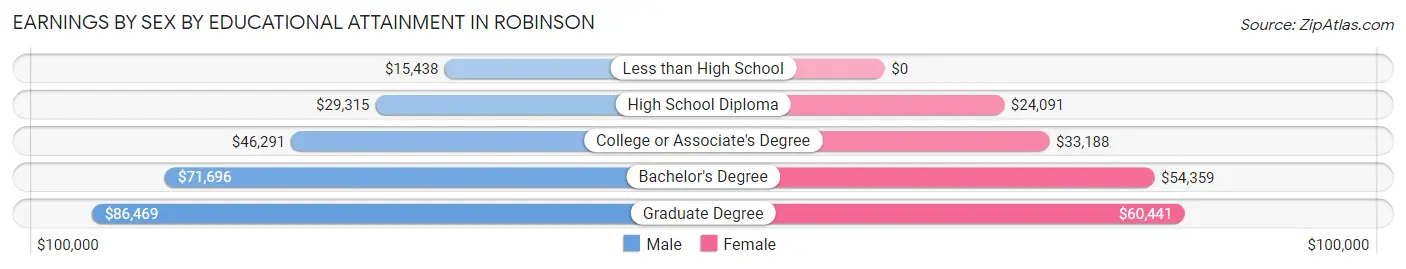
| Educational Attainment | Male Income | Female Income |
| Less than High School | $15,438 | $0 |
| High School Diploma | $29,315 | $24,091 |
| College or Associate's Degree | $46,291 | $33,188 |
| Bachelor's Degree | $71,696 | $54,359 |
| Graduate Degree | $86,469 | $60,441 |
| Total | $44,583 | $41,875 |
Family Income in Robinson
Family Income Brackets in Robinson
According to the Robinson family income data, there are 403 families falling into the $50,000 to $74,999 income range, which is the most common income bracket and makes up 24.7% of all families. Conversely, the $10,000 to $14,999 income bracket is the least frequent group with only 8 families (0.5%) belonging to this category.
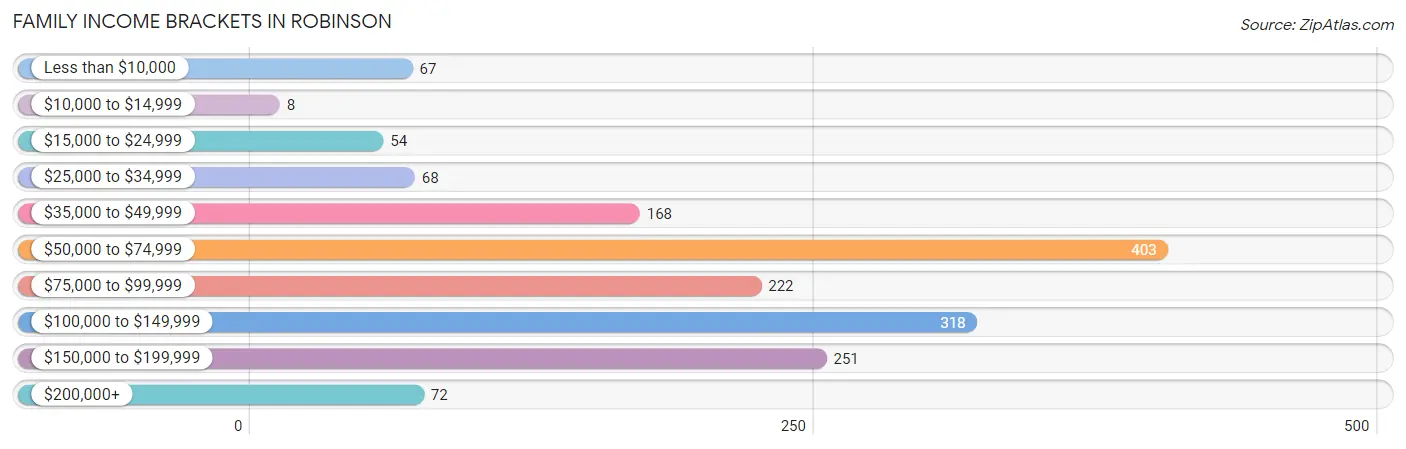
| Income Bracket | # Families | % Families |
| Less than $10,000 | 67 | 4.1% |
| $10,000 to $14,999 | 8 | 0.5% |
| $15,000 to $24,999 | 54 | 3.3% |
| $25,000 to $34,999 | 68 | 4.2% |
| $35,000 to $49,999 | 168 | 10.3% |
| $50,000 to $74,999 | 403 | 24.7% |
| $75,000 to $99,999 | 222 | 13.6% |
| $100,000 to $149,999 | 318 | 19.5% |
| $150,000 to $199,999 | 251 | 15.4% |
| $200,000+ | 72 | 4.4% |
Family Income by Famaliy Size in Robinson
5-person families (88 | 5.4%) account for the highest median family income in Robinson with $160,577 per family, while 5-person families (88 | 5.4%) have the highest median income of $32,115 per family member.
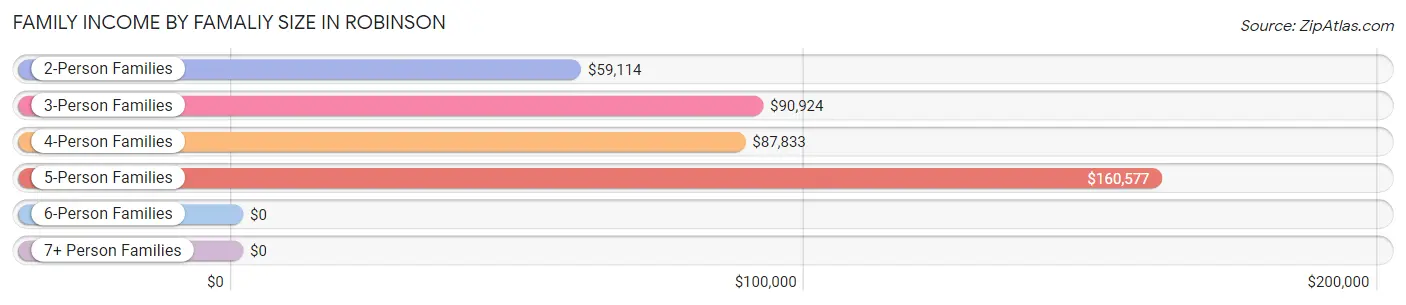
| Income Bracket | # Families | Median Income |
| 2-Person Families | 901 (55.3%) | $59,114 |
| 3-Person Families | 397 (24.4%) | $90,924 |
| 4-Person Families | 214 (13.1%) | $87,833 |
| 5-Person Families | 88 (5.4%) | $160,577 |
| 6-Person Families | 7 (0.4%) | $0 |
| 7+ Person Families | 23 (1.4%) | $0 |
| Total | 1,630 (100.0%) | $77,750 |
Family Income by Number of Earners in Robinson
The median family income in Robinson is $77,750, with families comprising 3+ earners (200) having the highest median family income of $151,143, while families with no earners (255) have the lowest median family income of $52,208, accounting for 12.3% and 15.6% of families, respectively.
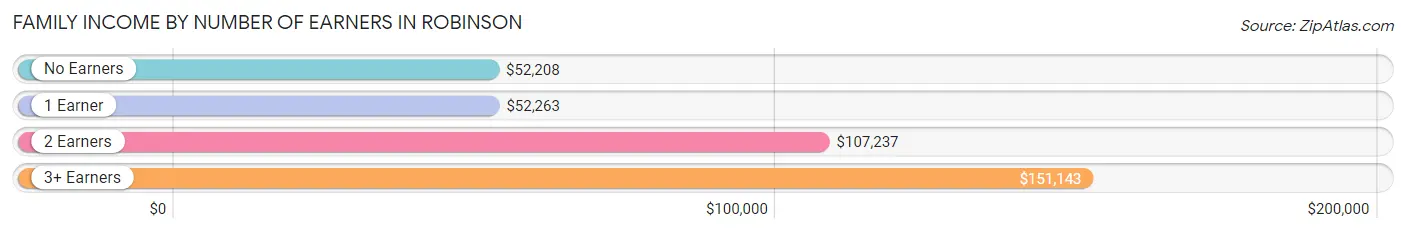
| Number of Earners | # Families | Median Income |
| No Earners | 255 (15.6%) | $52,208 |
| 1 Earner | 513 (31.5%) | $52,263 |
| 2 Earners | 662 (40.6%) | $107,237 |
| 3+ Earners | 200 (12.3%) | $151,143 |
| Total | 1,630 (100.0%) | $77,750 |
Household Income in Robinson
Household Income Brackets in Robinson
With 549 households falling in the category, the $50,000 to $74,999 income range is the most frequent in Robinson, accounting for 21.1% of all households. In contrast, only 73 households (2.8%) fall into the $200,000+ income bracket, making it the least populous group.
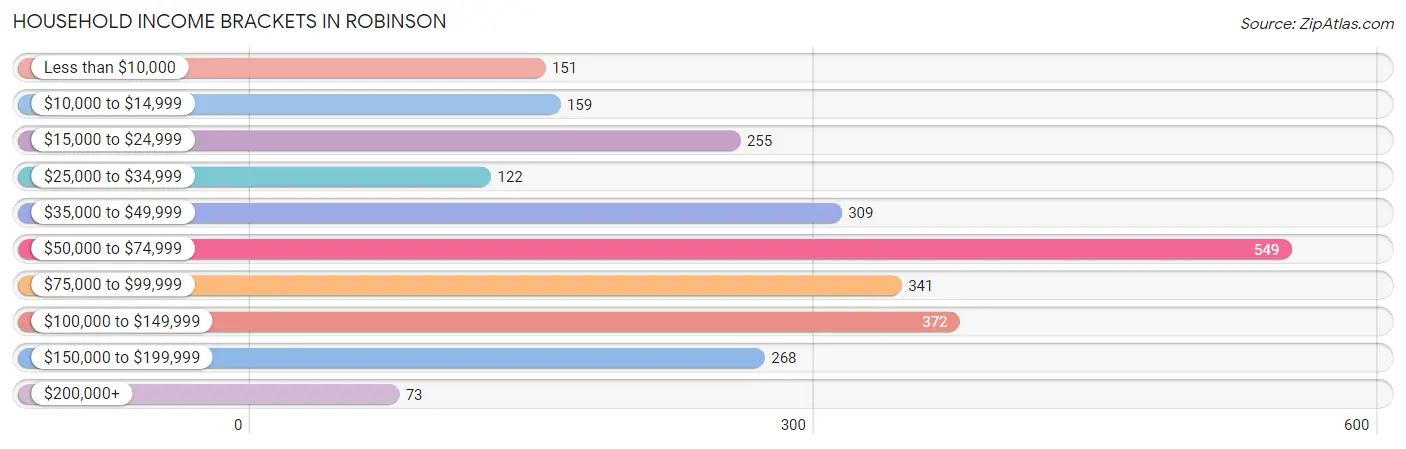
| Income Bracket | # Households | % Households |
| Less than $10,000 | 151 | 5.8% |
| $10,000 to $14,999 | 159 | 6.1% |
| $15,000 to $24,999 | 255 | 9.8% |
| $25,000 to $34,999 | 122 | 4.7% |
| $35,000 to $49,999 | 309 | 11.9% |
| $50,000 to $74,999 | 549 | 21.1% |
| $75,000 to $99,999 | 341 | 13.1% |
| $100,000 to $149,999 | 372 | 14.3% |
| $150,000 to $199,999 | 268 | 10.3% |
| $200,000+ | 73 | 2.8% |
Household Income by Householder Age in Robinson
The median household income in Robinson is $57,500, with the highest median household income of $85,833 found in the 45 to 64 years age bracket for the primary householder. A total of 782 households (30.1%) fall into this category. Meanwhile, the 15 to 24 years age bracket for the primary householder has the lowest median household income of $0, with 128 households (4.9%) in this group.
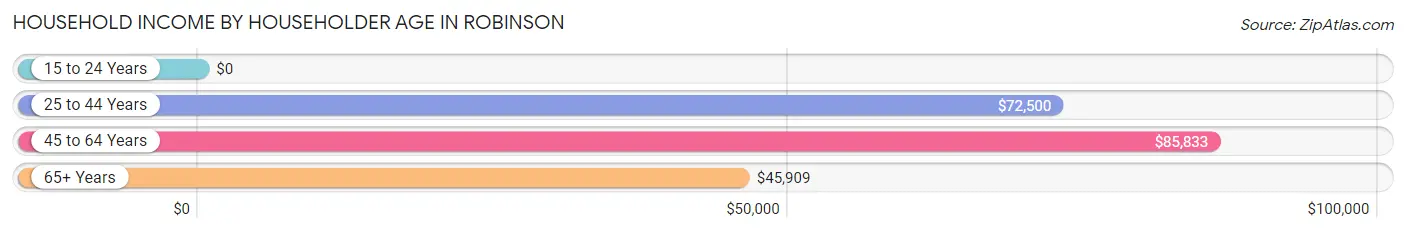
| Income Bracket | # Households | Median Income |
| 15 to 24 Years | 128 (4.9%) | $0 |
| 25 to 44 Years | 842 (32.4%) | $72,500 |
| 45 to 64 Years | 782 (30.1%) | $85,833 |
| 65+ Years | 848 (32.6%) | $45,909 |
| Total | 2,600 (100.0%) | $57,500 |
Poverty in Robinson
Income Below Poverty by Sex and Age in Robinson
With 7.2% poverty level for males and 9.2% for females among the residents of Robinson, 15 year old males and 5 year old females are the most vulnerable to poverty, with 20 males (34.5%) and 15 females (100.0%) in their respective age groups living below the poverty level.
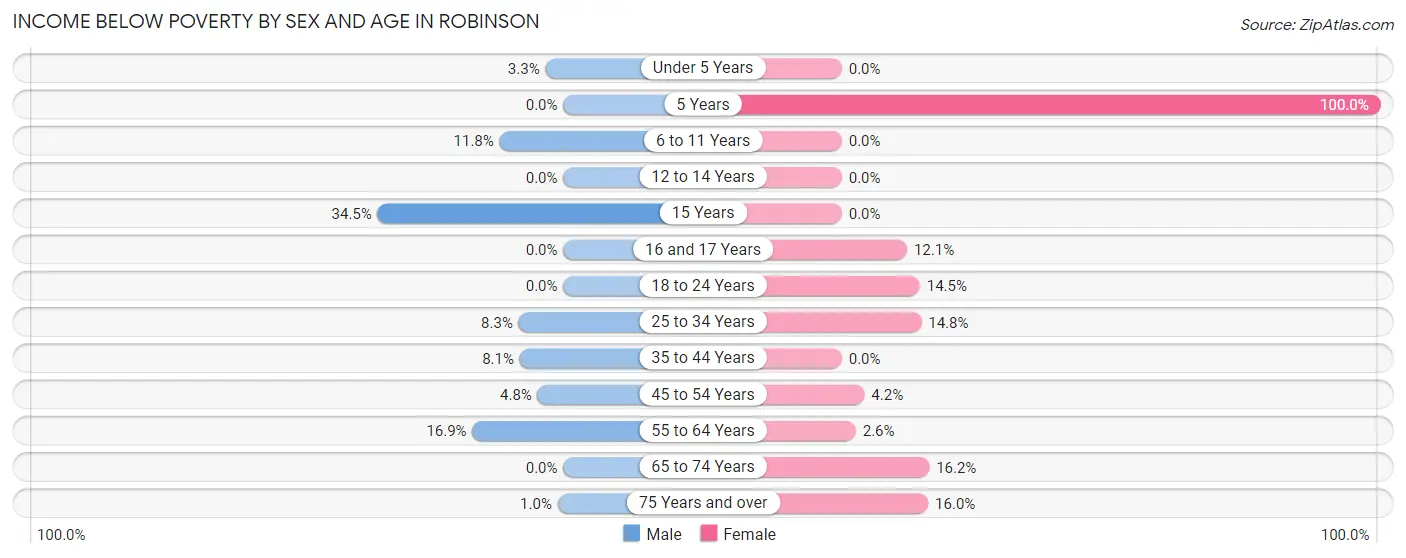
| Age Bracket | Male | Female |
| Under 5 Years | 5 (3.3%) | 0 (0.0%) |
| 5 Years | 0 (0.0%) | 15 (100.0%) |
| 6 to 11 Years | 40 (11.8%) | 0 (0.0%) |
| 12 to 14 Years | 0 (0.0%) | 0 (0.0%) |
| 15 Years | 20 (34.5%) | 0 (0.0%) |
| 16 and 17 Years | 0 (0.0%) | 19 (12.1%) |
| 18 to 24 Years | 0 (0.0%) | 21 (14.5%) |
| 25 to 34 Years | 39 (8.3%) | 58 (14.8%) |
| 35 to 44 Years | 21 (8.1%) | 0 (0.0%) |
| 45 to 54 Years | 19 (4.8%) | 17 (4.2%) |
| 55 to 64 Years | 56 (16.9%) | 7 (2.6%) |
| 65 to 74 Years | 0 (0.0%) | 72 (16.2%) |
| 75 Years and over | 2 (1.0%) | 46 (16.0%) |
| Total | 202 (7.2%) | 255 (9.2%) |
Income Above Poverty by Sex and Age in Robinson
According to the poverty statistics in Robinson, males aged 5 years and females aged under 5 years are the age groups that are most secure financially, with 100.0% of males and 100.0% of females in these age groups living above the poverty line.
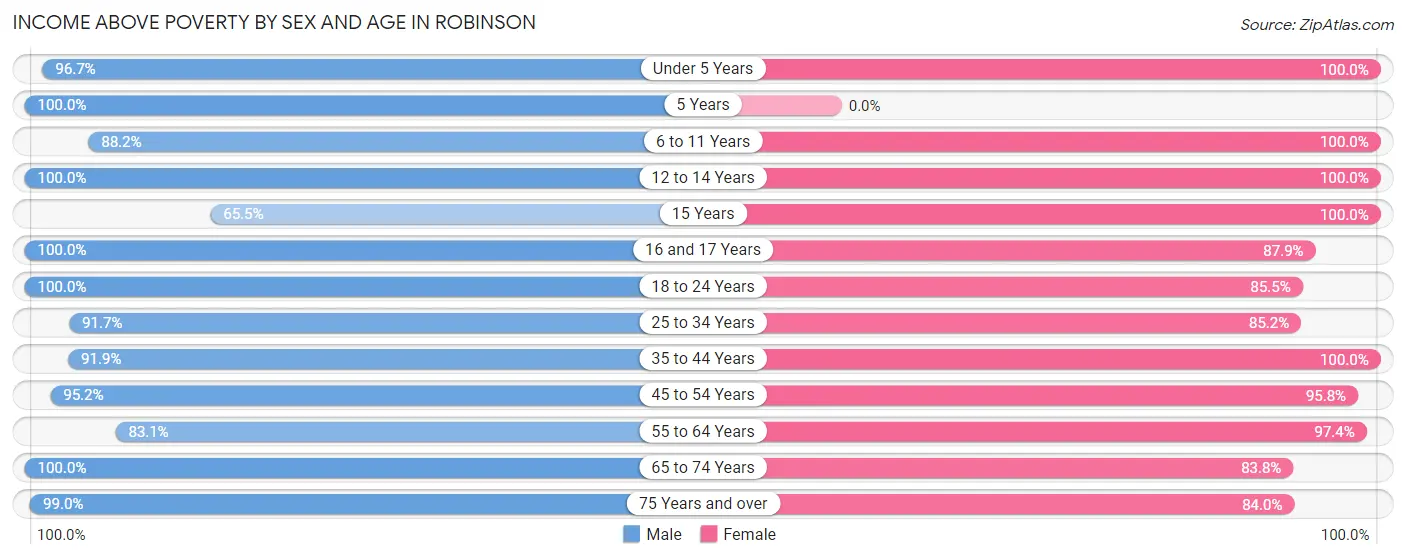
| Age Bracket | Male | Female |
| Under 5 Years | 146 (96.7%) | 130 (100.0%) |
| 5 Years | 26 (100.0%) | 0 (0.0%) |
| 6 to 11 Years | 298 (88.2%) | 153 (100.0%) |
| 12 to 14 Years | 129 (100.0%) | 36 (100.0%) |
| 15 Years | 38 (65.5%) | 15 (100.0%) |
| 16 and 17 Years | 45 (100.0%) | 138 (87.9%) |
| 18 to 24 Years | 195 (100.0%) | 124 (85.5%) |
| 25 to 34 Years | 432 (91.7%) | 335 (85.2%) |
| 35 to 44 Years | 239 (91.9%) | 315 (100.0%) |
| 45 to 54 Years | 379 (95.2%) | 388 (95.8%) |
| 55 to 64 Years | 276 (83.1%) | 262 (97.4%) |
| 65 to 74 Years | 209 (100.0%) | 372 (83.8%) |
| 75 Years and over | 191 (99.0%) | 241 (84.0%) |
| Total | 2,603 (92.8%) | 2,509 (90.8%) |
Income Below Poverty Among Married-Couple Families in Robinson
The poverty statistics for married-couple families in Robinson show that 0.7% or 8 of the total 1,165 families live below the poverty line. Families with no children have the highest poverty rate of 1.1%, comprising of 8 families. On the other hand, families with 1 or 2 children have the lowest poverty rate of 0.0%, which includes 0 families.
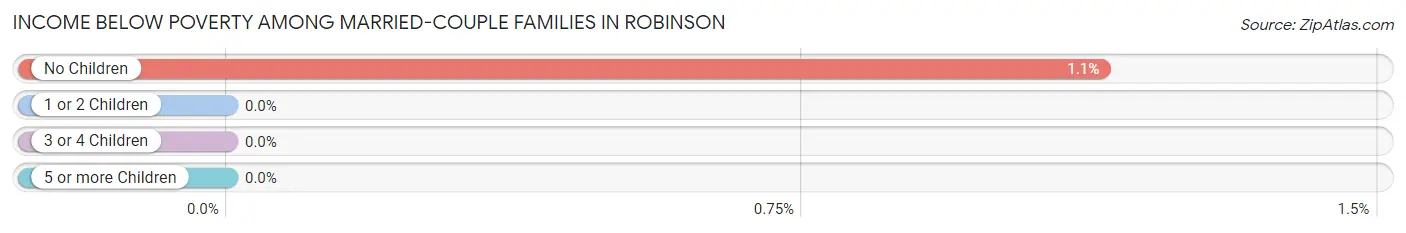
| Children | Above Poverty | Below Poverty |
| No Children | 694 (98.9%) | 8 (1.1%) |
| 1 or 2 Children | 397 (100.0%) | 0 (0.0%) |
| 3 or 4 Children | 43 (100.0%) | 0 (0.0%) |
| 5 or more Children | 23 (100.0%) | 0 (0.0%) |
| Total | 1,157 (99.3%) | 8 (0.7%) |
Income Below Poverty Among Single-Parent Households in Robinson
According to the poverty data in Robinson, 26.2% or 39 single-father households and 18.7% or 59 single-mother households are living below the poverty line. Among single-father households, those with 1 or 2 children have the highest poverty rate, with 39 households (26.2%) experiencing poverty. Likewise, among single-mother households, those with 1 or 2 children have the highest poverty rate, with 51 households (20.9%) falling below the poverty line.
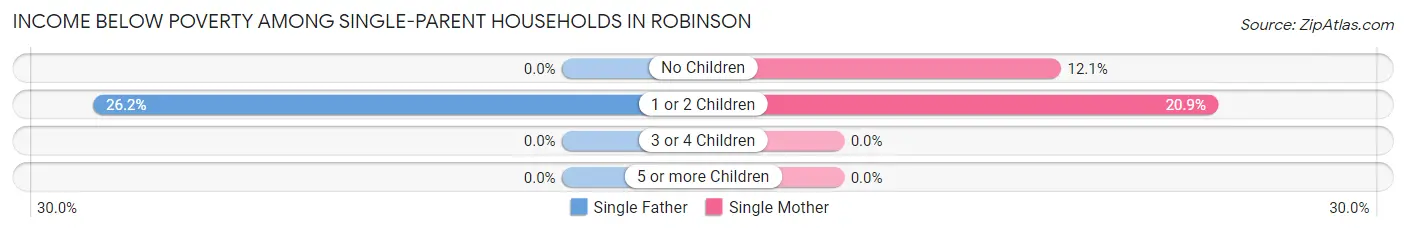
| Children | Single Father | Single Mother |
| No Children | 0 (0.0%) | 8 (12.1%) |
| 1 or 2 Children | 39 (26.2%) | 51 (20.9%) |
| 3 or 4 Children | 0 (0.0%) | 0 (0.0%) |
| 5 or more Children | 0 (0.0%) | 0 (0.0%) |
| Total | 39 (26.2%) | 59 (18.7%) |
Income Below Poverty Among Married-Couple vs Single-Parent Households in Robinson
The poverty data for Robinson shows that 8 of the married-couple family households (0.7%) and 98 of the single-parent households (21.1%) are living below the poverty level. Within the married-couple family households, those with no children have the highest poverty rate, with 8 households (1.1%) falling below the poverty line. Among the single-parent households, those with 1 or 2 children have the highest poverty rate, with 90 household (22.9%) living below poverty.
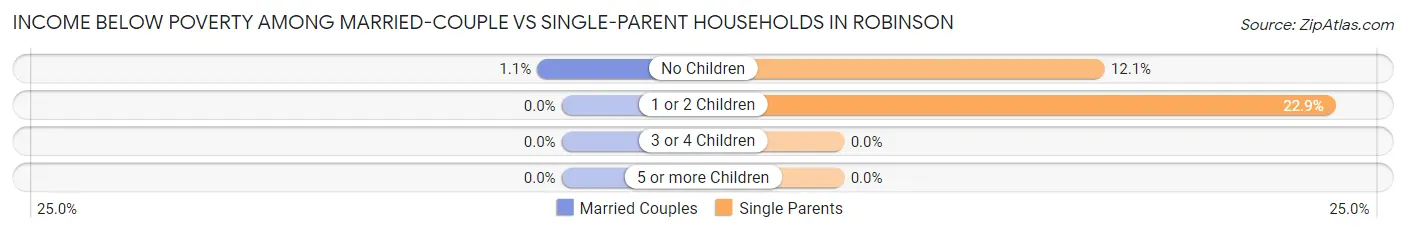
| Children | Married-Couple Families | Single-Parent Households |
| No Children | 8 (1.1%) | 8 (12.1%) |
| 1 or 2 Children | 0 (0.0%) | 90 (22.9%) |
| 3 or 4 Children | 0 (0.0%) | 0 (0.0%) |
| 5 or more Children | 0 (0.0%) | 0 (0.0%) |
| Total | 8 (0.7%) | 98 (21.1%) |
Race in Robinson
The most populous races in Robinson are White / Caucasian (6,075 | 85.7%), Black / African American (805 | 11.4%), and Hispanic or Latino (349 | 4.9%).
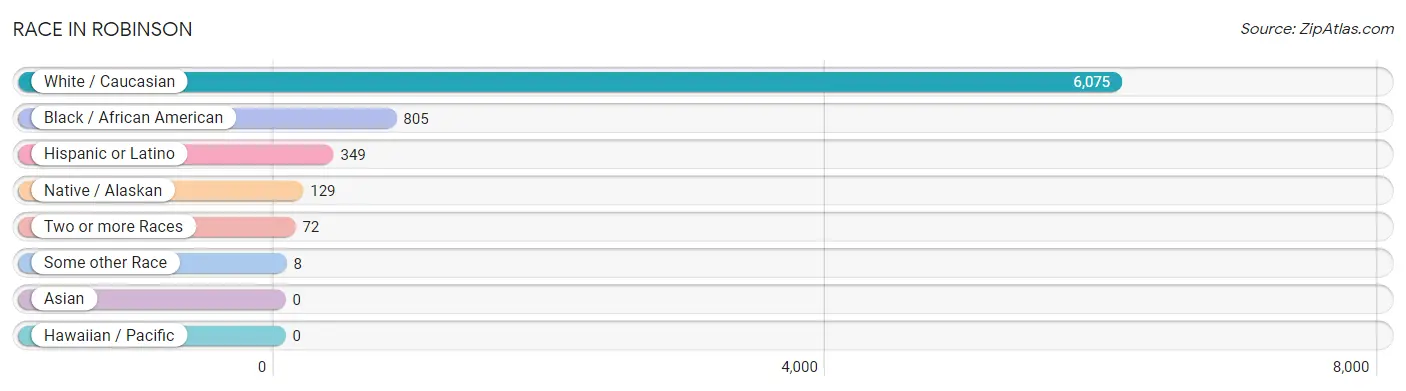
| Race | # Population | % Population |
| Asian | 0 | 0.0% |
| Black / African American | 805 | 11.4% |
| Hawaiian / Pacific | 0 | 0.0% |
| Hispanic or Latino | 349 | 4.9% |
| Native / Alaskan | 129 | 1.8% |
| White / Caucasian | 6,075 | 85.7% |
| Two or more Races | 72 | 1.0% |
| Some other Race | 8 | 0.1% |
| Total | 7,089 | 100.0% |
Ancestry in Robinson
The most populous ancestries reported in Robinson are German (1,529 | 21.6%), Irish (1,092 | 15.4%), English (727 | 10.3%), American (381 | 5.4%), and Mexican (286 | 4.0%), together accounting for 56.6% of all Robinson residents.
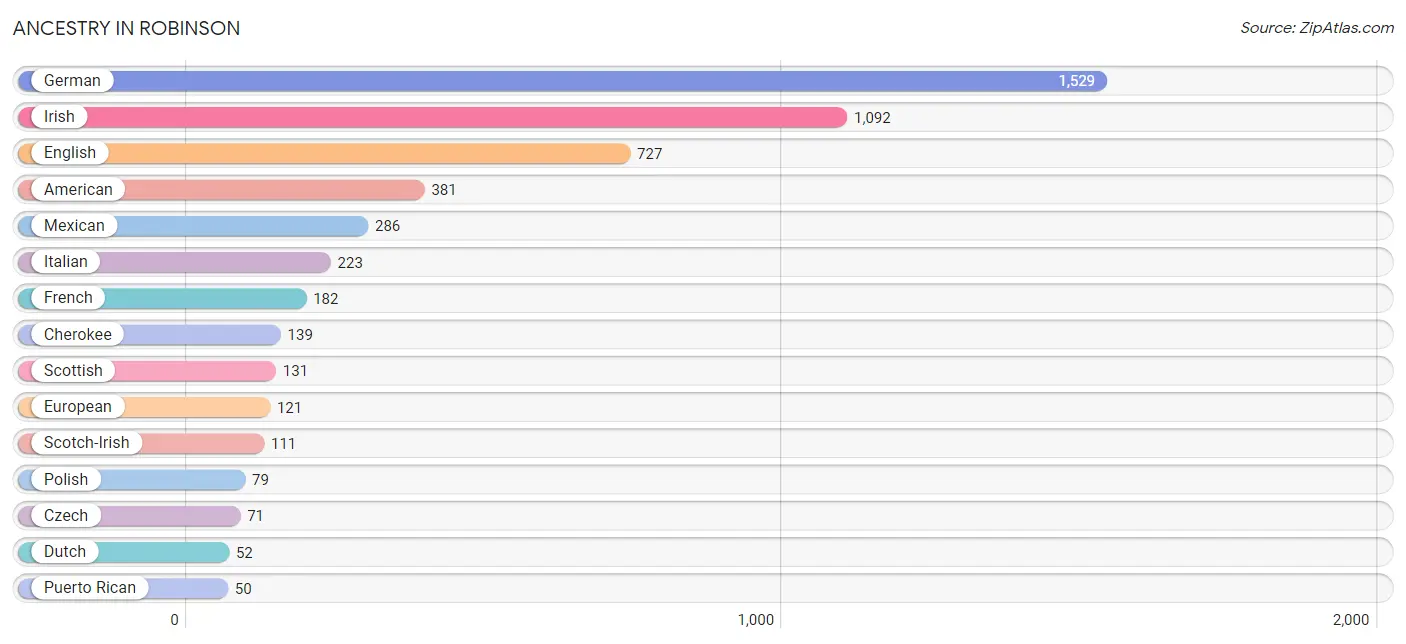
| Ancestry | # Population | % Population |
| American | 381 | 5.4% |
| Blackfeet | 6 | 0.1% |
| Brazilian | 18 | 0.3% |
| British | 47 | 0.7% |
| Canadian | 11 | 0.2% |
| Central American | 7 | 0.1% |
| Cherokee | 139 | 2.0% |
| Croatian | 30 | 0.4% |
| Czech | 71 | 1.0% |
| Czechoslovakian | 8 | 0.1% |
| Dutch | 52 | 0.7% |
| English | 727 | 10.3% |
| European | 121 | 1.7% |
| French | 182 | 2.6% |
| French Canadian | 7 | 0.1% |
| German | 1,529 | 21.6% |
| Greek | 12 | 0.2% |
| Guatemalan | 7 | 0.1% |
| Hungarian | 6 | 0.1% |
| Irish | 1,092 | 15.4% |
| Italian | 223 | 3.2% |
| Korean | 27 | 0.4% |
| Lithuanian | 9 | 0.1% |
| Mexican | 286 | 4.0% |
| Norwegian | 35 | 0.5% |
| Polish | 79 | 1.1% |
| Puerto Rican | 50 | 0.7% |
| Russian | 3 | 0.0% |
| Scandinavian | 14 | 0.2% |
| Scotch-Irish | 111 | 1.6% |
| Scottish | 131 | 1.8% |
| Swedish | 16 | 0.2% |
| Swiss | 9 | 0.1% |
| Turkish | 5 | 0.1% |
| Ukrainian | 12 | 0.2% |
| Welsh | 48 | 0.7% | View All 36 Rows |
Immigrants in Robinson
The most numerous immigrant groups reported in Robinson came from Latin America (84 | 1.2%), Central America (63 | 0.9%), Mexico (40 | 0.6%), Asia (27 | 0.4%), and Philippines (27 | 0.4%), together accounting for 3.4% of all Robinson residents.
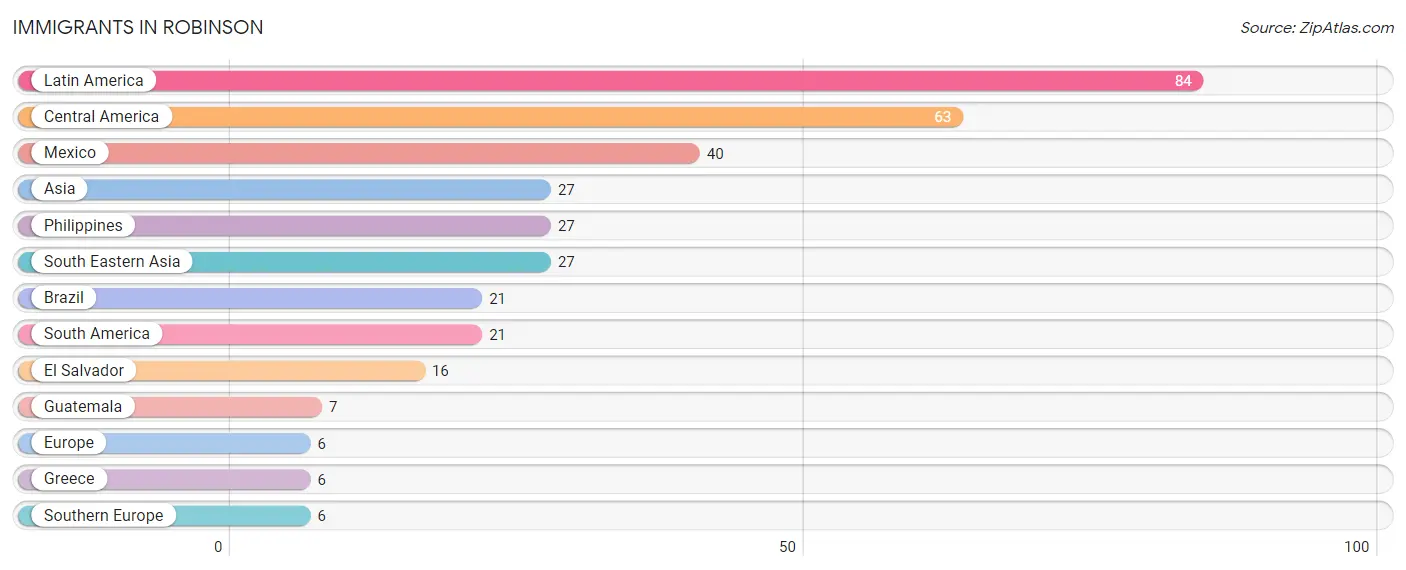
| Immigration Origin | # Population | % Population |
| Asia | 27 | 0.4% |
| Brazil | 21 | 0.3% |
| Central America | 63 | 0.9% |
| El Salvador | 16 | 0.2% |
| Europe | 6 | 0.1% |
| Greece | 6 | 0.1% |
| Guatemala | 7 | 0.1% |
| Latin America | 84 | 1.2% |
| Mexico | 40 | 0.6% |
| Philippines | 27 | 0.4% |
| South America | 21 | 0.3% |
| South Eastern Asia | 27 | 0.4% |
| Southern Europe | 6 | 0.1% | View All 13 Rows |
Sex and Age in Robinson
Sex and Age in Robinson
The most populous age groups in Robinson are 30 to 34 Years (445 | 10.5%) for men and 30 to 34 Years (240 | 8.4%) for women.
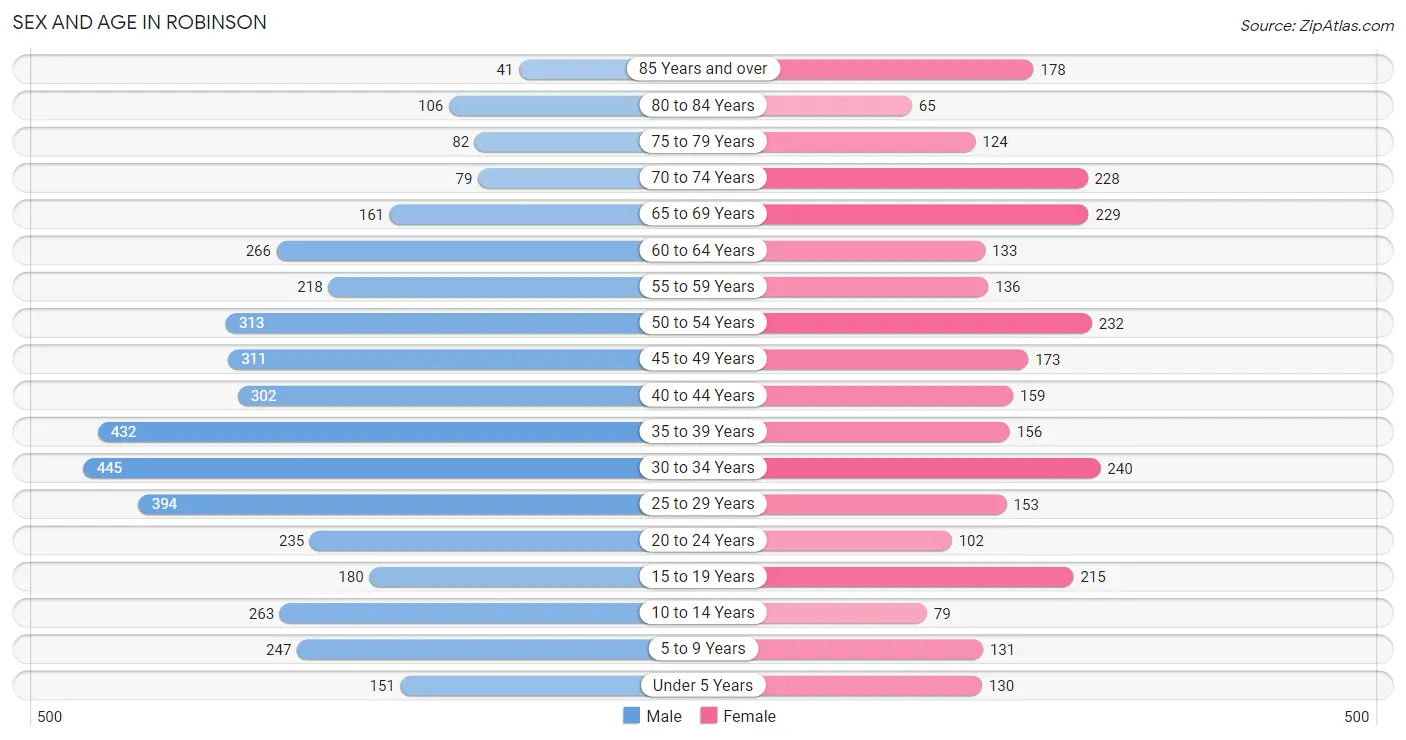
| Age Bracket | Male | Female |
| Under 5 Years | 151 (3.6%) | 130 (4.5%) |
| 5 to 9 Years | 247 (5.8%) | 131 (4.6%) |
| 10 to 14 Years | 263 (6.2%) | 79 (2.8%) |
| 15 to 19 Years | 180 (4.3%) | 215 (7.5%) |
| 20 to 24 Years | 235 (5.6%) | 102 (3.6%) |
| 25 to 29 Years | 394 (9.3%) | 153 (5.3%) |
| 30 to 34 Years | 445 (10.5%) | 240 (8.4%) |
| 35 to 39 Years | 432 (10.2%) | 156 (5.4%) |
| 40 to 44 Years | 302 (7.1%) | 159 (5.6%) |
| 45 to 49 Years | 311 (7.4%) | 173 (6.0%) |
| 50 to 54 Years | 313 (7.4%) | 232 (8.1%) |
| 55 to 59 Years | 218 (5.2%) | 136 (4.8%) |
| 60 to 64 Years | 266 (6.3%) | 133 (4.6%) |
| 65 to 69 Years | 161 (3.8%) | 229 (8.0%) |
| 70 to 74 Years | 79 (1.9%) | 228 (8.0%) |
| 75 to 79 Years | 82 (1.9%) | 124 (4.3%) |
| 80 to 84 Years | 106 (2.5%) | 65 (2.3%) |
| 85 Years and over | 41 (1.0%) | 178 (6.2%) |
| Total | 4,226 (100.0%) | 2,863 (100.0%) |
Families and Households in Robinson
Median Family Size in Robinson
The median family size in Robinson is 2.69 persons per family, with married-couple families (1,165 | 71.5%) accounting for the largest median family size of 2.92 persons per family. On the other hand, single male/father families (149 | 9.1%) represent the smallest median family size with 1.73 persons per family.
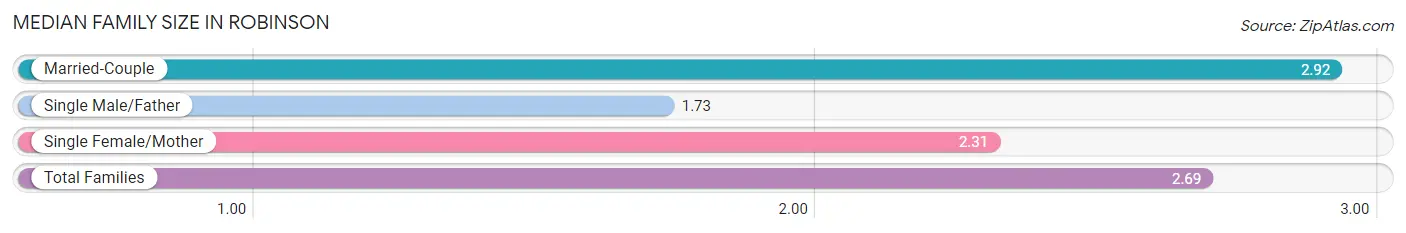
| Family Type | # Families | Family Size |
| Married-Couple | 1,165 (71.5%) | 2.92 |
| Single Male/Father | 149 (9.1%) | 1.73 |
| Single Female/Mother | 316 (19.4%) | 2.31 |
| Total Families | 1,630 (100.0%) | 2.69 |
Median Household Size in Robinson
The median household size in Robinson is 2.15 persons per household, with married-couple households (1,165 | 44.8%) accounting for the largest median household size of 2.92 persons per household. non-family households (970 | 37.3%) represent the smallest median household size with 1.12 persons per household.
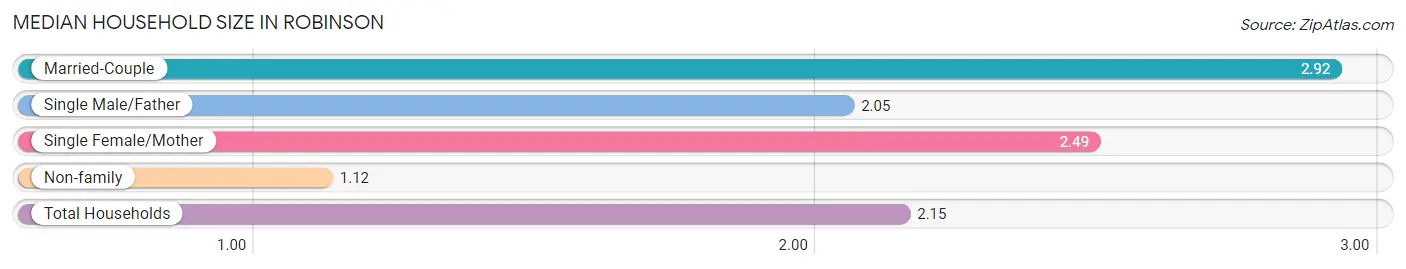
| Household Type | # Households | Household Size |
| Married-Couple | 1,165 (44.8%) | 2.92 |
| Single Male/Father | 149 (5.7%) | 2.05 |
| Single Female/Mother | 316 (12.1%) | 2.49 |
| Non-family | 970 (37.3%) | 1.12 |
| Total Households | 2,600 (100.0%) | 2.15 |
Household Size by Marriage Status in Robinson
Out of a total of 2,600 households in Robinson, 1,630 (62.7%) are family households, while 970 (37.3%) are nonfamily households. The most numerous type of family households are 2-person households, comprising 808, and the most common type of nonfamily households are 1-person households, comprising 899.
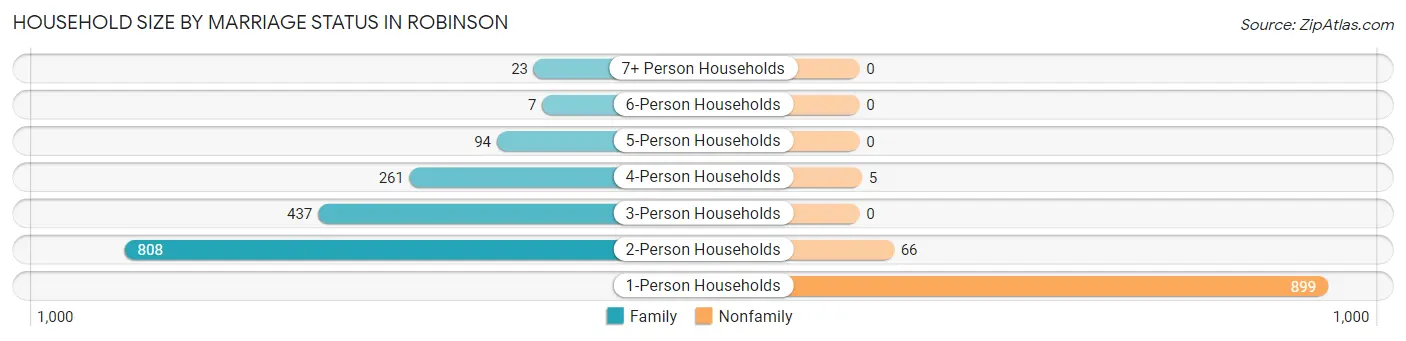
| Household Size | Family Households | Nonfamily Households |
| 1-Person Households | - | 899 (34.6%) |
| 2-Person Households | 808 (31.1%) | 66 (2.5%) |
| 3-Person Households | 437 (16.8%) | 0 (0.0%) |
| 4-Person Households | 261 (10.0%) | 5 (0.2%) |
| 5-Person Households | 94 (3.6%) | 0 (0.0%) |
| 6-Person Households | 7 (0.3%) | 0 (0.0%) |
| 7+ Person Households | 23 (0.9%) | 0 (0.0%) |
| Total | 1,630 (62.7%) | 970 (37.3%) |
Female Fertility in Robinson
Fertility by Age in Robinson
Average fertility rate in Robinson is 50.0 births per 1,000 women. Women in the age bracket of 20 to 34 years have the highest fertility rate with 129.0 births per 1,000 women. Women in the age bracket of 20 to 34 years acount for 100.0% of all women with births.
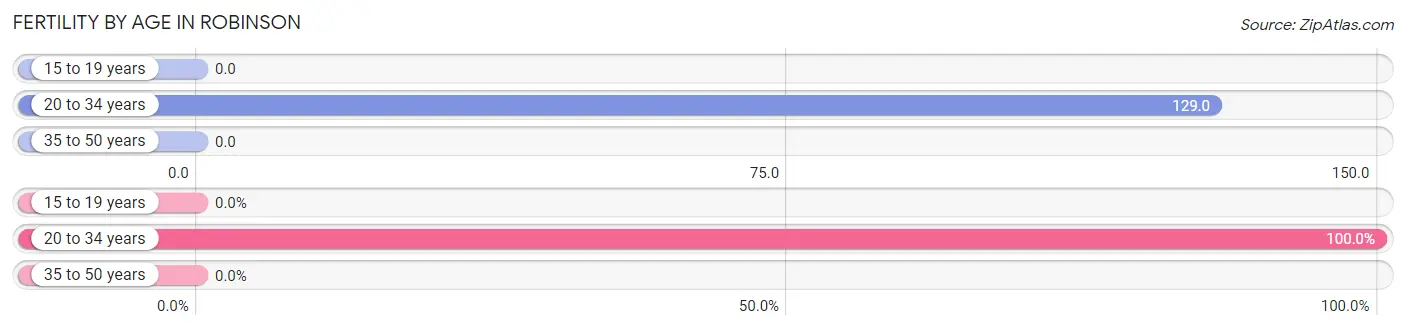
| Age Bracket | Women with Births | Births / 1,000 Women |
| 15 to 19 years | 0 (0.0%) | 0.0 |
| 20 to 34 years | 64 (100.0%) | 129.0 |
| 35 to 50 years | 0 (0.0%) | 0.0 |
| Total | 64 (100.0%) | 50.0 |
Fertility by Age by Marriage Status in Robinson
93.8% of women with births (64) in Robinson are married. The highest percentage of unmarried women with births falls into 20 to 34 years age bracket with 6.2% of them unmarried at the time of birth, while the lowest percentage of unmarried women with births belong to 20 to 34 years age bracket with 6.2% of them unmarried.
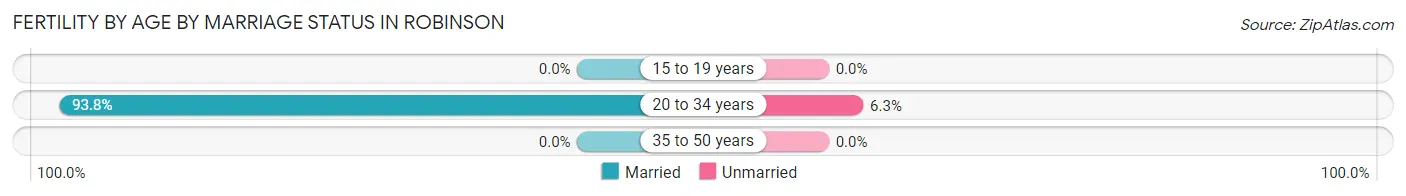
| Age Bracket | Married | Unmarried |
| 15 to 19 years | 0 (0.0%) | 0 (0.0%) |
| 20 to 34 years | 60 (93.8%) | 4 (6.2%) |
| 35 to 50 years | 0 (0.0%) | 0 (0.0%) |
| Total | 60 (93.8%) | 4 (6.2%) |
Fertility by Education in Robinson
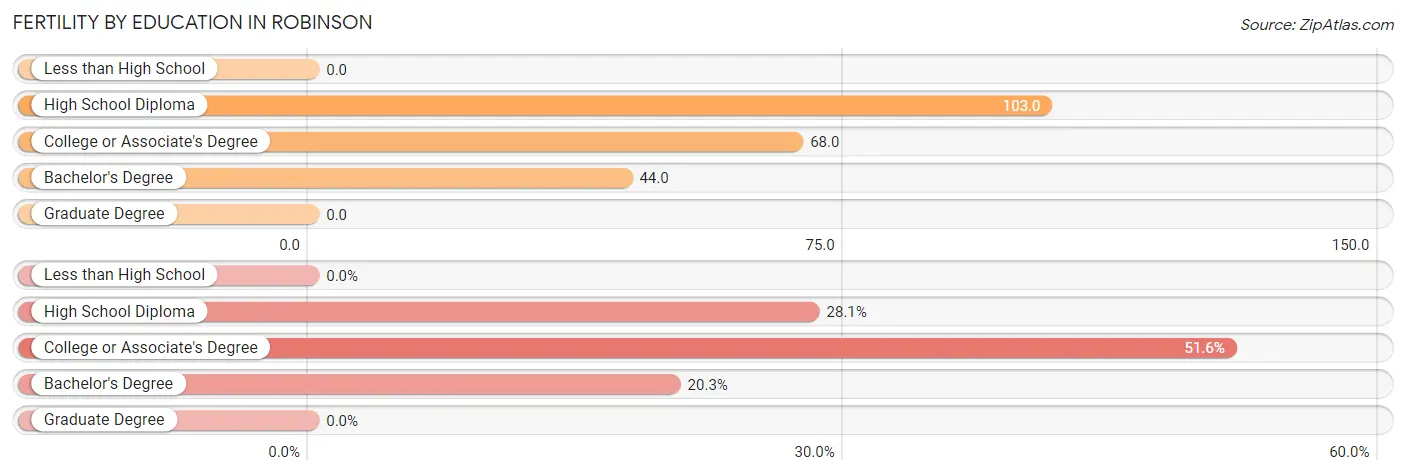
| Educational Attainment | Women with Births | Births / 1,000 Women |
| Less than High School | 0 (0.0%) | 0.0 |
| High School Diploma | 18 (28.1%) | 103.0 |
| College or Associate's Degree | 33 (51.6%) | 68.0 |
| Bachelor's Degree | 13 (20.3%) | 44.0 |
| Graduate Degree | 0 (0.0%) | 0.0 |
| Total | 64 (100.0%) | 50.0 |
Fertility by Education by Marriage Status in Robinson
6.2% of women with births in Robinson are unmarried. Women with the educational attainment of high school diploma are most likely to be married with 100.0% of them married at childbirth, while women with the educational attainment of college or associate's degree are least likely to be married with 12.1% of them unmarried at childbirth.
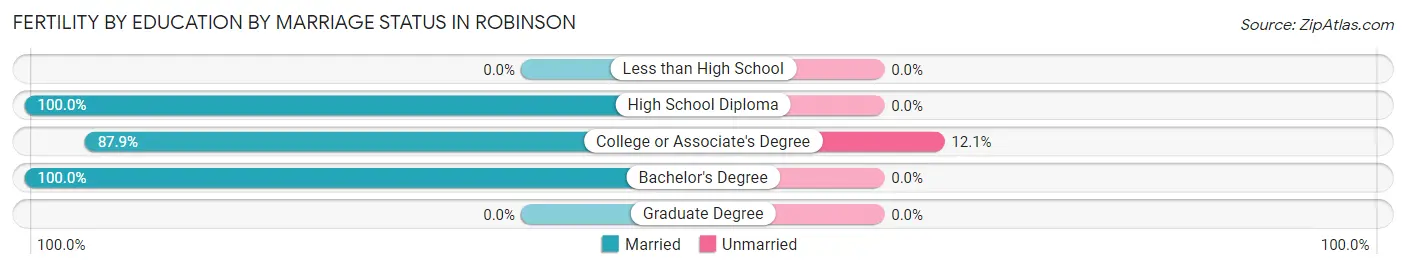
| Educational Attainment | Married | Unmarried |
| Less than High School | 0 (0.0%) | 0 (0.0%) |
| High School Diploma | 18 (100.0%) | 0 (0.0%) |
| College or Associate's Degree | 29 (87.9%) | 4 (12.1%) |
| Bachelor's Degree | 13 (100.0%) | 0 (0.0%) |
| Graduate Degree | 0 (0.0%) | 0 (0.0%) |
| Total | 60 (93.8%) | 4 (6.2%) |
Employment Characteristics in Robinson
Employment by Class of Employer in Robinson
Among the 2,820 employed individuals in Robinson, private company employees (1,795 | 63.6%), not-for-profit organizations (387 | 13.7%), and state government employees (256 | 9.1%) make up the most common classes of employment.
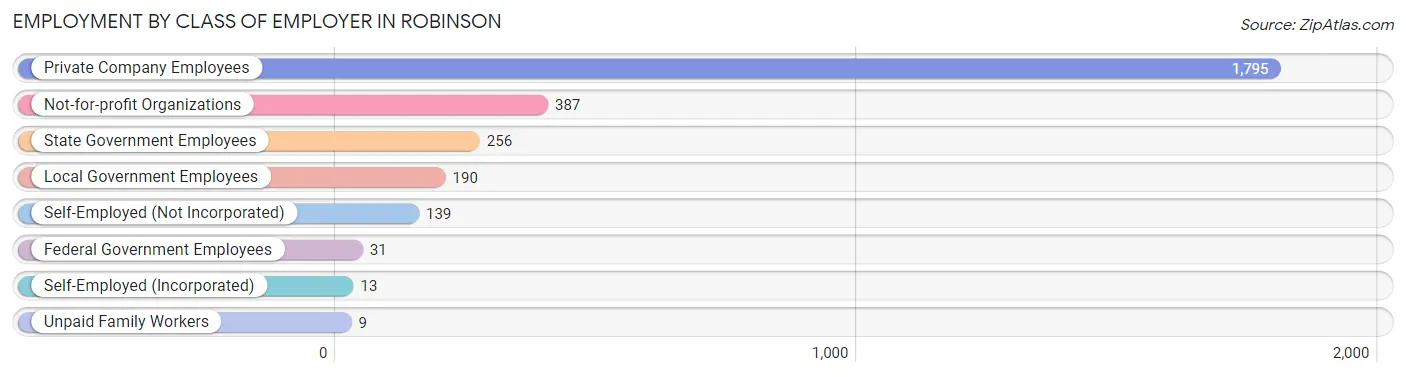
| Employer Class | # Employees | % Employees |
| Private Company Employees | 1,795 | 63.6% |
| Self-Employed (Incorporated) | 13 | 0.5% |
| Self-Employed (Not Incorporated) | 139 | 4.9% |
| Not-for-profit Organizations | 387 | 13.7% |
| Local Government Employees | 190 | 6.7% |
| State Government Employees | 256 | 9.1% |
| Federal Government Employees | 31 | 1.1% |
| Unpaid Family Workers | 9 | 0.3% |
| Total | 2,820 | 100.0% |
Employment Status by Age in Robinson
According to the labor force statistics for Robinson, out of the total population over 16 years of age (6,015), 49.8% or 2,995 individuals are in the labor force, with 5.1% or 153 of them unemployed. The age group with the highest labor force participation rate is 45 to 54 years, with 75.2% or 774 individuals in the labor force. Within the labor force, the 20 to 24 years age range has the highest percentage of unemployed individuals, with 25.8% or 42 of them being unemployed.
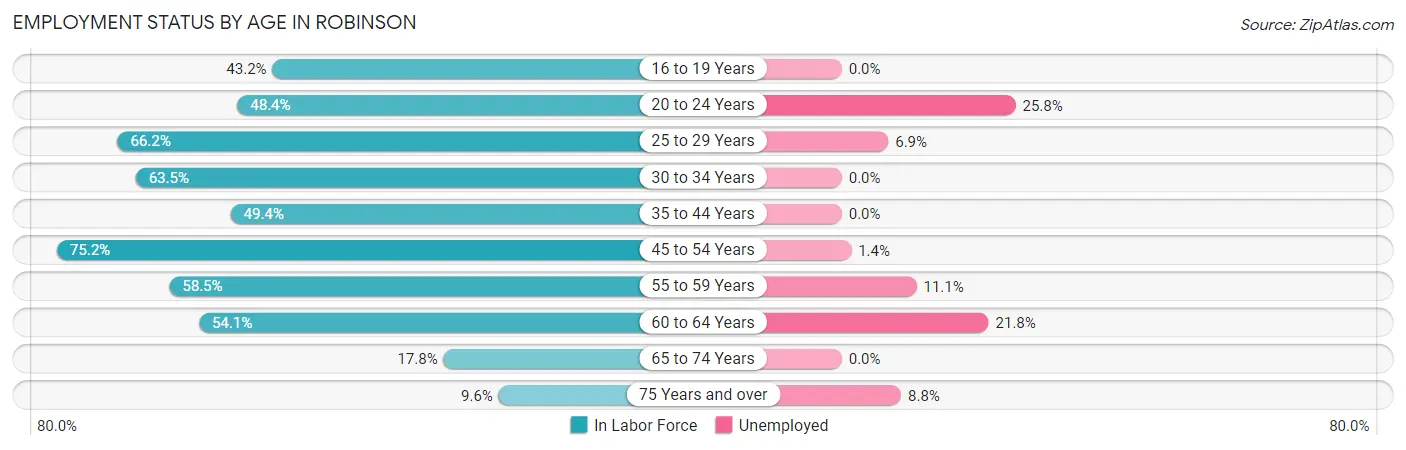
| Age Bracket | In Labor Force | Unemployed |
| 16 to 19 Years | 139 (43.2%) | 0 (0.0%) |
| 20 to 24 Years | 163 (48.4%) | 42 (25.8%) |
| 25 to 29 Years | 362 (66.2%) | 25 (6.9%) |
| 30 to 34 Years | 435 (63.5%) | 0 (0.0%) |
| 35 to 44 Years | 518 (49.4%) | 0 (0.0%) |
| 45 to 54 Years | 774 (75.2%) | 11 (1.4%) |
| 55 to 59 Years | 207 (58.5%) | 23 (11.1%) |
| 60 to 64 Years | 216 (54.1%) | 47 (21.8%) |
| 65 to 74 Years | 124 (17.8%) | 0 (0.0%) |
| 75 Years and over | 57 (9.6%) | 5 (8.8%) |
| Total | 2,995 (49.8%) | 153 (5.1%) |
Employment Status by Educational Attainment in Robinson
According to labor force statistics for Robinson, 61.8% of individuals (2,511) out of the total population between 25 and 64 years of age (4,063) are in the labor force, with 4.2% or 105 of them being unemployed. The group with the highest labor force participation rate are those with the educational attainment of bachelor's degree or higher, with 92.1% or 721 individuals in the labor force. Within the labor force, individuals with less than high school education have the highest percentage of unemployment, with 19.3% or 47 of them being unemployed.
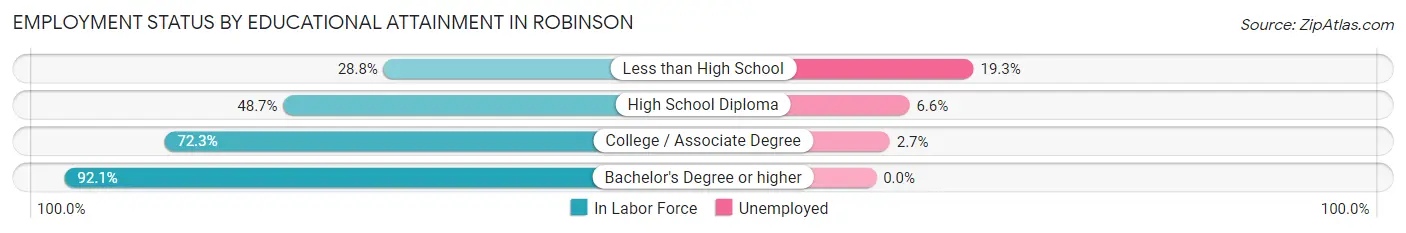
| Educational Attainment | In Labor Force | Unemployed |
| Less than High School | 244 (28.8%) | 163 (19.3%) |
| High School Diploma | 437 (48.7%) | 59 (6.6%) |
| College / Associate Degree | 1,110 (72.3%) | 41 (2.7%) |
| Bachelor's Degree or higher | 721 (92.1%) | 0 (0.0%) |
| Total | 2,511 (61.8%) | 171 (4.2%) |
Employment Occupations by Sex in Robinson
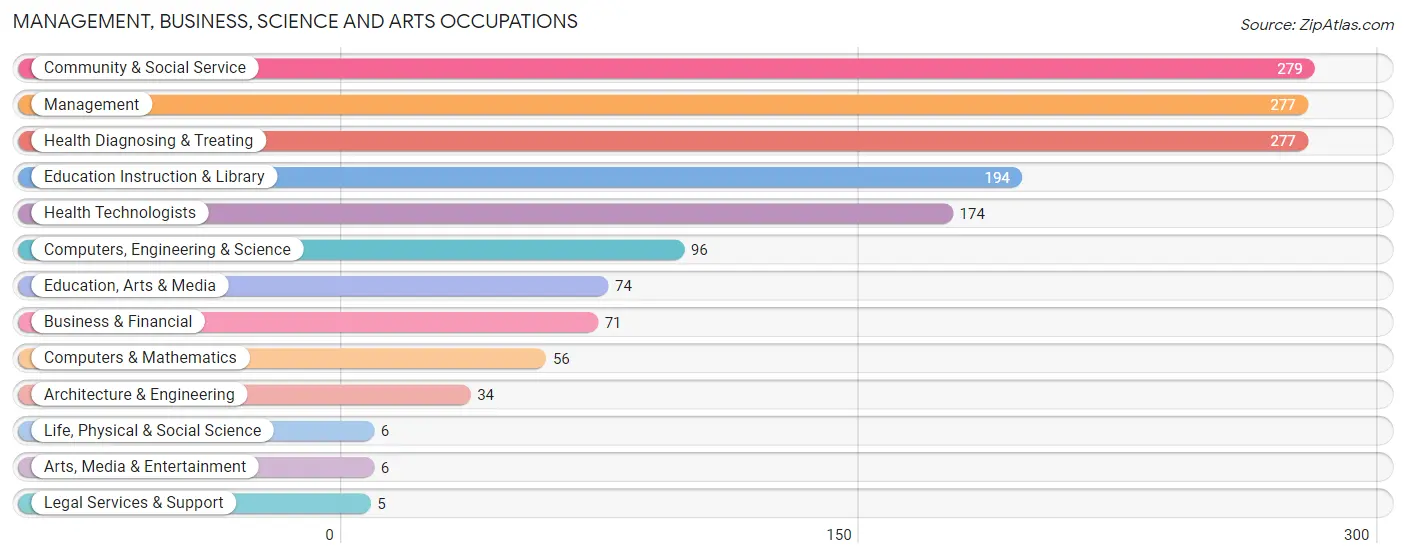
Management, Business, Science and Arts Occupations
The most common Management, Business, Science and Arts occupations in Robinson are Community & Social Service (279 | 9.8%), Management (277 | 9.8%), Health Diagnosing & Treating (277 | 9.8%), Education Instruction & Library (194 | 6.8%), and Health Technologists (174 | 6.1%).
Management, Business, Science and Arts Occupations by Sex
Within the Management, Business, Science and Arts occupations in Robinson, the most male-oriented occupations are Legal Services & Support (100.0%), Arts, Media & Entertainment (100.0%), and Architecture & Engineering (79.4%), while the most female-oriented occupations are Life, Physical & Social Science (100.0%), Health Technologists (86.2%), and Health Diagnosing & Treating (84.5%).
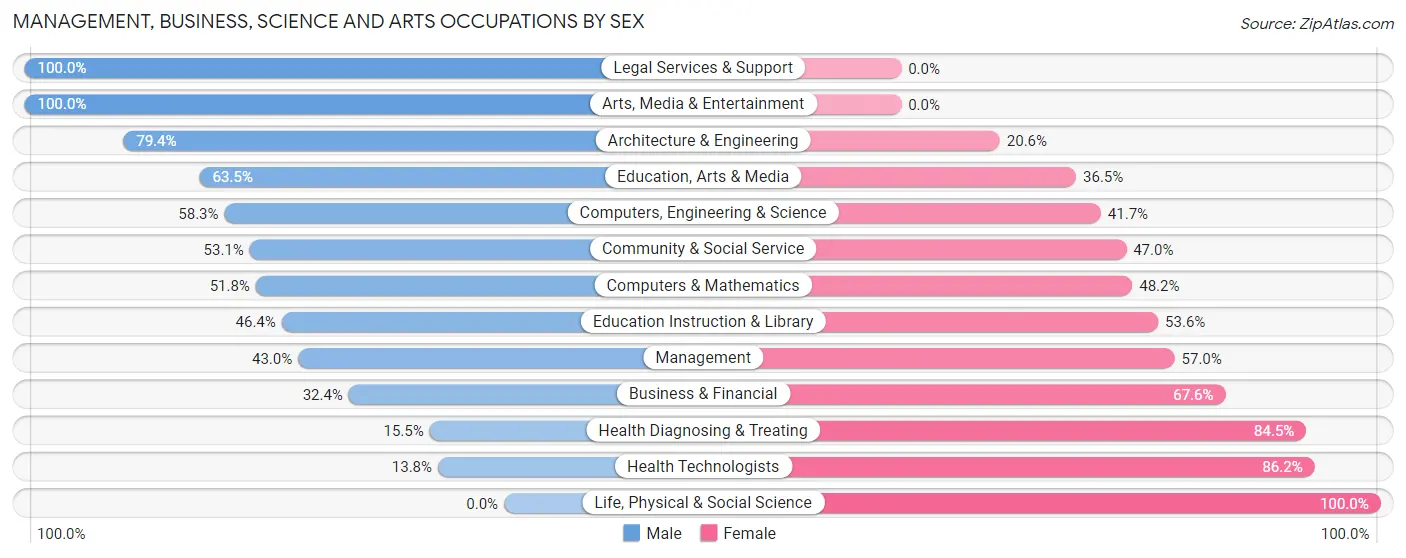
| Occupation | Male | Female |
| Management | 119 (43.0%) | 158 (57.0%) |
| Business & Financial | 23 (32.4%) | 48 (67.6%) |
| Computers, Engineering & Science | 56 (58.3%) | 40 (41.7%) |
| Computers & Mathematics | 29 (51.8%) | 27 (48.2%) |
| Architecture & Engineering | 27 (79.4%) | 7 (20.6%) |
| Life, Physical & Social Science | 0 (0.0%) | 6 (100.0%) |
| Community & Social Service | 148 (53.0%) | 131 (46.9%) |
| Education, Arts & Media | 47 (63.5%) | 27 (36.5%) |
| Legal Services & Support | 5 (100.0%) | 0 (0.0%) |
| Education Instruction & Library | 90 (46.4%) | 104 (53.6%) |
| Arts, Media & Entertainment | 6 (100.0%) | 0 (0.0%) |
| Health Diagnosing & Treating | 43 (15.5%) | 234 (84.5%) |
| Health Technologists | 24 (13.8%) | 150 (86.2%) |
| Total (Category) | 389 (38.9%) | 611 (61.1%) |
| Total (Overall) | 1,422 (50.0%) | 1,420 (50.0%) |
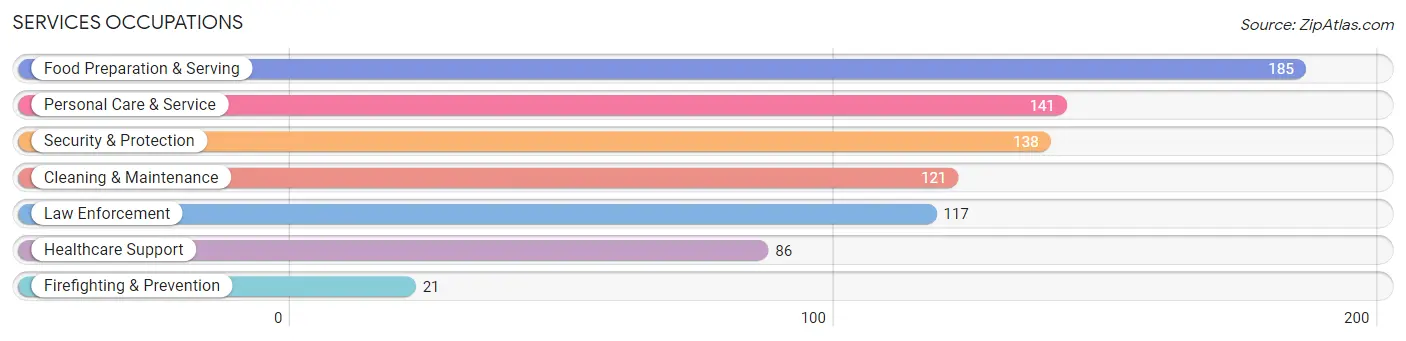
Services Occupations
The most common Services occupations in Robinson are Food Preparation & Serving (185 | 6.5%), Personal Care & Service (141 | 5.0%), Security & Protection (138 | 4.9%), Cleaning & Maintenance (121 | 4.3%), and Law Enforcement (117 | 4.1%).
Services Occupations by Sex
Within the Services occupations in Robinson, the most male-oriented occupations are Security & Protection (100.0%), Firefighting & Prevention (100.0%), and Law Enforcement (100.0%), while the most female-oriented occupations are Personal Care & Service (100.0%), Food Preparation & Serving (95.1%), and Cleaning & Maintenance (67.8%).
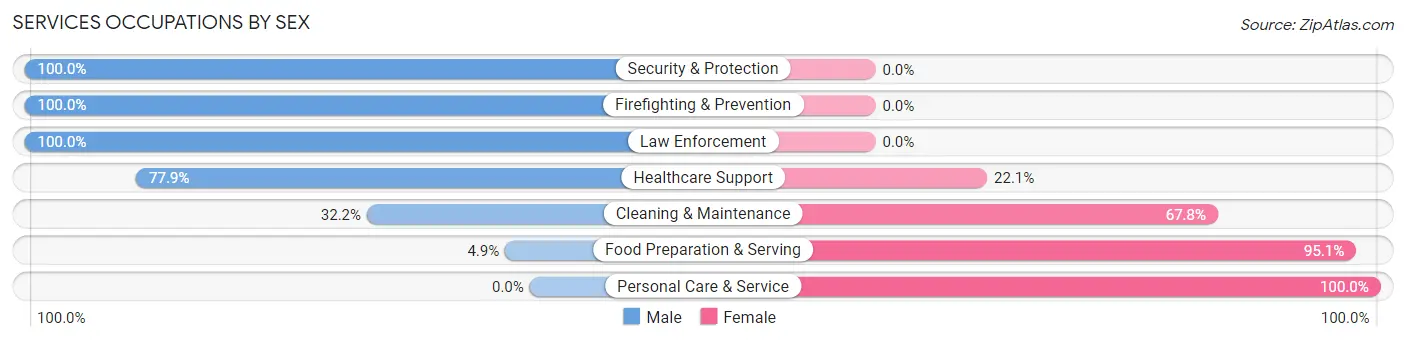
| Occupation | Male | Female |
| Healthcare Support | 67 (77.9%) | 19 (22.1%) |
| Security & Protection | 138 (100.0%) | 0 (0.0%) |
| Firefighting & Prevention | 21 (100.0%) | 0 (0.0%) |
| Law Enforcement | 117 (100.0%) | 0 (0.0%) |
| Food Preparation & Serving | 9 (4.9%) | 176 (95.1%) |
| Cleaning & Maintenance | 39 (32.2%) | 82 (67.8%) |
| Personal Care & Service | 0 (0.0%) | 141 (100.0%) |
| Total (Category) | 253 (37.7%) | 418 (62.3%) |
| Total (Overall) | 1,422 (50.0%) | 1,420 (50.0%) |
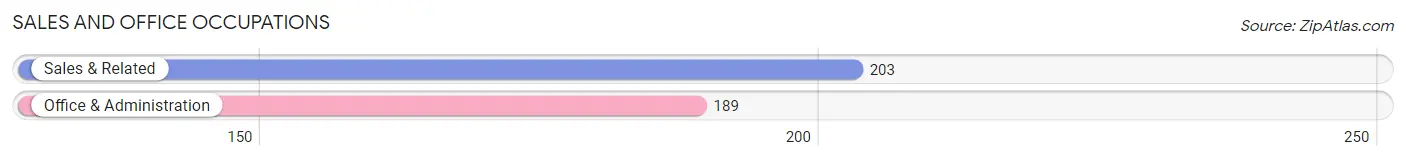
Sales and Office Occupations
The most common Sales and Office occupations in Robinson are Sales & Related (203 | 7.1%), and Office & Administration (189 | 6.7%).
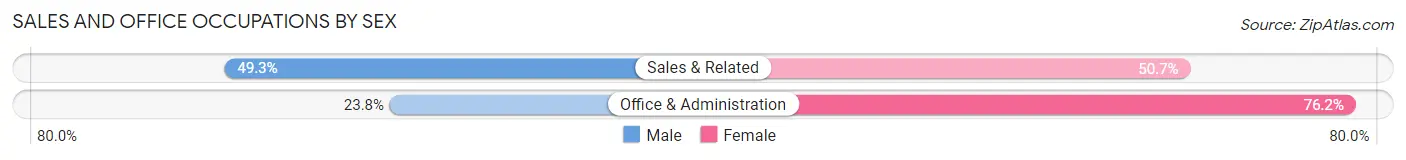
Sales and Office Occupations by Sex
| Occupation | Male | Female |
| Sales & Related | 100 (49.3%) | 103 (50.7%) |
| Office & Administration | 45 (23.8%) | 144 (76.2%) |
| Total (Category) | 145 (37.0%) | 247 (63.0%) |
| Total (Overall) | 1,422 (50.0%) | 1,420 (50.0%) |
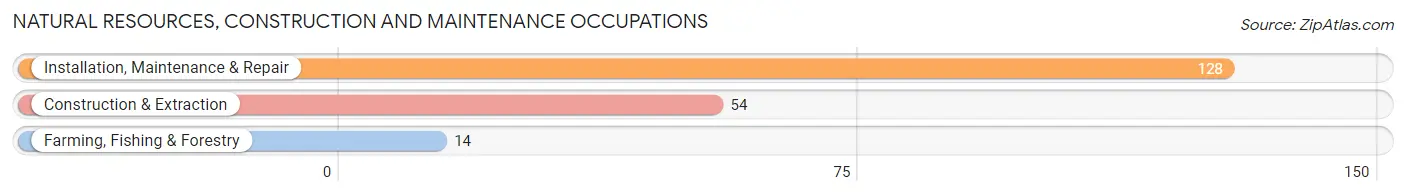
Natural Resources, Construction and Maintenance Occupations
The most common Natural Resources, Construction and Maintenance occupations in Robinson are Installation, Maintenance & Repair (128 | 4.5%), Construction & Extraction (54 | 1.9%), and Farming, Fishing & Forestry (14 | 0.5%).
Natural Resources, Construction and Maintenance Occupations by Sex

| Occupation | Male | Female |
| Farming, Fishing & Forestry | 14 (100.0%) | 0 (0.0%) |
| Construction & Extraction | 54 (100.0%) | 0 (0.0%) |
| Installation, Maintenance & Repair | 128 (100.0%) | 0 (0.0%) |
| Total (Category) | 196 (100.0%) | 0 (0.0%) |
| Total (Overall) | 1,422 (50.0%) | 1,420 (50.0%) |
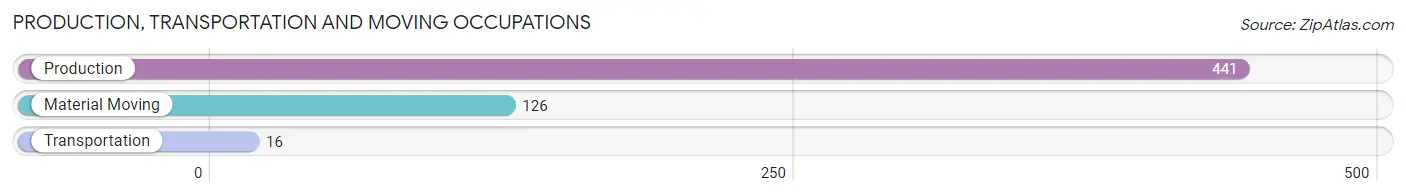
Production, Transportation and Moving Occupations
The most common Production, Transportation and Moving occupations in Robinson are Production (441 | 15.5%), Material Moving (126 | 4.4%), and Transportation (16 | 0.6%).
Production, Transportation and Moving Occupations by Sex
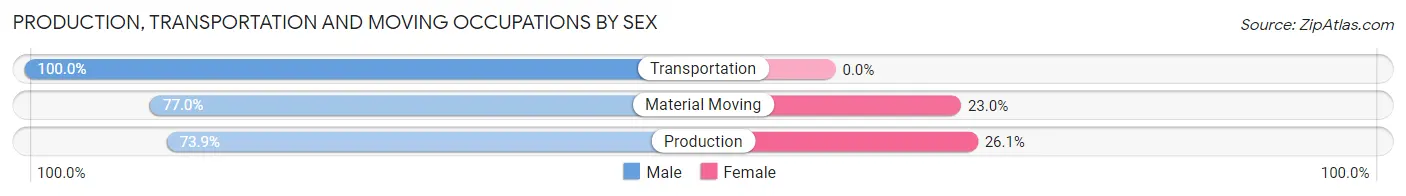
| Occupation | Male | Female |
| Production | 326 (73.9%) | 115 (26.1%) |
| Transportation | 16 (100.0%) | 0 (0.0%) |
| Material Moving | 97 (77.0%) | 29 (23.0%) |
| Total (Category) | 439 (75.3%) | 144 (24.7%) |
| Total (Overall) | 1,422 (50.0%) | 1,420 (50.0%) |
Employment Industries by Sex in Robinson
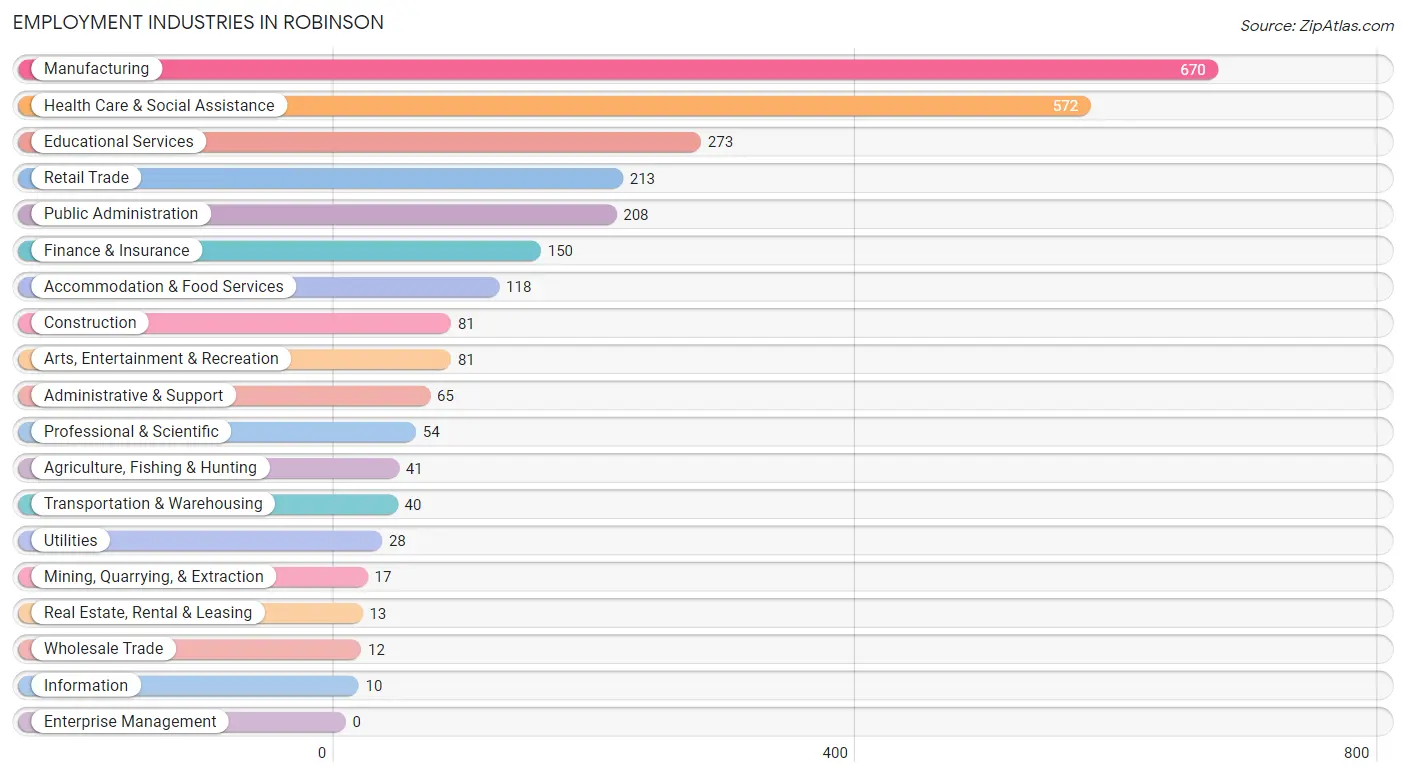
Employment Industries in Robinson
The major employment industries in Robinson include Manufacturing (670 | 23.6%), Health Care & Social Assistance (572 | 20.1%), Educational Services (273 | 9.6%), Retail Trade (213 | 7.5%), and Public Administration (208 | 7.3%).
Employment Industries by Sex in Robinson
The Robinson industries that see more men than women are Construction (100.0%), Utilities (100.0%), and Real Estate, Rental & Leasing (100.0%), whereas the industries that tend to have a higher number of women are Wholesale Trade (100.0%), Information (100.0%), and Transportation & Warehousing (85.0%).
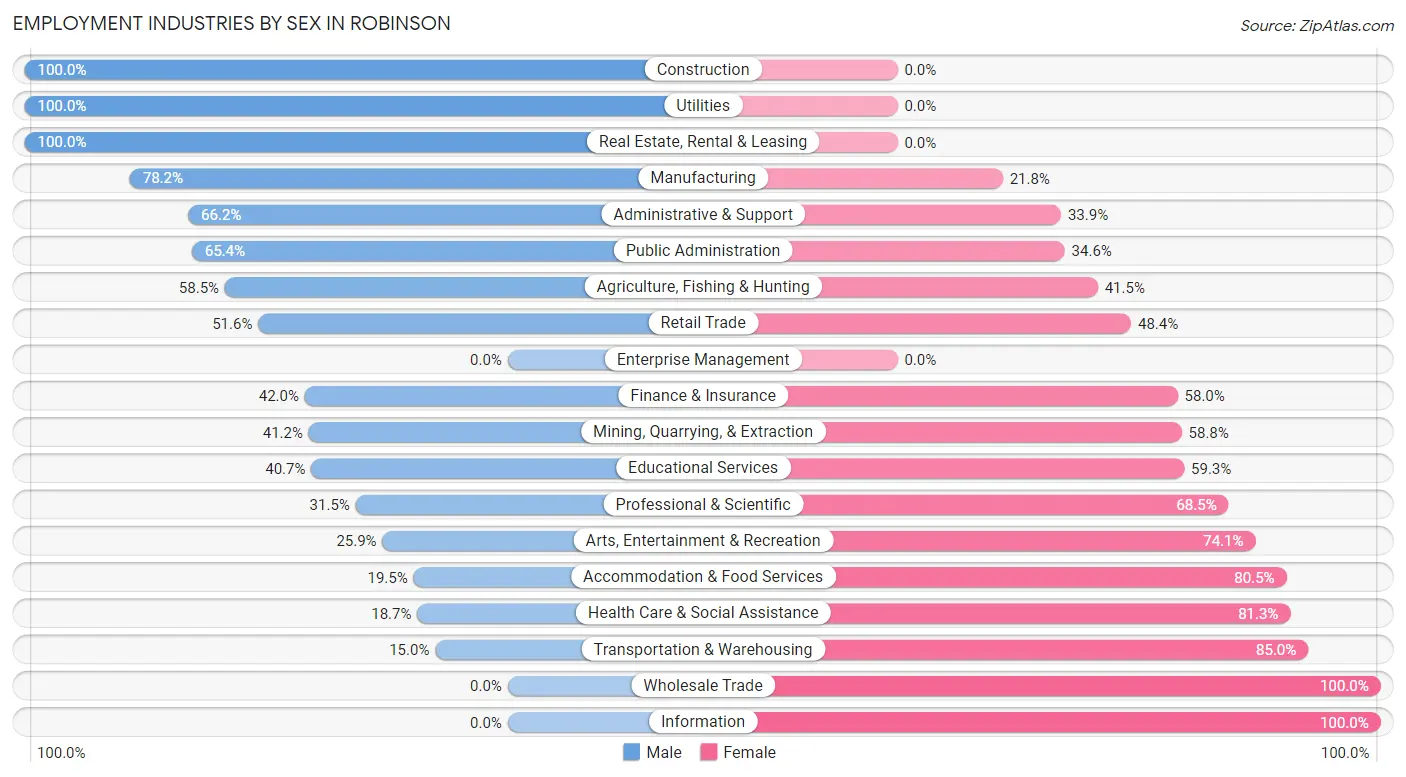
| Industry | Male | Female |
| Agriculture, Fishing & Hunting | 24 (58.5%) | 17 (41.5%) |
| Mining, Quarrying, & Extraction | 7 (41.2%) | 10 (58.8%) |
| Construction | 81 (100.0%) | 0 (0.0%) |
| Manufacturing | 524 (78.2%) | 146 (21.8%) |
| Wholesale Trade | 0 (0.0%) | 12 (100.0%) |
| Retail Trade | 110 (51.6%) | 103 (48.4%) |
| Transportation & Warehousing | 6 (15.0%) | 34 (85.0%) |
| Utilities | 28 (100.0%) | 0 (0.0%) |
| Information | 0 (0.0%) | 10 (100.0%) |
| Finance & Insurance | 63 (42.0%) | 87 (58.0%) |
| Real Estate, Rental & Leasing | 13 (100.0%) | 0 (0.0%) |
| Professional & Scientific | 17 (31.5%) | 37 (68.5%) |
| Enterprise Management | 0 (0.0%) | 0 (0.0%) |
| Administrative & Support | 43 (66.1%) | 22 (33.9%) |
| Educational Services | 111 (40.7%) | 162 (59.3%) |
| Health Care & Social Assistance | 107 (18.7%) | 465 (81.3%) |
| Arts, Entertainment & Recreation | 21 (25.9%) | 60 (74.1%) |
| Accommodation & Food Services | 23 (19.5%) | 95 (80.5%) |
| Public Administration | 136 (65.4%) | 72 (34.6%) |
| Total | 1,422 (50.0%) | 1,420 (50.0%) |
Education in Robinson
School Enrollment in Robinson
The most common levels of schooling among the 1,318 students in Robinson are middle school (331 | 25.1%), high school (327 | 24.8%), and elementary school (221 | 16.8%).
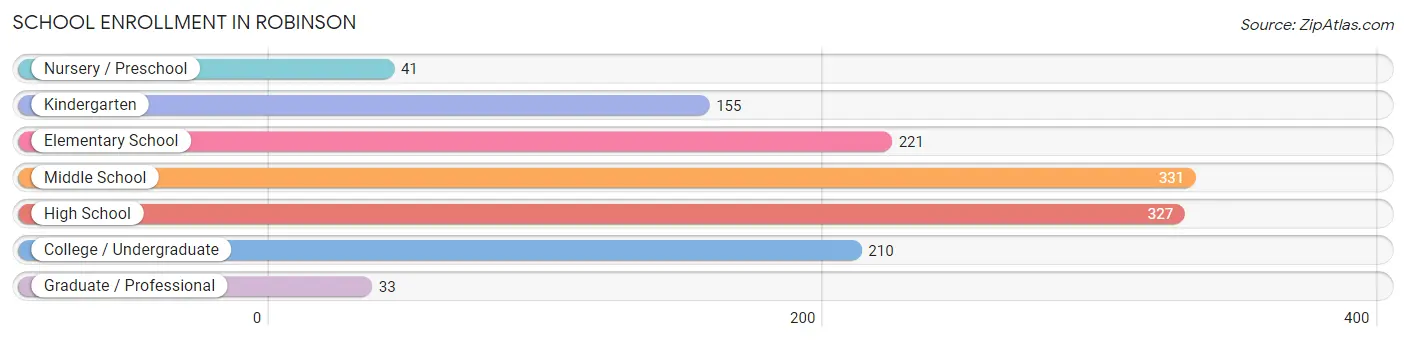
| School Level | # Students | % Students |
| Nursery / Preschool | 41 | 3.1% |
| Kindergarten | 155 | 11.8% |
| Elementary School | 221 | 16.8% |
| Middle School | 331 | 25.1% |
| High School | 327 | 24.8% |
| College / Undergraduate | 210 | 15.9% |
| Graduate / Professional | 33 | 2.5% |
| Total | 1,318 | 100.0% |
School Enrollment by Age by Funding Source in Robinson
Out of a total of 1,318 students who are enrolled in schools in Robinson, 132 (10.0%) attend a private institution, while the remaining 1,186 (90.0%) are enrolled in public schools. The age group of 25 to 34 year olds has the highest likelihood of being enrolled in private schools, with 44 (66.7% in the age bracket) enrolled. Conversely, the age group of 3 to 4 year olds has the lowest likelihood of being enrolled in a private school, with 41 (100.0% in the age bracket) attending a public institution.
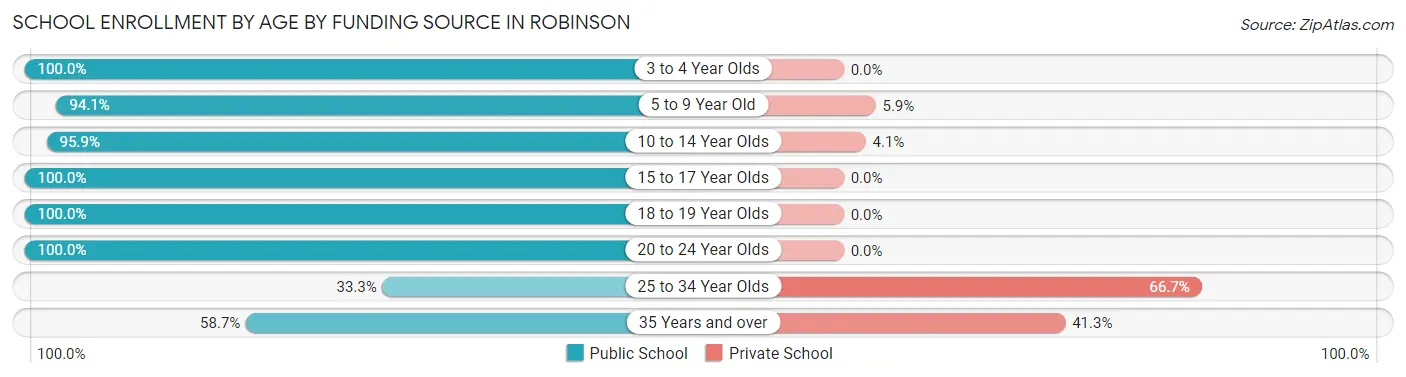
| Age Bracket | Public School | Private School |
| 3 to 4 Year Olds | 41 (100.0%) | 0 (0.0%) |
| 5 to 9 Year Old | 349 (94.1%) | 22 (5.9%) |
| 10 to 14 Year Olds | 328 (95.9%) | 14 (4.1%) |
| 15 to 17 Year Olds | 234 (100.0%) | 0 (0.0%) |
| 18 to 19 Year Olds | 93 (100.0%) | 0 (0.0%) |
| 20 to 24 Year Olds | 45 (100.0%) | 0 (0.0%) |
| 25 to 34 Year Olds | 22 (33.3%) | 44 (66.7%) |
| 35 Years and over | 74 (58.7%) | 52 (41.3%) |
| Total | 1,186 (90.0%) | 132 (10.0%) |
Educational Attainment by Field of Study in Robinson
Education (385 | 31.0%), social sciences (150 | 12.1%), science & technology (137 | 11.0%), arts & humanities (117 | 9.4%), and business (104 | 8.4%) are the most common fields of study among 1,243 individuals in Robinson who have obtained a bachelor's degree or higher.
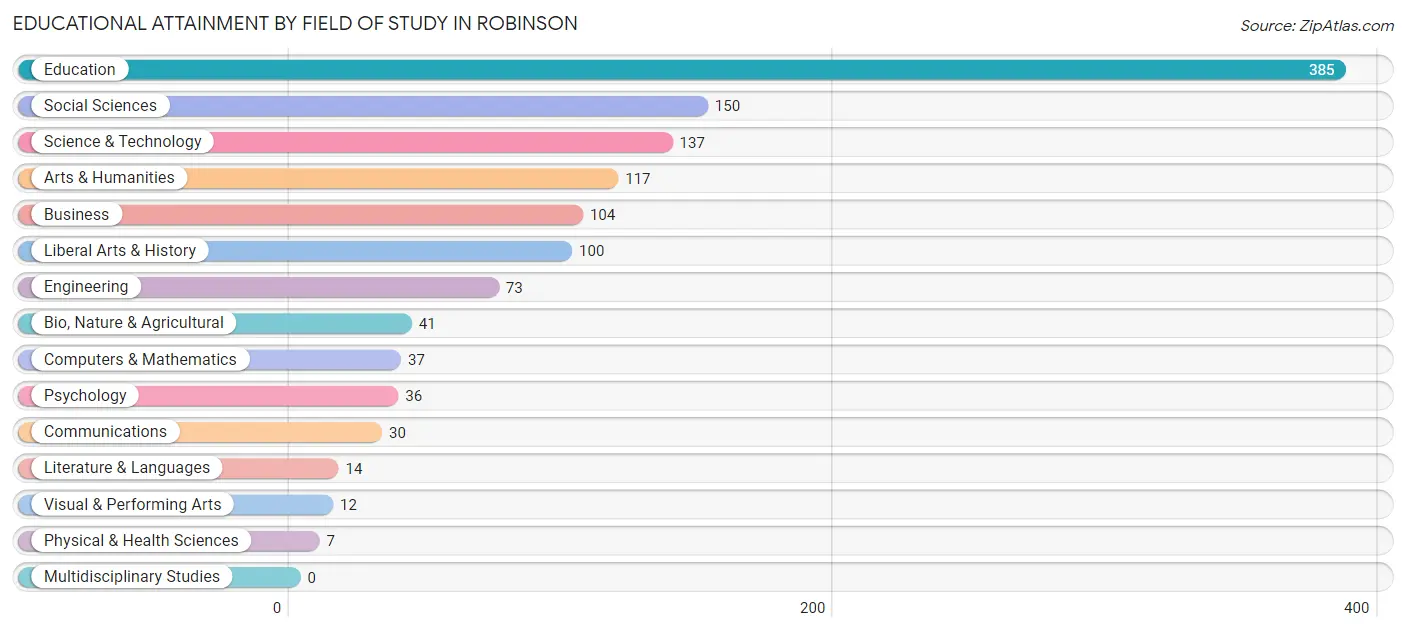
| Field of Study | # Graduates | % Graduates |
| Computers & Mathematics | 37 | 3.0% |
| Bio, Nature & Agricultural | 41 | 3.3% |
| Physical & Health Sciences | 7 | 0.6% |
| Psychology | 36 | 2.9% |
| Social Sciences | 150 | 12.1% |
| Engineering | 73 | 5.9% |
| Multidisciplinary Studies | 0 | 0.0% |
| Science & Technology | 137 | 11.0% |
| Business | 104 | 8.4% |
| Education | 385 | 31.0% |
| Literature & Languages | 14 | 1.1% |
| Liberal Arts & History | 100 | 8.1% |
| Visual & Performing Arts | 12 | 1.0% |
| Communications | 30 | 2.4% |
| Arts & Humanities | 117 | 9.4% |
| Total | 1,243 | 100.0% |
Transportation & Commute in Robinson
Vehicle Availability by Sex in Robinson
The most prevalent vehicle ownership categories in Robinson are males with 2 vehicles (635, accounting for 45.1%) and females with 2 vehicles (525, making up 45.0%).
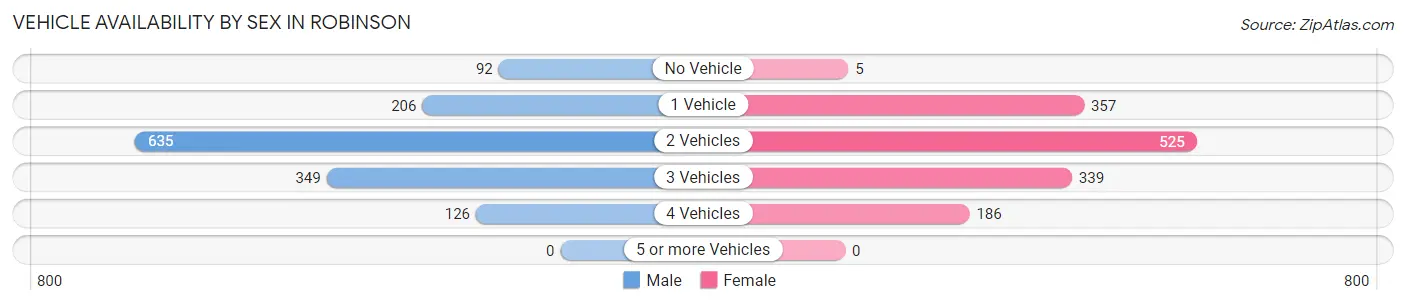
| Vehicles Available | Male | Female |
| No Vehicle | 92 (6.5%) | 5 (0.4%) |
| 1 Vehicle | 206 (14.6%) | 357 (25.3%) |
| 2 Vehicles | 635 (45.1%) | 525 (37.2%) |
| 3 Vehicles | 349 (24.8%) | 339 (24.0%) |
| 4 Vehicles | 126 (8.9%) | 186 (13.2%) |
| 5 or more Vehicles | 0 (0.0%) | 0 (0.0%) |
| Total | 1,408 (100.0%) | 1,412 (100.0%) |
Commute Time in Robinson
The most frequently occuring commute durations in Robinson are 5 to 9 minutes (825 commuters, 32.3%), less than 5 minutes (686 commuters, 26.9%), and 10 to 14 minutes (410 commuters, 16.1%).
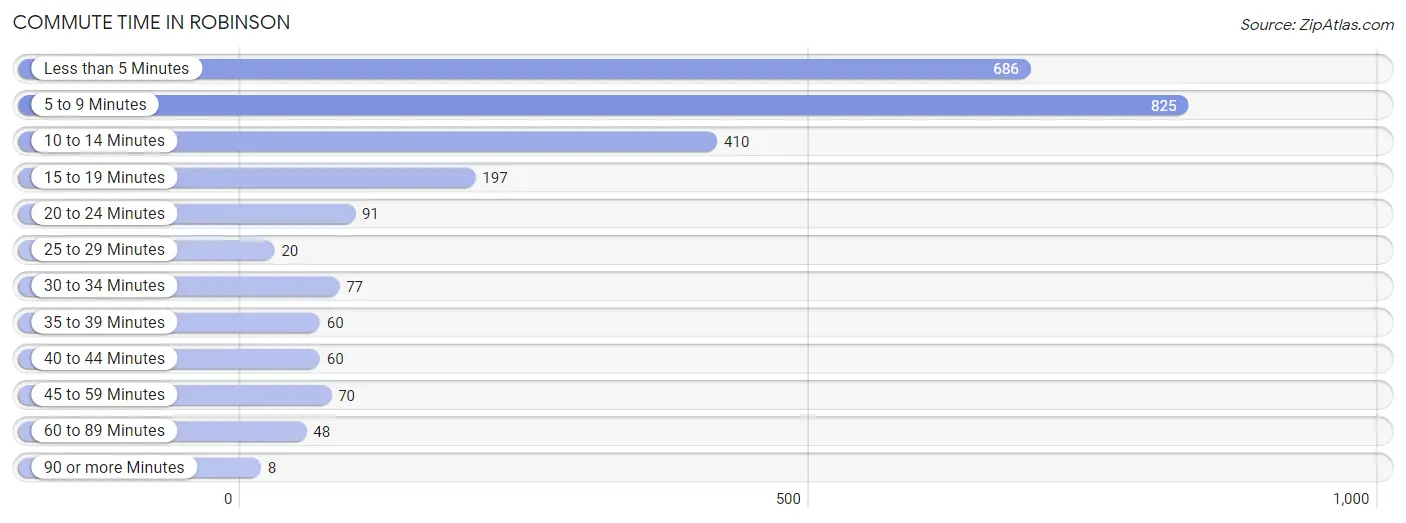
| Commute Time | # Commuters | % Commuters |
| Less than 5 Minutes | 686 | 26.9% |
| 5 to 9 Minutes | 825 | 32.3% |
| 10 to 14 Minutes | 410 | 16.1% |
| 15 to 19 Minutes | 197 | 7.7% |
| 20 to 24 Minutes | 91 | 3.6% |
| 25 to 29 Minutes | 20 | 0.8% |
| 30 to 34 Minutes | 77 | 3.0% |
| 35 to 39 Minutes | 60 | 2.4% |
| 40 to 44 Minutes | 60 | 2.4% |
| 45 to 59 Minutes | 70 | 2.7% |
| 60 to 89 Minutes | 48 | 1.9% |
| 90 or more Minutes | 8 | 0.3% |
Commute Time by Sex in Robinson
The most common commute times in Robinson are 5 to 9 minutes (464 commuters, 33.2%) for males and 5 to 9 minutes (361 commuters, 31.3%) for females.
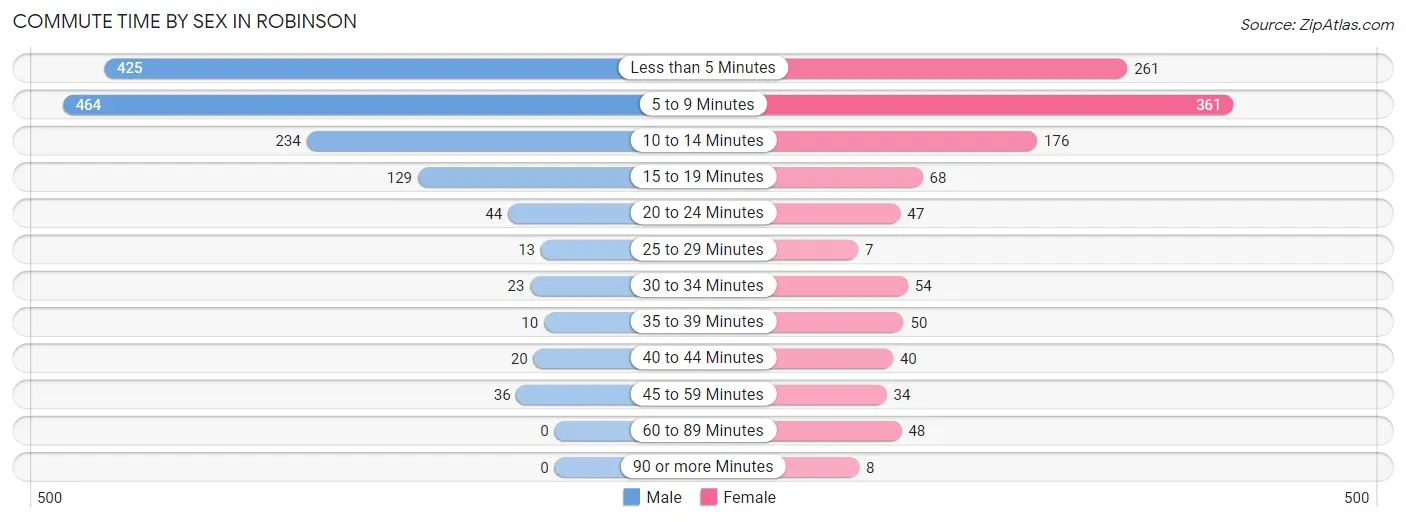
| Commute Time | Male | Female |
| Less than 5 Minutes | 425 (30.4%) | 261 (22.6%) |
| 5 to 9 Minutes | 464 (33.2%) | 361 (31.3%) |
| 10 to 14 Minutes | 234 (16.7%) | 176 (15.2%) |
| 15 to 19 Minutes | 129 (9.2%) | 68 (5.9%) |
| 20 to 24 Minutes | 44 (3.2%) | 47 (4.1%) |
| 25 to 29 Minutes | 13 (0.9%) | 7 (0.6%) |
| 30 to 34 Minutes | 23 (1.7%) | 54 (4.7%) |
| 35 to 39 Minutes | 10 (0.7%) | 50 (4.3%) |
| 40 to 44 Minutes | 20 (1.4%) | 40 (3.5%) |
| 45 to 59 Minutes | 36 (2.6%) | 34 (2.9%) |
| 60 to 89 Minutes | 0 (0.0%) | 48 (4.2%) |
| 90 or more Minutes | 0 (0.0%) | 8 (0.7%) |
Time of Departure to Work by Sex in Robinson
The most frequent times of departure to work in Robinson are 6:30 AM to 6:59 AM (315, 22.5%) for males and 7:30 AM to 7:59 AM (289, 25.0%) for females.
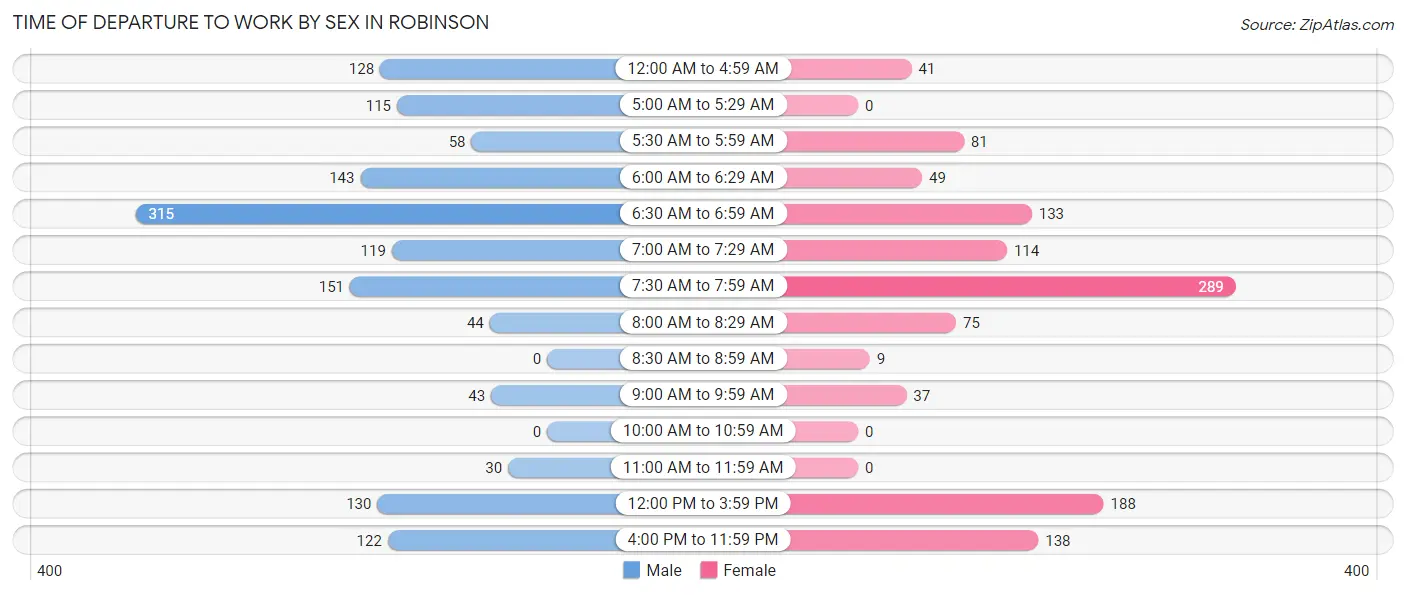
| Time of Departure | Male | Female |
| 12:00 AM to 4:59 AM | 128 (9.2%) | 41 (3.5%) |
| 5:00 AM to 5:29 AM | 115 (8.2%) | 0 (0.0%) |
| 5:30 AM to 5:59 AM | 58 (4.2%) | 81 (7.0%) |
| 6:00 AM to 6:29 AM | 143 (10.2%) | 49 (4.3%) |
| 6:30 AM to 6:59 AM | 315 (22.5%) | 133 (11.5%) |
| 7:00 AM to 7:29 AM | 119 (8.5%) | 114 (9.9%) |
| 7:30 AM to 7:59 AM | 151 (10.8%) | 289 (25.0%) |
| 8:00 AM to 8:29 AM | 44 (3.2%) | 75 (6.5%) |
| 8:30 AM to 8:59 AM | 0 (0.0%) | 9 (0.8%) |
| 9:00 AM to 9:59 AM | 43 (3.1%) | 37 (3.2%) |
| 10:00 AM to 10:59 AM | 0 (0.0%) | 0 (0.0%) |
| 11:00 AM to 11:59 AM | 30 (2.1%) | 0 (0.0%) |
| 12:00 PM to 3:59 PM | 130 (9.3%) | 188 (16.3%) |
| 4:00 PM to 11:59 PM | 122 (8.7%) | 138 (12.0%) |
| Total | 1,398 (100.0%) | 1,154 (100.0%) |
Housing Occupancy in Robinson
Occupancy by Ownership in Robinson
Of the total 2,600 dwellings in Robinson, owner-occupied units account for 1,754 (67.5%), while renter-occupied units make up 846 (32.5%).
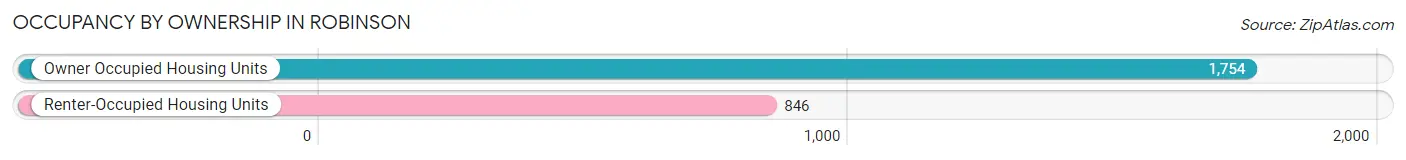
| Occupancy | # Housing Units | % Housing Units |
| Owner Occupied Housing Units | 1,754 | 67.5% |
| Renter-Occupied Housing Units | 846 | 32.5% |
| Total Occupied Housing Units | 2,600 | 100.0% |
Occupancy by Household Size in Robinson
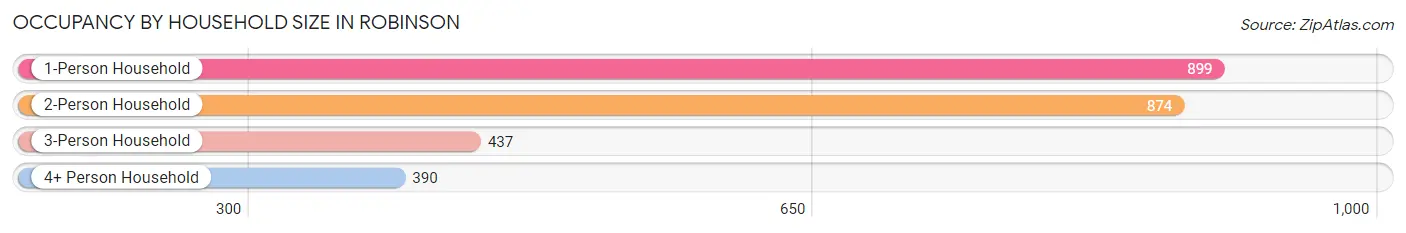
| Household Size | # Housing Units | % Housing Units |
| 1-Person Household | 899 | 34.6% |
| 2-Person Household | 874 | 33.6% |
| 3-Person Household | 437 | 16.8% |
| 4+ Person Household | 390 | 15.0% |
| Total Housing Units | 2,600 | 100.0% |
Occupancy by Ownership by Household Size in Robinson
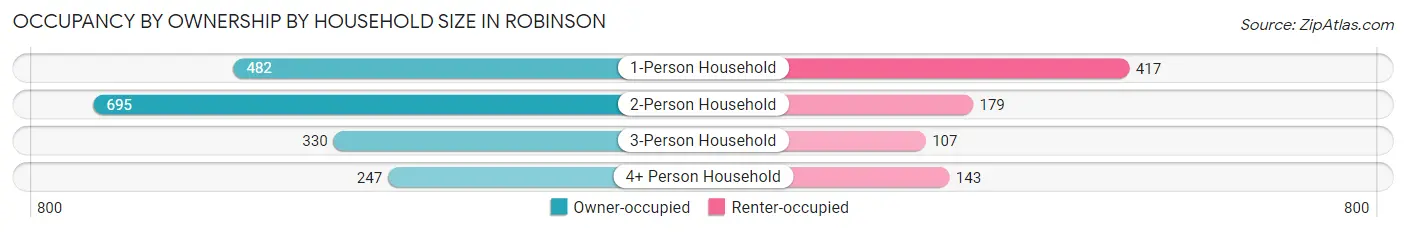
| Household Size | Owner-occupied | Renter-occupied |
| 1-Person Household | 482 (53.6%) | 417 (46.4%) |
| 2-Person Household | 695 (79.5%) | 179 (20.5%) |
| 3-Person Household | 330 (75.5%) | 107 (24.5%) |
| 4+ Person Household | 247 (63.3%) | 143 (36.7%) |
| Total Housing Units | 1,754 (67.5%) | 846 (32.5%) |
Occupancy by Educational Attainment in Robinson
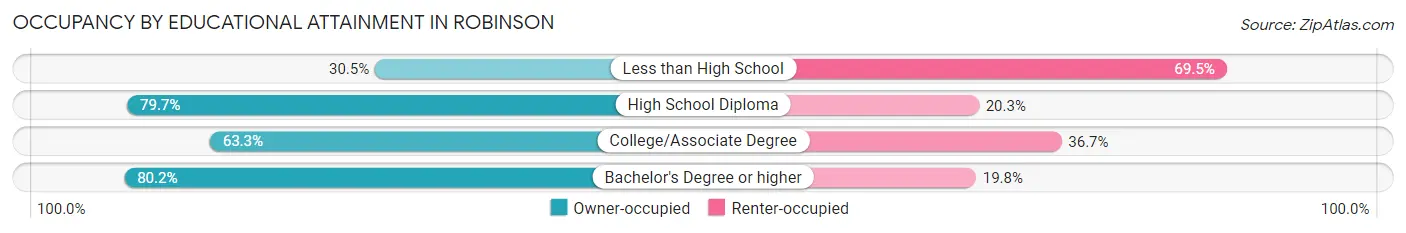
| Household Size | Owner-occupied | Renter-occupied |
| Less than High School | 105 (30.5%) | 239 (69.5%) |
| High School Diploma | 388 (79.7%) | 99 (20.3%) |
| College/Associate Degree | 591 (63.3%) | 343 (36.7%) |
| Bachelor's Degree or higher | 670 (80.2%) | 165 (19.8%) |
Occupancy by Age of Householder in Robinson
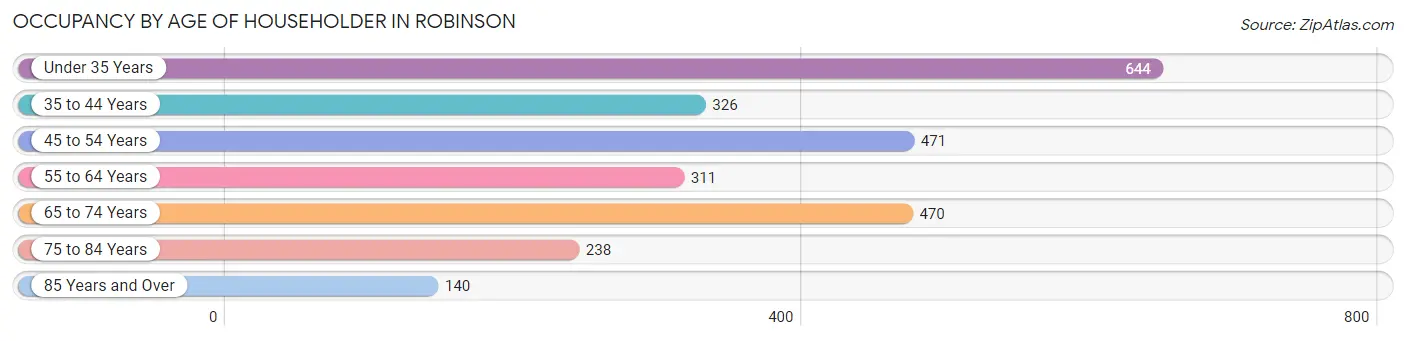
| Age Bracket | # Households | % Households |
| Under 35 Years | 644 | 24.8% |
| 35 to 44 Years | 326 | 12.5% |
| 45 to 54 Years | 471 | 18.1% |
| 55 to 64 Years | 311 | 12.0% |
| 65 to 74 Years | 470 | 18.1% |
| 75 to 84 Years | 238 | 9.1% |
| 85 Years and Over | 140 | 5.4% |
| Total | 2,600 | 100.0% |
Housing Finances in Robinson
Median Income by Occupancy in Robinson
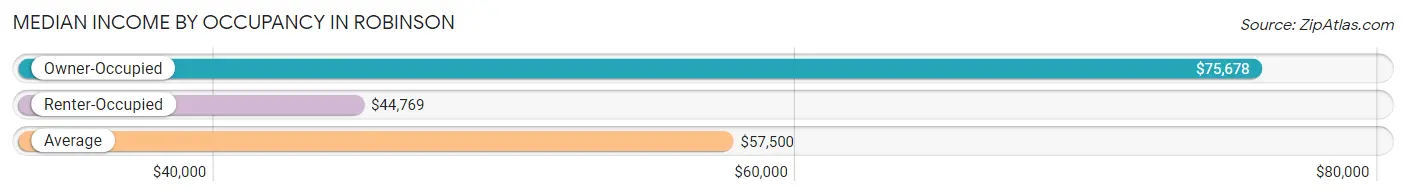
| Occupancy Type | # Households | Median Income |
| Owner-Occupied | 1,754 (67.5%) | $75,678 |
| Renter-Occupied | 846 (32.5%) | $44,769 |
| Average | 2,600 (100.0%) | $57,500 |
Occupancy by Householder Income Bracket in Robinson
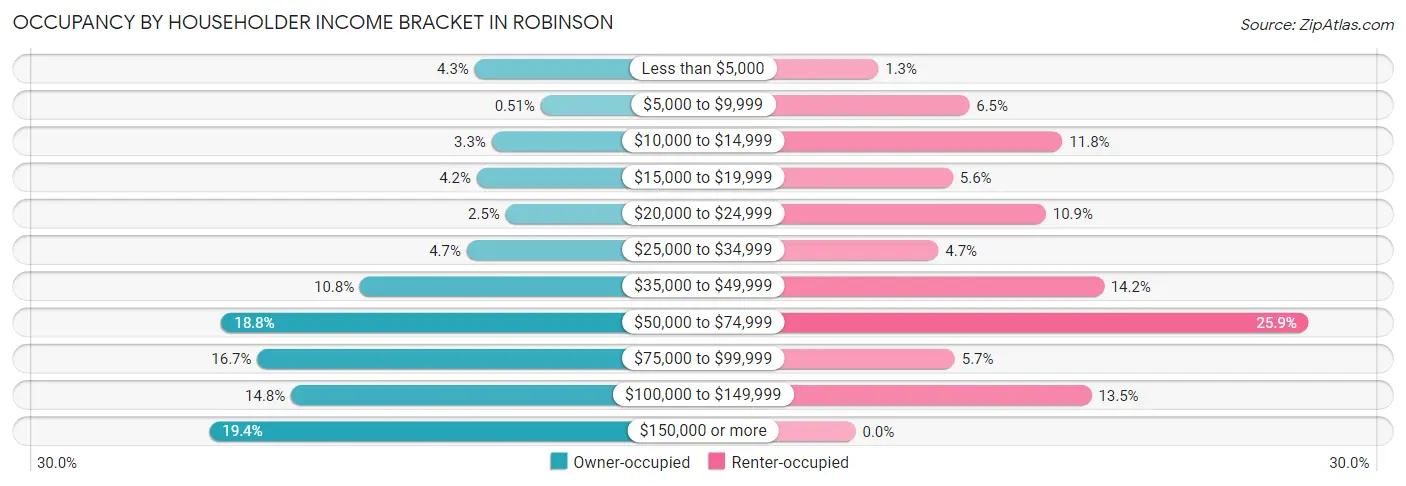
| Income Bracket | Owner-occupied | Renter-occupied |
| Less than $5,000 | 75 (4.3%) | 11 (1.3%) |
| $5,000 to $9,999 | 9 (0.5%) | 55 (6.5%) |
| $10,000 to $14,999 | 58 (3.3%) | 100 (11.8%) |
| $15,000 to $19,999 | 73 (4.2%) | 47 (5.6%) |
| $20,000 to $24,999 | 44 (2.5%) | 92 (10.9%) |
| $25,000 to $34,999 | 83 (4.7%) | 40 (4.7%) |
| $35,000 to $49,999 | 190 (10.8%) | 120 (14.2%) |
| $50,000 to $74,999 | 329 (18.8%) | 219 (25.9%) |
| $75,000 to $99,999 | 293 (16.7%) | 48 (5.7%) |
| $100,000 to $149,999 | 259 (14.8%) | 114 (13.5%) |
| $150,000 or more | 341 (19.4%) | 0 (0.0%) |
| Total | 1,754 (100.0%) | 846 (100.0%) |
Monthly Housing Cost Tiers in Robinson
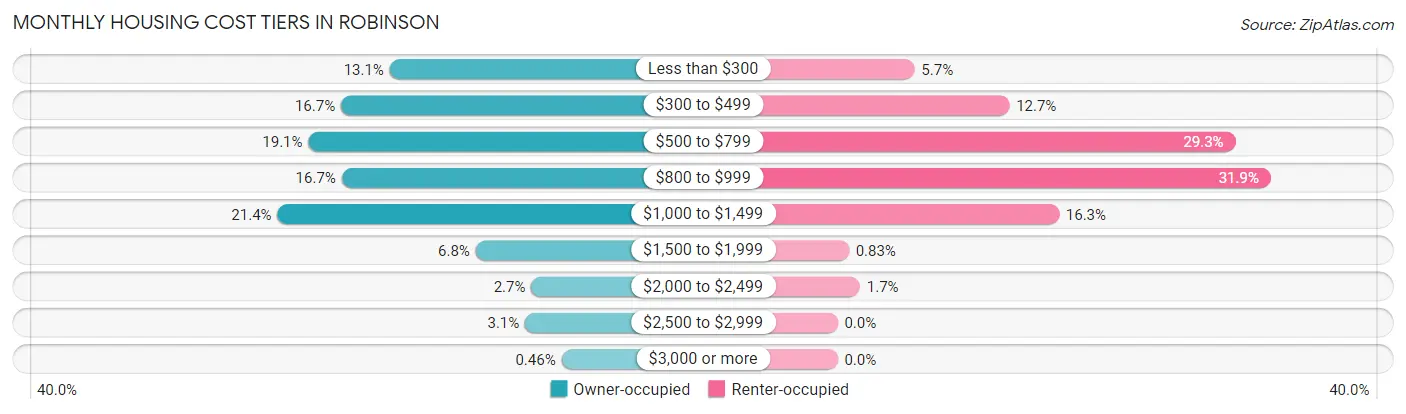
| Monthly Cost | Owner-occupied | Renter-occupied |
| Less than $300 | 230 (13.1%) | 48 (5.7%) |
| $300 to $499 | 293 (16.7%) | 107 (12.7%) |
| $500 to $799 | 335 (19.1%) | 248 (29.3%) |
| $800 to $999 | 292 (16.7%) | 270 (31.9%) |
| $1,000 to $1,499 | 375 (21.4%) | 138 (16.3%) |
| $1,500 to $1,999 | 119 (6.8%) | 7 (0.8%) |
| $2,000 to $2,499 | 47 (2.7%) | 14 (1.7%) |
| $2,500 to $2,999 | 55 (3.1%) | 0 (0.0%) |
| $3,000 or more | 8 (0.5%) | 0 (0.0%) |
| Total | 1,754 (100.0%) | 846 (100.0%) |
Physical Housing Characteristics in Robinson
Housing Structures in Robinson
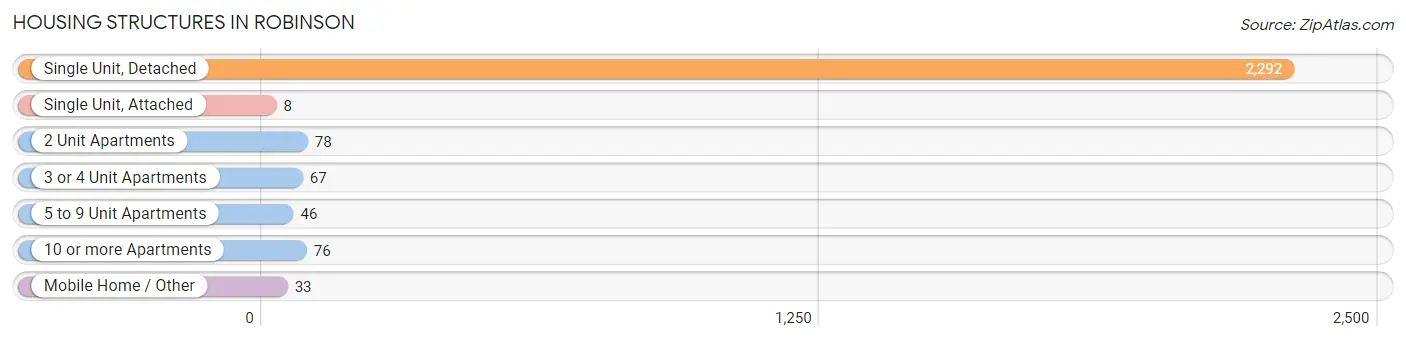
| Structure Type | # Housing Units | % Housing Units |
| Single Unit, Detached | 2,292 | 88.1% |
| Single Unit, Attached | 8 | 0.3% |
| 2 Unit Apartments | 78 | 3.0% |
| 3 or 4 Unit Apartments | 67 | 2.6% |
| 5 to 9 Unit Apartments | 46 | 1.8% |
| 10 or more Apartments | 76 | 2.9% |
| Mobile Home / Other | 33 | 1.3% |
| Total | 2,600 | 100.0% |
Housing Structures by Occupancy in Robinson
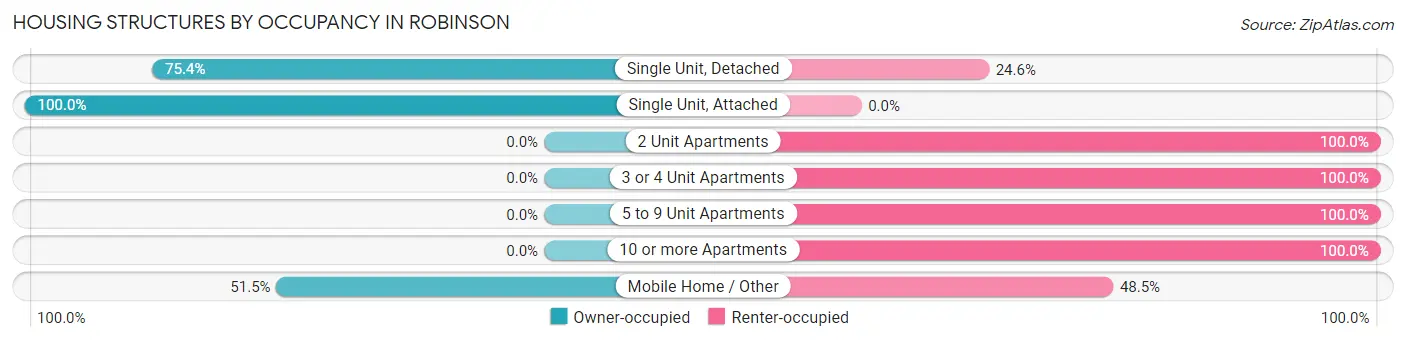
| Structure Type | Owner-occupied | Renter-occupied |
| Single Unit, Detached | 1,729 (75.4%) | 563 (24.6%) |
| Single Unit, Attached | 8 (100.0%) | 0 (0.0%) |
| 2 Unit Apartments | 0 (0.0%) | 78 (100.0%) |
| 3 or 4 Unit Apartments | 0 (0.0%) | 67 (100.0%) |
| 5 to 9 Unit Apartments | 0 (0.0%) | 46 (100.0%) |
| 10 or more Apartments | 0 (0.0%) | 76 (100.0%) |
| Mobile Home / Other | 17 (51.5%) | 16 (48.5%) |
| Total | 1,754 (67.5%) | 846 (32.5%) |
Housing Structures by Number of Rooms in Robinson
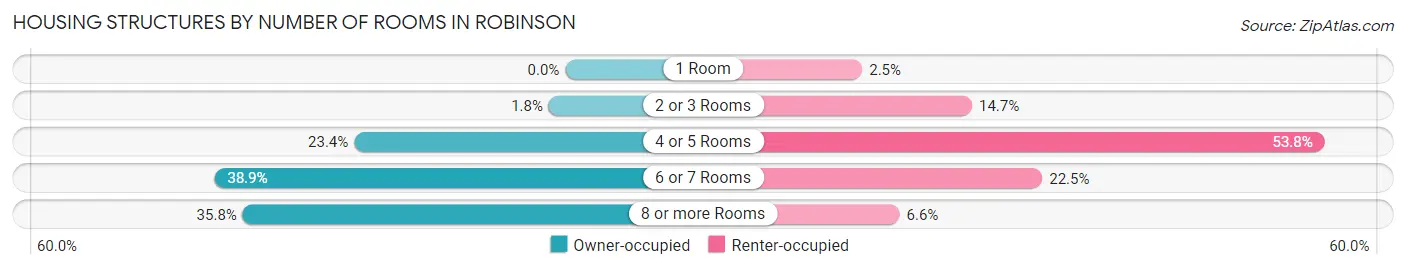
| Number of Rooms | Owner-occupied | Renter-occupied |
| 1 Room | 0 (0.0%) | 21 (2.5%) |
| 2 or 3 Rooms | 32 (1.8%) | 124 (14.7%) |
| 4 or 5 Rooms | 411 (23.4%) | 455 (53.8%) |
| 6 or 7 Rooms | 683 (38.9%) | 190 (22.5%) |
| 8 or more Rooms | 628 (35.8%) | 56 (6.6%) |
| Total | 1,754 (100.0%) | 846 (100.0%) |
Housing Structure by Heating Type in Robinson
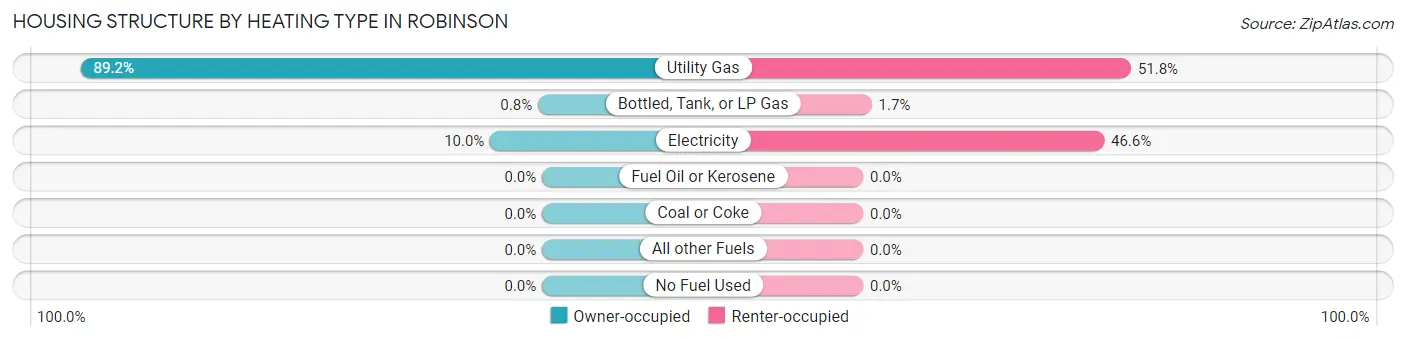
| Heating Type | Owner-occupied | Renter-occupied |
| Utility Gas | 1,564 (89.2%) | 438 (51.8%) |
| Bottled, Tank, or LP Gas | 14 (0.8%) | 14 (1.7%) |
| Electricity | 176 (10.0%) | 394 (46.6%) |
| Fuel Oil or Kerosene | 0 (0.0%) | 0 (0.0%) |
| Coal or Coke | 0 (0.0%) | 0 (0.0%) |
| All other Fuels | 0 (0.0%) | 0 (0.0%) |
| No Fuel Used | 0 (0.0%) | 0 (0.0%) |
| Total | 1,754 (100.0%) | 846 (100.0%) |
Household Vehicle Usage in Robinson
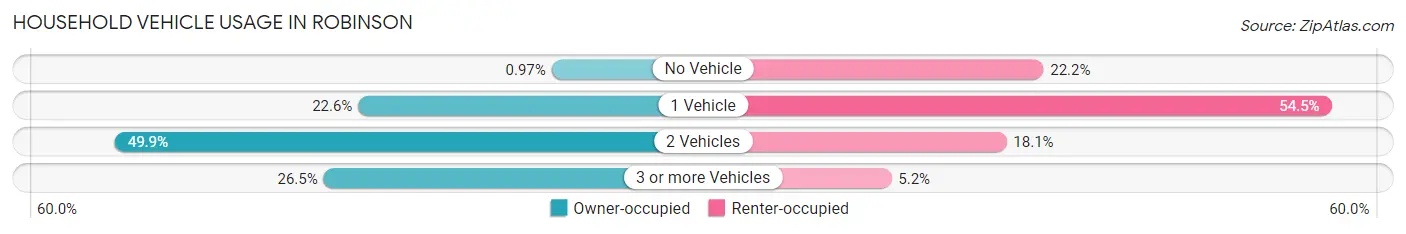
| Vehicles per Household | Owner-occupied | Renter-occupied |
| No Vehicle | 17 (1.0%) | 188 (22.2%) |
| 1 Vehicle | 397 (22.6%) | 461 (54.5%) |
| 2 Vehicles | 875 (49.9%) | 153 (18.1%) |
| 3 or more Vehicles | 465 (26.5%) | 44 (5.2%) |
| Total | 1,754 (100.0%) | 846 (100.0%) |
Real Estate & Mortgages in Robinson
Real Estate and Mortgage Overview in Robinson
| Characteristic | Without Mortgage | With Mortgage |
| Housing Units | 577 | 1,177 |
| Median Property Value | $86,700 | $106,900 |
| Median Household Income | $50,479 | $266 |
| Monthly Housing Costs | $376 | $8 |
| Real Estate Taxes | $1,141 | $48 |
Property Value by Mortgage Status in Robinson
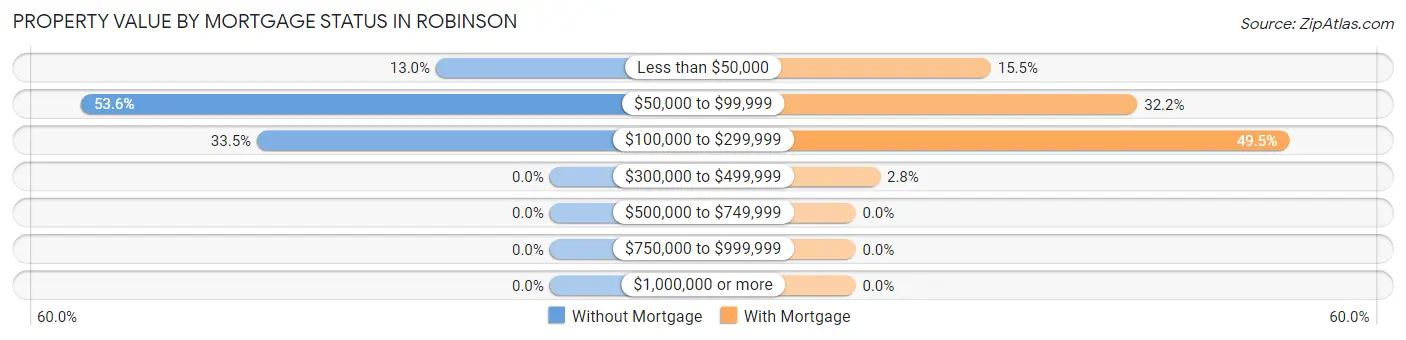
| Property Value | Without Mortgage | With Mortgage |
| Less than $50,000 | 75 (13.0%) | 182 (15.5%) |
| $50,000 to $99,999 | 309 (53.5%) | 379 (32.2%) |
| $100,000 to $299,999 | 193 (33.5%) | 583 (49.5%) |
| $300,000 to $499,999 | 0 (0.0%) | 33 (2.8%) |
| $500,000 to $749,999 | 0 (0.0%) | 0 (0.0%) |
| $750,000 to $999,999 | 0 (0.0%) | 0 (0.0%) |
| $1,000,000 or more | 0 (0.0%) | 0 (0.0%) |
| Total | 577 (100.0%) | 1,177 (100.0%) |
Household Income by Mortgage Status in Robinson
| Household Income | Without Mortgage | With Mortgage |
| Less than $10,000 | 16 (2.8%) | 93 (7.9%) |
| $10,000 to $24,999 | 156 (27.0%) | 68 (5.8%) |
| $25,000 to $34,999 | 5 (0.9%) | 19 (1.6%) |
| $35,000 to $49,999 | 100 (17.3%) | 78 (6.6%) |
| $50,000 to $74,999 | 118 (20.4%) | 90 (7.6%) |
| $75,000 to $99,999 | 57 (9.9%) | 211 (17.9%) |
| $100,000 to $149,999 | 50 (8.7%) | 236 (20.1%) |
| $150,000 or more | 75 (13.0%) | 209 (17.8%) |
| Total | 577 (100.0%) | 1,177 (100.0%) |
Property Value to Household Income Ratio in Robinson
| Value-to-Income Ratio | Without Mortgage | With Mortgage |
| Less than 2.0x | 313 (54.2%) | 85,492 (7,263.5%) |
| 2.0x to 2.9x | 112 (19.4%) | 882 (74.9%) |
| 3.0x to 3.9x | 40 (6.9%) | 177 (15.0%) |
| 4.0x or more | 105 (18.2%) | 40 (3.4%) |
| Total | 577 (100.0%) | 1,177 (100.0%) |
Real Estate Taxes by Mortgage Status in Robinson
| Property Taxes | Without Mortgage | With Mortgage |
| Less than $800 | 156 (27.0%) | 21 (1.8%) |
| $800 to $1,499 | 242 (41.9%) | 220 (18.7%) |
| $800 to $1,499 | 131 (22.7%) | 275 (23.4%) |
| Total | 577 (100.0%) | 1,177 (100.0%) |
Health & Disability in Robinson
Health Insurance Coverage by Age in Robinson
| Age Bracket | With Coverage | Without Coverage |
| Under 6 Years | 322 (100.0%) | 0 (0.0%) |
| 6 to 18 Years | 998 (97.9%) | 21 (2.1%) |
| 19 to 25 Years | 349 (100.0%) | 0 (0.0%) |
| 26 to 34 Years | 648 (82.0%) | 142 (18.0%) |
| 35 to 44 Years | 462 (80.3%) | 113 (19.7%) |
| 45 to 54 Years | 727 (90.5%) | 76 (9.5%) |
| 55 to 64 Years | 503 (83.7%) | 98 (16.3%) |
| 65 to 74 Years | 653 (100.0%) | 0 (0.0%) |
| 75 Years and older | 480 (100.0%) | 0 (0.0%) |
| Total | 5,142 (91.9%) | 450 (8.1%) |
Health Insurance Coverage by Citizenship Status in Robinson
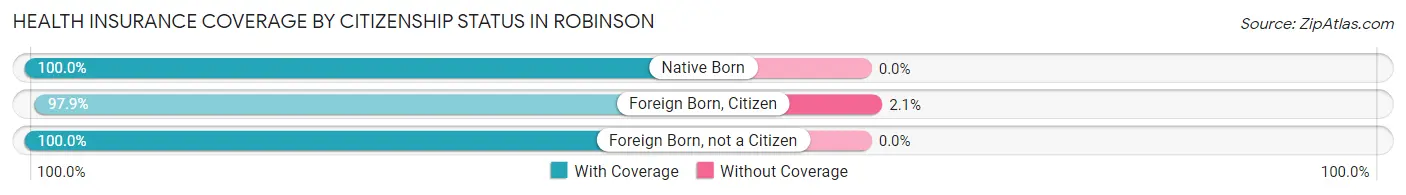
| Citizenship Status | With Coverage | Without Coverage |
| Native Born | 322 (100.0%) | 0 (0.0%) |
| Foreign Born, Citizen | 998 (97.9%) | 21 (2.1%) |
| Foreign Born, not a Citizen | 349 (100.0%) | 0 (0.0%) |
Health Insurance Coverage by Household Income in Robinson
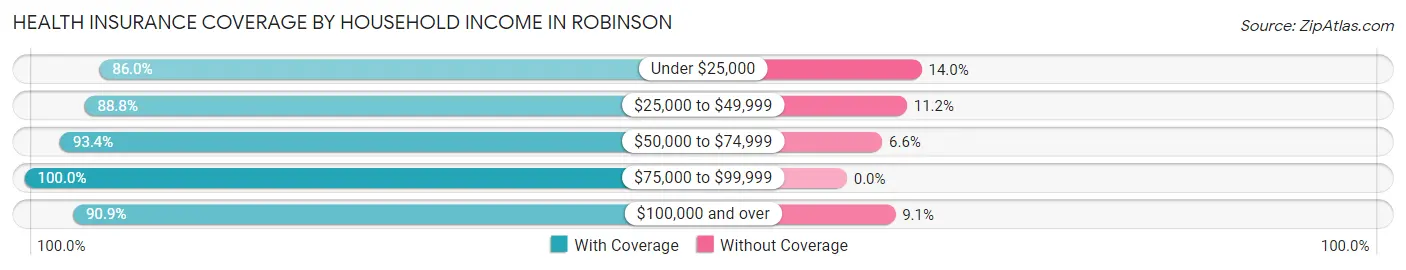
| Household Income | With Coverage | Without Coverage |
| Under $25,000 | 602 (86.0%) | 98 (14.0%) |
| $25,000 to $49,999 | 616 (88.8%) | 78 (11.2%) |
| $50,000 to $74,999 | 1,102 (93.4%) | 78 (6.6%) |
| $75,000 to $99,999 | 844 (100.0%) | 0 (0.0%) |
| $100,000 and over | 1,966 (90.9%) | 196 (9.1%) |
Public vs Private Health Insurance Coverage by Age in Robinson
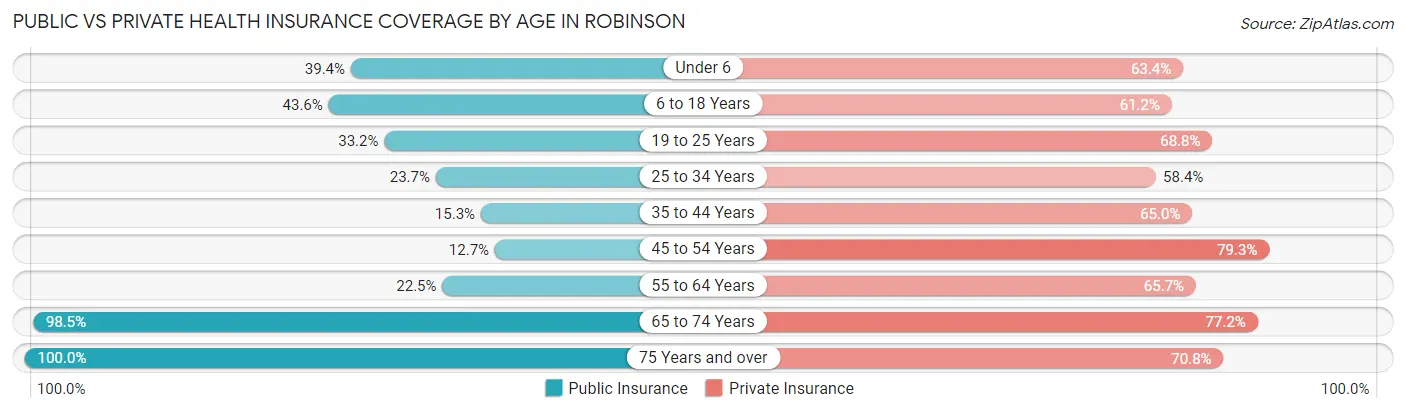
| Age Bracket | Public Insurance | Private Insurance |
| Under 6 | 127 (39.4%) | 204 (63.3%) |
| 6 to 18 Years | 444 (43.6%) | 624 (61.2%) |
| 19 to 25 Years | 116 (33.2%) | 240 (68.8%) |
| 25 to 34 Years | 187 (23.7%) | 461 (58.4%) |
| 35 to 44 Years | 88 (15.3%) | 374 (65.0%) |
| 45 to 54 Years | 102 (12.7%) | 637 (79.3%) |
| 55 to 64 Years | 135 (22.5%) | 395 (65.7%) |
| 65 to 74 Years | 643 (98.5%) | 504 (77.2%) |
| 75 Years and over | 480 (100.0%) | 340 (70.8%) |
| Total | 2,322 (41.5%) | 3,779 (67.6%) |
Disability Status by Sex by Age in Robinson
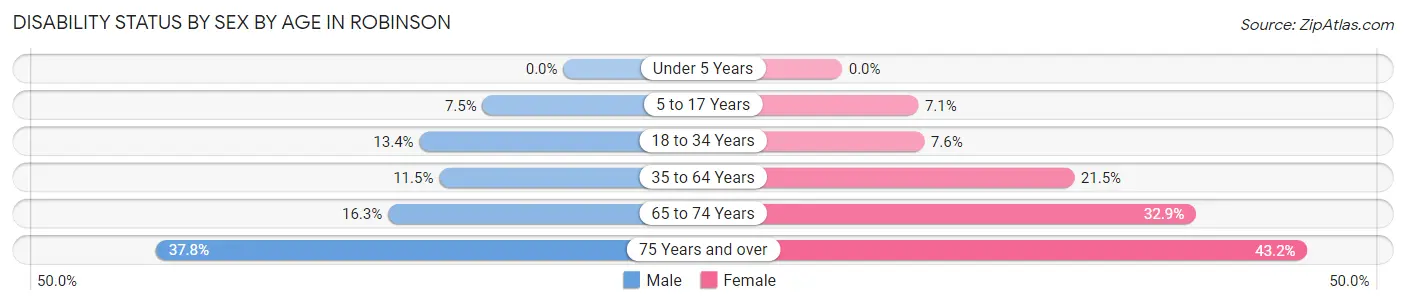
| Age Bracket | Male | Female |
| Under 5 Years | 0 (0.0%) | 0 (0.0%) |
| 5 to 17 Years | 46 (7.5%) | 27 (7.1%) |
| 18 to 34 Years | 89 (13.4%) | 41 (7.6%) |
| 35 to 64 Years | 114 (11.5%) | 213 (21.5%) |
| 65 to 74 Years | 34 (16.3%) | 146 (32.9%) |
| 75 Years and over | 73 (37.8%) | 124 (43.2%) |
Disability Class by Sex by Age in Robinson
Disability Class: Hearing Difficulty
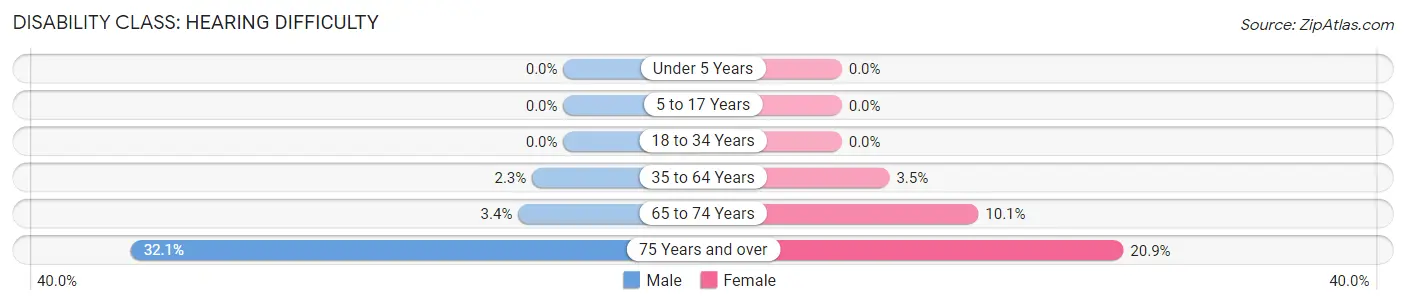
| Age Bracket | Male | Female |
| Under 5 Years | 0 (0.0%) | 0 (0.0%) |
| 5 to 17 Years | 0 (0.0%) | 0 (0.0%) |
| 18 to 34 Years | 0 (0.0%) | 0 (0.0%) |
| 35 to 64 Years | 23 (2.3%) | 35 (3.5%) |
| 65 to 74 Years | 7 (3.4%) | 45 (10.1%) |
| 75 Years and over | 62 (32.1%) | 60 (20.9%) |
Disability Class: Vision Difficulty
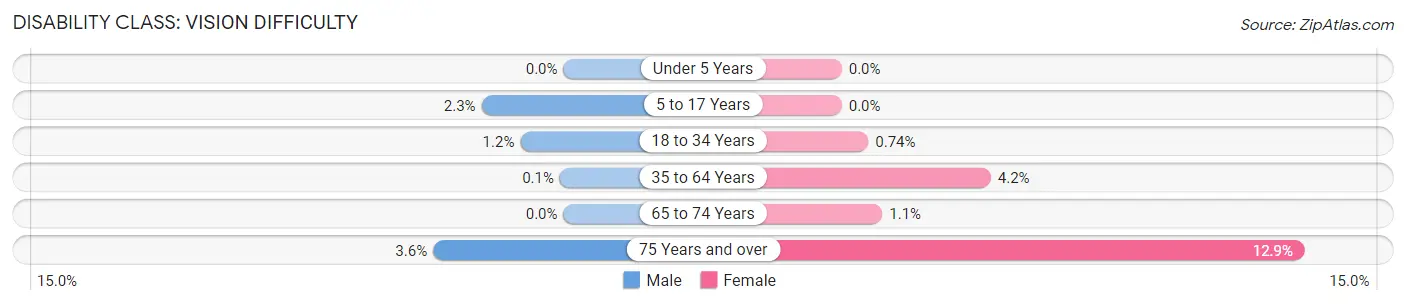
| Age Bracket | Male | Female |
| Under 5 Years | 0 (0.0%) | 0 (0.0%) |
| 5 to 17 Years | 14 (2.3%) | 0 (0.0%) |
| 18 to 34 Years | 8 (1.2%) | 4 (0.7%) |
| 35 to 64 Years | 1 (0.1%) | 41 (4.2%) |
| 65 to 74 Years | 0 (0.0%) | 5 (1.1%) |
| 75 Years and over | 7 (3.6%) | 37 (12.9%) |
Disability Class: Cognitive Difficulty
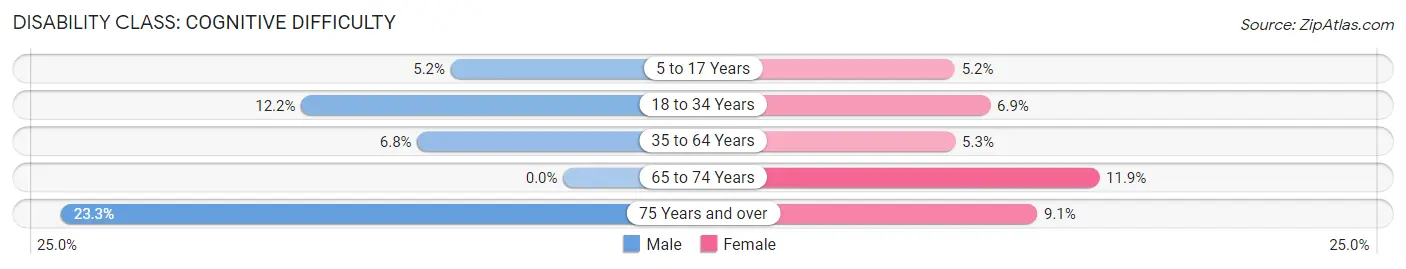
| Age Bracket | Male | Female |
| 5 to 17 Years | 32 (5.2%) | 20 (5.2%) |
| 18 to 34 Years | 81 (12.2%) | 37 (6.9%) |
| 35 to 64 Years | 67 (6.8%) | 52 (5.3%) |
| 65 to 74 Years | 0 (0.0%) | 53 (11.9%) |
| 75 Years and over | 45 (23.3%) | 26 (9.1%) |
Disability Class: Ambulatory Difficulty
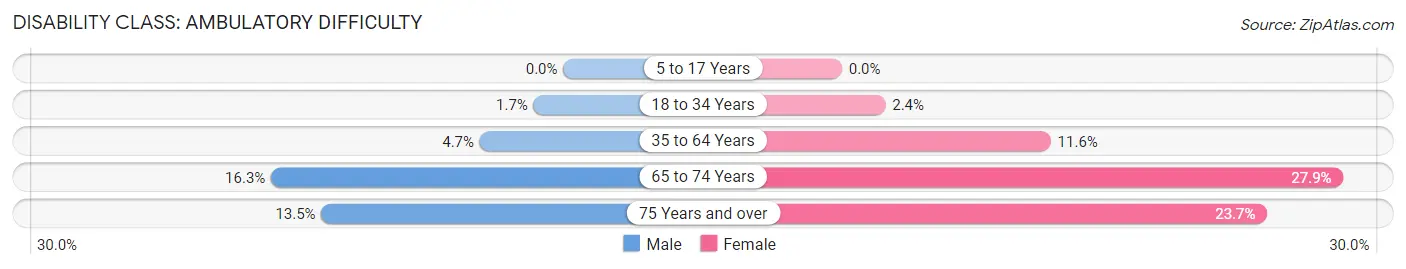
| Age Bracket | Male | Female |
| 5 to 17 Years | 0 (0.0%) | 0 (0.0%) |
| 18 to 34 Years | 11 (1.7%) | 13 (2.4%) |
| 35 to 64 Years | 46 (4.6%) | 115 (11.6%) |
| 65 to 74 Years | 34 (16.3%) | 124 (27.9%) |
| 75 Years and over | 26 (13.5%) | 68 (23.7%) |
Disability Class: Self-Care Difficulty
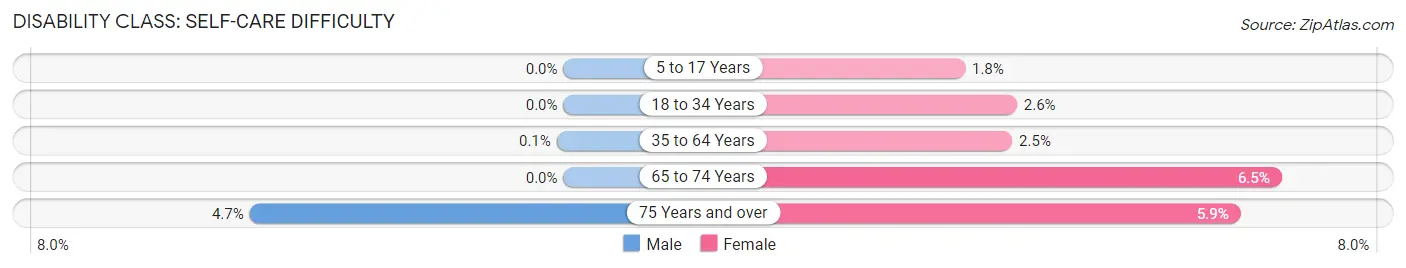
| Age Bracket | Male | Female |
| 5 to 17 Years | 0 (0.0%) | 7 (1.8%) |
| 18 to 34 Years | 0 (0.0%) | 14 (2.6%) |
| 35 to 64 Years | 1 (0.1%) | 25 (2.5%) |
| 65 to 74 Years | 0 (0.0%) | 29 (6.5%) |
| 75 Years and over | 9 (4.7%) | 17 (5.9%) |
Technology Access in Robinson
Computing Device Access in Robinson
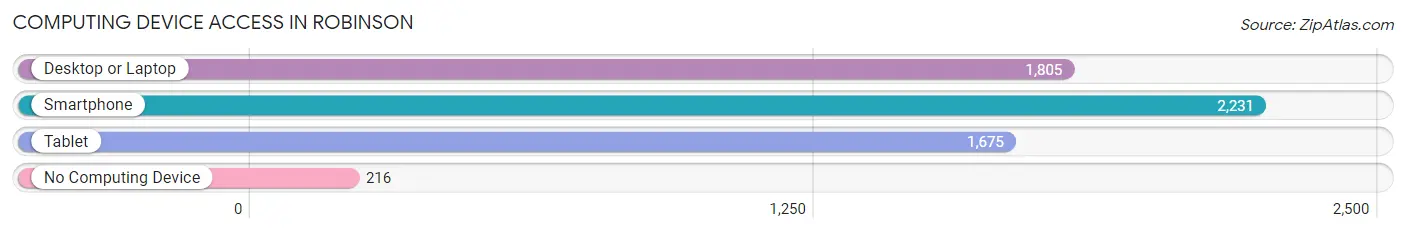
| Device Type | # Households | % Households |
| Desktop or Laptop | 1,805 | 69.4% |
| Smartphone | 2,231 | 85.8% |
| Tablet | 1,675 | 64.4% |
| No Computing Device | 216 | 8.3% |
| Total | 2,600 | 100.0% |
Internet Access in Robinson
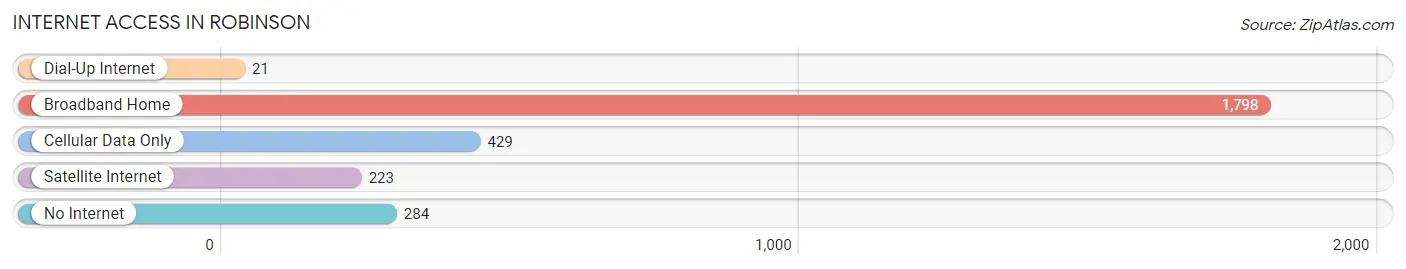
| Internet Type | # Households | % Households |
| Dial-Up Internet | 21 | 0.8% |
| Broadband Home | 1,798 | 69.2% |
| Cellular Data Only | 429 | 16.5% |
| Satellite Internet | 223 | 8.6% |
| No Internet | 284 | 10.9% |
| Total | 2,600 | 100.0% |
Robinson Summary
Robinson, Illinois is a small city located in Crawford County, Illinois. It is situated in the eastern part of the state, about 50 miles south of Champaign and about 100 miles east of St. Louis, Missouri. The city has a population of approximately 8,000 people and is the county seat of Crawford County.
History
Robinson was founded in 1817 by William Robinson, a Revolutionary War veteran. The city was originally known as Robinson's Station, and was a stop on the Vincennes Trace, a major trading route between the Ohio River and the Mississippi River. The city was incorporated in 1839 and was named after its founder.
In the late 19th century, Robinson was a major center for coal mining. The city was home to several coal mines, and the coal industry was the main source of employment for the city's residents. The coal industry declined in the early 20th century, and the city's economy shifted to agriculture and manufacturing.
Geography
Robinson is located in the eastern part of Illinois, in the Wabash Valley region. The city is situated on the banks of the Wabash River, and is surrounded by rolling hills and farmland. The city is located about 50 miles south of Champaign and about 100 miles east of St. Louis, Missouri.
The climate in Robinson is humid continental, with hot summers and cold winters. The average annual temperature is around 50 degrees Fahrenheit, and the average annual precipitation is around 40 inches.
Economy
Robinson's economy is largely based on agriculture and manufacturing. The city is home to several manufacturing companies, including a paper mill, a plastics factory, and a metal fabrication plant. Agriculture is also an important part of the local economy, with corn, soybeans, and wheat being the main crops.
Robinson is also home to several retail stores, restaurants, and other businesses. The city is served by two hospitals, a community college, and a public library.
Demographics
As of the 2010 census, Robinson had a population of 8,000 people. The racial makeup of the city was 95.3% White, 1.2% African American, 0.7% Native American, 0.4% Asian, 0.1% Pacific Islander, and 1.3% from other races. Hispanic or Latino of any race were 2.2% of the population.
The median household income in Robinson was $37,000, and the median family income was $45,000. The per capita income was $19,000. About 15.5% of the population was below the poverty line.
Robinson is served by the Crawford County School District, which includes two elementary schools, one middle school, and one high school. The city is also home to a branch of the University of Illinois.
Common Questions
What is Per Capita Income in Robinson?
Per Capita income in Robinson is $28,249.
What is the Median Family Income in Robinson?
Median Family Income in Robinson is $77,750.
What is the Median Household income in Robinson?
Median Household Income in Robinson is $57,500.
What is Income or Wage Gap in Robinson?
Income or Wage Gap in Robinson is 18.5%.
Women in Robinson earn 81.5 cents for every dollar earned by a man.
What is Inequality or Gini Index in Robinson?
Inequality or Gini Index in Robinson is 0.41.
What is the Total Population of Robinson?
Total Population of Robinson is 7,089.
What is the Total Male Population of Robinson?
Total Male Population of Robinson is 4,226.
What is the Total Female Population of Robinson?
Total Female Population of Robinson is 2,863.
What is the Ratio of Males per 100 Females in Robinson?
There are 147.61 Males per 100 Females in Robinson.
What is the Ratio of Females per 100 Males in Robinson?
There are 67.75 Females per 100 Males in Robinson.
What is the Median Population Age in Robinson?
Median Population Age in Robinson is 39.9 Years.
What is the Average Family Size in Robinson
Average Family Size in Robinson is 2.7 People.
What is the Average Household Size in Robinson
Average Household Size in Robinson is 2.1 People.
How Large is the Labor Force in Robinson?
There are 2,995 People in the Labor Forcein in Robinson.
What is the Percentage of People in the Labor Force in Robinson?
49.8% of People are in the Labor Force in Robinson.
What is the Unemployment Rate in Robinson?
Unemployment Rate in Robinson is 5.1%.