Shorewood, IL Map & Demographics
Shorewood Map
Shorewood Overview
$47,739
PER CAPITA INCOME
$138,500
AVG FAMILY INCOME
$119,904
AVG HOUSEHOLD INCOME
41.2%
WAGE / INCOME GAP [ % ]
58.8¢/ $1
WAGE / INCOME GAP [ $ ]
$10,204
FAMILY INCOME DEFICIT
0.37
INEQUALITY / GINI INDEX
18,109
TOTAL POPULATION
9,342
MALE POPULATION
8,767
FEMALE POPULATION
106.56
MALES / 100 FEMALES
93.85
FEMALES / 100 MALES
42.6
MEDIAN AGE
3.3
AVG FAMILY SIZE
2.8
AVG HOUSEHOLD SIZE
8,883
LABOR FORCE [ PEOPLE ]
61.0%
PERCENT IN LABOR FORCE
4.9%
UNEMPLOYMENT RATE
Shorewood Zip Codes
Income in Shorewood
Income Overview in Shorewood
Per Capita Income in Shorewood is $47,739, while median incomes of families and households are $138,500 and $119,904 respectively.
| Characteristic | Number | Measure |
| Per Capita Income | 18,109 | $47,739 |
| Median Family Income | 4,786 | $138,500 |
| Mean Family Income | 4,786 | $149,176 |
| Median Household Income | 6,359 | $119,904 |
| Mean Household Income | 6,359 | $132,926 |
| Income Deficit | 4,786 | $10,204 |
| Wage / Income Gap (%) | 18,109 | 41.22% |
| Wage / Income Gap ($) | 18,109 | 58.78¢ per $1 |
| Gini / Inequality Index | 18,109 | 0.37 |
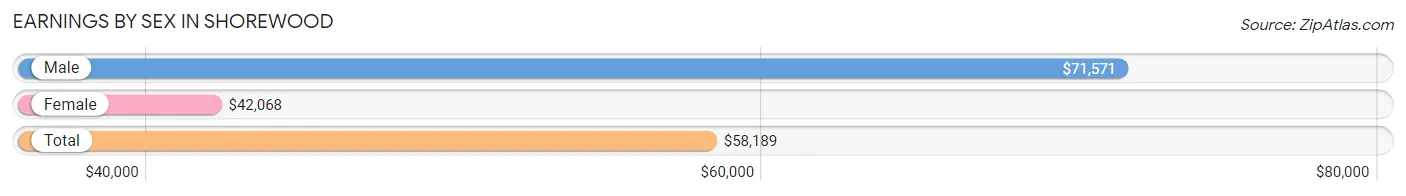
Earnings by Sex in Shorewood
Average Earnings in Shorewood are $58,189, $71,571 for men and $42,068 for women, a difference of 41.2%.
| Sex | Number | Average Earnings |
| Male | 5,273 (55.3%) | $71,571 |
| Female | 4,257 (44.7%) | $42,068 |
| Total | 9,530 (100.0%) | $58,189 |
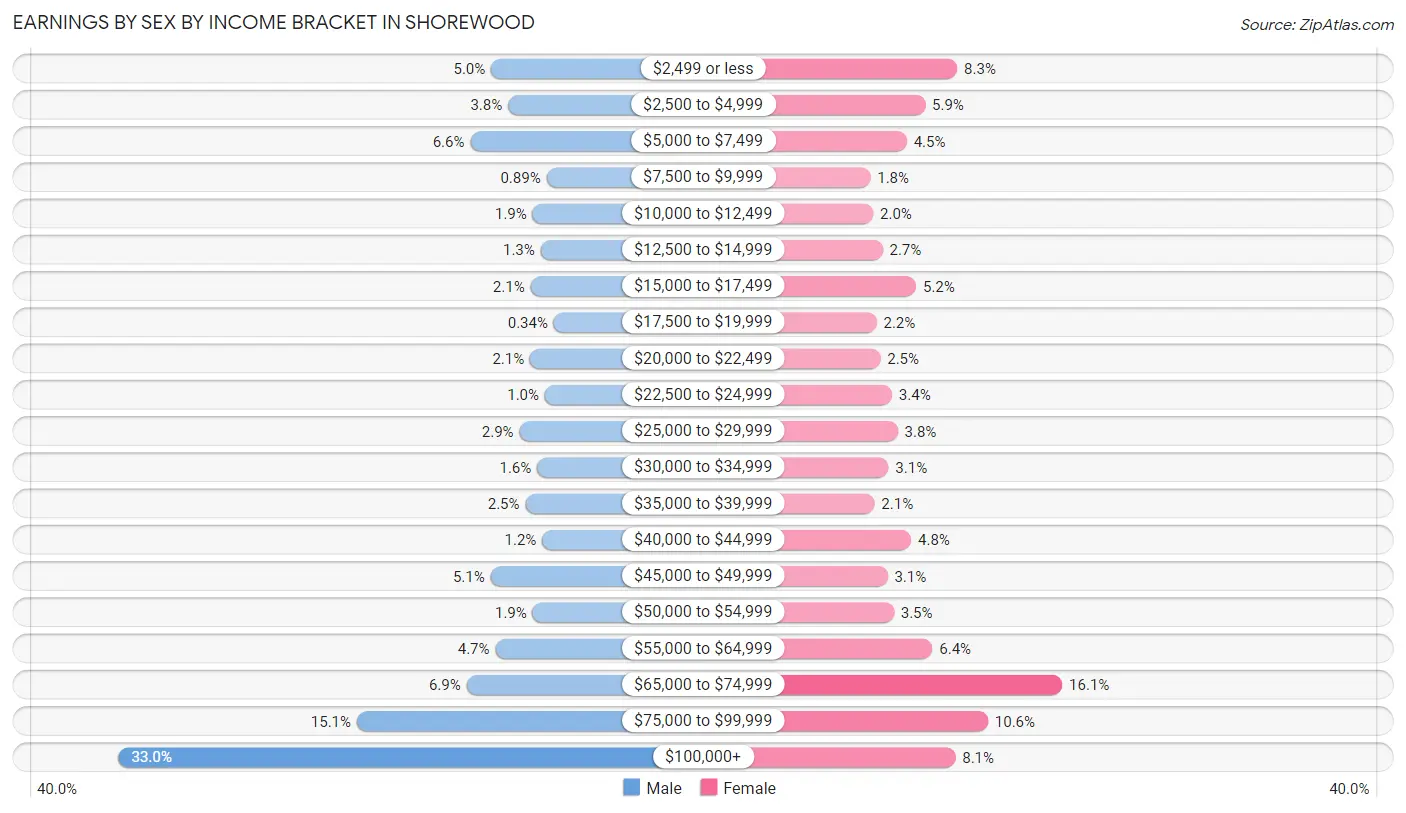
Earnings by Sex by Income Bracket in Shorewood
The most common earnings brackets in Shorewood are $100,000+ for men (1,738 | 33.0%) and $65,000 to $74,999 for women (687 | 16.1%).
| Income | Male | Female |
| $2,499 or less | 266 (5.0%) | 352 (8.3%) |
| $2,500 to $4,999 | 199 (3.8%) | 250 (5.9%) |
| $5,000 to $7,499 | 348 (6.6%) | 191 (4.5%) |
| $7,500 to $9,999 | 47 (0.9%) | 75 (1.8%) |
| $10,000 to $12,499 | 102 (1.9%) | 84 (2.0%) |
| $12,500 to $14,999 | 70 (1.3%) | 114 (2.7%) |
| $15,000 to $17,499 | 110 (2.1%) | 221 (5.2%) |
| $17,500 to $19,999 | 18 (0.3%) | 95 (2.2%) |
| $20,000 to $22,499 | 112 (2.1%) | 107 (2.5%) |
| $22,500 to $24,999 | 53 (1.0%) | 144 (3.4%) |
| $25,000 to $29,999 | 154 (2.9%) | 162 (3.8%) |
| $30,000 to $34,999 | 84 (1.6%) | 133 (3.1%) |
| $35,000 to $39,999 | 130 (2.5%) | 88 (2.1%) |
| $40,000 to $44,999 | 64 (1.2%) | 205 (4.8%) |
| $45,000 to $49,999 | 268 (5.1%) | 130 (3.0%) |
| $50,000 to $54,999 | 102 (1.9%) | 150 (3.5%) |
| $55,000 to $64,999 | 249 (4.7%) | 273 (6.4%) |
| $65,000 to $74,999 | 363 (6.9%) | 687 (16.1%) |
| $75,000 to $99,999 | 796 (15.1%) | 450 (10.6%) |
| $100,000+ | 1,738 (33.0%) | 346 (8.1%) |
| Total | 5,273 (100.0%) | 4,257 (100.0%) |
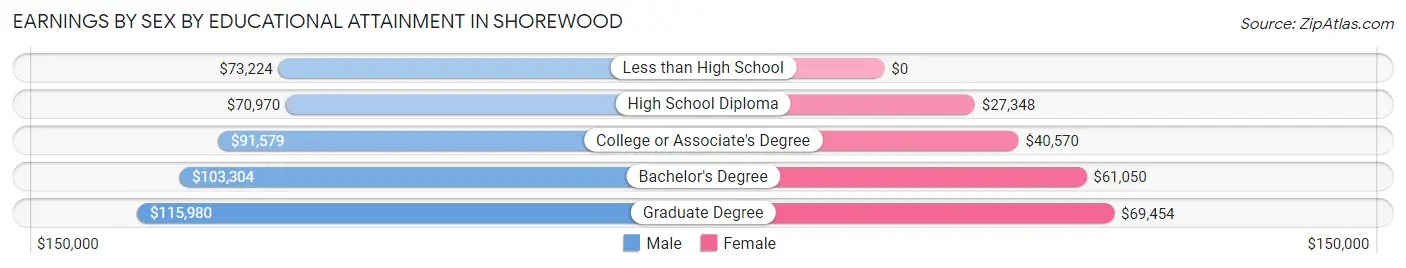
Earnings by Sex by Educational Attainment in Shorewood
Average earnings in Shorewood are $91,135 for men and $49,434 for women, a difference of 45.8%. Men with an educational attainment of graduate degree enjoy the highest average annual earnings of $115,980, while those with high school diploma education earn the least with $70,970. Women with an educational attainment of graduate degree earn the most with the average annual earnings of $69,454, while those with high school diploma education have the smallest earnings of $27,348.
| Educational Attainment | Male Income | Female Income |
| Less than High School | $73,224 | $0 |
| High School Diploma | $70,970 | $27,348 |
| College or Associate's Degree | $91,579 | $40,570 |
| Bachelor's Degree | $103,304 | $61,050 |
| Graduate Degree | $115,980 | $69,454 |
| Total | $91,135 | $49,434 |
Family Income in Shorewood
Family Income Brackets in Shorewood
According to the Shorewood family income data, there are 1,283 families falling into the $150,000 to $199,999 income range, which is the most common income bracket and makes up 26.8% of all families. Conversely, the less than $10,000 income bracket is the least frequent group with only 38 families (0.8%) belonging to this category.
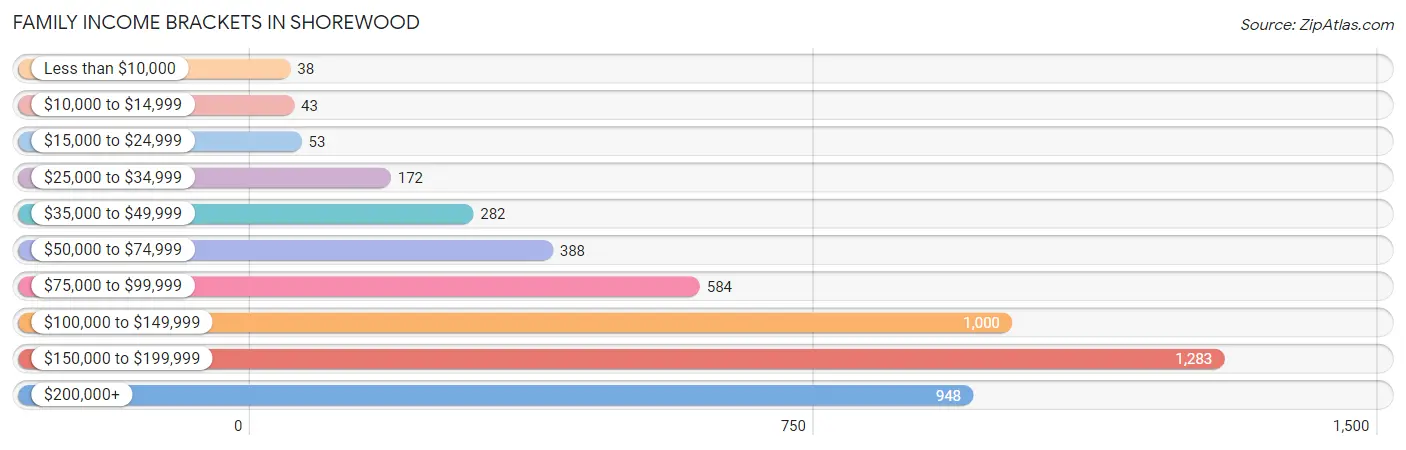
| Income Bracket | # Families | % Families |
| Less than $10,000 | 38 | 0.8% |
| $10,000 to $14,999 | 43 | 0.9% |
| $15,000 to $24,999 | 53 | 1.1% |
| $25,000 to $34,999 | 172 | 3.6% |
| $35,000 to $49,999 | 282 | 5.9% |
| $50,000 to $74,999 | 388 | 8.1% |
| $75,000 to $99,999 | 584 | 12.2% |
| $100,000 to $149,999 | 1,000 | 20.9% |
| $150,000 to $199,999 | 1,283 | 26.8% |
| $200,000+ | 948 | 19.8% |
Family Income by Famaliy Size in Shorewood
6-person families (165 | 3.5%) account for the highest median family income in Shorewood with $171,307 per family, while 2-person families (2,254 | 47.1%) have the highest median income of $55,964 per family member.
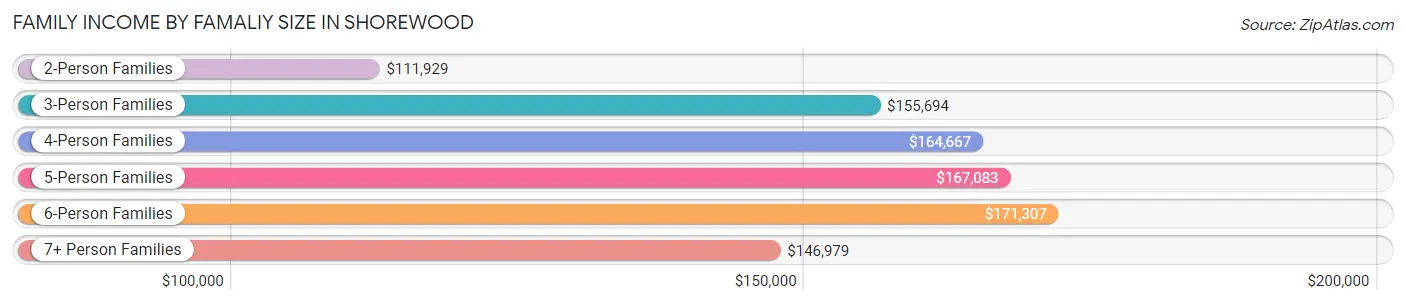
| Income Bracket | # Families | Median Income |
| 2-Person Families | 2,254 (47.1%) | $111,929 |
| 3-Person Families | 882 (18.4%) | $155,694 |
| 4-Person Families | 758 (15.8%) | $164,667 |
| 5-Person Families | 625 (13.1%) | $167,083 |
| 6-Person Families | 165 (3.5%) | $171,307 |
| 7+ Person Families | 102 (2.1%) | $146,979 |
| Total | 4,786 (100.0%) | $138,500 |
Family Income by Number of Earners in Shorewood
The median family income in Shorewood is $138,500, with families comprising 3+ earners (1,031) having the highest median family income of $182,176, while families with no earners (1,015) have the lowest median family income of $75,063, accounting for 21.5% and 21.2% of families, respectively.
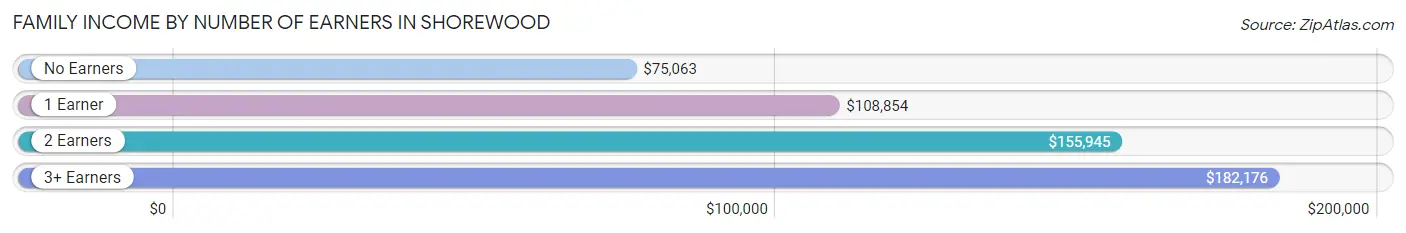
| Number of Earners | # Families | Median Income |
| No Earners | 1,015 (21.2%) | $75,063 |
| 1 Earner | 1,101 (23.0%) | $108,854 |
| 2 Earners | 1,639 (34.3%) | $155,945 |
| 3+ Earners | 1,031 (21.5%) | $182,176 |
| Total | 4,786 (100.0%) | $138,500 |
Household Income in Shorewood
Household Income Brackets in Shorewood
With 1,374 households falling in the category, the $150,000 to $199,999 income range is the most frequent in Shorewood, accounting for 21.6% of all households. In contrast, only 57 households (0.9%) fall into the $10,000 to $14,999 income bracket, making it the least populous group.
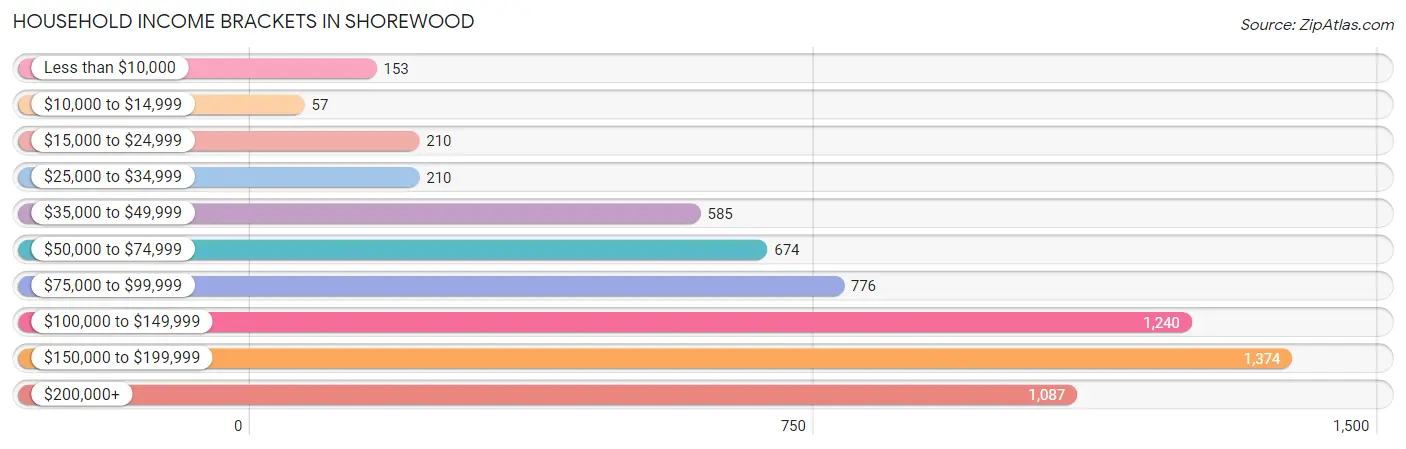
| Income Bracket | # Households | % Households |
| Less than $10,000 | 153 | 2.4% |
| $10,000 to $14,999 | 57 | 0.9% |
| $15,000 to $24,999 | 210 | 3.3% |
| $25,000 to $34,999 | 210 | 3.3% |
| $35,000 to $49,999 | 585 | 9.2% |
| $50,000 to $74,999 | 674 | 10.6% |
| $75,000 to $99,999 | 776 | 12.2% |
| $100,000 to $149,999 | 1,240 | 19.5% |
| $150,000 to $199,999 | 1,374 | 21.6% |
| $200,000+ | 1,087 | 17.1% |
Household Income by Householder Age in Shorewood
The median household income in Shorewood is $119,904, with the highest median household income of $153,224 found in the 45 to 64 years age bracket for the primary householder. A total of 2,519 households (39.6%) fall into this category.
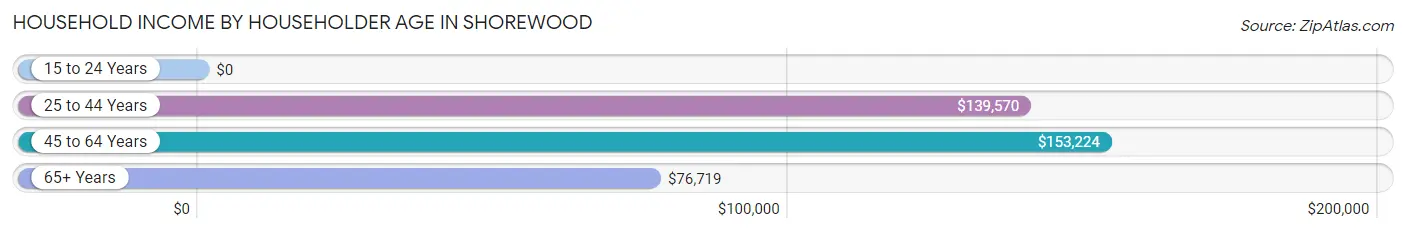
| Income Bracket | # Households | Median Income |
| 15 to 24 Years | 0 (0.0%) | $0 |
| 25 to 44 Years | 1,563 (24.6%) | $139,570 |
| 45 to 64 Years | 2,519 (39.6%) | $153,224 |
| 65+ Years | 2,277 (35.8%) | $76,719 |
| Total | 6,359 (100.0%) | $119,904 |
Poverty in Shorewood
Income Below Poverty by Sex and Age in Shorewood
With 3.6% poverty level for males and 3.2% for females among the residents of Shorewood, 6 to 11 year old males and 75 year old and over females are the most vulnerable to poverty, with 30 males (6.1%) and 69 females (8.3%) in their respective age groups living below the poverty level.
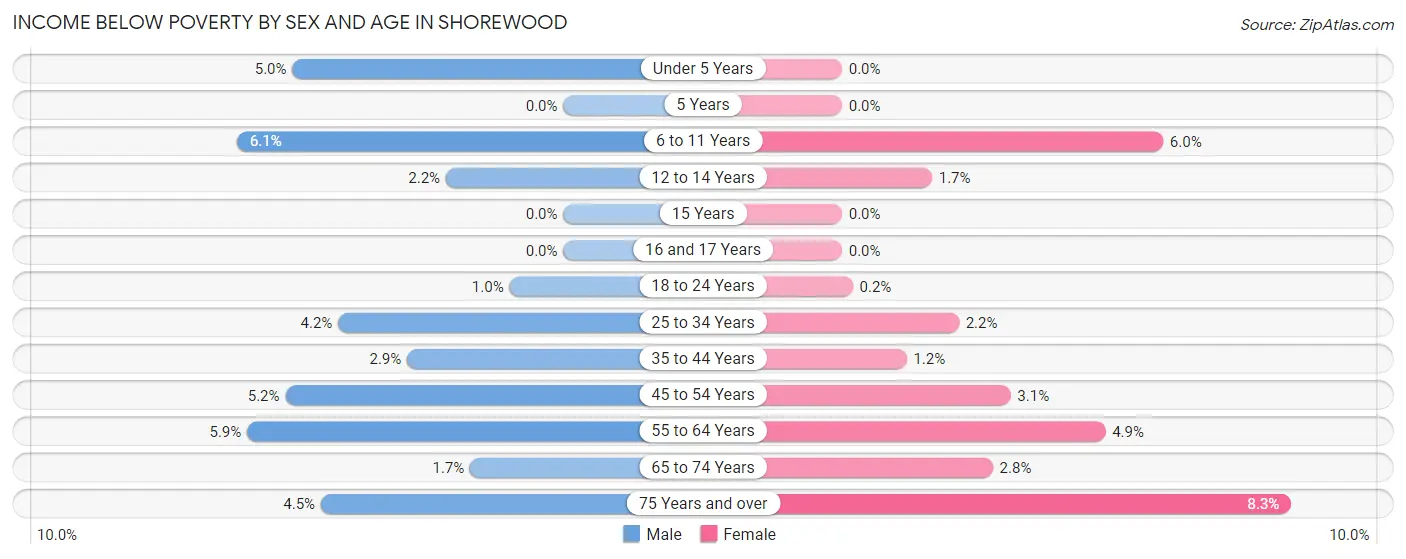
| Age Bracket | Male | Female |
| Under 5 Years | 26 (5.0%) | 0 (0.0%) |
| 5 Years | 0 (0.0%) | 0 (0.0%) |
| 6 to 11 Years | 30 (6.1%) | 43 (6.0%) |
| 12 to 14 Years | 14 (2.2%) | 5 (1.7%) |
| 15 Years | 0 (0.0%) | 0 (0.0%) |
| 16 and 17 Years | 0 (0.0%) | 0 (0.0%) |
| 18 to 24 Years | 9 (1.0%) | 1 (0.2%) |
| 25 to 34 Years | 41 (4.2%) | 18 (2.2%) |
| 35 to 44 Years | 30 (2.9%) | 16 (1.2%) |
| 45 to 54 Years | 64 (5.2%) | 34 (3.1%) |
| 55 to 64 Years | 67 (5.9%) | 56 (4.9%) |
| 65 to 74 Years | 19 (1.7%) | 35 (2.8%) |
| 75 Years and over | 31 (4.5%) | 69 (8.3%) |
| Total | 331 (3.6%) | 277 (3.2%) |
Income Above Poverty by Sex and Age in Shorewood
According to the poverty statistics in Shorewood, males aged 5 years and females aged under 5 years are the age groups that are most secure financially, with 100.0% of males and 100.0% of females in these age groups living above the poverty line.
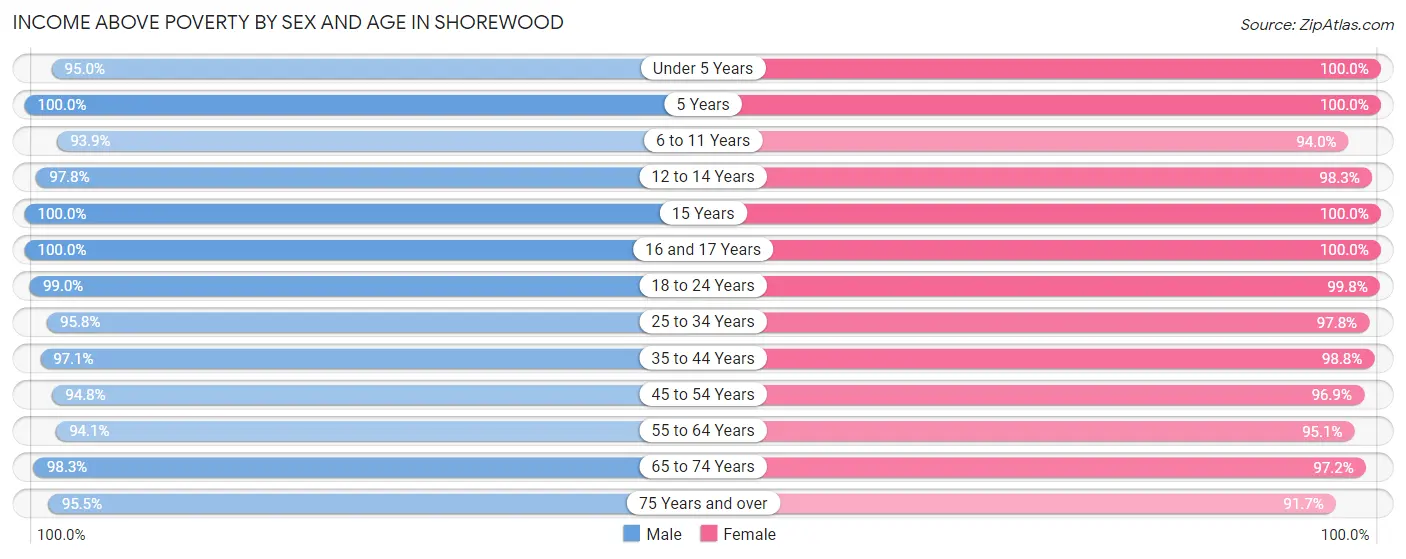
| Age Bracket | Male | Female |
| Under 5 Years | 491 (95.0%) | 231 (100.0%) |
| 5 Years | 78 (100.0%) | 83 (100.0%) |
| 6 to 11 Years | 465 (93.9%) | 679 (94.0%) |
| 12 to 14 Years | 627 (97.8%) | 294 (98.3%) |
| 15 Years | 161 (100.0%) | 196 (100.0%) |
| 16 and 17 Years | 297 (100.0%) | 191 (100.0%) |
| 18 to 24 Years | 895 (99.0%) | 498 (99.8%) |
| 25 to 34 Years | 940 (95.8%) | 812 (97.8%) |
| 35 to 44 Years | 1,006 (97.1%) | 1,313 (98.8%) |
| 45 to 54 Years | 1,177 (94.8%) | 1,053 (96.9%) |
| 55 to 64 Years | 1,075 (94.1%) | 1,090 (95.1%) |
| 65 to 74 Years | 1,081 (98.3%) | 1,214 (97.2%) |
| 75 Years and over | 658 (95.5%) | 758 (91.7%) |
| Total | 8,951 (96.4%) | 8,412 (96.8%) |
Income Below Poverty Among Married-Couple Families in Shorewood
The poverty statistics for married-couple families in Shorewood show that 1.6% or 69 of the total 4,248 families live below the poverty line. Families with 3 or 4 children have the highest poverty rate of 5.8%, comprising of 16 families. On the other hand, families with 5 or more children have the lowest poverty rate of 0.0%, which includes 0 families.
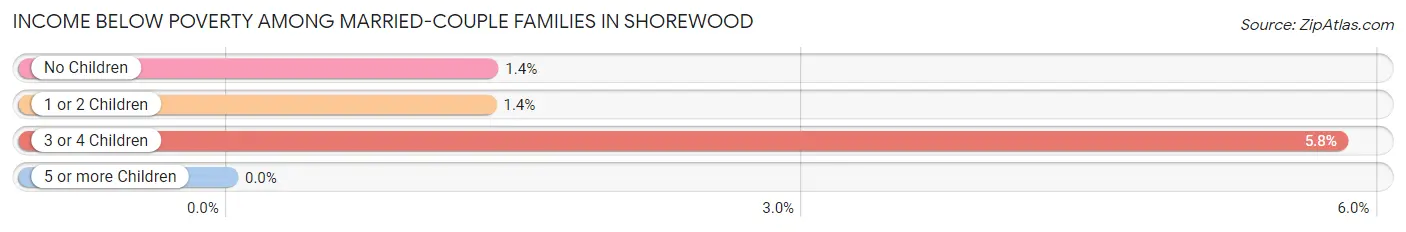
| Children | Above Poverty | Below Poverty |
| No Children | 2,543 (98.6%) | 35 (1.4%) |
| 1 or 2 Children | 1,319 (98.7%) | 18 (1.3%) |
| 3 or 4 Children | 260 (94.2%) | 16 (5.8%) |
| 5 or more Children | 57 (100.0%) | 0 (0.0%) |
| Total | 4,179 (98.4%) | 69 (1.6%) |
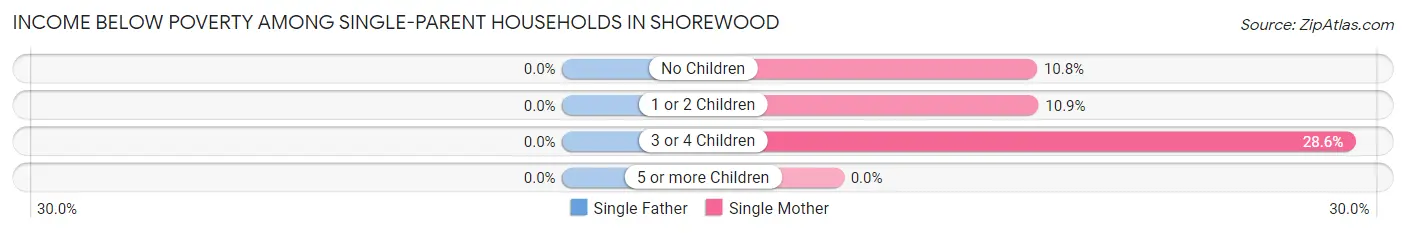
Income Below Poverty Among Single-Parent Households in Shorewood
| Children | Single Father | Single Mother |
| No Children | 0 (0.0%) | 23 (10.8%) |
| 1 or 2 Children | 0 (0.0%) | 16 (10.9%) |
| 3 or 4 Children | 0 (0.0%) | 10 (28.6%) |
| 5 or more Children | 0 (0.0%) | 0 (0.0%) |
| Total | 0 (0.0%) | 49 (12.4%) |
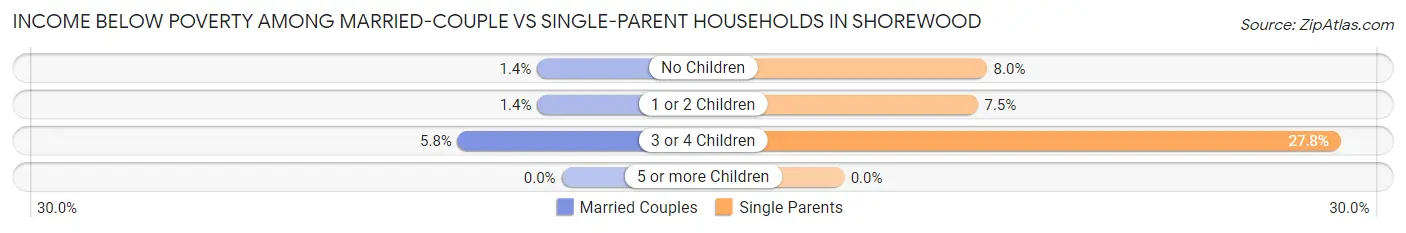
Income Below Poverty Among Married-Couple vs Single-Parent Households in Shorewood
The poverty data for Shorewood shows that 69 of the married-couple family households (1.6%) and 49 of the single-parent households (9.1%) are living below the poverty level. Within the married-couple family households, those with 3 or 4 children have the highest poverty rate, with 16 households (5.8%) falling below the poverty line. Among the single-parent households, those with 3 or 4 children have the highest poverty rate, with 10 household (27.8%) living below poverty.
| Children | Married-Couple Families | Single-Parent Households |
| No Children | 35 (1.4%) | 23 (8.0%) |
| 1 or 2 Children | 18 (1.3%) | 16 (7.5%) |
| 3 or 4 Children | 16 (5.8%) | 10 (27.8%) |
| 5 or more Children | 0 (0.0%) | 0 (0.0%) |
| Total | 69 (1.6%) | 49 (9.1%) |
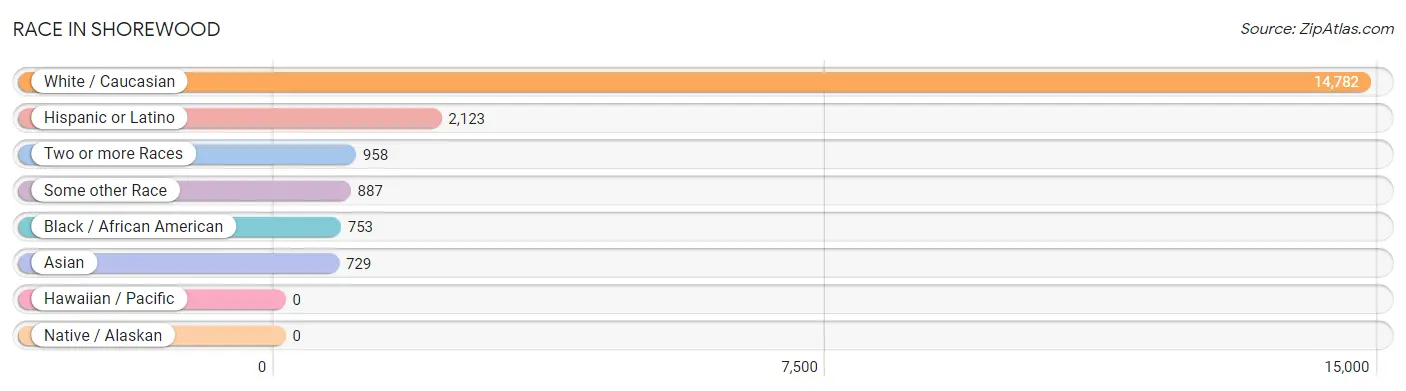
Race in Shorewood
The most populous races in Shorewood are White / Caucasian (14,782 | 81.6%), Hispanic or Latino (2,123 | 11.7%), and Two or more Races (958 | 5.3%).
| Race | # Population | % Population |
| Asian | 729 | 4.0% |
| Black / African American | 753 | 4.2% |
| Hawaiian / Pacific | 0 | 0.0% |
| Hispanic or Latino | 2,123 | 11.7% |
| Native / Alaskan | 0 | 0.0% |
| White / Caucasian | 14,782 | 81.6% |
| Two or more Races | 958 | 5.3% |
| Some other Race | 887 | 4.9% |
| Total | 18,109 | 100.0% |
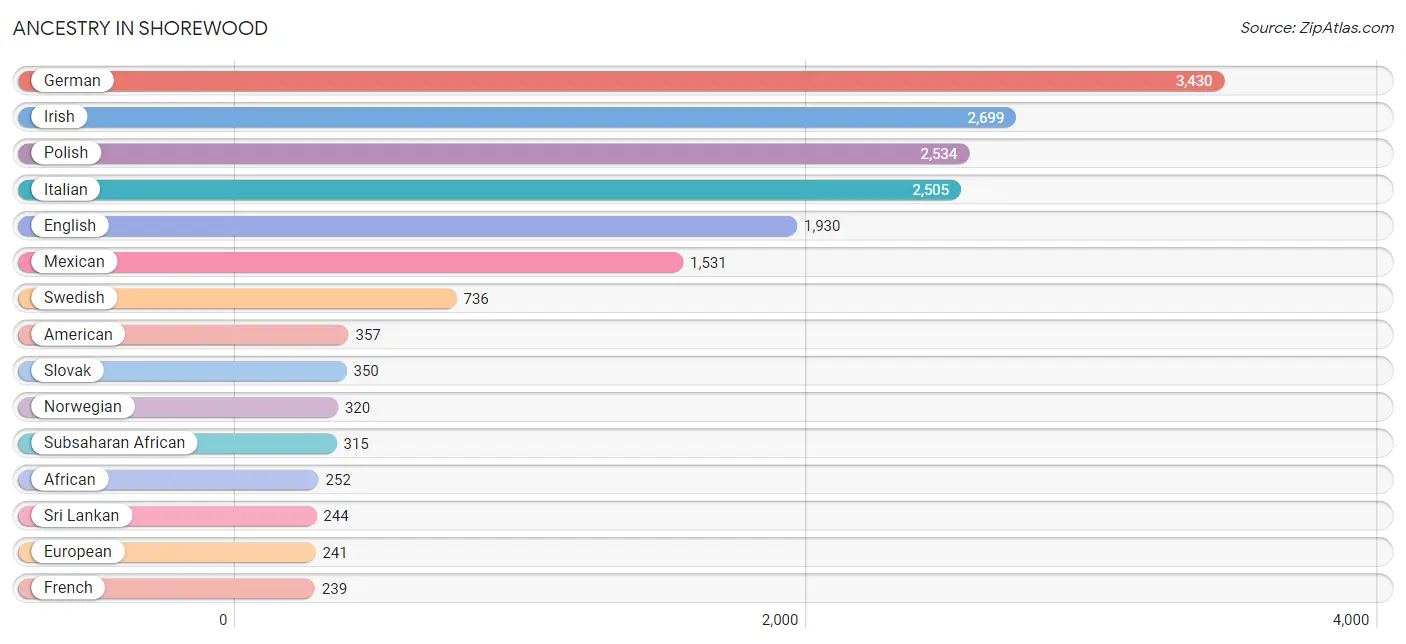
Ancestry in Shorewood
The most populous ancestries reported in Shorewood are German (3,430 | 18.9%), Irish (2,699 | 14.9%), Polish (2,534 | 14.0%), Italian (2,505 | 13.8%), and English (1,930 | 10.7%), together accounting for 72.3% of all Shorewood residents.
| Ancestry | # Population | % Population |
| African | 252 | 1.4% |
| American | 357 | 2.0% |
| Arab | 114 | 0.6% |
| Argentinean | 65 | 0.4% |
| Armenian | 1 | 0.0% |
| Australian | 23 | 0.1% |
| Austrian | 84 | 0.5% |
| Belgian | 33 | 0.2% |
| British | 74 | 0.4% |
| Burmese | 83 | 0.5% |
| Canadian | 9 | 0.1% |
| Central American | 46 | 0.3% |
| Cherokee | 1 | 0.0% |
| Colombian | 41 | 0.2% |
| Croatian | 115 | 0.6% |
| Czech | 166 | 0.9% |
| Czechoslovakian | 69 | 0.4% |
| Danish | 32 | 0.2% |
| Dutch | 193 | 1.1% |
| Eastern European | 23 | 0.1% |
| English | 1,930 | 10.7% |
| European | 241 | 1.3% |
| Finnish | 38 | 0.2% |
| French | 239 | 1.3% |
| French Canadian | 63 | 0.4% |
| German | 3,430 | 18.9% |
| Greek | 121 | 0.7% |
| Guatemalan | 26 | 0.1% |
| Hungarian | 125 | 0.7% |
| Indian (Asian) | 90 | 0.5% |
| Irish | 2,699 | 14.9% |
| Italian | 2,505 | 13.8% |
| Korean | 152 | 0.8% |
| Lithuanian | 111 | 0.6% |
| Malaysian | 29 | 0.2% |
| Mexican | 1,531 | 8.5% |
| Norwegian | 320 | 1.8% |
| Palestinian | 10 | 0.1% |
| Polish | 2,534 | 14.0% |
| Puerto Rican | 239 | 1.3% |
| Romanian | 19 | 0.1% |
| Russian | 71 | 0.4% |
| Salvadoran | 20 | 0.1% |
| Scandinavian | 17 | 0.1% |
| Scotch-Irish | 79 | 0.4% |
| Scottish | 82 | 0.4% |
| Slovak | 350 | 1.9% |
| Slovene | 151 | 0.8% |
| South American | 152 | 0.8% |
| Spaniard | 155 | 0.9% |
| Sri Lankan | 244 | 1.3% |
| Subsaharan African | 315 | 1.7% |
| Swedish | 736 | 4.1% |
| Swiss | 20 | 0.1% |
| Syrian | 94 | 0.5% |
| Thai | 108 | 0.6% |
| Ukrainian | 45 | 0.3% |
| Venezuelan | 46 | 0.3% |
| Welsh | 114 | 0.6% | View All 59 Rows |
Immigrants in Shorewood
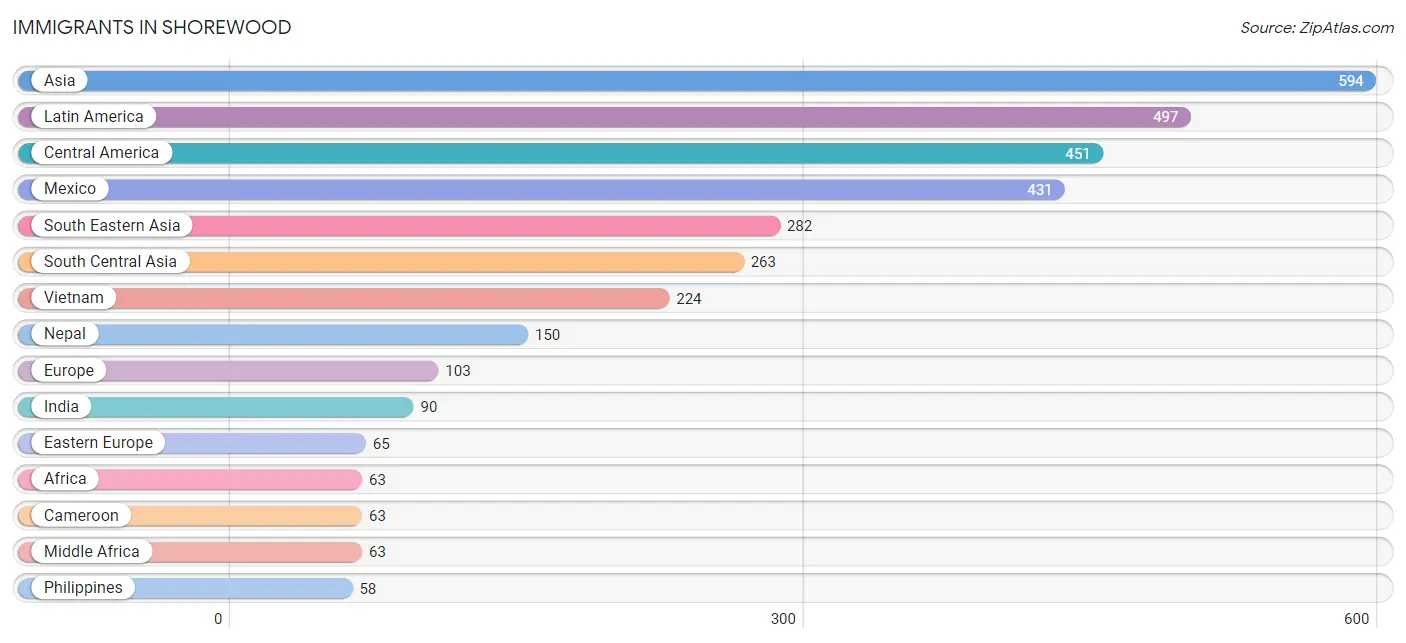
The most numerous immigrant groups reported in Shorewood came from Asia (594 | 3.3%), Latin America (497 | 2.7%), Central America (451 | 2.5%), Mexico (431 | 2.4%), and South Eastern Asia (282 | 1.6%), together accounting for 12.5% of all Shorewood residents.
| Immigration Origin | # Population | % Population |
| Africa | 63 | 0.4% |
| Asia | 594 | 3.3% |
| Austria | 15 | 0.1% |
| Belize | 20 | 0.1% |
| Cameroon | 63 | 0.4% |
| Canada | 9 | 0.1% |
| Central America | 451 | 2.5% |
| China | 10 | 0.1% |
| Eastern Asia | 29 | 0.2% |
| Eastern Europe | 65 | 0.4% |
| England | 4 | 0.0% |
| Europe | 103 | 0.6% |
| Germany | 1 | 0.0% |
| India | 90 | 0.5% |
| Iran | 23 | 0.1% |
| Jordan | 20 | 0.1% |
| Korea | 19 | 0.1% |
| Latin America | 497 | 2.7% |
| Lithuania | 22 | 0.1% |
| Mexico | 431 | 2.4% |
| Middle Africa | 63 | 0.4% |
| Moldova | 19 | 0.1% |
| Nepal | 150 | 0.8% |
| Northern Europe | 4 | 0.0% |
| Philippines | 58 | 0.3% |
| Poland | 24 | 0.1% |
| South America | 46 | 0.3% |
| South Central Asia | 263 | 1.5% |
| South Eastern Asia | 282 | 1.6% |
| Venezuela | 46 | 0.3% |
| Vietnam | 224 | 1.2% |
| Western Asia | 20 | 0.1% |
| Western Europe | 16 | 0.1% | View All 33 Rows |
Sex and Age in Shorewood
Sex and Age in Shorewood
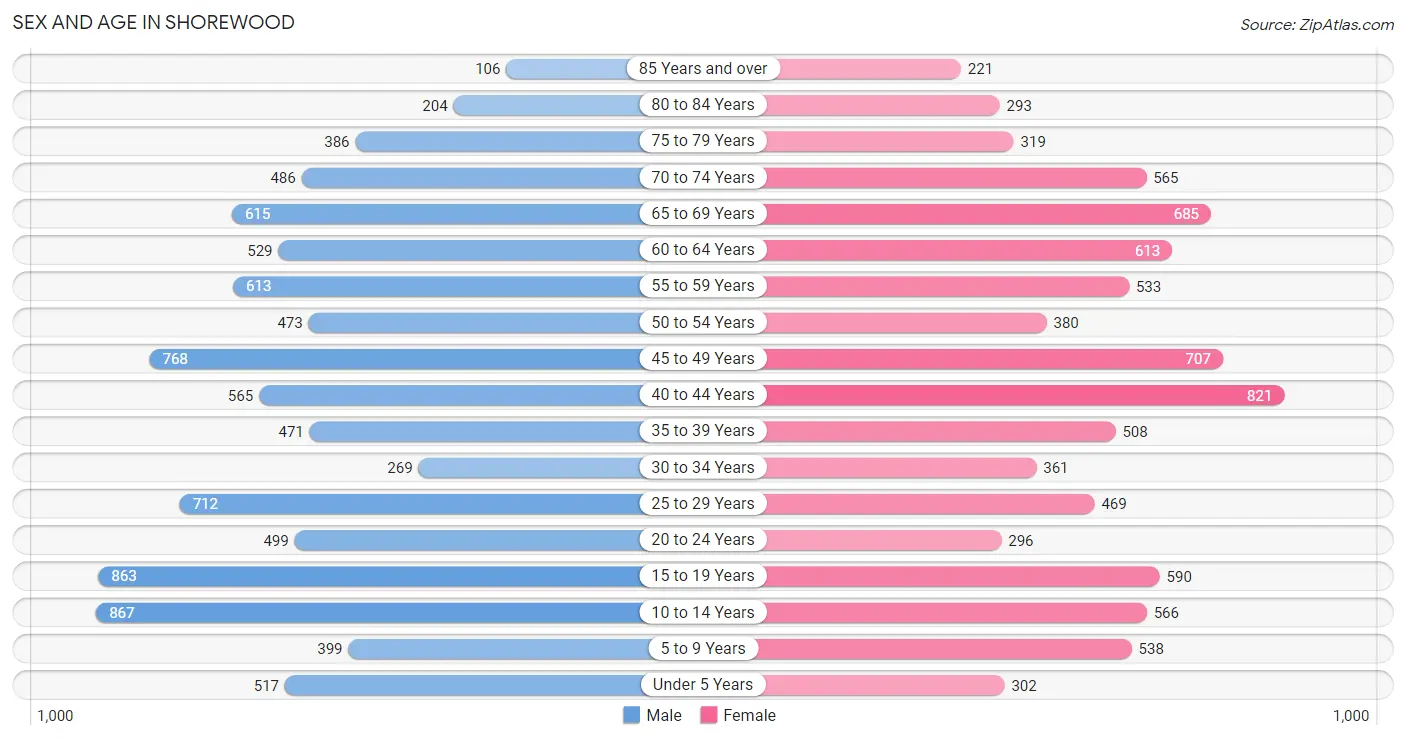
The most populous age groups in Shorewood are 10 to 14 Years (867 | 9.3%) for men and 40 to 44 Years (821 | 9.4%) for women.
| Age Bracket | Male | Female |
| Under 5 Years | 517 (5.5%) | 302 (3.4%) |
| 5 to 9 Years | 399 (4.3%) | 538 (6.1%) |
| 10 to 14 Years | 867 (9.3%) | 566 (6.5%) |
| 15 to 19 Years | 863 (9.2%) | 590 (6.7%) |
| 20 to 24 Years | 499 (5.3%) | 296 (3.4%) |
| 25 to 29 Years | 712 (7.6%) | 469 (5.3%) |
| 30 to 34 Years | 269 (2.9%) | 361 (4.1%) |
| 35 to 39 Years | 471 (5.0%) | 508 (5.8%) |
| 40 to 44 Years | 565 (6.0%) | 821 (9.4%) |
| 45 to 49 Years | 768 (8.2%) | 707 (8.1%) |
| 50 to 54 Years | 473 (5.1%) | 380 (4.3%) |
| 55 to 59 Years | 613 (6.6%) | 533 (6.1%) |
| 60 to 64 Years | 529 (5.7%) | 613 (7.0%) |
| 65 to 69 Years | 615 (6.6%) | 685 (7.8%) |
| 70 to 74 Years | 486 (5.2%) | 565 (6.4%) |
| 75 to 79 Years | 386 (4.1%) | 319 (3.6%) |
| 80 to 84 Years | 204 (2.2%) | 293 (3.3%) |
| 85 Years and over | 106 (1.1%) | 221 (2.5%) |
| Total | 9,342 (100.0%) | 8,767 (100.0%) |
Families and Households in Shorewood
Median Family Size in Shorewood
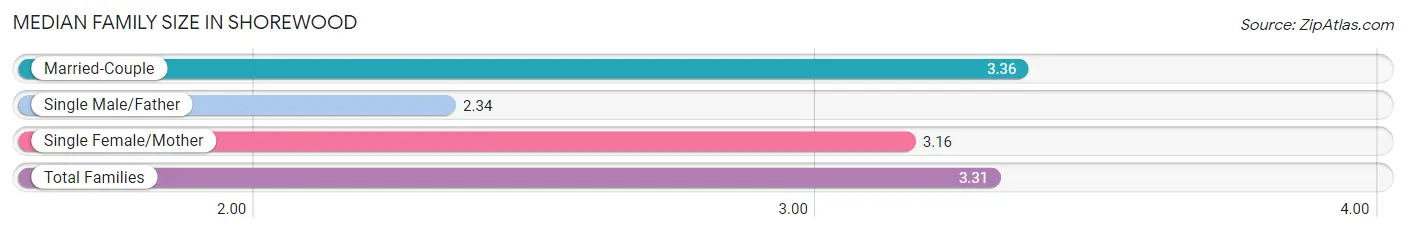
The median family size in Shorewood is 3.31 persons per family, with married-couple families (4,248 | 88.8%) accounting for the largest median family size of 3.36 persons per family. On the other hand, single male/father families (143 | 3.0%) represent the smallest median family size with 2.34 persons per family.
| Family Type | # Families | Family Size |
| Married-Couple | 4,248 (88.8%) | 3.36 |
| Single Male/Father | 143 (3.0%) | 2.34 |
| Single Female/Mother | 395 (8.3%) | 3.16 |
| Total Families | 4,786 (100.0%) | 3.31 |
Median Household Size in Shorewood
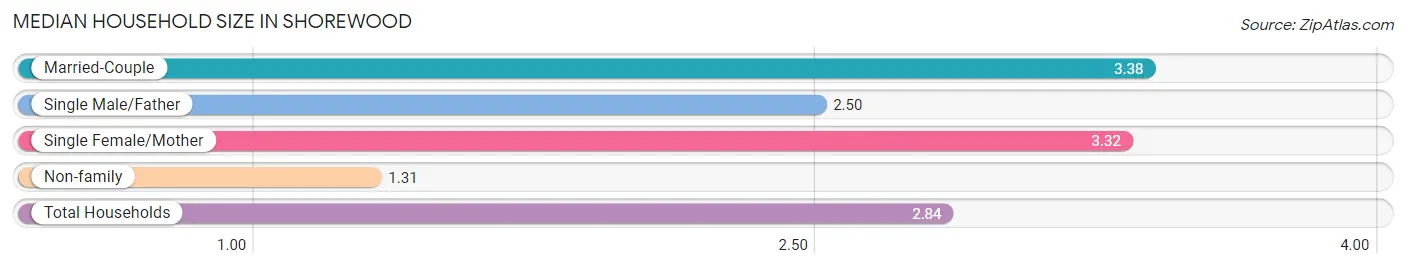
The median household size in Shorewood is 2.84 persons per household, with married-couple households (4,248 | 66.8%) accounting for the largest median household size of 3.38 persons per household. non-family households (1,573 | 24.7%) represent the smallest median household size with 1.31 persons per household.
| Household Type | # Households | Household Size |
| Married-Couple | 4,248 (66.8%) | 3.38 |
| Single Male/Father | 143 (2.2%) | 2.50 |
| Single Female/Mother | 395 (6.2%) | 3.32 |
| Non-family | 1,573 (24.7%) | 1.31 |
| Total Households | 6,359 (100.0%) | 2.84 |
Household Size by Marriage Status in Shorewood
Out of a total of 6,359 households in Shorewood, 4,786 (75.3%) are family households, while 1,573 (24.7%) are nonfamily households. The most numerous type of family households are 2-person households, comprising 2,212, and the most common type of nonfamily households are 1-person households, comprising 1,239.
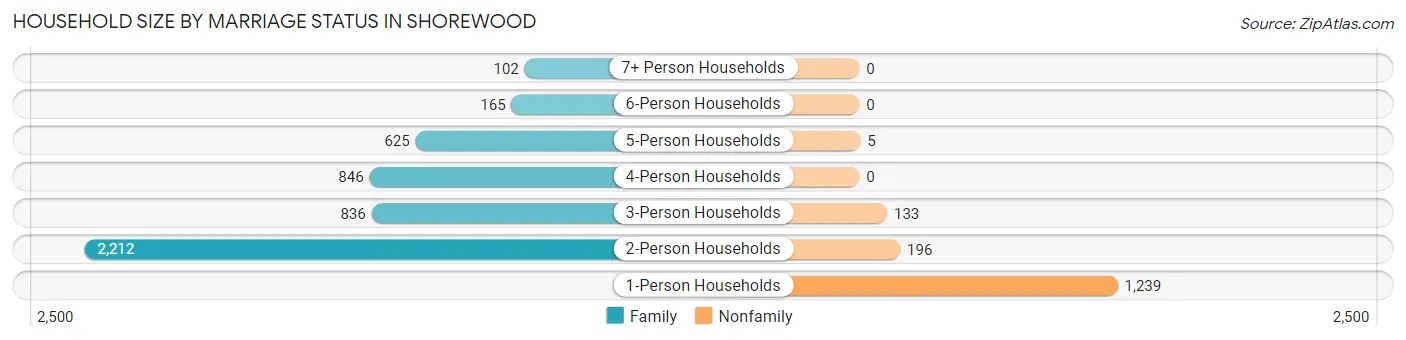
| Household Size | Family Households | Nonfamily Households |
| 1-Person Households | - | 1,239 (19.5%) |
| 2-Person Households | 2,212 (34.8%) | 196 (3.1%) |
| 3-Person Households | 836 (13.2%) | 133 (2.1%) |
| 4-Person Households | 846 (13.3%) | 0 (0.0%) |
| 5-Person Households | 625 (9.8%) | 5 (0.1%) |
| 6-Person Households | 165 (2.6%) | 0 (0.0%) |
| 7+ Person Households | 102 (1.6%) | 0 (0.0%) |
| Total | 4,786 (75.3%) | 1,573 (24.7%) |
Female Fertility in Shorewood
Fertility by Age in Shorewood
Average fertility rate in Shorewood is 22.0 births per 1,000 women. Women in the age bracket of 20 to 34 years have the highest fertility rate with 59.0 births per 1,000 women. Women in the age bracket of 20 to 34 years acount for 78.6% of all women with births.
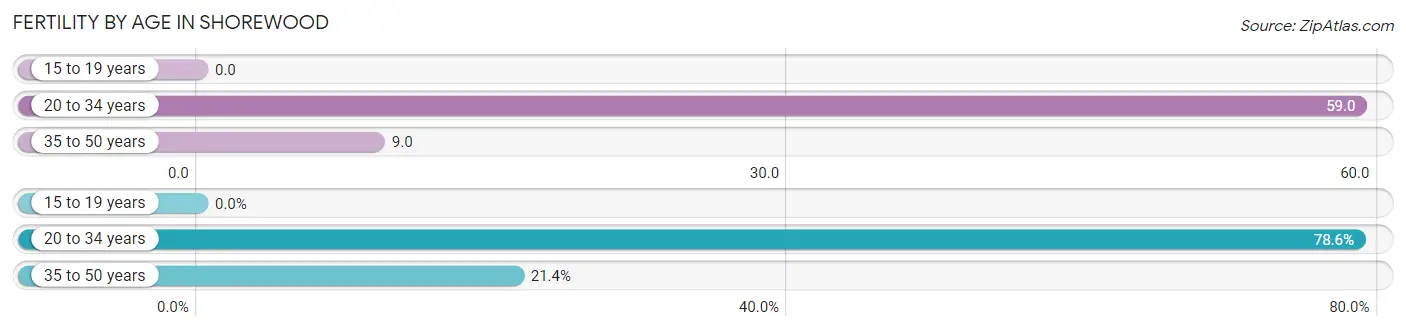
| Age Bracket | Women with Births | Births / 1,000 Women |
| 15 to 19 years | 0 (0.0%) | 0.0 |
| 20 to 34 years | 66 (78.6%) | 59.0 |
| 35 to 50 years | 18 (21.4%) | 9.0 |
| Total | 84 (100.0%) | 22.0 |
Fertility by Age by Marriage Status in Shorewood
94.0% of women with births (84) in Shorewood are married. The highest percentage of unmarried women with births falls into 20 to 34 years age bracket with 7.6% of them unmarried at the time of birth, while the lowest percentage of unmarried women with births belong to 35 to 50 years age bracket with 0.0% of them unmarried.
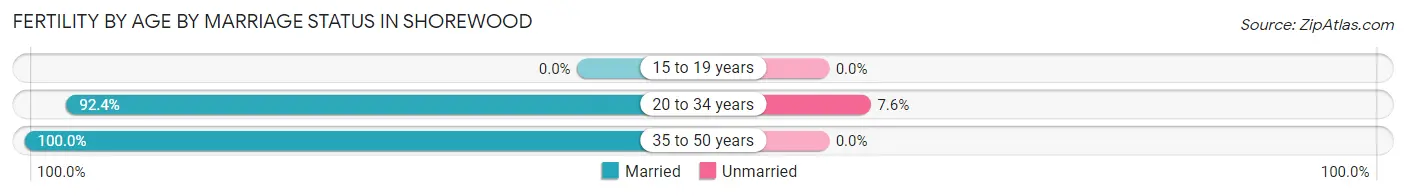
| Age Bracket | Married | Unmarried |
| 15 to 19 years | 0 (0.0%) | 0 (0.0%) |
| 20 to 34 years | 61 (92.4%) | 5 (7.6%) |
| 35 to 50 years | 18 (100.0%) | 0 (0.0%) |
| Total | 79 (94.1%) | 5 (5.9%) |
Fertility by Education in Shorewood
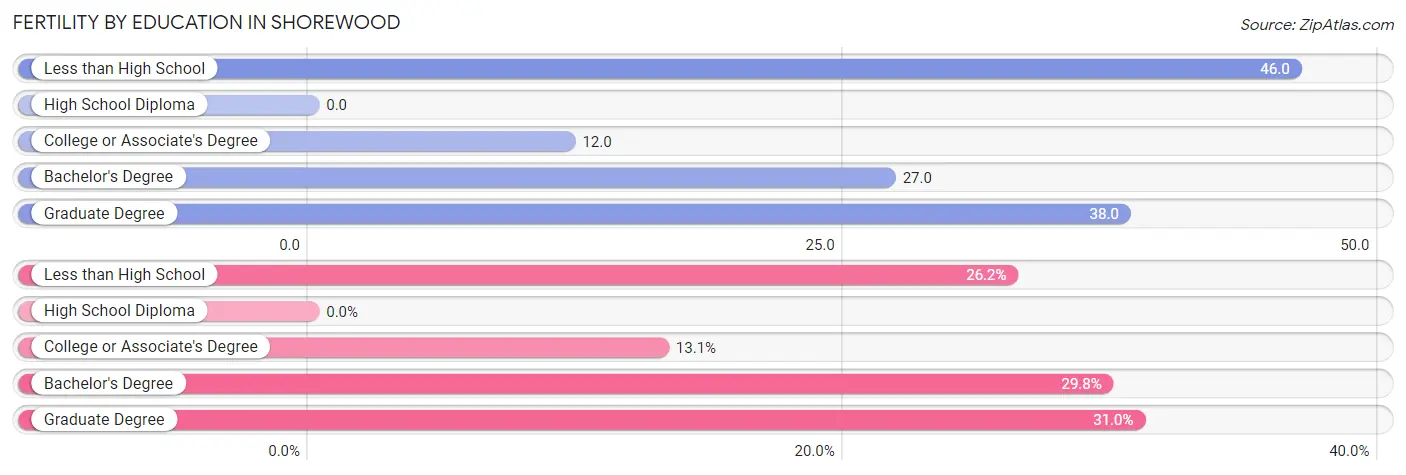
| Educational Attainment | Women with Births | Births / 1,000 Women |
| Less than High School | 22 (26.2%) | 46.0 |
| High School Diploma | 0 (0.0%) | 0.0 |
| College or Associate's Degree | 11 (13.1%) | 12.0 |
| Bachelor's Degree | 25 (29.8%) | 27.0 |
| Graduate Degree | 26 (30.9%) | 38.0 |
| Total | 84 (100.0%) | 22.0 |
Fertility by Education by Marriage Status in Shorewood
5.9% of women with births in Shorewood are unmarried. Women with the educational attainment of less than high school are most likely to be married with 100.0% of them married at childbirth, while women with the educational attainment of college or associate's degree are least likely to be married with 45.5% of them unmarried at childbirth.
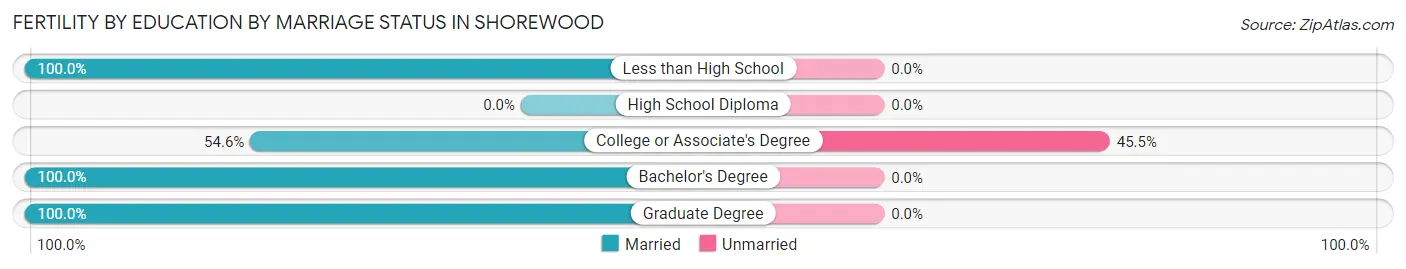
| Educational Attainment | Married | Unmarried |
| Less than High School | 22 (100.0%) | 0 (0.0%) |
| High School Diploma | 0 (0.0%) | 0 (0.0%) |
| College or Associate's Degree | 6 (54.5%) | 5 (45.5%) |
| Bachelor's Degree | 25 (100.0%) | 0 (0.0%) |
| Graduate Degree | 26 (100.0%) | 0 (0.0%) |
| Total | 79 (94.1%) | 5 (5.9%) |
Employment Characteristics in Shorewood
Employment by Class of Employer in Shorewood
Among the 8,359 employed individuals in Shorewood, private company employees (5,826 | 69.7%), local government employees (957 | 11.5%), and not-for-profit organizations (603 | 7.2%) make up the most common classes of employment.
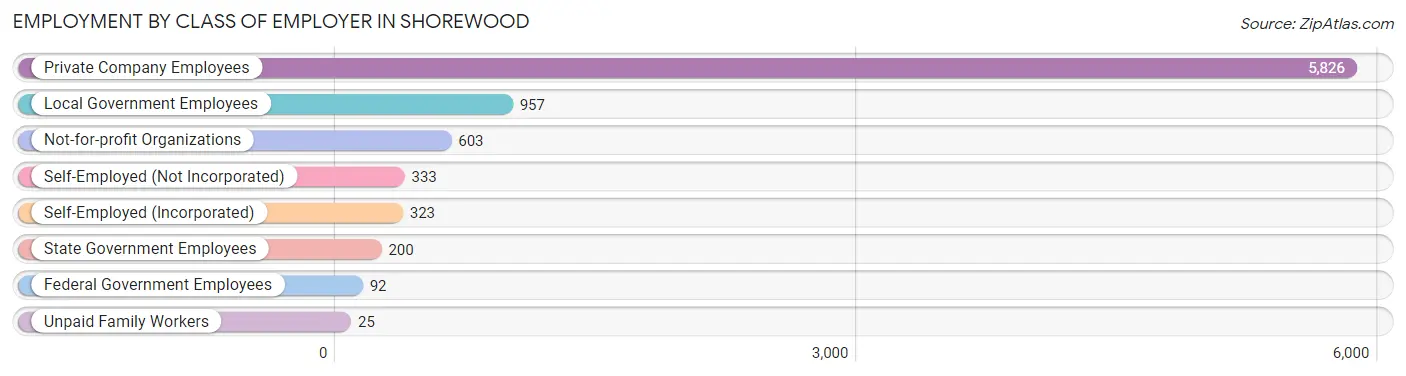
| Employer Class | # Employees | % Employees |
| Private Company Employees | 5,826 | 69.7% |
| Self-Employed (Incorporated) | 323 | 3.9% |
| Self-Employed (Not Incorporated) | 333 | 4.0% |
| Not-for-profit Organizations | 603 | 7.2% |
| Local Government Employees | 957 | 11.5% |
| State Government Employees | 200 | 2.4% |
| Federal Government Employees | 92 | 1.1% |
| Unpaid Family Workers | 25 | 0.3% |
| Total | 8,359 | 100.0% |
Employment Status by Age in Shorewood
According to the labor force statistics for Shorewood, out of the total population over 16 years of age (14,563), 61.0% or 8,883 individuals are in the labor force, with 4.9% or 435 of them unemployed. The age group with the highest labor force participation rate is 25 to 29 years, with 93.6% or 1,105 individuals in the labor force. Within the labor force, the 16 to 19 years age range has the highest percentage of unemployed individuals, with 19.6% or 134 of them being unemployed.
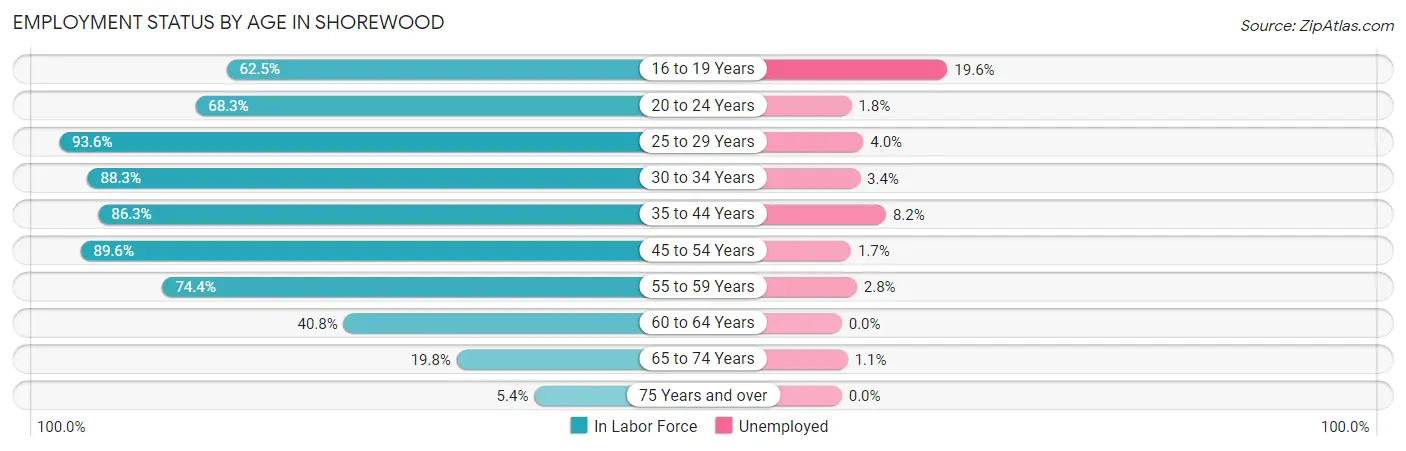
| Age Bracket | In Labor Force | Unemployed |
| 16 to 19 Years | 685 (62.5%) | 134 (19.6%) |
| 20 to 24 Years | 543 (68.3%) | 10 (1.8%) |
| 25 to 29 Years | 1,105 (93.6%) | 44 (4.0%) |
| 30 to 34 Years | 556 (88.3%) | 19 (3.4%) |
| 35 to 44 Years | 2,041 (86.3%) | 167 (8.2%) |
| 45 to 54 Years | 2,086 (89.6%) | 35 (1.7%) |
| 55 to 59 Years | 853 (74.4%) | 24 (2.8%) |
| 60 to 64 Years | 466 (40.8%) | 0 (0.0%) |
| 65 to 74 Years | 465 (19.8%) | 5 (1.1%) |
| 75 Years and over | 83 (5.4%) | 0 (0.0%) |
| Total | 8,883 (61.0%) | 435 (4.9%) |
Employment Status by Educational Attainment in Shorewood
According to labor force statistics for Shorewood, 80.8% of individuals (7,104) out of the total population between 25 and 64 years of age (8,792) are in the labor force, with 4.1% or 291 of them being unemployed. The group with the highest labor force participation rate are those with the educational attainment of bachelor's degree or higher, with 83.7% or 2,897 individuals in the labor force. Within the labor force, individuals with college / associate degree education have the highest percentage of unemployment, with 8.8% or 199 of them being unemployed.
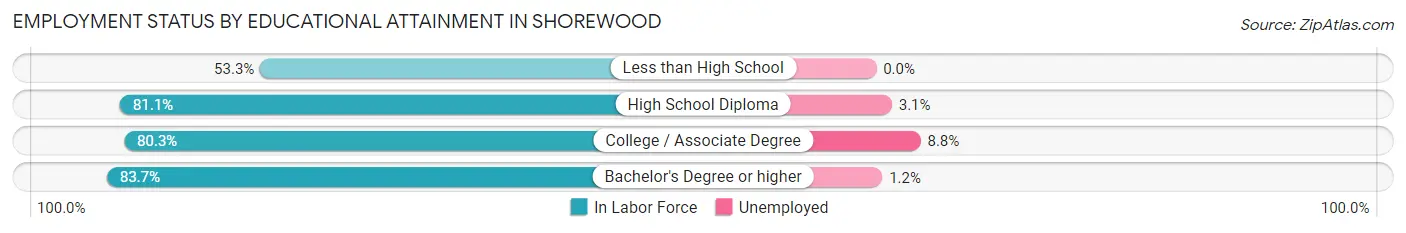
| Educational Attainment | In Labor Force | Unemployed |
| Less than High School | 171 (53.3%) | 0 (0.0%) |
| High School Diploma | 1,784 (81.1%) | 68 (3.1%) |
| College / Associate Degree | 2,256 (80.3%) | 247 (8.8%) |
| Bachelor's Degree or higher | 2,897 (83.7%) | 42 (1.2%) |
| Total | 7,104 (80.8%) | 360 (4.1%) |
Employment Occupations by Sex in Shorewood
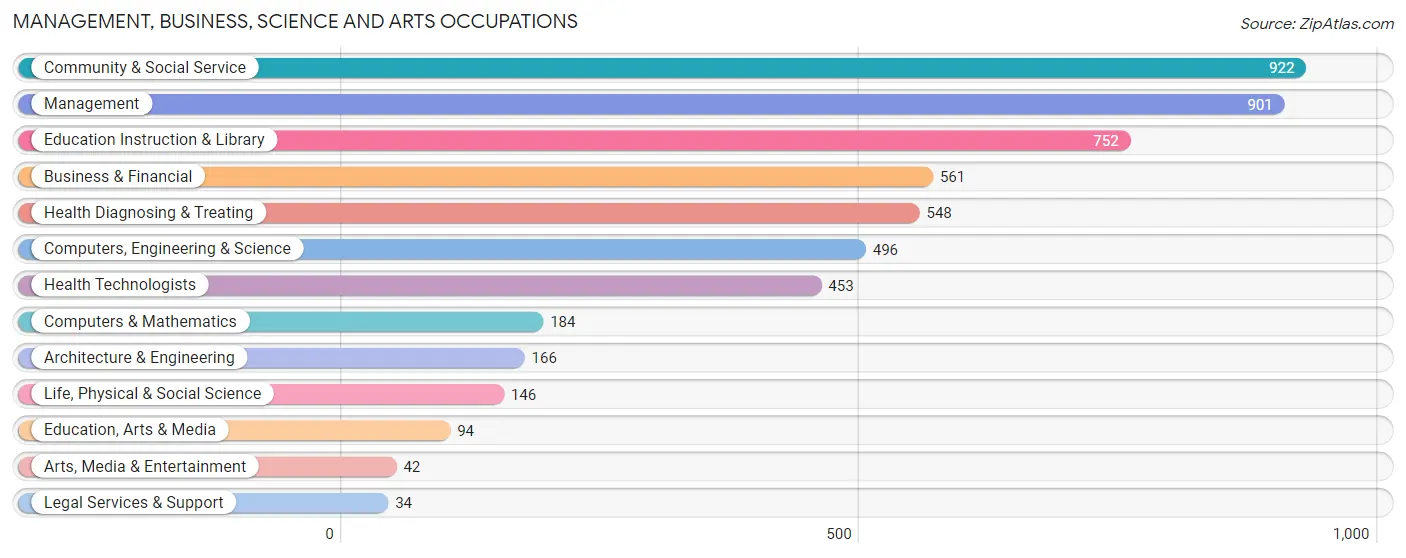
Management, Business, Science and Arts Occupations
The most common Management, Business, Science and Arts occupations in Shorewood are Community & Social Service (922 | 10.9%), Management (901 | 10.7%), Education Instruction & Library (752 | 8.9%), Business & Financial (561 | 6.6%), and Health Diagnosing & Treating (548 | 6.5%).
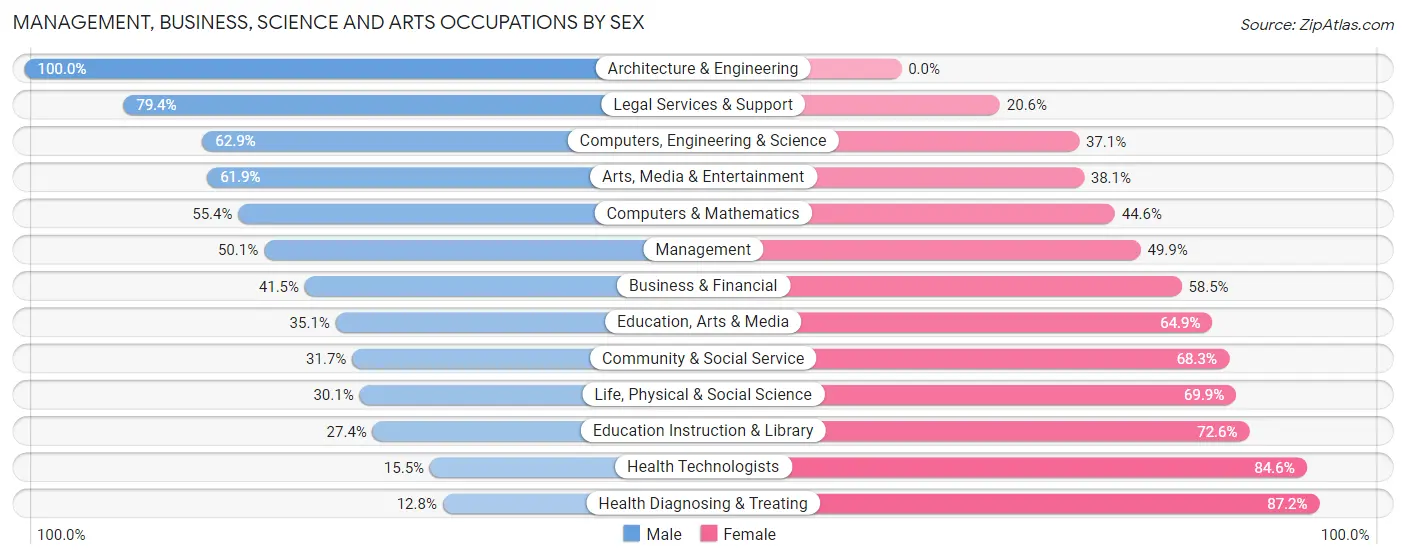
Management, Business, Science and Arts Occupations by Sex
Within the Management, Business, Science and Arts occupations in Shorewood, the most male-oriented occupations are Architecture & Engineering (100.0%), Legal Services & Support (79.4%), and Computers, Engineering & Science (62.9%), while the most female-oriented occupations are Health Diagnosing & Treating (87.2%), Health Technologists (84.6%), and Education Instruction & Library (72.6%).
| Occupation | Male | Female |
| Management | 451 (50.1%) | 450 (49.9%) |
| Business & Financial | 233 (41.5%) | 328 (58.5%) |
| Computers, Engineering & Science | 312 (62.9%) | 184 (37.1%) |
| Computers & Mathematics | 102 (55.4%) | 82 (44.6%) |
| Architecture & Engineering | 166 (100.0%) | 0 (0.0%) |
| Life, Physical & Social Science | 44 (30.1%) | 102 (69.9%) |
| Community & Social Service | 292 (31.7%) | 630 (68.3%) |
| Education, Arts & Media | 33 (35.1%) | 61 (64.9%) |
| Legal Services & Support | 27 (79.4%) | 7 (20.6%) |
| Education Instruction & Library | 206 (27.4%) | 546 (72.6%) |
| Arts, Media & Entertainment | 26 (61.9%) | 16 (38.1%) |
| Health Diagnosing & Treating | 70 (12.8%) | 478 (87.2%) |
| Health Technologists | 70 (15.4%) | 383 (84.6%) |
| Total (Category) | 1,358 (39.6%) | 2,070 (60.4%) |
| Total (Overall) | 4,597 (54.4%) | 3,848 (45.6%) |
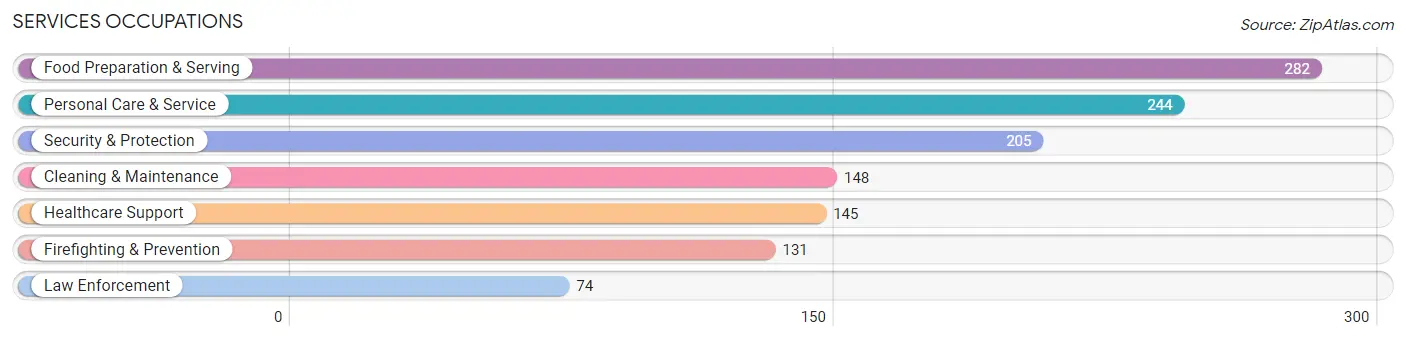
Services Occupations
The most common Services occupations in Shorewood are Food Preparation & Serving (282 | 3.3%), Personal Care & Service (244 | 2.9%), Security & Protection (205 | 2.4%), Cleaning & Maintenance (148 | 1.8%), and Healthcare Support (145 | 1.7%).
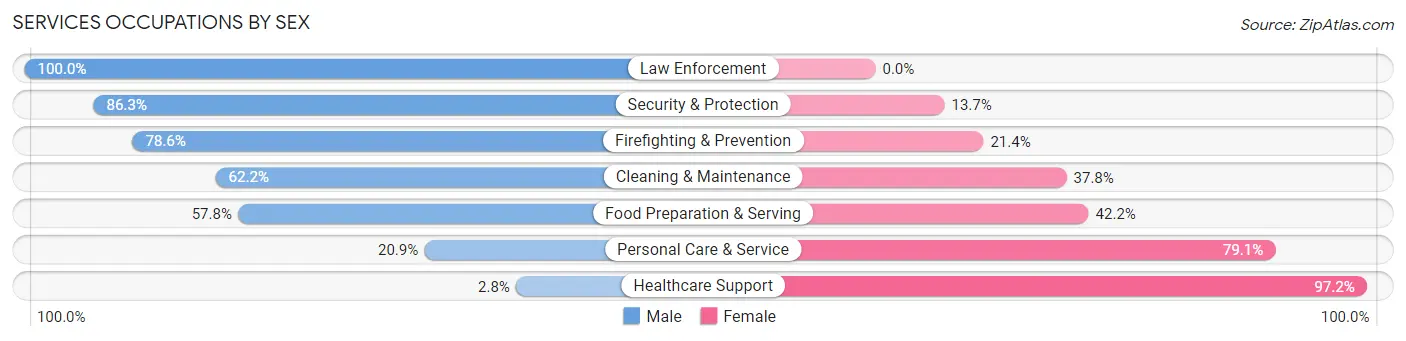
Services Occupations by Sex
Within the Services occupations in Shorewood, the most male-oriented occupations are Law Enforcement (100.0%), Security & Protection (86.3%), and Firefighting & Prevention (78.6%), while the most female-oriented occupations are Healthcare Support (97.2%), Personal Care & Service (79.1%), and Food Preparation & Serving (42.2%).
| Occupation | Male | Female |
| Healthcare Support | 4 (2.8%) | 141 (97.2%) |
| Security & Protection | 177 (86.3%) | 28 (13.7%) |
| Firefighting & Prevention | 103 (78.6%) | 28 (21.4%) |
| Law Enforcement | 74 (100.0%) | 0 (0.0%) |
| Food Preparation & Serving | 163 (57.8%) | 119 (42.2%) |
| Cleaning & Maintenance | 92 (62.2%) | 56 (37.8%) |
| Personal Care & Service | 51 (20.9%) | 193 (79.1%) |
| Total (Category) | 487 (47.6%) | 537 (52.4%) |
| Total (Overall) | 4,597 (54.4%) | 3,848 (45.6%) |
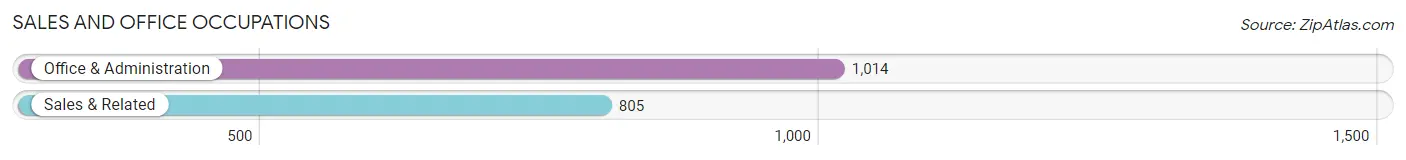
Sales and Office Occupations
The most common Sales and Office occupations in Shorewood are Office & Administration (1,014 | 12.0%), and Sales & Related (805 | 9.5%).
Sales and Office Occupations by Sex
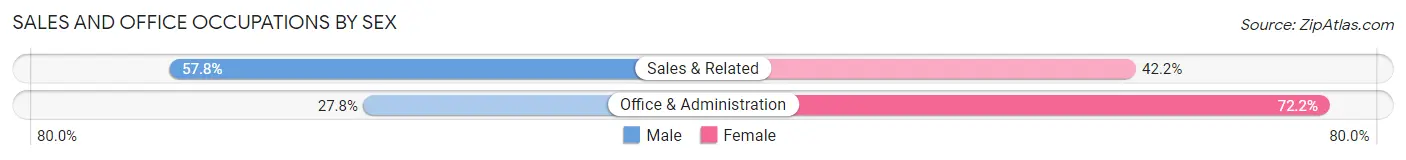
| Occupation | Male | Female |
| Sales & Related | 465 (57.8%) | 340 (42.2%) |
| Office & Administration | 282 (27.8%) | 732 (72.2%) |
| Total (Category) | 747 (41.1%) | 1,072 (58.9%) |
| Total (Overall) | 4,597 (54.4%) | 3,848 (45.6%) |
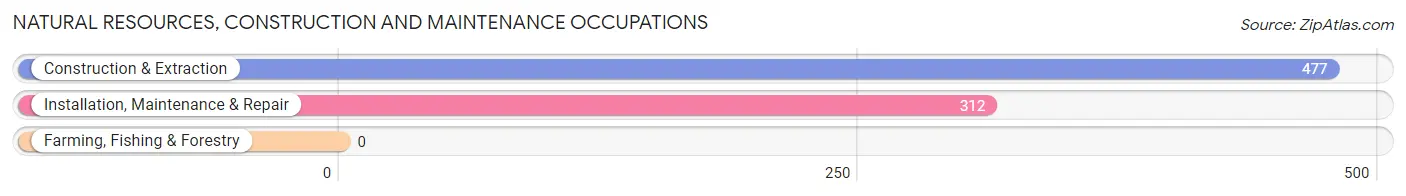
Natural Resources, Construction and Maintenance Occupations
The most common Natural Resources, Construction and Maintenance occupations in Shorewood are Construction & Extraction (477 | 5.7%), and Installation, Maintenance & Repair (312 | 3.7%).
Natural Resources, Construction and Maintenance Occupations by Sex
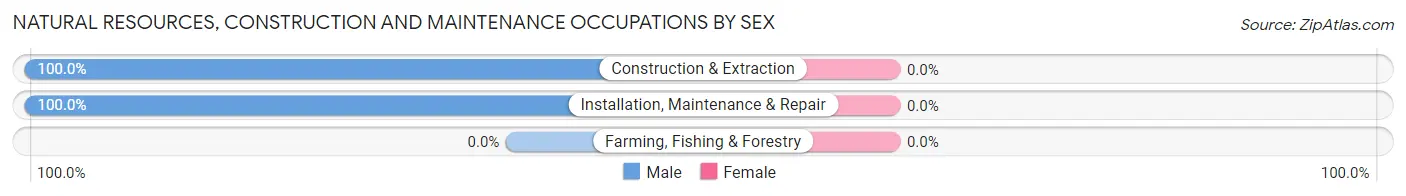
| Occupation | Male | Female |
| Farming, Fishing & Forestry | 0 (0.0%) | 0 (0.0%) |
| Construction & Extraction | 477 (100.0%) | 0 (0.0%) |
| Installation, Maintenance & Repair | 312 (100.0%) | 0 (0.0%) |
| Total (Category) | 789 (100.0%) | 0 (0.0%) |
| Total (Overall) | 4,597 (54.4%) | 3,848 (45.6%) |
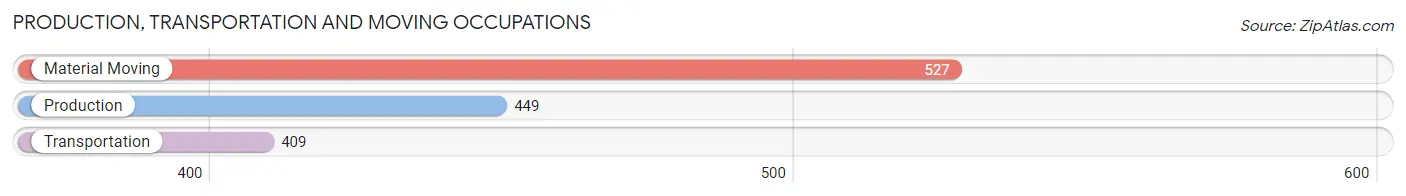
Production, Transportation and Moving Occupations
The most common Production, Transportation and Moving occupations in Shorewood are Material Moving (527 | 6.2%), Production (449 | 5.3%), and Transportation (409 | 4.8%).
Production, Transportation and Moving Occupations by Sex
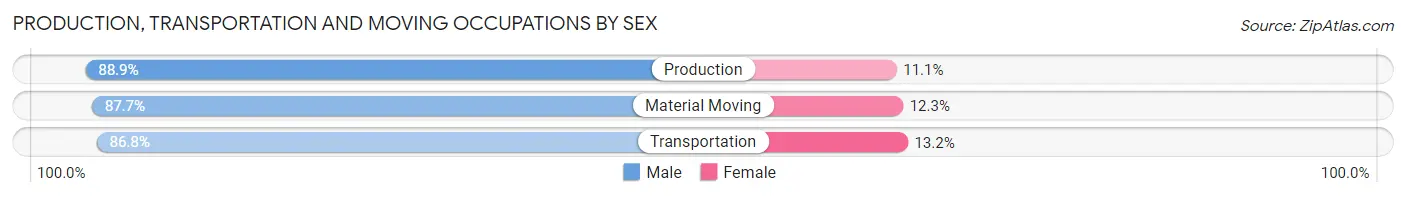
| Occupation | Male | Female |
| Production | 399 (88.9%) | 50 (11.1%) |
| Transportation | 355 (86.8%) | 54 (13.2%) |
| Material Moving | 462 (87.7%) | 65 (12.3%) |
| Total (Category) | 1,216 (87.8%) | 169 (12.2%) |
| Total (Overall) | 4,597 (54.4%) | 3,848 (45.6%) |
Employment Industries by Sex in Shorewood
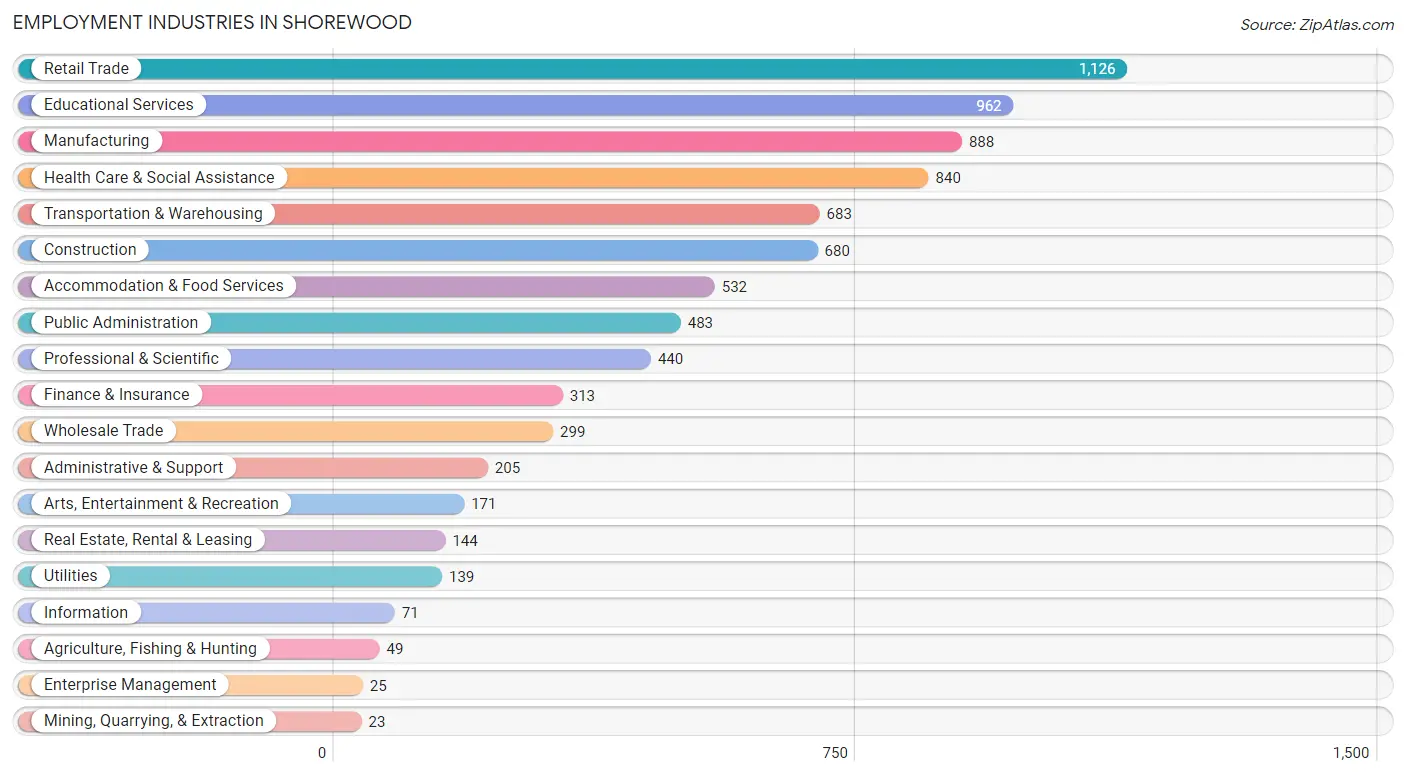
Employment Industries in Shorewood
The major employment industries in Shorewood include Retail Trade (1,126 | 13.3%), Educational Services (962 | 11.4%), Manufacturing (888 | 10.5%), Health Care & Social Assistance (840 | 10.0%), and Transportation & Warehousing (683 | 8.1%).
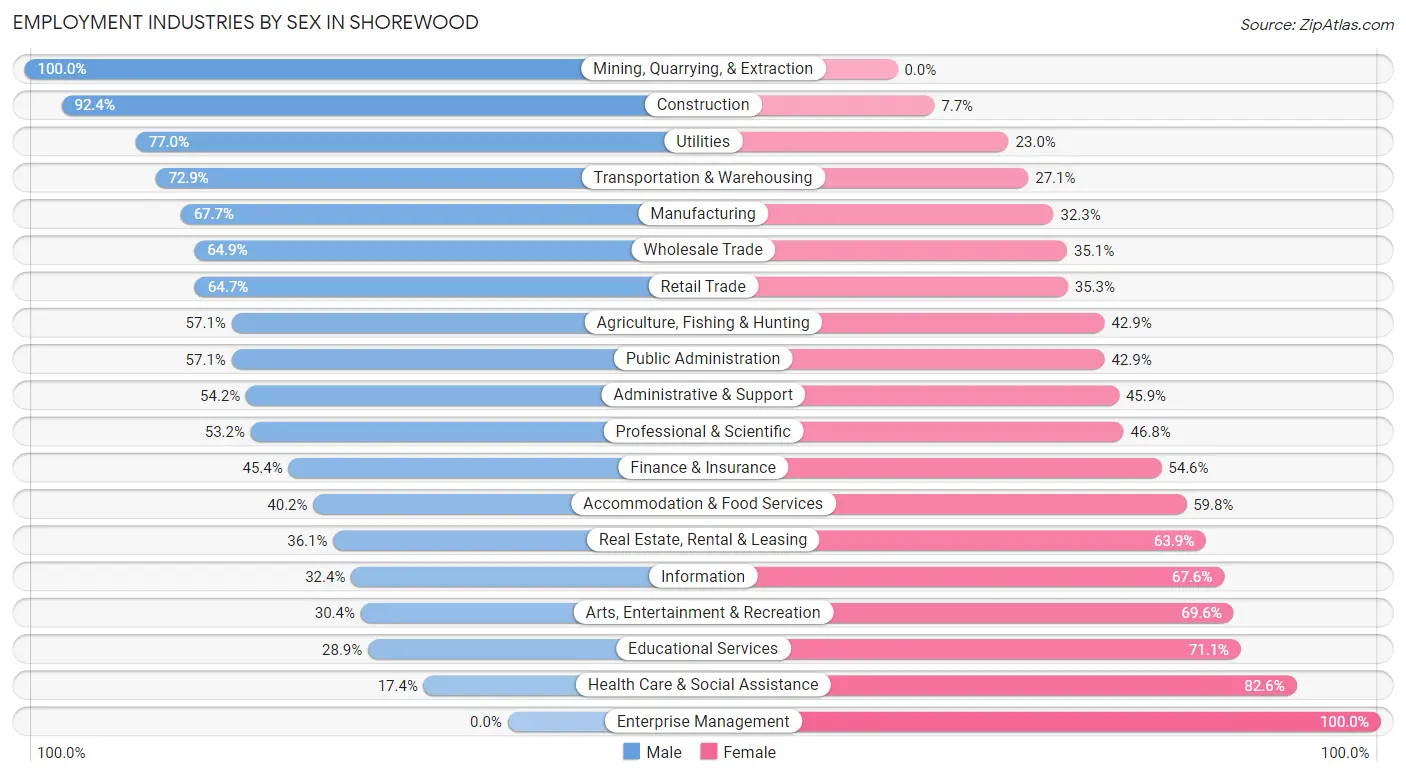
Employment Industries by Sex in Shorewood
The Shorewood industries that see more men than women are Mining, Quarrying, & Extraction (100.0%), Construction (92.3%), and Utilities (77.0%), whereas the industries that tend to have a higher number of women are Enterprise Management (100.0%), Health Care & Social Assistance (82.6%), and Educational Services (71.1%).
| Industry | Male | Female |
| Agriculture, Fishing & Hunting | 28 (57.1%) | 21 (42.9%) |
| Mining, Quarrying, & Extraction | 23 (100.0%) | 0 (0.0%) |
| Construction | 628 (92.3%) | 52 (7.6%) |
| Manufacturing | 601 (67.7%) | 287 (32.3%) |
| Wholesale Trade | 194 (64.9%) | 105 (35.1%) |
| Retail Trade | 729 (64.7%) | 397 (35.3%) |
| Transportation & Warehousing | 498 (72.9%) | 185 (27.1%) |
| Utilities | 107 (77.0%) | 32 (23.0%) |
| Information | 23 (32.4%) | 48 (67.6%) |
| Finance & Insurance | 142 (45.4%) | 171 (54.6%) |
| Real Estate, Rental & Leasing | 52 (36.1%) | 92 (63.9%) |
| Professional & Scientific | 234 (53.2%) | 206 (46.8%) |
| Enterprise Management | 0 (0.0%) | 25 (100.0%) |
| Administrative & Support | 111 (54.1%) | 94 (45.9%) |
| Educational Services | 278 (28.9%) | 684 (71.1%) |
| Health Care & Social Assistance | 146 (17.4%) | 694 (82.6%) |
| Arts, Entertainment & Recreation | 52 (30.4%) | 119 (69.6%) |
| Accommodation & Food Services | 214 (40.2%) | 318 (59.8%) |
| Public Administration | 276 (57.1%) | 207 (42.9%) |
| Total | 4,597 (54.4%) | 3,848 (45.6%) |
Education in Shorewood
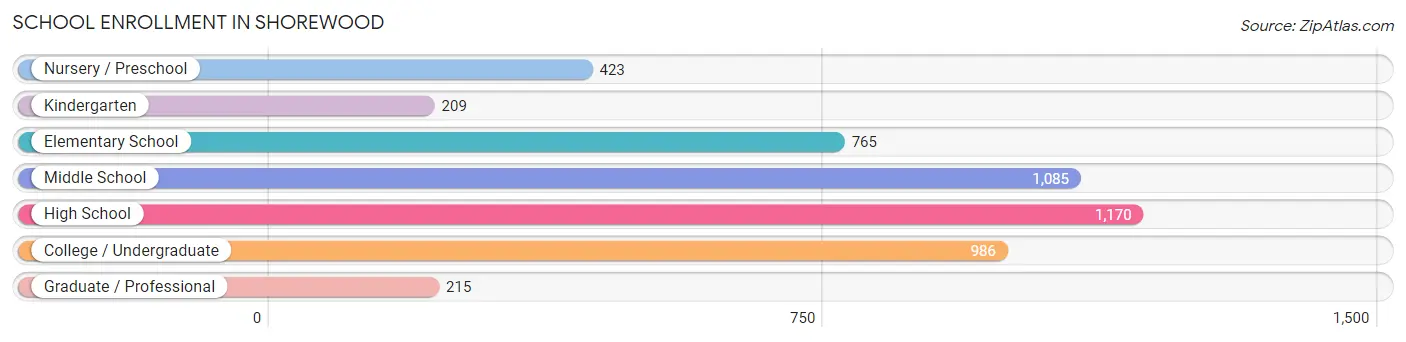
School Enrollment in Shorewood
The most common levels of schooling among the 4,853 students in Shorewood are high school (1,170 | 24.1%), middle school (1,085 | 22.4%), and college / undergraduate (986 | 20.3%).
| School Level | # Students | % Students |
| Nursery / Preschool | 423 | 8.7% |
| Kindergarten | 209 | 4.3% |
| Elementary School | 765 | 15.8% |
| Middle School | 1,085 | 22.4% |
| High School | 1,170 | 24.1% |
| College / Undergraduate | 986 | 20.3% |
| Graduate / Professional | 215 | 4.4% |
| Total | 4,853 | 100.0% |
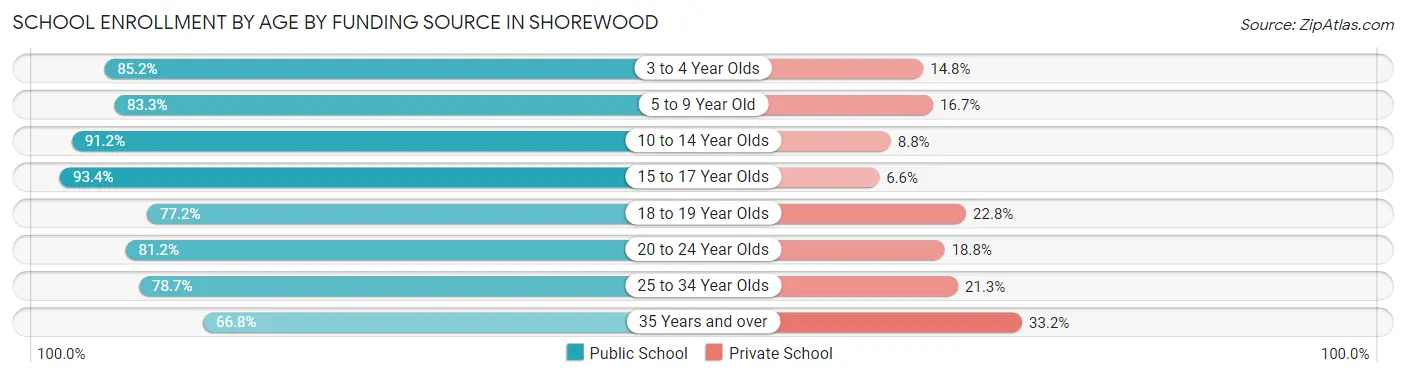
School Enrollment by Age by Funding Source in Shorewood
Out of a total of 4,853 students who are enrolled in schools in Shorewood, 704 (14.5%) attend a private institution, while the remaining 4,149 (85.5%) are enrolled in public schools. The age group of 35 years and over has the highest likelihood of being enrolled in private schools, with 117 (33.2% in the age bracket) enrolled. Conversely, the age group of 15 to 17 year olds has the lowest likelihood of being enrolled in a private school, with 789 (93.4% in the age bracket) attending a public institution.
| Age Bracket | Public School | Private School |
| 3 to 4 Year Olds | 293 (85.2%) | 51 (14.8%) |
| 5 to 9 Year Old | 765 (83.3%) | 153 (16.7%) |
| 10 to 14 Year Olds | 1,307 (91.2%) | 126 (8.8%) |
| 15 to 17 Year Olds | 789 (93.4%) | 56 (6.6%) |
| 18 to 19 Year Olds | 362 (77.2%) | 107 (22.8%) |
| 20 to 24 Year Olds | 289 (81.2%) | 67 (18.8%) |
| 25 to 34 Year Olds | 107 (78.7%) | 29 (21.3%) |
| 35 Years and over | 235 (66.8%) | 117 (33.2%) |
| Total | 4,149 (85.5%) | 704 (14.5%) |
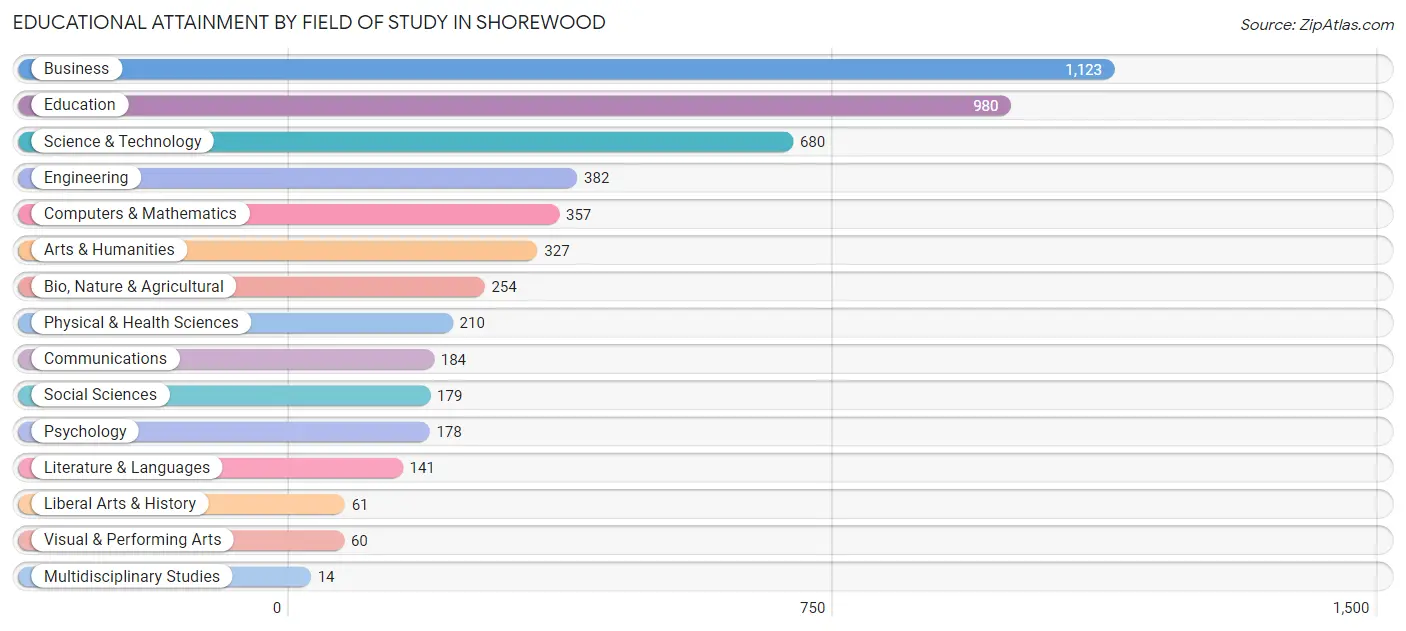
Educational Attainment by Field of Study in Shorewood
Business (1,123 | 21.9%), education (980 | 19.1%), science & technology (680 | 13.3%), engineering (382 | 7.4%), and computers & mathematics (357 | 7.0%) are the most common fields of study among 5,130 individuals in Shorewood who have obtained a bachelor's degree or higher.
| Field of Study | # Graduates | % Graduates |
| Computers & Mathematics | 357 | 7.0% |
| Bio, Nature & Agricultural | 254 | 5.0% |
| Physical & Health Sciences | 210 | 4.1% |
| Psychology | 178 | 3.5% |
| Social Sciences | 179 | 3.5% |
| Engineering | 382 | 7.4% |
| Multidisciplinary Studies | 14 | 0.3% |
| Science & Technology | 680 | 13.3% |
| Business | 1,123 | 21.9% |
| Education | 980 | 19.1% |
| Literature & Languages | 141 | 2.8% |
| Liberal Arts & History | 61 | 1.2% |
| Visual & Performing Arts | 60 | 1.2% |
| Communications | 184 | 3.6% |
| Arts & Humanities | 327 | 6.4% |
| Total | 5,130 | 100.0% |
Transportation & Commute in Shorewood
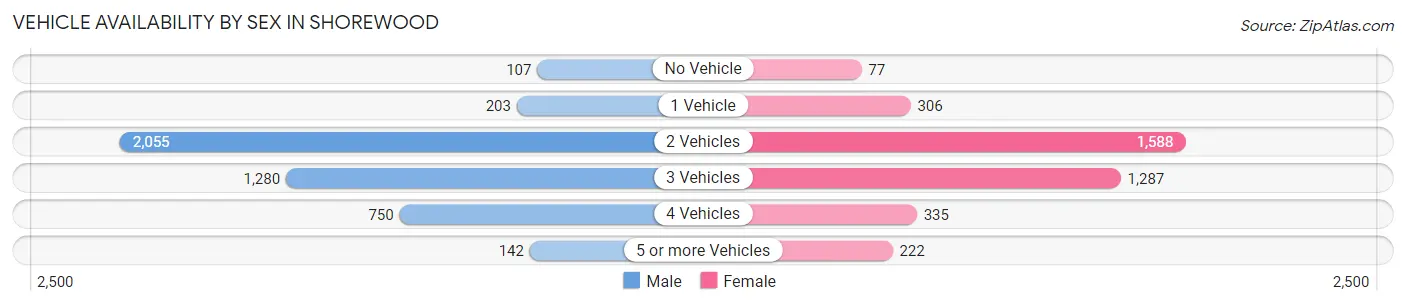
Vehicle Availability by Sex in Shorewood
The most prevalent vehicle ownership categories in Shorewood are males with 2 vehicles (2,055, accounting for 45.3%) and females with 2 vehicles (1,588, making up 53.9%).
| Vehicles Available | Male | Female |
| No Vehicle | 107 (2.4%) | 77 (2.0%) |
| 1 Vehicle | 203 (4.5%) | 306 (8.0%) |
| 2 Vehicles | 2,055 (45.3%) | 1,588 (41.6%) |
| 3 Vehicles | 1,280 (28.2%) | 1,287 (33.7%) |
| 4 Vehicles | 750 (16.5%) | 335 (8.8%) |
| 5 or more Vehicles | 142 (3.1%) | 222 (5.8%) |
| Total | 4,537 (100.0%) | 3,815 (100.0%) |
Commute Time in Shorewood
The most frequently occuring commute durations in Shorewood are 15 to 19 minutes (1,595 commuters, 21.3%), 20 to 24 minutes (1,098 commuters, 14.7%), and 30 to 34 minutes (766 commuters, 10.2%).
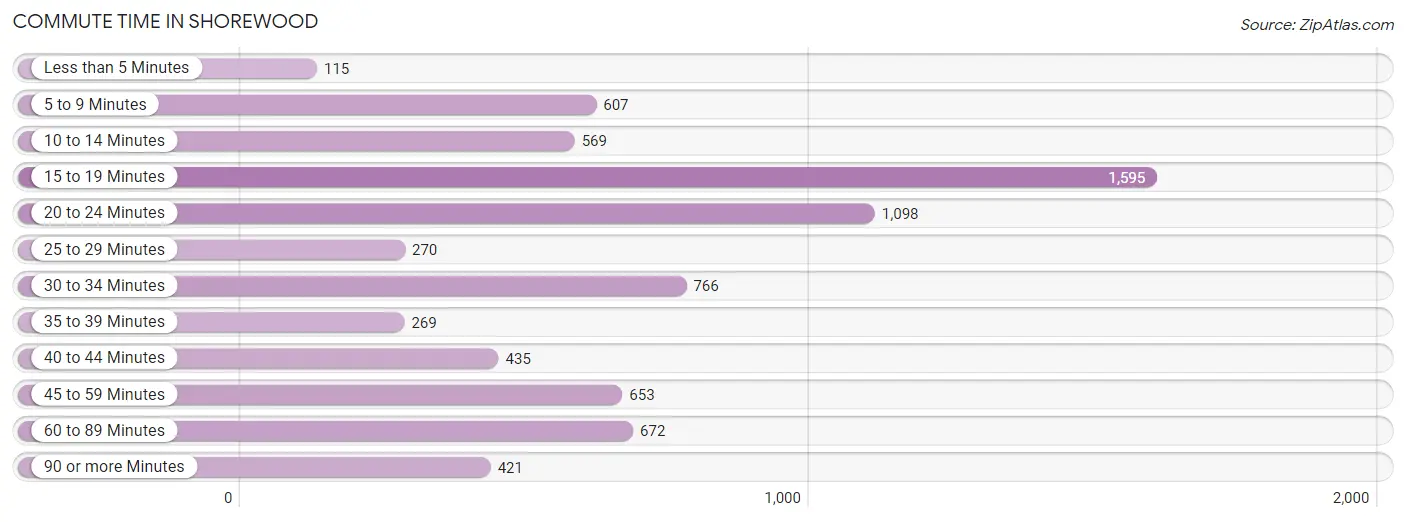
| Commute Time | # Commuters | % Commuters |
| Less than 5 Minutes | 115 | 1.5% |
| 5 to 9 Minutes | 607 | 8.1% |
| 10 to 14 Minutes | 569 | 7.6% |
| 15 to 19 Minutes | 1,595 | 21.3% |
| 20 to 24 Minutes | 1,098 | 14.7% |
| 25 to 29 Minutes | 270 | 3.6% |
| 30 to 34 Minutes | 766 | 10.2% |
| 35 to 39 Minutes | 269 | 3.6% |
| 40 to 44 Minutes | 435 | 5.8% |
| 45 to 59 Minutes | 653 | 8.7% |
| 60 to 89 Minutes | 672 | 9.0% |
| 90 or more Minutes | 421 | 5.6% |
Commute Time by Sex in Shorewood
The most common commute times in Shorewood are 15 to 19 minutes (826 commuters, 19.6%) for males and 15 to 19 minutes (769 commuters, 23.6%) for females.
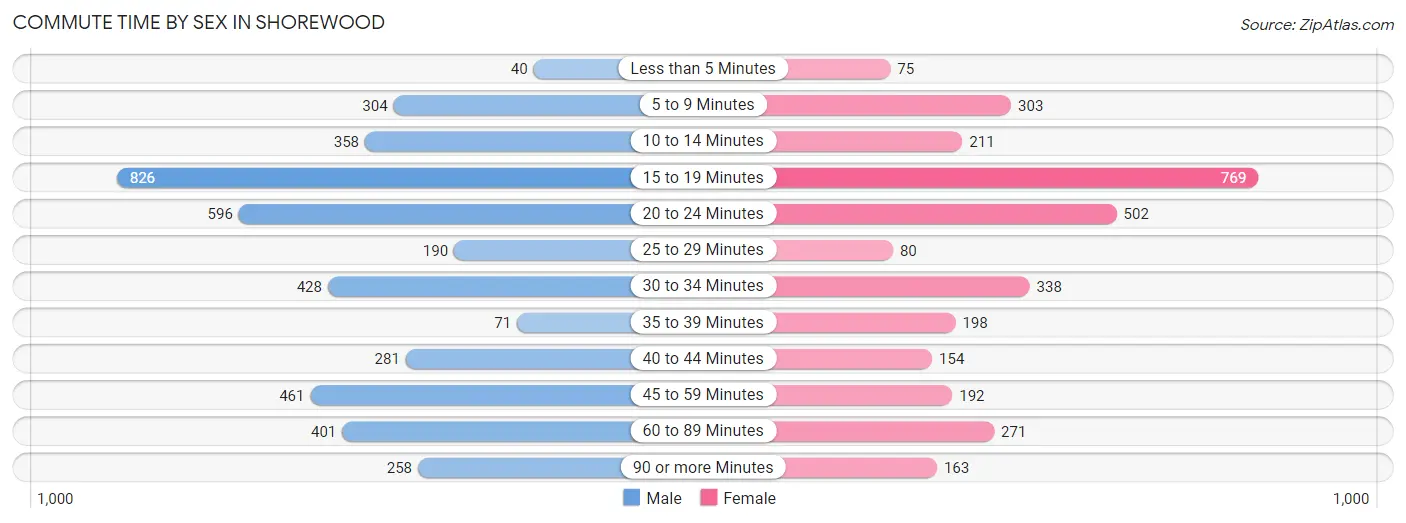
| Commute Time | Male | Female |
| Less than 5 Minutes | 40 (0.9%) | 75 (2.3%) |
| 5 to 9 Minutes | 304 (7.2%) | 303 (9.3%) |
| 10 to 14 Minutes | 358 (8.5%) | 211 (6.5%) |
| 15 to 19 Minutes | 826 (19.6%) | 769 (23.6%) |
| 20 to 24 Minutes | 596 (14.1%) | 502 (15.4%) |
| 25 to 29 Minutes | 190 (4.5%) | 80 (2.5%) |
| 30 to 34 Minutes | 428 (10.2%) | 338 (10.4%) |
| 35 to 39 Minutes | 71 (1.7%) | 198 (6.1%) |
| 40 to 44 Minutes | 281 (6.7%) | 154 (4.7%) |
| 45 to 59 Minutes | 461 (10.9%) | 192 (5.9%) |
| 60 to 89 Minutes | 401 (9.5%) | 271 (8.3%) |
| 90 or more Minutes | 258 (6.1%) | 163 (5.0%) |
Time of Departure to Work by Sex in Shorewood
The most frequent times of departure to work in Shorewood are 6:00 AM to 6:29 AM (575, 13.6%) for males and 7:30 AM to 7:59 AM (448, 13.8%) for females.
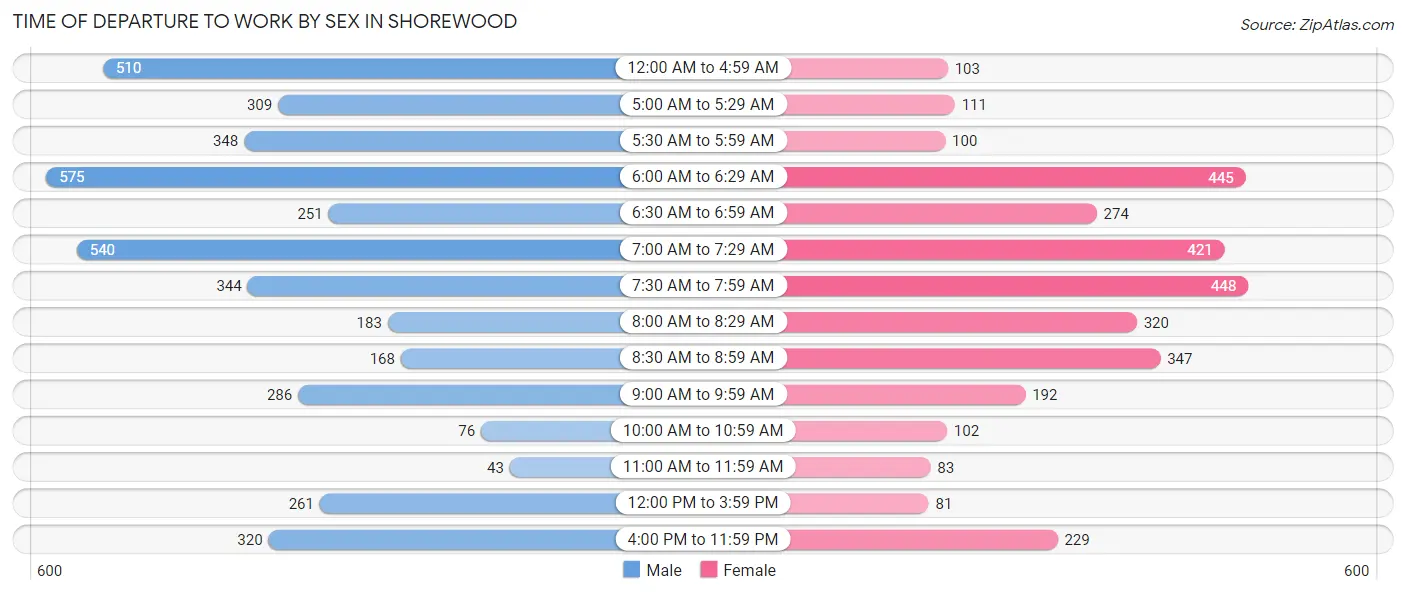
| Time of Departure | Male | Female |
| 12:00 AM to 4:59 AM | 510 (12.1%) | 103 (3.2%) |
| 5:00 AM to 5:29 AM | 309 (7.3%) | 111 (3.4%) |
| 5:30 AM to 5:59 AM | 348 (8.3%) | 100 (3.1%) |
| 6:00 AM to 6:29 AM | 575 (13.6%) | 445 (13.7%) |
| 6:30 AM to 6:59 AM | 251 (6.0%) | 274 (8.4%) |
| 7:00 AM to 7:29 AM | 540 (12.8%) | 421 (12.9%) |
| 7:30 AM to 7:59 AM | 344 (8.2%) | 448 (13.8%) |
| 8:00 AM to 8:29 AM | 183 (4.3%) | 320 (9.8%) |
| 8:30 AM to 8:59 AM | 168 (4.0%) | 347 (10.7%) |
| 9:00 AM to 9:59 AM | 286 (6.8%) | 192 (5.9%) |
| 10:00 AM to 10:59 AM | 76 (1.8%) | 102 (3.1%) |
| 11:00 AM to 11:59 AM | 43 (1.0%) | 83 (2.5%) |
| 12:00 PM to 3:59 PM | 261 (6.2%) | 81 (2.5%) |
| 4:00 PM to 11:59 PM | 320 (7.6%) | 229 (7.0%) |
| Total | 4,214 (100.0%) | 3,256 (100.0%) |
Housing Occupancy in Shorewood
Occupancy by Ownership in Shorewood
Of the total 6,359 dwellings in Shorewood, owner-occupied units account for 6,084 (95.7%), while renter-occupied units make up 275 (4.3%).
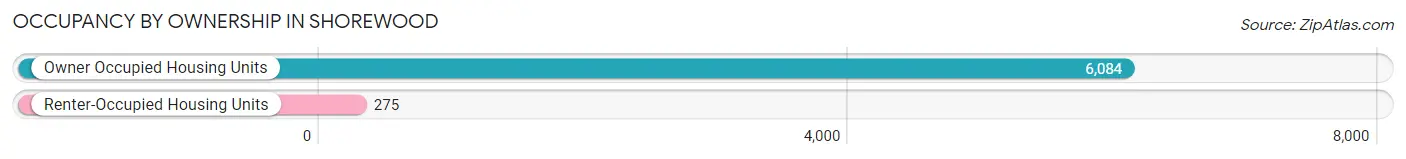
| Occupancy | # Housing Units | % Housing Units |
| Owner Occupied Housing Units | 6,084 | 95.7% |
| Renter-Occupied Housing Units | 275 | 4.3% |
| Total Occupied Housing Units | 6,359 | 100.0% |
Occupancy by Household Size in Shorewood
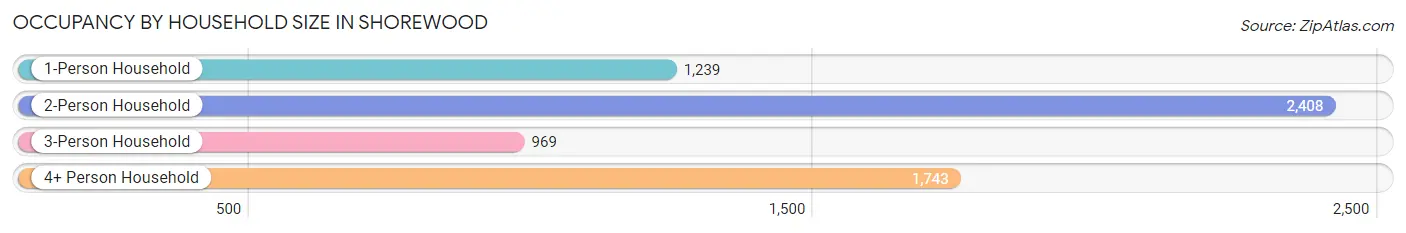
| Household Size | # Housing Units | % Housing Units |
| 1-Person Household | 1,239 | 19.5% |
| 2-Person Household | 2,408 | 37.9% |
| 3-Person Household | 969 | 15.2% |
| 4+ Person Household | 1,743 | 27.4% |
| Total Housing Units | 6,359 | 100.0% |
Occupancy by Ownership by Household Size in Shorewood
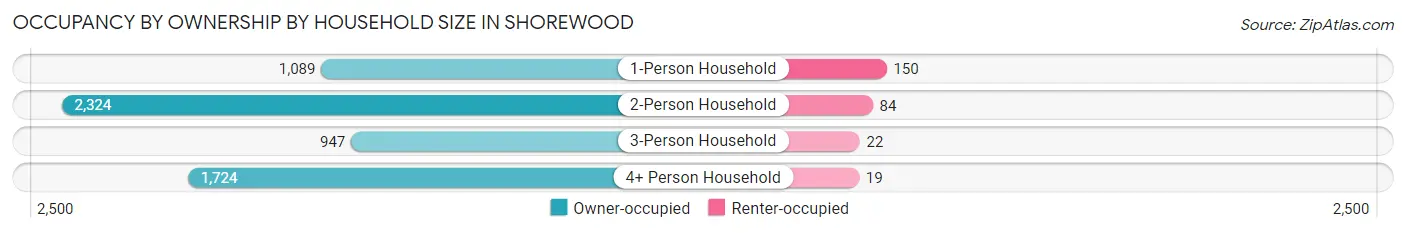
| Household Size | Owner-occupied | Renter-occupied |
| 1-Person Household | 1,089 (87.9%) | 150 (12.1%) |
| 2-Person Household | 2,324 (96.5%) | 84 (3.5%) |
| 3-Person Household | 947 (97.7%) | 22 (2.3%) |
| 4+ Person Household | 1,724 (98.9%) | 19 (1.1%) |
| Total Housing Units | 6,084 (95.7%) | 275 (4.3%) |
Occupancy by Educational Attainment in Shorewood
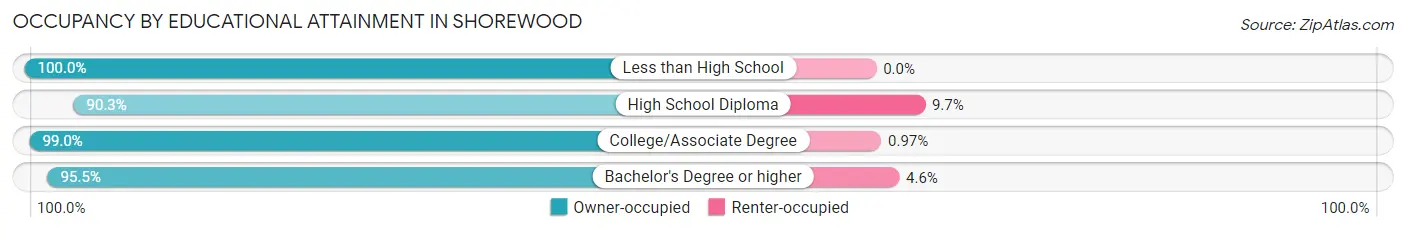
| Household Size | Owner-occupied | Renter-occupied |
| Less than High School | 126 (100.0%) | 0 (0.0%) |
| High School Diploma | 1,148 (90.3%) | 123 (9.7%) |
| College/Associate Degree | 2,038 (99.0%) | 20 (1.0%) |
| Bachelor's Degree or higher | 2,772 (95.5%) | 132 (4.5%) |
Occupancy by Age of Householder in Shorewood
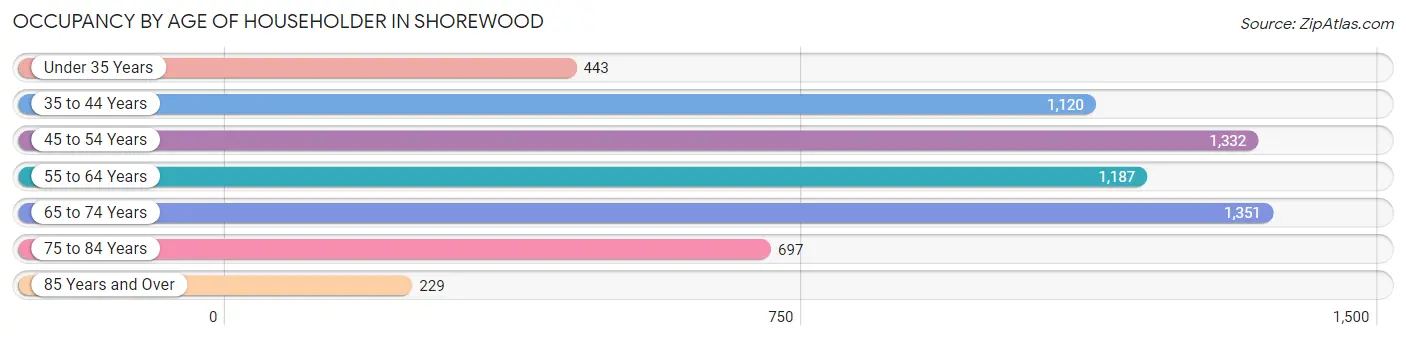
| Age Bracket | # Households | % Households |
| Under 35 Years | 443 | 7.0% |
| 35 to 44 Years | 1,120 | 17.6% |
| 45 to 54 Years | 1,332 | 20.9% |
| 55 to 64 Years | 1,187 | 18.7% |
| 65 to 74 Years | 1,351 | 21.2% |
| 75 to 84 Years | 697 | 11.0% |
| 85 Years and Over | 229 | 3.6% |
| Total | 6,359 | 100.0% |
Housing Finances in Shorewood
Median Income by Occupancy in Shorewood
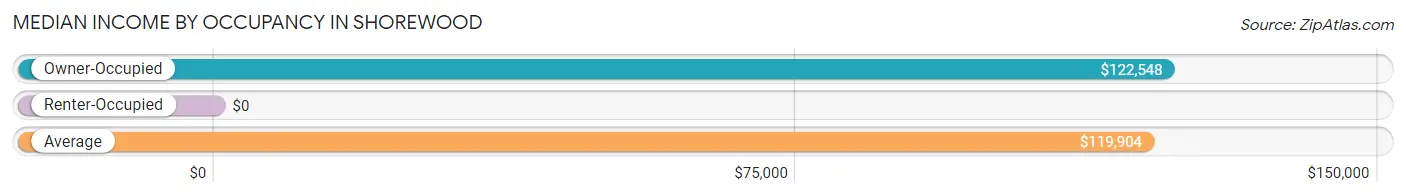
| Occupancy Type | # Households | Median Income |
| Owner-Occupied | 6,084 (95.7%) | $122,548 |
| Renter-Occupied | 275 (4.3%) | $0 |
| Average | 6,359 (100.0%) | $119,904 |
Occupancy by Householder Income Bracket in Shorewood
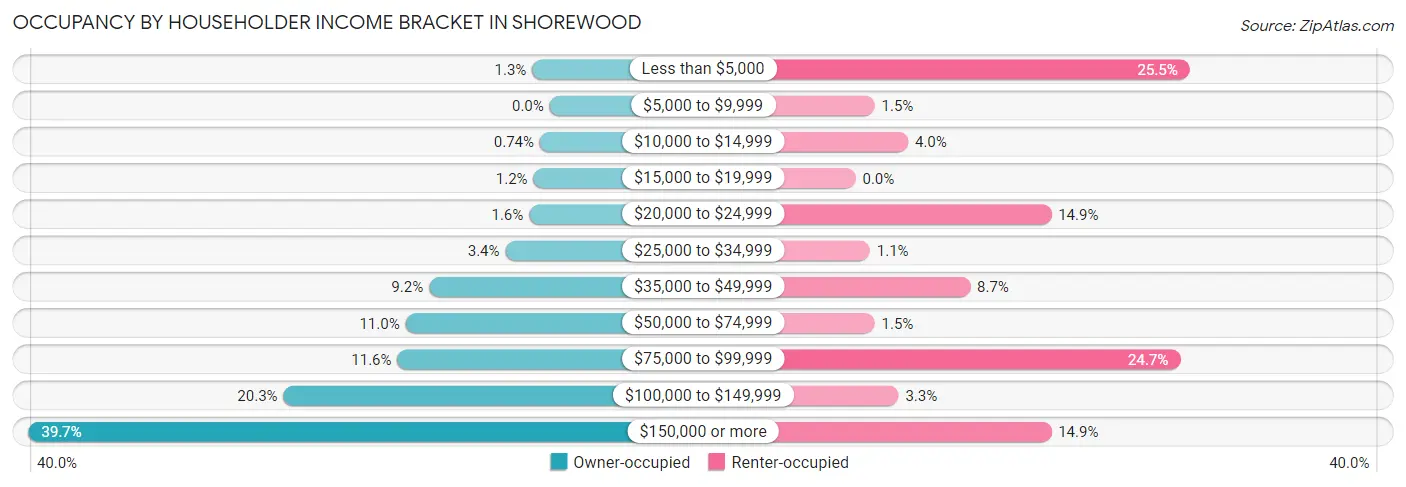
| Income Bracket | Owner-occupied | Renter-occupied |
| Less than $5,000 | 81 (1.3%) | 70 (25.5%) |
| $5,000 to $9,999 | 0 (0.0%) | 4 (1.5%) |
| $10,000 to $14,999 | 45 (0.7%) | 11 (4.0%) |
| $15,000 to $19,999 | 75 (1.2%) | 0 (0.0%) |
| $20,000 to $24,999 | 95 (1.6%) | 41 (14.9%) |
| $25,000 to $34,999 | 205 (3.4%) | 3 (1.1%) |
| $35,000 to $49,999 | 559 (9.2%) | 24 (8.7%) |
| $50,000 to $74,999 | 668 (11.0%) | 4 (1.5%) |
| $75,000 to $99,999 | 706 (11.6%) | 68 (24.7%) |
| $100,000 to $149,999 | 1,234 (20.3%) | 9 (3.3%) |
| $150,000 or more | 2,416 (39.7%) | 41 (14.9%) |
| Total | 6,084 (100.0%) | 275 (100.0%) |
Monthly Housing Cost Tiers in Shorewood
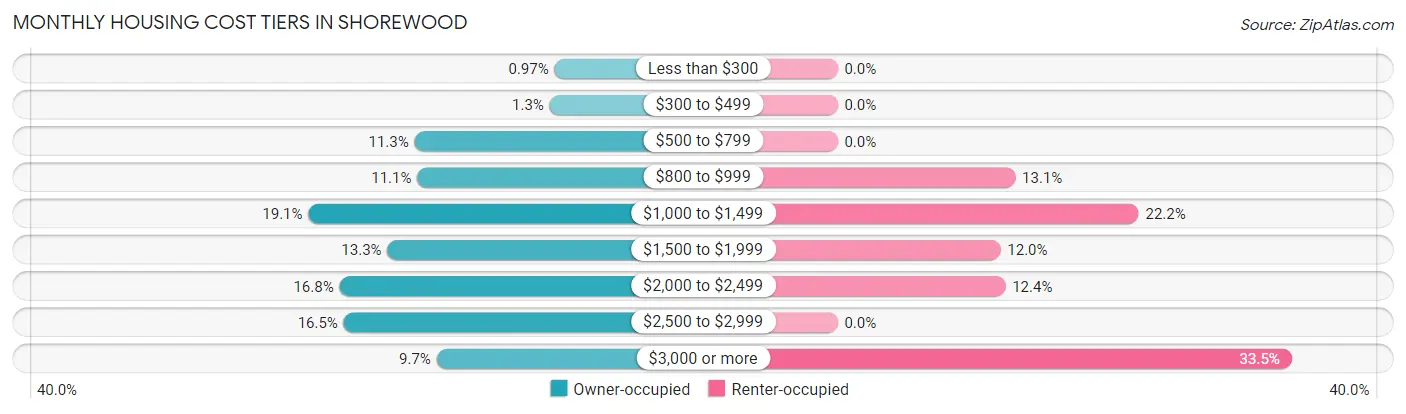
| Monthly Cost | Owner-occupied | Renter-occupied |
| Less than $300 | 59 (1.0%) | 0 (0.0%) |
| $300 to $499 | 81 (1.3%) | 0 (0.0%) |
| $500 to $799 | 686 (11.3%) | 0 (0.0%) |
| $800 to $999 | 674 (11.1%) | 36 (13.1%) |
| $1,000 to $1,499 | 1,162 (19.1%) | 61 (22.2%) |
| $1,500 to $1,999 | 808 (13.3%) | 33 (12.0%) |
| $2,000 to $2,499 | 1,023 (16.8%) | 34 (12.4%) |
| $2,500 to $2,999 | 1,004 (16.5%) | 0 (0.0%) |
| $3,000 or more | 587 (9.7%) | 92 (33.5%) |
| Total | 6,084 (100.0%) | 275 (100.0%) |
Physical Housing Characteristics in Shorewood
Housing Structures in Shorewood
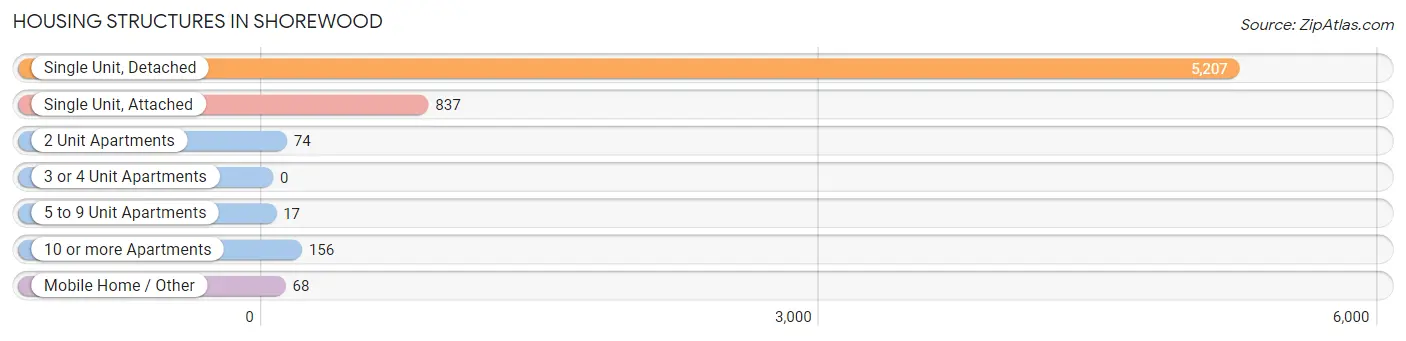
| Structure Type | # Housing Units | % Housing Units |
| Single Unit, Detached | 5,207 | 81.9% |
| Single Unit, Attached | 837 | 13.2% |
| 2 Unit Apartments | 74 | 1.2% |
| 3 or 4 Unit Apartments | 0 | 0.0% |
| 5 to 9 Unit Apartments | 17 | 0.3% |
| 10 or more Apartments | 156 | 2.5% |
| Mobile Home / Other | 68 | 1.1% |
| Total | 6,359 | 100.0% |
Housing Structures by Occupancy in Shorewood
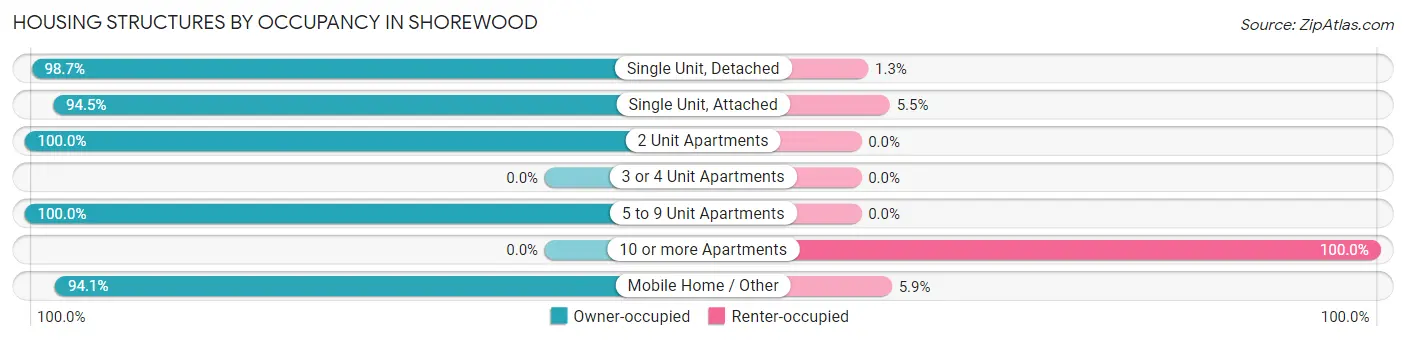
| Structure Type | Owner-occupied | Renter-occupied |
| Single Unit, Detached | 5,138 (98.7%) | 69 (1.3%) |
| Single Unit, Attached | 791 (94.5%) | 46 (5.5%) |
| 2 Unit Apartments | 74 (100.0%) | 0 (0.0%) |
| 3 or 4 Unit Apartments | 0 (0.0%) | 0 (0.0%) |
| 5 to 9 Unit Apartments | 17 (100.0%) | 0 (0.0%) |
| 10 or more Apartments | 0 (0.0%) | 156 (100.0%) |
| Mobile Home / Other | 64 (94.1%) | 4 (5.9%) |
| Total | 6,084 (95.7%) | 275 (4.3%) |
Housing Structures by Number of Rooms in Shorewood
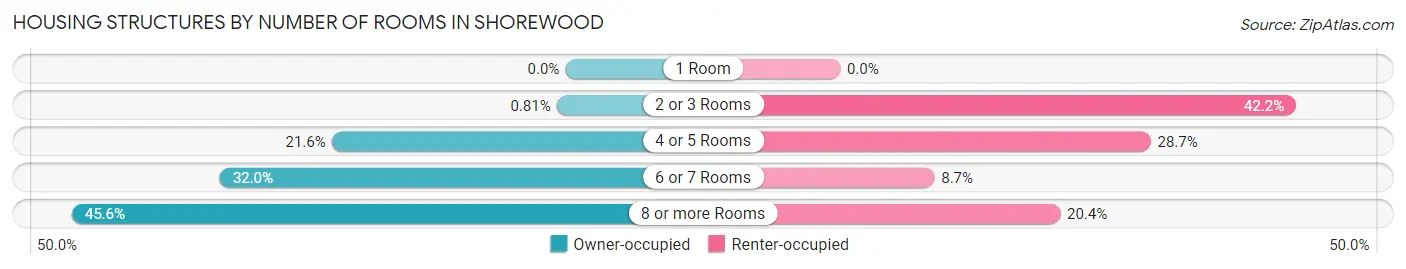
| Number of Rooms | Owner-occupied | Renter-occupied |
| 1 Room | 0 (0.0%) | 0 (0.0%) |
| 2 or 3 Rooms | 49 (0.8%) | 116 (42.2%) |
| 4 or 5 Rooms | 1,315 (21.6%) | 79 (28.7%) |
| 6 or 7 Rooms | 1,944 (32.0%) | 24 (8.7%) |
| 8 or more Rooms | 2,776 (45.6%) | 56 (20.4%) |
| Total | 6,084 (100.0%) | 275 (100.0%) |
Housing Structure by Heating Type in Shorewood
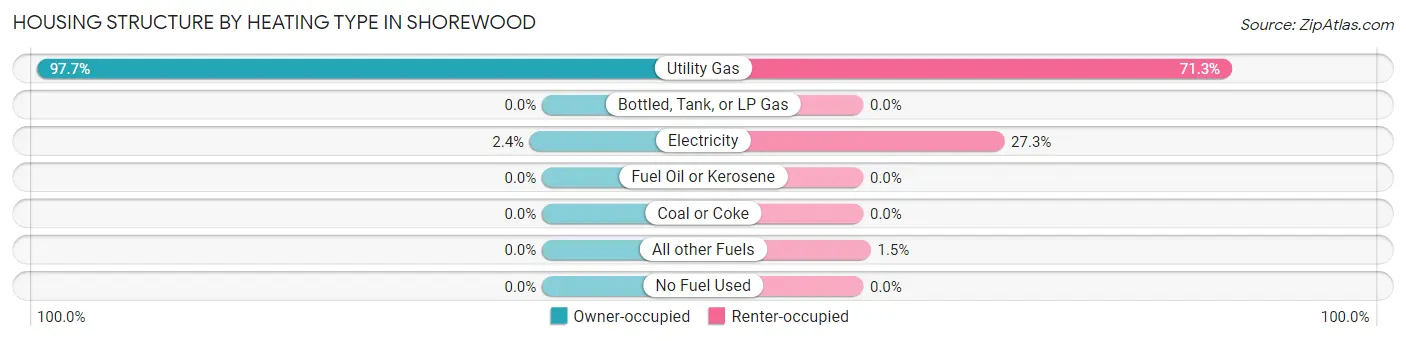
| Heating Type | Owner-occupied | Renter-occupied |
| Utility Gas | 5,941 (97.7%) | 196 (71.3%) |
| Bottled, Tank, or LP Gas | 0 (0.0%) | 0 (0.0%) |
| Electricity | 143 (2.4%) | 75 (27.3%) |
| Fuel Oil or Kerosene | 0 (0.0%) | 0 (0.0%) |
| Coal or Coke | 0 (0.0%) | 0 (0.0%) |
| All other Fuels | 0 (0.0%) | 4 (1.5%) |
| No Fuel Used | 0 (0.0%) | 0 (0.0%) |
| Total | 6,084 (100.0%) | 275 (100.0%) |
Household Vehicle Usage in Shorewood
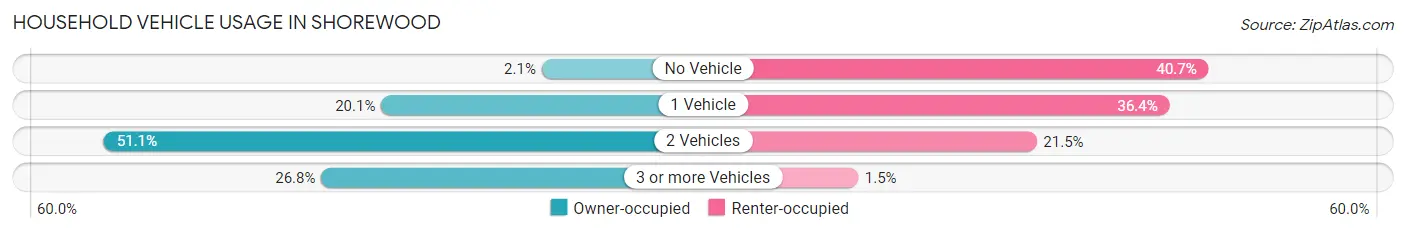
| Vehicles per Household | Owner-occupied | Renter-occupied |
| No Vehicle | 126 (2.1%) | 112 (40.7%) |
| 1 Vehicle | 1,220 (20.1%) | 100 (36.4%) |
| 2 Vehicles | 3,110 (51.1%) | 59 (21.4%) |
| 3 or more Vehicles | 1,628 (26.8%) | 4 (1.5%) |
| Total | 6,084 (100.0%) | 275 (100.0%) |
Real Estate & Mortgages in Shorewood
Real Estate and Mortgage Overview in Shorewood
| Characteristic | Without Mortgage | With Mortgage |
| Housing Units | 2,089 | 3,995 |
| Median Property Value | $292,500 | $311,700 |
| Median Household Income | $83,271 | $1,838 |
| Monthly Housing Costs | $913 | $587 |
| Real Estate Taxes | $6,717 | $56 |
Property Value by Mortgage Status in Shorewood
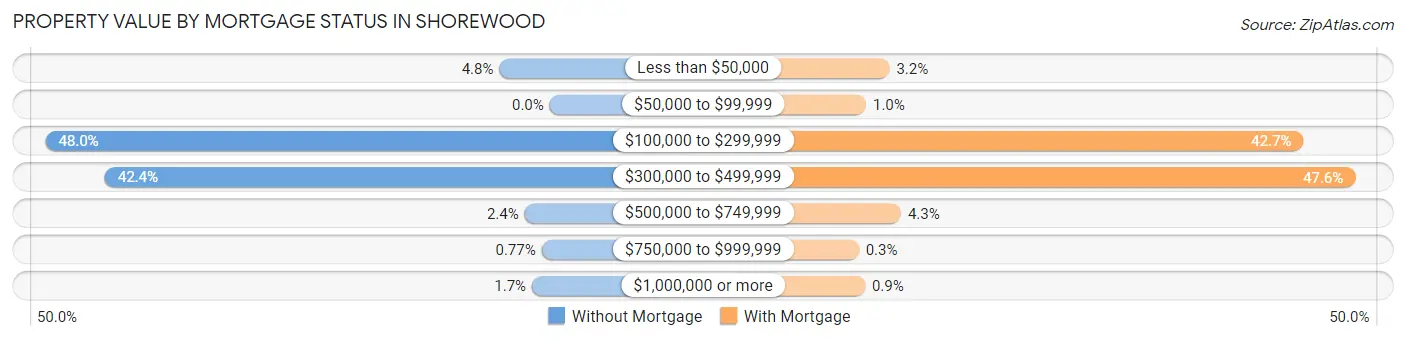
| Property Value | Without Mortgage | With Mortgage |
| Less than $50,000 | 100 (4.8%) | 129 (3.2%) |
| $50,000 to $99,999 | 0 (0.0%) | 40 (1.0%) |
| $100,000 to $299,999 | 1,003 (48.0%) | 1,704 (42.6%) |
| $300,000 to $499,999 | 885 (42.4%) | 1,901 (47.6%) |
| $500,000 to $749,999 | 50 (2.4%) | 173 (4.3%) |
| $750,000 to $999,999 | 16 (0.8%) | 12 (0.3%) |
| $1,000,000 or more | 35 (1.7%) | 36 (0.9%) |
| Total | 2,089 (100.0%) | 3,995 (100.0%) |
Household Income by Mortgage Status in Shorewood
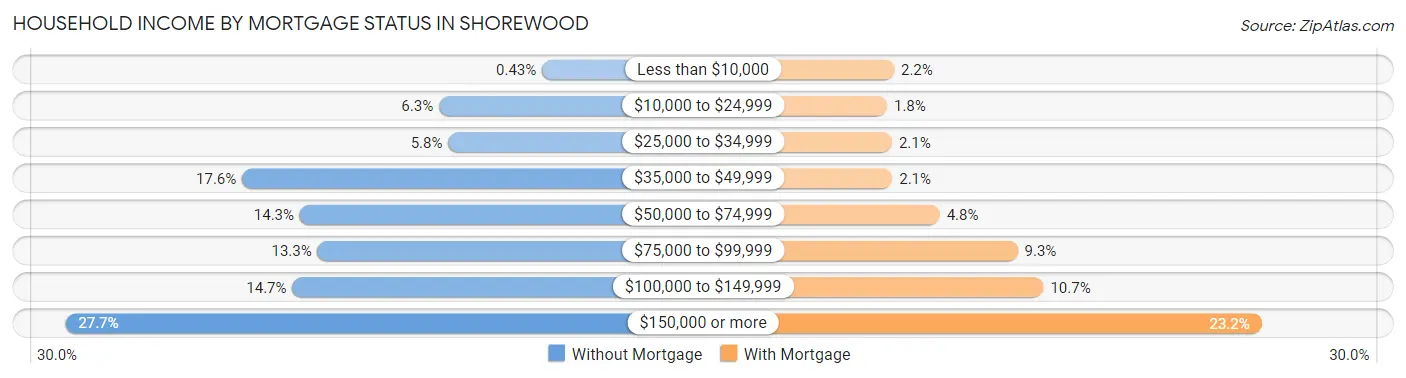
| Household Income | Without Mortgage | With Mortgage |
| Less than $10,000 | 9 (0.4%) | 88 (2.2%) |
| $10,000 to $24,999 | 132 (6.3%) | 72 (1.8%) |
| $25,000 to $34,999 | 121 (5.8%) | 83 (2.1%) |
| $35,000 to $49,999 | 367 (17.6%) | 84 (2.1%) |
| $50,000 to $74,999 | 298 (14.3%) | 192 (4.8%) |
| $75,000 to $99,999 | 277 (13.3%) | 370 (9.3%) |
| $100,000 to $149,999 | 307 (14.7%) | 429 (10.7%) |
| $150,000 or more | 578 (27.7%) | 927 (23.2%) |
| Total | 2,089 (100.0%) | 3,995 (100.0%) |
Property Value to Household Income Ratio in Shorewood
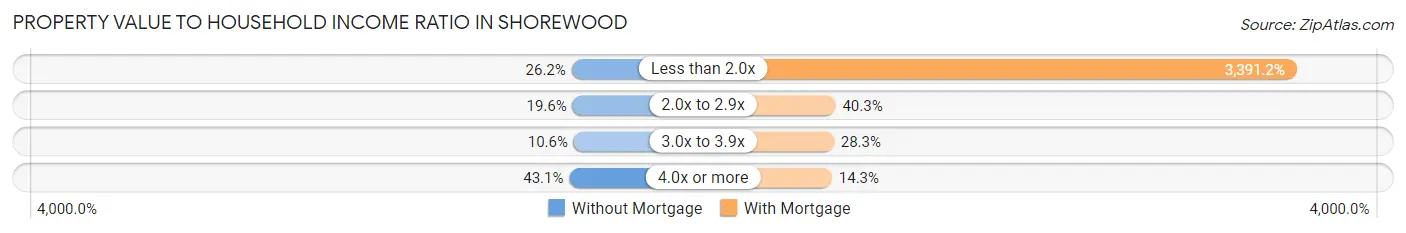
| Value-to-Income Ratio | Without Mortgage | With Mortgage |
| Less than 2.0x | 548 (26.2%) | 135,479 (3,391.2%) |
| 2.0x to 2.9x | 410 (19.6%) | 1,610 (40.3%) |
| 3.0x to 3.9x | 222 (10.6%) | 1,132 (28.3%) |
| 4.0x or more | 900 (43.1%) | 571 (14.3%) |
| Total | 2,089 (100.0%) | 3,995 (100.0%) |
Real Estate Taxes by Mortgage Status in Shorewood
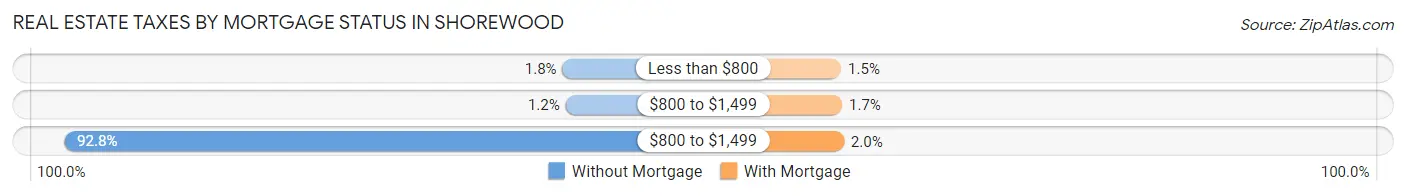
| Property Taxes | Without Mortgage | With Mortgage |
| Less than $800 | 37 (1.8%) | 59 (1.5%) |
| $800 to $1,499 | 25 (1.2%) | 66 (1.7%) |
| $800 to $1,499 | 1,938 (92.8%) | 79 (2.0%) |
| Total | 2,089 (100.0%) | 3,995 (100.0%) |
Health & Disability in Shorewood
Health Insurance Coverage by Age in Shorewood
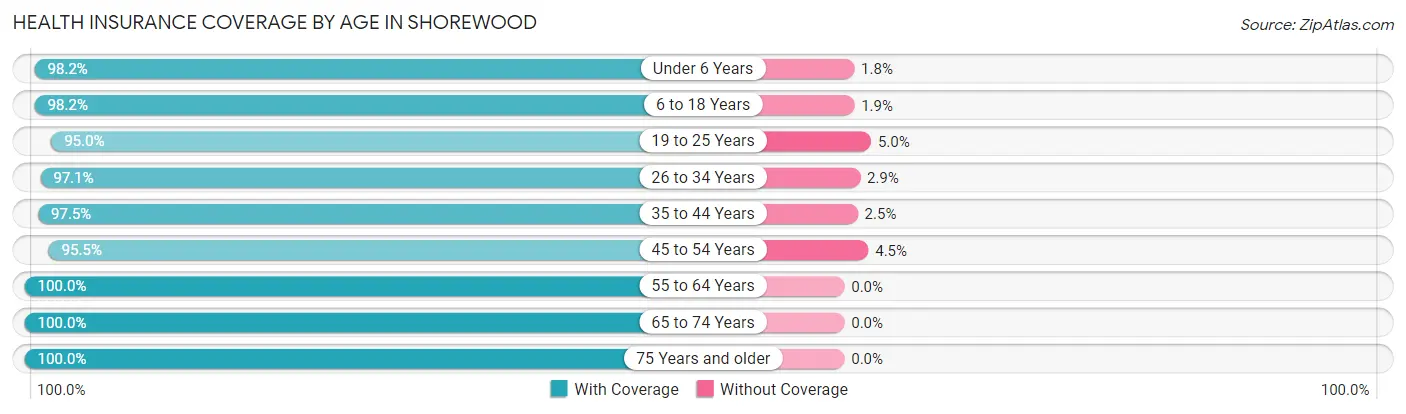
| Age Bracket | With Coverage | Without Coverage |
| Under 6 Years | 962 (98.2%) | 18 (1.8%) |
| 6 to 18 Years | 3,398 (98.2%) | 64 (1.8%) |
| 19 to 25 Years | 1,110 (95.0%) | 58 (5.0%) |
| 26 to 34 Years | 1,590 (97.1%) | 48 (2.9%) |
| 35 to 44 Years | 2,306 (97.5%) | 59 (2.5%) |
| 45 to 54 Years | 2,224 (95.5%) | 104 (4.5%) |
| 55 to 64 Years | 2,288 (100.0%) | 0 (0.0%) |
| 65 to 74 Years | 2,349 (100.0%) | 0 (0.0%) |
| 75 Years and older | 1,516 (100.0%) | 0 (0.0%) |
| Total | 17,743 (98.1%) | 351 (1.9%) |
Health Insurance Coverage by Citizenship Status in Shorewood
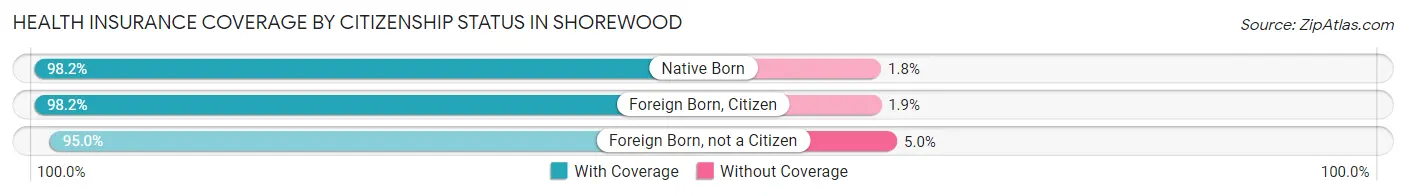
| Citizenship Status | With Coverage | Without Coverage |
| Native Born | 962 (98.2%) | 18 (1.8%) |
| Foreign Born, Citizen | 3,398 (98.2%) | 64 (1.8%) |
| Foreign Born, not a Citizen | 1,110 (95.0%) | 58 (5.0%) |
Health Insurance Coverage by Household Income in Shorewood
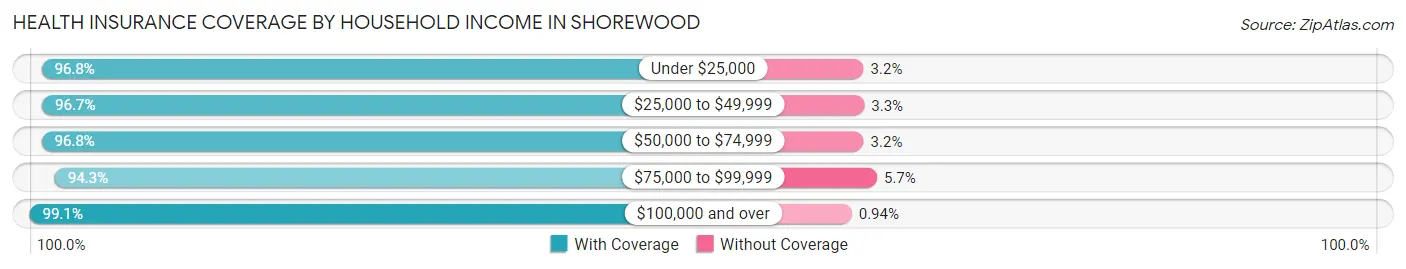
| Household Income | With Coverage | Without Coverage |
| Under $25,000 | 612 (96.8%) | 20 (3.2%) |
| $25,000 to $49,999 | 1,439 (96.7%) | 49 (3.3%) |
| $50,000 to $74,999 | 1,256 (96.8%) | 41 (3.2%) |
| $75,000 to $99,999 | 2,062 (94.3%) | 124 (5.7%) |
| $100,000 and over | 12,354 (99.1%) | 117 (0.9%) |
Public vs Private Health Insurance Coverage by Age in Shorewood
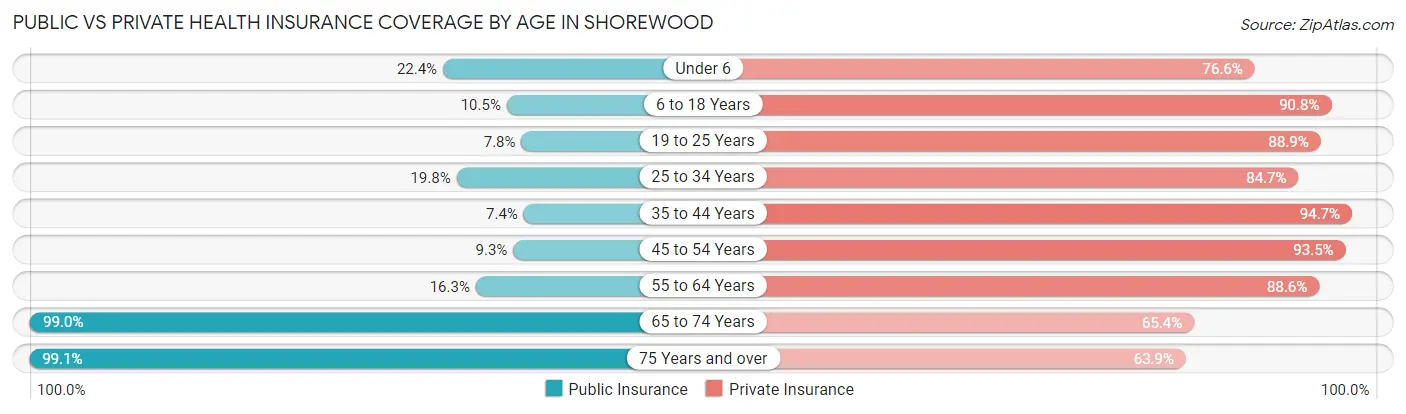
| Age Bracket | Public Insurance | Private Insurance |
| Under 6 | 219 (22.4%) | 751 (76.6%) |
| 6 to 18 Years | 364 (10.5%) | 3,145 (90.8%) |
| 19 to 25 Years | 91 (7.8%) | 1,038 (88.9%) |
| 25 to 34 Years | 325 (19.8%) | 1,388 (84.7%) |
| 35 to 44 Years | 174 (7.4%) | 2,239 (94.7%) |
| 45 to 54 Years | 217 (9.3%) | 2,176 (93.5%) |
| 55 to 64 Years | 372 (16.3%) | 2,027 (88.6%) |
| 65 to 74 Years | 2,325 (99.0%) | 1,536 (65.4%) |
| 75 Years and over | 1,503 (99.1%) | 968 (63.8%) |
| Total | 5,590 (30.9%) | 15,268 (84.4%) |
Disability Status by Sex by Age in Shorewood
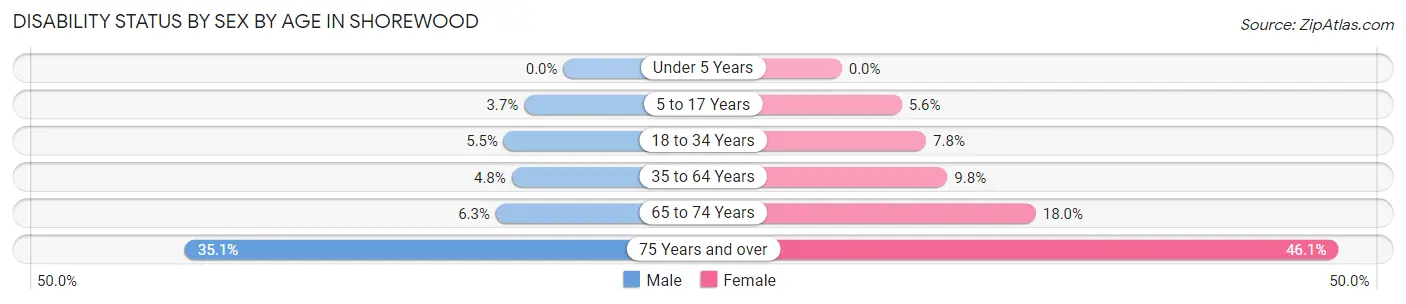
| Age Bracket | Male | Female |
| Under 5 Years | 0 (0.0%) | 0 (0.0%) |
| 5 to 17 Years | 63 (3.6%) | 83 (5.6%) |
| 18 to 34 Years | 104 (5.5%) | 104 (7.8%) |
| 35 to 64 Years | 164 (4.8%) | 349 (9.8%) |
| 65 to 74 Years | 69 (6.3%) | 225 (18.0%) |
| 75 Years and over | 242 (35.1%) | 381 (46.1%) |
Disability Class by Sex by Age in Shorewood
Disability Class: Hearing Difficulty
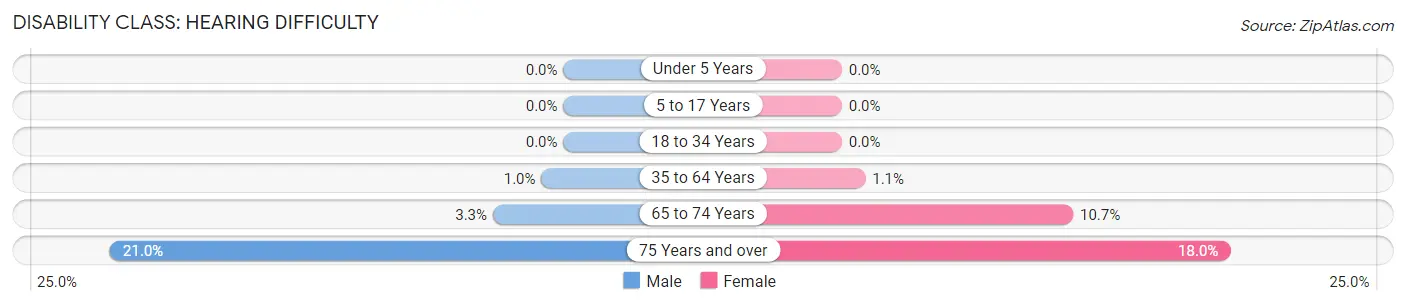
| Age Bracket | Male | Female |
| Under 5 Years | 0 (0.0%) | 0 (0.0%) |
| 5 to 17 Years | 0 (0.0%) | 0 (0.0%) |
| 18 to 34 Years | 0 (0.0%) | 0 (0.0%) |
| 35 to 64 Years | 35 (1.0%) | 39 (1.1%) |
| 65 to 74 Years | 36 (3.3%) | 134 (10.7%) |
| 75 Years and over | 145 (21.0%) | 149 (18.0%) |
Disability Class: Vision Difficulty
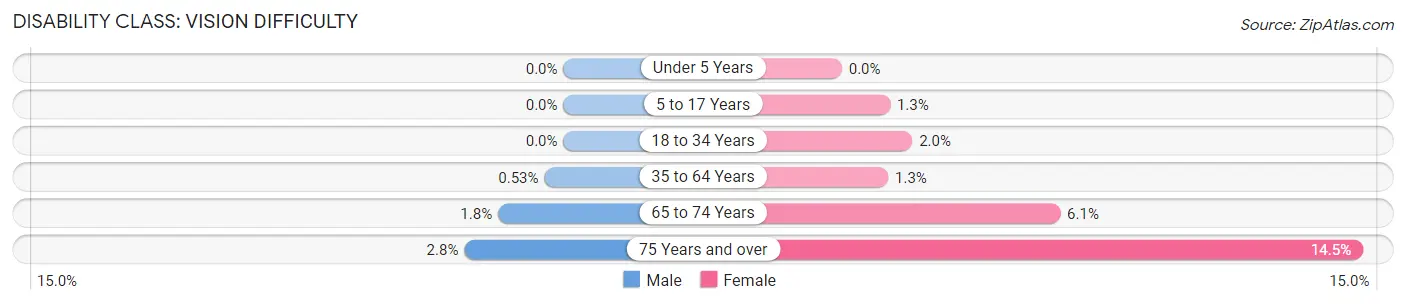
| Age Bracket | Male | Female |
| Under 5 Years | 0 (0.0%) | 0 (0.0%) |
| 5 to 17 Years | 0 (0.0%) | 20 (1.3%) |
| 18 to 34 Years | 0 (0.0%) | 26 (2.0%) |
| 35 to 64 Years | 18 (0.5%) | 46 (1.3%) |
| 65 to 74 Years | 20 (1.8%) | 76 (6.1%) |
| 75 Years and over | 19 (2.8%) | 120 (14.5%) |
Disability Class: Cognitive Difficulty
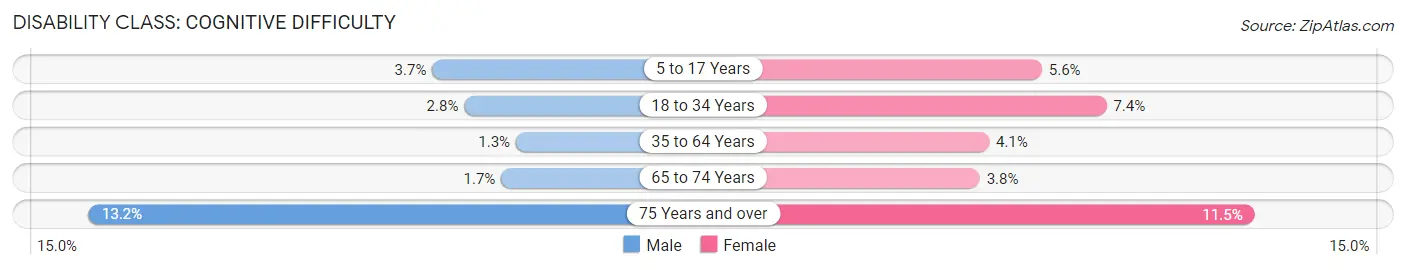
| Age Bracket | Male | Female |
| 5 to 17 Years | 63 (3.6%) | 83 (5.6%) |
| 18 to 34 Years | 52 (2.8%) | 98 (7.4%) |
| 35 to 64 Years | 45 (1.3%) | 146 (4.1%) |
| 65 to 74 Years | 19 (1.7%) | 48 (3.8%) |
| 75 Years and over | 91 (13.2%) | 95 (11.5%) |
Disability Class: Ambulatory Difficulty
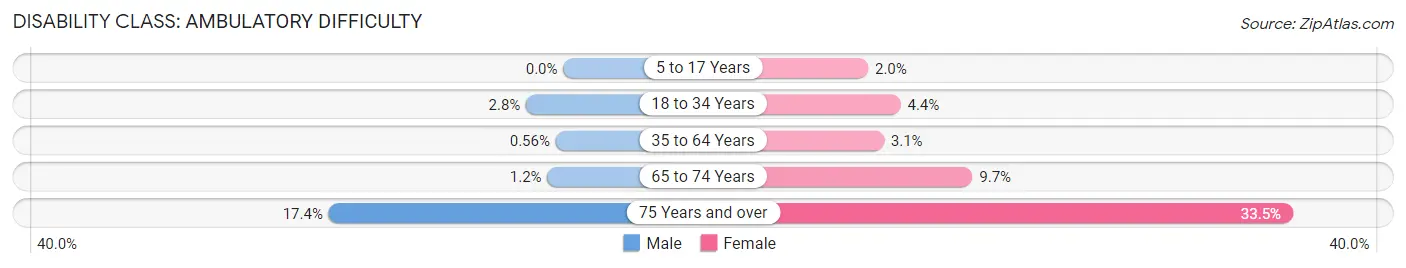
| Age Bracket | Male | Female |
| 5 to 17 Years | 0 (0.0%) | 29 (1.9%) |
| 18 to 34 Years | 52 (2.8%) | 58 (4.4%) |
| 35 to 64 Years | 19 (0.6%) | 111 (3.1%) |
| 65 to 74 Years | 13 (1.2%) | 121 (9.7%) |
| 75 Years and over | 120 (17.4%) | 277 (33.5%) |
Disability Class: Self-Care Difficulty
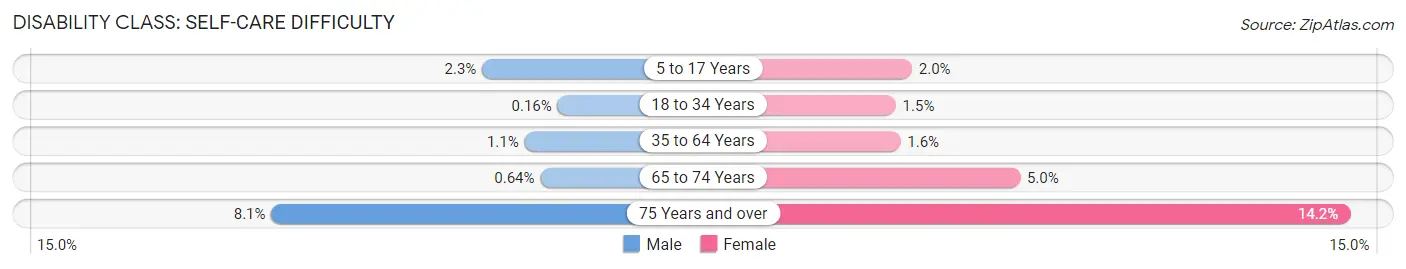
| Age Bracket | Male | Female |
| 5 to 17 Years | 39 (2.3%) | 29 (1.9%) |
| 18 to 34 Years | 3 (0.2%) | 20 (1.5%) |
| 35 to 64 Years | 37 (1.1%) | 58 (1.6%) |
| 65 to 74 Years | 7 (0.6%) | 62 (5.0%) |
| 75 Years and over | 56 (8.1%) | 117 (14.1%) |
Technology Access in Shorewood
Computing Device Access in Shorewood
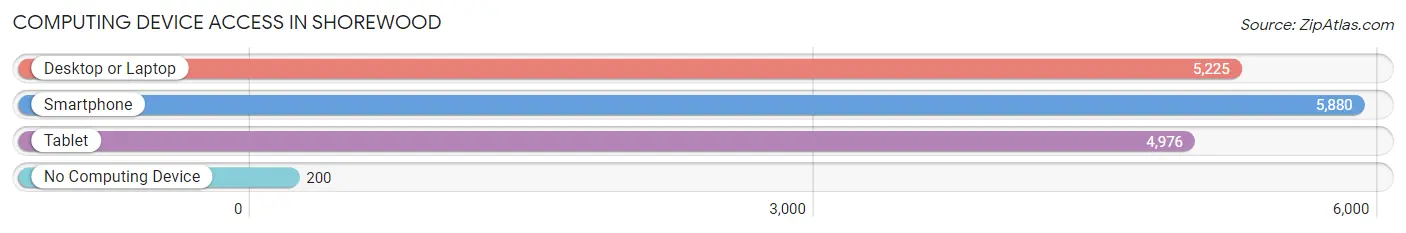
| Device Type | # Households | % Households |
| Desktop or Laptop | 5,225 | 82.2% |
| Smartphone | 5,880 | 92.5% |
| Tablet | 4,976 | 78.2% |
| No Computing Device | 200 | 3.2% |
| Total | 6,359 | 100.0% |
Internet Access in Shorewood
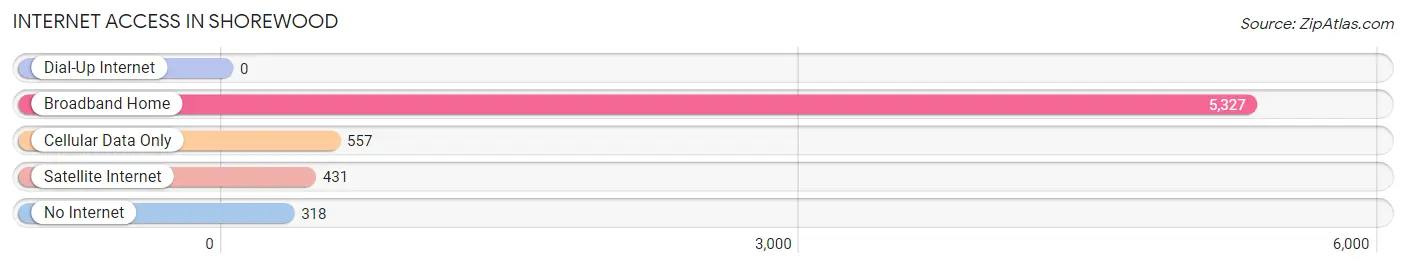
| Internet Type | # Households | % Households |
| Dial-Up Internet | 0 | 0.0% |
| Broadband Home | 5,327 | 83.8% |
| Cellular Data Only | 557 | 8.8% |
| Satellite Internet | 431 | 6.8% |
| No Internet | 318 | 5.0% |
| Total | 6,359 | 100.0% |
Shorewood Summary
Shorewood, Illinois is a village located in Will County, Illinois, United States. The population was 8,837 at the 2010 census. It is part of the Chicago metropolitan area.
History
Shorewood was first settled in 1834 by a group of settlers from New York. The village was originally known as "Newark," but was later renamed "Shorewood" in 1869. The name was chosen to reflect the village's proximity to the Des Plaines River.
The village was incorporated in 1887 and has since grown to become a thriving community. The village has a rich history of industry, including a brickyard, a lumber mill, and a coal mine.
Geography
Shorewood is located at 41°31'17" North, 88°10'17" West (41.5214, -88.1714). The village is situated on the Des Plaines River, which forms the western boundary of the village. The village is located approximately 25 miles southwest of downtown Chicago.
The village has a total area of 4.2 square miles, all of which is land. The village is located in a flat, low-lying area, with an elevation of 645 feet above sea level.
Economy
Shorewood's economy is largely based on manufacturing and retail. The village is home to several large manufacturing companies, including Caterpillar, Inc., and John Deere. The village also has a number of retail stores, including a Walmart Supercenter, a Target, and a Kohl's.
The village also has a number of restaurants, including a McDonald's, a Subway, and a Burger King. The village also has a number of small businesses, including a hardware store, a pharmacy, and a grocery store.
Demographics
As of the 2010 census, the population of Shorewood was 8,837. The racial makeup of the village was 87.3% White, 5.2% African American, 0.4% Native American, 2.2% Asian, 0.1% Pacific Islander, 2.2% from other races, and 2.7% from two or more races. Hispanic or Latino of any race were 6.3% of the population.
The median income for a household in the village was $63,917, and the median income for a family was $76,917. The per capita income for the village was $30,917. About 4.2% of families and 5.7% of the population were below the poverty line, including 6.7% of those under age 18 and 4.2% of those age 65 or over.
Common Questions
What is Per Capita Income in Shorewood?
Per Capita income in Shorewood is $47,739.
What is the Median Family Income in Shorewood?
Median Family Income in Shorewood is $138,500.
What is the Median Household income in Shorewood?
Median Household Income in Shorewood is $119,904.
What is Income or Wage Gap in Shorewood?
Income or Wage Gap in Shorewood is 41.2%.
Women in Shorewood earn 58.8 cents for every dollar earned by a man.
What is Family Income Deficit in Shorewood?
Family Income Deficit in Shorewood is $10,204.
Families that are below poverty line in Shorewood earn $10,204 less on average than the poverty threshold level.
What is Inequality or Gini Index in Shorewood?
Inequality or Gini Index in Shorewood is 0.37.
What is the Total Population of Shorewood?
Total Population of Shorewood is 18,109.
What is the Total Male Population of Shorewood?
Total Male Population of Shorewood is 9,342.
What is the Total Female Population of Shorewood?
Total Female Population of Shorewood is 8,767.
What is the Ratio of Males per 100 Females in Shorewood?
There are 106.56 Males per 100 Females in Shorewood.
What is the Ratio of Females per 100 Males in Shorewood?
There are 93.85 Females per 100 Males in Shorewood.
What is the Median Population Age in Shorewood?
Median Population Age in Shorewood is 42.6 Years.
What is the Average Family Size in Shorewood
Average Family Size in Shorewood is 3.3 People.
What is the Average Household Size in Shorewood
Average Household Size in Shorewood is 2.8 People.
How Large is the Labor Force in Shorewood?
There are 8,883 People in the Labor Forcein in Shorewood.
What is the Percentage of People in the Labor Force in Shorewood?
61.0% of People are in the Labor Force in Shorewood.
What is the Unemployment Rate in Shorewood?
Unemployment Rate in Shorewood is 4.9%.