Troutville borough, PA Map & Demographics
Troutville borough Overview
$24,737
PER CAPITA INCOME
$75,833
AVG FAMILY INCOME
$75,417
AVG HOUSEHOLD INCOME
55.3%
WAGE / INCOME GAP [ % ]
44.7¢/ $1
WAGE / INCOME GAP [ $ ]
0.36
INEQUALITY / GINI INDEX
218
TOTAL POPULATION
108
MALE POPULATION
110
FEMALE POPULATION
98.18
MALES / 100 FEMALES
101.85
FEMALES / 100 MALES
25.0
MEDIAN AGE
5.2
AVG FAMILY SIZE
4.0
AVG HOUSEHOLD SIZE
73
LABOR FORCE [ PEOPLE ]
53.3%
PERCENT IN LABOR FORCE
Income in Troutville borough
Income Overview in Troutville borough
Per Capita Income in Troutville borough is $24,737, while median incomes of families and households are $75,833 and $75,417 respectively.
| Characteristic | Number | Measure |
| Per Capita Income | 218 | $24,737 |
| Median Family Income | 36 | $75,833 |
| Mean Family Income | 36 | $93,281 |
| Median Household Income | 55 | $75,417 |
| Mean Household Income | 55 | $92,162 |
| Income Deficit | 36 | $0 |
| Wage / Income Gap (%) | 218 | 55.28% |
| Wage / Income Gap ($) | 218 | 44.72¢ per $1 |
| Gini / Inequality Index | 218 | 0.36 |
Earnings by Sex in Troutville borough
Average Earnings in Troutville borough are $51,667, $61,500 for men and $27,500 for women, a difference of 55.3%.
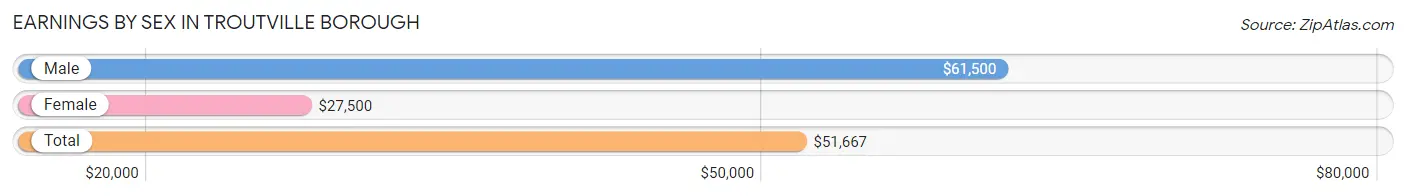
| Sex | Number | Average Earnings |
| Male | 48 (58.5%) | $61,500 |
| Female | 34 (41.5%) | $27,500 |
| Total | 82 (100.0%) | $51,667 |
Earnings by Sex by Income Bracket in Troutville borough
The most common earnings brackets in Troutville borough are $75,000 to $99,999 for men (12 | 25.0%) and $75,000 to $99,999 for women (8 | 23.5%).
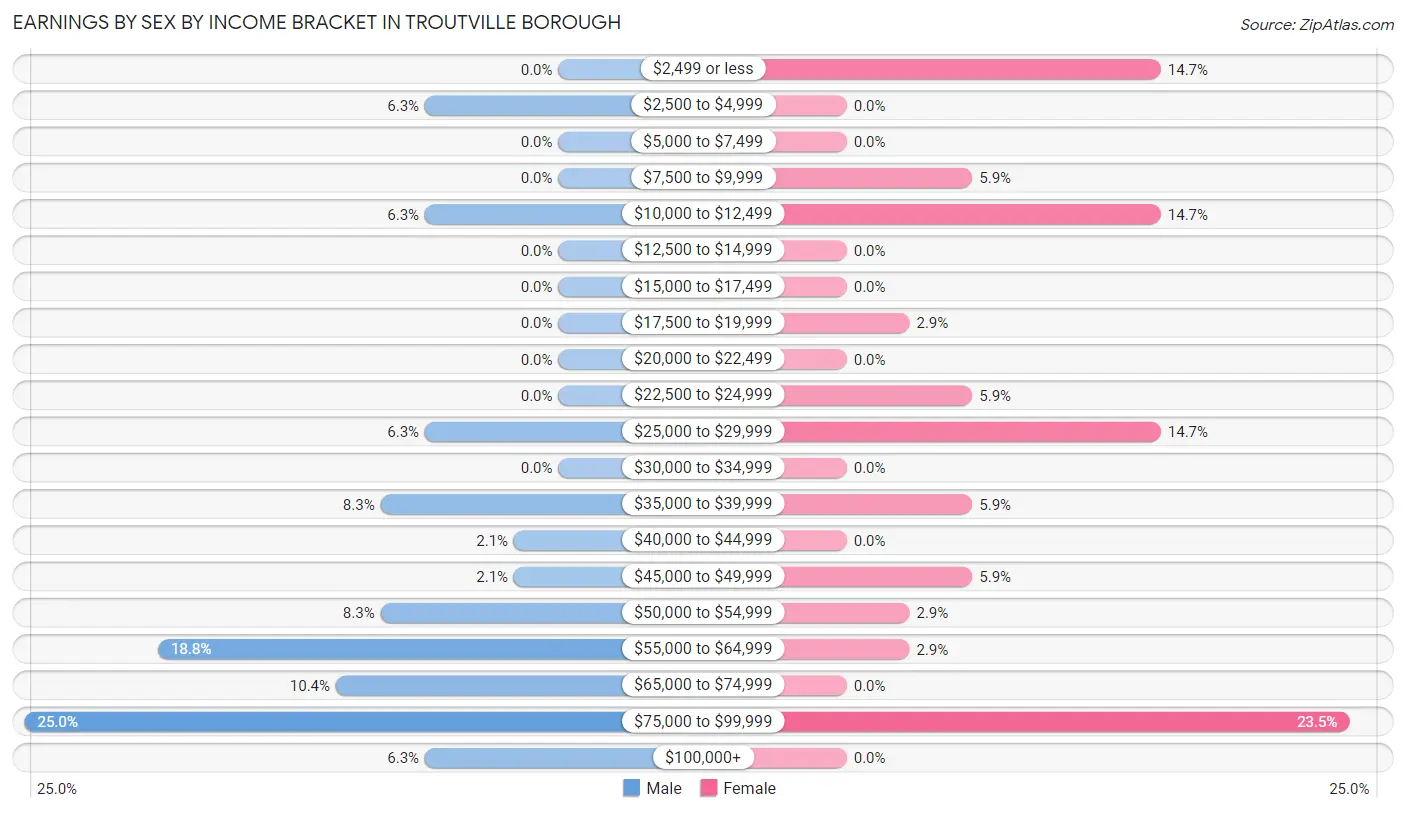
| Income | Male | Female |
| $2,499 or less | 0 (0.0%) | 5 (14.7%) |
| $2,500 to $4,999 | 3 (6.2%) | 0 (0.0%) |
| $5,000 to $7,499 | 0 (0.0%) | 0 (0.0%) |
| $7,500 to $9,999 | 0 (0.0%) | 2 (5.9%) |
| $10,000 to $12,499 | 3 (6.2%) | 5 (14.7%) |
| $12,500 to $14,999 | 0 (0.0%) | 0 (0.0%) |
| $15,000 to $17,499 | 0 (0.0%) | 0 (0.0%) |
| $17,500 to $19,999 | 0 (0.0%) | 1 (2.9%) |
| $20,000 to $22,499 | 0 (0.0%) | 0 (0.0%) |
| $22,500 to $24,999 | 0 (0.0%) | 2 (5.9%) |
| $25,000 to $29,999 | 3 (6.2%) | 5 (14.7%) |
| $30,000 to $34,999 | 0 (0.0%) | 0 (0.0%) |
| $35,000 to $39,999 | 4 (8.3%) | 2 (5.9%) |
| $40,000 to $44,999 | 1 (2.1%) | 0 (0.0%) |
| $45,000 to $49,999 | 1 (2.1%) | 2 (5.9%) |
| $50,000 to $54,999 | 4 (8.3%) | 1 (2.9%) |
| $55,000 to $64,999 | 9 (18.8%) | 1 (2.9%) |
| $65,000 to $74,999 | 5 (10.4%) | 0 (0.0%) |
| $75,000 to $99,999 | 12 (25.0%) | 8 (23.5%) |
| $100,000+ | 3 (6.2%) | 0 (0.0%) |
| Total | 48 (100.0%) | 34 (100.0%) |
Earnings by Sex by Educational Attainment in Troutville borough
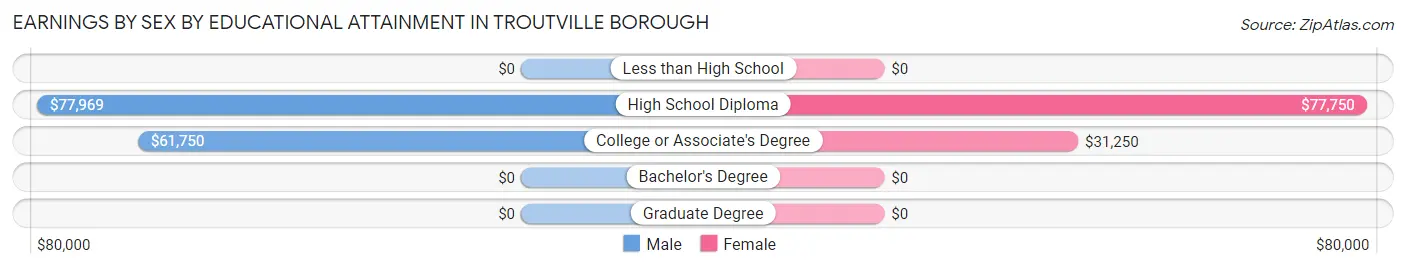
| Educational Attainment | Male Income | Female Income |
| Less than High School | - | - |
| High School Diploma | $77,969 | $77,750 |
| College or Associate's Degree | $61,750 | $31,250 |
| Bachelor's Degree | - | - |
| Graduate Degree | - | - |
| Total | $63,750 | $0 |
Family Income in Troutville borough
Family Income Brackets in Troutville borough
According to the Troutville borough family income data, there are 13 families falling into the $50,000 to $74,999 income range, which is the most common income bracket and makes up 36.1% of all families.
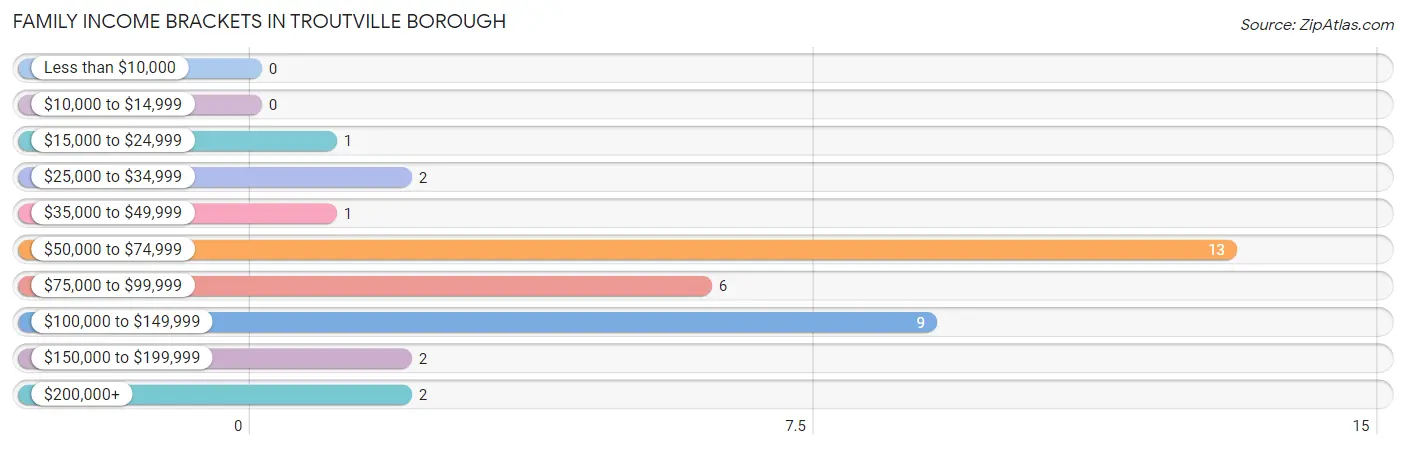
| Income Bracket | # Families | % Families |
| Less than $10,000 | 0 | 0.0% |
| $10,000 to $14,999 | 0 | 0.0% |
| $15,000 to $24,999 | 1 | 2.8% |
| $25,000 to $34,999 | 2 | 5.6% |
| $35,000 to $49,999 | 1 | 2.8% |
| $50,000 to $74,999 | 13 | 36.1% |
| $75,000 to $99,999 | 6 | 16.7% |
| $100,000 to $149,999 | 9 | 25.0% |
| $150,000 to $199,999 | 2 | 5.6% |
| $200,000+ | 2 | 5.6% |
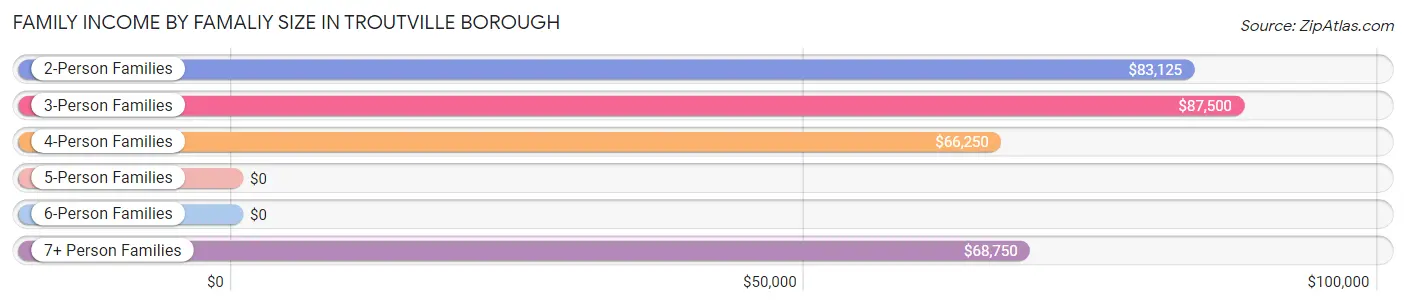
Family Income by Famaliy Size in Troutville borough
3-person families (4 | 11.1%) account for the highest median family income in Troutville borough with $87,500 per family, while 2-person families (15 | 41.7%) have the highest median income of $41,562 per family member.
| Income Bracket | # Families | Median Income |
| 2-Person Families | 15 (41.7%) | $83,125 |
| 3-Person Families | 4 (11.1%) | $87,500 |
| 4-Person Families | 7 (19.4%) | $66,250 |
| 5-Person Families | 2 (5.6%) | $0 |
| 6-Person Families | 0 (0.0%) | $0 |
| 7+ Person Families | 8 (22.2%) | $68,750 |
| Total | 36 (100.0%) | $75,833 |
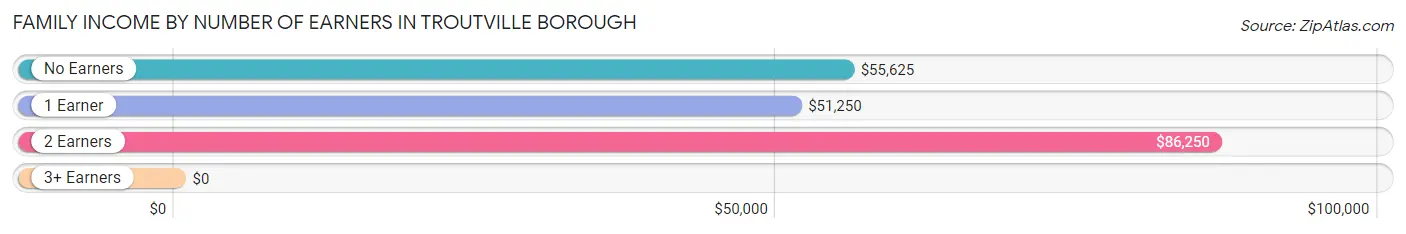
Family Income by Number of Earners in Troutville borough
| Number of Earners | # Families | Median Income |
| No Earners | 5 (13.9%) | $55,625 |
| 1 Earner | 7 (19.4%) | $51,250 |
| 2 Earners | 23 (63.9%) | $86,250 |
| 3+ Earners | 1 (2.8%) | $0 |
| Total | 36 (100.0%) | $75,833 |
Household Income in Troutville borough
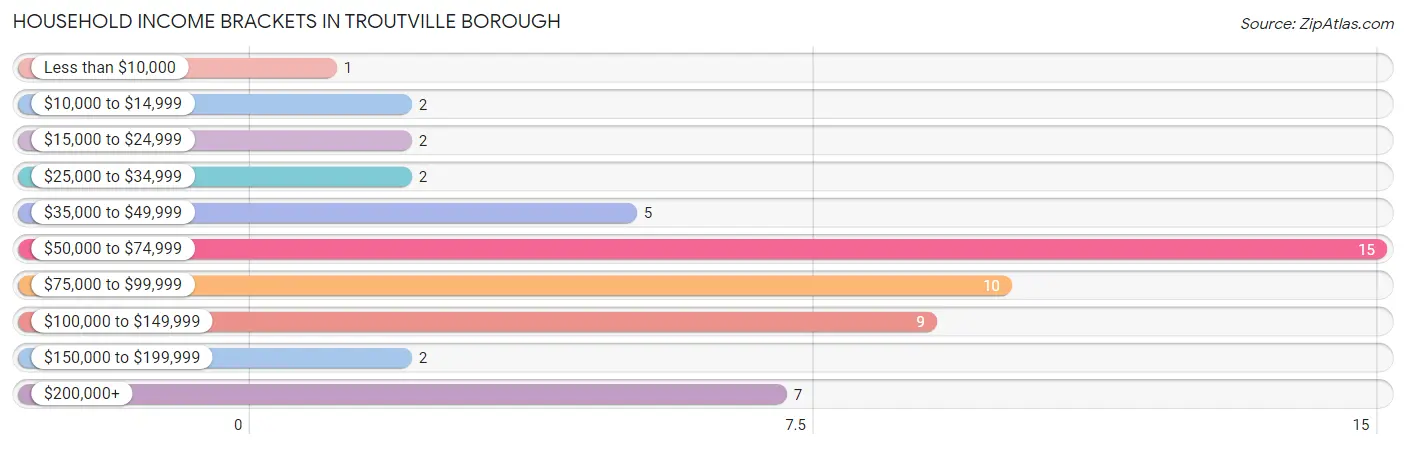
Household Income Brackets in Troutville borough
With 15 households falling in the category, the $50,000 to $74,999 income range is the most frequent in Troutville borough, accounting for 27.3% of all households. In contrast, only 1 households (1.8%) fall into the less than $10,000 income bracket, making it the least populous group.
| Income Bracket | # Households | % Households |
| Less than $10,000 | 1 | 1.8% |
| $10,000 to $14,999 | 2 | 3.6% |
| $15,000 to $24,999 | 2 | 3.6% |
| $25,000 to $34,999 | 2 | 3.6% |
| $35,000 to $49,999 | 5 | 9.1% |
| $50,000 to $74,999 | 15 | 27.3% |
| $75,000 to $99,999 | 10 | 18.2% |
| $100,000 to $149,999 | 9 | 16.4% |
| $150,000 to $199,999 | 2 | 3.6% |
| $200,000+ | 7 | 12.7% |
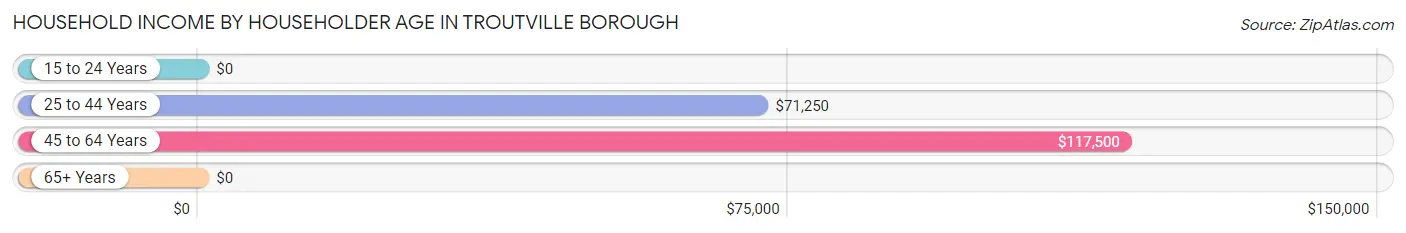
Household Income by Householder Age in Troutville borough
The median household income in Troutville borough is $75,417, with the highest median household income of $117,500 found in the 45 to 64 years age bracket for the primary householder. A total of 20 households (36.4%) fall into this category. Meanwhile, the 15 to 24 years age bracket for the primary householder has the lowest median household income of $0, with 1 households (1.8%) in this group.
| Income Bracket | # Households | Median Income |
| 15 to 24 Years | 1 (1.8%) | $0 |
| 25 to 44 Years | 20 (36.4%) | $71,250 |
| 45 to 64 Years | 20 (36.4%) | $117,500 |
| 65+ Years | 14 (25.5%) | $0 |
| Total | 55 (100.0%) | $75,417 |
Poverty in Troutville borough
Income Below Poverty by Sex and Age in Troutville borough
With 0.9% poverty level for males and 4.5% for females among the residents of Troutville borough, 75 year old and over males and 25 to 34 year old females are the most vulnerable to poverty, with 1 males (14.3%) and 2 females (18.2%) in their respective age groups living below the poverty level.
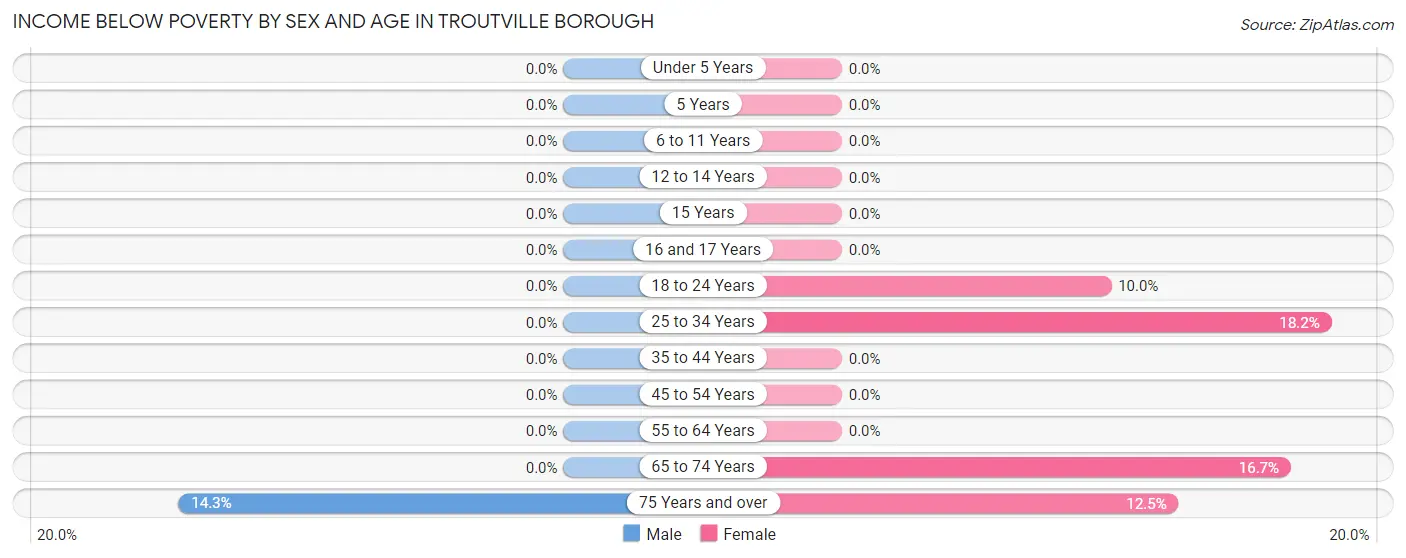
| Age Bracket | Male | Female |
| Under 5 Years | 0 (0.0%) | 0 (0.0%) |
| 5 Years | 0 (0.0%) | 0 (0.0%) |
| 6 to 11 Years | 0 (0.0%) | 0 (0.0%) |
| 12 to 14 Years | 0 (0.0%) | 0 (0.0%) |
| 15 Years | 0 (0.0%) | 0 (0.0%) |
| 16 and 17 Years | 0 (0.0%) | 0 (0.0%) |
| 18 to 24 Years | 0 (0.0%) | 1 (10.0%) |
| 25 to 34 Years | 0 (0.0%) | 2 (18.2%) |
| 35 to 44 Years | 0 (0.0%) | 0 (0.0%) |
| 45 to 54 Years | 0 (0.0%) | 0 (0.0%) |
| 55 to 64 Years | 0 (0.0%) | 0 (0.0%) |
| 65 to 74 Years | 0 (0.0%) | 1 (16.7%) |
| 75 Years and over | 1 (14.3%) | 1 (12.5%) |
| Total | 1 (0.9%) | 5 (4.5%) |
Income Above Poverty by Sex and Age in Troutville borough
According to the poverty statistics in Troutville borough, males aged under 5 years and females aged under 5 years are the age groups that are most secure financially, with 100.0% of males and 100.0% of females in these age groups living above the poverty line.
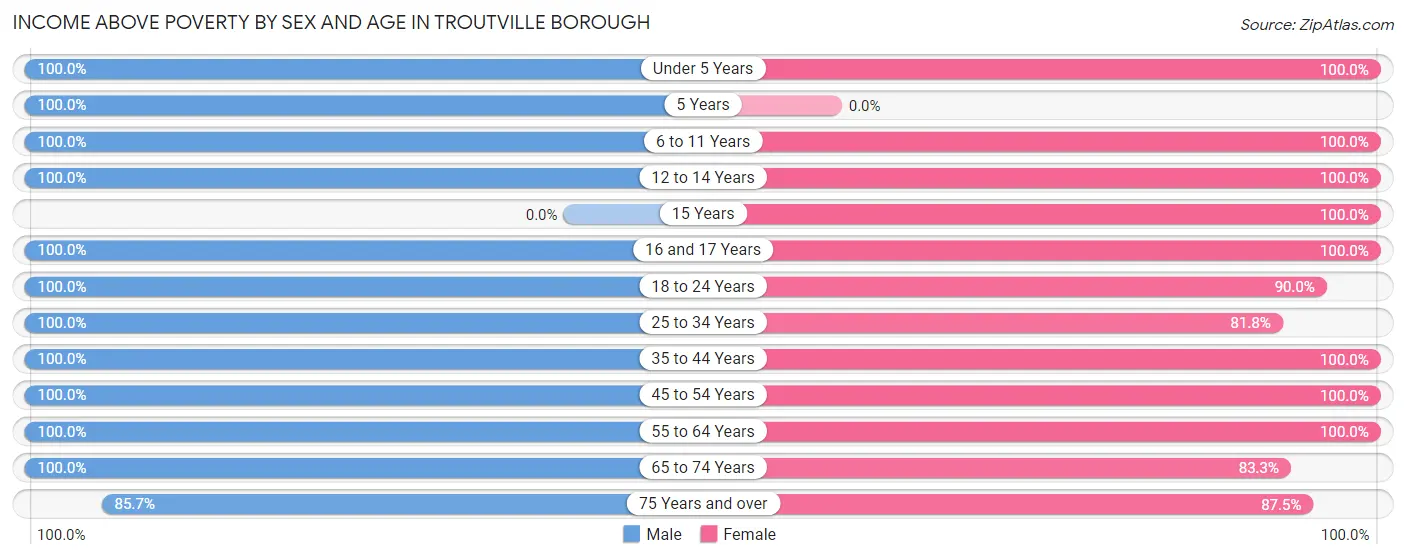
| Age Bracket | Male | Female |
| Under 5 Years | 14 (100.0%) | 8 (100.0%) |
| 5 Years | 1 (100.0%) | 0 (0.0%) |
| 6 to 11 Years | 20 (100.0%) | 10 (100.0%) |
| 12 to 14 Years | 10 (100.0%) | 14 (100.0%) |
| 15 Years | 0 (0.0%) | 4 (100.0%) |
| 16 and 17 Years | 3 (100.0%) | 6 (100.0%) |
| 18 to 24 Years | 9 (100.0%) | 9 (90.0%) |
| 25 to 34 Years | 16 (100.0%) | 9 (81.8%) |
| 35 to 44 Years | 6 (100.0%) | 9 (100.0%) |
| 45 to 54 Years | 10 (100.0%) | 12 (100.0%) |
| 55 to 64 Years | 11 (100.0%) | 12 (100.0%) |
| 65 to 74 Years | 1 (100.0%) | 5 (83.3%) |
| 75 Years and over | 6 (85.7%) | 7 (87.5%) |
| Total | 107 (99.1%) | 105 (95.5%) |
Income Below Poverty Among Married-Couple Families in Troutville borough
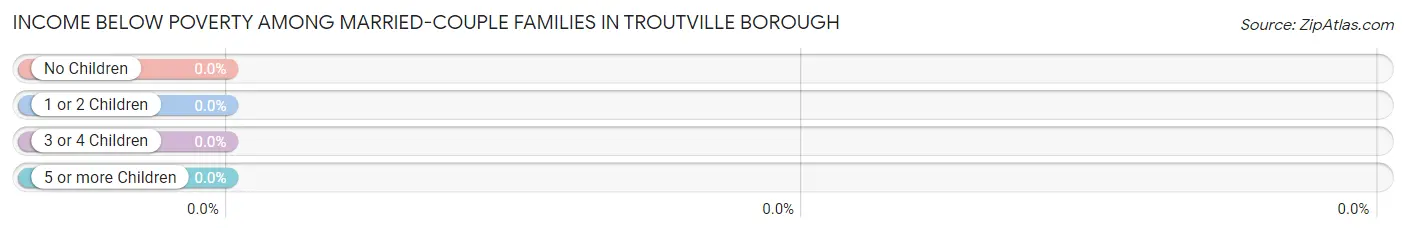
| Children | Above Poverty | Below Poverty |
| No Children | 15 (100.0%) | 0 (0.0%) |
| 1 or 2 Children | 10 (100.0%) | 0 (0.0%) |
| 3 or 4 Children | 0 (0.0%) | 0 (0.0%) |
| 5 or more Children | 8 (100.0%) | 0 (0.0%) |
| Total | 33 (100.0%) | 0 (0.0%) |
Income Below Poverty Among Single-Parent Households in Troutville borough
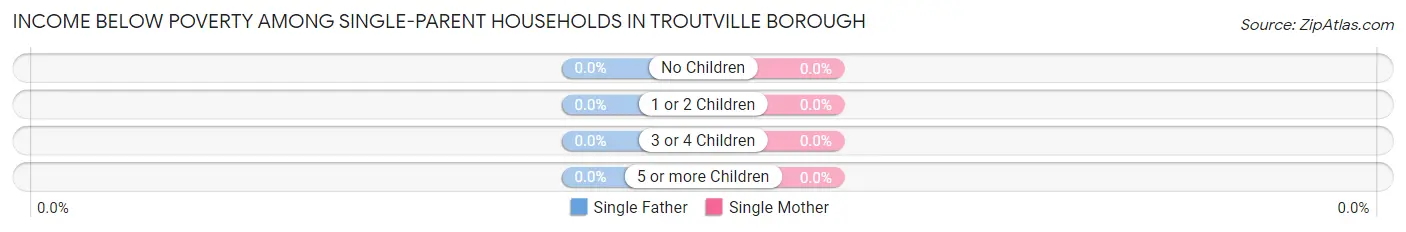
| Children | Single Father | Single Mother |
| No Children | 0 (0.0%) | 0 (0.0%) |
| 1 or 2 Children | 0 (0.0%) | 0 (0.0%) |
| 3 or 4 Children | 0 (0.0%) | 0 (0.0%) |
| 5 or more Children | 0 (0.0%) | 0 (0.0%) |
| Total | 0 (0.0%) | 0 (0.0%) |
Income Below Poverty Among Married-Couple vs Single-Parent Households in Troutville borough
| Children | Married-Couple Families | Single-Parent Households |
| No Children | 0 (0.0%) | 0 (0.0%) |
| 1 or 2 Children | 0 (0.0%) | 0 (0.0%) |
| 3 or 4 Children | 0 (0.0%) | 0 (0.0%) |
| 5 or more Children | 0 (0.0%) | 0 (0.0%) |
| Total | 0 (0.0%) | 0 (0.0%) |
Race in Troutville borough
The most populous races in Troutville borough are White / Caucasian (204 | 93.6%), Some other Race (11 | 5.1%), and Two or more Races (3 | 1.4%).
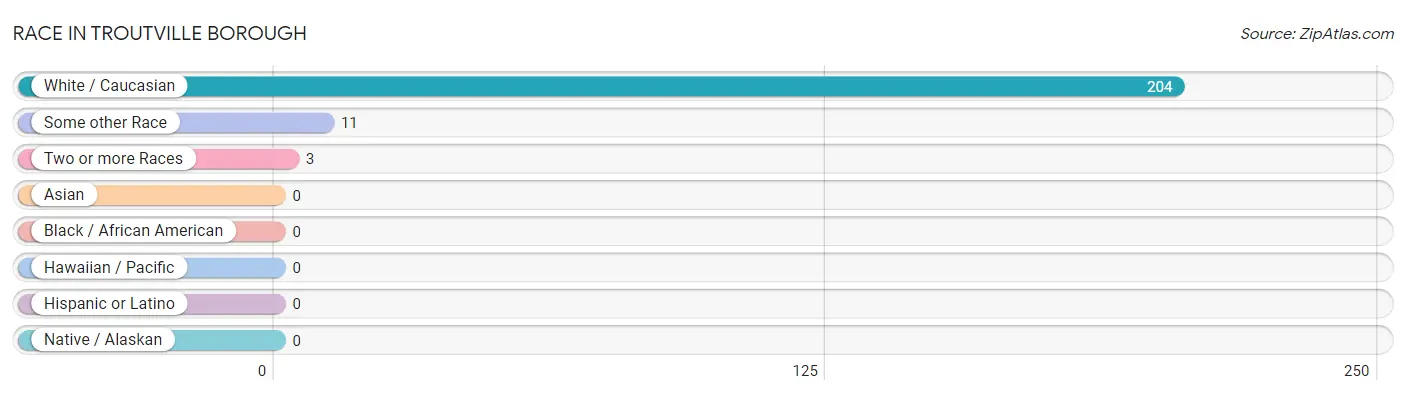
| Race | # Population | % Population |
| Asian | 0 | 0.0% |
| Black / African American | 0 | 0.0% |
| Hawaiian / Pacific | 0 | 0.0% |
| Hispanic or Latino | 0 | 0.0% |
| Native / Alaskan | 0 | 0.0% |
| White / Caucasian | 204 | 93.6% |
| Two or more Races | 3 | 1.4% |
| Some other Race | 11 | 5.1% |
| Total | 218 | 100.0% |
Ancestry in Troutville borough
The most populous ancestries reported in Troutville borough are German (45 | 20.6%), Dutch (23 | 10.5%), Italian (21 | 9.6%), Polish (13 | 6.0%), and Irish (12 | 5.5%), together accounting for 52.3% of all Troutville borough residents.
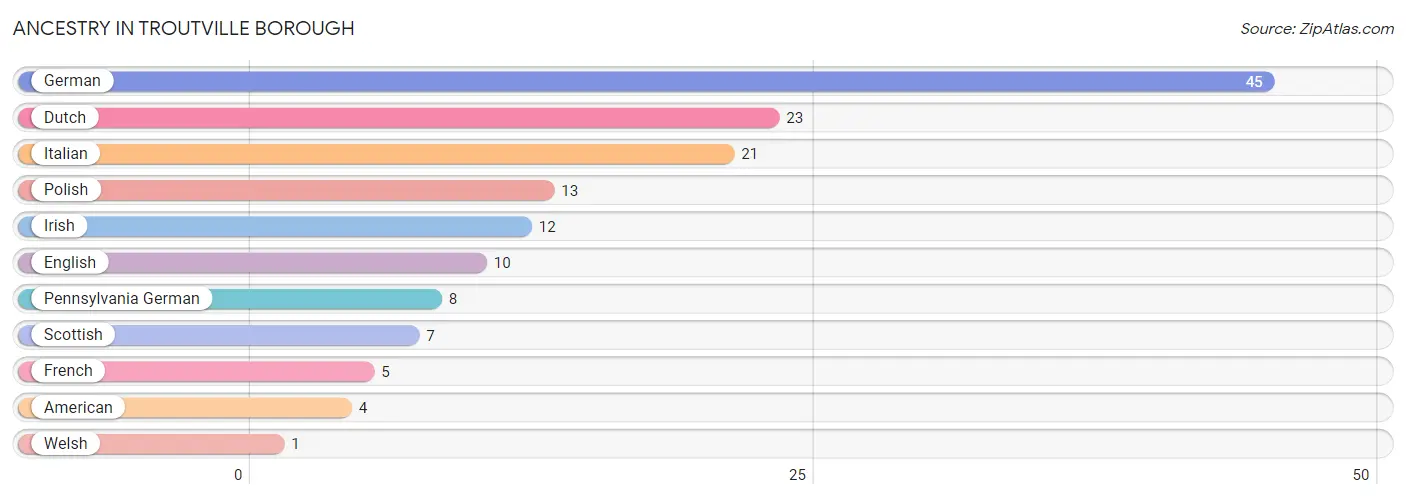
| Ancestry | # Population | % Population |
| American | 4 | 1.8% |
| Dutch | 23 | 10.5% |
| English | 10 | 4.6% |
| French | 5 | 2.3% |
| German | 45 | 20.6% |
| Irish | 12 | 5.5% |
| Italian | 21 | 9.6% |
| Pennsylvania German | 8 | 3.7% |
| Polish | 13 | 6.0% |
| Scottish | 7 | 3.2% |
| Welsh | 1 | 0.5% | View All 11 Rows |
Immigrants in Troutville borough
The most numerous immigrant groups reported in Troutville borough came from Asia (1 | 0.5%), Singapore (1 | 0.5%), and South Eastern Asia (1 | 0.5%), together accounting for 1.4% of all Troutville borough residents.
| Immigration Origin | # Population | % Population |
| Asia | 1 | 0.5% |
| Singapore | 1 | 0.5% |
| South Eastern Asia | 1 | 0.5% | View All 3 Rows |
Sex and Age in Troutville borough
Sex and Age in Troutville borough
The most populous age groups in Troutville borough are 5 to 9 Years (20 | 18.5%) for men and 10 to 14 Years (19 | 17.3%) for women.
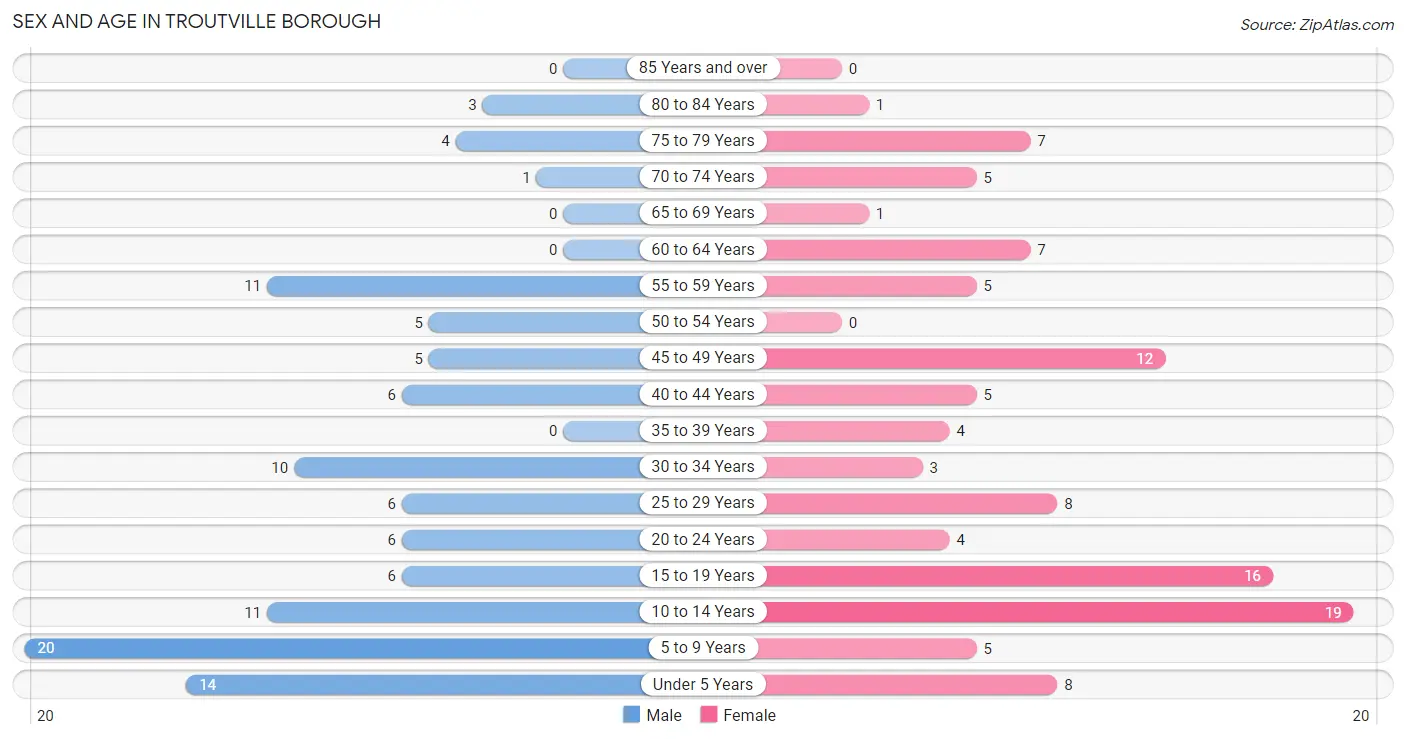
| Age Bracket | Male | Female |
| Under 5 Years | 14 (13.0%) | 8 (7.3%) |
| 5 to 9 Years | 20 (18.5%) | 5 (4.5%) |
| 10 to 14 Years | 11 (10.2%) | 19 (17.3%) |
| 15 to 19 Years | 6 (5.6%) | 16 (14.5%) |
| 20 to 24 Years | 6 (5.6%) | 4 (3.6%) |
| 25 to 29 Years | 6 (5.6%) | 8 (7.3%) |
| 30 to 34 Years | 10 (9.3%) | 3 (2.7%) |
| 35 to 39 Years | 0 (0.0%) | 4 (3.6%) |
| 40 to 44 Years | 6 (5.6%) | 5 (4.5%) |
| 45 to 49 Years | 5 (4.6%) | 12 (10.9%) |
| 50 to 54 Years | 5 (4.6%) | 0 (0.0%) |
| 55 to 59 Years | 11 (10.2%) | 5 (4.5%) |
| 60 to 64 Years | 0 (0.0%) | 7 (6.4%) |
| 65 to 69 Years | 0 (0.0%) | 1 (0.9%) |
| 70 to 74 Years | 1 (0.9%) | 5 (4.5%) |
| 75 to 79 Years | 4 (3.7%) | 7 (6.4%) |
| 80 to 84 Years | 3 (2.8%) | 1 (0.9%) |
| 85 Years and over | 0 (0.0%) | 0 (0.0%) |
| Total | 108 (100.0%) | 110 (100.0%) |
Families and Households in Troutville borough
Median Family Size in Troutville borough
The median family size in Troutville borough is 5.17 persons per family, with married-couple families (33 | 91.7%) accounting for the largest median family size of 5.42 persons per family. On the other hand, single female/mother families (2 | 5.6%) represent the smallest median family size with 2.00 persons per family.
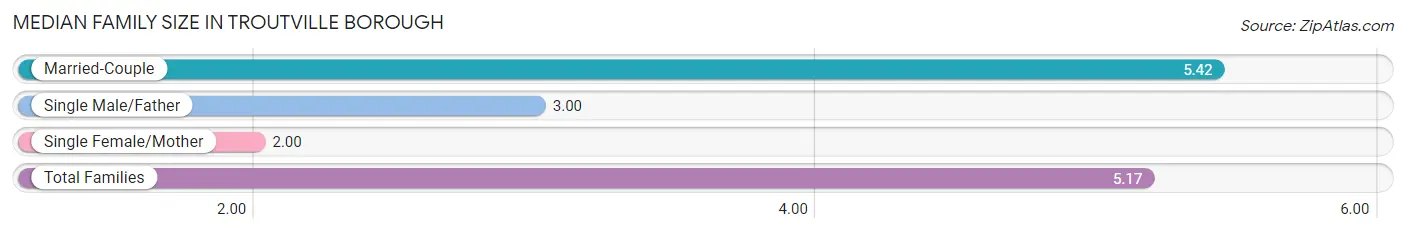
| Family Type | # Families | Family Size |
| Married-Couple | 33 (91.7%) | 5.42 |
| Single Male/Father | 1 (2.8%) | 3.00 |
| Single Female/Mother | 2 (5.6%) | 2.00 |
| Total Families | 36 (100.0%) | 5.17 |
Median Household Size in Troutville borough
The median household size in Troutville borough is 3.96 persons per household, with married-couple households (33 | 60.0%) accounting for the largest median household size of 5.42 persons per household. non-family households (19 | 34.5%) represent the smallest median household size with 1.58 persons per household.
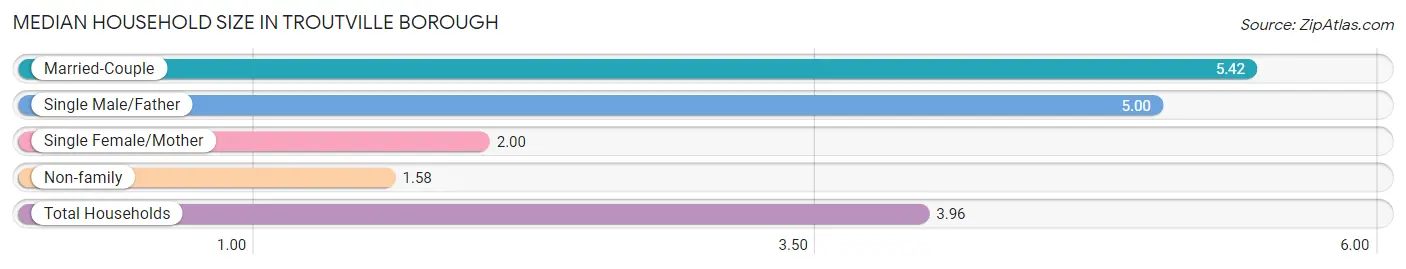
| Household Type | # Households | Household Size |
| Married-Couple | 33 (60.0%) | 5.42 |
| Single Male/Father | 1 (1.8%) | 5.00 |
| Single Female/Mother | 2 (3.6%) | 2.00 |
| Non-family | 19 (34.5%) | 1.58 |
| Total Households | 55 (100.0%) | 3.96 |
Household Size by Marriage Status in Troutville borough
Out of a total of 55 households in Troutville borough, 36 (65.4%) are family households, while 19 (34.5%) are nonfamily households. The most numerous type of family households are 2-person households, comprising 15, and the most common type of nonfamily households are 1-person households, comprising 11.
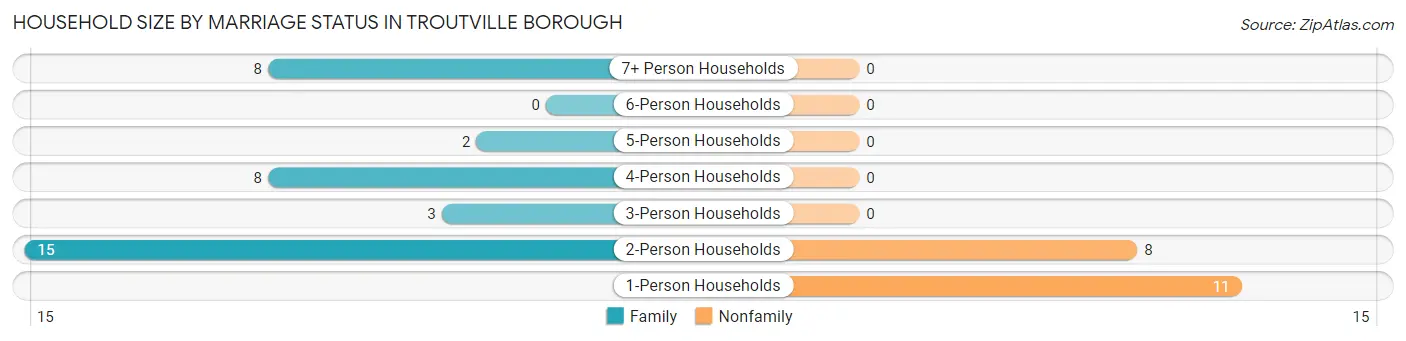
| Household Size | Family Households | Nonfamily Households |
| 1-Person Households | - | 11 (20.0%) |
| 2-Person Households | 15 (27.3%) | 8 (14.5%) |
| 3-Person Households | 3 (5.4%) | 0 (0.0%) |
| 4-Person Households | 8 (14.5%) | 0 (0.0%) |
| 5-Person Households | 2 (3.6%) | 0 (0.0%) |
| 6-Person Households | 0 (0.0%) | 0 (0.0%) |
| 7+ Person Households | 8 (14.5%) | 0 (0.0%) |
| Total | 36 (65.4%) | 19 (34.5%) |
Female Fertility in Troutville borough
Fertility by Age in Troutville borough
Average fertility rate in Troutville borough is 212.0 births per 1,000 women. Women in the age bracket of 20 to 34 years have the highest fertility rate with 733.0 births per 1,000 women. Women in the age bracket of 20 to 34 years acount for 100.0% of all women with births.
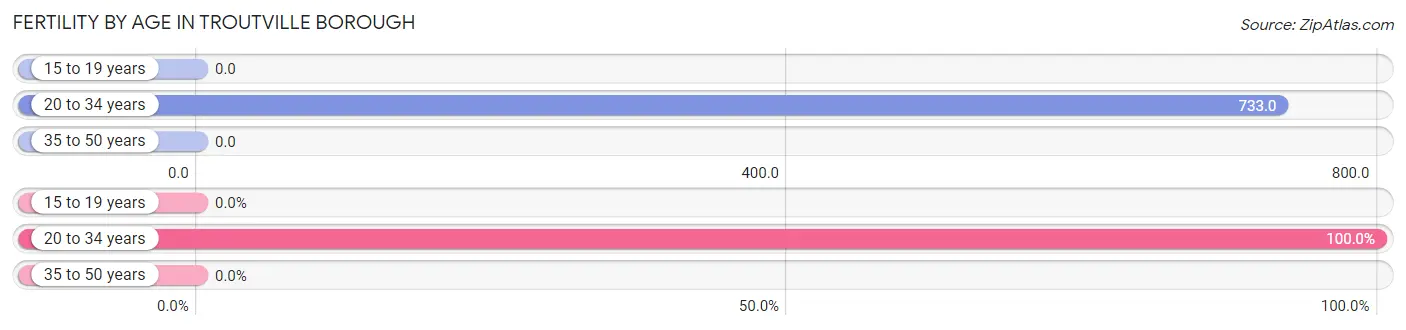
| Age Bracket | Women with Births | Births / 1,000 Women |
| 15 to 19 years | 0 (0.0%) | 0.0 |
| 20 to 34 years | 11 (100.0%) | 733.0 |
| 35 to 50 years | 0 (0.0%) | 0.0 |
| Total | 11 (100.0%) | 212.0 |
Fertility by Age by Marriage Status in Troutville borough
81.8% of women with births (11) in Troutville borough are married. The highest percentage of unmarried women with births falls into 20 to 34 years age bracket with 18.2% of them unmarried at the time of birth, while the lowest percentage of unmarried women with births belong to 20 to 34 years age bracket with 18.2% of them unmarried.
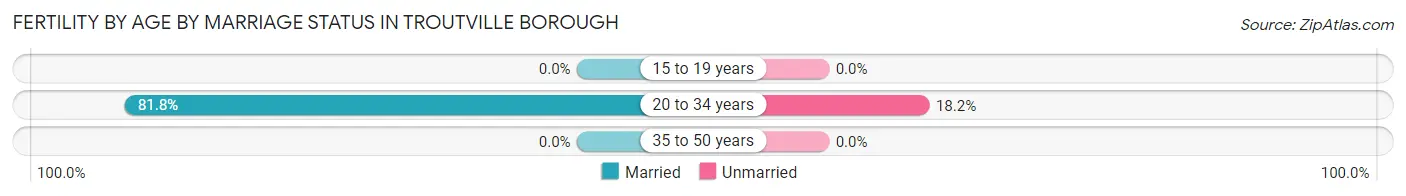
| Age Bracket | Married | Unmarried |
| 15 to 19 years | 0 (0.0%) | 0 (0.0%) |
| 20 to 34 years | 9 (81.8%) | 2 (18.2%) |
| 35 to 50 years | 0 (0.0%) | 0 (0.0%) |
| Total | 9 (81.8%) | 2 (18.2%) |
Fertility by Education in Troutville borough
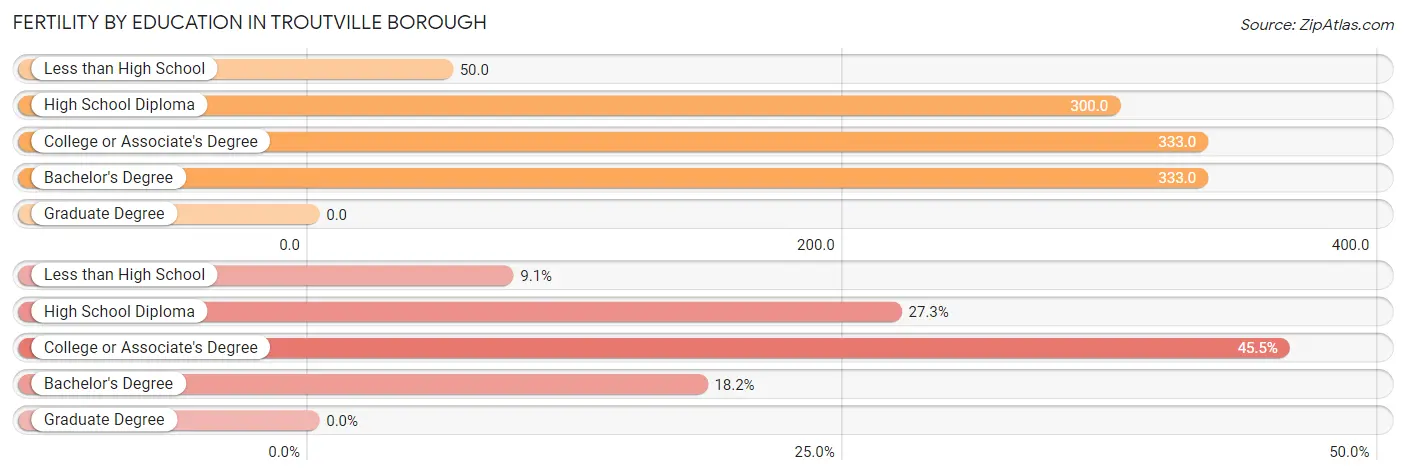
| Educational Attainment | Women with Births | Births / 1,000 Women |
| Less than High School | 1 (9.1%) | 50.0 |
| High School Diploma | 3 (27.3%) | 300.0 |
| College or Associate's Degree | 5 (45.5%) | 333.0 |
| Bachelor's Degree | 2 (18.2%) | 333.0 |
| Graduate Degree | 0 (0.0%) | 0.0 |
| Total | 11 (100.0%) | 212.0 |
Fertility by Education by Marriage Status in Troutville borough
18.2% of women with births in Troutville borough are unmarried. Women with the educational attainment of less than high school are most likely to be married with 100.0% of them married at childbirth, while women with the educational attainment of high school diploma are least likely to be married with 66.7% of them unmarried at childbirth.
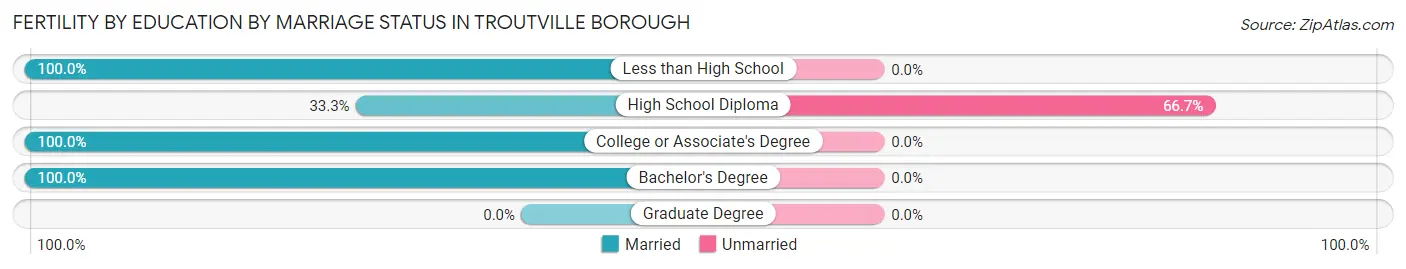
| Educational Attainment | Married | Unmarried |
| Less than High School | 1 (100.0%) | 0 (0.0%) |
| High School Diploma | 1 (33.3%) | 2 (66.7%) |
| College or Associate's Degree | 5 (100.0%) | 0 (0.0%) |
| Bachelor's Degree | 2 (100.0%) | 0 (0.0%) |
| Graduate Degree | 0 (0.0%) | 0 (0.0%) |
| Total | 9 (81.8%) | 2 (18.2%) |
Employment Characteristics in Troutville borough
Employment by Class of Employer in Troutville borough
Among the 71 employed individuals in Troutville borough, private company employees (51 | 71.8%), federal government employees (5 | 7.0%), and self-employed (not incorporated) (4 | 5.6%) make up the most common classes of employment.
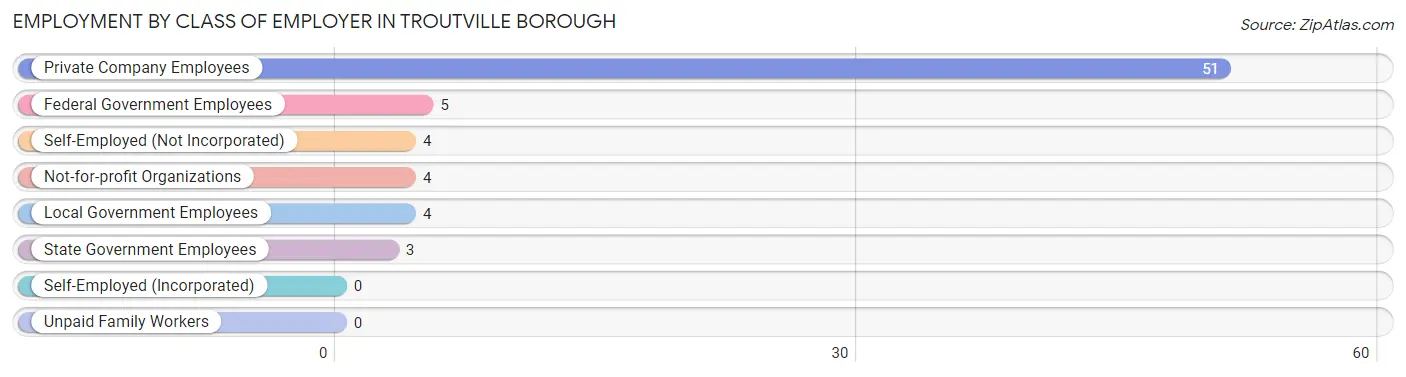
| Employer Class | # Employees | % Employees |
| Private Company Employees | 51 | 71.8% |
| Self-Employed (Incorporated) | 0 | 0.0% |
| Self-Employed (Not Incorporated) | 4 | 5.6% |
| Not-for-profit Organizations | 4 | 5.6% |
| Local Government Employees | 4 | 5.6% |
| State Government Employees | 3 | 4.2% |
| Federal Government Employees | 5 | 7.0% |
| Unpaid Family Workers | 0 | 0.0% |
| Total | 71 | 100.0% |
Employment Status by Age in Troutville borough
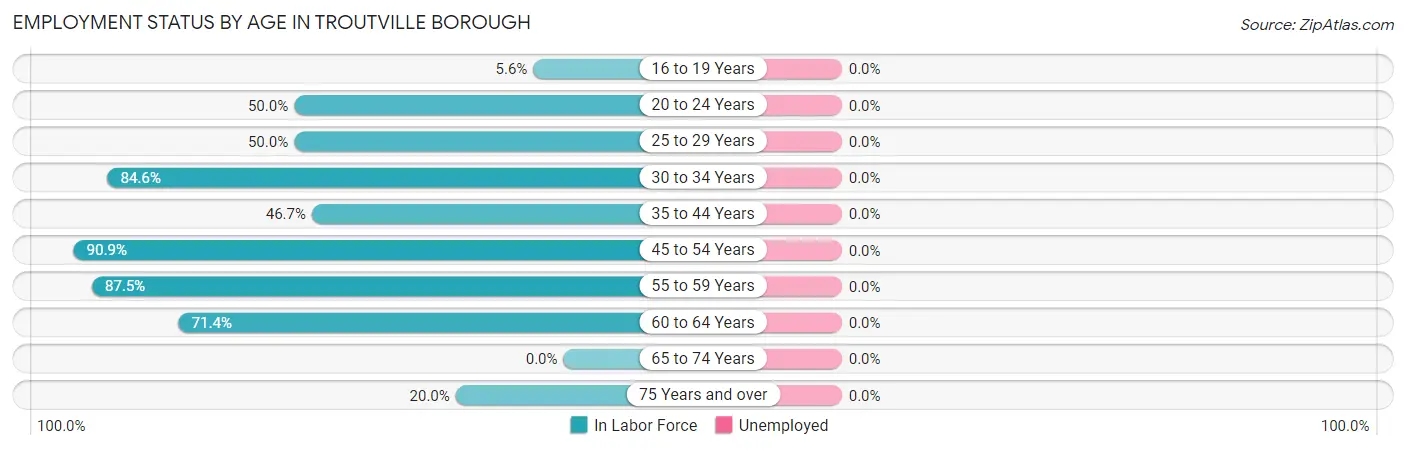
| Age Bracket | In Labor Force | Unemployed |
| 16 to 19 Years | 1 (5.6%) | 0 (0.0%) |
| 20 to 24 Years | 5 (50.0%) | 0 (0.0%) |
| 25 to 29 Years | 7 (50.0%) | 0 (0.0%) |
| 30 to 34 Years | 11 (84.6%) | 0 (0.0%) |
| 35 to 44 Years | 7 (46.7%) | 0 (0.0%) |
| 45 to 54 Years | 20 (90.9%) | 0 (0.0%) |
| 55 to 59 Years | 14 (87.5%) | 0 (0.0%) |
| 60 to 64 Years | 5 (71.4%) | 0 (0.0%) |
| 65 to 74 Years | 0 (0.0%) | 0 (0.0%) |
| 75 Years and over | 3 (20.0%) | 0 (0.0%) |
| Total | 73 (53.3%) | 0 (0.0%) |
Employment Status by Educational Attainment in Troutville borough
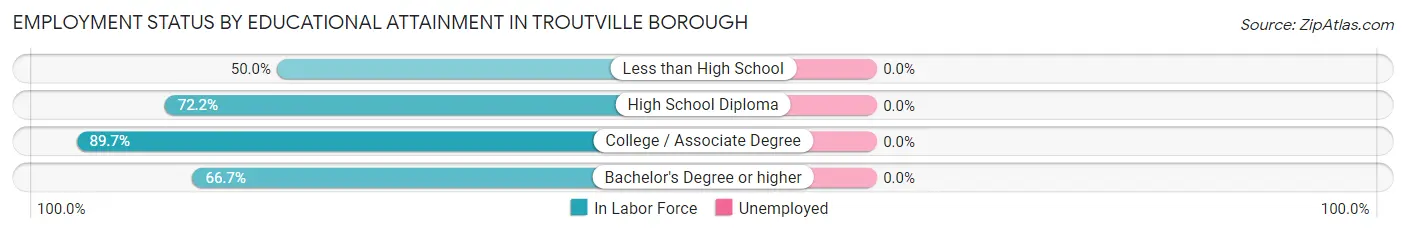
| Educational Attainment | In Labor Force | Unemployed |
| Less than High School | 8 (50.0%) | 0 (0.0%) |
| High School Diploma | 26 (72.2%) | 0 (0.0%) |
| College / Associate Degree | 26 (89.7%) | 0 (0.0%) |
| Bachelor's Degree or higher | 4 (66.7%) | 0 (0.0%) |
| Total | 64 (73.6%) | 0 (0.0%) |
Employment Occupations by Sex in Troutville borough
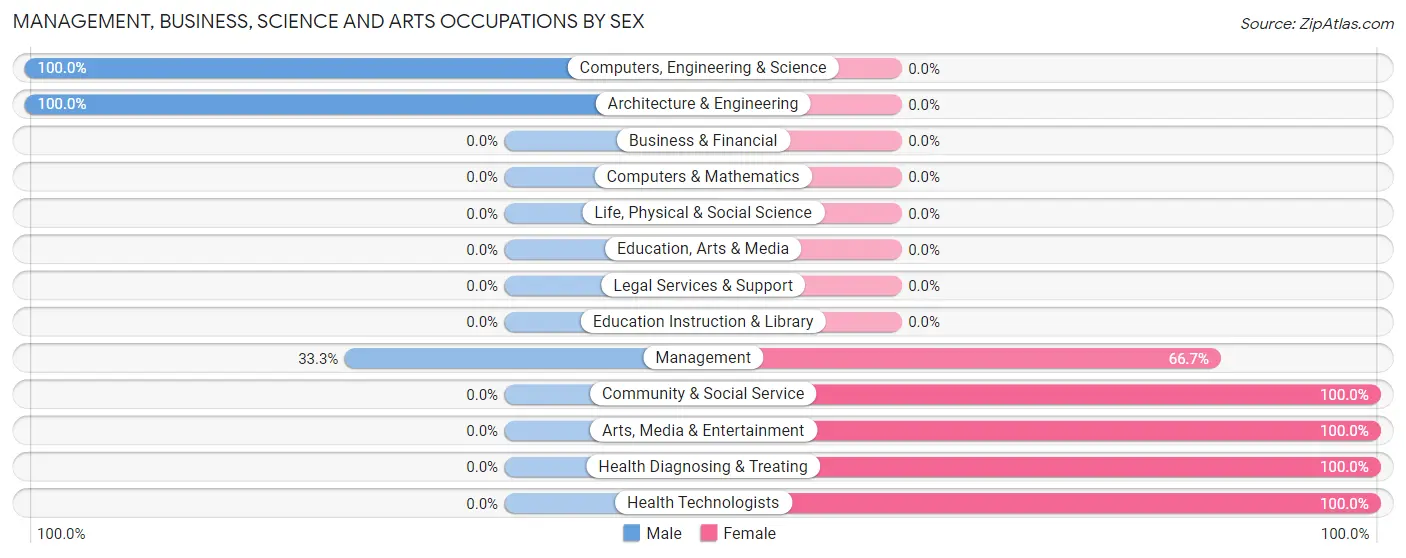
Management, Business, Science and Arts Occupations
The most common Management, Business, Science and Arts occupations in Troutville borough are Management (9 | 12.3%), Health Diagnosing & Treating (5 | 6.9%), Health Technologists (4 | 5.5%), Community & Social Service (2 | 2.7%), and Arts, Media & Entertainment (2 | 2.7%).
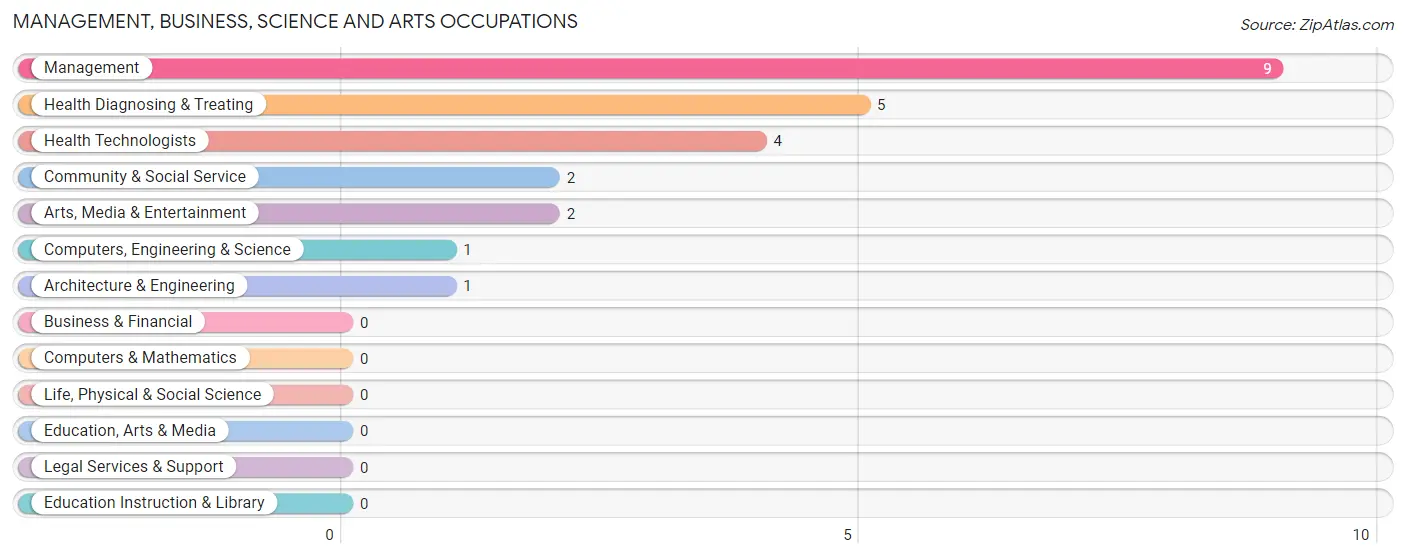
Management, Business, Science and Arts Occupations by Sex
Within the Management, Business, Science and Arts occupations in Troutville borough, the most male-oriented occupations are Computers, Engineering & Science (100.0%), Architecture & Engineering (100.0%), and Management (33.3%), while the most female-oriented occupations are Community & Social Service (100.0%), Arts, Media & Entertainment (100.0%), and Health Diagnosing & Treating (100.0%).
| Occupation | Male | Female |
| Management | 3 (33.3%) | 6 (66.7%) |
| Business & Financial | 0 (0.0%) | 0 (0.0%) |
| Computers, Engineering & Science | 1 (100.0%) | 0 (0.0%) |
| Computers & Mathematics | 0 (0.0%) | 0 (0.0%) |
| Architecture & Engineering | 1 (100.0%) | 0 (0.0%) |
| Life, Physical & Social Science | 0 (0.0%) | 0 (0.0%) |
| Community & Social Service | 0 (0.0%) | 2 (100.0%) |
| Education, Arts & Media | 0 (0.0%) | 0 (0.0%) |
| Legal Services & Support | 0 (0.0%) | 0 (0.0%) |
| Education Instruction & Library | 0 (0.0%) | 0 (0.0%) |
| Arts, Media & Entertainment | 0 (0.0%) | 2 (100.0%) |
| Health Diagnosing & Treating | 0 (0.0%) | 5 (100.0%) |
| Health Technologists | 0 (0.0%) | 4 (100.0%) |
| Total (Category) | 4 (23.5%) | 13 (76.5%) |
| Total (Overall) | 44 (60.3%) | 29 (39.7%) |
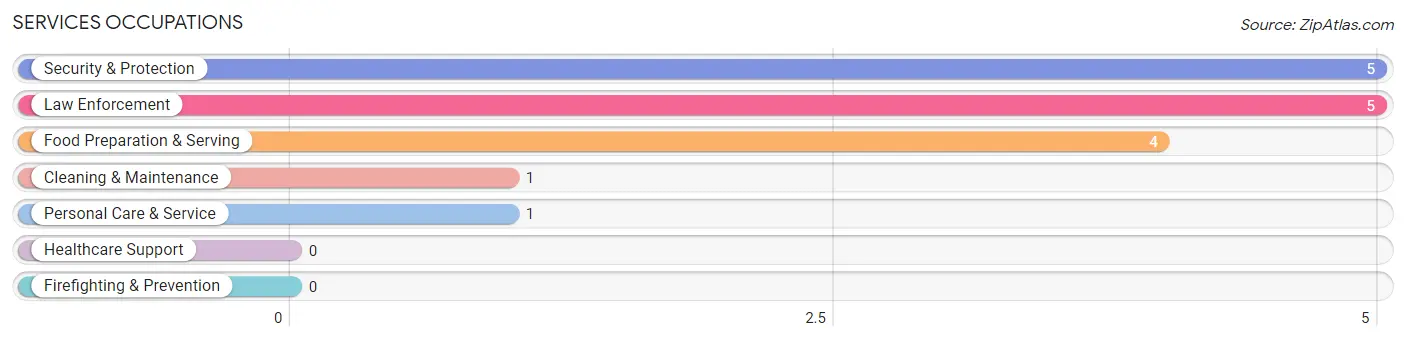
Services Occupations
The most common Services occupations in Troutville borough are Security & Protection (5 | 6.9%), Law Enforcement (5 | 6.9%), Food Preparation & Serving (4 | 5.5%), Cleaning & Maintenance (1 | 1.4%), and Personal Care & Service (1 | 1.4%).
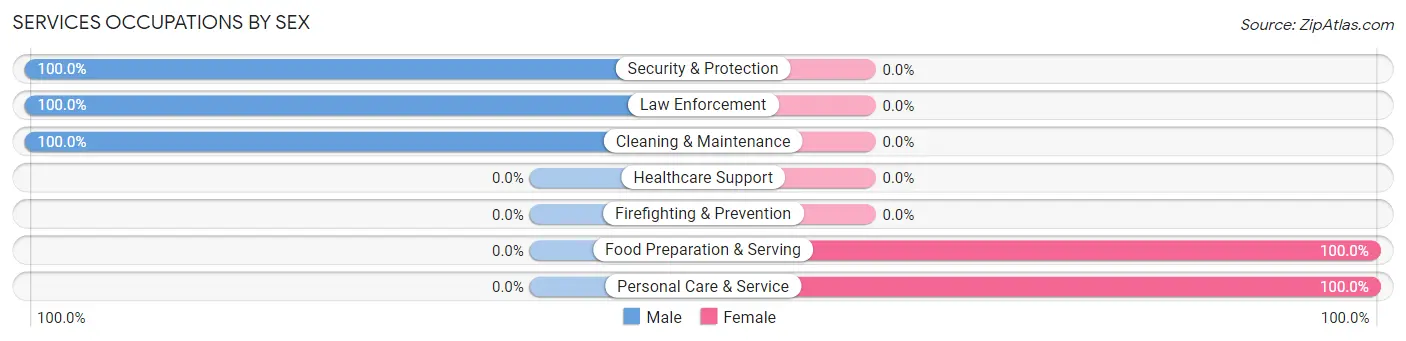
Services Occupations by Sex
Within the Services occupations in Troutville borough, the most male-oriented occupations are Security & Protection (100.0%), Law Enforcement (100.0%), and Cleaning & Maintenance (100.0%), while the most female-oriented occupations are Food Preparation & Serving (100.0%), and Personal Care & Service (100.0%).
| Occupation | Male | Female |
| Healthcare Support | 0 (0.0%) | 0 (0.0%) |
| Security & Protection | 5 (100.0%) | 0 (0.0%) |
| Firefighting & Prevention | 0 (0.0%) | 0 (0.0%) |
| Law Enforcement | 5 (100.0%) | 0 (0.0%) |
| Food Preparation & Serving | 0 (0.0%) | 4 (100.0%) |
| Cleaning & Maintenance | 1 (100.0%) | 0 (0.0%) |
| Personal Care & Service | 0 (0.0%) | 1 (100.0%) |
| Total (Category) | 6 (54.5%) | 5 (45.5%) |
| Total (Overall) | 44 (60.3%) | 29 (39.7%) |
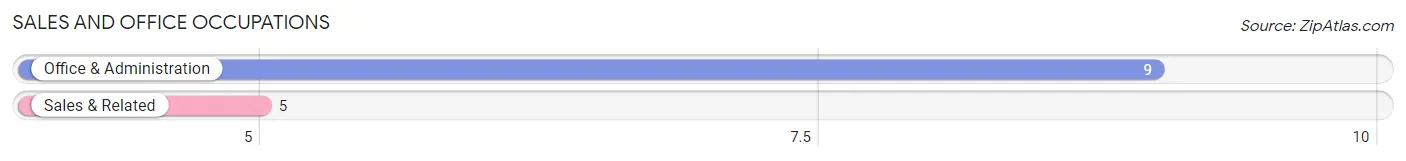
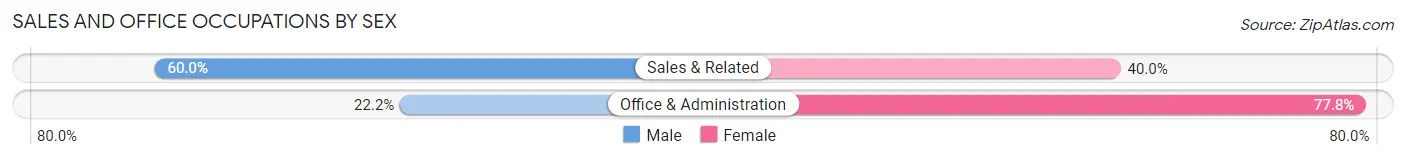
Sales and Office Occupations
The most common Sales and Office occupations in Troutville borough are Office & Administration (9 | 12.3%), and Sales & Related (5 | 6.9%).
Sales and Office Occupations by Sex
| Occupation | Male | Female |
| Sales & Related | 3 (60.0%) | 2 (40.0%) |
| Office & Administration | 2 (22.2%) | 7 (77.8%) |
| Total (Category) | 5 (35.7%) | 9 (64.3%) |
| Total (Overall) | 44 (60.3%) | 29 (39.7%) |
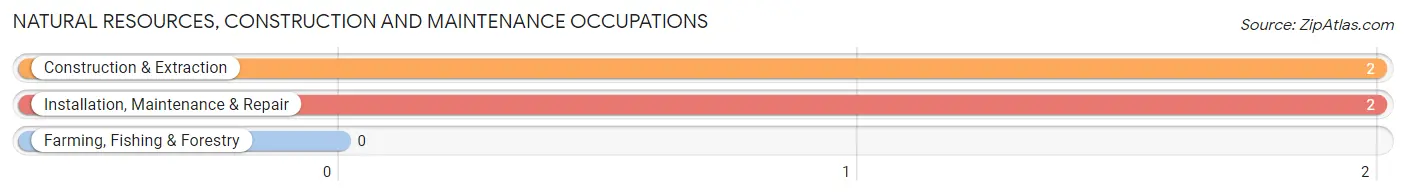
Natural Resources, Construction and Maintenance Occupations
The most common Natural Resources, Construction and Maintenance occupations in Troutville borough are Construction & Extraction (2 | 2.7%), and Installation, Maintenance & Repair (2 | 2.7%).
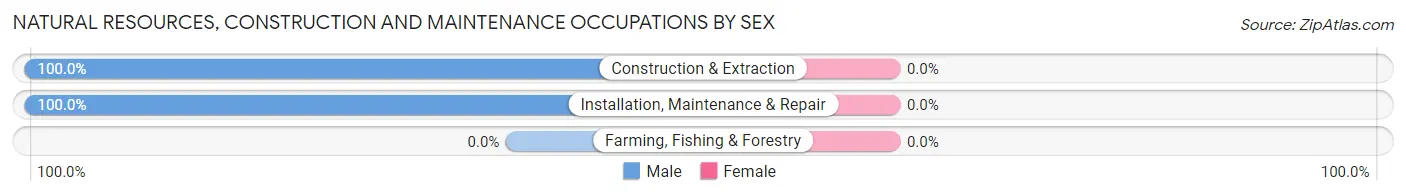
Natural Resources, Construction and Maintenance Occupations by Sex
| Occupation | Male | Female |
| Farming, Fishing & Forestry | 0 (0.0%) | 0 (0.0%) |
| Construction & Extraction | 2 (100.0%) | 0 (0.0%) |
| Installation, Maintenance & Repair | 2 (100.0%) | 0 (0.0%) |
| Total (Category) | 4 (100.0%) | 0 (0.0%) |
| Total (Overall) | 44 (60.3%) | 29 (39.7%) |
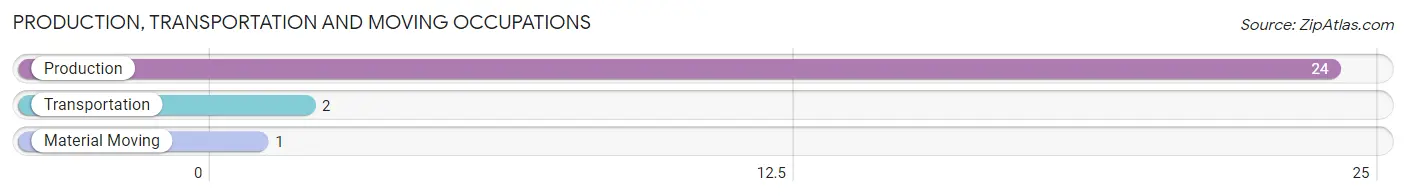
Production, Transportation and Moving Occupations
The most common Production, Transportation and Moving occupations in Troutville borough are Production (24 | 32.9%), Transportation (2 | 2.7%), and Material Moving (1 | 1.4%).
Production, Transportation and Moving Occupations by Sex
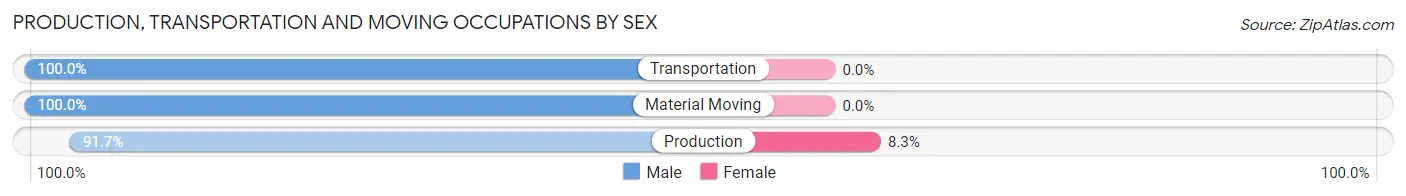
| Occupation | Male | Female |
| Production | 22 (91.7%) | 2 (8.3%) |
| Transportation | 2 (100.0%) | 0 (0.0%) |
| Material Moving | 1 (100.0%) | 0 (0.0%) |
| Total (Category) | 25 (92.6%) | 2 (7.4%) |
| Total (Overall) | 44 (60.3%) | 29 (39.7%) |
Employment Industries by Sex in Troutville borough
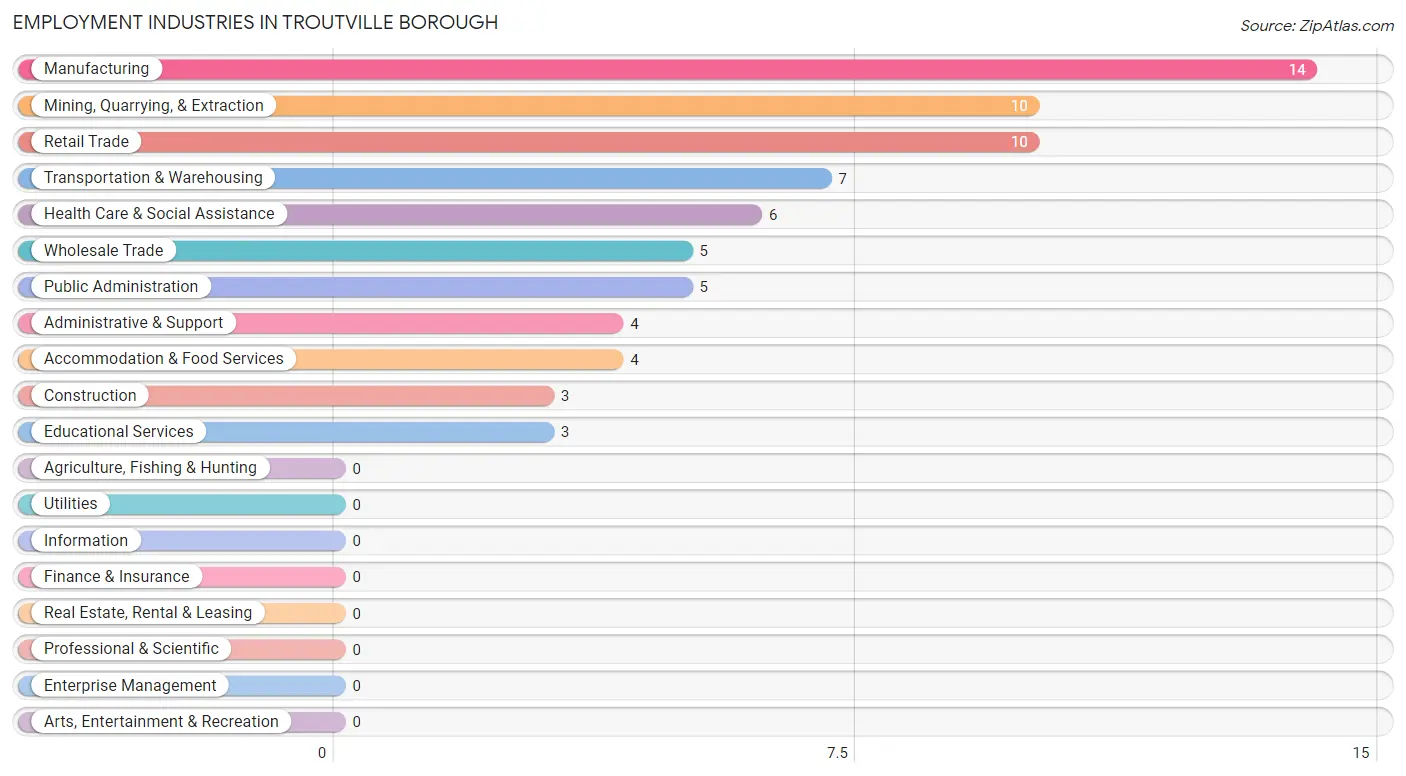
Employment Industries in Troutville borough
The major employment industries in Troutville borough include Manufacturing (14 | 19.2%), Mining, Quarrying, & Extraction (10 | 13.7%), Retail Trade (10 | 13.7%), Transportation & Warehousing (7 | 9.6%), and Health Care & Social Assistance (6 | 8.2%).
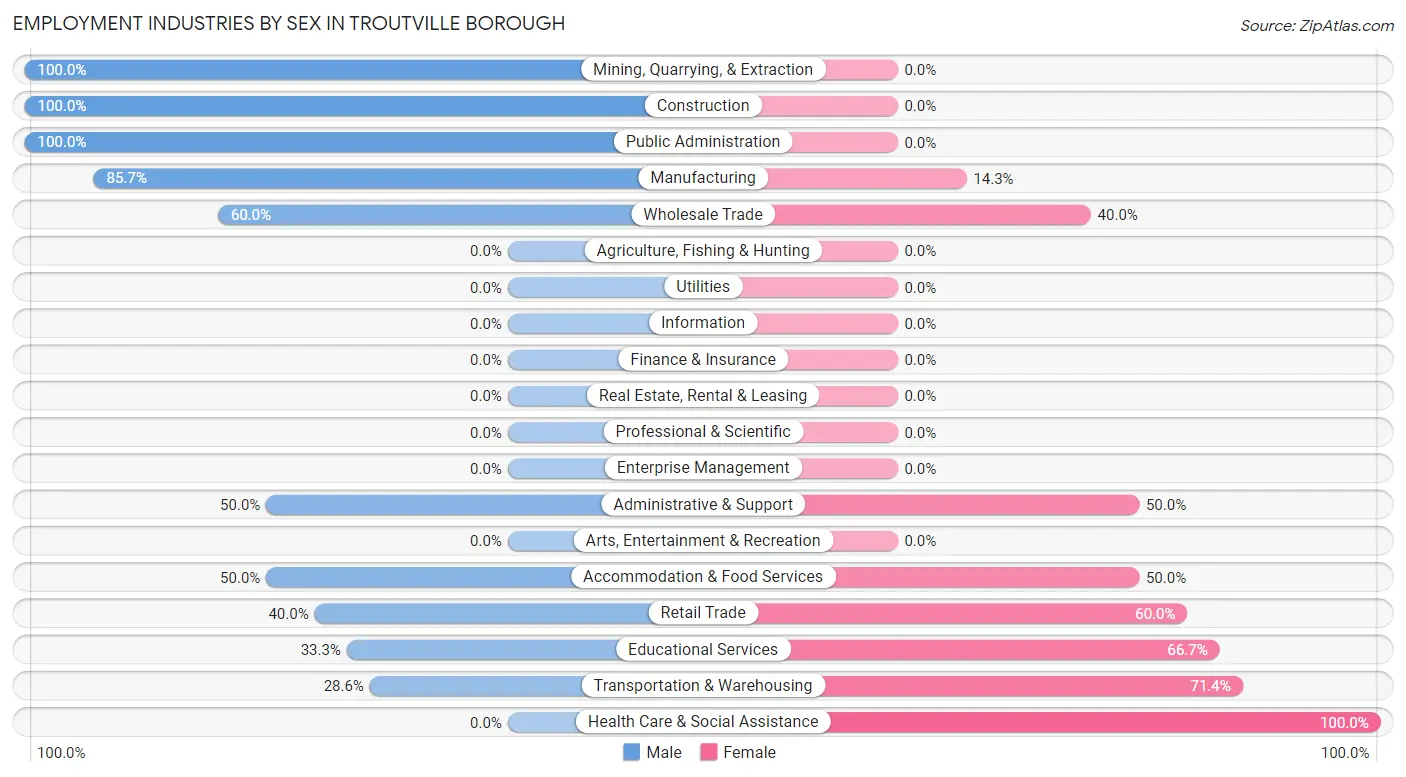
Employment Industries by Sex in Troutville borough
The Troutville borough industries that see more men than women are Mining, Quarrying, & Extraction (100.0%), Construction (100.0%), and Public Administration (100.0%), whereas the industries that tend to have a higher number of women are Health Care & Social Assistance (100.0%), Transportation & Warehousing (71.4%), and Educational Services (66.7%).
| Industry | Male | Female |
| Agriculture, Fishing & Hunting | 0 (0.0%) | 0 (0.0%) |
| Mining, Quarrying, & Extraction | 10 (100.0%) | 0 (0.0%) |
| Construction | 3 (100.0%) | 0 (0.0%) |
| Manufacturing | 12 (85.7%) | 2 (14.3%) |
| Wholesale Trade | 3 (60.0%) | 2 (40.0%) |
| Retail Trade | 4 (40.0%) | 6 (60.0%) |
| Transportation & Warehousing | 2 (28.6%) | 5 (71.4%) |
| Utilities | 0 (0.0%) | 0 (0.0%) |
| Information | 0 (0.0%) | 0 (0.0%) |
| Finance & Insurance | 0 (0.0%) | 0 (0.0%) |
| Real Estate, Rental & Leasing | 0 (0.0%) | 0 (0.0%) |
| Professional & Scientific | 0 (0.0%) | 0 (0.0%) |
| Enterprise Management | 0 (0.0%) | 0 (0.0%) |
| Administrative & Support | 2 (50.0%) | 2 (50.0%) |
| Educational Services | 1 (33.3%) | 2 (66.7%) |
| Health Care & Social Assistance | 0 (0.0%) | 6 (100.0%) |
| Arts, Entertainment & Recreation | 0 (0.0%) | 0 (0.0%) |
| Accommodation & Food Services | 2 (50.0%) | 2 (50.0%) |
| Public Administration | 5 (100.0%) | 0 (0.0%) |
| Total | 44 (60.3%) | 29 (39.7%) |
Education in Troutville borough
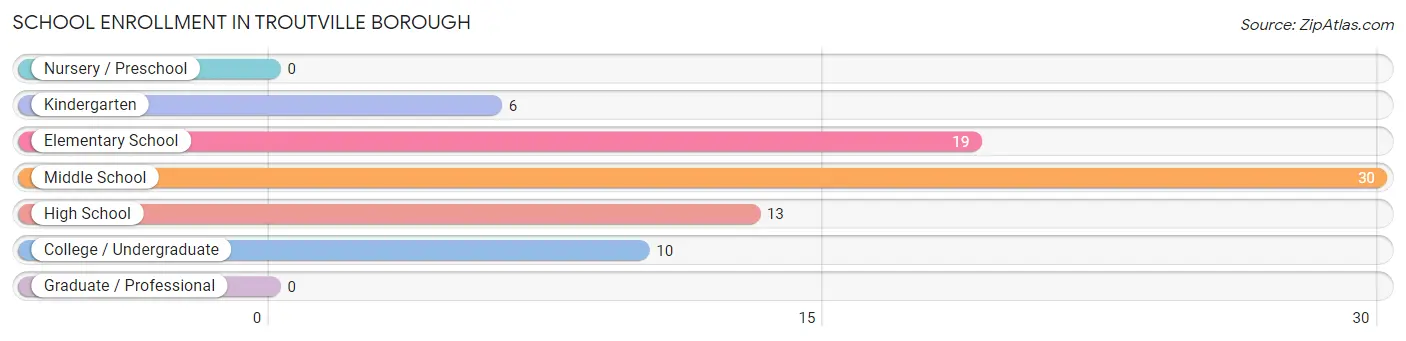
School Enrollment in Troutville borough
The most common levels of schooling among the 78 students in Troutville borough are middle school (30 | 38.5%), elementary school (19 | 24.4%), and high school (13 | 16.7%).
| School Level | # Students | % Students |
| Nursery / Preschool | 0 | 0.0% |
| Kindergarten | 6 | 7.7% |
| Elementary School | 19 | 24.4% |
| Middle School | 30 | 38.5% |
| High School | 13 | 16.7% |
| College / Undergraduate | 10 | 12.8% |
| Graduate / Professional | 0 | 0.0% |
| Total | 78 | 100.0% |
School Enrollment by Age by Funding Source in Troutville borough
Out of a total of 78 students who are enrolled in schools in Troutville borough, 12 (15.4%) attend a private institution, while the remaining 66 (84.6%) are enrolled in public schools. The age group of 5 to 9 year old has the highest likelihood of being enrolled in private schools, with 7 (28.0% in the age bracket) enrolled. Conversely, the age group of 18 to 19 year olds has the lowest likelihood of being enrolled in a private school, with 5 (100.0% in the age bracket) attending a public institution.
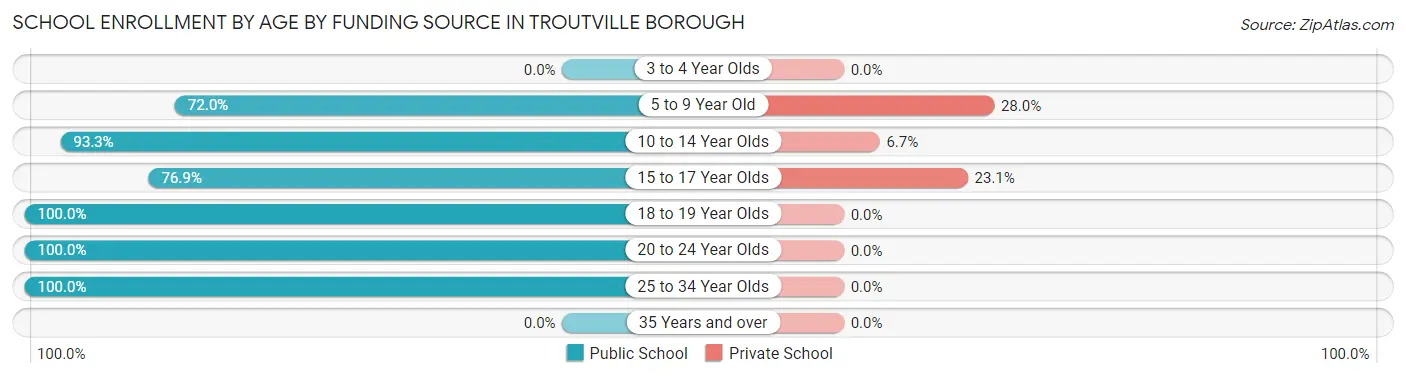
| Age Bracket | Public School | Private School |
| 3 to 4 Year Olds | 0 (0.0%) | 0 (0.0%) |
| 5 to 9 Year Old | 18 (72.0%) | 7 (28.0%) |
| 10 to 14 Year Olds | 28 (93.3%) | 2 (6.7%) |
| 15 to 17 Year Olds | 10 (76.9%) | 3 (23.1%) |
| 18 to 19 Year Olds | 5 (100.0%) | 0 (0.0%) |
| 20 to 24 Year Olds | 3 (100.0%) | 0 (0.0%) |
| 25 to 34 Year Olds | 2 (100.0%) | 0 (0.0%) |
| 35 Years and over | 0 (0.0%) | 0 (0.0%) |
| Total | 66 (84.6%) | 12 (15.4%) |
Educational Attainment by Field of Study in Troutville borough
Science & technology (4 | 40.0%), visual & performing arts (3 | 30.0%), computers & mathematics (1 | 10.0%), physical & health sciences (1 | 10.0%), and engineering (1 | 10.0%) are the most common fields of study among 10 individuals in Troutville borough who have obtained a bachelor's degree or higher.
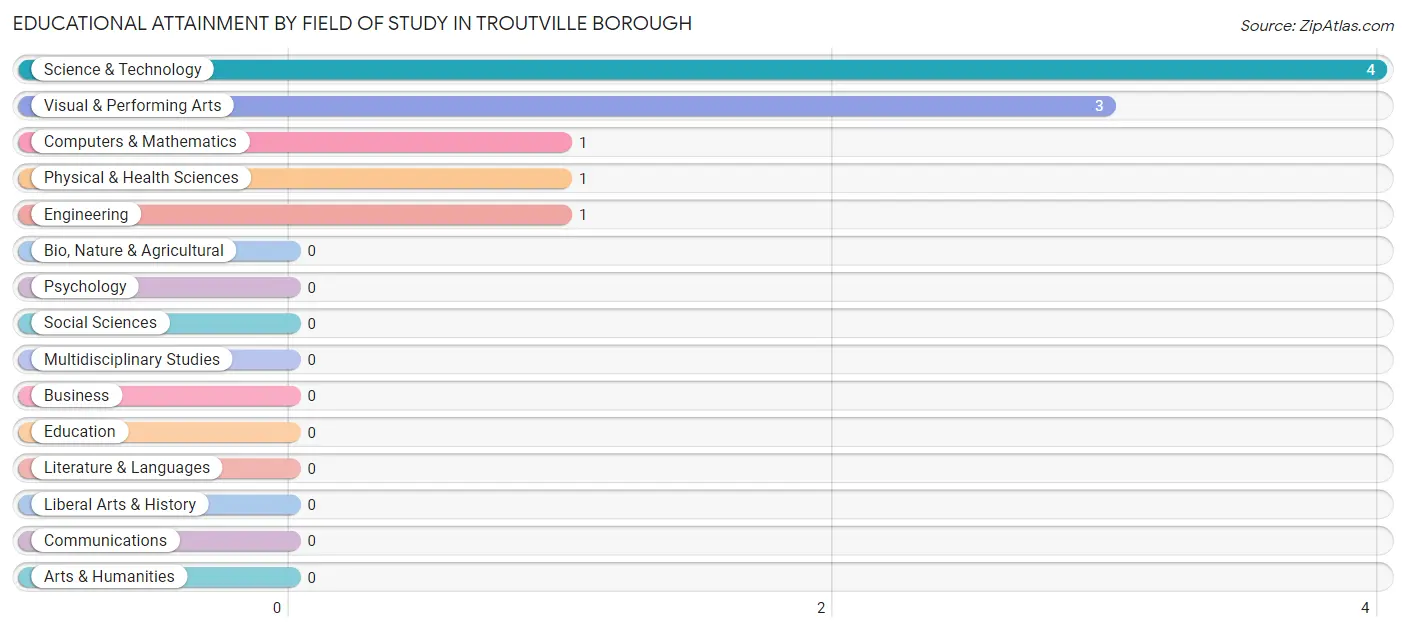
| Field of Study | # Graduates | % Graduates |
| Computers & Mathematics | 1 | 10.0% |
| Bio, Nature & Agricultural | 0 | 0.0% |
| Physical & Health Sciences | 1 | 10.0% |
| Psychology | 0 | 0.0% |
| Social Sciences | 0 | 0.0% |
| Engineering | 1 | 10.0% |
| Multidisciplinary Studies | 0 | 0.0% |
| Science & Technology | 4 | 40.0% |
| Business | 0 | 0.0% |
| Education | 0 | 0.0% |
| Literature & Languages | 0 | 0.0% |
| Liberal Arts & History | 0 | 0.0% |
| Visual & Performing Arts | 3 | 30.0% |
| Communications | 0 | 0.0% |
| Arts & Humanities | 0 | 0.0% |
| Total | 10 | 100.0% |
Transportation & Commute in Troutville borough
Vehicle Availability by Sex in Troutville borough
The most prevalent vehicle ownership categories in Troutville borough are males with 2 vehicles (11, accounting for 25.0%) and females with 2 vehicles (9, making up 40.7%).
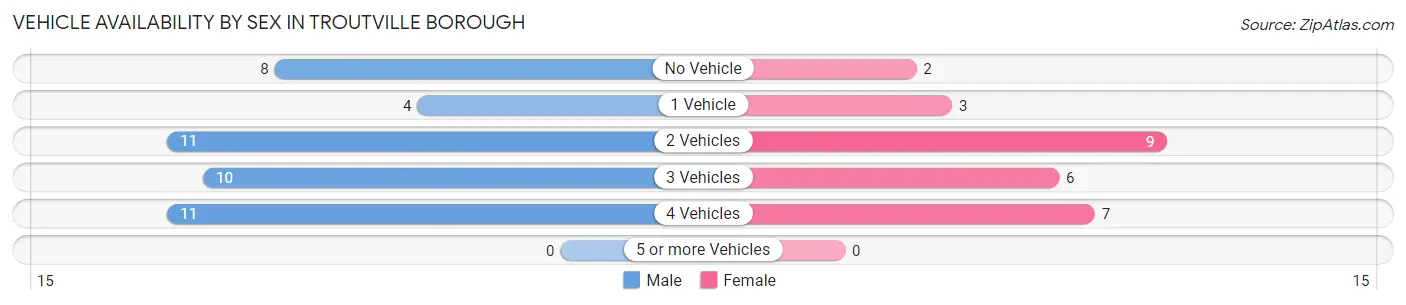
| Vehicles Available | Male | Female |
| No Vehicle | 8 (18.2%) | 2 (7.4%) |
| 1 Vehicle | 4 (9.1%) | 3 (11.1%) |
| 2 Vehicles | 11 (25.0%) | 9 (33.3%) |
| 3 Vehicles | 10 (22.7%) | 6 (22.2%) |
| 4 Vehicles | 11 (25.0%) | 7 (25.9%) |
| 5 or more Vehicles | 0 (0.0%) | 0 (0.0%) |
| Total | 44 (100.0%) | 27 (100.0%) |
Commute Time in Troutville borough
The most frequently occuring commute durations in Troutville borough are 20 to 24 minutes (23 commuters, 33.3%), 15 to 19 minutes (17 commuters, 24.6%), and less than 5 minutes (8 commuters, 11.6%).
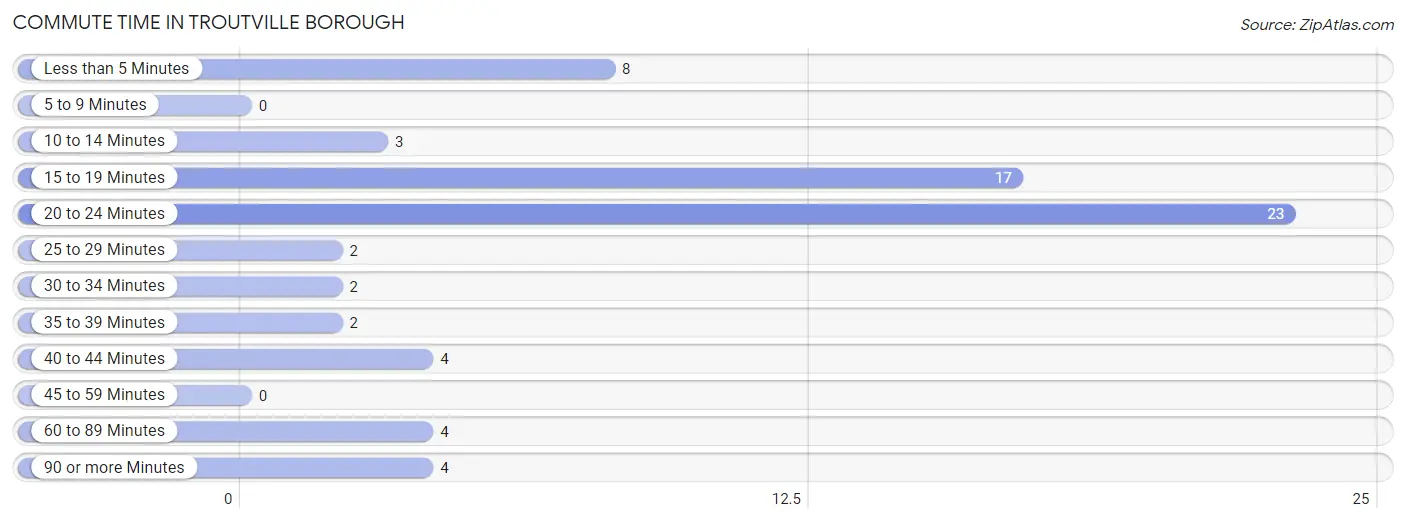
| Commute Time | # Commuters | % Commuters |
| Less than 5 Minutes | 8 | 11.6% |
| 5 to 9 Minutes | 0 | 0.0% |
| 10 to 14 Minutes | 3 | 4.3% |
| 15 to 19 Minutes | 17 | 24.6% |
| 20 to 24 Minutes | 23 | 33.3% |
| 25 to 29 Minutes | 2 | 2.9% |
| 30 to 34 Minutes | 2 | 2.9% |
| 35 to 39 Minutes | 2 | 2.9% |
| 40 to 44 Minutes | 4 | 5.8% |
| 45 to 59 Minutes | 0 | 0.0% |
| 60 to 89 Minutes | 4 | 5.8% |
| 90 or more Minutes | 4 | 5.8% |
Commute Time by Sex in Troutville borough
The most common commute times in Troutville borough are 20 to 24 minutes (13 commuters, 29.5%) for males and 20 to 24 minutes (10 commuters, 40.0%) for females.
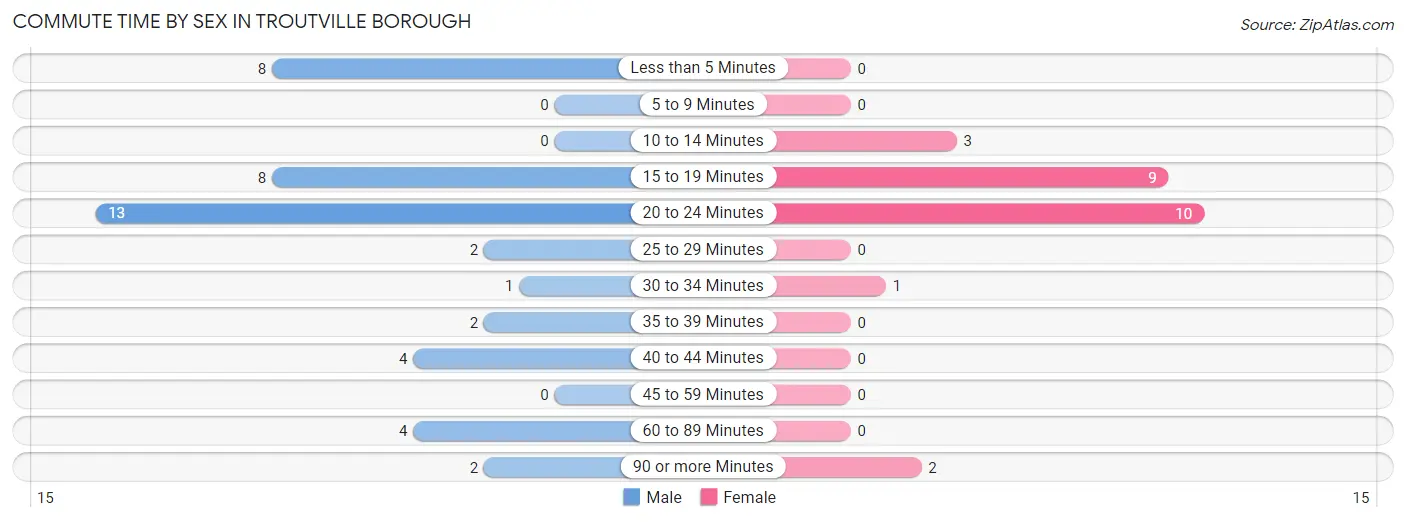
| Commute Time | Male | Female |
| Less than 5 Minutes | 8 (18.2%) | 0 (0.0%) |
| 5 to 9 Minutes | 0 (0.0%) | 0 (0.0%) |
| 10 to 14 Minutes | 0 (0.0%) | 3 (12.0%) |
| 15 to 19 Minutes | 8 (18.2%) | 9 (36.0%) |
| 20 to 24 Minutes | 13 (29.5%) | 10 (40.0%) |
| 25 to 29 Minutes | 2 (4.5%) | 0 (0.0%) |
| 30 to 34 Minutes | 1 (2.3%) | 1 (4.0%) |
| 35 to 39 Minutes | 2 (4.5%) | 0 (0.0%) |
| 40 to 44 Minutes | 4 (9.1%) | 0 (0.0%) |
| 45 to 59 Minutes | 0 (0.0%) | 0 (0.0%) |
| 60 to 89 Minutes | 4 (9.1%) | 0 (0.0%) |
| 90 or more Minutes | 2 (4.5%) | 2 (8.0%) |
Time of Departure to Work by Sex in Troutville borough
The most frequent times of departure to work in Troutville borough are 7:00 AM to 7:29 AM (15, 34.1%) for males and 12:00 AM to 4:59 AM (7, 28.0%) for females.
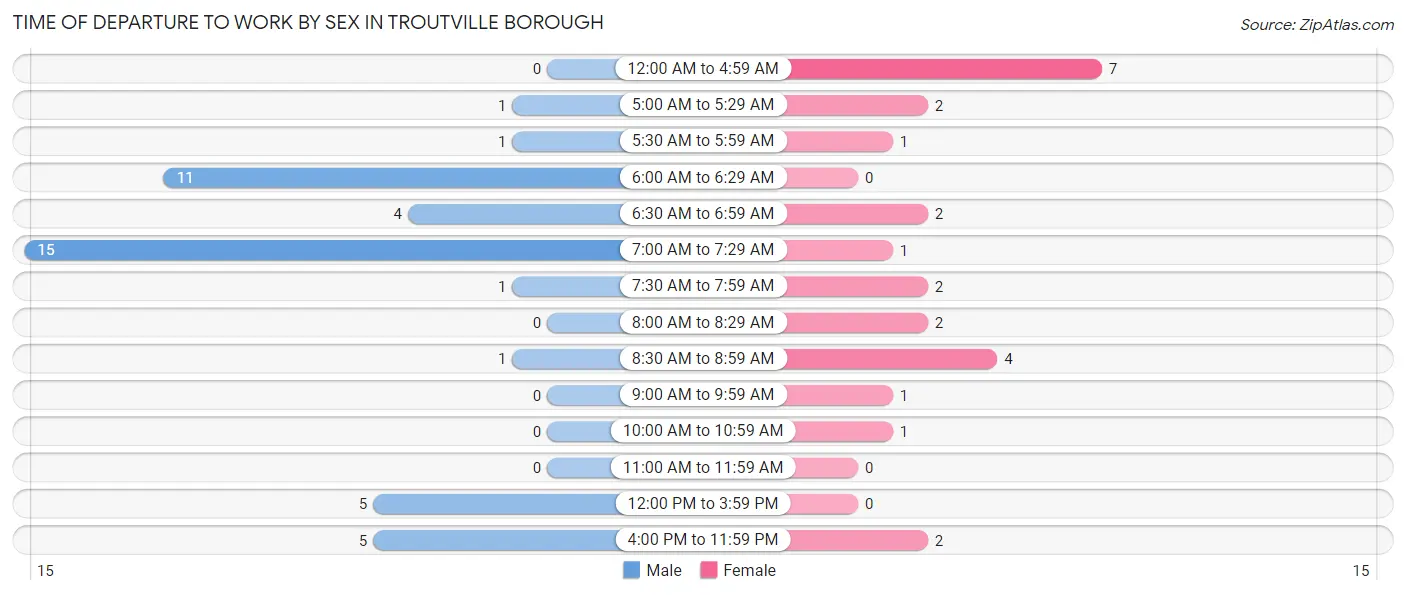
| Time of Departure | Male | Female |
| 12:00 AM to 4:59 AM | 0 (0.0%) | 7 (28.0%) |
| 5:00 AM to 5:29 AM | 1 (2.3%) | 2 (8.0%) |
| 5:30 AM to 5:59 AM | 1 (2.3%) | 1 (4.0%) |
| 6:00 AM to 6:29 AM | 11 (25.0%) | 0 (0.0%) |
| 6:30 AM to 6:59 AM | 4 (9.1%) | 2 (8.0%) |
| 7:00 AM to 7:29 AM | 15 (34.1%) | 1 (4.0%) |
| 7:30 AM to 7:59 AM | 1 (2.3%) | 2 (8.0%) |
| 8:00 AM to 8:29 AM | 0 (0.0%) | 2 (8.0%) |
| 8:30 AM to 8:59 AM | 1 (2.3%) | 4 (16.0%) |
| 9:00 AM to 9:59 AM | 0 (0.0%) | 1 (4.0%) |
| 10:00 AM to 10:59 AM | 0 (0.0%) | 1 (4.0%) |
| 11:00 AM to 11:59 AM | 0 (0.0%) | 0 (0.0%) |
| 12:00 PM to 3:59 PM | 5 (11.4%) | 0 (0.0%) |
| 4:00 PM to 11:59 PM | 5 (11.4%) | 2 (8.0%) |
| Total | 44 (100.0%) | 25 (100.0%) |
Housing Occupancy in Troutville borough
Occupancy by Ownership in Troutville borough
Of the total 55 dwellings in Troutville borough, owner-occupied units account for 48 (87.3%), while renter-occupied units make up 7 (12.7%).
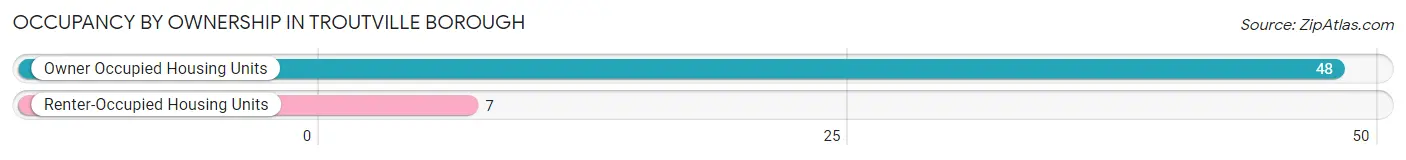
| Occupancy | # Housing Units | % Housing Units |
| Owner Occupied Housing Units | 48 | 87.3% |
| Renter-Occupied Housing Units | 7 | 12.7% |
| Total Occupied Housing Units | 55 | 100.0% |
Occupancy by Household Size in Troutville borough
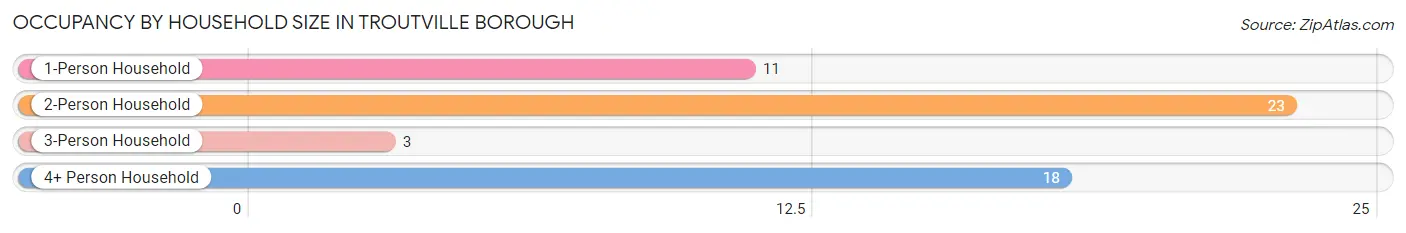
| Household Size | # Housing Units | % Housing Units |
| 1-Person Household | 11 | 20.0% |
| 2-Person Household | 23 | 41.8% |
| 3-Person Household | 3 | 5.4% |
| 4+ Person Household | 18 | 32.7% |
| Total Housing Units | 55 | 100.0% |
Occupancy by Ownership by Household Size in Troutville borough
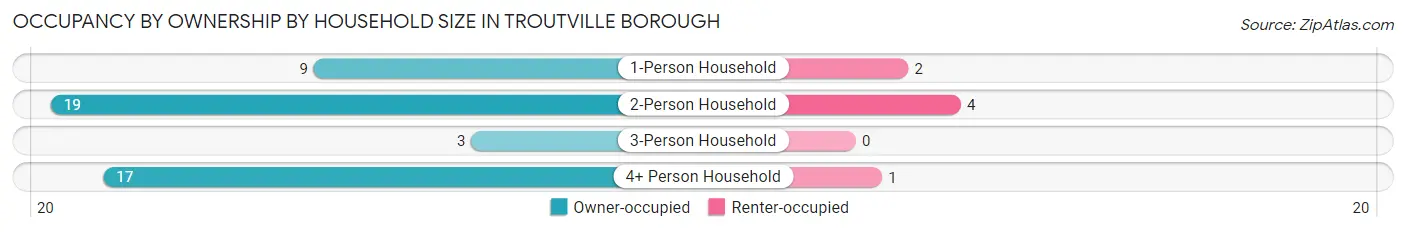
| Household Size | Owner-occupied | Renter-occupied |
| 1-Person Household | 9 (81.8%) | 2 (18.2%) |
| 2-Person Household | 19 (82.6%) | 4 (17.4%) |
| 3-Person Household | 3 (100.0%) | 0 (0.0%) |
| 4+ Person Household | 17 (94.4%) | 1 (5.6%) |
| Total Housing Units | 48 (87.3%) | 7 (12.7%) |
Occupancy by Educational Attainment in Troutville borough
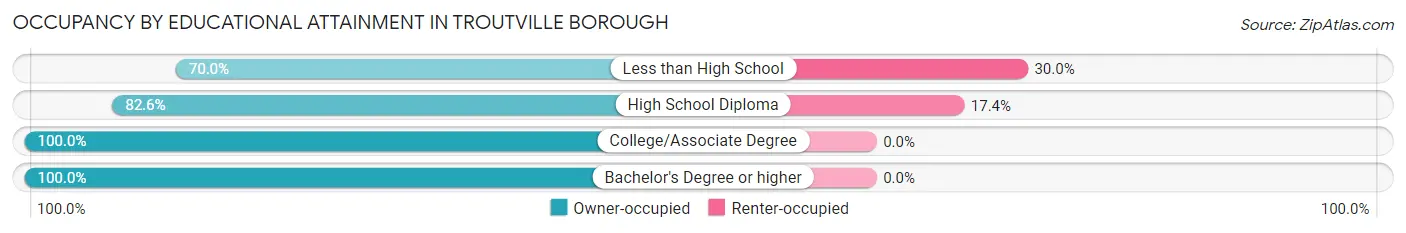
| Household Size | Owner-occupied | Renter-occupied |
| Less than High School | 7 (70.0%) | 3 (30.0%) |
| High School Diploma | 19 (82.6%) | 4 (17.4%) |
| College/Associate Degree | 18 (100.0%) | 0 (0.0%) |
| Bachelor's Degree or higher | 4 (100.0%) | 0 (0.0%) |
Occupancy by Age of Householder in Troutville borough
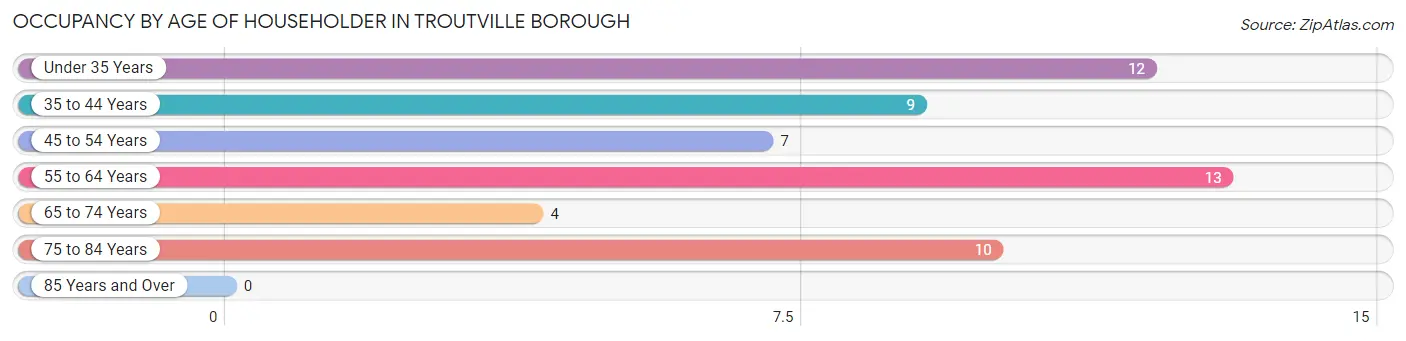
| Age Bracket | # Households | % Households |
| Under 35 Years | 12 | 21.8% |
| 35 to 44 Years | 9 | 16.4% |
| 45 to 54 Years | 7 | 12.7% |
| 55 to 64 Years | 13 | 23.6% |
| 65 to 74 Years | 4 | 7.3% |
| 75 to 84 Years | 10 | 18.2% |
| 85 Years and Over | 0 | 0.0% |
| Total | 55 | 100.0% |
Housing Finances in Troutville borough
Median Income by Occupancy in Troutville borough
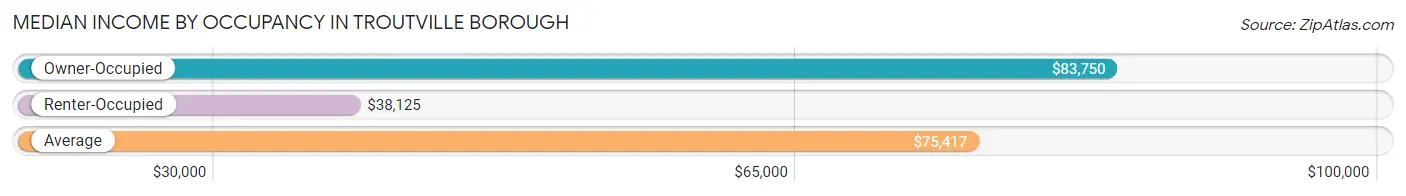
| Occupancy Type | # Households | Median Income |
| Owner-Occupied | 48 (87.3%) | $83,750 |
| Renter-Occupied | 7 (12.7%) | $38,125 |
| Average | 55 (100.0%) | $75,417 |
Occupancy by Householder Income Bracket in Troutville borough
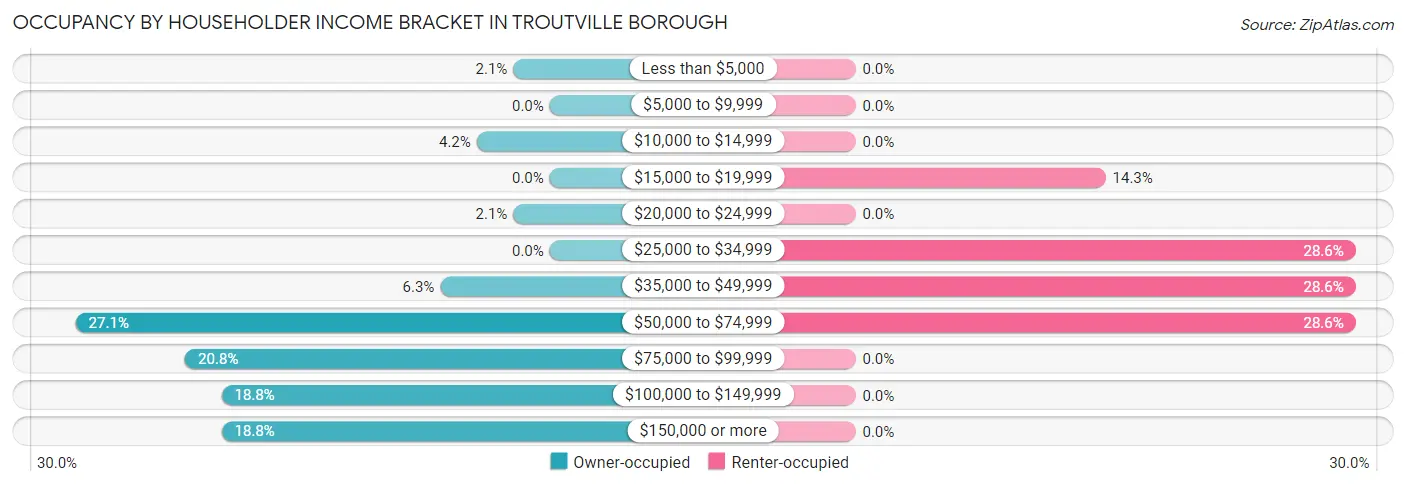
| Income Bracket | Owner-occupied | Renter-occupied |
| Less than $5,000 | 1 (2.1%) | 0 (0.0%) |
| $5,000 to $9,999 | 0 (0.0%) | 0 (0.0%) |
| $10,000 to $14,999 | 2 (4.2%) | 0 (0.0%) |
| $15,000 to $19,999 | 0 (0.0%) | 1 (14.3%) |
| $20,000 to $24,999 | 1 (2.1%) | 0 (0.0%) |
| $25,000 to $34,999 | 0 (0.0%) | 2 (28.6%) |
| $35,000 to $49,999 | 3 (6.2%) | 2 (28.6%) |
| $50,000 to $74,999 | 13 (27.1%) | 2 (28.6%) |
| $75,000 to $99,999 | 10 (20.8%) | 0 (0.0%) |
| $100,000 to $149,999 | 9 (18.8%) | 0 (0.0%) |
| $150,000 or more | 9 (18.8%) | 0 (0.0%) |
| Total | 48 (100.0%) | 7 (100.0%) |
Monthly Housing Cost Tiers in Troutville borough
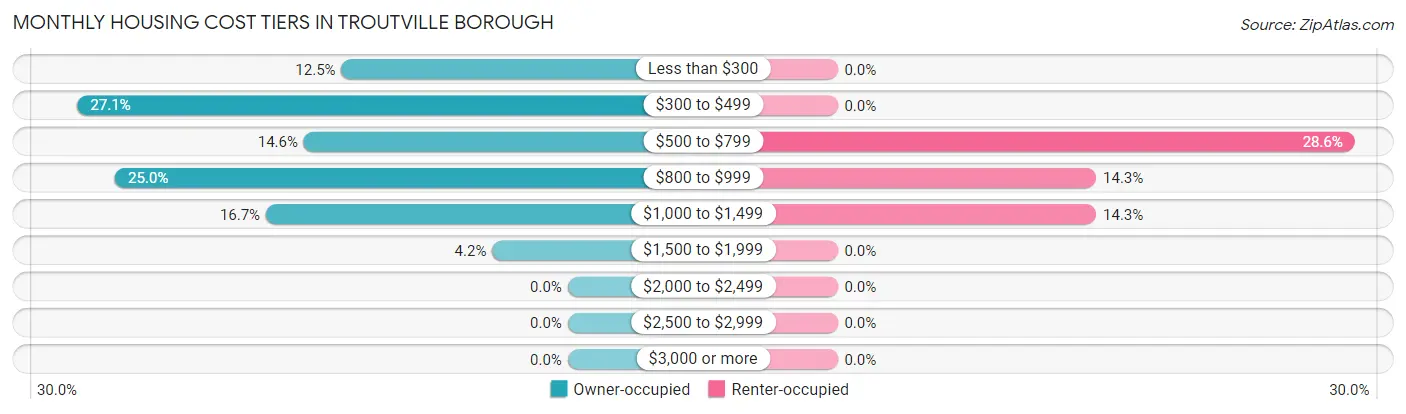
| Monthly Cost | Owner-occupied | Renter-occupied |
| Less than $300 | 6 (12.5%) | 0 (0.0%) |
| $300 to $499 | 13 (27.1%) | 0 (0.0%) |
| $500 to $799 | 7 (14.6%) | 2 (28.6%) |
| $800 to $999 | 12 (25.0%) | 1 (14.3%) |
| $1,000 to $1,499 | 8 (16.7%) | 1 (14.3%) |
| $1,500 to $1,999 | 2 (4.2%) | 0 (0.0%) |
| $2,000 to $2,499 | 0 (0.0%) | 0 (0.0%) |
| $2,500 to $2,999 | 0 (0.0%) | 0 (0.0%) |
| $3,000 or more | 0 (0.0%) | 0 (0.0%) |
| Total | 48 (100.0%) | 7 (100.0%) |
Physical Housing Characteristics in Troutville borough
Housing Structures in Troutville borough
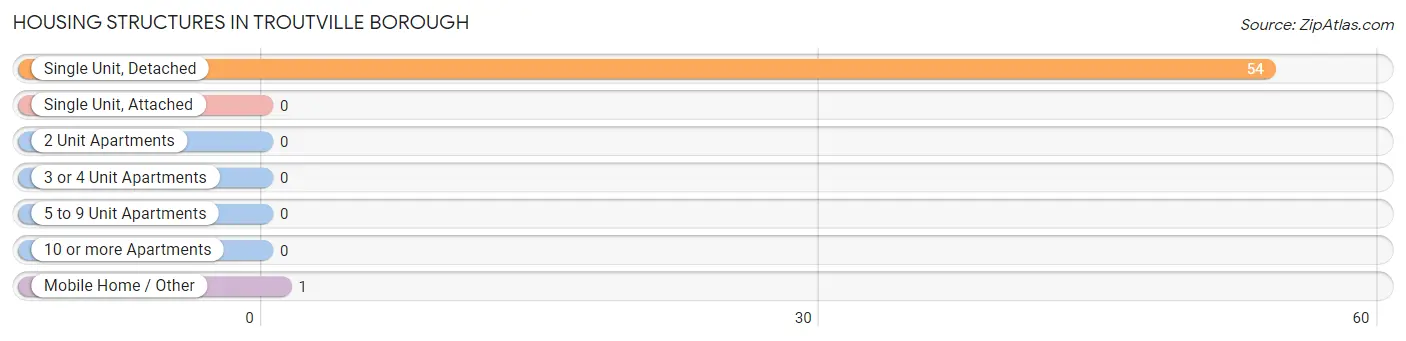
| Structure Type | # Housing Units | % Housing Units |
| Single Unit, Detached | 54 | 98.2% |
| Single Unit, Attached | 0 | 0.0% |
| 2 Unit Apartments | 0 | 0.0% |
| 3 or 4 Unit Apartments | 0 | 0.0% |
| 5 to 9 Unit Apartments | 0 | 0.0% |
| 10 or more Apartments | 0 | 0.0% |
| Mobile Home / Other | 1 | 1.8% |
| Total | 55 | 100.0% |
Housing Structures by Occupancy in Troutville borough
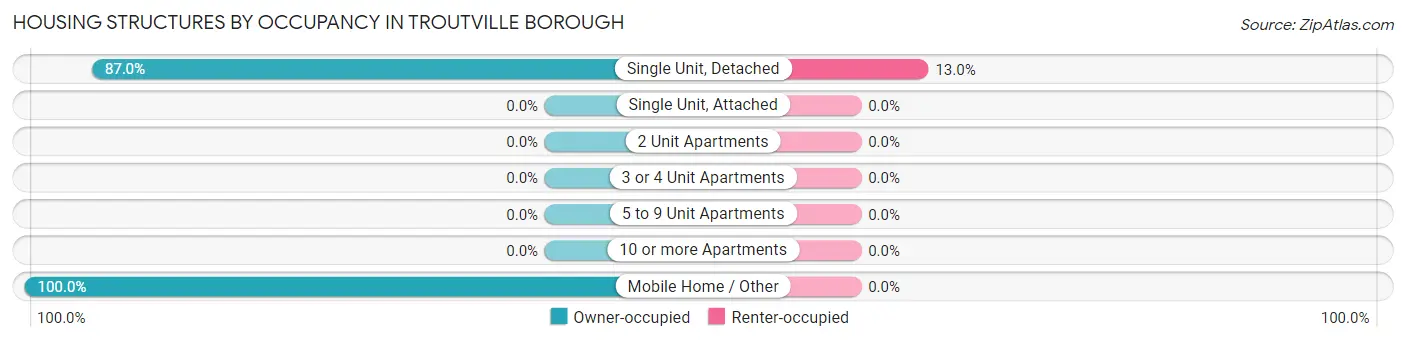
| Structure Type | Owner-occupied | Renter-occupied |
| Single Unit, Detached | 47 (87.0%) | 7 (13.0%) |
| Single Unit, Attached | 0 (0.0%) | 0 (0.0%) |
| 2 Unit Apartments | 0 (0.0%) | 0 (0.0%) |
| 3 or 4 Unit Apartments | 0 (0.0%) | 0 (0.0%) |
| 5 to 9 Unit Apartments | 0 (0.0%) | 0 (0.0%) |
| 10 or more Apartments | 0 (0.0%) | 0 (0.0%) |
| Mobile Home / Other | 1 (100.0%) | 0 (0.0%) |
| Total | 48 (87.3%) | 7 (12.7%) |
Housing Structures by Number of Rooms in Troutville borough
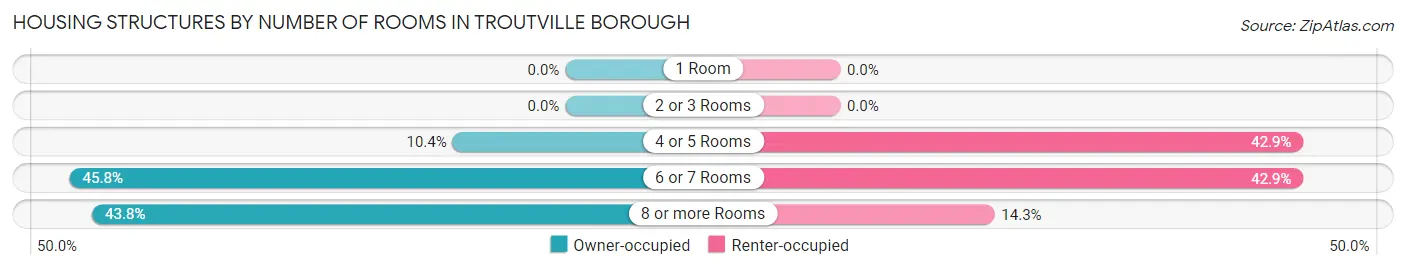
| Number of Rooms | Owner-occupied | Renter-occupied |
| 1 Room | 0 (0.0%) | 0 (0.0%) |
| 2 or 3 Rooms | 0 (0.0%) | 0 (0.0%) |
| 4 or 5 Rooms | 5 (10.4%) | 3 (42.9%) |
| 6 or 7 Rooms | 22 (45.8%) | 3 (42.9%) |
| 8 or more Rooms | 21 (43.8%) | 1 (14.3%) |
| Total | 48 (100.0%) | 7 (100.0%) |
Housing Structure by Heating Type in Troutville borough
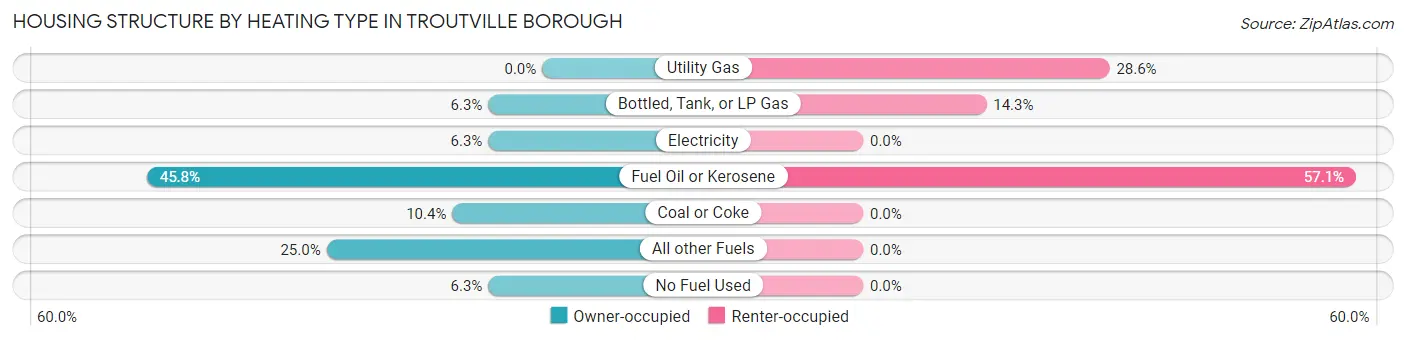
| Heating Type | Owner-occupied | Renter-occupied |
| Utility Gas | 0 (0.0%) | 2 (28.6%) |
| Bottled, Tank, or LP Gas | 3 (6.2%) | 1 (14.3%) |
| Electricity | 3 (6.2%) | 0 (0.0%) |
| Fuel Oil or Kerosene | 22 (45.8%) | 4 (57.1%) |
| Coal or Coke | 5 (10.4%) | 0 (0.0%) |
| All other Fuels | 12 (25.0%) | 0 (0.0%) |
| No Fuel Used | 3 (6.2%) | 0 (0.0%) |
| Total | 48 (100.0%) | 7 (100.0%) |
Household Vehicle Usage in Troutville borough
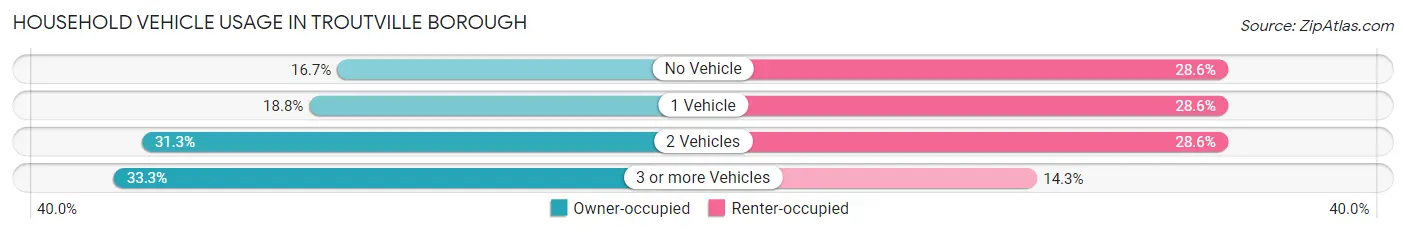
| Vehicles per Household | Owner-occupied | Renter-occupied |
| No Vehicle | 8 (16.7%) | 2 (28.6%) |
| 1 Vehicle | 9 (18.8%) | 2 (28.6%) |
| 2 Vehicles | 15 (31.2%) | 2 (28.6%) |
| 3 or more Vehicles | 16 (33.3%) | 1 (14.3%) |
| Total | 48 (100.0%) | 7 (100.0%) |
Real Estate & Mortgages in Troutville borough
Real Estate and Mortgage Overview in Troutville borough
| Characteristic | Without Mortgage | With Mortgage |
| Housing Units | 26 | 22 |
| Median Property Value | $78,800 | $110,000 |
| Median Household Income | $83,750 | $1 |
| Monthly Housing Costs | $440 | $0 |
| Real Estate Taxes | $711 | $0 |
Property Value by Mortgage Status in Troutville borough
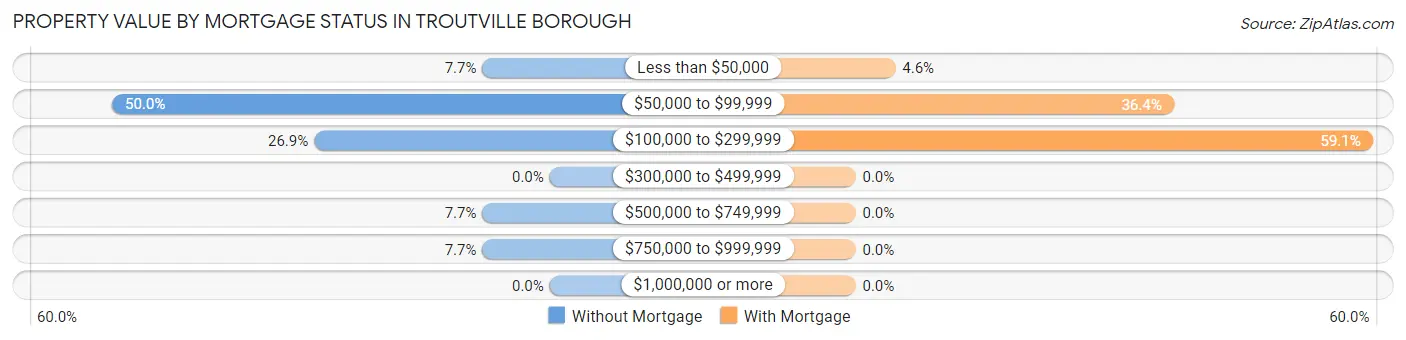
| Property Value | Without Mortgage | With Mortgage |
| Less than $50,000 | 2 (7.7%) | 1 (4.5%) |
| $50,000 to $99,999 | 13 (50.0%) | 8 (36.4%) |
| $100,000 to $299,999 | 7 (26.9%) | 13 (59.1%) |
| $300,000 to $499,999 | 0 (0.0%) | 0 (0.0%) |
| $500,000 to $749,999 | 2 (7.7%) | 0 (0.0%) |
| $750,000 to $999,999 | 2 (7.7%) | 0 (0.0%) |
| $1,000,000 or more | 0 (0.0%) | 0 (0.0%) |
| Total | 26 (100.0%) | 22 (100.0%) |
Household Income by Mortgage Status in Troutville borough
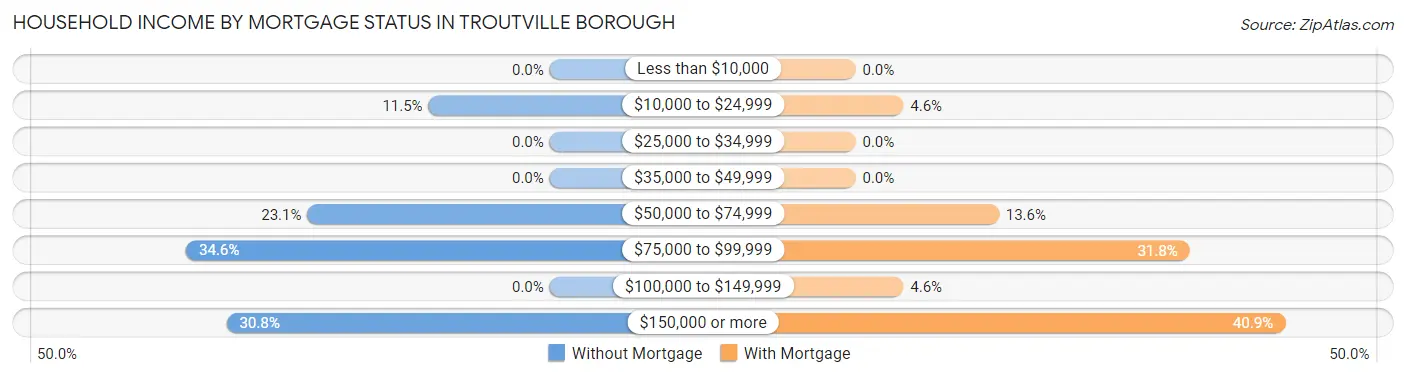
| Household Income | Without Mortgage | With Mortgage |
| Less than $10,000 | 0 (0.0%) | 0 (0.0%) |
| $10,000 to $24,999 | 3 (11.5%) | 1 (4.5%) |
| $25,000 to $34,999 | 0 (0.0%) | 0 (0.0%) |
| $35,000 to $49,999 | 0 (0.0%) | 0 (0.0%) |
| $50,000 to $74,999 | 6 (23.1%) | 3 (13.6%) |
| $75,000 to $99,999 | 9 (34.6%) | 7 (31.8%) |
| $100,000 to $149,999 | 0 (0.0%) | 1 (4.5%) |
| $150,000 or more | 8 (30.8%) | 9 (40.9%) |
| Total | 26 (100.0%) | 22 (100.0%) |
Property Value to Household Income Ratio in Troutville borough
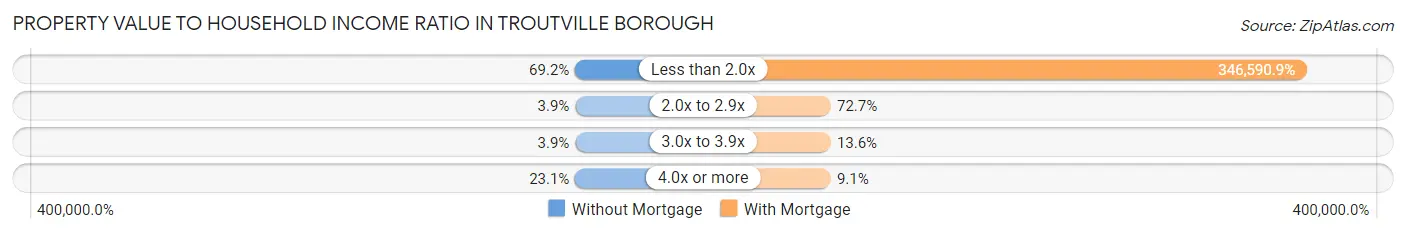
| Value-to-Income Ratio | Without Mortgage | With Mortgage |
| Less than 2.0x | 18 (69.2%) | 76,250 (346,590.9%) |
| 2.0x to 2.9x | 1 (3.8%) | 16 (72.7%) |
| 3.0x to 3.9x | 1 (3.8%) | 3 (13.6%) |
| 4.0x or more | 6 (23.1%) | 2 (9.1%) |
| Total | 26 (100.0%) | 22 (100.0%) |
Real Estate Taxes by Mortgage Status in Troutville borough
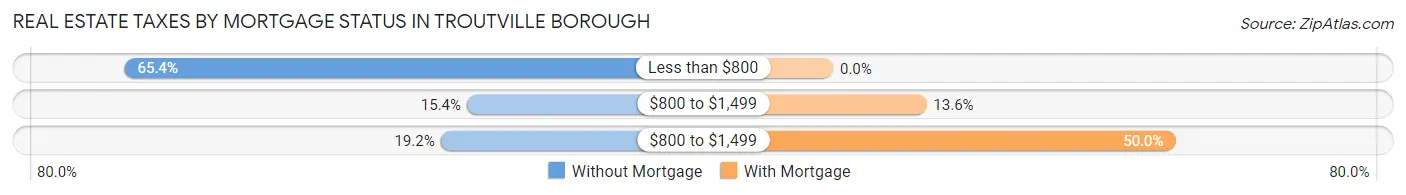
| Property Taxes | Without Mortgage | With Mortgage |
| Less than $800 | 17 (65.4%) | 0 (0.0%) |
| $800 to $1,499 | 4 (15.4%) | 3 (13.6%) |
| $800 to $1,499 | 5 (19.2%) | 11 (50.0%) |
| Total | 26 (100.0%) | 22 (100.0%) |
Health & Disability in Troutville borough
Health Insurance Coverage by Age in Troutville borough
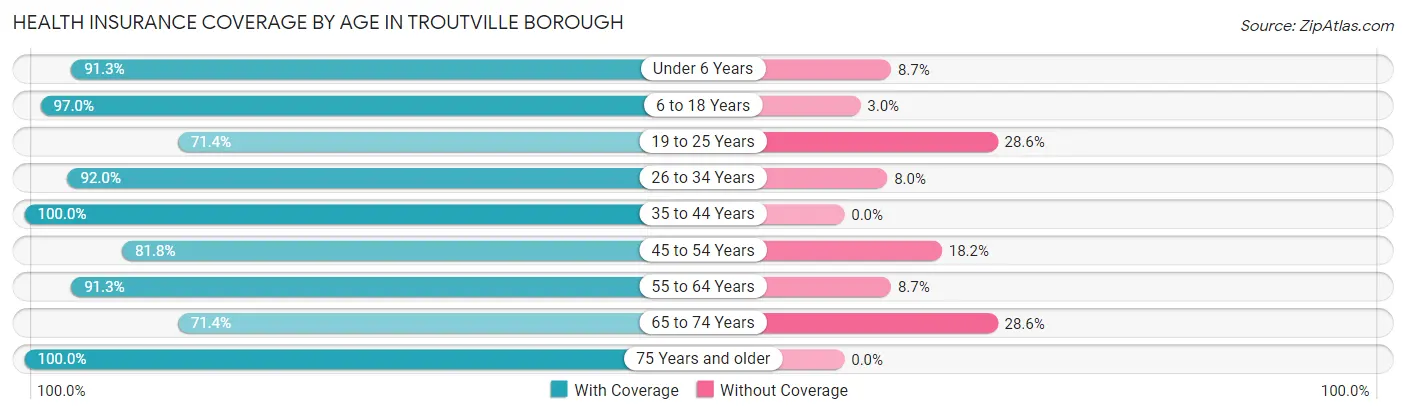
| Age Bracket | With Coverage | Without Coverage |
| Under 6 Years | 21 (91.3%) | 2 (8.7%) |
| 6 to 18 Years | 65 (97.0%) | 2 (3.0%) |
| 19 to 25 Years | 15 (71.4%) | 6 (28.6%) |
| 26 to 34 Years | 23 (92.0%) | 2 (8.0%) |
| 35 to 44 Years | 15 (100.0%) | 0 (0.0%) |
| 45 to 54 Years | 18 (81.8%) | 4 (18.2%) |
| 55 to 64 Years | 21 (91.3%) | 2 (8.7%) |
| 65 to 74 Years | 5 (71.4%) | 2 (28.6%) |
| 75 Years and older | 15 (100.0%) | 0 (0.0%) |
| Total | 198 (90.8%) | 20 (9.2%) |
Health Insurance Coverage by Citizenship Status in Troutville borough
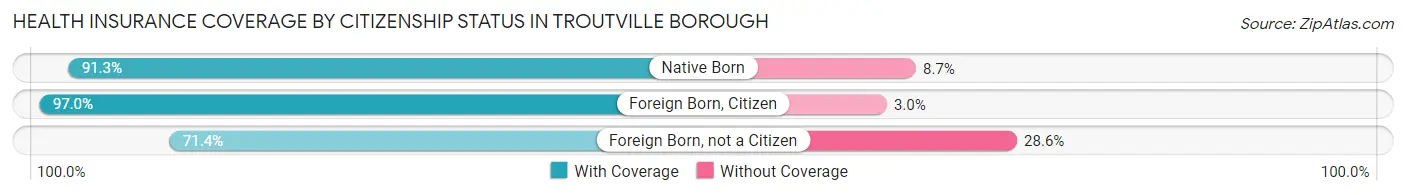
| Citizenship Status | With Coverage | Without Coverage |
| Native Born | 21 (91.3%) | 2 (8.7%) |
| Foreign Born, Citizen | 65 (97.0%) | 2 (3.0%) |
| Foreign Born, not a Citizen | 15 (71.4%) | 6 (28.6%) |
Health Insurance Coverage by Household Income in Troutville borough
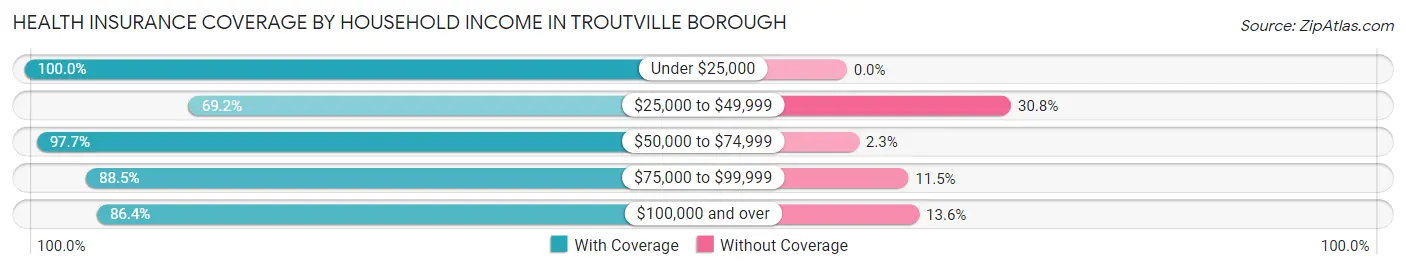
| Household Income | With Coverage | Without Coverage |
| Under $25,000 | 6 (100.0%) | 0 (0.0%) |
| $25,000 to $49,999 | 9 (69.2%) | 4 (30.8%) |
| $50,000 to $74,999 | 86 (97.7%) | 2 (2.3%) |
| $75,000 to $99,999 | 46 (88.5%) | 6 (11.5%) |
| $100,000 and over | 51 (86.4%) | 8 (13.6%) |
Public vs Private Health Insurance Coverage by Age in Troutville borough
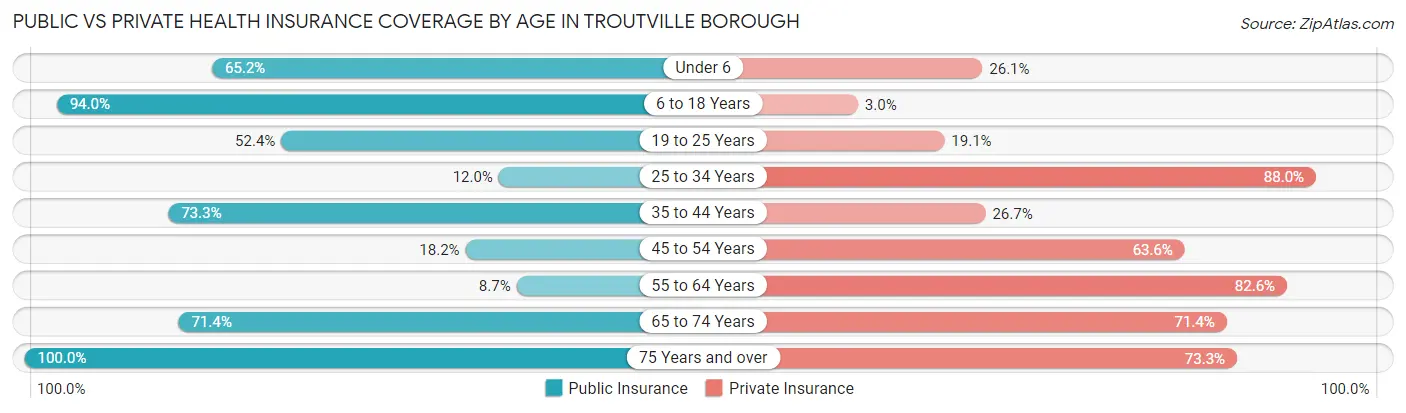
| Age Bracket | Public Insurance | Private Insurance |
| Under 6 | 15 (65.2%) | 6 (26.1%) |
| 6 to 18 Years | 63 (94.0%) | 2 (3.0%) |
| 19 to 25 Years | 11 (52.4%) | 4 (19.1%) |
| 25 to 34 Years | 3 (12.0%) | 22 (88.0%) |
| 35 to 44 Years | 11 (73.3%) | 4 (26.7%) |
| 45 to 54 Years | 4 (18.2%) | 14 (63.6%) |
| 55 to 64 Years | 2 (8.7%) | 19 (82.6%) |
| 65 to 74 Years | 5 (71.4%) | 5 (71.4%) |
| 75 Years and over | 15 (100.0%) | 11 (73.3%) |
| Total | 129 (59.2%) | 87 (39.9%) |
Disability Status by Sex by Age in Troutville borough
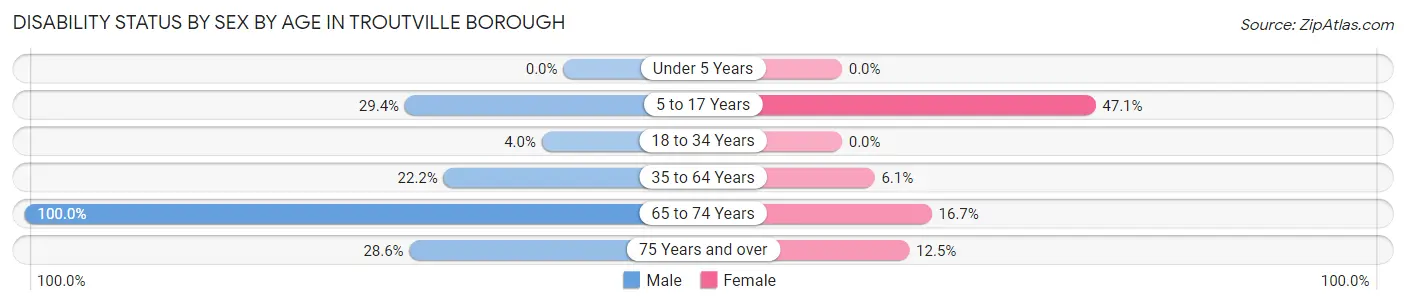
| Age Bracket | Male | Female |
| Under 5 Years | 0 (0.0%) | 0 (0.0%) |
| 5 to 17 Years | 10 (29.4%) | 16 (47.1%) |
| 18 to 34 Years | 1 (4.0%) | 0 (0.0%) |
| 35 to 64 Years | 6 (22.2%) | 2 (6.1%) |
| 65 to 74 Years | 1 (100.0%) | 1 (16.7%) |
| 75 Years and over | 2 (28.6%) | 1 (12.5%) |
Disability Class by Sex by Age in Troutville borough
Disability Class: Hearing Difficulty
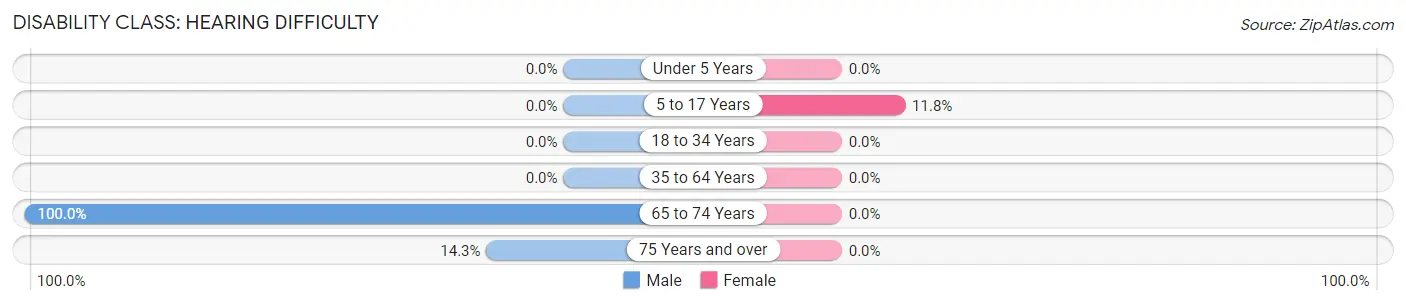
| Age Bracket | Male | Female |
| Under 5 Years | 0 (0.0%) | 0 (0.0%) |
| 5 to 17 Years | 0 (0.0%) | 4 (11.8%) |
| 18 to 34 Years | 0 (0.0%) | 0 (0.0%) |
| 35 to 64 Years | 0 (0.0%) | 0 (0.0%) |
| 65 to 74 Years | 1 (100.0%) | 0 (0.0%) |
| 75 Years and over | 1 (14.3%) | 0 (0.0%) |
Disability Class: Vision Difficulty
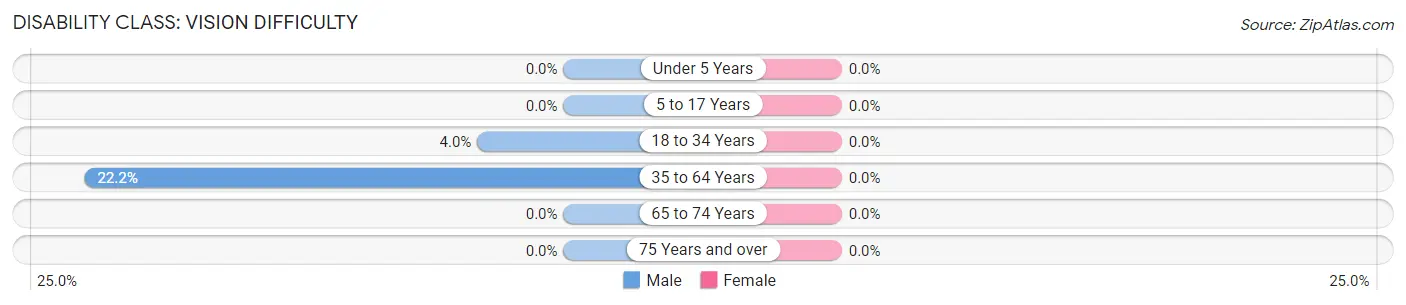
| Age Bracket | Male | Female |
| Under 5 Years | 0 (0.0%) | 0 (0.0%) |
| 5 to 17 Years | 0 (0.0%) | 0 (0.0%) |
| 18 to 34 Years | 1 (4.0%) | 0 (0.0%) |
| 35 to 64 Years | 6 (22.2%) | 0 (0.0%) |
| 65 to 74 Years | 0 (0.0%) | 0 (0.0%) |
| 75 Years and over | 0 (0.0%) | 0 (0.0%) |
Disability Class: Cognitive Difficulty
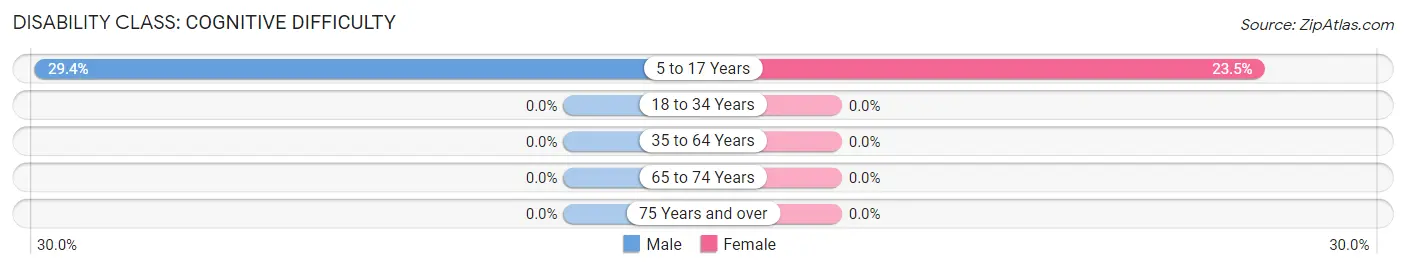
| Age Bracket | Male | Female |
| 5 to 17 Years | 10 (29.4%) | 8 (23.5%) |
| 18 to 34 Years | 0 (0.0%) | 0 (0.0%) |
| 35 to 64 Years | 0 (0.0%) | 0 (0.0%) |
| 65 to 74 Years | 0 (0.0%) | 0 (0.0%) |
| 75 Years and over | 0 (0.0%) | 0 (0.0%) |
Disability Class: Ambulatory Difficulty
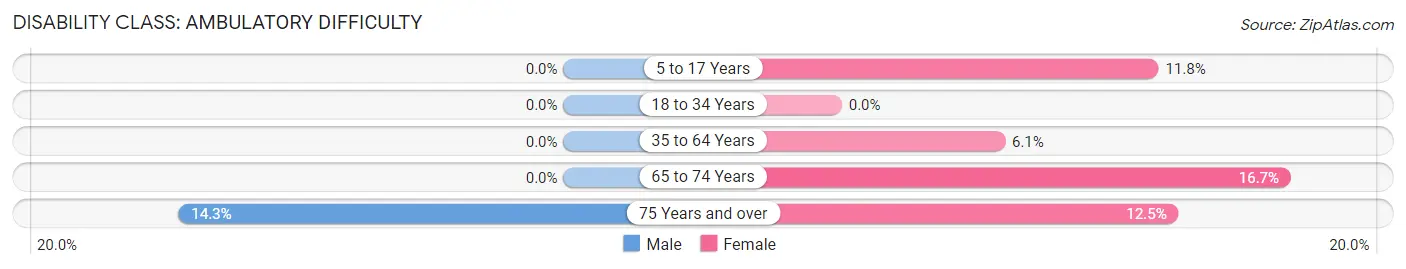
| Age Bracket | Male | Female |
| 5 to 17 Years | 0 (0.0%) | 4 (11.8%) |
| 18 to 34 Years | 0 (0.0%) | 0 (0.0%) |
| 35 to 64 Years | 0 (0.0%) | 2 (6.1%) |
| 65 to 74 Years | 0 (0.0%) | 1 (16.7%) |
| 75 Years and over | 1 (14.3%) | 1 (12.5%) |
Disability Class: Self-Care Difficulty
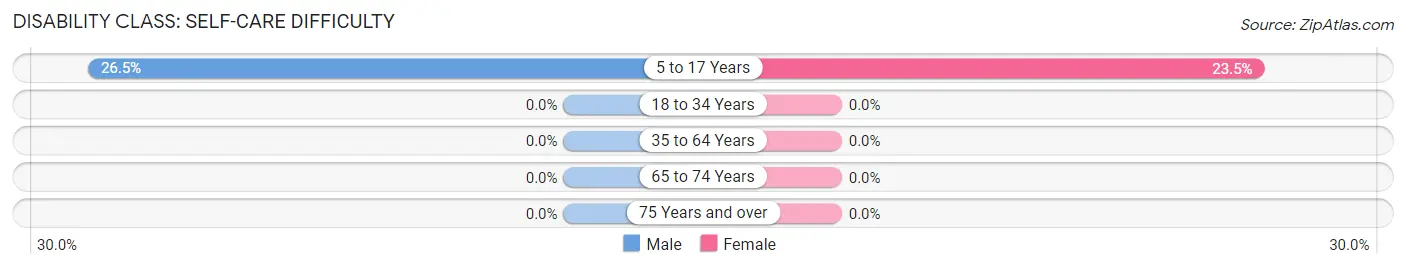
| Age Bracket | Male | Female |
| 5 to 17 Years | 9 (26.5%) | 8 (23.5%) |
| 18 to 34 Years | 0 (0.0%) | 0 (0.0%) |
| 35 to 64 Years | 0 (0.0%) | 0 (0.0%) |
| 65 to 74 Years | 0 (0.0%) | 0 (0.0%) |
| 75 Years and over | 0 (0.0%) | 0 (0.0%) |
Technology Access in Troutville borough
Computing Device Access in Troutville borough
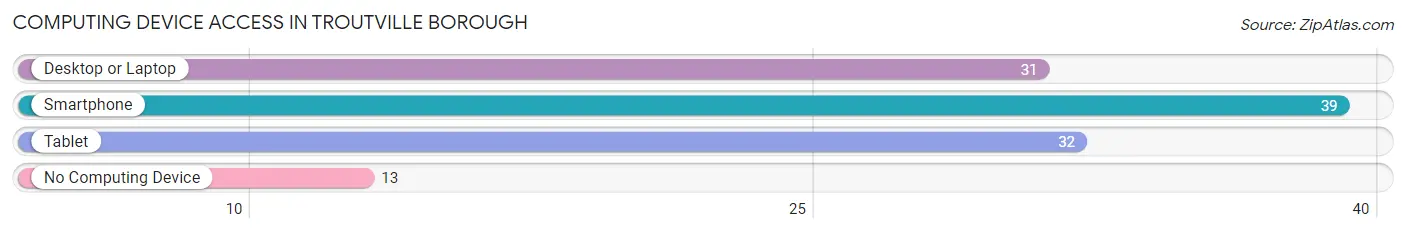
| Device Type | # Households | % Households |
| Desktop or Laptop | 31 | 56.4% |
| Smartphone | 39 | 70.9% |
| Tablet | 32 | 58.2% |
| No Computing Device | 13 | 23.6% |
| Total | 55 | 100.0% |
Internet Access in Troutville borough
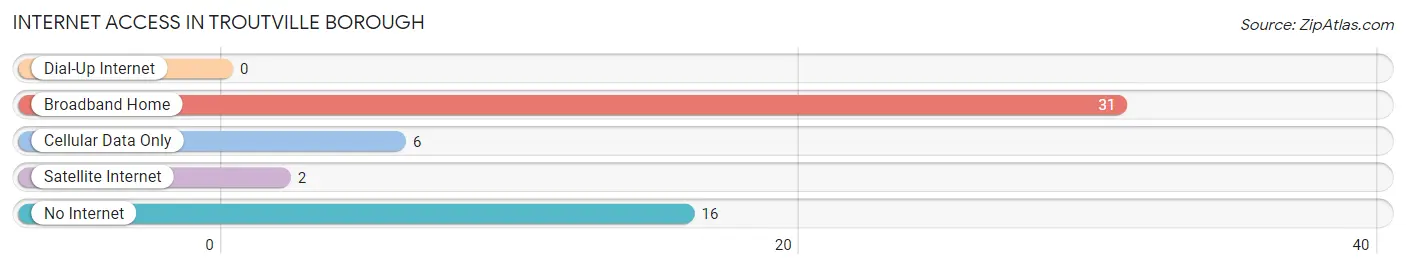
| Internet Type | # Households | % Households |
| Dial-Up Internet | 0 | 0.0% |
| Broadband Home | 31 | 56.4% |
| Cellular Data Only | 6 | 10.9% |
| Satellite Internet | 2 | 3.6% |
| No Internet | 16 | 29.1% |
| Total | 55 | 100.0% |
Troutville borough Summary
Troutville Borough is a small borough located in Bedford County, Pennsylvania. It is situated in the Allegheny Mountains, approximately 20 miles east of Altoona and 90 miles east of Pittsburgh. The borough is home to a population of approximately 1,000 people, and is known for its rural charm and small-town atmosphere.
History
Troutville Borough was founded in 1845 by a group of settlers from the nearby town of Bedford. The settlers were looking for a place to settle and raise their families, and Troutville was the perfect spot. The town was named after the abundance of trout in the nearby streams. The first settlers built a log cabin, and soon more settlers began to arrive. By the late 1800s, Troutville had become a thriving community with a post office, a general store, a blacksmith shop, and a school.
In the early 1900s, Troutville began to experience a period of growth and prosperity. The town was home to several businesses, including a sawmill, a grist mill, a tannery, and a brickyard. The town also had a hotel, a bank, and a movie theater. The town was also home to a number of churches, including the Troutville United Methodist Church, which was founded in 1876.
In the mid-1900s, Troutville began to experience a period of decline. The sawmill and grist mill closed, and the tannery and brickyard moved away. The population began to decline, and by the 1970s, the town had become a virtual ghost town.
In the late 1970s, Troutville began to experience a period of revitalization. The town was designated as a National Historic District in 1979, and the Troutville Historical Society was formed in 1980. The society has worked to preserve the town’s history and to promote its revitalization.
Geography
Troutville Borough is located in Bedford County, Pennsylvania. It is situated in the Allegheny Mountains, approximately 20 miles east of Altoona and 90 miles east of Pittsburgh. The borough is bordered by the towns of Bedford, Everett, and Saxton. The borough is situated in a valley, and is surrounded by rolling hills and forests. The borough is home to several creeks, including the Little Juniata River, which flows through the center of town.
Economy
Troutville Borough’s economy is largely based on tourism and agriculture. The town is home to several small businesses, including a general store, a hardware store, a restaurant, and a bed and breakfast. The town is also home to several farms, which produce a variety of crops, including corn, soybeans, and hay.
Demographics
As of the 2010 census, Troutville Borough had a population of 1,000 people. The racial makeup of the borough was 97.2% White, 0.7% African American, 0.2% Native American, 0.2% Asian, 0.2% from other races, and 1.7% from two or more races. Hispanic or Latino of any race were 0.7% of the population.
The median income for a household in Troutville Borough was $37,500, and the median income for a family was $41,250. The per capita income for the borough was $17,845. About 11.2% of families and 13.2% of the population were below the poverty line, including 16.7% of those under age 18 and 8.3% of those age 65 or over.
Common Questions
What is Per Capita Income in Troutville borough?
Per Capita income in Troutville borough is $24,737.
What is the Median Family Income in Troutville borough?
Median Family Income in Troutville borough is $75,833.
What is the Median Household income in Troutville borough?
Median Household Income in Troutville borough is $75,417.
What is Income or Wage Gap in Troutville borough?
Income or Wage Gap in Troutville borough is 55.3%.
Women in Troutville borough earn 44.7 cents for every dollar earned by a man.
What is Inequality or Gini Index in Troutville borough?
Inequality or Gini Index in Troutville borough is 0.36.
What is the Total Population of Troutville borough?
Total Population of Troutville borough is 218.
What is the Total Male Population of Troutville borough?
Total Male Population of Troutville borough is 108.
What is the Total Female Population of Troutville borough?
Total Female Population of Troutville borough is 110.
What is the Ratio of Males per 100 Females in Troutville borough?
There are 98.18 Males per 100 Females in Troutville borough.
What is the Ratio of Females per 100 Males in Troutville borough?
There are 101.85 Females per 100 Males in Troutville borough.
What is the Median Population Age in Troutville borough?
Median Population Age in Troutville borough is 25.0 Years.
What is the Average Family Size in Troutville borough
Average Family Size in Troutville borough is 5.2 People.
What is the Average Household Size in Troutville borough
Average Household Size in Troutville borough is 4.0 People.
How Large is the Labor Force in Troutville borough?
There are 73 People in the Labor Forcein in Troutville borough.
What is the Percentage of People in the Labor Force in Troutville borough?
53.3% of People are in the Labor Force in Troutville borough.