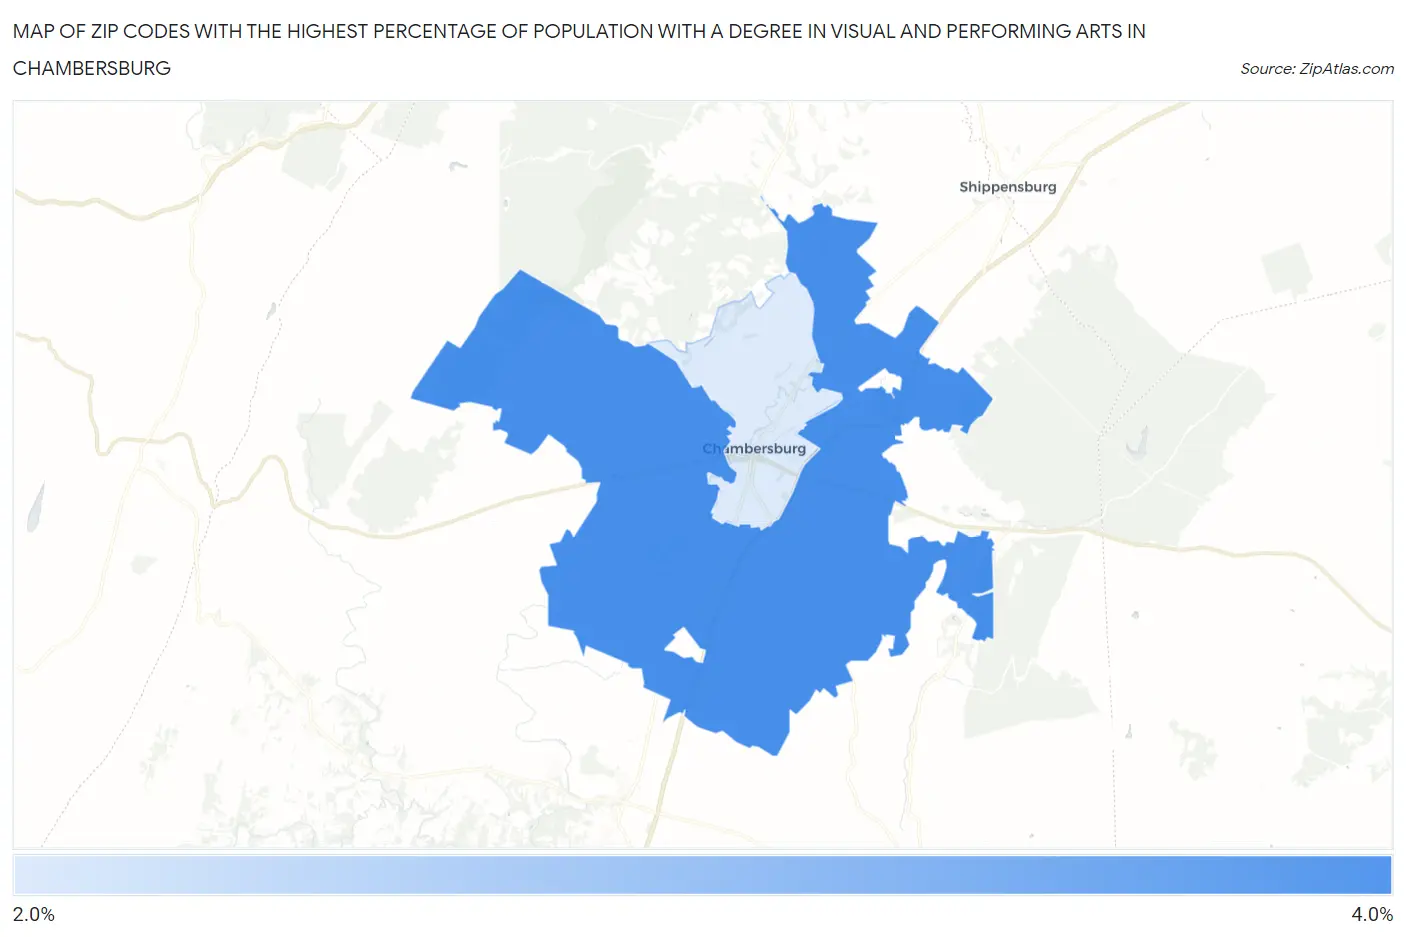
Zip Codes with the Highest Percentage of Population with a Degree in Visual and Performing Arts in Chambersburg, PA
RELATED REPORTS & OPTIONS
Visual and Performing Arts
Chambersburg
Compare Zip Codes
Map of Zip Codes with the Highest Percentage of Population with a Degree in Visual and Performing Arts in Chambersburg
2.2%
3.6%
Zip Codes with the Highest Percentage of Population with a Degree in Visual and Performing Arts in Chambersburg, PA
| Zip Code | % Graduates | vs State | vs National | |
| 1. | 17202 | 3.6% | 3.8%(-0.205)#494 | 4.3%(-0.634)#10,435 |
| 2. | 17201 | 2.2% | 3.8%(-1.58)#781 | 4.3%(-2.01)#15,569 |
1
Common Questions
What are the Top Zip Codes with the Highest Percentage of Population with a Degree in Visual and Performing Arts in Chambersburg, PA?
Top Zip Codes with the Highest Percentage of Population with a Degree in Visual and Performing Arts in Chambersburg, PA are:
What zip code has the Highest Percentage of Population with a Degree in Visual and Performing Arts in Chambersburg, PA?
17202 has the Highest Percentage of Population with a Degree in Visual and Performing Arts in Chambersburg, PA with 3.6%.
What is the Percentage of Population with a Degree in Visual and Performing Arts in Pennsylvania?
Percentage of Population with a Degree in Visual and Performing Arts in Pennsylvania is 3.8%.
What is the Percentage of Population with a Degree in Visual and Performing Arts in the United States?
Percentage of Population with a Degree in Visual and Performing Arts in the United States is 4.3%.