Cressona borough, PA Map & Demographics
Cressona borough Overview
$30,632
PER CAPITA INCOME
$74,239
AVG FAMILY INCOME
$69,300
AVG HOUSEHOLD INCOME
42.2%
WAGE / INCOME GAP [ % ]
57.8¢/ $1
WAGE / INCOME GAP [ $ ]
0.35
INEQUALITY / GINI INDEX
1,312
TOTAL POPULATION
646
MALE POPULATION
666
FEMALE POPULATION
97.00
MALES / 100 FEMALES
103.10
FEMALES / 100 MALES
38.2
MEDIAN AGE
2.9
AVG FAMILY SIZE
2.4
AVG HOUSEHOLD SIZE
775
LABOR FORCE [ PEOPLE ]
70.8%
PERCENT IN LABOR FORCE
4.6%
UNEMPLOYMENT RATE
Income in Cressona borough
Income Overview in Cressona borough
Per Capita Income in Cressona borough is $30,632, while median incomes of families and households are $74,239 and $69,300 respectively.
| Characteristic | Number | Measure |
| Per Capita Income | 1,312 | $30,632 |
| Median Family Income | 344 | $74,239 |
| Mean Family Income | 344 | $79,545 |
| Median Household Income | 538 | $69,300 |
| Mean Household Income | 538 | $71,999 |
| Income Deficit | 344 | $0 |
| Wage / Income Gap (%) | 1,312 | 42.19% |
| Wage / Income Gap ($) | 1,312 | 57.81¢ per $1 |
| Gini / Inequality Index | 1,312 | 0.35 |
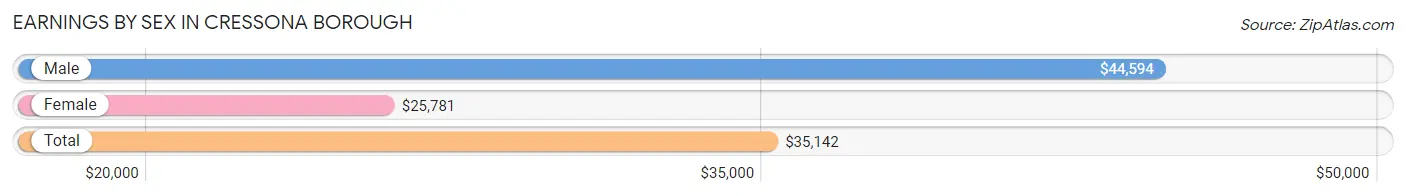
Earnings by Sex in Cressona borough
Average Earnings in Cressona borough are $35,142, $44,594 for men and $25,781 for women, a difference of 42.2%.
| Sex | Number | Average Earnings |
| Male | 429 (53.8%) | $44,594 |
| Female | 368 (46.2%) | $25,781 |
| Total | 797 (100.0%) | $35,142 |
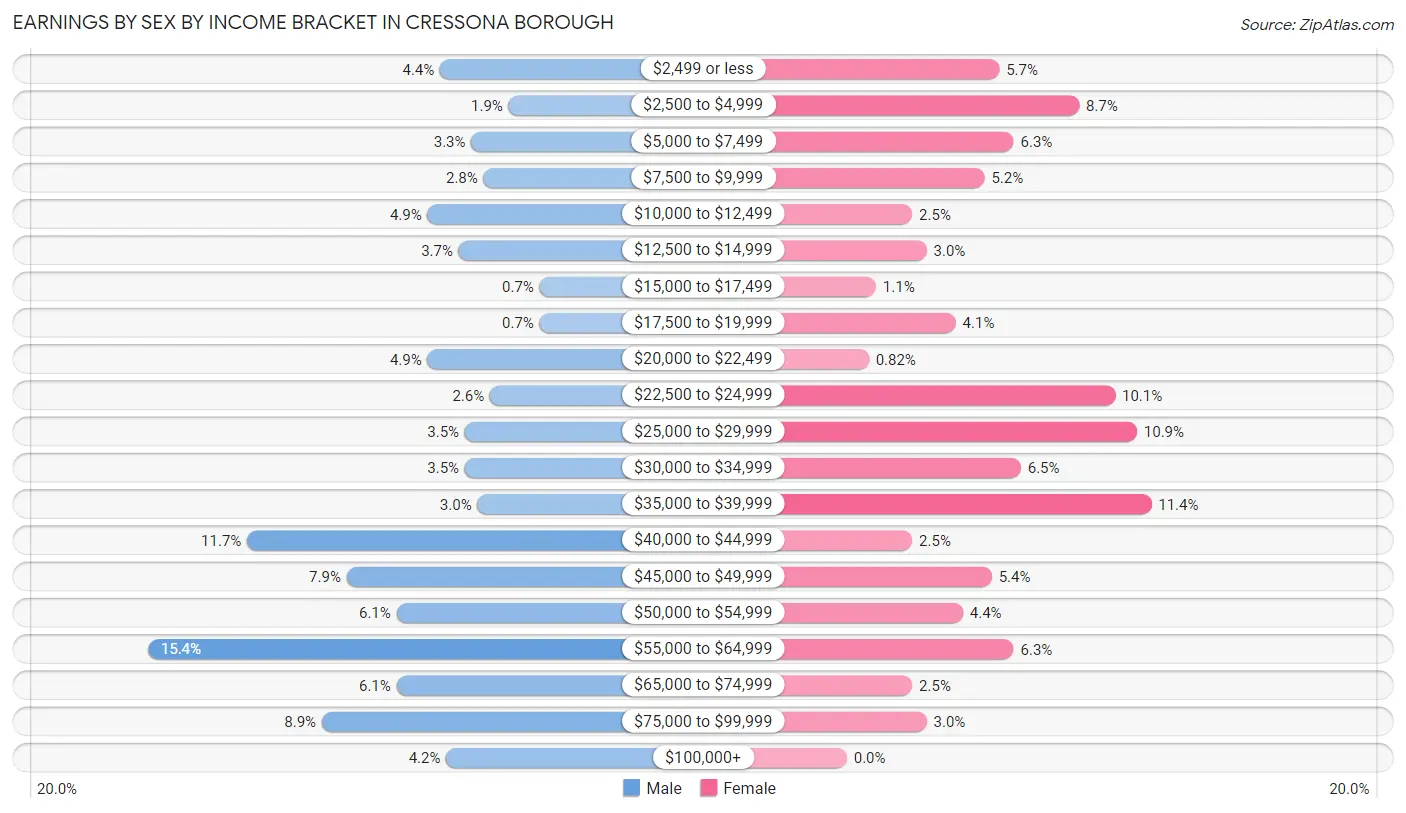
Earnings by Sex by Income Bracket in Cressona borough
The most common earnings brackets in Cressona borough are $55,000 to $64,999 for men (66 | 15.4%) and $35,000 to $39,999 for women (42 | 11.4%).
| Income | Male | Female |
| $2,499 or less | 19 (4.4%) | 21 (5.7%) |
| $2,500 to $4,999 | 8 (1.9%) | 32 (8.7%) |
| $5,000 to $7,499 | 14 (3.3%) | 23 (6.2%) |
| $7,500 to $9,999 | 12 (2.8%) | 19 (5.2%) |
| $10,000 to $12,499 | 21 (4.9%) | 9 (2.5%) |
| $12,500 to $14,999 | 16 (3.7%) | 11 (3.0%) |
| $15,000 to $17,499 | 3 (0.7%) | 4 (1.1%) |
| $17,500 to $19,999 | 3 (0.7%) | 15 (4.1%) |
| $20,000 to $22,499 | 21 (4.9%) | 3 (0.8%) |
| $22,500 to $24,999 | 11 (2.6%) | 37 (10.1%) |
| $25,000 to $29,999 | 15 (3.5%) | 40 (10.9%) |
| $30,000 to $34,999 | 15 (3.5%) | 24 (6.5%) |
| $35,000 to $39,999 | 13 (3.0%) | 42 (11.4%) |
| $40,000 to $44,999 | 50 (11.7%) | 9 (2.5%) |
| $45,000 to $49,999 | 34 (7.9%) | 20 (5.4%) |
| $50,000 to $54,999 | 26 (6.1%) | 16 (4.3%) |
| $55,000 to $64,999 | 66 (15.4%) | 23 (6.2%) |
| $65,000 to $74,999 | 26 (6.1%) | 9 (2.5%) |
| $75,000 to $99,999 | 38 (8.9%) | 11 (3.0%) |
| $100,000+ | 18 (4.2%) | 0 (0.0%) |
| Total | 429 (100.0%) | 368 (100.0%) |
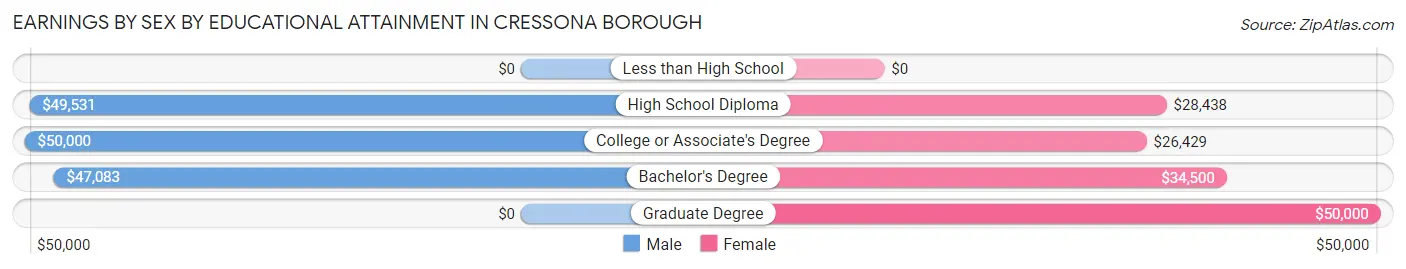
Earnings by Sex by Educational Attainment in Cressona borough
Average earnings in Cressona borough are $47,917 for men and $29,688 for women, a difference of 38.0%. Men with an educational attainment of college or associate's degree enjoy the highest average annual earnings of $50,000, while those with bachelor's degree education earn the least with $47,083. Women with an educational attainment of graduate degree earn the most with the average annual earnings of $50,000, while those with college or associate's degree education have the smallest earnings of $26,429.
| Educational Attainment | Male Income | Female Income |
| Less than High School | - | - |
| High School Diploma | $49,531 | $28,438 |
| College or Associate's Degree | $50,000 | $26,429 |
| Bachelor's Degree | $47,083 | $34,500 |
| Graduate Degree | - | - |
| Total | $47,917 | $29,688 |
Family Income in Cressona borough
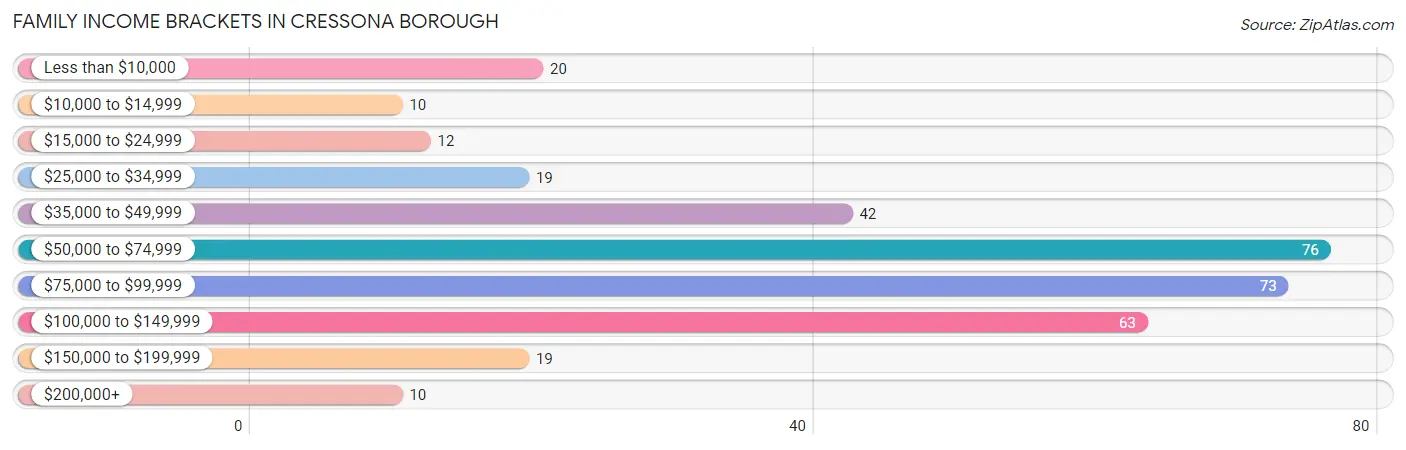
Family Income Brackets in Cressona borough
According to the Cressona borough family income data, there are 76 families falling into the $50,000 to $74,999 income range, which is the most common income bracket and makes up 22.1% of all families. Conversely, the $10,000 to $14,999 income bracket is the least frequent group with only 10 families (2.9%) belonging to this category.
| Income Bracket | # Families | % Families |
| Less than $10,000 | 20 | 5.8% |
| $10,000 to $14,999 | 10 | 2.9% |
| $15,000 to $24,999 | 12 | 3.5% |
| $25,000 to $34,999 | 19 | 5.5% |
| $35,000 to $49,999 | 42 | 12.2% |
| $50,000 to $74,999 | 76 | 22.1% |
| $75,000 to $99,999 | 73 | 21.2% |
| $100,000 to $149,999 | 63 | 18.3% |
| $150,000 to $199,999 | 19 | 5.5% |
| $200,000+ | 10 | 2.9% |
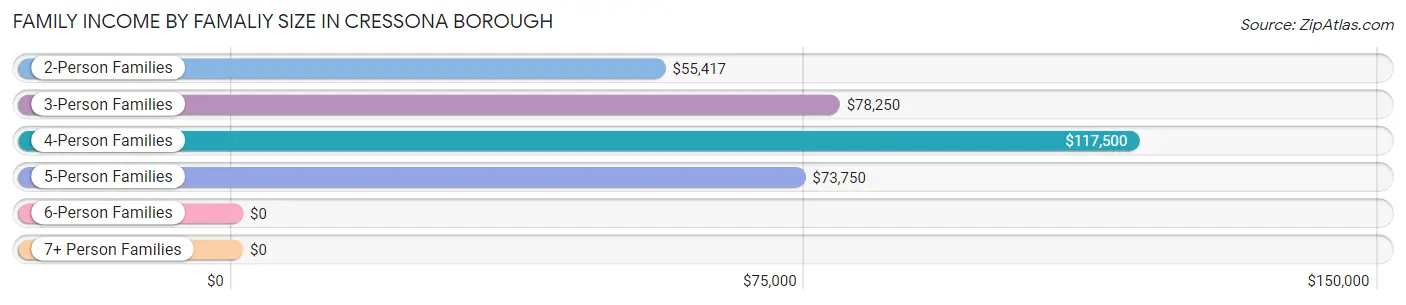
Family Income by Famaliy Size in Cressona borough
4-person families (66 | 19.2%) account for the highest median family income in Cressona borough with $117,500 per family, while 4-person families (66 | 19.2%) have the highest median income of $29,375 per family member.
| Income Bracket | # Families | Median Income |
| 2-Person Families | 179 (52.0%) | $55,417 |
| 3-Person Families | 80 (23.3%) | $78,250 |
| 4-Person Families | 66 (19.2%) | $117,500 |
| 5-Person Families | 14 (4.1%) | $73,750 |
| 6-Person Families | 0 (0.0%) | $0 |
| 7+ Person Families | 5 (1.5%) | $0 |
| Total | 344 (100.0%) | $74,239 |
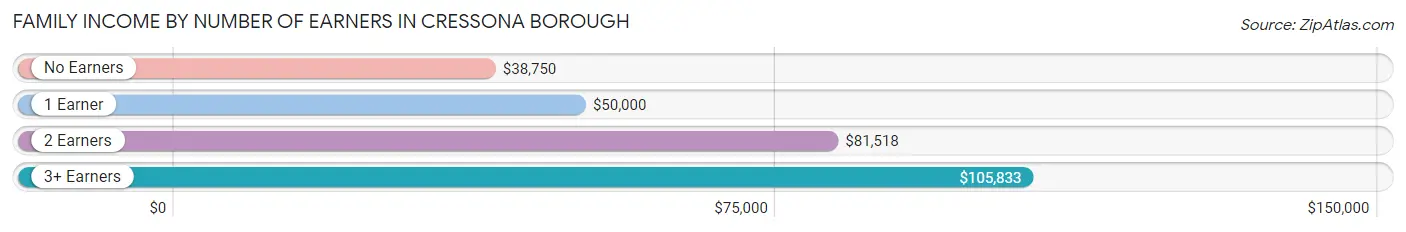
Family Income by Number of Earners in Cressona borough
The median family income in Cressona borough is $74,239, with families comprising 3+ earners (54) having the highest median family income of $105,833, while families with no earners (55) have the lowest median family income of $38,750, accounting for 15.7% and 16.0% of families, respectively.
| Number of Earners | # Families | Median Income |
| No Earners | 55 (16.0%) | $38,750 |
| 1 Earner | 96 (27.9%) | $50,000 |
| 2 Earners | 139 (40.4%) | $81,518 |
| 3+ Earners | 54 (15.7%) | $105,833 |
| Total | 344 (100.0%) | $74,239 |
Household Income in Cressona borough
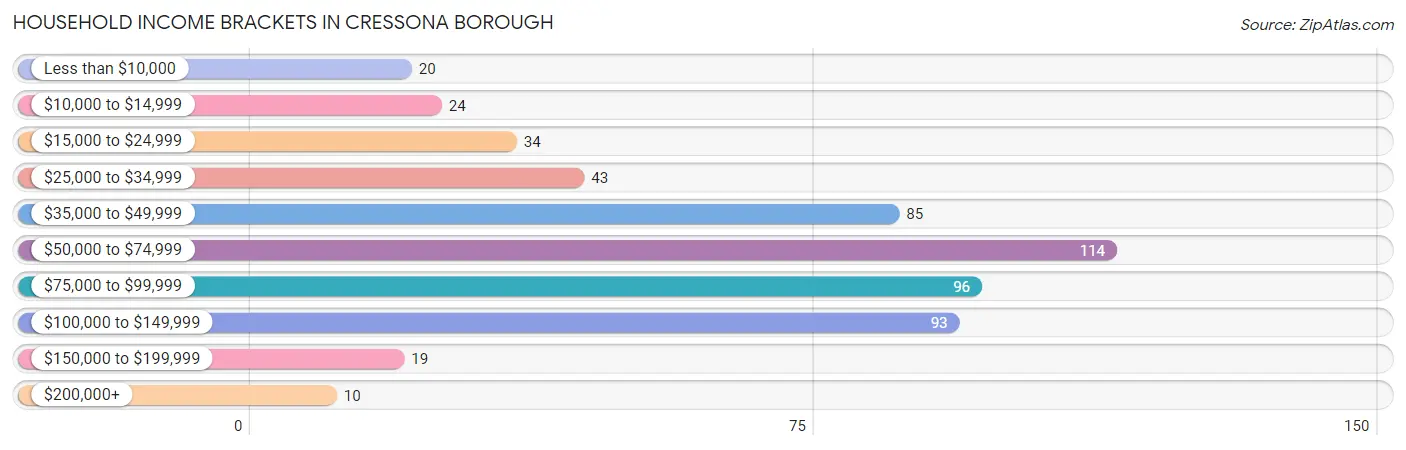
Household Income Brackets in Cressona borough
With 114 households falling in the category, the $50,000 to $74,999 income range is the most frequent in Cressona borough, accounting for 21.2% of all households. In contrast, only 10 households (1.9%) fall into the $200,000+ income bracket, making it the least populous group.
| Income Bracket | # Households | % Households |
| Less than $10,000 | 20 | 3.7% |
| $10,000 to $14,999 | 24 | 4.5% |
| $15,000 to $24,999 | 34 | 6.3% |
| $25,000 to $34,999 | 43 | 8.0% |
| $35,000 to $49,999 | 85 | 15.8% |
| $50,000 to $74,999 | 114 | 21.2% |
| $75,000 to $99,999 | 96 | 17.8% |
| $100,000 to $149,999 | 93 | 17.3% |
| $150,000 to $199,999 | 19 | 3.5% |
| $200,000+ | 10 | 1.9% |
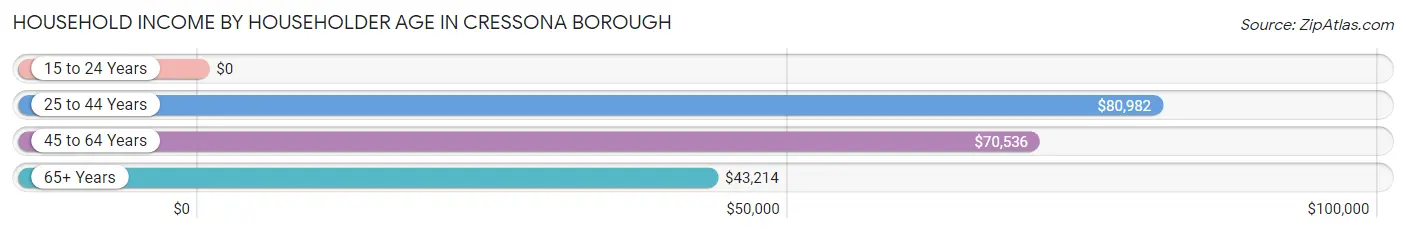
Household Income by Householder Age in Cressona borough
The median household income in Cressona borough is $69,300, with the highest median household income of $80,982 found in the 25 to 44 years age bracket for the primary householder. A total of 159 households (29.5%) fall into this category. Meanwhile, the 15 to 24 years age bracket for the primary householder has the lowest median household income of $0, with 9 households (1.7%) in this group.
| Income Bracket | # Households | Median Income |
| 15 to 24 Years | 9 (1.7%) | $0 |
| 25 to 44 Years | 159 (29.5%) | $80,982 |
| 45 to 64 Years | 210 (39.0%) | $70,536 |
| 65+ Years | 160 (29.7%) | $43,214 |
| Total | 538 (100.0%) | $69,300 |
Poverty in Cressona borough
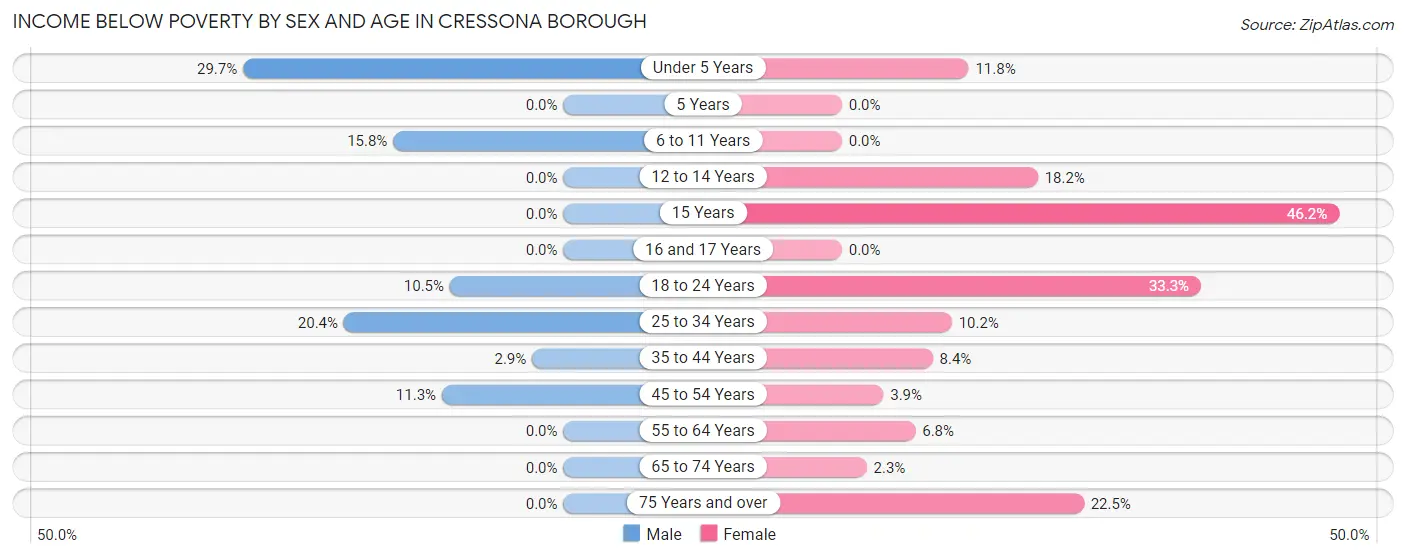
Income Below Poverty by Sex and Age in Cressona borough
With 9.2% poverty level for males and 10.1% for females among the residents of Cressona borough, under 5 year old males and 15 year old females are the most vulnerable to poverty, with 11 males (29.7%) and 6 females (46.2%) in their respective age groups living below the poverty level.
| Age Bracket | Male | Female |
| Under 5 Years | 11 (29.7%) | 2 (11.8%) |
| 5 Years | 0 (0.0%) | 0 (0.0%) |
| 6 to 11 Years | 6 (15.8%) | 0 (0.0%) |
| 12 to 14 Years | 0 (0.0%) | 2 (18.2%) |
| 15 Years | 0 (0.0%) | 6 (46.2%) |
| 16 and 17 Years | 0 (0.0%) | 0 (0.0%) |
| 18 to 24 Years | 8 (10.5%) | 18 (33.3%) |
| 25 to 34 Years | 22 (20.4%) | 10 (10.2%) |
| 35 to 44 Years | 2 (2.9%) | 7 (8.4%) |
| 45 to 54 Years | 8 (11.3%) | 3 (3.8%) |
| 55 to 64 Years | 0 (0.0%) | 6 (6.8%) |
| 65 to 74 Years | 0 (0.0%) | 2 (2.3%) |
| 75 Years and over | 0 (0.0%) | 11 (22.5%) |
| Total | 57 (9.2%) | 67 (10.1%) |
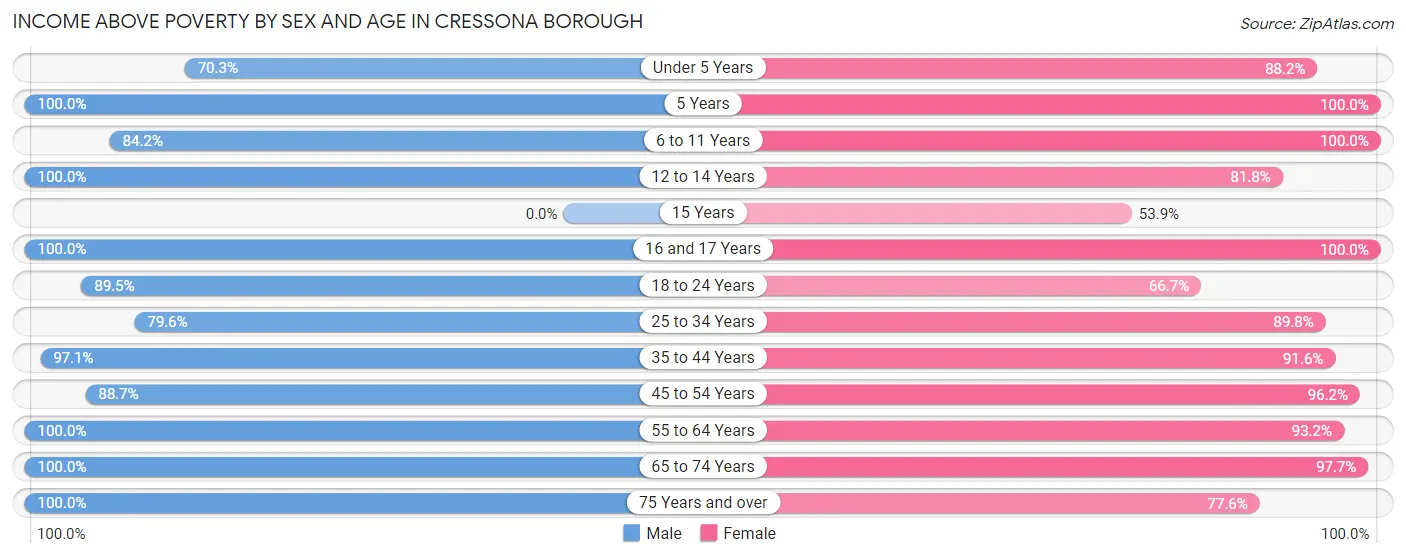
Income Above Poverty by Sex and Age in Cressona borough
According to the poverty statistics in Cressona borough, males aged 5 years and females aged 5 years are the age groups that are most secure financially, with 100.0% of males and 100.0% of females in these age groups living above the poverty line.
| Age Bracket | Male | Female |
| Under 5 Years | 26 (70.3%) | 15 (88.2%) |
| 5 Years | 3 (100.0%) | 15 (100.0%) |
| 6 to 11 Years | 32 (84.2%) | 49 (100.0%) |
| 12 to 14 Years | 6 (100.0%) | 9 (81.8%) |
| 15 Years | 0 (0.0%) | 7 (53.8%) |
| 16 and 17 Years | 3 (100.0%) | 24 (100.0%) |
| 18 to 24 Years | 68 (89.5%) | 36 (66.7%) |
| 25 to 34 Years | 86 (79.6%) | 88 (89.8%) |
| 35 to 44 Years | 67 (97.1%) | 76 (91.6%) |
| 45 to 54 Years | 63 (88.7%) | 75 (96.2%) |
| 55 to 64 Years | 88 (100.0%) | 82 (93.2%) |
| 65 to 74 Years | 73 (100.0%) | 85 (97.7%) |
| 75 Years and over | 46 (100.0%) | 38 (77.5%) |
| Total | 561 (90.8%) | 599 (89.9%) |
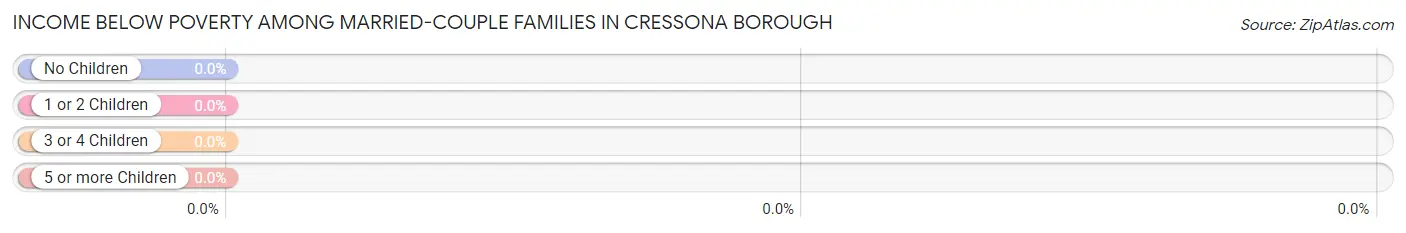
Income Below Poverty Among Married-Couple Families in Cressona borough
| Children | Above Poverty | Below Poverty |
| No Children | 158 (100.0%) | 0 (0.0%) |
| 1 or 2 Children | 68 (100.0%) | 0 (0.0%) |
| 3 or 4 Children | 6 (100.0%) | 0 (0.0%) |
| 5 or more Children | 5 (100.0%) | 0 (0.0%) |
| Total | 237 (100.0%) | 0 (0.0%) |
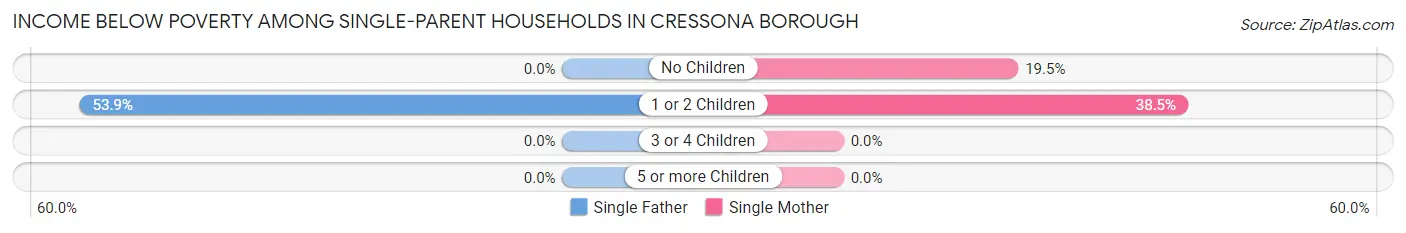
Income Below Poverty Among Single-Parent Households in Cressona borough
According to the poverty data in Cressona borough, 25.9% or 7 single-father households and 28.7% or 23 single-mother households are living below the poverty line. Among single-father households, those with 1 or 2 children have the highest poverty rate, with 7 households (53.8%) experiencing poverty. Likewise, among single-mother households, those with 1 or 2 children have the highest poverty rate, with 15 households (38.5%) falling below the poverty line.
| Children | Single Father | Single Mother |
| No Children | 0 (0.0%) | 8 (19.5%) |
| 1 or 2 Children | 7 (53.8%) | 15 (38.5%) |
| 3 or 4 Children | 0 (0.0%) | 0 (0.0%) |
| 5 or more Children | 0 (0.0%) | 0 (0.0%) |
| Total | 7 (25.9%) | 23 (28.7%) |
Income Below Poverty Among Married-Couple vs Single-Parent Households in Cressona borough
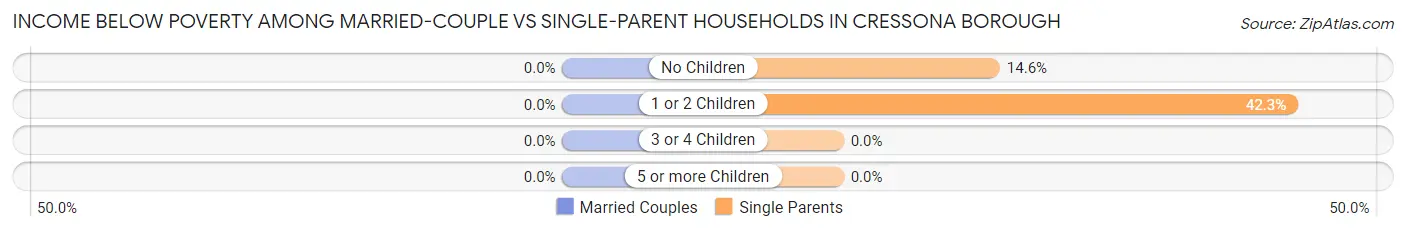
| Children | Married-Couple Families | Single-Parent Households |
| No Children | 0 (0.0%) | 8 (14.5%) |
| 1 or 2 Children | 0 (0.0%) | 22 (42.3%) |
| 3 or 4 Children | 0 (0.0%) | 0 (0.0%) |
| 5 or more Children | 0 (0.0%) | 0 (0.0%) |
| Total | 0 (0.0%) | 30 (28.0%) |
Race in Cressona borough
The most populous races in Cressona borough are White / Caucasian (1,279 | 97.5%), Hispanic or Latino (39 | 3.0%), and Two or more Races (25 | 1.9%).
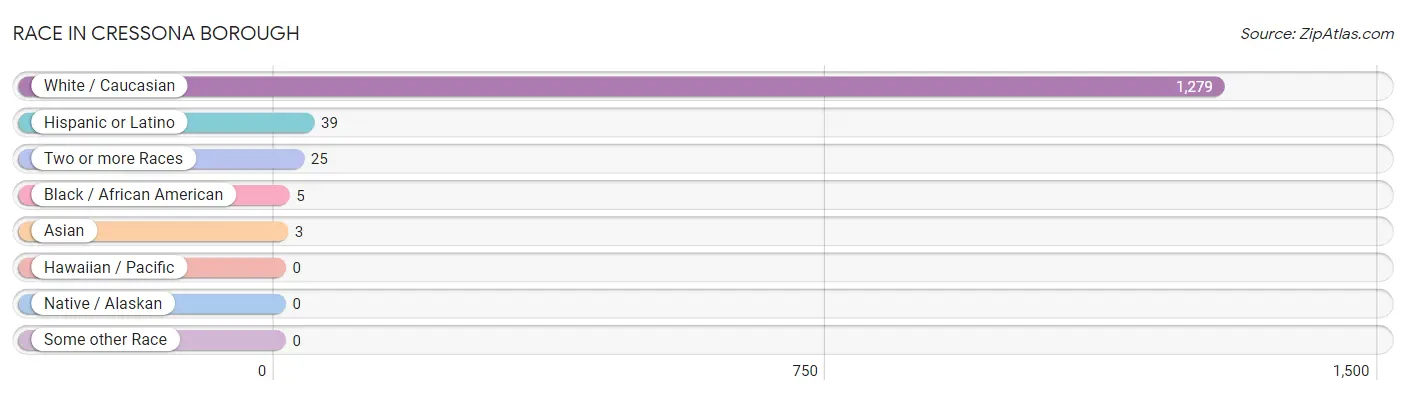
| Race | # Population | % Population |
| Asian | 3 | 0.2% |
| Black / African American | 5 | 0.4% |
| Hawaiian / Pacific | 0 | 0.0% |
| Hispanic or Latino | 39 | 3.0% |
| Native / Alaskan | 0 | 0.0% |
| White / Caucasian | 1,279 | 97.5% |
| Two or more Races | 25 | 1.9% |
| Some other Race | 0 | 0.0% |
| Total | 1,312 | 100.0% |
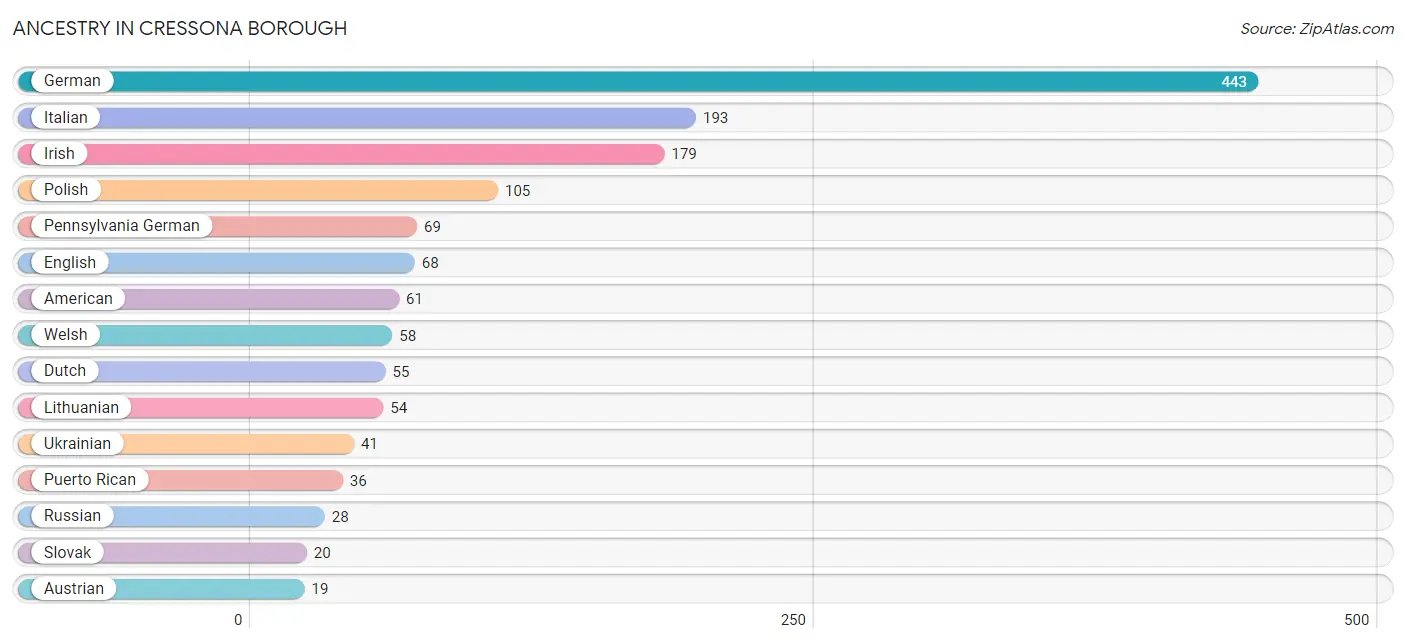
Ancestry in Cressona borough
The most populous ancestries reported in Cressona borough are German (443 | 33.8%), Italian (193 | 14.7%), Irish (179 | 13.6%), Polish (105 | 8.0%), and Pennsylvania German (69 | 5.3%), together accounting for 75.4% of all Cressona borough residents.
| Ancestry | # Population | % Population |
| American | 61 | 4.6% |
| Austrian | 19 | 1.5% |
| Brazilian | 5 | 0.4% |
| British | 7 | 0.5% |
| Cherokee | 2 | 0.2% |
| Chippewa | 3 | 0.2% |
| Czech | 4 | 0.3% |
| Delaware | 2 | 0.2% |
| Dutch | 55 | 4.2% |
| Eastern European | 4 | 0.3% |
| English | 68 | 5.2% |
| European | 7 | 0.5% |
| French | 18 | 1.4% |
| German | 443 | 33.8% |
| Greek | 18 | 1.4% |
| Guamanian / Chamorro | 7 | 0.5% |
| Haitian | 3 | 0.2% |
| Indian (Asian) | 3 | 0.2% |
| Irish | 179 | 13.6% |
| Italian | 193 | 14.7% |
| Lithuanian | 54 | 4.1% |
| Northern European | 2 | 0.2% |
| Norwegian | 11 | 0.8% |
| Pennsylvania German | 69 | 5.3% |
| Polish | 105 | 8.0% |
| Puerto Rican | 36 | 2.7% |
| Russian | 28 | 2.1% |
| Scotch-Irish | 16 | 1.2% |
| Scottish | 6 | 0.5% |
| Slovak | 20 | 1.5% |
| Ukrainian | 41 | 3.1% |
| Welsh | 58 | 4.4% | View All 32 Rows |
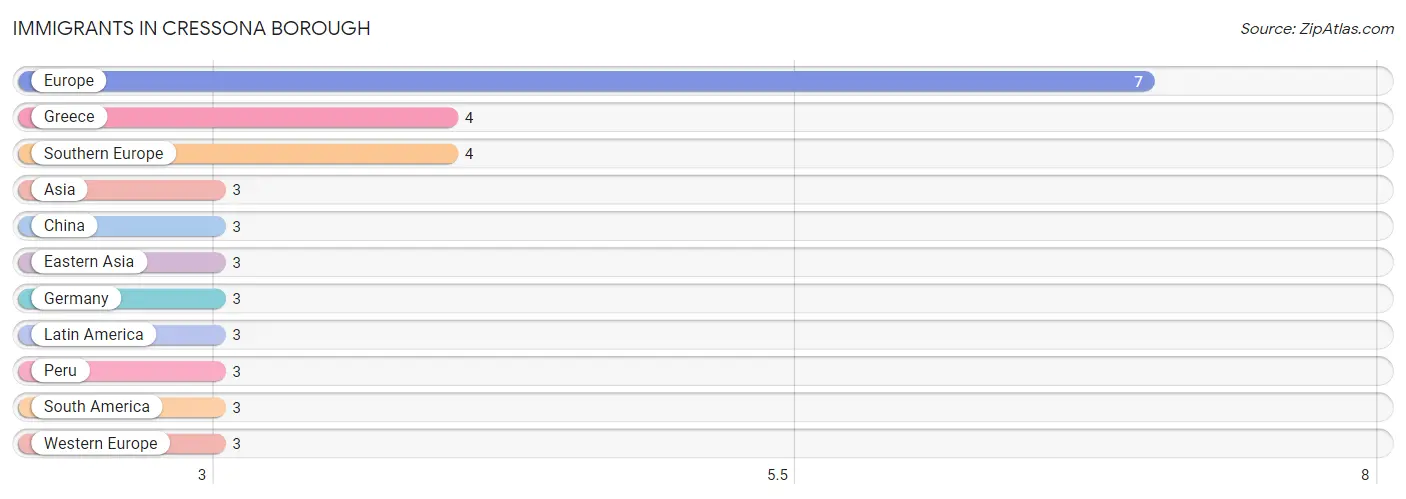
Immigrants in Cressona borough
The most numerous immigrant groups reported in Cressona borough came from Europe (7 | 0.5%), Greece (4 | 0.3%), Southern Europe (4 | 0.3%), Asia (3 | 0.2%), and China (3 | 0.2%), together accounting for 1.6% of all Cressona borough residents.
| Immigration Origin | # Population | % Population |
| Asia | 3 | 0.2% |
| China | 3 | 0.2% |
| Eastern Asia | 3 | 0.2% |
| Europe | 7 | 0.5% |
| Germany | 3 | 0.2% |
| Greece | 4 | 0.3% |
| Latin America | 3 | 0.2% |
| Peru | 3 | 0.2% |
| South America | 3 | 0.2% |
| Southern Europe | 4 | 0.3% |
| Western Europe | 3 | 0.2% | View All 11 Rows |
Sex and Age in Cressona borough
Sex and Age in Cressona borough
The most populous age groups in Cressona borough are 30 to 34 Years (70 | 10.8%) for men and 50 to 54 Years (62 | 9.3%) for women.
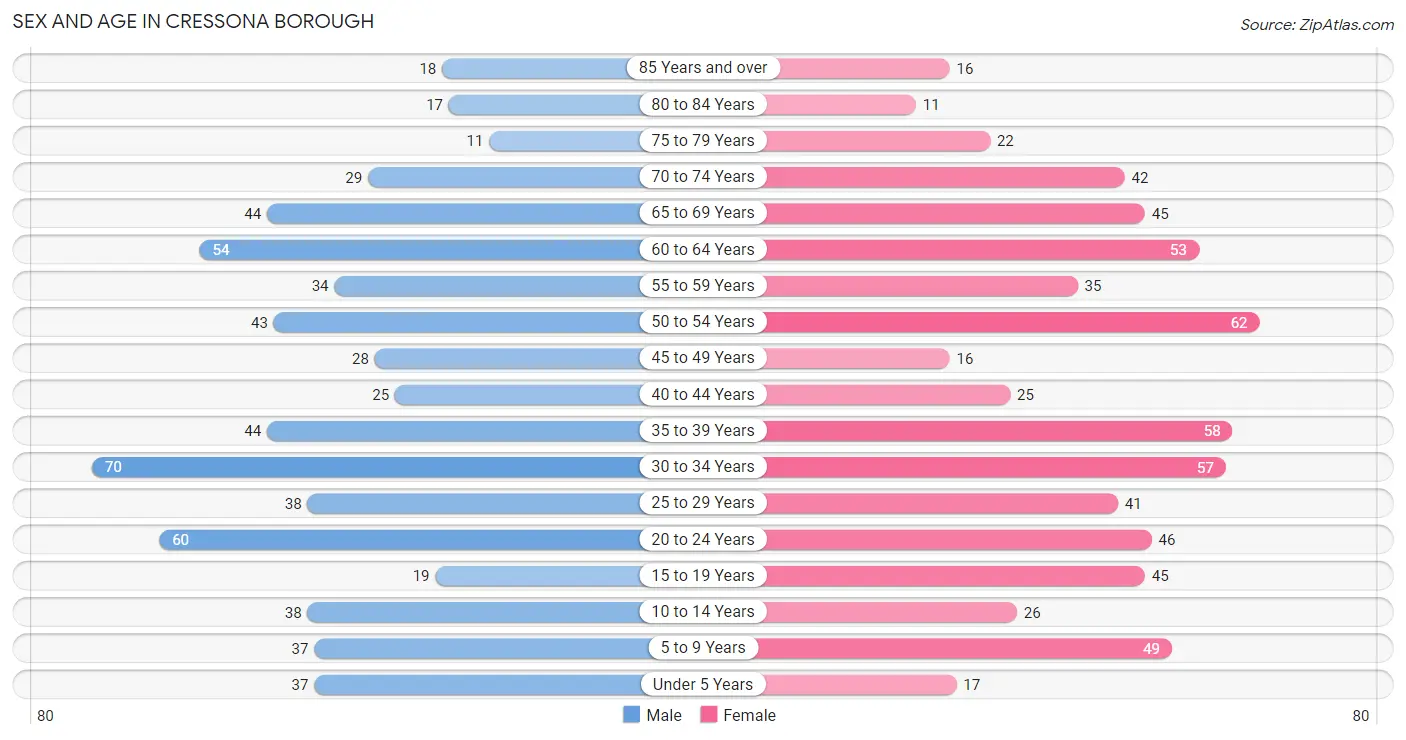
| Age Bracket | Male | Female |
| Under 5 Years | 37 (5.7%) | 17 (2.5%) |
| 5 to 9 Years | 37 (5.7%) | 49 (7.4%) |
| 10 to 14 Years | 38 (5.9%) | 26 (3.9%) |
| 15 to 19 Years | 19 (2.9%) | 45 (6.8%) |
| 20 to 24 Years | 60 (9.3%) | 46 (6.9%) |
| 25 to 29 Years | 38 (5.9%) | 41 (6.2%) |
| 30 to 34 Years | 70 (10.8%) | 57 (8.6%) |
| 35 to 39 Years | 44 (6.8%) | 58 (8.7%) |
| 40 to 44 Years | 25 (3.9%) | 25 (3.7%) |
| 45 to 49 Years | 28 (4.3%) | 16 (2.4%) |
| 50 to 54 Years | 43 (6.7%) | 62 (9.3%) |
| 55 to 59 Years | 34 (5.3%) | 35 (5.3%) |
| 60 to 64 Years | 54 (8.4%) | 53 (8.0%) |
| 65 to 69 Years | 44 (6.8%) | 45 (6.8%) |
| 70 to 74 Years | 29 (4.5%) | 42 (6.3%) |
| 75 to 79 Years | 11 (1.7%) | 22 (3.3%) |
| 80 to 84 Years | 17 (2.6%) | 11 (1.7%) |
| 85 Years and over | 18 (2.8%) | 16 (2.4%) |
| Total | 646 (100.0%) | 666 (100.0%) |
Families and Households in Cressona borough
Median Family Size in Cressona borough
The median family size in Cressona borough is 2.89 persons per family, with married-couple families (237 | 68.9%) accounting for the largest median family size of 3 persons per family. On the other hand, single male/father families (27 | 7.9%) represent the smallest median family size with 2.41 persons per family.
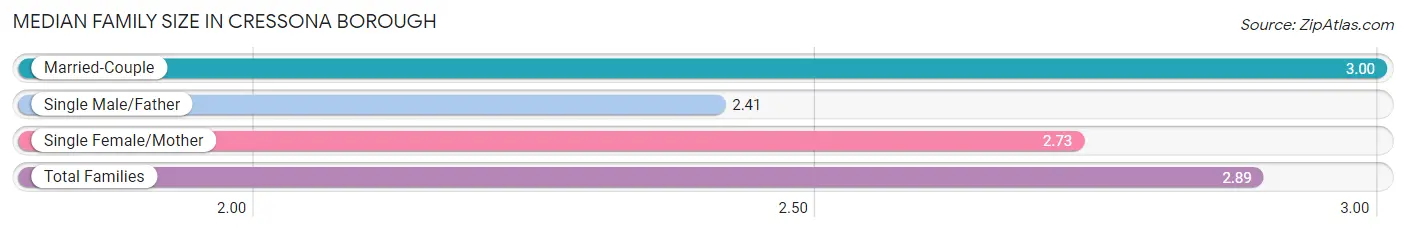
| Family Type | # Families | Family Size |
| Married-Couple | 237 (68.9%) | 3.00 |
| Single Male/Father | 27 (7.9%) | 2.41 |
| Single Female/Mother | 80 (23.3%) | 2.73 |
| Total Families | 344 (100.0%) | 2.89 |
Median Household Size in Cressona borough
The median household size in Cressona borough is 2.44 persons per household, with married-couple households (237 | 44.1%) accounting for the largest median household size of 3 persons per household. non-family households (194 | 36.1%) represent the smallest median household size with 1.45 persons per household.
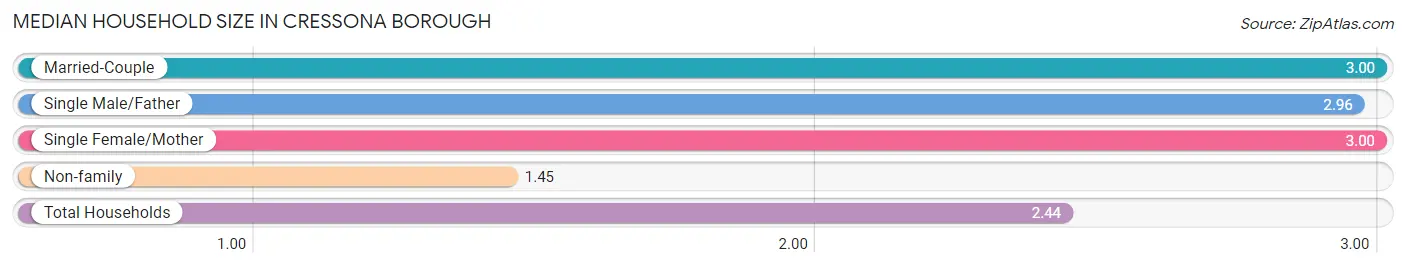
| Household Type | # Households | Household Size |
| Married-Couple | 237 (44.1%) | 3.00 |
| Single Male/Father | 27 (5.0%) | 2.96 |
| Single Female/Mother | 80 (14.9%) | 3.00 |
| Non-family | 194 (36.1%) | 1.45 |
| Total Households | 538 (100.0%) | 2.44 |
Household Size by Marriage Status in Cressona borough
Out of a total of 538 households in Cressona borough, 344 (63.9%) are family households, while 194 (36.1%) are nonfamily households. The most numerous type of family households are 2-person households, comprising 166, and the most common type of nonfamily households are 1-person households, comprising 145.
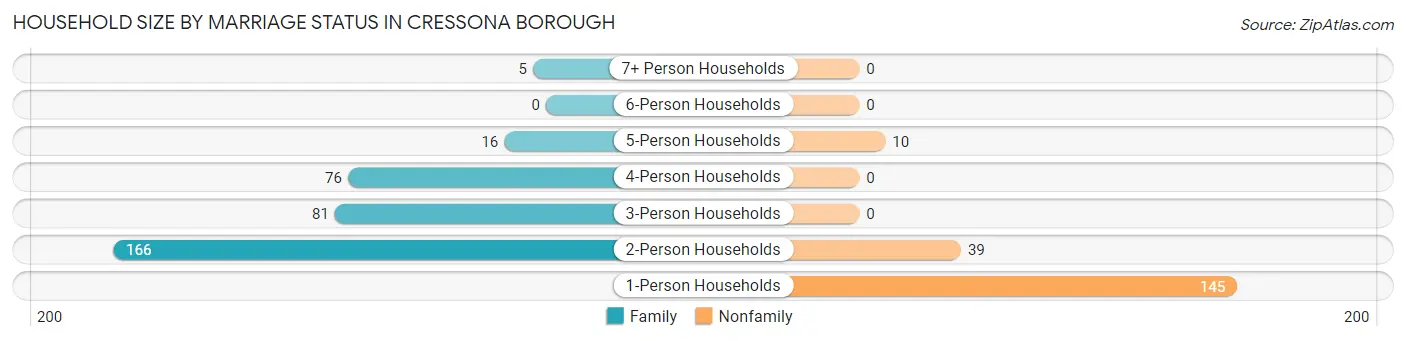
| Household Size | Family Households | Nonfamily Households |
| 1-Person Households | - | 145 (27.0%) |
| 2-Person Households | 166 (30.9%) | 39 (7.2%) |
| 3-Person Households | 81 (15.1%) | 0 (0.0%) |
| 4-Person Households | 76 (14.1%) | 0 (0.0%) |
| 5-Person Households | 16 (3.0%) | 10 (1.9%) |
| 6-Person Households | 0 (0.0%) | 0 (0.0%) |
| 7+ Person Households | 5 (0.9%) | 0 (0.0%) |
| Total | 344 (63.9%) | 194 (36.1%) |
Female Fertility in Cressona borough
Fertility by Age in Cressona borough
| Age Bracket | Women with Births | Births / 1,000 Women |
| 15 to 19 years | 0 (0.0%) | 0.0 |
| 20 to 34 years | 0 (0.0%) | 0.0 |
| 35 to 50 years | 0 (0.0%) | 0.0 |
| Total | 0 (0.0%) | 0.0 |
Fertility by Age by Marriage Status in Cressona borough
| Age Bracket | Married | Unmarried |
| 15 to 19 years | 0 (0.0%) | 0 (0.0%) |
| 20 to 34 years | 0 (0.0%) | 0 (0.0%) |
| 35 to 50 years | 0 (0.0%) | 0 (0.0%) |
| Total | 0 (0.0%) | 0 (0.0%) |
Fertility by Education in Cressona borough
| Educational Attainment | Women with Births | Births / 1,000 Women |
| Less than High School | 0 (0.0%) | 0.0 |
| High School Diploma | 0 (0.0%) | 0.0 |
| College or Associate's Degree | 0 (0.0%) | 0.0 |
| Bachelor's Degree | 0 (0.0%) | 0.0 |
| Graduate Degree | 0 (0.0%) | 0.0 |
| Total | 0 (0.0%) | 0.0 |
Fertility by Education by Marriage Status in Cressona borough
| Educational Attainment | Married | Unmarried |
| Less than High School | 0 (0.0%) | 0 (0.0%) |
| High School Diploma | 0 (0.0%) | 0 (0.0%) |
| College or Associate's Degree | 0 (0.0%) | 0 (0.0%) |
| Bachelor's Degree | 0 (0.0%) | 0 (0.0%) |
| Graduate Degree | 0 (0.0%) | 0 (0.0%) |
| Total | 0 (0.0%) | 0 (0.0%) |
Employment Characteristics in Cressona borough
Employment by Class of Employer in Cressona borough
Among the 730 employed individuals in Cressona borough, private company employees (581 | 79.6%), not-for-profit organizations (70 | 9.6%), and local government employees (30 | 4.1%) make up the most common classes of employment.
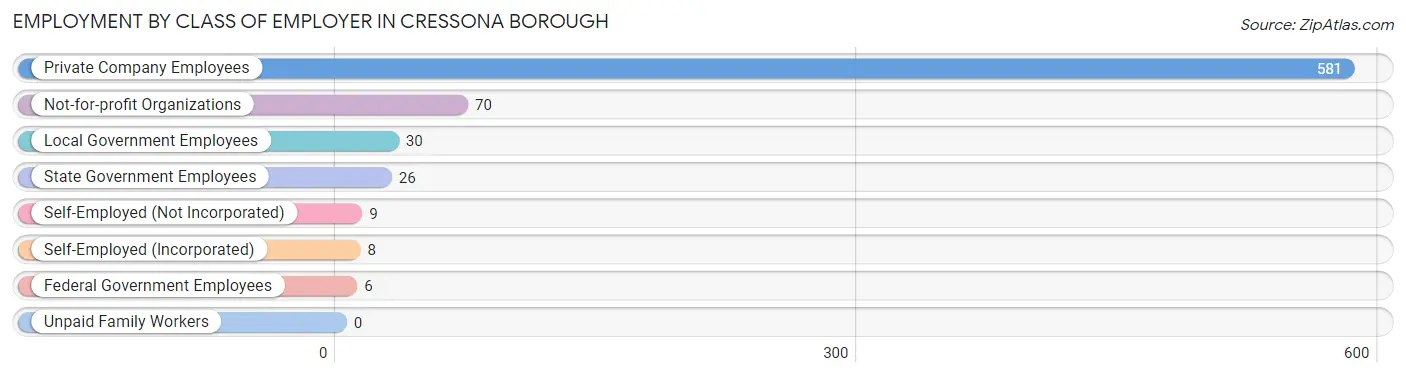
| Employer Class | # Employees | % Employees |
| Private Company Employees | 581 | 79.6% |
| Self-Employed (Incorporated) | 8 | 1.1% |
| Self-Employed (Not Incorporated) | 9 | 1.2% |
| Not-for-profit Organizations | 70 | 9.6% |
| Local Government Employees | 30 | 4.1% |
| State Government Employees | 26 | 3.6% |
| Federal Government Employees | 6 | 0.8% |
| Unpaid Family Workers | 0 | 0.0% |
| Total | 730 | 100.0% |
Employment Status by Age in Cressona borough
According to the labor force statistics for Cressona borough, out of the total population over 16 years of age (1,095), 70.8% or 775 individuals are in the labor force, with 4.6% or 36 of them unemployed. The age group with the highest labor force participation rate is 25 to 29 years, with 100.0% or 79 individuals in the labor force. Within the labor force, the 16 to 19 years age range has the highest percentage of unemployed individuals, with 52.2% or 12 of them being unemployed.
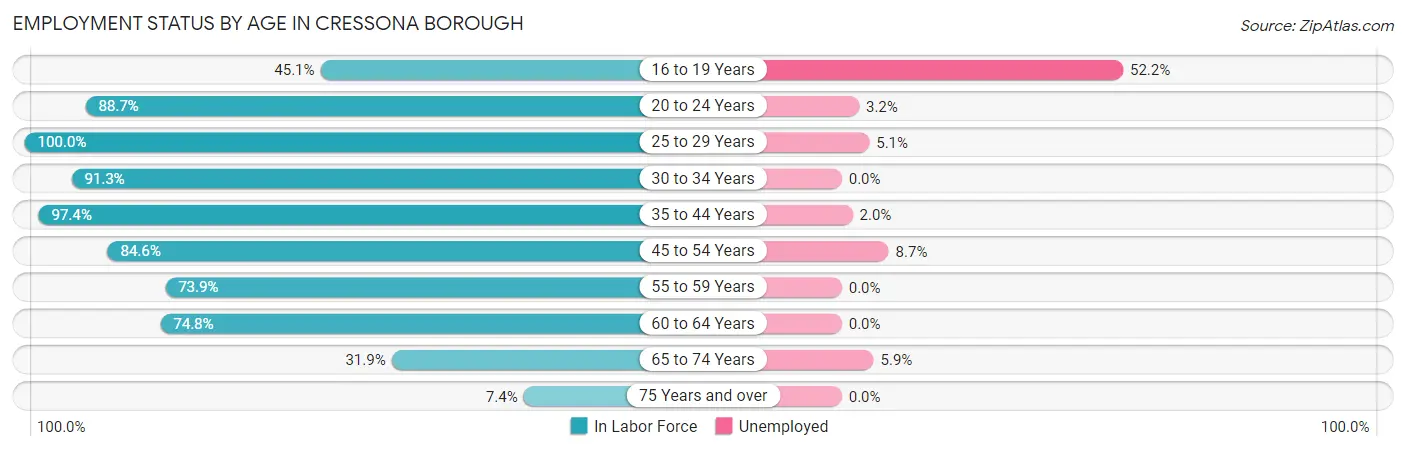
| Age Bracket | In Labor Force | Unemployed |
| 16 to 19 Years | 23 (45.1%) | 12 (52.2%) |
| 20 to 24 Years | 94 (88.7%) | 3 (3.2%) |
| 25 to 29 Years | 79 (100.0%) | 4 (5.1%) |
| 30 to 34 Years | 116 (91.3%) | 0 (0.0%) |
| 35 to 44 Years | 148 (97.4%) | 3 (2.0%) |
| 45 to 54 Years | 126 (84.6%) | 11 (8.7%) |
| 55 to 59 Years | 51 (73.9%) | 0 (0.0%) |
| 60 to 64 Years | 80 (74.8%) | 0 (0.0%) |
| 65 to 74 Years | 51 (31.9%) | 3 (5.9%) |
| 75 Years and over | 7 (7.4%) | 0 (0.0%) |
| Total | 775 (70.8%) | 36 (4.6%) |
Employment Status by Educational Attainment in Cressona borough
According to labor force statistics for Cressona borough, 87.8% of individuals (600) out of the total population between 25 and 64 years of age (683) are in the labor force, with 3.0% or 18 of them being unemployed. The group with the highest labor force participation rate are those with the educational attainment of bachelor's degree or higher, with 95.6% or 129 individuals in the labor force. Within the labor force, individuals with college / associate degree education have the highest percentage of unemployment, with 8.3% or 15 of them being unemployed.
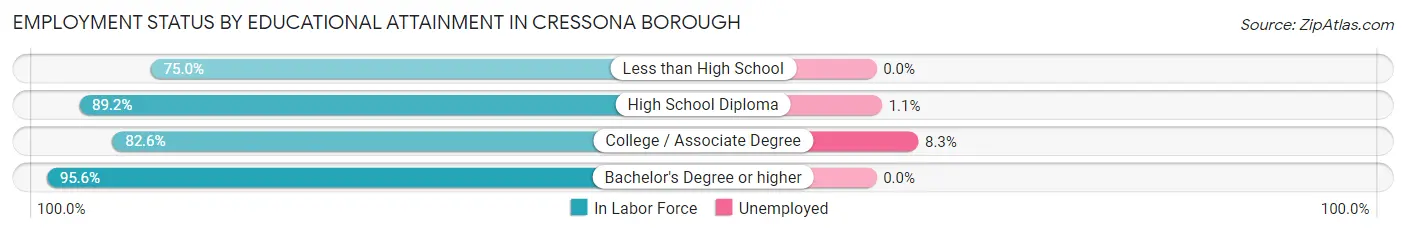
| Educational Attainment | In Labor Force | Unemployed |
| Less than High School | 18 (75.0%) | 0 (0.0%) |
| High School Diploma | 272 (89.2%) | 3 (1.1%) |
| College / Associate Degree | 181 (82.6%) | 18 (8.3%) |
| Bachelor's Degree or higher | 129 (95.6%) | 0 (0.0%) |
| Total | 600 (87.8%) | 20 (3.0%) |
Employment Occupations by Sex in Cressona borough
Management, Business, Science and Arts Occupations
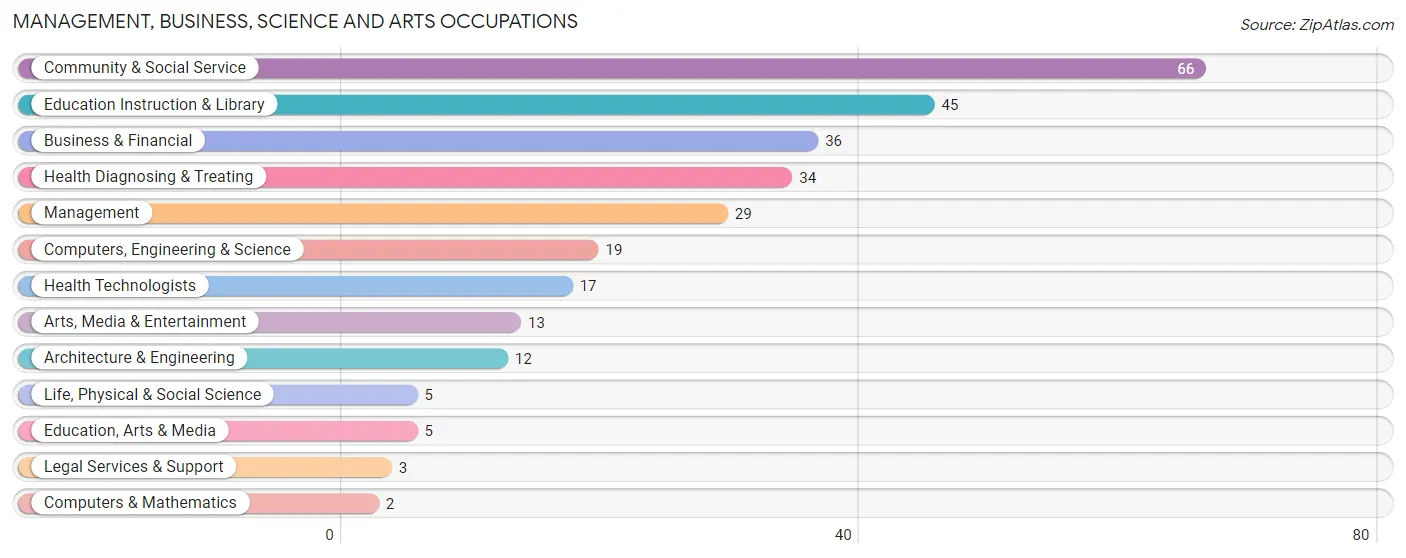
The most common Management, Business, Science and Arts occupations in Cressona borough are Community & Social Service (66 | 8.9%), Education Instruction & Library (45 | 6.1%), Business & Financial (36 | 4.9%), Health Diagnosing & Treating (34 | 4.6%), and Management (29 | 3.9%).
Management, Business, Science and Arts Occupations by Sex
Within the Management, Business, Science and Arts occupations in Cressona borough, the most male-oriented occupations are Computers & Mathematics (100.0%), Architecture & Engineering (100.0%), and Computers, Engineering & Science (73.7%), while the most female-oriented occupations are Life, Physical & Social Science (100.0%), Legal Services & Support (100.0%), and Education Instruction & Library (80.0%).
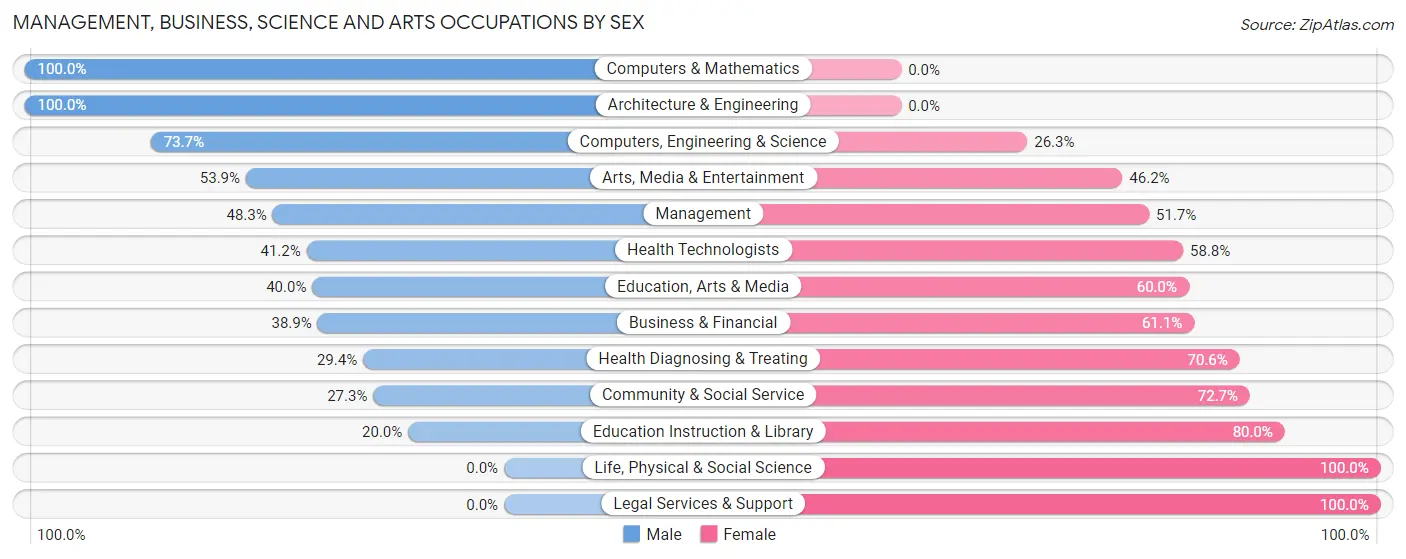
| Occupation | Male | Female |
| Management | 14 (48.3%) | 15 (51.7%) |
| Business & Financial | 14 (38.9%) | 22 (61.1%) |
| Computers, Engineering & Science | 14 (73.7%) | 5 (26.3%) |
| Computers & Mathematics | 2 (100.0%) | 0 (0.0%) |
| Architecture & Engineering | 12 (100.0%) | 0 (0.0%) |
| Life, Physical & Social Science | 0 (0.0%) | 5 (100.0%) |
| Community & Social Service | 18 (27.3%) | 48 (72.7%) |
| Education, Arts & Media | 2 (40.0%) | 3 (60.0%) |
| Legal Services & Support | 0 (0.0%) | 3 (100.0%) |
| Education Instruction & Library | 9 (20.0%) | 36 (80.0%) |
| Arts, Media & Entertainment | 7 (53.8%) | 6 (46.2%) |
| Health Diagnosing & Treating | 10 (29.4%) | 24 (70.6%) |
| Health Technologists | 7 (41.2%) | 10 (58.8%) |
| Total (Category) | 70 (38.0%) | 114 (62.0%) |
| Total (Overall) | 391 (52.9%) | 348 (47.1%) |
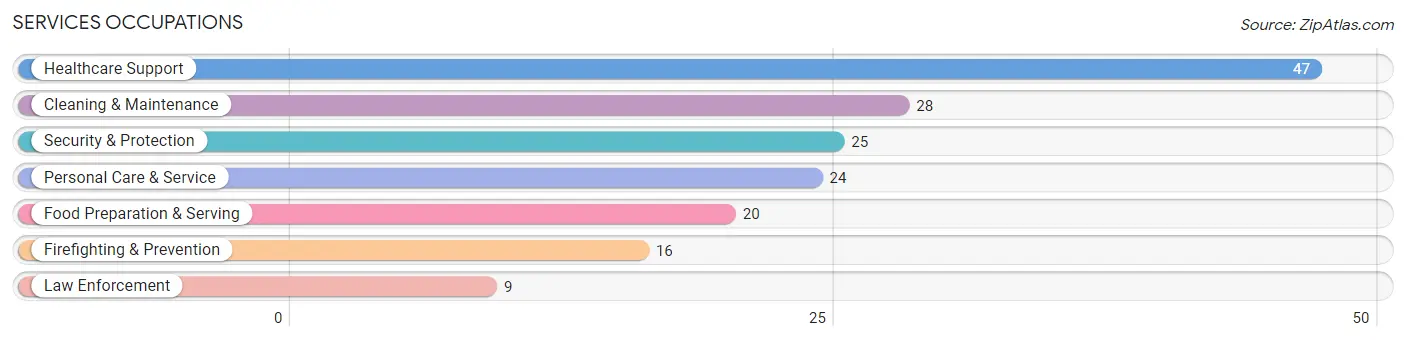
Services Occupations
The most common Services occupations in Cressona borough are Healthcare Support (47 | 6.4%), Cleaning & Maintenance (28 | 3.8%), Security & Protection (25 | 3.4%), Personal Care & Service (24 | 3.3%), and Food Preparation & Serving (20 | 2.7%).
Services Occupations by Sex
Within the Services occupations in Cressona borough, the most male-oriented occupations are Law Enforcement (100.0%), Security & Protection (72.0%), and Cleaning & Maintenance (57.1%), while the most female-oriented occupations are Food Preparation & Serving (100.0%), Personal Care & Service (100.0%), and Healthcare Support (91.5%).
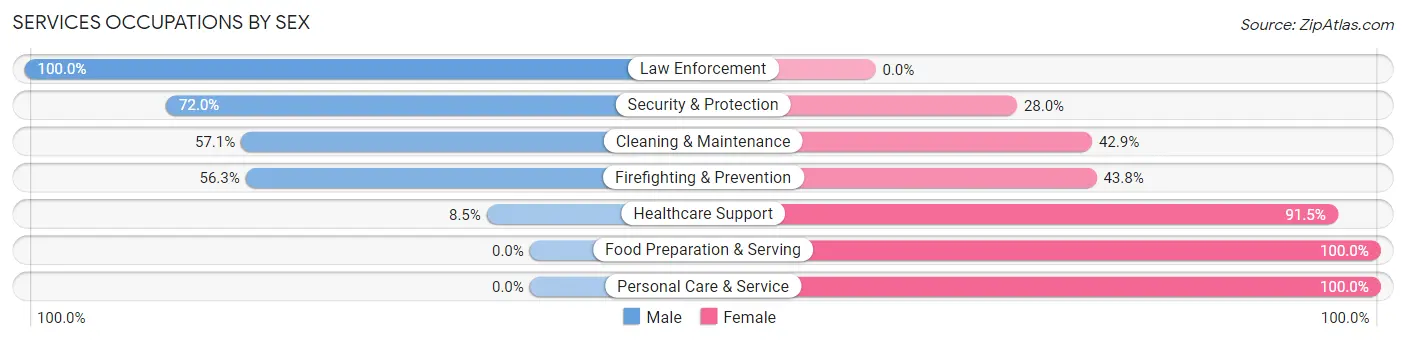
| Occupation | Male | Female |
| Healthcare Support | 4 (8.5%) | 43 (91.5%) |
| Security & Protection | 18 (72.0%) | 7 (28.0%) |
| Firefighting & Prevention | 9 (56.2%) | 7 (43.8%) |
| Law Enforcement | 9 (100.0%) | 0 (0.0%) |
| Food Preparation & Serving | 0 (0.0%) | 20 (100.0%) |
| Cleaning & Maintenance | 16 (57.1%) | 12 (42.9%) |
| Personal Care & Service | 0 (0.0%) | 24 (100.0%) |
| Total (Category) | 38 (26.4%) | 106 (73.6%) |
| Total (Overall) | 391 (52.9%) | 348 (47.1%) |
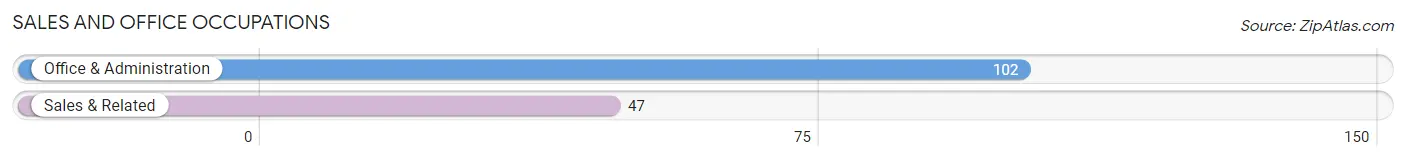
Sales and Office Occupations
The most common Sales and Office occupations in Cressona borough are Office & Administration (102 | 13.8%), and Sales & Related (47 | 6.4%).
Sales and Office Occupations by Sex
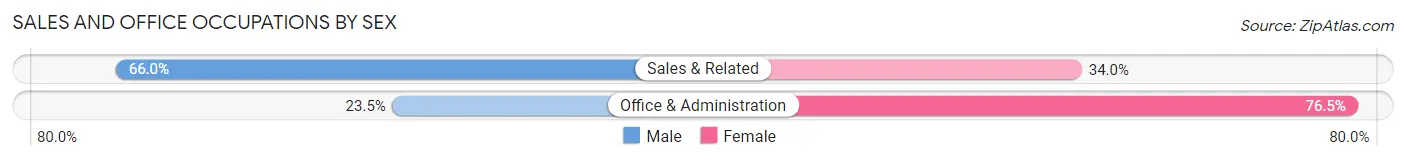
| Occupation | Male | Female |
| Sales & Related | 31 (66.0%) | 16 (34.0%) |
| Office & Administration | 24 (23.5%) | 78 (76.5%) |
| Total (Category) | 55 (36.9%) | 94 (63.1%) |
| Total (Overall) | 391 (52.9%) | 348 (47.1%) |
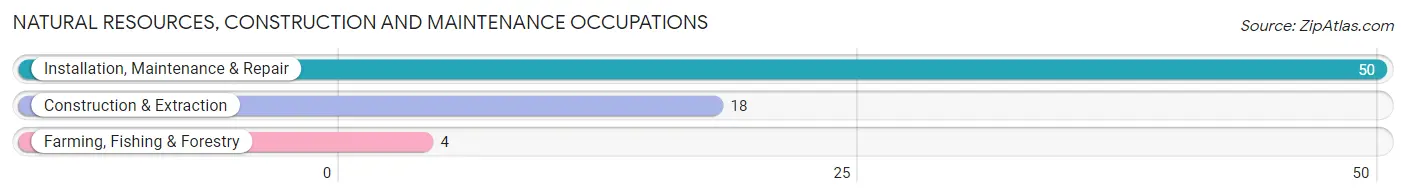
Natural Resources, Construction and Maintenance Occupations
The most common Natural Resources, Construction and Maintenance occupations in Cressona borough are Installation, Maintenance & Repair (50 | 6.8%), Construction & Extraction (18 | 2.4%), and Farming, Fishing & Forestry (4 | 0.5%).
Natural Resources, Construction and Maintenance Occupations by Sex
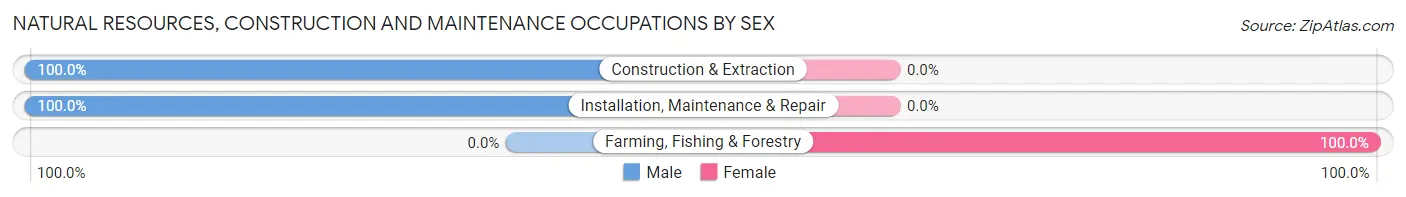
| Occupation | Male | Female |
| Farming, Fishing & Forestry | 0 (0.0%) | 4 (100.0%) |
| Construction & Extraction | 18 (100.0%) | 0 (0.0%) |
| Installation, Maintenance & Repair | 50 (100.0%) | 0 (0.0%) |
| Total (Category) | 68 (94.4%) | 4 (5.6%) |
| Total (Overall) | 391 (52.9%) | 348 (47.1%) |
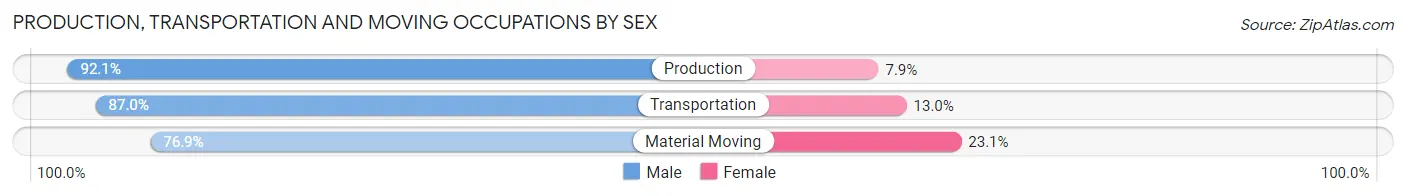
Production, Transportation and Moving Occupations
The most common Production, Transportation and Moving occupations in Cressona borough are Material Moving (91 | 12.3%), Production (76 | 10.3%), and Transportation (23 | 3.1%).
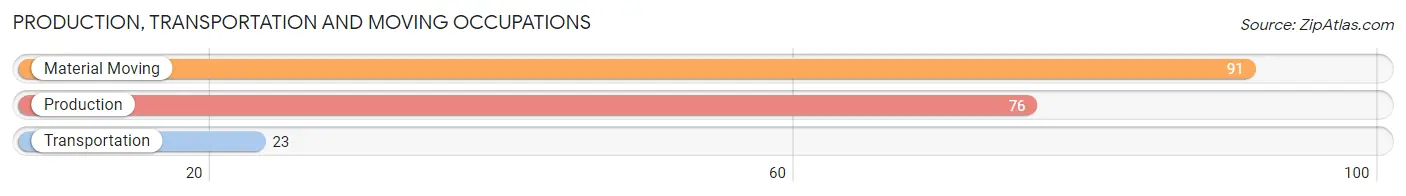
Production, Transportation and Moving Occupations by Sex
| Occupation | Male | Female |
| Production | 70 (92.1%) | 6 (7.9%) |
| Transportation | 20 (87.0%) | 3 (13.0%) |
| Material Moving | 70 (76.9%) | 21 (23.1%) |
| Total (Category) | 160 (84.2%) | 30 (15.8%) |
| Total (Overall) | 391 (52.9%) | 348 (47.1%) |
Employment Industries by Sex in Cressona borough
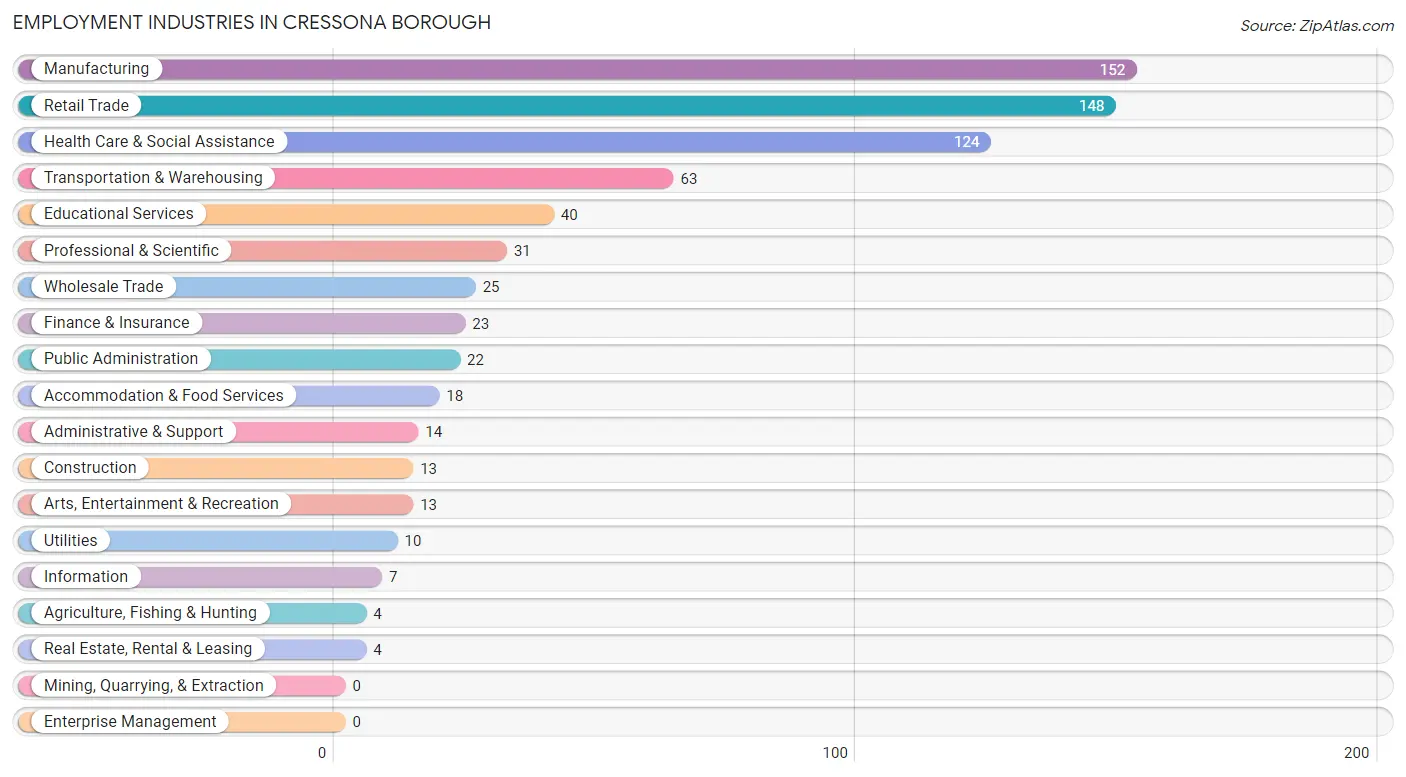
Employment Industries in Cressona borough
The major employment industries in Cressona borough include Manufacturing (152 | 20.6%), Retail Trade (148 | 20.0%), Health Care & Social Assistance (124 | 16.8%), Transportation & Warehousing (63 | 8.5%), and Educational Services (40 | 5.4%).
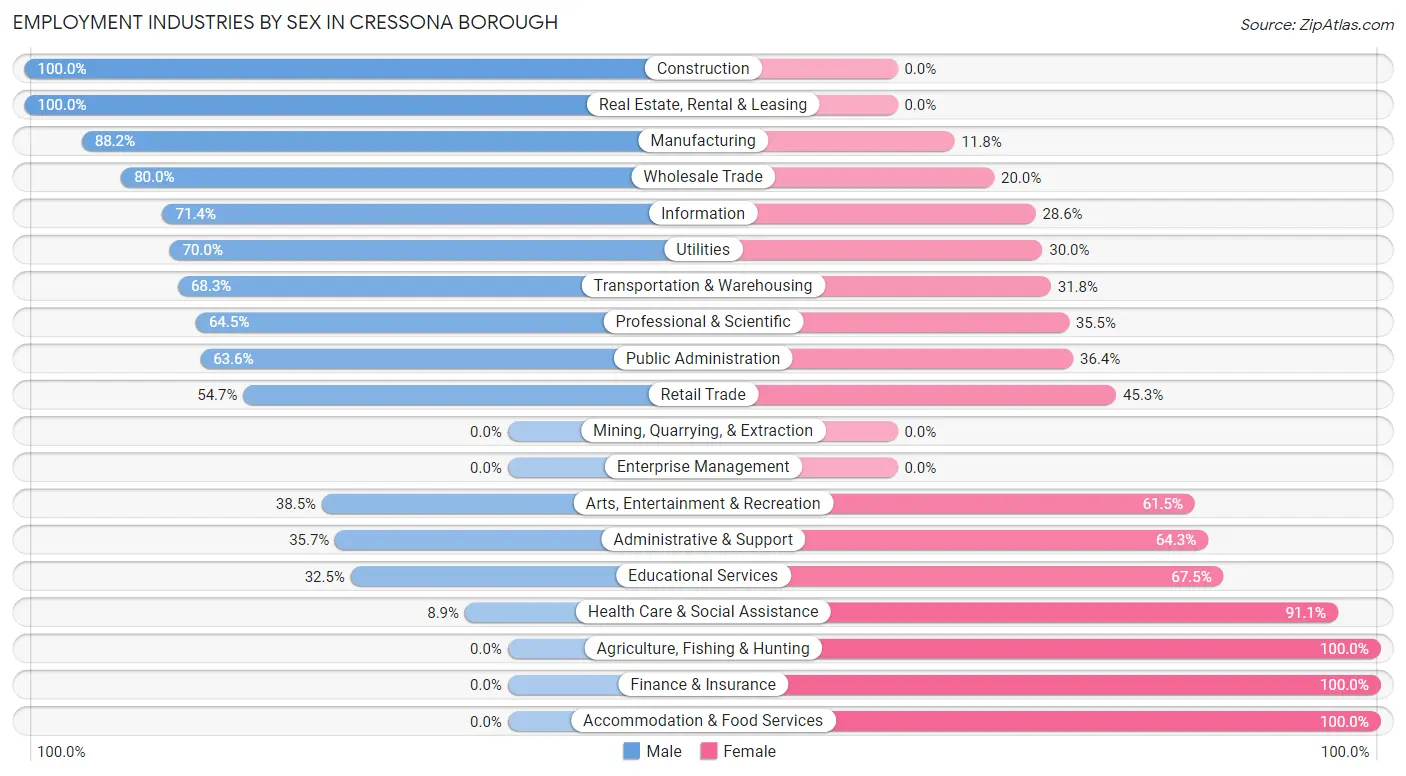
Employment Industries by Sex in Cressona borough
The Cressona borough industries that see more men than women are Construction (100.0%), Real Estate, Rental & Leasing (100.0%), and Manufacturing (88.2%), whereas the industries that tend to have a higher number of women are Agriculture, Fishing & Hunting (100.0%), Finance & Insurance (100.0%), and Accommodation & Food Services (100.0%).
| Industry | Male | Female |
| Agriculture, Fishing & Hunting | 0 (0.0%) | 4 (100.0%) |
| Mining, Quarrying, & Extraction | 0 (0.0%) | 0 (0.0%) |
| Construction | 13 (100.0%) | 0 (0.0%) |
| Manufacturing | 134 (88.2%) | 18 (11.8%) |
| Wholesale Trade | 20 (80.0%) | 5 (20.0%) |
| Retail Trade | 81 (54.7%) | 67 (45.3%) |
| Transportation & Warehousing | 43 (68.2%) | 20 (31.8%) |
| Utilities | 7 (70.0%) | 3 (30.0%) |
| Information | 5 (71.4%) | 2 (28.6%) |
| Finance & Insurance | 0 (0.0%) | 23 (100.0%) |
| Real Estate, Rental & Leasing | 4 (100.0%) | 0 (0.0%) |
| Professional & Scientific | 20 (64.5%) | 11 (35.5%) |
| Enterprise Management | 0 (0.0%) | 0 (0.0%) |
| Administrative & Support | 5 (35.7%) | 9 (64.3%) |
| Educational Services | 13 (32.5%) | 27 (67.5%) |
| Health Care & Social Assistance | 11 (8.9%) | 113 (91.1%) |
| Arts, Entertainment & Recreation | 5 (38.5%) | 8 (61.5%) |
| Accommodation & Food Services | 0 (0.0%) | 18 (100.0%) |
| Public Administration | 14 (63.6%) | 8 (36.4%) |
| Total | 391 (52.9%) | 348 (47.1%) |
Education in Cressona borough
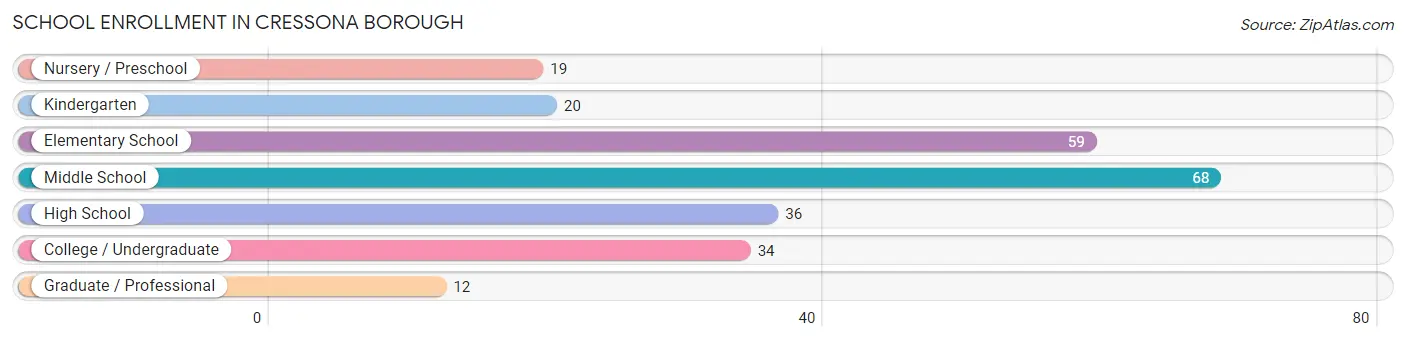
School Enrollment in Cressona borough
The most common levels of schooling among the 248 students in Cressona borough are middle school (68 | 27.4%), elementary school (59 | 23.8%), and high school (36 | 14.5%).
| School Level | # Students | % Students |
| Nursery / Preschool | 19 | 7.7% |
| Kindergarten | 20 | 8.1% |
| Elementary School | 59 | 23.8% |
| Middle School | 68 | 27.4% |
| High School | 36 | 14.5% |
| College / Undergraduate | 34 | 13.7% |
| Graduate / Professional | 12 | 4.8% |
| Total | 248 | 100.0% |
School Enrollment by Age by Funding Source in Cressona borough
Out of a total of 248 students who are enrolled in schools in Cressona borough, 20 (8.1%) attend a private institution, while the remaining 228 (91.9%) are enrolled in public schools. The age group of 35 years and over has the highest likelihood of being enrolled in private schools, with 4 (100.0% in the age bracket) enrolled. Conversely, the age group of 3 to 4 year olds has the lowest likelihood of being enrolled in a private school, with 13 (100.0% in the age bracket) attending a public institution.
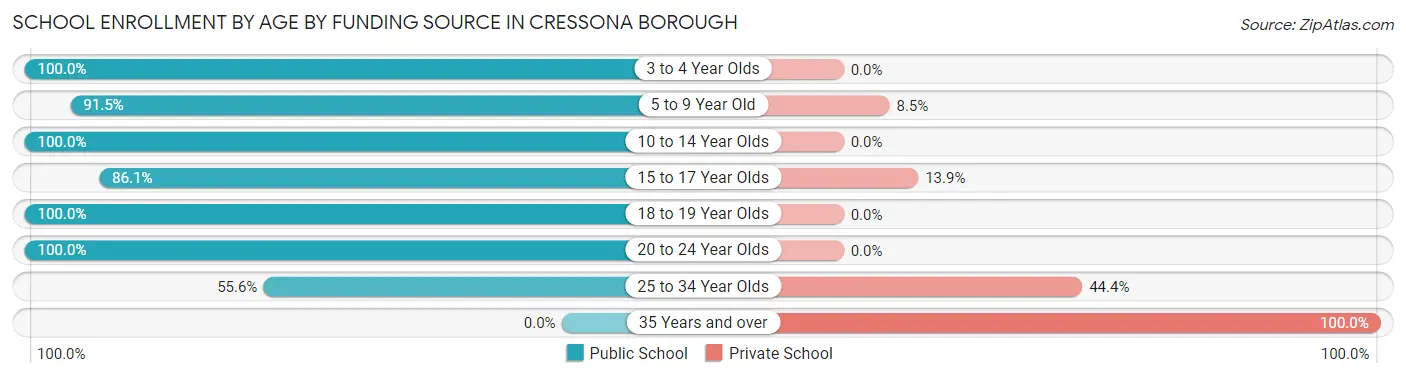
| Age Bracket | Public School | Private School |
| 3 to 4 Year Olds | 13 (100.0%) | 0 (0.0%) |
| 5 to 9 Year Old | 75 (91.5%) | 7 (8.5%) |
| 10 to 14 Year Olds | 64 (100.0%) | 0 (0.0%) |
| 15 to 17 Year Olds | 31 (86.1%) | 5 (13.9%) |
| 18 to 19 Year Olds | 21 (100.0%) | 0 (0.0%) |
| 20 to 24 Year Olds | 19 (100.0%) | 0 (0.0%) |
| 25 to 34 Year Olds | 5 (55.6%) | 4 (44.4%) |
| 35 Years and over | 0 (0.0%) | 4 (100.0%) |
| Total | 228 (91.9%) | 20 (8.1%) |
Educational Attainment by Field of Study in Cressona borough
Arts & humanities (35 | 17.8%), business (28 | 14.2%), visual & performing arts (22 | 11.2%), psychology (21 | 10.7%), and education (21 | 10.7%) are the most common fields of study among 197 individuals in Cressona borough who have obtained a bachelor's degree or higher.
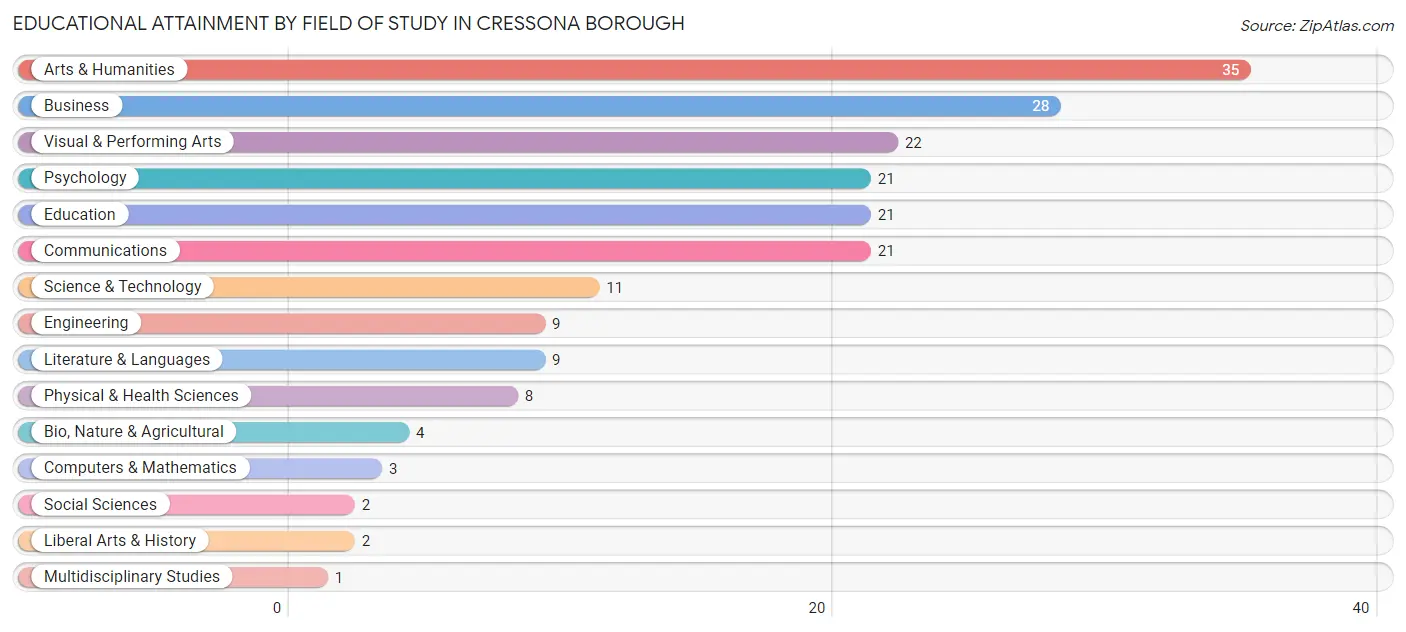
| Field of Study | # Graduates | % Graduates |
| Computers & Mathematics | 3 | 1.5% |
| Bio, Nature & Agricultural | 4 | 2.0% |
| Physical & Health Sciences | 8 | 4.1% |
| Psychology | 21 | 10.7% |
| Social Sciences | 2 | 1.0% |
| Engineering | 9 | 4.6% |
| Multidisciplinary Studies | 1 | 0.5% |
| Science & Technology | 11 | 5.6% |
| Business | 28 | 14.2% |
| Education | 21 | 10.7% |
| Literature & Languages | 9 | 4.6% |
| Liberal Arts & History | 2 | 1.0% |
| Visual & Performing Arts | 22 | 11.2% |
| Communications | 21 | 10.7% |
| Arts & Humanities | 35 | 17.8% |
| Total | 197 | 100.0% |
Transportation & Commute in Cressona borough
Vehicle Availability by Sex in Cressona borough
The most prevalent vehicle ownership categories in Cressona borough are males with 2 vehicles (216, accounting for 56.1%) and females with 2 vehicles (155, making up 62.6%).
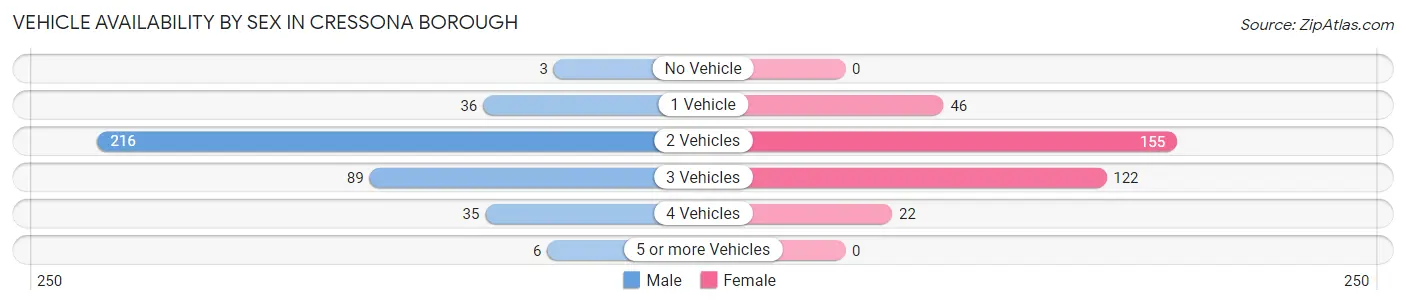
| Vehicles Available | Male | Female |
| No Vehicle | 3 (0.8%) | 0 (0.0%) |
| 1 Vehicle | 36 (9.3%) | 46 (13.3%) |
| 2 Vehicles | 216 (56.1%) | 155 (44.9%) |
| 3 Vehicles | 89 (23.1%) | 122 (35.4%) |
| 4 Vehicles | 35 (9.1%) | 22 (6.4%) |
| 5 or more Vehicles | 6 (1.6%) | 0 (0.0%) |
| Total | 385 (100.0%) | 345 (100.0%) |
Commute Time in Cressona borough
The most frequently occuring commute durations in Cressona borough are 15 to 19 minutes (159 commuters, 22.2%), 5 to 9 minutes (120 commuters, 16.7%), and 10 to 14 minutes (118 commuters, 16.5%).
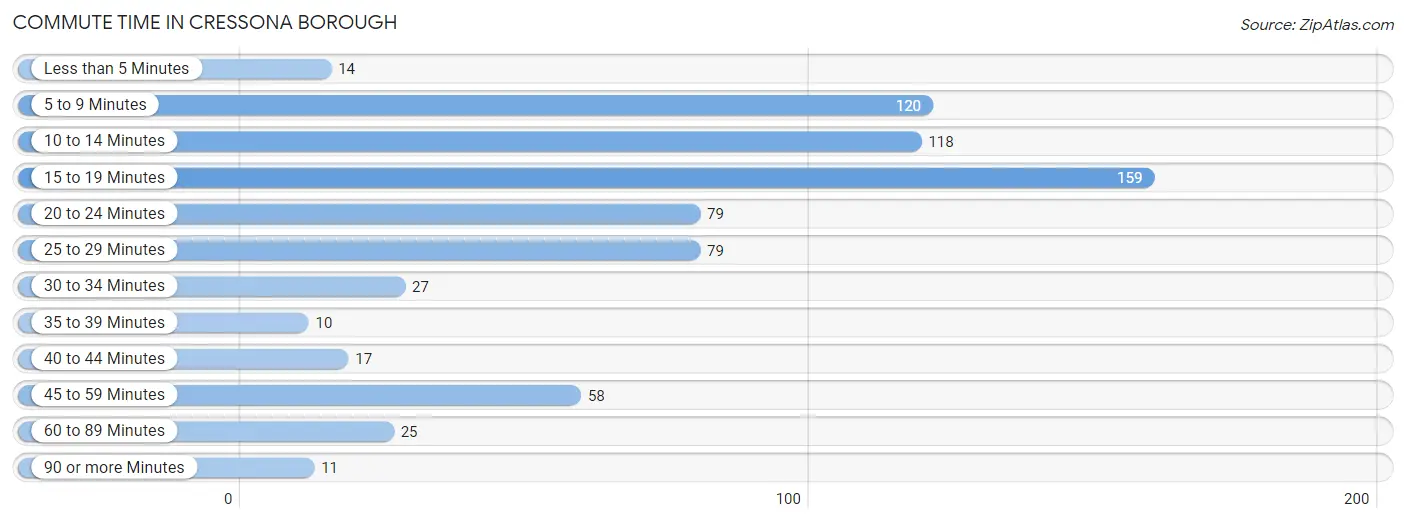
| Commute Time | # Commuters | % Commuters |
| Less than 5 Minutes | 14 | 1.9% |
| 5 to 9 Minutes | 120 | 16.7% |
| 10 to 14 Minutes | 118 | 16.5% |
| 15 to 19 Minutes | 159 | 22.2% |
| 20 to 24 Minutes | 79 | 11.0% |
| 25 to 29 Minutes | 79 | 11.0% |
| 30 to 34 Minutes | 27 | 3.8% |
| 35 to 39 Minutes | 10 | 1.4% |
| 40 to 44 Minutes | 17 | 2.4% |
| 45 to 59 Minutes | 58 | 8.1% |
| 60 to 89 Minutes | 25 | 3.5% |
| 90 or more Minutes | 11 | 1.5% |
Commute Time by Sex in Cressona borough
The most common commute times in Cressona borough are 5 to 9 minutes (68 commuters, 18.1%) for males and 15 to 19 minutes (96 commuters, 28.1%) for females.
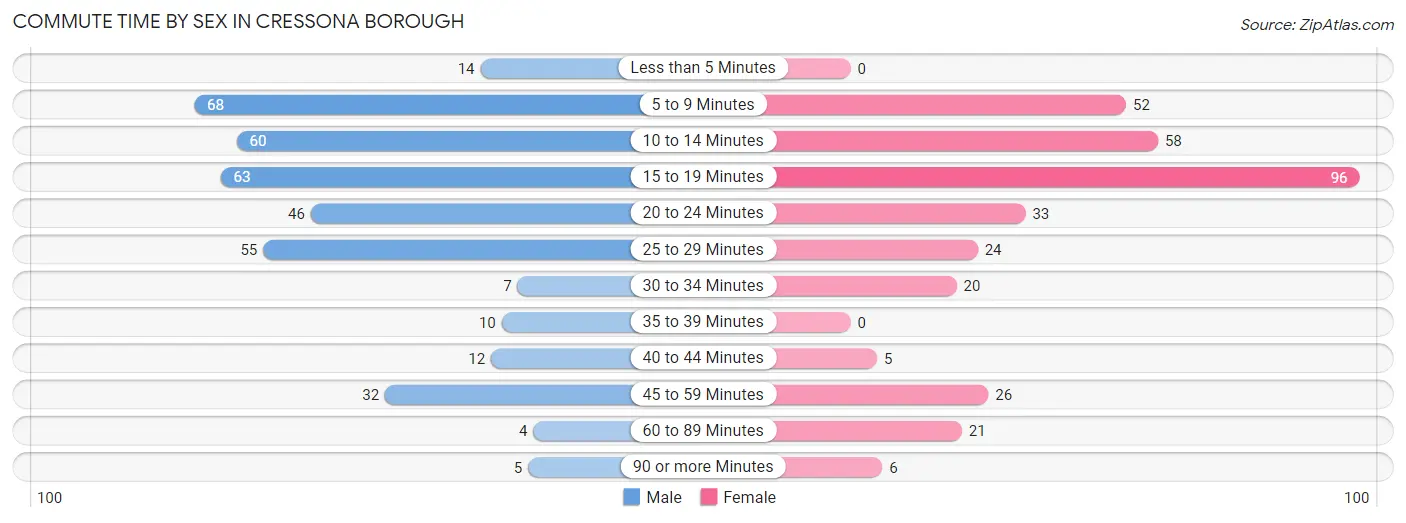
| Commute Time | Male | Female |
| Less than 5 Minutes | 14 (3.7%) | 0 (0.0%) |
| 5 to 9 Minutes | 68 (18.1%) | 52 (15.2%) |
| 10 to 14 Minutes | 60 (16.0%) | 58 (17.0%) |
| 15 to 19 Minutes | 63 (16.8%) | 96 (28.1%) |
| 20 to 24 Minutes | 46 (12.2%) | 33 (9.7%) |
| 25 to 29 Minutes | 55 (14.6%) | 24 (7.0%) |
| 30 to 34 Minutes | 7 (1.9%) | 20 (5.9%) |
| 35 to 39 Minutes | 10 (2.7%) | 0 (0.0%) |
| 40 to 44 Minutes | 12 (3.2%) | 5 (1.5%) |
| 45 to 59 Minutes | 32 (8.5%) | 26 (7.6%) |
| 60 to 89 Minutes | 4 (1.1%) | 21 (6.2%) |
| 90 or more Minutes | 5 (1.3%) | 6 (1.8%) |
Time of Departure to Work by Sex in Cressona borough
The most frequent times of departure to work in Cressona borough are 4:00 PM to 11:59 PM (60, 16.0%) for males and 12:00 PM to 3:59 PM (70, 20.5%) for females.
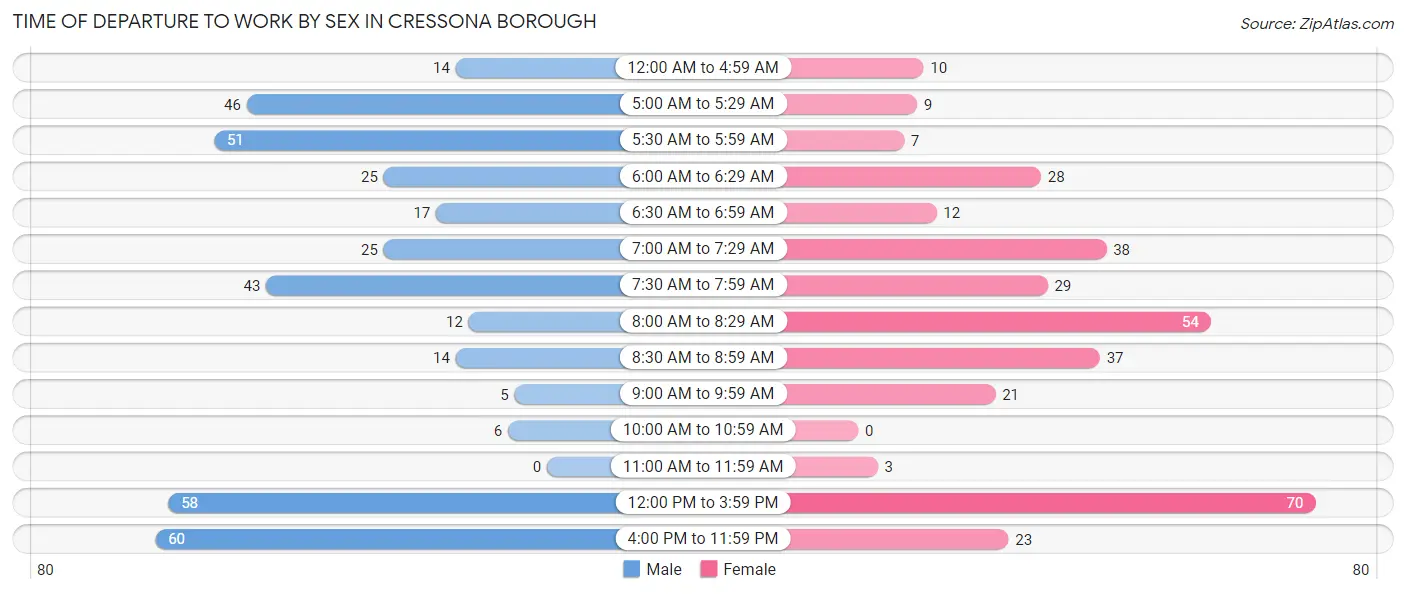
| Time of Departure | Male | Female |
| 12:00 AM to 4:59 AM | 14 (3.7%) | 10 (2.9%) |
| 5:00 AM to 5:29 AM | 46 (12.2%) | 9 (2.6%) |
| 5:30 AM to 5:59 AM | 51 (13.6%) | 7 (2.1%) |
| 6:00 AM to 6:29 AM | 25 (6.7%) | 28 (8.2%) |
| 6:30 AM to 6:59 AM | 17 (4.5%) | 12 (3.5%) |
| 7:00 AM to 7:29 AM | 25 (6.7%) | 38 (11.1%) |
| 7:30 AM to 7:59 AM | 43 (11.4%) | 29 (8.5%) |
| 8:00 AM to 8:29 AM | 12 (3.2%) | 54 (15.8%) |
| 8:30 AM to 8:59 AM | 14 (3.7%) | 37 (10.8%) |
| 9:00 AM to 9:59 AM | 5 (1.3%) | 21 (6.2%) |
| 10:00 AM to 10:59 AM | 6 (1.6%) | 0 (0.0%) |
| 11:00 AM to 11:59 AM | 0 (0.0%) | 3 (0.9%) |
| 12:00 PM to 3:59 PM | 58 (15.4%) | 70 (20.5%) |
| 4:00 PM to 11:59 PM | 60 (16.0%) | 23 (6.7%) |
| Total | 376 (100.0%) | 341 (100.0%) |
Housing Occupancy in Cressona borough
Occupancy by Ownership in Cressona borough
Of the total 538 dwellings in Cressona borough, owner-occupied units account for 382 (71.0%), while renter-occupied units make up 156 (29.0%).
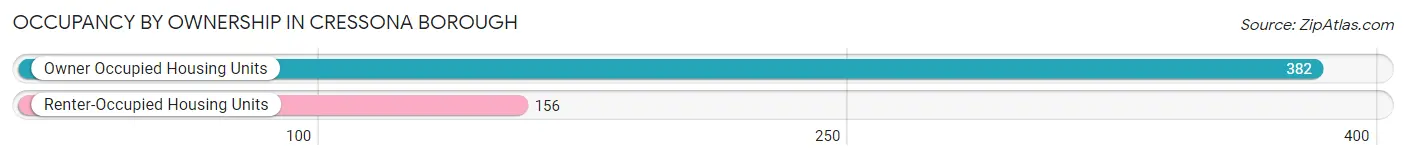
| Occupancy | # Housing Units | % Housing Units |
| Owner Occupied Housing Units | 382 | 71.0% |
| Renter-Occupied Housing Units | 156 | 29.0% |
| Total Occupied Housing Units | 538 | 100.0% |
Occupancy by Household Size in Cressona borough
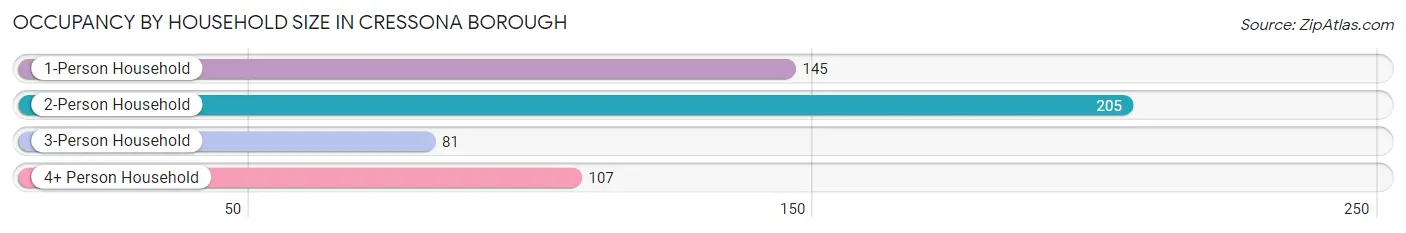
| Household Size | # Housing Units | % Housing Units |
| 1-Person Household | 145 | 27.0% |
| 2-Person Household | 205 | 38.1% |
| 3-Person Household | 81 | 15.1% |
| 4+ Person Household | 107 | 19.9% |
| Total Housing Units | 538 | 100.0% |
Occupancy by Ownership by Household Size in Cressona borough
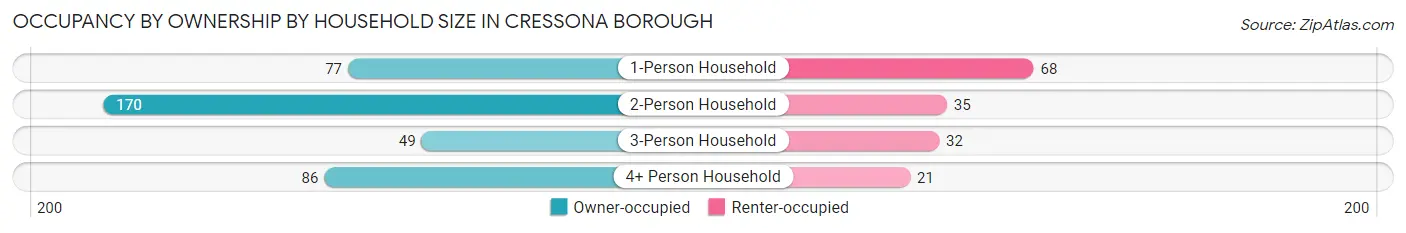
| Household Size | Owner-occupied | Renter-occupied |
| 1-Person Household | 77 (53.1%) | 68 (46.9%) |
| 2-Person Household | 170 (82.9%) | 35 (17.1%) |
| 3-Person Household | 49 (60.5%) | 32 (39.5%) |
| 4+ Person Household | 86 (80.4%) | 21 (19.6%) |
| Total Housing Units | 382 (71.0%) | 156 (29.0%) |
Occupancy by Educational Attainment in Cressona borough
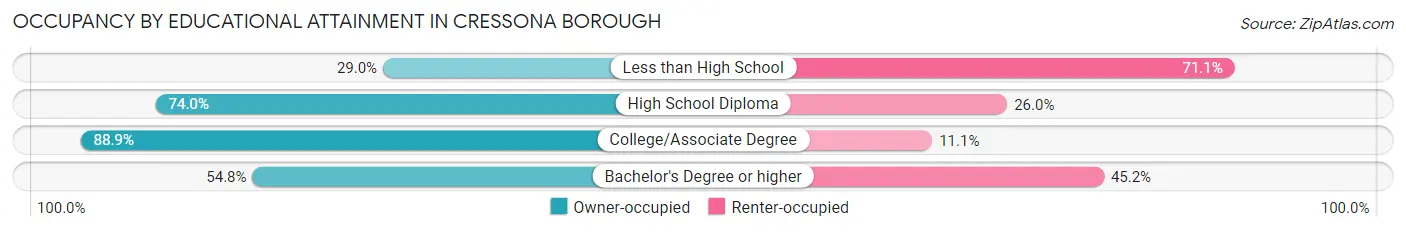
| Household Size | Owner-occupied | Renter-occupied |
| Less than High School | 11 (28.9%) | 27 (71.1%) |
| High School Diploma | 208 (74.0%) | 73 (26.0%) |
| College/Associate Degree | 112 (88.9%) | 14 (11.1%) |
| Bachelor's Degree or higher | 51 (54.8%) | 42 (45.2%) |
Occupancy by Age of Householder in Cressona borough
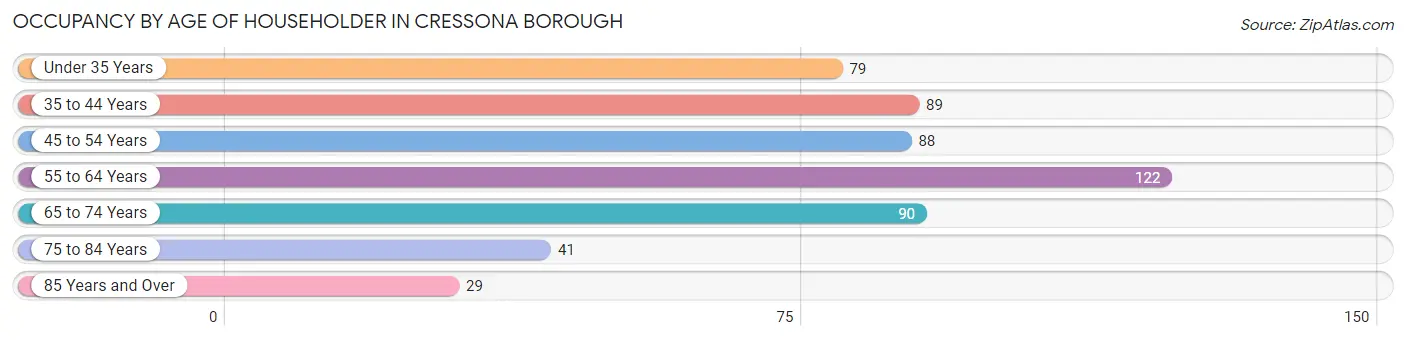
| Age Bracket | # Households | % Households |
| Under 35 Years | 79 | 14.7% |
| 35 to 44 Years | 89 | 16.5% |
| 45 to 54 Years | 88 | 16.4% |
| 55 to 64 Years | 122 | 22.7% |
| 65 to 74 Years | 90 | 16.7% |
| 75 to 84 Years | 41 | 7.6% |
| 85 Years and Over | 29 | 5.4% |
| Total | 538 | 100.0% |
Housing Finances in Cressona borough
Median Income by Occupancy in Cressona borough
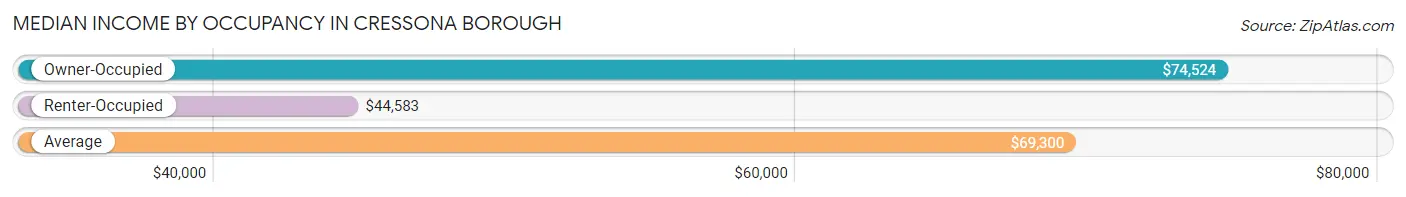
| Occupancy Type | # Households | Median Income |
| Owner-Occupied | 382 (71.0%) | $74,524 |
| Renter-Occupied | 156 (29.0%) | $44,583 |
| Average | 538 (100.0%) | $69,300 |
Occupancy by Householder Income Bracket in Cressona borough
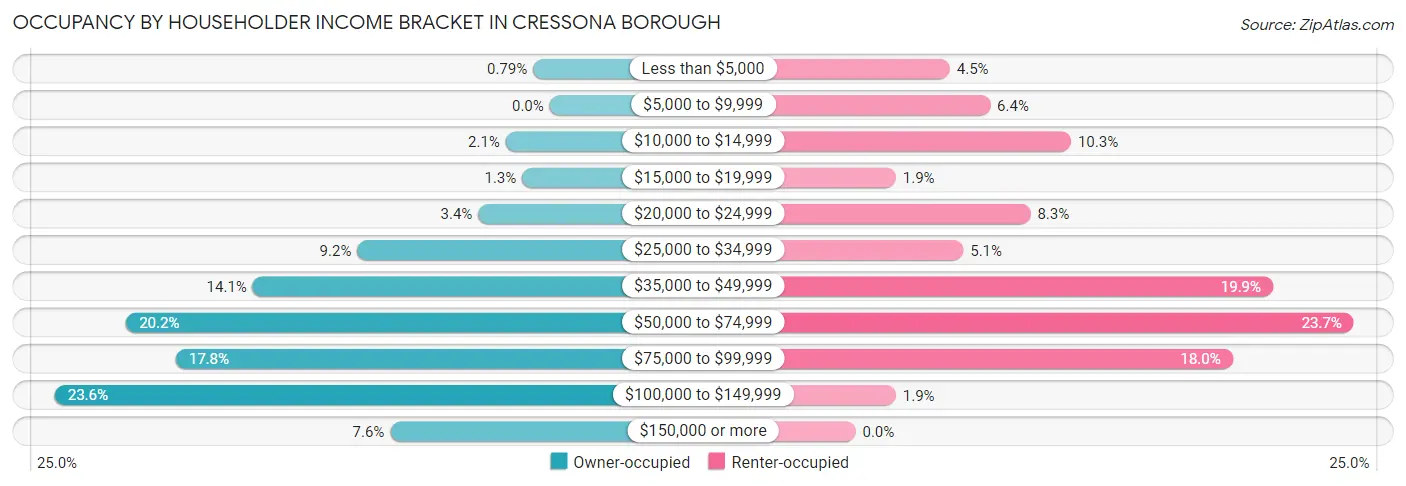
| Income Bracket | Owner-occupied | Renter-occupied |
| Less than $5,000 | 3 (0.8%) | 7 (4.5%) |
| $5,000 to $9,999 | 0 (0.0%) | 10 (6.4%) |
| $10,000 to $14,999 | 8 (2.1%) | 16 (10.3%) |
| $15,000 to $19,999 | 5 (1.3%) | 3 (1.9%) |
| $20,000 to $24,999 | 13 (3.4%) | 13 (8.3%) |
| $25,000 to $34,999 | 35 (9.2%) | 8 (5.1%) |
| $35,000 to $49,999 | 54 (14.1%) | 31 (19.9%) |
| $50,000 to $74,999 | 77 (20.2%) | 37 (23.7%) |
| $75,000 to $99,999 | 68 (17.8%) | 28 (17.9%) |
| $100,000 to $149,999 | 90 (23.6%) | 3 (1.9%) |
| $150,000 or more | 29 (7.6%) | 0 (0.0%) |
| Total | 382 (100.0%) | 156 (100.0%) |
Monthly Housing Cost Tiers in Cressona borough
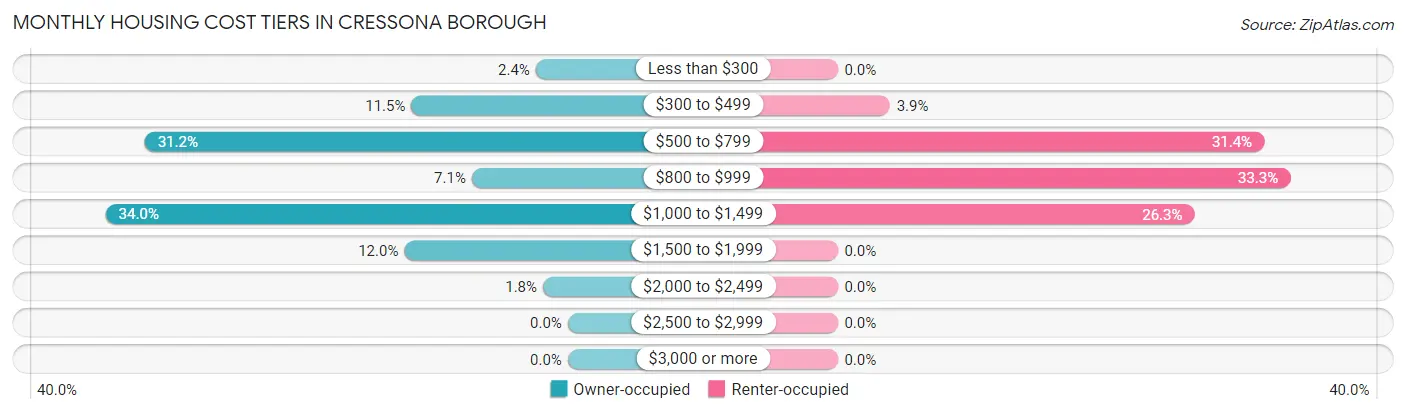
| Monthly Cost | Owner-occupied | Renter-occupied |
| Less than $300 | 9 (2.4%) | 0 (0.0%) |
| $300 to $499 | 44 (11.5%) | 6 (3.8%) |
| $500 to $799 | 119 (31.1%) | 49 (31.4%) |
| $800 to $999 | 27 (7.1%) | 52 (33.3%) |
| $1,000 to $1,499 | 130 (34.0%) | 41 (26.3%) |
| $1,500 to $1,999 | 46 (12.0%) | 0 (0.0%) |
| $2,000 to $2,499 | 7 (1.8%) | 0 (0.0%) |
| $2,500 to $2,999 | 0 (0.0%) | 0 (0.0%) |
| $3,000 or more | 0 (0.0%) | 0 (0.0%) |
| Total | 382 (100.0%) | 156 (100.0%) |
Physical Housing Characteristics in Cressona borough
Housing Structures in Cressona borough
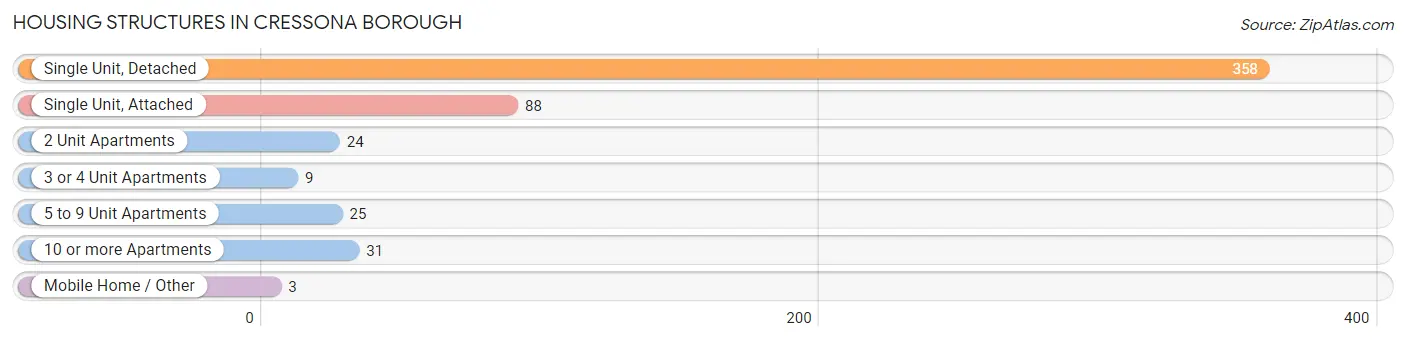
| Structure Type | # Housing Units | % Housing Units |
| Single Unit, Detached | 358 | 66.5% |
| Single Unit, Attached | 88 | 16.4% |
| 2 Unit Apartments | 24 | 4.5% |
| 3 or 4 Unit Apartments | 9 | 1.7% |
| 5 to 9 Unit Apartments | 25 | 4.6% |
| 10 or more Apartments | 31 | 5.8% |
| Mobile Home / Other | 3 | 0.6% |
| Total | 538 | 100.0% |
Housing Structures by Occupancy in Cressona borough
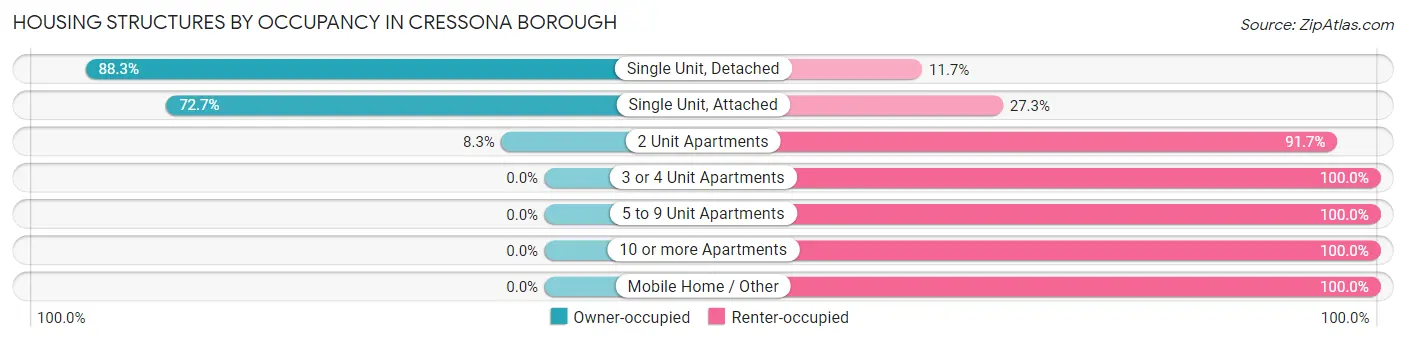
| Structure Type | Owner-occupied | Renter-occupied |
| Single Unit, Detached | 316 (88.3%) | 42 (11.7%) |
| Single Unit, Attached | 64 (72.7%) | 24 (27.3%) |
| 2 Unit Apartments | 2 (8.3%) | 22 (91.7%) |
| 3 or 4 Unit Apartments | 0 (0.0%) | 9 (100.0%) |
| 5 to 9 Unit Apartments | 0 (0.0%) | 25 (100.0%) |
| 10 or more Apartments | 0 (0.0%) | 31 (100.0%) |
| Mobile Home / Other | 0 (0.0%) | 3 (100.0%) |
| Total | 382 (71.0%) | 156 (29.0%) |
Housing Structures by Number of Rooms in Cressona borough
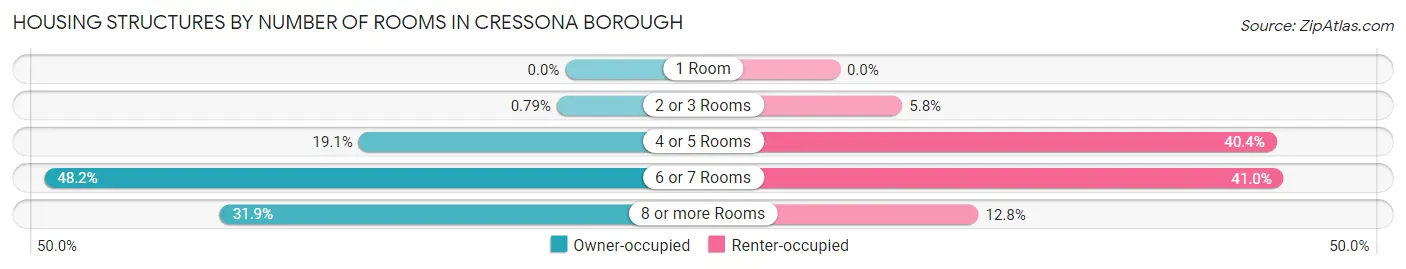
| Number of Rooms | Owner-occupied | Renter-occupied |
| 1 Room | 0 (0.0%) | 0 (0.0%) |
| 2 or 3 Rooms | 3 (0.8%) | 9 (5.8%) |
| 4 or 5 Rooms | 73 (19.1%) | 63 (40.4%) |
| 6 or 7 Rooms | 184 (48.2%) | 64 (41.0%) |
| 8 or more Rooms | 122 (31.9%) | 20 (12.8%) |
| Total | 382 (100.0%) | 156 (100.0%) |
Housing Structure by Heating Type in Cressona borough
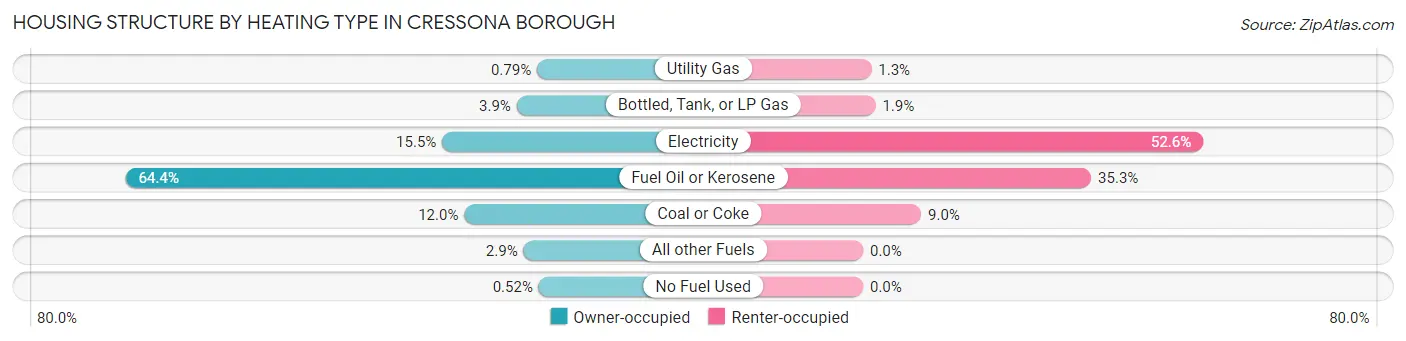
| Heating Type | Owner-occupied | Renter-occupied |
| Utility Gas | 3 (0.8%) | 2 (1.3%) |
| Bottled, Tank, or LP Gas | 15 (3.9%) | 3 (1.9%) |
| Electricity | 59 (15.4%) | 82 (52.6%) |
| Fuel Oil or Kerosene | 246 (64.4%) | 55 (35.3%) |
| Coal or Coke | 46 (12.0%) | 14 (9.0%) |
| All other Fuels | 11 (2.9%) | 0 (0.0%) |
| No Fuel Used | 2 (0.5%) | 0 (0.0%) |
| Total | 382 (100.0%) | 156 (100.0%) |
Household Vehicle Usage in Cressona borough
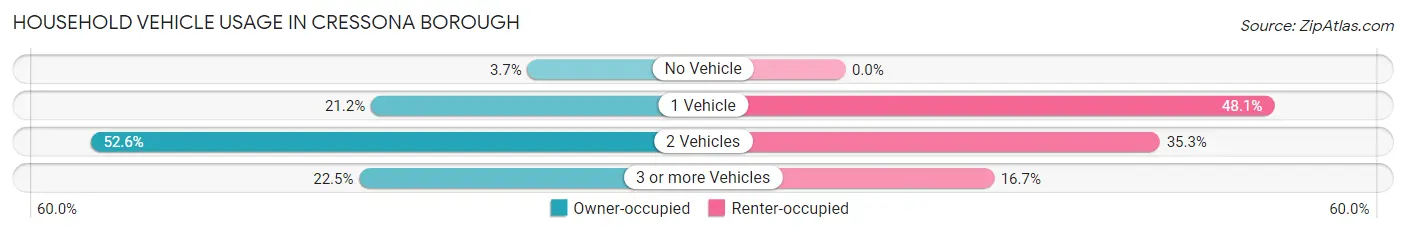
| Vehicles per Household | Owner-occupied | Renter-occupied |
| No Vehicle | 14 (3.7%) | 0 (0.0%) |
| 1 Vehicle | 81 (21.2%) | 75 (48.1%) |
| 2 Vehicles | 201 (52.6%) | 55 (35.3%) |
| 3 or more Vehicles | 86 (22.5%) | 26 (16.7%) |
| Total | 382 (100.0%) | 156 (100.0%) |
Real Estate & Mortgages in Cressona borough
Real Estate and Mortgage Overview in Cressona borough
| Characteristic | Without Mortgage | With Mortgage |
| Housing Units | 147 | 235 |
| Median Property Value | $153,300 | $132,500 |
| Median Household Income | $58,125 | $26 |
| Monthly Housing Costs | $555 | $0 |
| Real Estate Taxes | $2,267 | $0 |
Property Value by Mortgage Status in Cressona borough
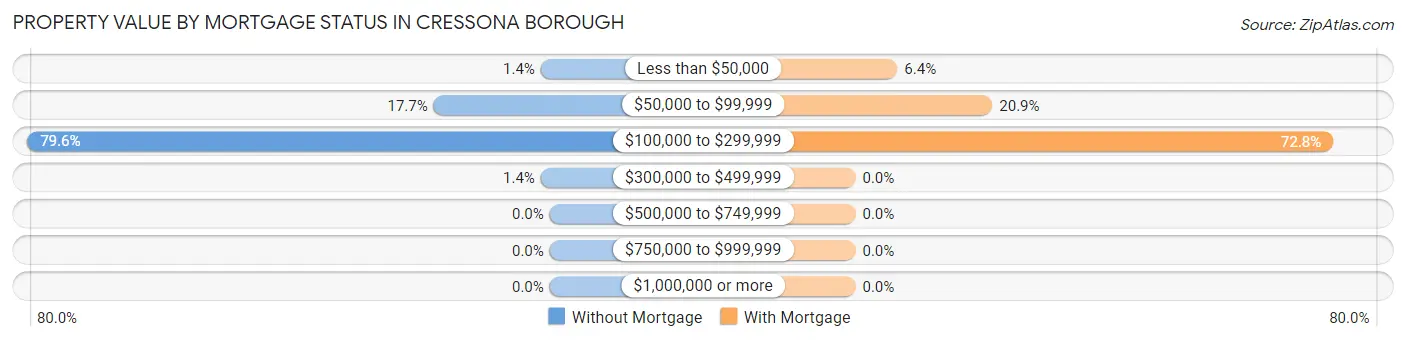
| Property Value | Without Mortgage | With Mortgage |
| Less than $50,000 | 2 (1.4%) | 15 (6.4%) |
| $50,000 to $99,999 | 26 (17.7%) | 49 (20.8%) |
| $100,000 to $299,999 | 117 (79.6%) | 171 (72.8%) |
| $300,000 to $499,999 | 2 (1.4%) | 0 (0.0%) |
| $500,000 to $749,999 | 0 (0.0%) | 0 (0.0%) |
| $750,000 to $999,999 | 0 (0.0%) | 0 (0.0%) |
| $1,000,000 or more | 0 (0.0%) | 0 (0.0%) |
| Total | 147 (100.0%) | 235 (100.0%) |
Household Income by Mortgage Status in Cressona borough
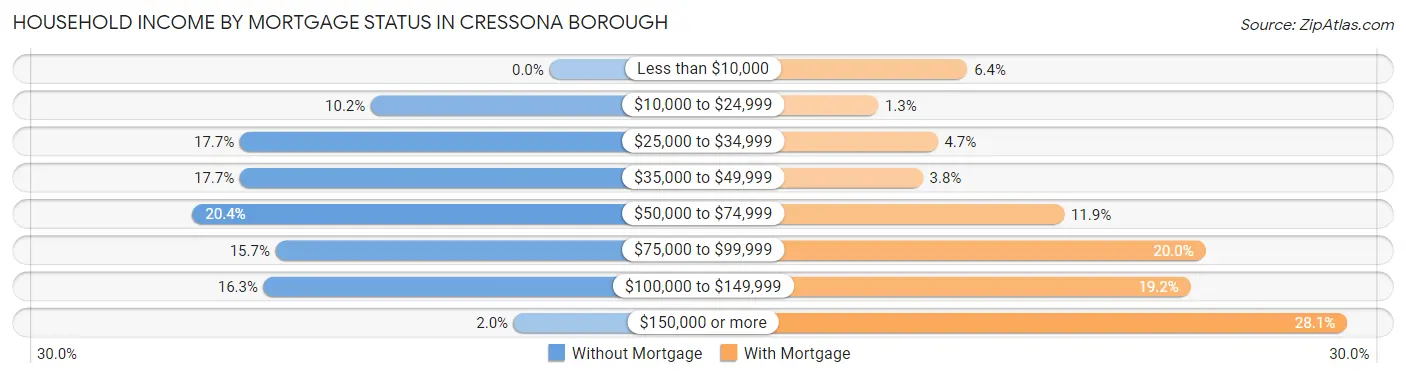
| Household Income | Without Mortgage | With Mortgage |
| Less than $10,000 | 0 (0.0%) | 15 (6.4%) |
| $10,000 to $24,999 | 15 (10.2%) | 3 (1.3%) |
| $25,000 to $34,999 | 26 (17.7%) | 11 (4.7%) |
| $35,000 to $49,999 | 26 (17.7%) | 9 (3.8%) |
| $50,000 to $74,999 | 30 (20.4%) | 28 (11.9%) |
| $75,000 to $99,999 | 23 (15.7%) | 47 (20.0%) |
| $100,000 to $149,999 | 24 (16.3%) | 45 (19.2%) |
| $150,000 or more | 3 (2.0%) | 66 (28.1%) |
| Total | 147 (100.0%) | 235 (100.0%) |
Property Value to Household Income Ratio in Cressona borough
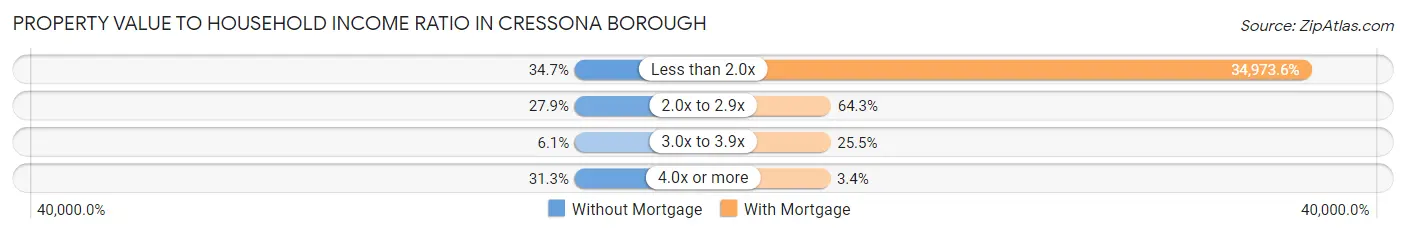
| Value-to-Income Ratio | Without Mortgage | With Mortgage |
| Less than 2.0x | 51 (34.7%) | 82,188 (34,973.6%) |
| 2.0x to 2.9x | 41 (27.9%) | 151 (64.3%) |
| 3.0x to 3.9x | 9 (6.1%) | 60 (25.5%) |
| 4.0x or more | 46 (31.3%) | 8 (3.4%) |
| Total | 147 (100.0%) | 235 (100.0%) |
Real Estate Taxes by Mortgage Status in Cressona borough
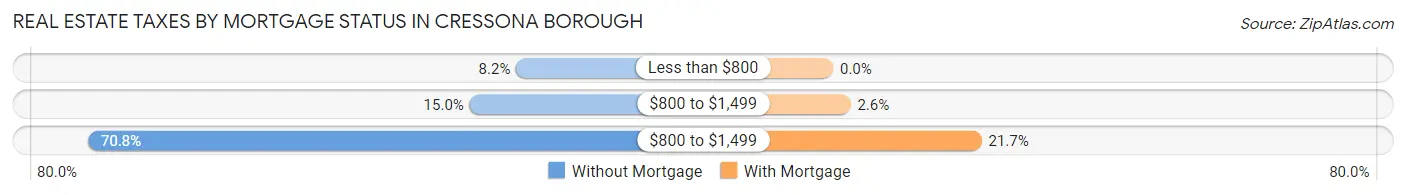
| Property Taxes | Without Mortgage | With Mortgage |
| Less than $800 | 12 (8.2%) | 0 (0.0%) |
| $800 to $1,499 | 22 (15.0%) | 6 (2.5%) |
| $800 to $1,499 | 104 (70.8%) | 51 (21.7%) |
| Total | 147 (100.0%) | 235 (100.0%) |
Health & Disability in Cressona borough
Health Insurance Coverage by Age in Cressona borough
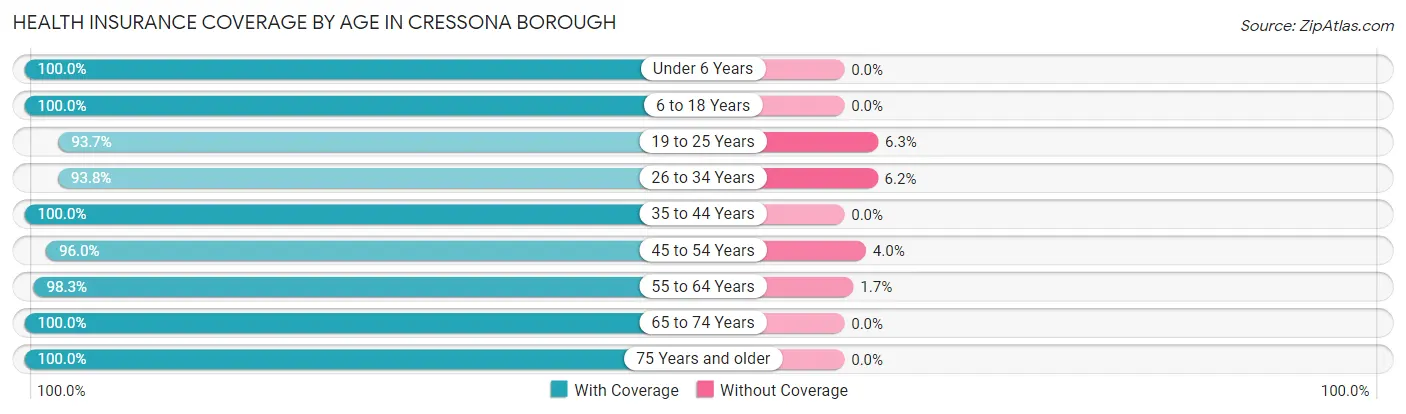
| Age Bracket | With Coverage | Without Coverage |
| Under 6 Years | 72 (100.0%) | 0 (0.0%) |
| 6 to 18 Years | 188 (100.0%) | 0 (0.0%) |
| 19 to 25 Years | 119 (93.7%) | 8 (6.3%) |
| 26 to 34 Years | 181 (93.8%) | 12 (6.2%) |
| 35 to 44 Years | 152 (100.0%) | 0 (0.0%) |
| 45 to 54 Years | 143 (96.0%) | 6 (4.0%) |
| 55 to 64 Years | 173 (98.3%) | 3 (1.7%) |
| 65 to 74 Years | 160 (100.0%) | 0 (0.0%) |
| 75 Years and older | 95 (100.0%) | 0 (0.0%) |
| Total | 1,283 (97.8%) | 29 (2.2%) |
Health Insurance Coverage by Citizenship Status in Cressona borough
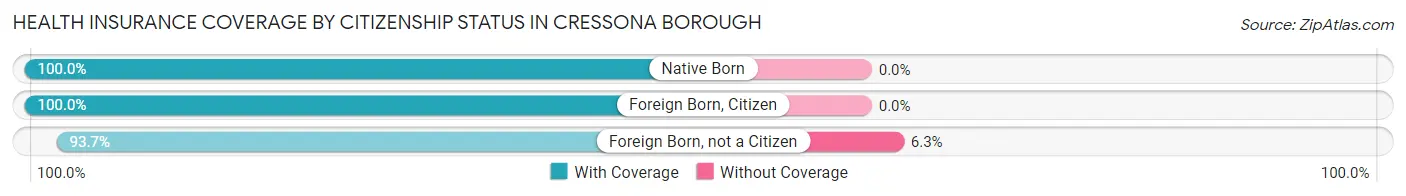
| Citizenship Status | With Coverage | Without Coverage |
| Native Born | 72 (100.0%) | 0 (0.0%) |
| Foreign Born, Citizen | 188 (100.0%) | 0 (0.0%) |
| Foreign Born, not a Citizen | 119 (93.7%) | 8 (6.3%) |
Health Insurance Coverage by Household Income in Cressona borough
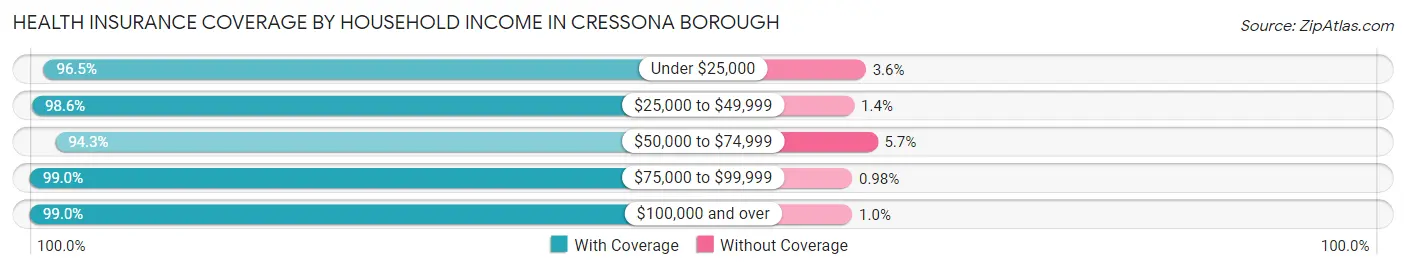
| Household Income | With Coverage | Without Coverage |
| Under $25,000 | 136 (96.5%) | 5 (3.5%) |
| $25,000 to $49,999 | 215 (98.6%) | 3 (1.4%) |
| $50,000 to $74,999 | 230 (94.3%) | 14 (5.7%) |
| $75,000 to $99,999 | 304 (99.0%) | 3 (1.0%) |
| $100,000 and over | 398 (99.0%) | 4 (1.0%) |
Public vs Private Health Insurance Coverage by Age in Cressona borough
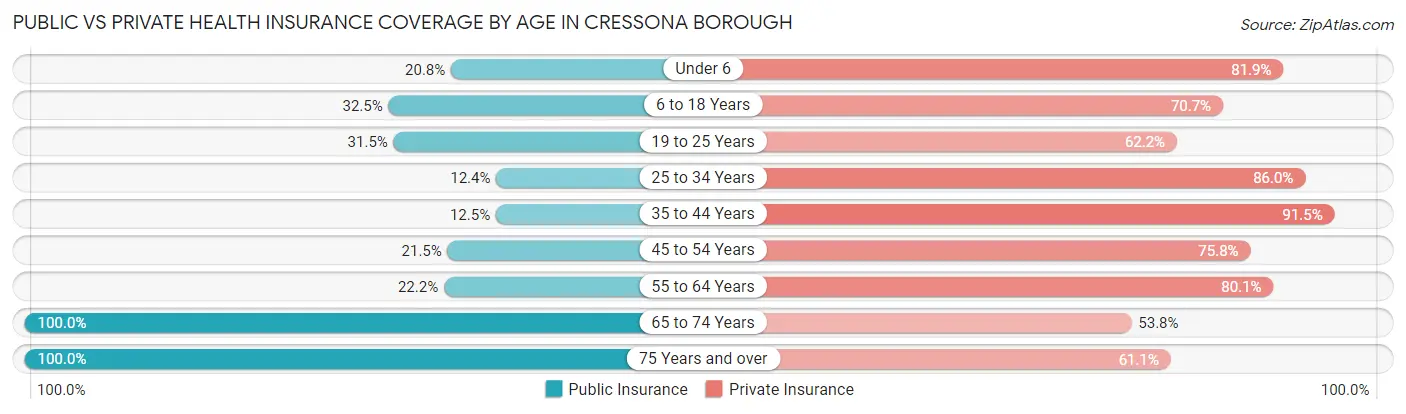
| Age Bracket | Public Insurance | Private Insurance |
| Under 6 | 15 (20.8%) | 59 (81.9%) |
| 6 to 18 Years | 61 (32.5%) | 133 (70.7%) |
| 19 to 25 Years | 40 (31.5%) | 79 (62.2%) |
| 25 to 34 Years | 24 (12.4%) | 166 (86.0%) |
| 35 to 44 Years | 19 (12.5%) | 139 (91.4%) |
| 45 to 54 Years | 32 (21.5%) | 113 (75.8%) |
| 55 to 64 Years | 39 (22.2%) | 141 (80.1%) |
| 65 to 74 Years | 160 (100.0%) | 86 (53.7%) |
| 75 Years and over | 95 (100.0%) | 58 (61.1%) |
| Total | 485 (37.0%) | 974 (74.2%) |
Disability Status by Sex by Age in Cressona borough
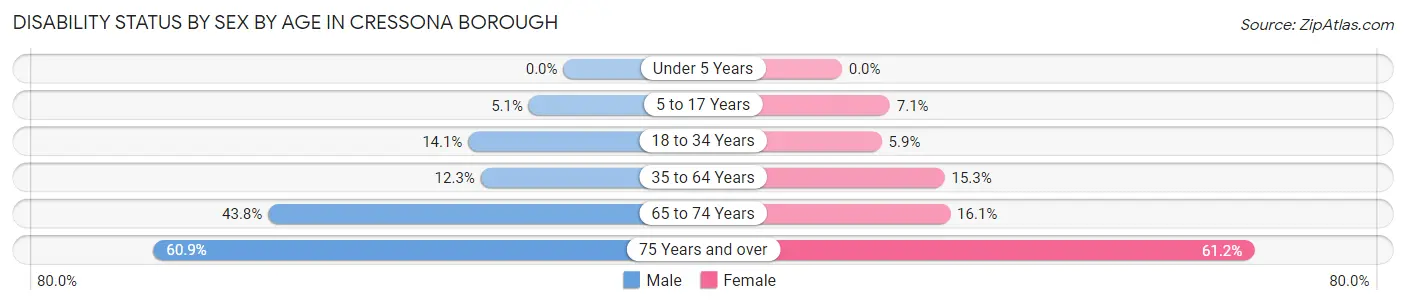
| Age Bracket | Male | Female |
| Under 5 Years | 0 (0.0%) | 0 (0.0%) |
| 5 to 17 Years | 4 (5.1%) | 8 (7.1%) |
| 18 to 34 Years | 26 (14.1%) | 9 (5.9%) |
| 35 to 64 Years | 28 (12.3%) | 38 (15.3%) |
| 65 to 74 Years | 32 (43.8%) | 14 (16.1%) |
| 75 Years and over | 28 (60.9%) | 30 (61.2%) |
Disability Class by Sex by Age in Cressona borough
Disability Class: Hearing Difficulty
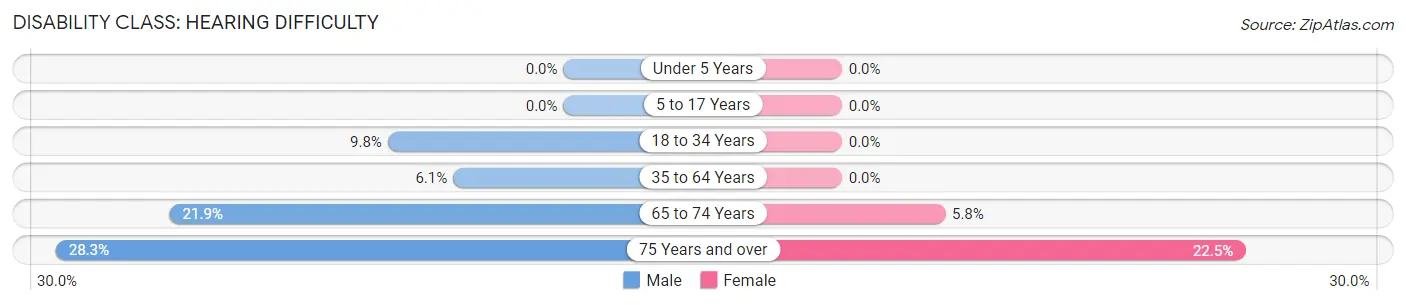
| Age Bracket | Male | Female |
| Under 5 Years | 0 (0.0%) | 0 (0.0%) |
| 5 to 17 Years | 0 (0.0%) | 0 (0.0%) |
| 18 to 34 Years | 18 (9.8%) | 0 (0.0%) |
| 35 to 64 Years | 14 (6.1%) | 0 (0.0%) |
| 65 to 74 Years | 16 (21.9%) | 5 (5.8%) |
| 75 Years and over | 13 (28.3%) | 11 (22.5%) |
Disability Class: Vision Difficulty
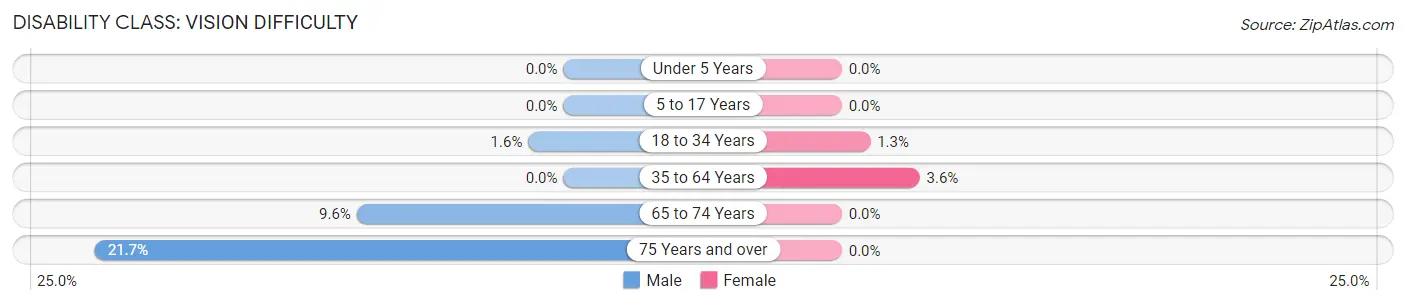
| Age Bracket | Male | Female |
| Under 5 Years | 0 (0.0%) | 0 (0.0%) |
| 5 to 17 Years | 0 (0.0%) | 0 (0.0%) |
| 18 to 34 Years | 3 (1.6%) | 2 (1.3%) |
| 35 to 64 Years | 0 (0.0%) | 9 (3.6%) |
| 65 to 74 Years | 7 (9.6%) | 0 (0.0%) |
| 75 Years and over | 10 (21.7%) | 0 (0.0%) |
Disability Class: Cognitive Difficulty
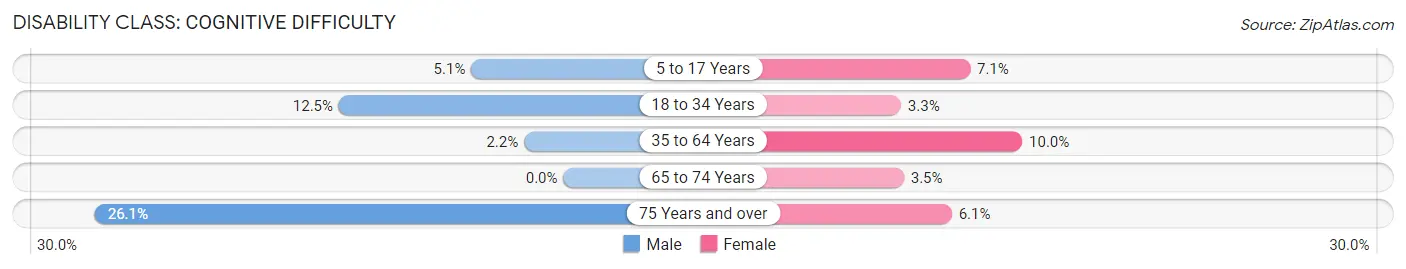
| Age Bracket | Male | Female |
| 5 to 17 Years | 4 (5.1%) | 8 (7.1%) |
| 18 to 34 Years | 23 (12.5%) | 5 (3.3%) |
| 35 to 64 Years | 5 (2.2%) | 25 (10.0%) |
| 65 to 74 Years | 0 (0.0%) | 3 (3.5%) |
| 75 Years and over | 12 (26.1%) | 3 (6.1%) |
Disability Class: Ambulatory Difficulty
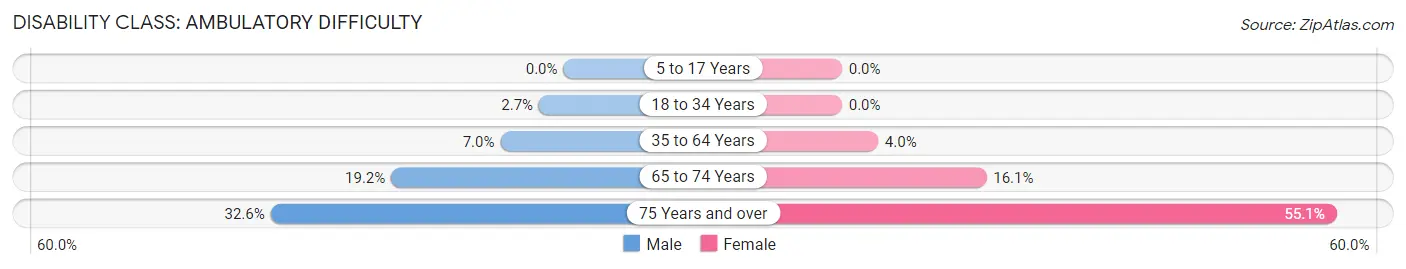
| Age Bracket | Male | Female |
| 5 to 17 Years | 0 (0.0%) | 0 (0.0%) |
| 18 to 34 Years | 5 (2.7%) | 0 (0.0%) |
| 35 to 64 Years | 16 (7.0%) | 10 (4.0%) |
| 65 to 74 Years | 14 (19.2%) | 14 (16.1%) |
| 75 Years and over | 15 (32.6%) | 27 (55.1%) |
Disability Class: Self-Care Difficulty
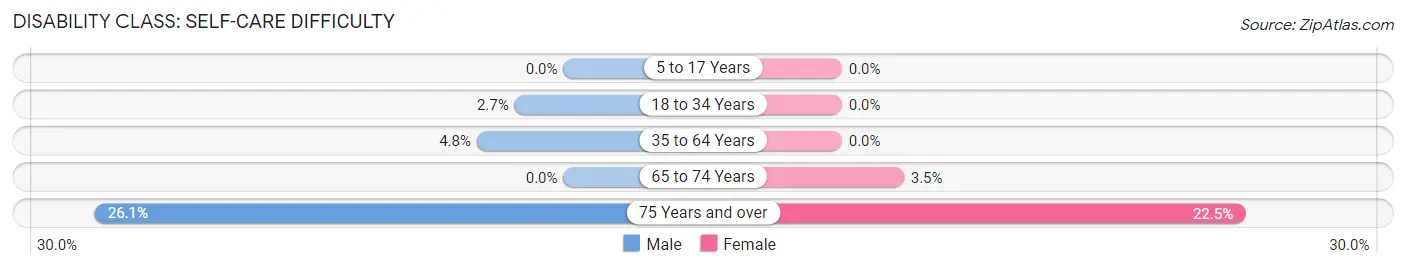
| Age Bracket | Male | Female |
| 5 to 17 Years | 0 (0.0%) | 0 (0.0%) |
| 18 to 34 Years | 5 (2.7%) | 0 (0.0%) |
| 35 to 64 Years | 11 (4.8%) | 0 (0.0%) |
| 65 to 74 Years | 0 (0.0%) | 3 (3.5%) |
| 75 Years and over | 12 (26.1%) | 11 (22.5%) |
Technology Access in Cressona borough
Computing Device Access in Cressona borough
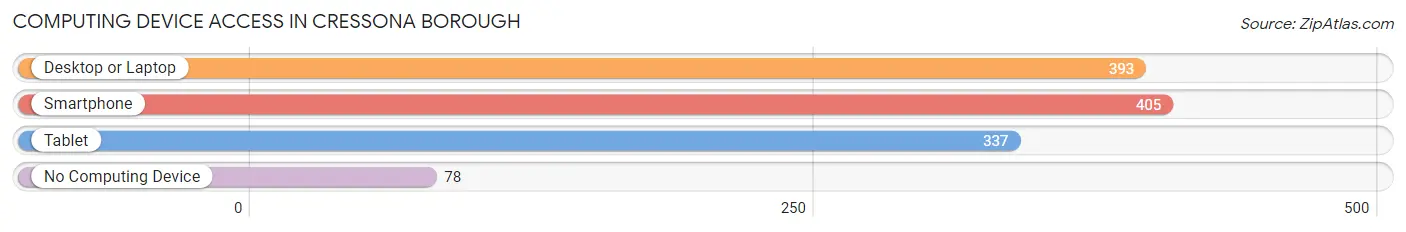
| Device Type | # Households | % Households |
| Desktop or Laptop | 393 | 73.1% |
| Smartphone | 405 | 75.3% |
| Tablet | 337 | 62.6% |
| No Computing Device | 78 | 14.5% |
| Total | 538 | 100.0% |
Internet Access in Cressona borough
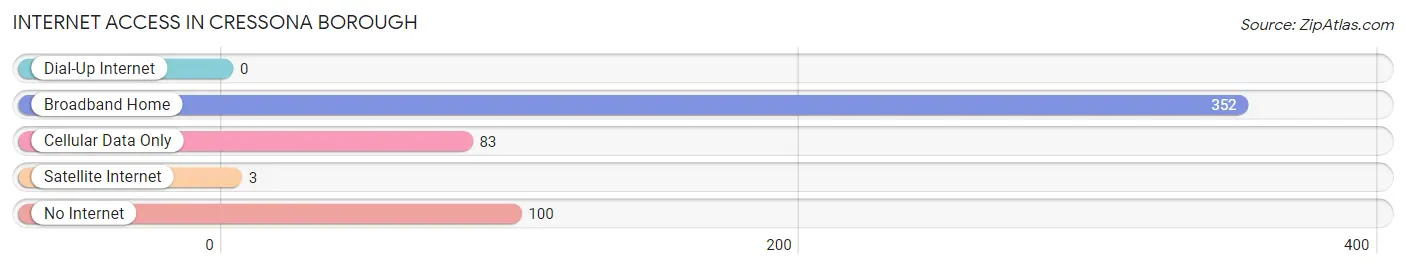
| Internet Type | # Households | % Households |
| Dial-Up Internet | 0 | 0.0% |
| Broadband Home | 352 | 65.4% |
| Cellular Data Only | 83 | 15.4% |
| Satellite Internet | 3 | 0.6% |
| No Internet | 100 | 18.6% |
| Total | 538 | 100.0% |
Cressona borough Summary
Cressona Borough is a small borough located in Schuylkill County, Pennsylvania. It is situated in the southern part of the county, approximately five miles south of Pottsville. The borough is bordered by the townships of North Manheim, West Brunswick, and East Brunswick. As of the 2010 census, the population of Cressona was 1,845.
History
The area that is now Cressona was first settled in the late 1700s by German immigrants. The town was originally known as “Cresson’s Valley”, named after the Cresson family who owned much of the land in the area. In 1851, the town was officially incorporated as the Borough of Cressona.
The town was an important center of industry in the late 19th and early 20th centuries. The Cressona Coal Company was founded in 1872 and operated until the 1950s. The company was the largest employer in the area and provided jobs for many of the town’s residents. Other industries in the area included the Cressona Iron Works, the Cressona Glass Works, and the Cressona Foundry.
Geography
Cressona is located in the southern part of Schuylkill County, approximately five miles south of Pottsville. The borough is bordered by the townships of North Manheim, West Brunswick, and East Brunswick. The borough covers an area of 0.8 square miles and is situated in the Appalachian Mountains. The terrain is mostly hilly and the highest point in the borough is 1,400 feet above sea level.
The climate in Cressona is classified as humid continental, with cold winters and hot, humid summers. The average annual temperature is 48°F and the average annual precipitation is 40 inches.
Economy
The economy of Cressona is largely based on manufacturing and retail. The largest employers in the borough are the Cressona Mall, the Cressona Foundry, and the Cressona Glass Works. Other major employers include the Cressona Iron Works, the Cressona Coal Company, and the Cressona Medical Center.
Demographics
As of the 2010 census, the population of Cressona was 1,845. The racial makeup of the borough was 97.3% White, 0.9% African American, 0.2% Native American, 0.3% Asian, and 1.3% from other races. The median household income was $41,250 and the median family income was $50,000.
The population of Cressona is largely Catholic, with the majority of residents belonging to the Roman Catholic Church. Other religious denominations in the borough include the United Methodist Church, the Lutheran Church, and the Presbyterian Church.
Conclusion
Cressona is a small borough located in Schuylkill County, Pennsylvania. It is situated in the southern part of the county, approximately five miles south of Pottsville. The borough is bordered by the townships of North Manheim, West Brunswick, and East Brunswick. As of the 2010 census, the population of Cressona was 1,845. The economy of Cressona is largely based on manufacturing and retail, and the largest employers in the borough are the Cressona Mall, the Cressona Foundry, and the Cressona Glass Works. The population of Cressona is largely Catholic, with the majority of residents belonging to the Roman Catholic Church.
Common Questions
What is Per Capita Income in Cressona borough?
Per Capita income in Cressona borough is $30,632.
What is the Median Family Income in Cressona borough?
Median Family Income in Cressona borough is $74,239.
What is the Median Household income in Cressona borough?
Median Household Income in Cressona borough is $69,300.
What is Income or Wage Gap in Cressona borough?
Income or Wage Gap in Cressona borough is 42.2%.
Women in Cressona borough earn 57.8 cents for every dollar earned by a man.
What is Inequality or Gini Index in Cressona borough?
Inequality or Gini Index in Cressona borough is 0.35.
What is the Total Population of Cressona borough?
Total Population of Cressona borough is 1,312.
What is the Total Male Population of Cressona borough?
Total Male Population of Cressona borough is 646.
What is the Total Female Population of Cressona borough?
Total Female Population of Cressona borough is 666.
What is the Ratio of Males per 100 Females in Cressona borough?
There are 97.00 Males per 100 Females in Cressona borough.
What is the Ratio of Females per 100 Males in Cressona borough?
There are 103.10 Females per 100 Males in Cressona borough.
What is the Median Population Age in Cressona borough?
Median Population Age in Cressona borough is 38.2 Years.
What is the Average Family Size in Cressona borough
Average Family Size in Cressona borough is 2.9 People.
What is the Average Household Size in Cressona borough
Average Household Size in Cressona borough is 2.4 People.
How Large is the Labor Force in Cressona borough?
There are 775 People in the Labor Forcein in Cressona borough.
What is the Percentage of People in the Labor Force in Cressona borough?
70.8% of People are in the Labor Force in Cressona borough.
What is the Unemployment Rate in Cressona borough?
Unemployment Rate in Cressona borough is 4.6%.