Muhlenberg Park, PA Map & Demographics
Muhlenberg Park Map
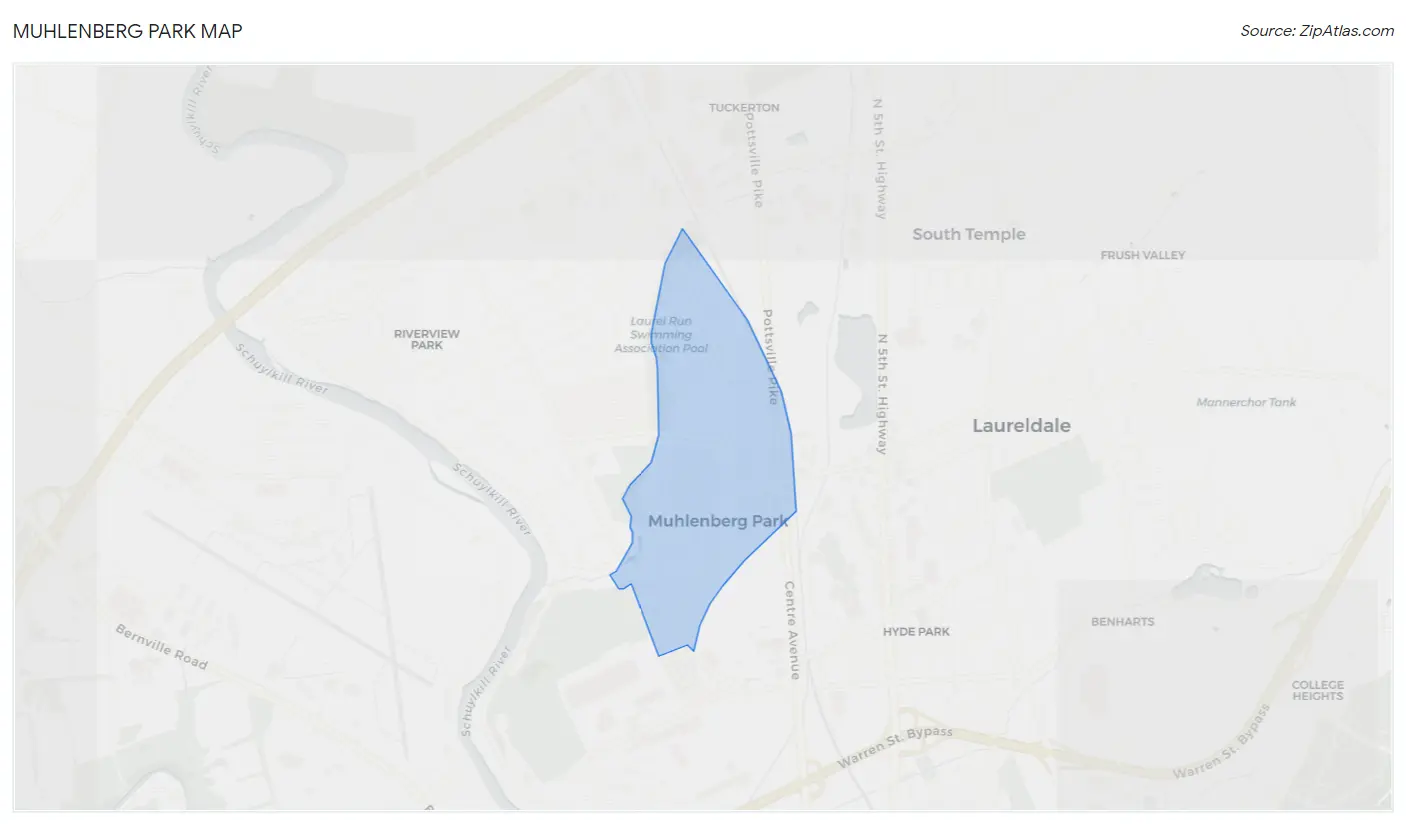
Muhlenberg Park Overview
$62,001
PER CAPITA INCOME
$113,382
AVG FAMILY INCOME
$91,477
AVG HOUSEHOLD INCOME
0.50
INEQUALITY / GINI INDEX
1,176
TOTAL POPULATION
594
MALE POPULATION
582
FEMALE POPULATION
102.06
MALES / 100 FEMALES
97.98
FEMALES / 100 MALES
55.9
MEDIAN AGE
2.8
AVG FAMILY SIZE
2.1
AVG HOUSEHOLD SIZE
573
LABOR FORCE [ PEOPLE ]
56.1%
PERCENT IN LABOR FORCE
1.7%
UNEMPLOYMENT RATE
Income in Muhlenberg Park
Income Overview in Muhlenberg Park
Per Capita Income in Muhlenberg Park is $62,001, while median incomes of families and households are $113,382 and $91,477 respectively.
| Characteristic | Number | Measure |
| Per Capita Income | 1,176 | $62,001 |
| Median Family Income | 318 | $113,382 |
| Mean Family Income | 318 | $171,643 |
| Median Household Income | 559 | $91,477 |
| Mean Household Income | 559 | $130,938 |
| Income Deficit | 318 | $0 |
| Wage / Income Gap (%) | 1,176 | 0.00% |
| Wage / Income Gap ($) | 1,176 | 100.00¢ per $1 |
| Gini / Inequality Index | 1,176 | 0.50 |
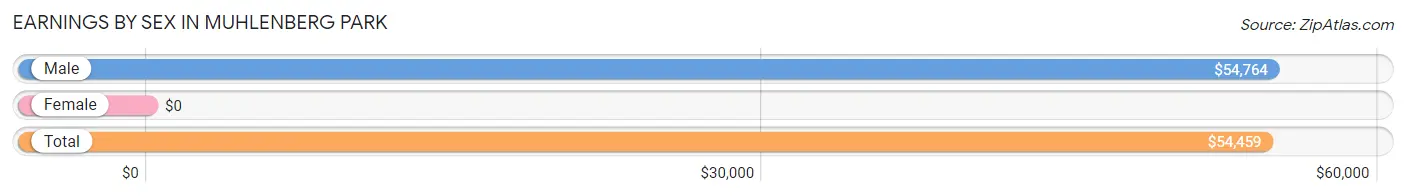
Earnings by Sex in Muhlenberg Park
| Sex | Number | Average Earnings |
| Male | 339 (52.8%) | $54,764 |
| Female | 303 (47.2%) | $0 |
| Total | 642 (100.0%) | $54,459 |
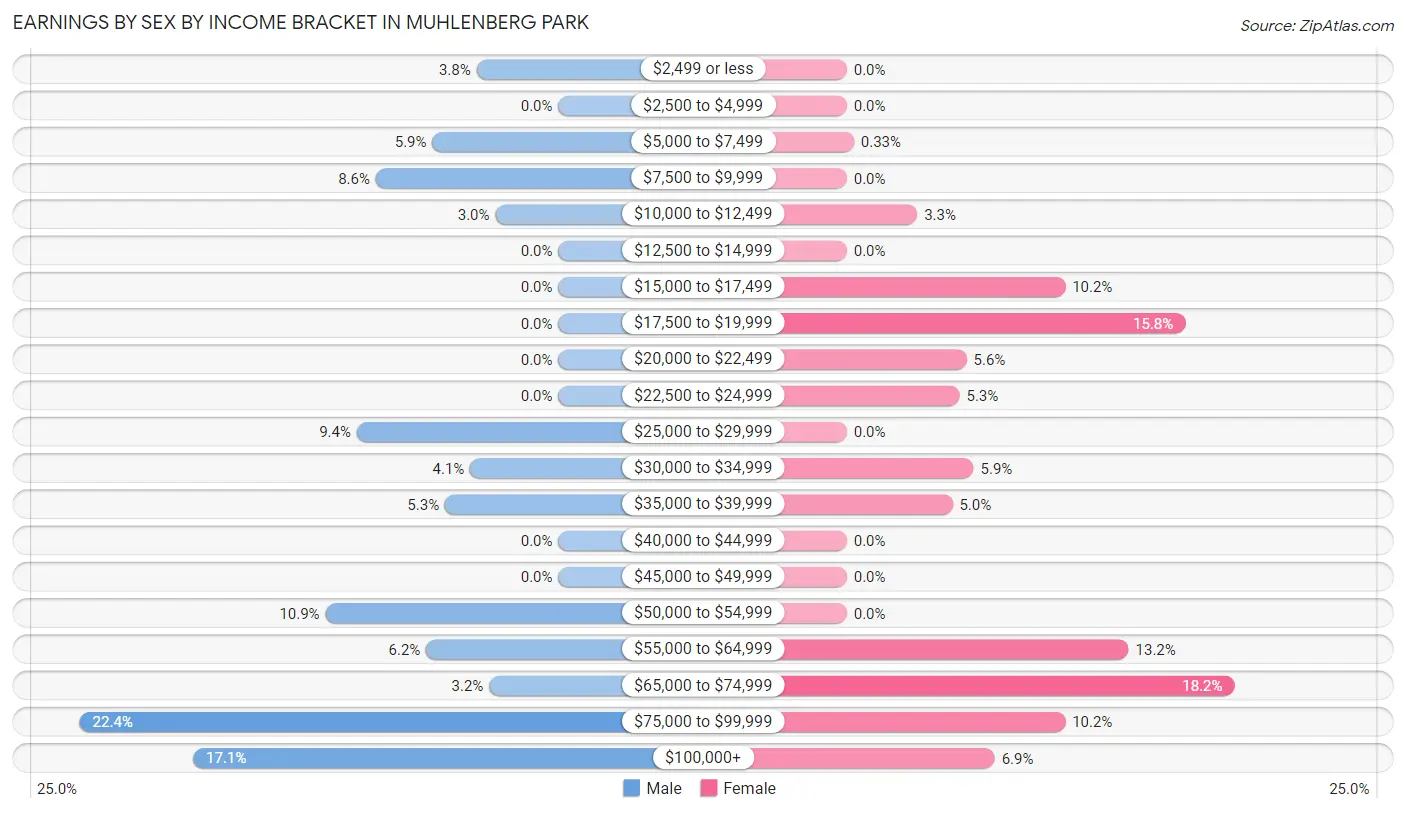
Earnings by Sex by Income Bracket in Muhlenberg Park
The most common earnings brackets in Muhlenberg Park are $75,000 to $99,999 for men (76 | 22.4%) and $65,000 to $74,999 for women (55 | 18.1%).
| Income | Male | Female |
| $2,499 or less | 13 (3.8%) | 0 (0.0%) |
| $2,500 to $4,999 | 0 (0.0%) | 0 (0.0%) |
| $5,000 to $7,499 | 20 (5.9%) | 1 (0.3%) |
| $7,500 to $9,999 | 29 (8.6%) | 0 (0.0%) |
| $10,000 to $12,499 | 10 (2.9%) | 10 (3.3%) |
| $12,500 to $14,999 | 0 (0.0%) | 0 (0.0%) |
| $15,000 to $17,499 | 0 (0.0%) | 31 (10.2%) |
| $17,500 to $19,999 | 0 (0.0%) | 48 (15.8%) |
| $20,000 to $22,499 | 0 (0.0%) | 17 (5.6%) |
| $22,500 to $24,999 | 0 (0.0%) | 16 (5.3%) |
| $25,000 to $29,999 | 32 (9.4%) | 0 (0.0%) |
| $30,000 to $34,999 | 14 (4.1%) | 18 (5.9%) |
| $35,000 to $39,999 | 18 (5.3%) | 15 (5.0%) |
| $40,000 to $44,999 | 0 (0.0%) | 0 (0.0%) |
| $45,000 to $49,999 | 0 (0.0%) | 0 (0.0%) |
| $50,000 to $54,999 | 37 (10.9%) | 0 (0.0%) |
| $55,000 to $64,999 | 21 (6.2%) | 40 (13.2%) |
| $65,000 to $74,999 | 11 (3.2%) | 55 (18.1%) |
| $75,000 to $99,999 | 76 (22.4%) | 31 (10.2%) |
| $100,000+ | 58 (17.1%) | 21 (6.9%) |
| Total | 339 (100.0%) | 303 (100.0%) |
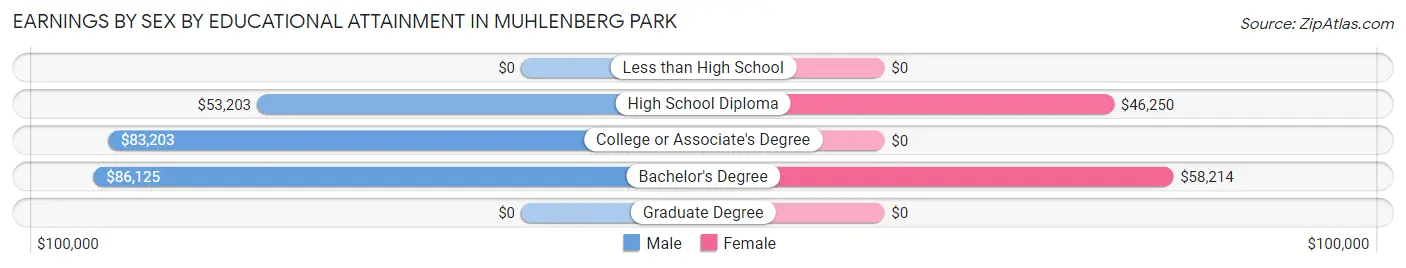
Earnings by Sex by Educational Attainment in Muhlenberg Park
Average earnings in Muhlenberg Park are $69,205 for men and $55,903 for women, a difference of 19.2%. Men with an educational attainment of bachelor's degree enjoy the highest average annual earnings of $86,125, while those with high school diploma education earn the least with $53,203. Women with an educational attainment of bachelor's degree earn the most with the average annual earnings of $58,214, while those with high school diploma education have the smallest earnings of $46,250.
| Educational Attainment | Male Income | Female Income |
| Less than High School | - | - |
| High School Diploma | $53,203 | $46,250 |
| College or Associate's Degree | $83,203 | $0 |
| Bachelor's Degree | $86,125 | $58,214 |
| Graduate Degree | - | - |
| Total | $69,205 | $55,903 |
Family Income in Muhlenberg Park
Family Income Brackets in Muhlenberg Park
According to the Muhlenberg Park family income data, there are 166 families falling into the $100,000 to $149,999 income range, which is the most common income bracket and makes up 52.2% of all families.
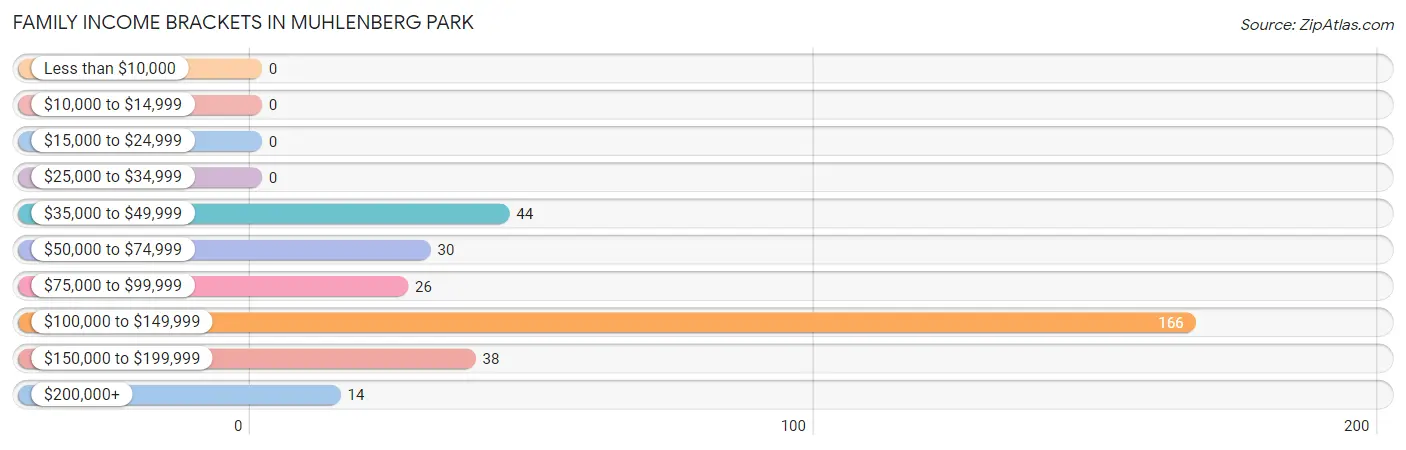
| Income Bracket | # Families | % Families |
| Less than $10,000 | 0 | 0.0% |
| $10,000 to $14,999 | 0 | 0.0% |
| $15,000 to $24,999 | 0 | 0.0% |
| $25,000 to $34,999 | 0 | 0.0% |
| $35,000 to $49,999 | 44 | 13.8% |
| $50,000 to $74,999 | 30 | 9.4% |
| $75,000 to $99,999 | 26 | 8.2% |
| $100,000 to $149,999 | 166 | 52.2% |
| $150,000 to $199,999 | 38 | 11.9% |
| $200,000+ | 14 | 4.4% |
Family Income by Famaliy Size in Muhlenberg Park
3-person families (55 | 17.3%) account for the highest median family income in Muhlenberg Park with $146,875 per family, while 2-person families (175 | 55.0%) have the highest median income of $50,469 per family member.
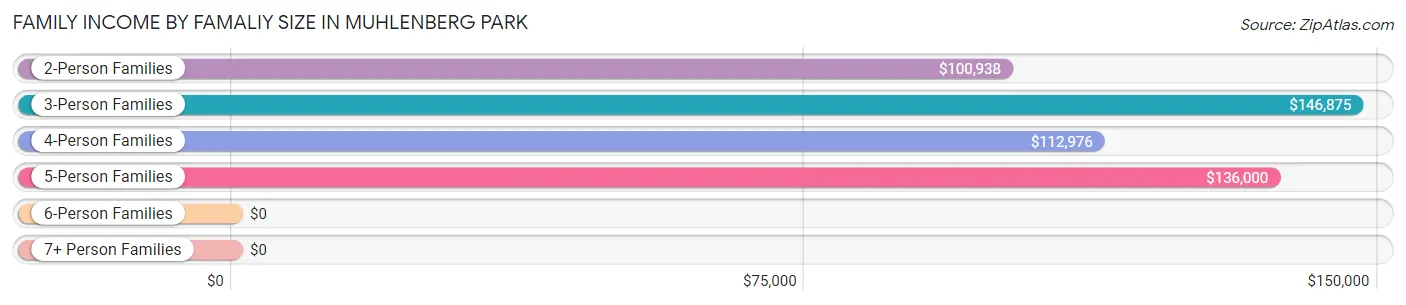
| Income Bracket | # Families | Median Income |
| 2-Person Families | 175 (55.0%) | $100,938 |
| 3-Person Families | 55 (17.3%) | $146,875 |
| 4-Person Families | 52 (16.4%) | $112,976 |
| 5-Person Families | 34 (10.7%) | $136,000 |
| 6-Person Families | 0 (0.0%) | $0 |
| 7+ Person Families | 2 (0.6%) | $0 |
| Total | 318 (100.0%) | $113,382 |
Family Income by Number of Earners in Muhlenberg Park
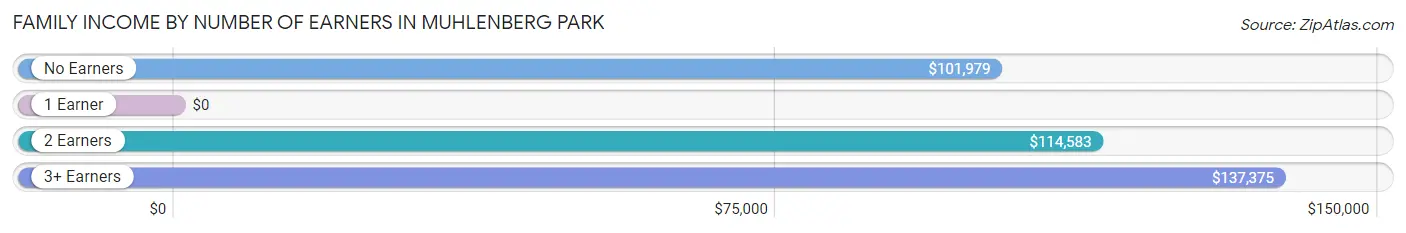
| Number of Earners | # Families | Median Income |
| No Earners | 105 (33.0%) | $101,979 |
| 1 Earner | 55 (17.3%) | $0 |
| 2 Earners | 109 (34.3%) | $114,583 |
| 3+ Earners | 49 (15.4%) | $137,375 |
| Total | 318 (100.0%) | $113,382 |
Household Income in Muhlenberg Park
Household Income Brackets in Muhlenberg Park
With 166 households falling in the category, the $100,000 to $149,999 income range is the most frequent in Muhlenberg Park, accounting for 29.7% of all households. In contrast, only 13 households (2.3%) fall into the less than $10,000 income bracket, making it the least populous group.
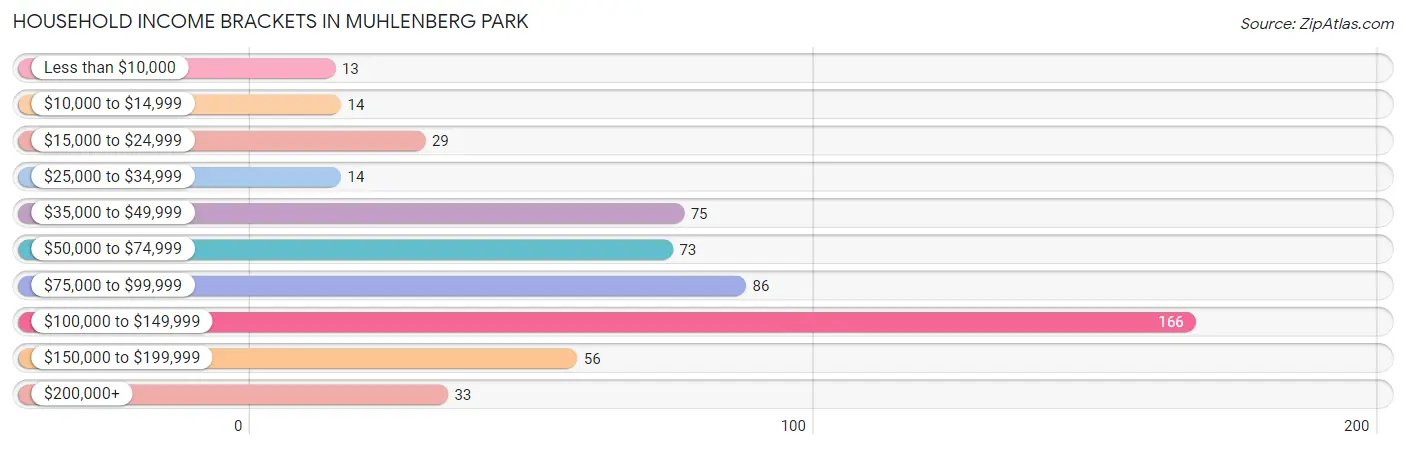
| Income Bracket | # Households | % Households |
| Less than $10,000 | 13 | 2.3% |
| $10,000 to $14,999 | 14 | 2.5% |
| $15,000 to $24,999 | 29 | 5.2% |
| $25,000 to $34,999 | 14 | 2.5% |
| $35,000 to $49,999 | 75 | 13.4% |
| $50,000 to $74,999 | 73 | 13.1% |
| $75,000 to $99,999 | 86 | 15.4% |
| $100,000 to $149,999 | 166 | 29.7% |
| $150,000 to $199,999 | 56 | 10.0% |
| $200,000+ | 33 | 5.9% |
Household Income by Householder Age in Muhlenberg Park
The median household income in Muhlenberg Park is $91,477, with the highest median household income of $102,216 found in the 45 to 64 years age bracket for the primary householder. A total of 235 households (42.0%) fall into this category.
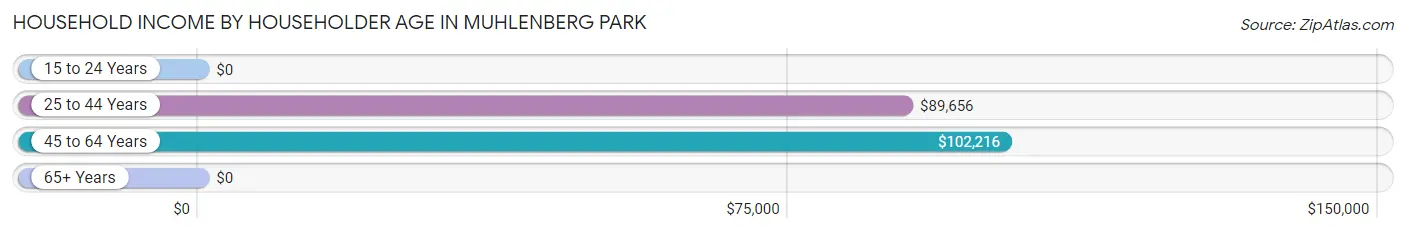
| Income Bracket | # Households | Median Income |
| 15 to 24 Years | 0 (0.0%) | $0 |
| 25 to 44 Years | 97 (17.3%) | $89,656 |
| 45 to 64 Years | 235 (42.0%) | $102,216 |
| 65+ Years | 227 (40.6%) | $0 |
| Total | 559 (100.0%) | $91,477 |
Poverty in Muhlenberg Park
Income Below Poverty by Sex and Age in Muhlenberg Park
With 5.7% poverty level for males and 2.2% for females among the residents of Muhlenberg Park, 55 to 64 year old males and 75 year old and over females are the most vulnerable to poverty, with 20 males (16.7%) and 13 females (11.6%) in their respective age groups living below the poverty level.
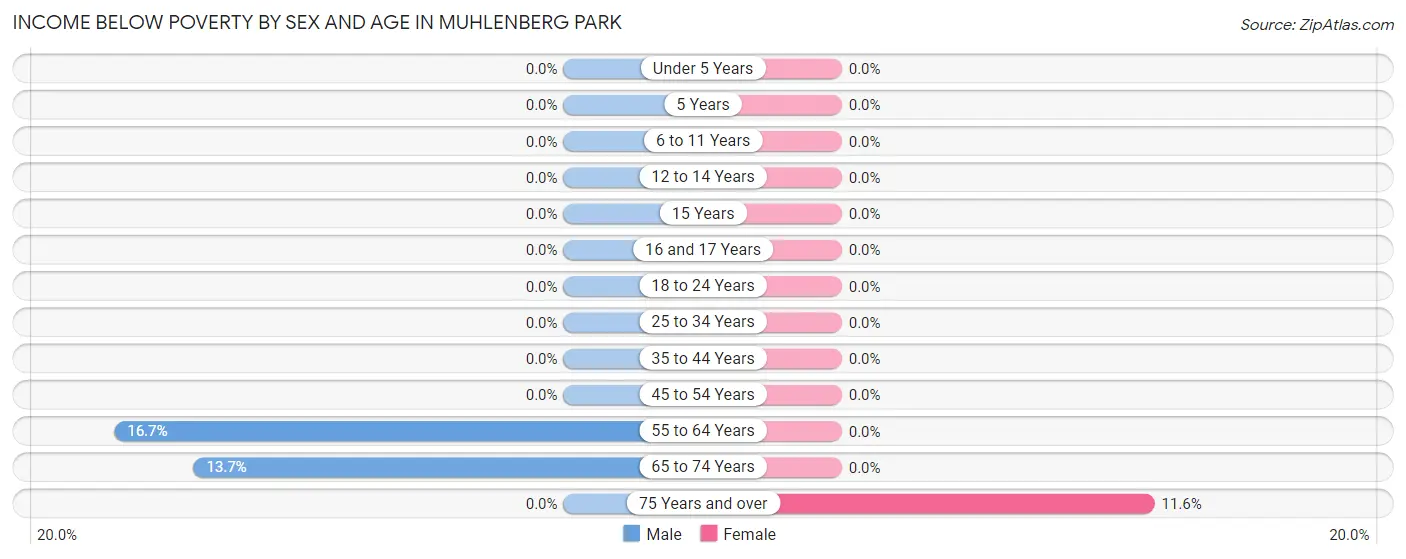
| Age Bracket | Male | Female |
| Under 5 Years | 0 (0.0%) | 0 (0.0%) |
| 5 Years | 0 (0.0%) | 0 (0.0%) |
| 6 to 11 Years | 0 (0.0%) | 0 (0.0%) |
| 12 to 14 Years | 0 (0.0%) | 0 (0.0%) |
| 15 Years | 0 (0.0%) | 0 (0.0%) |
| 16 and 17 Years | 0 (0.0%) | 0 (0.0%) |
| 18 to 24 Years | 0 (0.0%) | 0 (0.0%) |
| 25 to 34 Years | 0 (0.0%) | 0 (0.0%) |
| 35 to 44 Years | 0 (0.0%) | 0 (0.0%) |
| 45 to 54 Years | 0 (0.0%) | 0 (0.0%) |
| 55 to 64 Years | 20 (16.7%) | 0 (0.0%) |
| 65 to 74 Years | 14 (13.7%) | 0 (0.0%) |
| 75 Years and over | 0 (0.0%) | 13 (11.6%) |
| Total | 34 (5.7%) | 13 (2.2%) |
Income Above Poverty by Sex and Age in Muhlenberg Park
According to the poverty statistics in Muhlenberg Park, males aged under 5 years and females aged 6 to 11 years are the age groups that are most secure financially, with 100.0% of males and 100.0% of females in these age groups living above the poverty line.
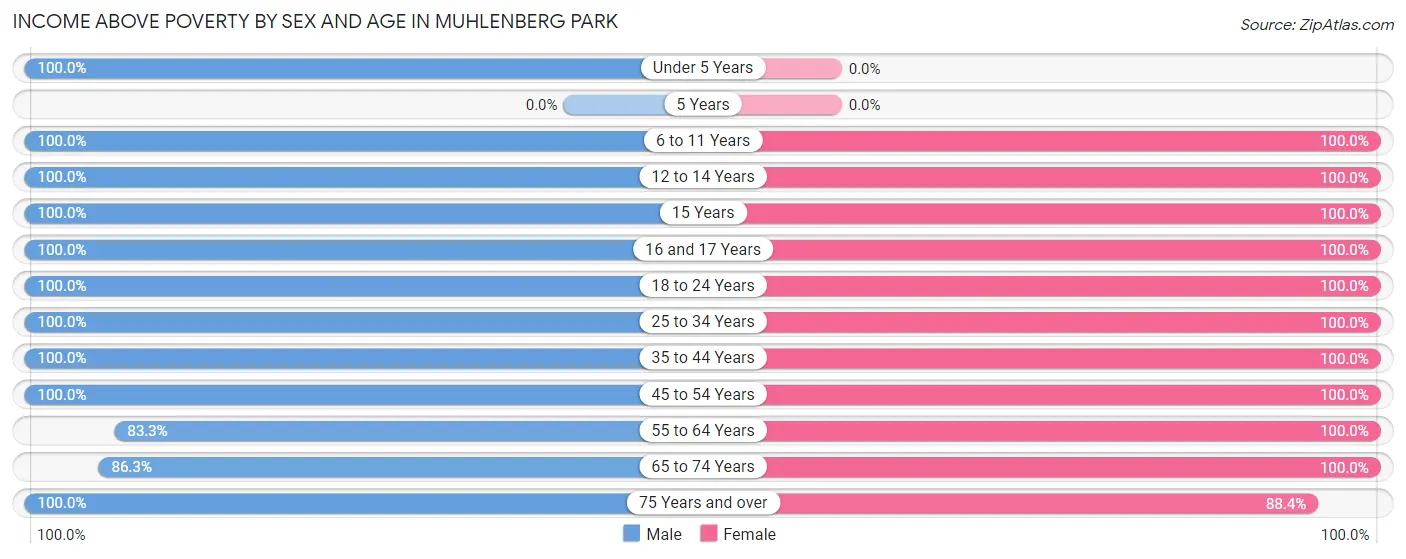
| Age Bracket | Male | Female |
| Under 5 Years | 9 (100.0%) | 0 (0.0%) |
| 5 Years | 0 (0.0%) | 0 (0.0%) |
| 6 to 11 Years | 35 (100.0%) | 11 (100.0%) |
| 12 to 14 Years | 17 (100.0%) | 35 (100.0%) |
| 15 Years | 46 (100.0%) | 2 (100.0%) |
| 16 and 17 Years | 14 (100.0%) | 21 (100.0%) |
| 18 to 24 Years | 52 (100.0%) | 22 (100.0%) |
| 25 to 34 Years | 63 (100.0%) | 21 (100.0%) |
| 35 to 44 Years | 21 (100.0%) | 46 (100.0%) |
| 45 to 54 Years | 58 (100.0%) | 68 (100.0%) |
| 55 to 64 Years | 100 (83.3%) | 148 (100.0%) |
| 65 to 74 Years | 88 (86.3%) | 96 (100.0%) |
| 75 Years and over | 57 (100.0%) | 99 (88.4%) |
| Total | 560 (94.3%) | 569 (97.8%) |
Income Below Poverty Among Married-Couple Families in Muhlenberg Park
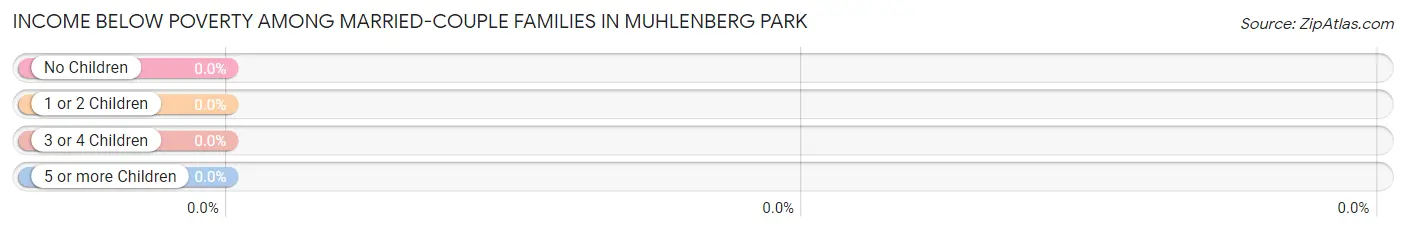
| Children | Above Poverty | Below Poverty |
| No Children | 230 (100.0%) | 0 (0.0%) |
| 1 or 2 Children | 42 (100.0%) | 0 (0.0%) |
| 3 or 4 Children | 24 (100.0%) | 0 (0.0%) |
| 5 or more Children | 0 (0.0%) | 0 (0.0%) |
| Total | 296 (100.0%) | 0 (0.0%) |
Income Below Poverty Among Single-Parent Households in Muhlenberg Park
| Children | Single Father | Single Mother |
| No Children | 0 (0.0%) | 0 (0.0%) |
| 1 or 2 Children | 0 (0.0%) | 0 (0.0%) |
| 3 or 4 Children | 0 (0.0%) | 0 (0.0%) |
| 5 or more Children | 0 (0.0%) | 0 (0.0%) |
| Total | 0 (0.0%) | 0 (0.0%) |
Income Below Poverty Among Married-Couple vs Single-Parent Households in Muhlenberg Park
| Children | Married-Couple Families | Single-Parent Households |
| No Children | 0 (0.0%) | 0 (0.0%) |
| 1 or 2 Children | 0 (0.0%) | 0 (0.0%) |
| 3 or 4 Children | 0 (0.0%) | 0 (0.0%) |
| 5 or more Children | 0 (0.0%) | 0 (0.0%) |
| Total | 0 (0.0%) | 0 (0.0%) |
Race in Muhlenberg Park
The most populous races in Muhlenberg Park are White / Caucasian (1,072 | 91.2%), Hispanic or Latino (98 | 8.3%), and Asian (34 | 2.9%).
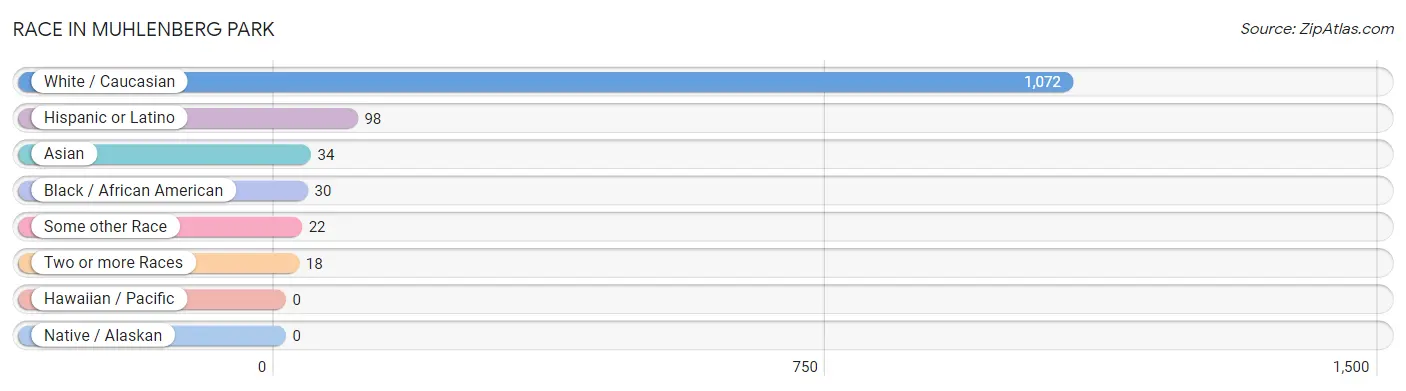
| Race | # Population | % Population |
| Asian | 34 | 2.9% |
| Black / African American | 30 | 2.5% |
| Hawaiian / Pacific | 0 | 0.0% |
| Hispanic or Latino | 98 | 8.3% |
| Native / Alaskan | 0 | 0.0% |
| White / Caucasian | 1,072 | 91.2% |
| Two or more Races | 18 | 1.5% |
| Some other Race | 22 | 1.9% |
| Total | 1,176 | 100.0% |
Ancestry in Muhlenberg Park
The most populous ancestries reported in Muhlenberg Park are German (608 | 51.7%), Polish (142 | 12.1%), Italian (133 | 11.3%), Irish (104 | 8.8%), and Puerto Rican (84 | 7.1%), together accounting for 91.1% of all Muhlenberg Park residents.
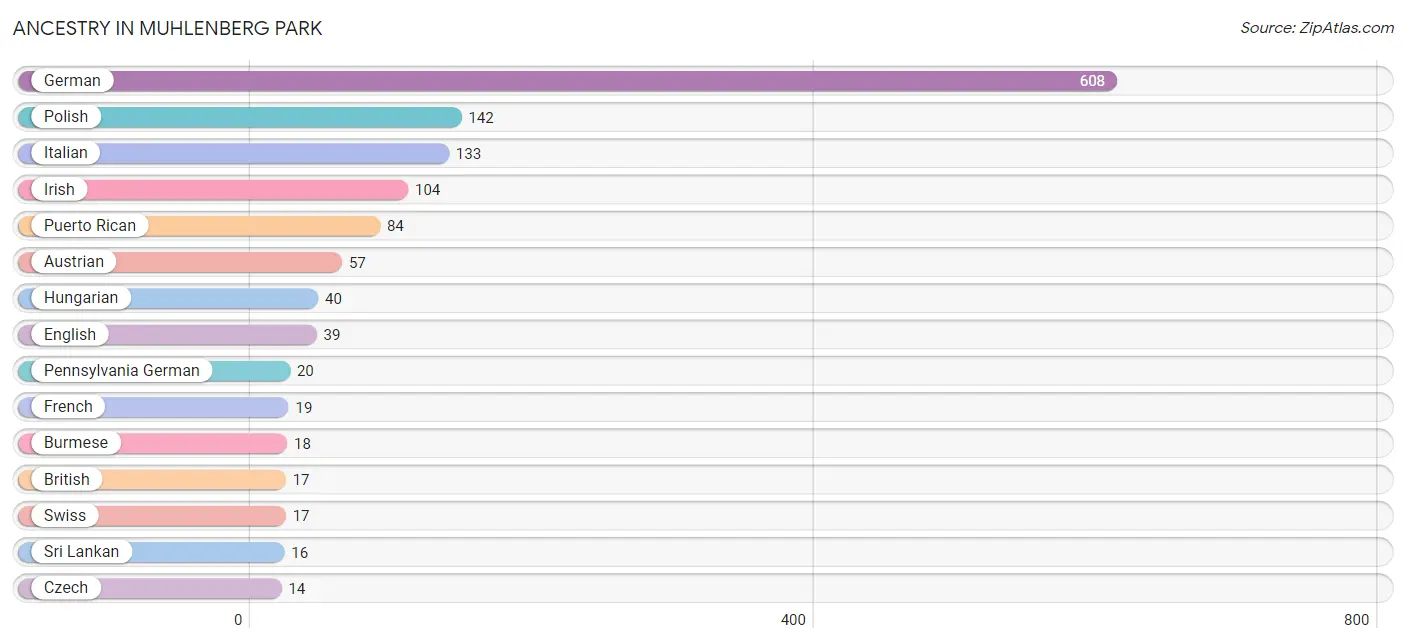
| Ancestry | # Population | % Population |
| American | 12 | 1.0% |
| Austrian | 57 | 4.9% |
| British | 17 | 1.5% |
| Burmese | 18 | 1.5% |
| Czech | 14 | 1.2% |
| Dutch | 11 | 0.9% |
| English | 39 | 3.3% |
| French | 19 | 1.6% |
| German | 608 | 51.7% |
| Greek | 14 | 1.2% |
| Hungarian | 40 | 3.4% |
| Irish | 104 | 8.8% |
| Italian | 133 | 11.3% |
| Pennsylvania German | 20 | 1.7% |
| Polish | 142 | 12.1% |
| Puerto Rican | 84 | 7.1% |
| Spaniard | 14 | 1.2% |
| Sri Lankan | 16 | 1.4% |
| Swiss | 17 | 1.5% | View All 19 Rows |
Immigrants in Muhlenberg Park
The most numerous immigrant groups reported in Muhlenberg Park came from Europe (14 | 1.2%), Southern Europe (14 | 1.2%), Spain (14 | 1.2%), Asia (11 | 0.9%), and South Eastern Asia (11 | 0.9%), together accounting for 5.4% of all Muhlenberg Park residents.
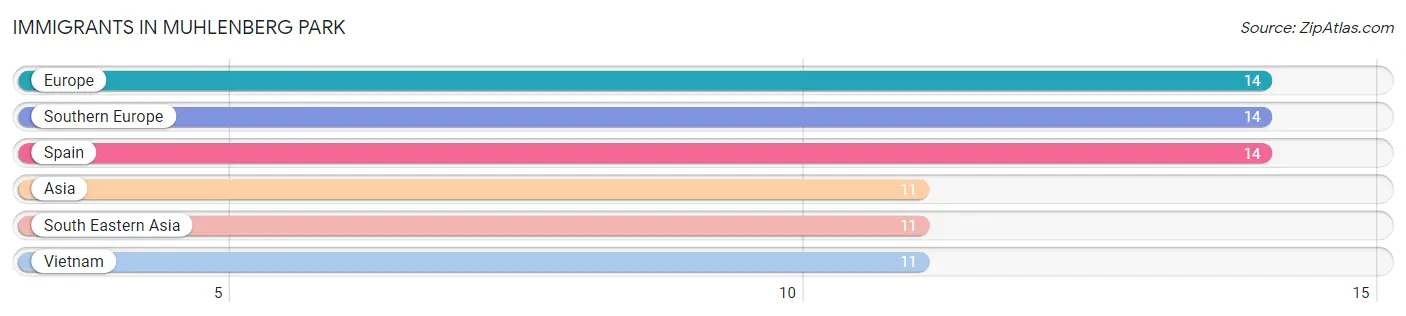
| Immigration Origin | # Population | % Population |
| Asia | 11 | 0.9% |
| Europe | 14 | 1.2% |
| South Eastern Asia | 11 | 0.9% |
| Southern Europe | 14 | 1.2% |
| Spain | 14 | 1.2% |
| Vietnam | 11 | 0.9% | View All 6 Rows |
Sex and Age in Muhlenberg Park
Sex and Age in Muhlenberg Park
The most populous age groups in Muhlenberg Park are 55 to 59 Years (120 | 20.2%) for men and 60 to 64 Years (84 | 14.4%) for women.
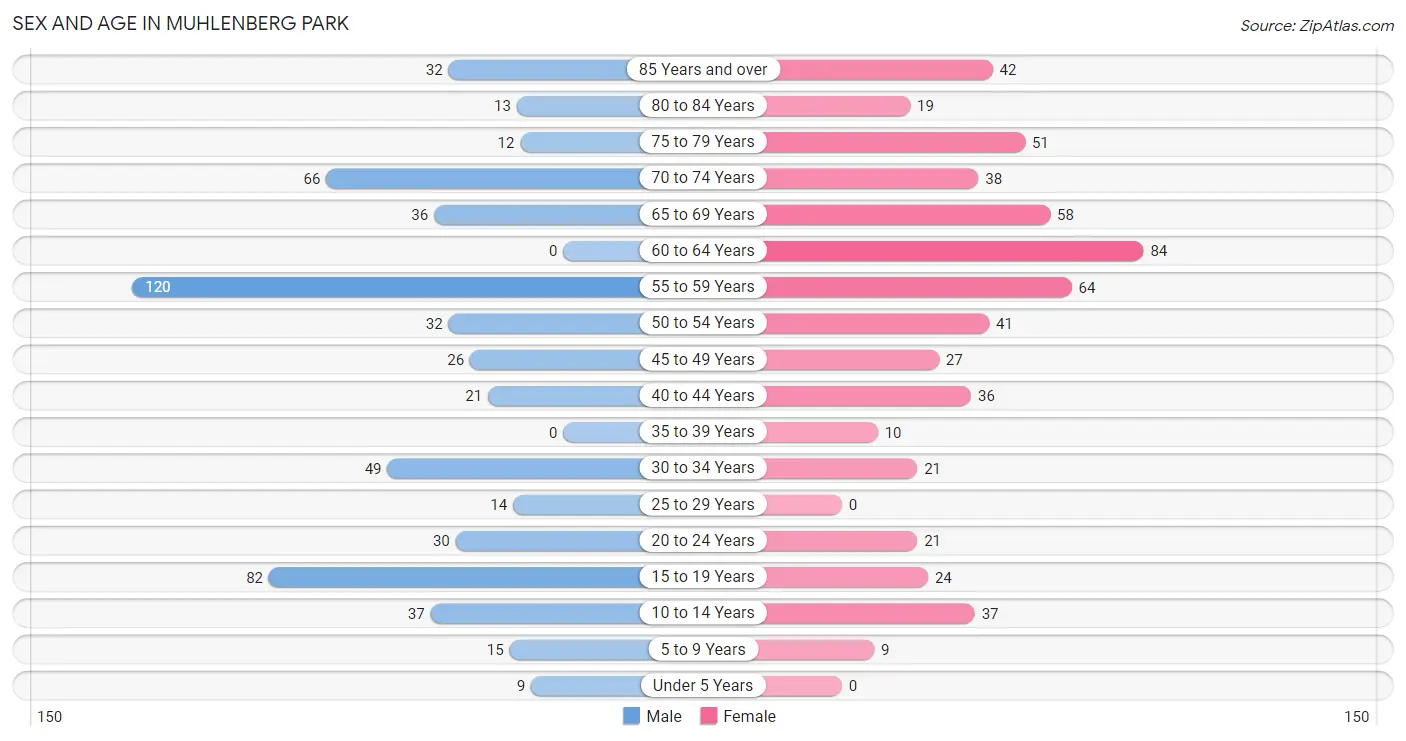
| Age Bracket | Male | Female |
| Under 5 Years | 9 (1.5%) | 0 (0.0%) |
| 5 to 9 Years | 15 (2.5%) | 9 (1.5%) |
| 10 to 14 Years | 37 (6.2%) | 37 (6.4%) |
| 15 to 19 Years | 82 (13.8%) | 24 (4.1%) |
| 20 to 24 Years | 30 (5.1%) | 21 (3.6%) |
| 25 to 29 Years | 14 (2.4%) | 0 (0.0%) |
| 30 to 34 Years | 49 (8.3%) | 21 (3.6%) |
| 35 to 39 Years | 0 (0.0%) | 10 (1.7%) |
| 40 to 44 Years | 21 (3.5%) | 36 (6.2%) |
| 45 to 49 Years | 26 (4.4%) | 27 (4.6%) |
| 50 to 54 Years | 32 (5.4%) | 41 (7.0%) |
| 55 to 59 Years | 120 (20.2%) | 64 (11.0%) |
| 60 to 64 Years | 0 (0.0%) | 84 (14.4%) |
| 65 to 69 Years | 36 (6.1%) | 58 (10.0%) |
| 70 to 74 Years | 66 (11.1%) | 38 (6.5%) |
| 75 to 79 Years | 12 (2.0%) | 51 (8.8%) |
| 80 to 84 Years | 13 (2.2%) | 19 (3.3%) |
| 85 Years and over | 32 (5.4%) | 42 (7.2%) |
| Total | 594 (100.0%) | 582 (100.0%) |
Families and Households in Muhlenberg Park
Median Family Size in Muhlenberg Park
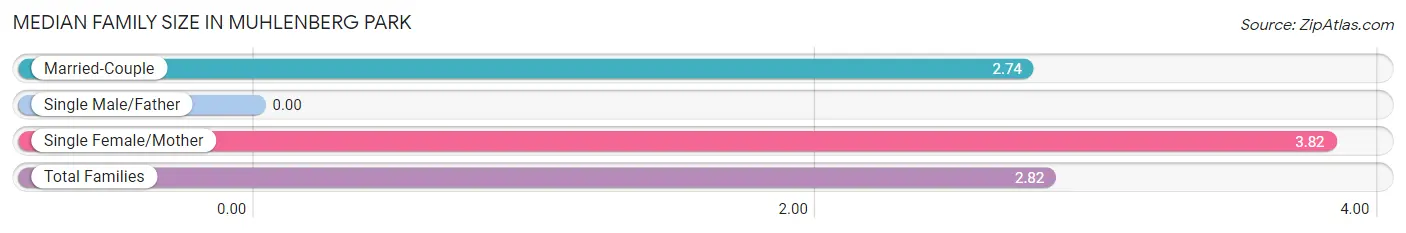
| Family Type | # Families | Family Size |
| Married-Couple | 296 (93.1%) | 2.74 |
| Single Male/Father | 0 (0.0%) | - |
| Single Female/Mother | 22 (6.9%) | 3.82 |
| Total Families | 318 (100.0%) | 2.82 |
Median Household Size in Muhlenberg Park
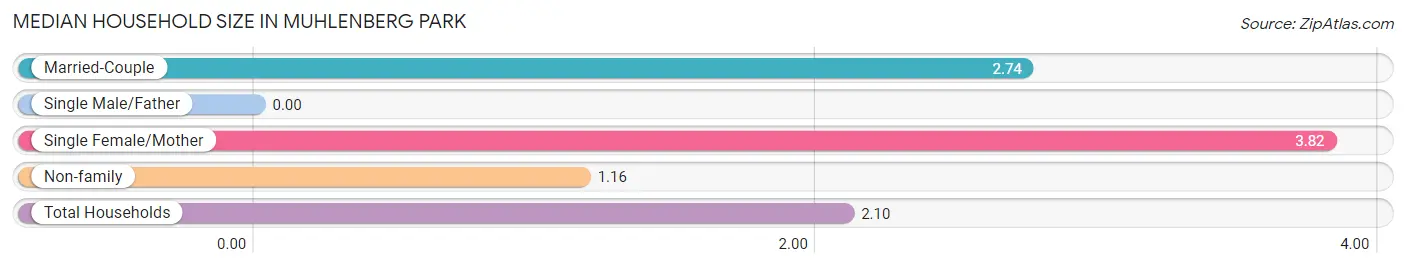
| Household Type | # Households | Household Size |
| Married-Couple | 296 (52.9%) | 2.74 |
| Single Male/Father | 0 (0.0%) | - |
| Single Female/Mother | 22 (3.9%) | 3.82 |
| Non-family | 241 (43.1%) | 1.16 |
| Total Households | 559 (100.0%) | 2.10 |
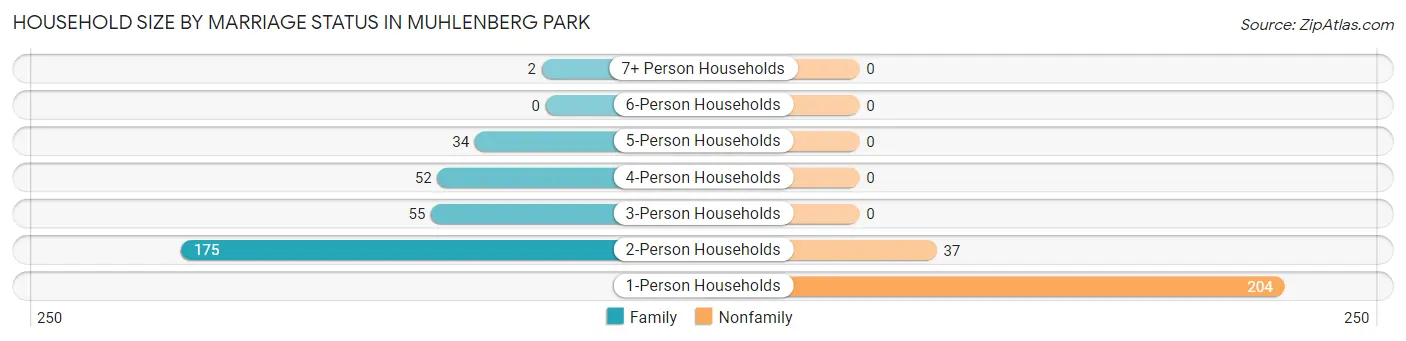
Household Size by Marriage Status in Muhlenberg Park
Out of a total of 559 households in Muhlenberg Park, 318 (56.9%) are family households, while 241 (43.1%) are nonfamily households. The most numerous type of family households are 2-person households, comprising 175, and the most common type of nonfamily households are 1-person households, comprising 204.
| Household Size | Family Households | Nonfamily Households |
| 1-Person Households | - | 204 (36.5%) |
| 2-Person Households | 175 (31.3%) | 37 (6.6%) |
| 3-Person Households | 55 (9.8%) | 0 (0.0%) |
| 4-Person Households | 52 (9.3%) | 0 (0.0%) |
| 5-Person Households | 34 (6.1%) | 0 (0.0%) |
| 6-Person Households | 0 (0.0%) | 0 (0.0%) |
| 7+ Person Households | 2 (0.4%) | 0 (0.0%) |
| Total | 318 (56.9%) | 241 (43.1%) |
Female Fertility in Muhlenberg Park
Fertility by Age in Muhlenberg Park
| Age Bracket | Women with Births | Births / 1,000 Women |
| 15 to 19 years | 0 (0.0%) | 0.0 |
| 20 to 34 years | 0 (0.0%) | 0.0 |
| 35 to 50 years | 0 (0.0%) | 0.0 |
| Total | 0 (0.0%) | 0.0 |
Fertility by Age by Marriage Status in Muhlenberg Park
| Age Bracket | Married | Unmarried |
| 15 to 19 years | 0 (0.0%) | 0 (0.0%) |
| 20 to 34 years | 0 (0.0%) | 0 (0.0%) |
| 35 to 50 years | 0 (0.0%) | 0 (0.0%) |
| Total | 0 (0.0%) | 0 (0.0%) |
Fertility by Education in Muhlenberg Park
| Educational Attainment | Women with Births | Births / 1,000 Women |
| Less than High School | 0 (0.0%) | 0.0 |
| High School Diploma | 0 (0.0%) | 0.0 |
| College or Associate's Degree | 0 (0.0%) | 0.0 |
| Bachelor's Degree | 0 (0.0%) | 0.0 |
| Graduate Degree | 0 (0.0%) | 0.0 |
| Total | 0 (0.0%) | 0.0 |
Fertility by Education by Marriage Status in Muhlenberg Park
| Educational Attainment | Married | Unmarried |
| Less than High School | 0 (0.0%) | 0 (0.0%) |
| High School Diploma | 0 (0.0%) | 0 (0.0%) |
| College or Associate's Degree | 0 (0.0%) | 0 (0.0%) |
| Bachelor's Degree | 0 (0.0%) | 0 (0.0%) |
| Graduate Degree | 0 (0.0%) | 0 (0.0%) |
| Total | 0 (0.0%) | 0 (0.0%) |
Employment Characteristics in Muhlenberg Park
Employment by Class of Employer in Muhlenberg Park
Among the 563 employed individuals in Muhlenberg Park, private company employees (398 | 70.7%), state government employees (88 | 15.6%), and self-employed (not incorporated) (34 | 6.0%) make up the most common classes of employment.
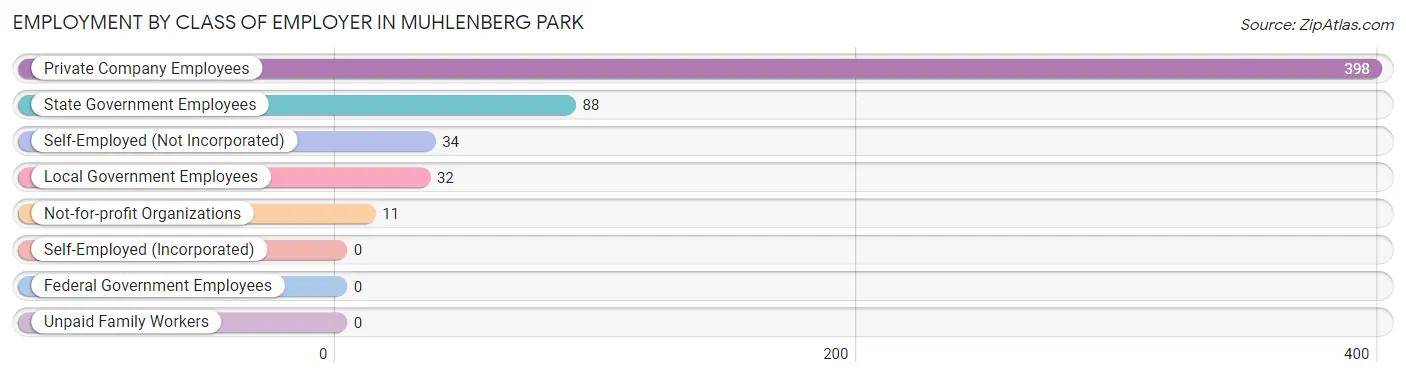
| Employer Class | # Employees | % Employees |
| Private Company Employees | 398 | 70.7% |
| Self-Employed (Incorporated) | 0 | 0.0% |
| Self-Employed (Not Incorporated) | 34 | 6.0% |
| Not-for-profit Organizations | 11 | 1.9% |
| Local Government Employees | 32 | 5.7% |
| State Government Employees | 88 | 15.6% |
| Federal Government Employees | 0 | 0.0% |
| Unpaid Family Workers | 0 | 0.0% |
| Total | 563 | 100.0% |
Employment Status by Age in Muhlenberg Park
According to the labor force statistics for Muhlenberg Park, out of the total population over 16 years of age (1,021), 56.1% or 573 individuals are in the labor force, with 1.7% or 10 of them unemployed. The age group with the highest labor force participation rate is 20 to 24 years, with 100.0% or 51 individuals in the labor force. Within the labor force, the 35 to 44 years age range has the highest percentage of unemployed individuals, with 15.4% or 10 of them being unemployed.
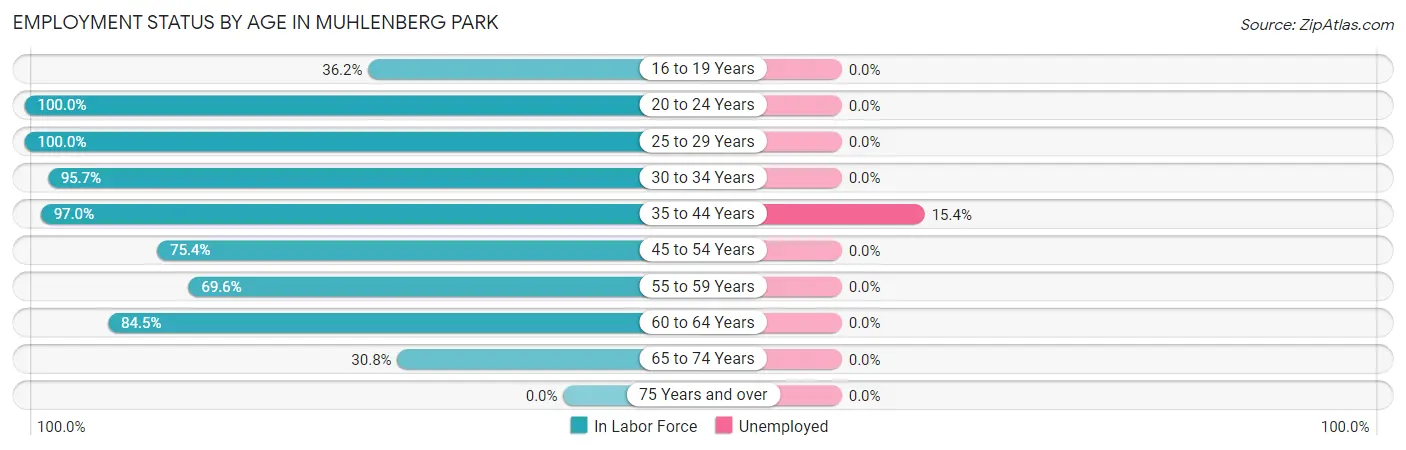
| Age Bracket | In Labor Force | Unemployed |
| 16 to 19 Years | 21 (36.2%) | 0 (0.0%) |
| 20 to 24 Years | 51 (100.0%) | 0 (0.0%) |
| 25 to 29 Years | 14 (100.0%) | 0 (0.0%) |
| 30 to 34 Years | 67 (95.7%) | 0 (0.0%) |
| 35 to 44 Years | 65 (97.0%) | 10 (15.4%) |
| 45 to 54 Years | 95 (75.4%) | 0 (0.0%) |
| 55 to 59 Years | 128 (69.6%) | 0 (0.0%) |
| 60 to 64 Years | 71 (84.5%) | 0 (0.0%) |
| 65 to 74 Years | 61 (30.8%) | 0 (0.0%) |
| 75 Years and over | 0 (0.0%) | 0 (0.0%) |
| Total | 573 (56.1%) | 10 (1.7%) |
Employment Status by Educational Attainment in Muhlenberg Park
According to labor force statistics for Muhlenberg Park, 80.7% of individuals (440) out of the total population between 25 and 64 years of age (545) are in the labor force, with 2.3% or 10 of them being unemployed. The group with the highest labor force participation rate are those with the educational attainment of bachelor's degree or higher, with 90.9% or 170 individuals in the labor force. Within the labor force, individuals with bachelor's degree or higher education have the highest percentage of unemployment, with 5.9% or 10 of them being unemployed.
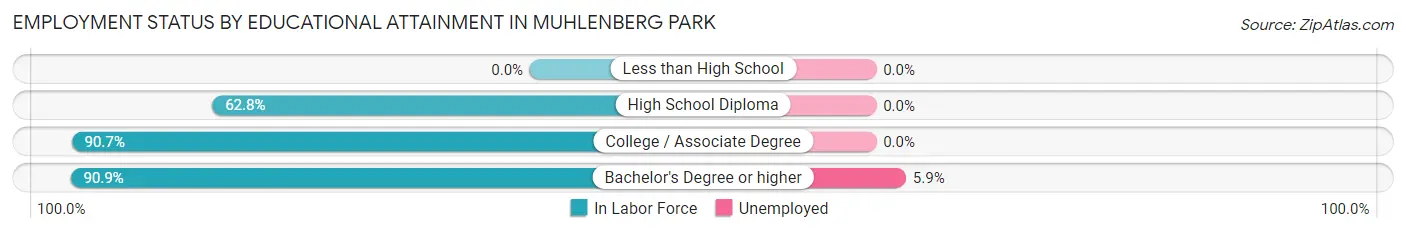
| Educational Attainment | In Labor Force | Unemployed |
| Less than High School | 0 (0.0%) | 0 (0.0%) |
| High School Diploma | 123 (62.8%) | 0 (0.0%) |
| College / Associate Degree | 147 (90.7%) | 0 (0.0%) |
| Bachelor's Degree or higher | 170 (90.9%) | 11 (5.9%) |
| Total | 440 (80.7%) | 13 (2.3%) |
Employment Occupations by Sex in Muhlenberg Park
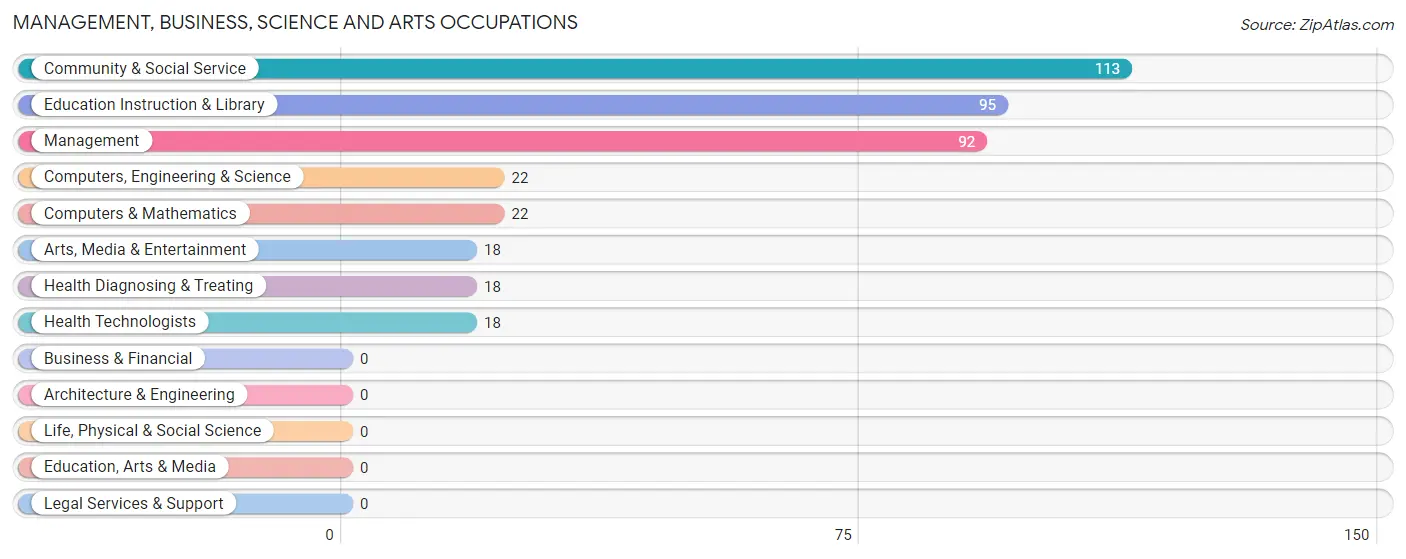
Management, Business, Science and Arts Occupations
The most common Management, Business, Science and Arts occupations in Muhlenberg Park are Community & Social Service (113 | 20.1%), Education Instruction & Library (95 | 16.9%), Management (92 | 16.3%), Computers, Engineering & Science (22 | 3.9%), and Computers & Mathematics (22 | 3.9%).
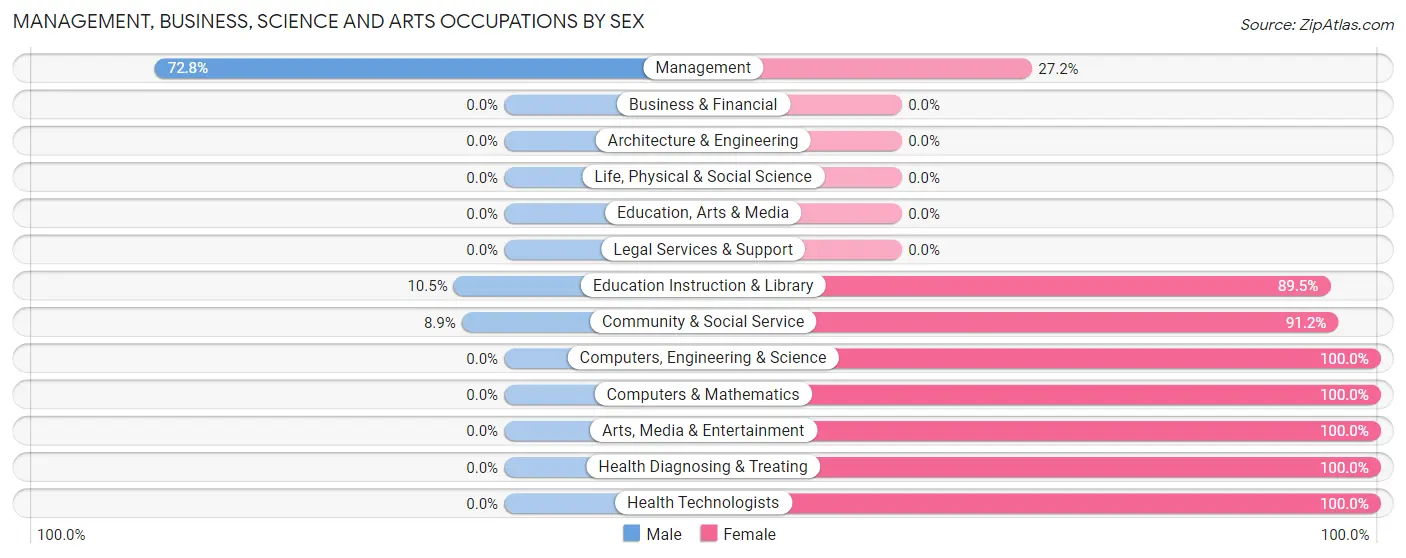
Management, Business, Science and Arts Occupations by Sex
Within the Management, Business, Science and Arts occupations in Muhlenberg Park, the most male-oriented occupations are Management (72.8%), Education Instruction & Library (10.5%), and Community & Social Service (8.8%), while the most female-oriented occupations are Computers, Engineering & Science (100.0%), Computers & Mathematics (100.0%), and Arts, Media & Entertainment (100.0%).
| Occupation | Male | Female |
| Management | 67 (72.8%) | 25 (27.2%) |
| Business & Financial | 0 (0.0%) | 0 (0.0%) |
| Computers, Engineering & Science | 0 (0.0%) | 22 (100.0%) |
| Computers & Mathematics | 0 (0.0%) | 22 (100.0%) |
| Architecture & Engineering | 0 (0.0%) | 0 (0.0%) |
| Life, Physical & Social Science | 0 (0.0%) | 0 (0.0%) |
| Community & Social Service | 10 (8.8%) | 103 (91.1%) |
| Education, Arts & Media | 0 (0.0%) | 0 (0.0%) |
| Legal Services & Support | 0 (0.0%) | 0 (0.0%) |
| Education Instruction & Library | 10 (10.5%) | 85 (89.5%) |
| Arts, Media & Entertainment | 0 (0.0%) | 18 (100.0%) |
| Health Diagnosing & Treating | 0 (0.0%) | 18 (100.0%) |
| Health Technologists | 0 (0.0%) | 18 (100.0%) |
| Total (Category) | 77 (31.4%) | 168 (68.6%) |
| Total (Overall) | 305 (54.2%) | 258 (45.8%) |
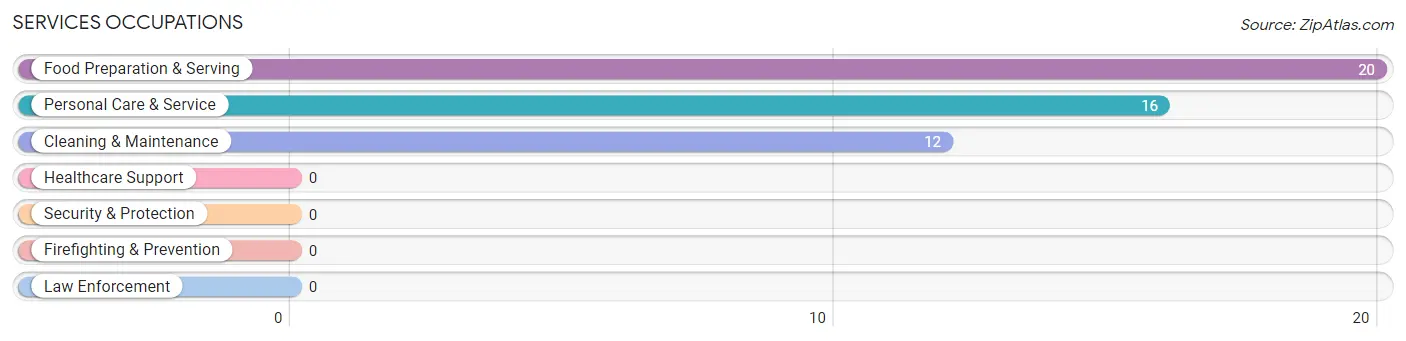
Services Occupations
The most common Services occupations in Muhlenberg Park are Food Preparation & Serving (20 | 3.5%), Personal Care & Service (16 | 2.8%), and Cleaning & Maintenance (12 | 2.1%).
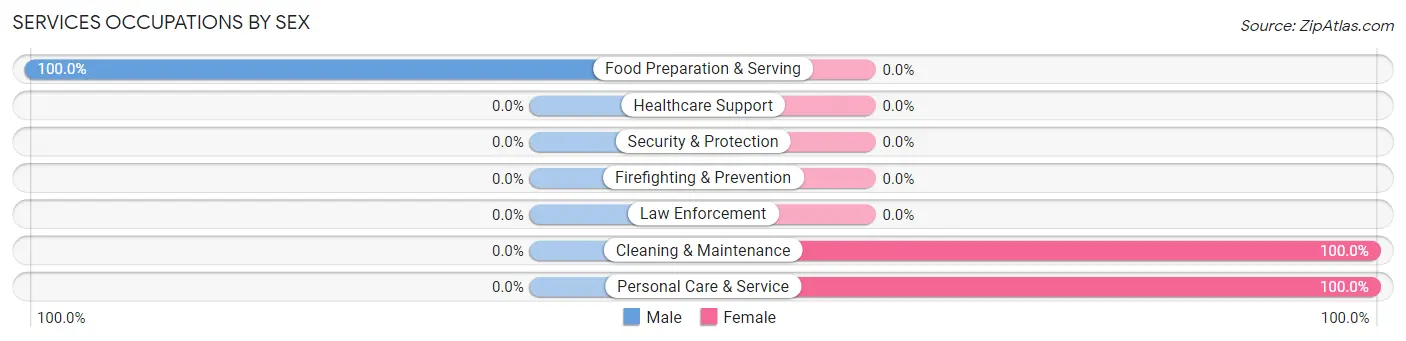
Services Occupations by Sex
| Occupation | Male | Female |
| Healthcare Support | 0 (0.0%) | 0 (0.0%) |
| Security & Protection | 0 (0.0%) | 0 (0.0%) |
| Firefighting & Prevention | 0 (0.0%) | 0 (0.0%) |
| Law Enforcement | 0 (0.0%) | 0 (0.0%) |
| Food Preparation & Serving | 20 (100.0%) | 0 (0.0%) |
| Cleaning & Maintenance | 0 (0.0%) | 12 (100.0%) |
| Personal Care & Service | 0 (0.0%) | 16 (100.0%) |
| Total (Category) | 20 (41.7%) | 28 (58.3%) |
| Total (Overall) | 305 (54.2%) | 258 (45.8%) |
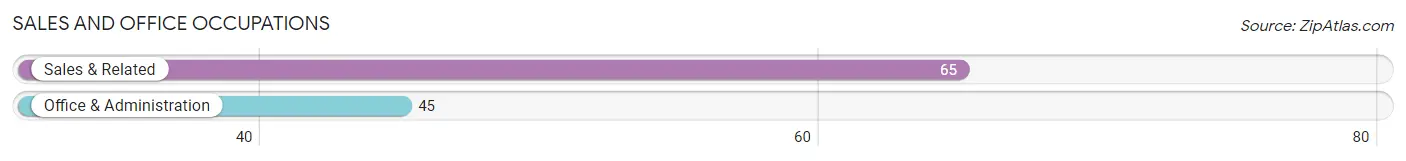
Sales and Office Occupations
The most common Sales and Office occupations in Muhlenberg Park are Sales & Related (65 | 11.6%), and Office & Administration (45 | 8.0%).
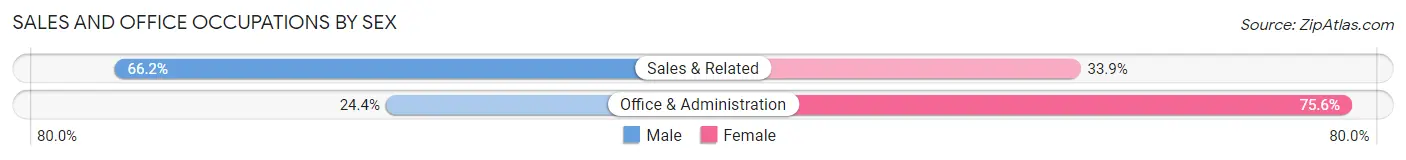
Sales and Office Occupations by Sex
| Occupation | Male | Female |
| Sales & Related | 43 (66.1%) | 22 (33.9%) |
| Office & Administration | 11 (24.4%) | 34 (75.6%) |
| Total (Category) | 54 (49.1%) | 56 (50.9%) |
| Total (Overall) | 305 (54.2%) | 258 (45.8%) |
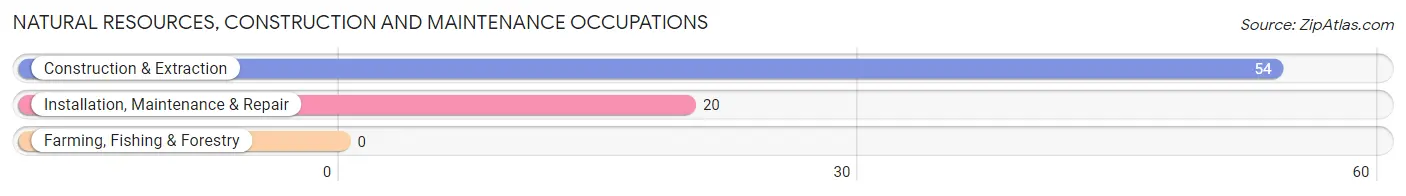
Natural Resources, Construction and Maintenance Occupations
The most common Natural Resources, Construction and Maintenance occupations in Muhlenberg Park are Construction & Extraction (54 | 9.6%), and Installation, Maintenance & Repair (20 | 3.5%).
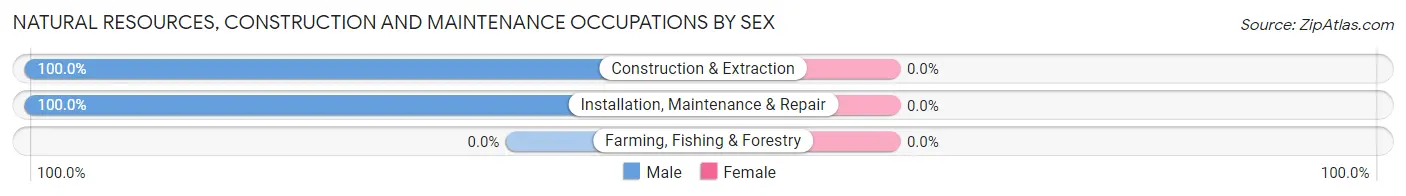
Natural Resources, Construction and Maintenance Occupations by Sex
| Occupation | Male | Female |
| Farming, Fishing & Forestry | 0 (0.0%) | 0 (0.0%) |
| Construction & Extraction | 54 (100.0%) | 0 (0.0%) |
| Installation, Maintenance & Repair | 20 (100.0%) | 0 (0.0%) |
| Total (Category) | 74 (100.0%) | 0 (0.0%) |
| Total (Overall) | 305 (54.2%) | 258 (45.8%) |
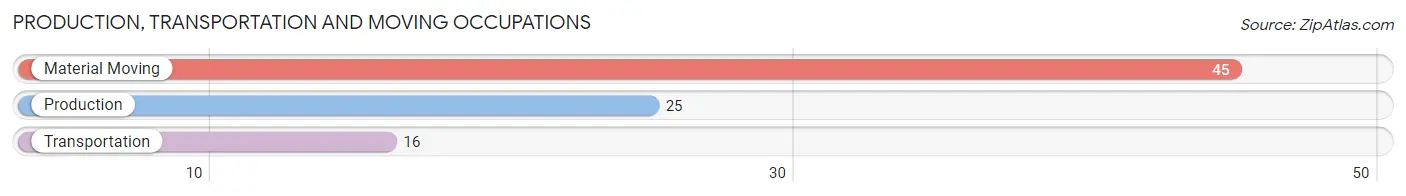
Production, Transportation and Moving Occupations
The most common Production, Transportation and Moving occupations in Muhlenberg Park are Material Moving (45 | 8.0%), Production (25 | 4.4%), and Transportation (16 | 2.8%).
Production, Transportation and Moving Occupations by Sex
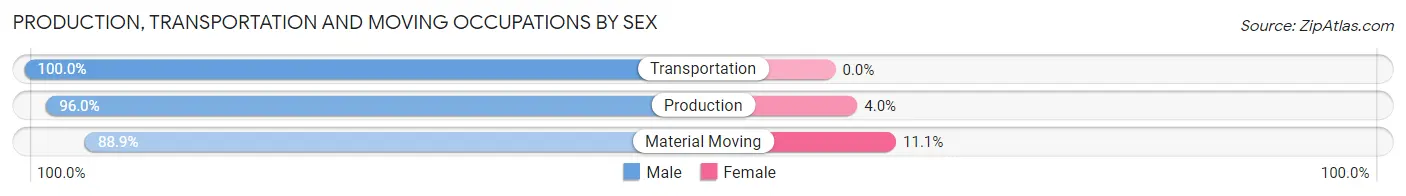
| Occupation | Male | Female |
| Production | 24 (96.0%) | 1 (4.0%) |
| Transportation | 16 (100.0%) | 0 (0.0%) |
| Material Moving | 40 (88.9%) | 5 (11.1%) |
| Total (Category) | 80 (93.0%) | 6 (7.0%) |
| Total (Overall) | 305 (54.2%) | 258 (45.8%) |
Employment Industries by Sex in Muhlenberg Park
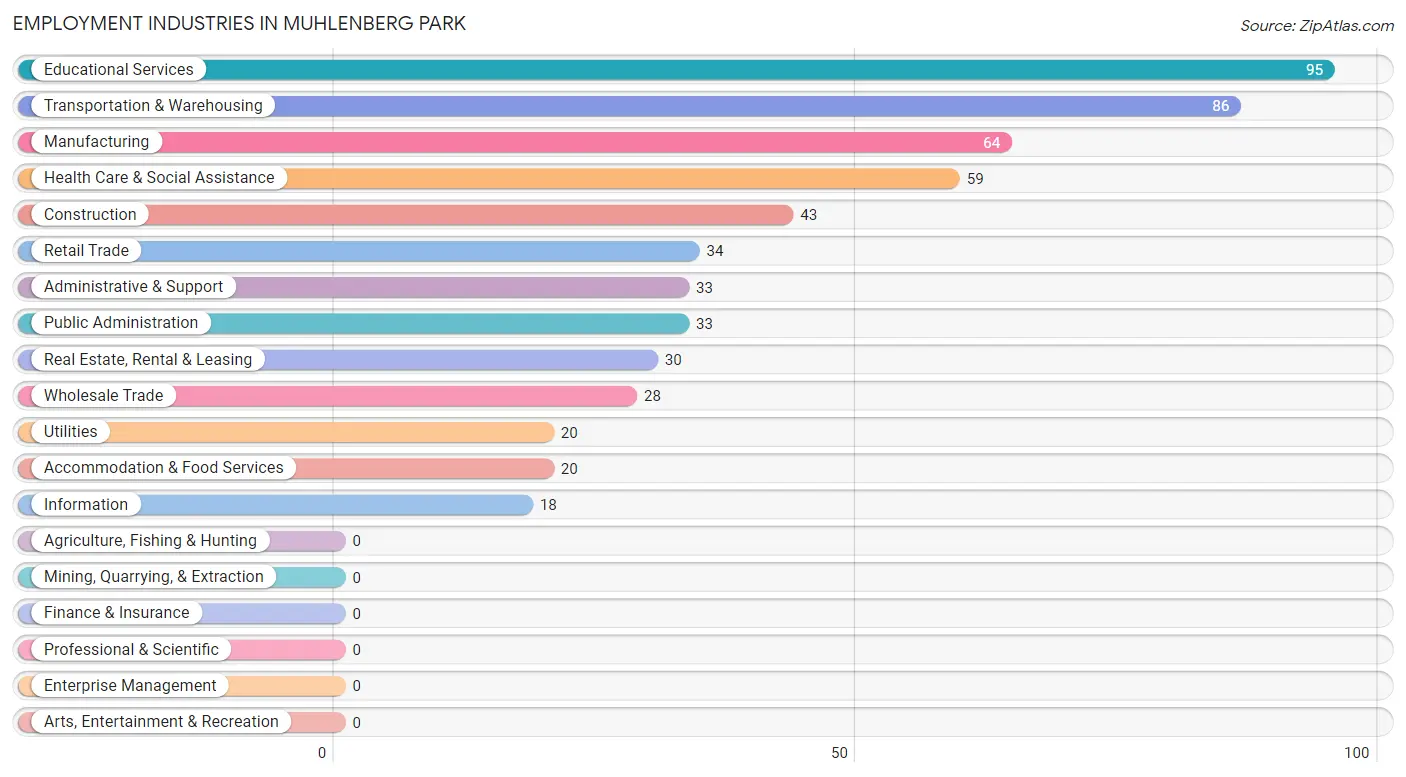
Employment Industries in Muhlenberg Park
The major employment industries in Muhlenberg Park include Educational Services (95 | 16.9%), Transportation & Warehousing (86 | 15.3%), Manufacturing (64 | 11.4%), Health Care & Social Assistance (59 | 10.5%), and Construction (43 | 7.6%).
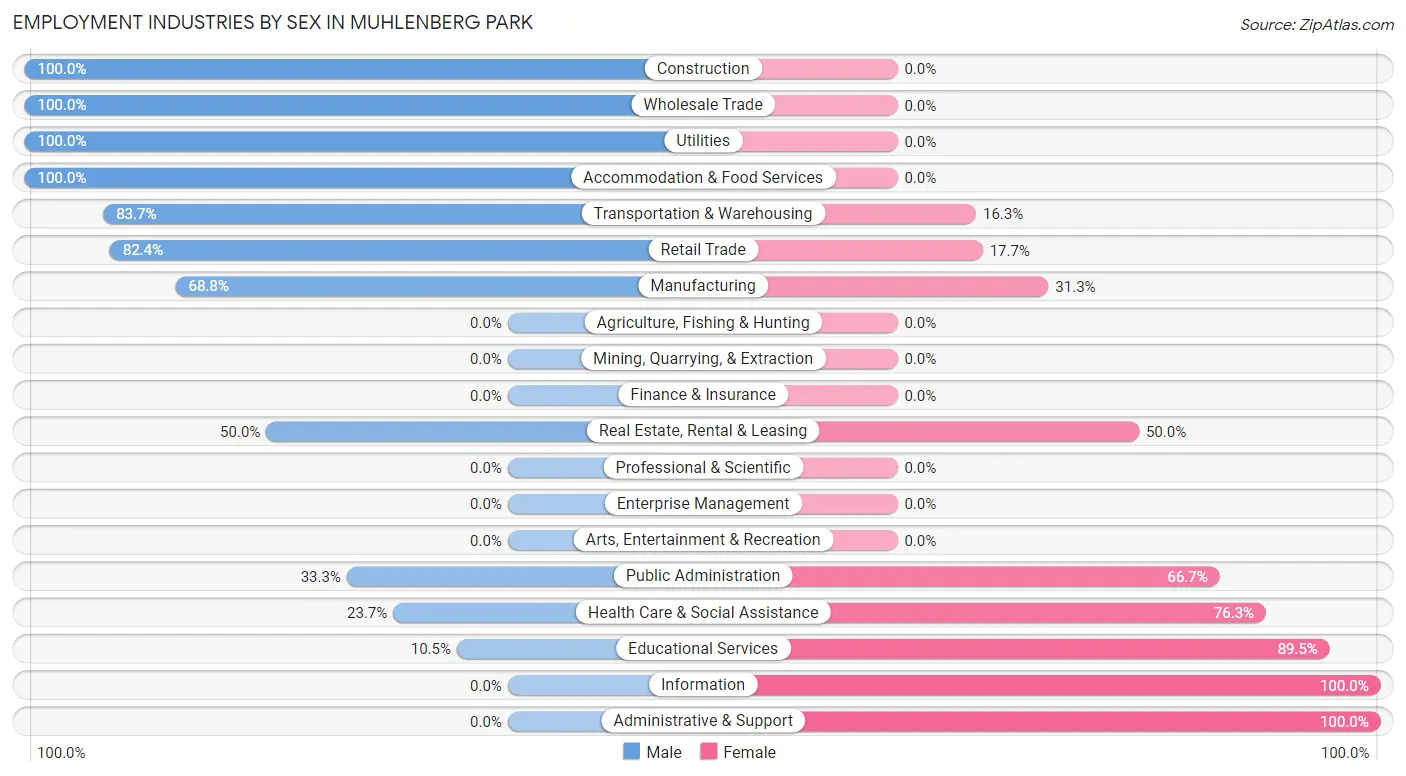
Employment Industries by Sex in Muhlenberg Park
The Muhlenberg Park industries that see more men than women are Construction (100.0%), Wholesale Trade (100.0%), and Utilities (100.0%), whereas the industries that tend to have a higher number of women are Information (100.0%), Administrative & Support (100.0%), and Educational Services (89.5%).
| Industry | Male | Female |
| Agriculture, Fishing & Hunting | 0 (0.0%) | 0 (0.0%) |
| Mining, Quarrying, & Extraction | 0 (0.0%) | 0 (0.0%) |
| Construction | 43 (100.0%) | 0 (0.0%) |
| Manufacturing | 44 (68.8%) | 20 (31.2%) |
| Wholesale Trade | 28 (100.0%) | 0 (0.0%) |
| Retail Trade | 28 (82.4%) | 6 (17.6%) |
| Transportation & Warehousing | 72 (83.7%) | 14 (16.3%) |
| Utilities | 20 (100.0%) | 0 (0.0%) |
| Information | 0 (0.0%) | 18 (100.0%) |
| Finance & Insurance | 0 (0.0%) | 0 (0.0%) |
| Real Estate, Rental & Leasing | 15 (50.0%) | 15 (50.0%) |
| Professional & Scientific | 0 (0.0%) | 0 (0.0%) |
| Enterprise Management | 0 (0.0%) | 0 (0.0%) |
| Administrative & Support | 0 (0.0%) | 33 (100.0%) |
| Educational Services | 10 (10.5%) | 85 (89.5%) |
| Health Care & Social Assistance | 14 (23.7%) | 45 (76.3%) |
| Arts, Entertainment & Recreation | 0 (0.0%) | 0 (0.0%) |
| Accommodation & Food Services | 20 (100.0%) | 0 (0.0%) |
| Public Administration | 11 (33.3%) | 22 (66.7%) |
| Total | 305 (54.2%) | 258 (45.8%) |
Education in Muhlenberg Park
School Enrollment in Muhlenberg Park
The most common levels of schooling among the 202 students in Muhlenberg Park are high school (108 | 53.5%), middle school (50 | 24.7%), and college / undergraduate (20 | 9.9%).
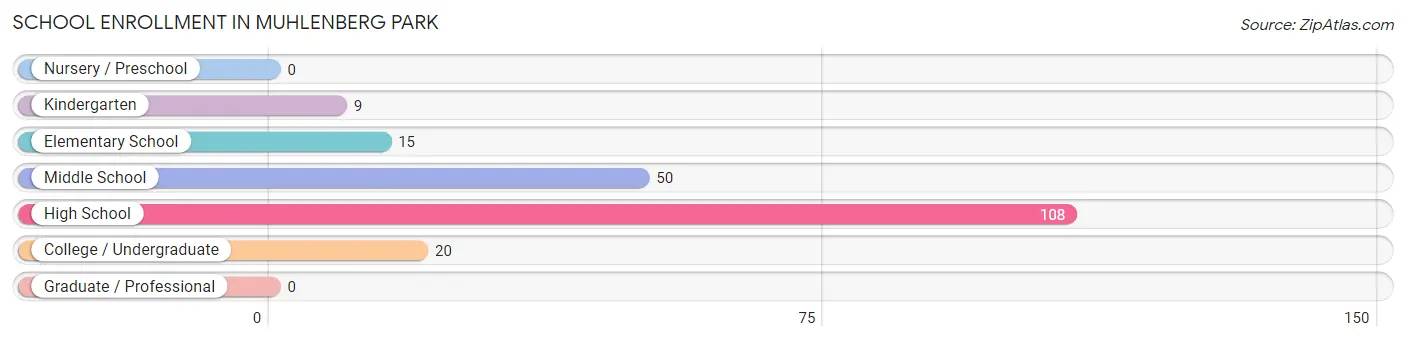
| School Level | # Students | % Students |
| Nursery / Preschool | 0 | 0.0% |
| Kindergarten | 9 | 4.5% |
| Elementary School | 15 | 7.4% |
| Middle School | 50 | 24.7% |
| High School | 108 | 53.5% |
| College / Undergraduate | 20 | 9.9% |
| Graduate / Professional | 0 | 0.0% |
| Total | 202 | 100.0% |
School Enrollment by Age by Funding Source in Muhlenberg Park
Out of a total of 202 students who are enrolled in schools in Muhlenberg Park, 43 (21.3%) attend a private institution, while the remaining 159 (78.7%) are enrolled in public schools. The age group of 5 to 9 year old has the highest likelihood of being enrolled in private schools, with 15 (62.5% in the age bracket) enrolled. Conversely, the age group of 18 to 19 year olds has the lowest likelihood of being enrolled in a private school, with 3 (100.0% in the age bracket) attending a public institution.
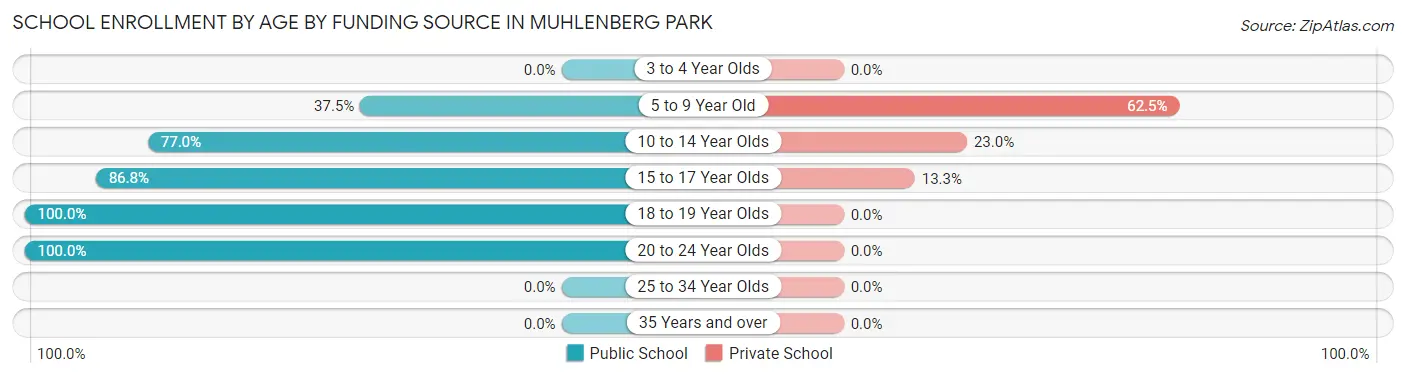
| Age Bracket | Public School | Private School |
| 3 to 4 Year Olds | 0 (0.0%) | 0 (0.0%) |
| 5 to 9 Year Old | 9 (37.5%) | 15 (62.5%) |
| 10 to 14 Year Olds | 57 (77.0%) | 17 (23.0%) |
| 15 to 17 Year Olds | 72 (86.8%) | 11 (13.3%) |
| 18 to 19 Year Olds | 3 (100.0%) | 0 (0.0%) |
| 20 to 24 Year Olds | 18 (100.0%) | 0 (0.0%) |
| 25 to 34 Year Olds | 0 (0.0%) | 0 (0.0%) |
| 35 Years and over | 0 (0.0%) | 0 (0.0%) |
| Total | 159 (78.7%) | 43 (21.3%) |
Educational Attainment by Field of Study in Muhlenberg Park
Visual & performing arts (80 | 22.5%), bio, nature & agricultural (64 | 18.0%), education (61 | 17.2%), literature & languages (55 | 15.5%), and business (47 | 13.2%) are the most common fields of study among 355 individuals in Muhlenberg Park who have obtained a bachelor's degree or higher.
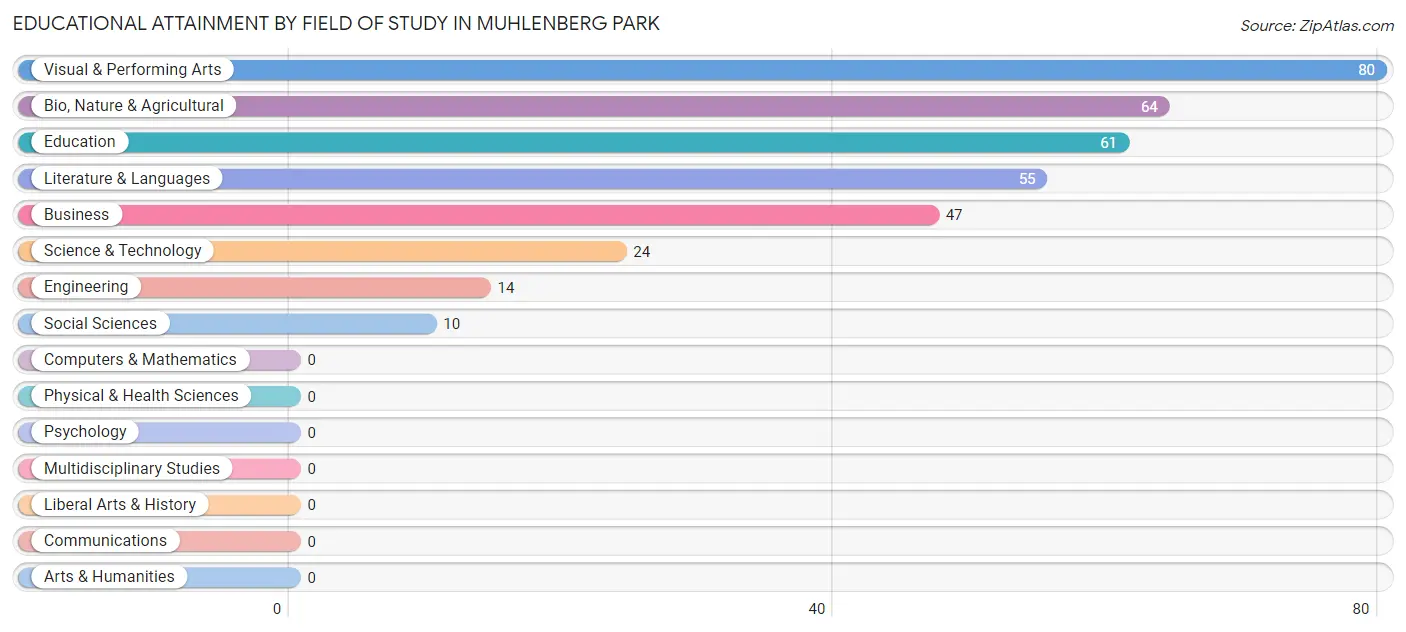
| Field of Study | # Graduates | % Graduates |
| Computers & Mathematics | 0 | 0.0% |
| Bio, Nature & Agricultural | 64 | 18.0% |
| Physical & Health Sciences | 0 | 0.0% |
| Psychology | 0 | 0.0% |
| Social Sciences | 10 | 2.8% |
| Engineering | 14 | 3.9% |
| Multidisciplinary Studies | 0 | 0.0% |
| Science & Technology | 24 | 6.8% |
| Business | 47 | 13.2% |
| Education | 61 | 17.2% |
| Literature & Languages | 55 | 15.5% |
| Liberal Arts & History | 0 | 0.0% |
| Visual & Performing Arts | 80 | 22.5% |
| Communications | 0 | 0.0% |
| Arts & Humanities | 0 | 0.0% |
| Total | 355 | 100.0% |
Transportation & Commute in Muhlenberg Park
Vehicle Availability by Sex in Muhlenberg Park
The most prevalent vehicle ownership categories in Muhlenberg Park are males with 1 vehicle (105, accounting for 34.4%) and females with 1 vehicle (65, making up 40.7%).
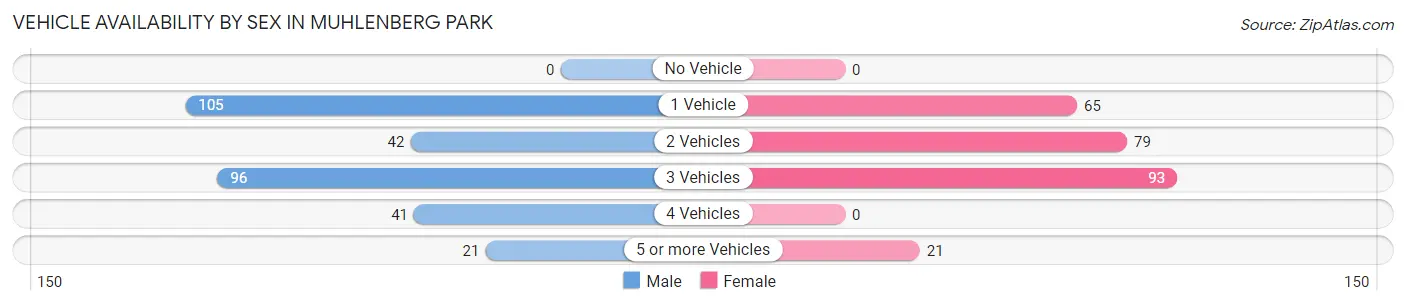
| Vehicles Available | Male | Female |
| No Vehicle | 0 (0.0%) | 0 (0.0%) |
| 1 Vehicle | 105 (34.4%) | 65 (25.2%) |
| 2 Vehicles | 42 (13.8%) | 79 (30.6%) |
| 3 Vehicles | 96 (31.5%) | 93 (36.0%) |
| 4 Vehicles | 41 (13.4%) | 0 (0.0%) |
| 5 or more Vehicles | 21 (6.9%) | 21 (8.1%) |
| Total | 305 (100.0%) | 258 (100.0%) |
Commute Time in Muhlenberg Park
The most frequently occuring commute durations in Muhlenberg Park are 5 to 9 minutes (148 commuters, 27.7%), 15 to 19 minutes (115 commuters, 21.5%), and 10 to 14 minutes (87 commuters, 16.3%).
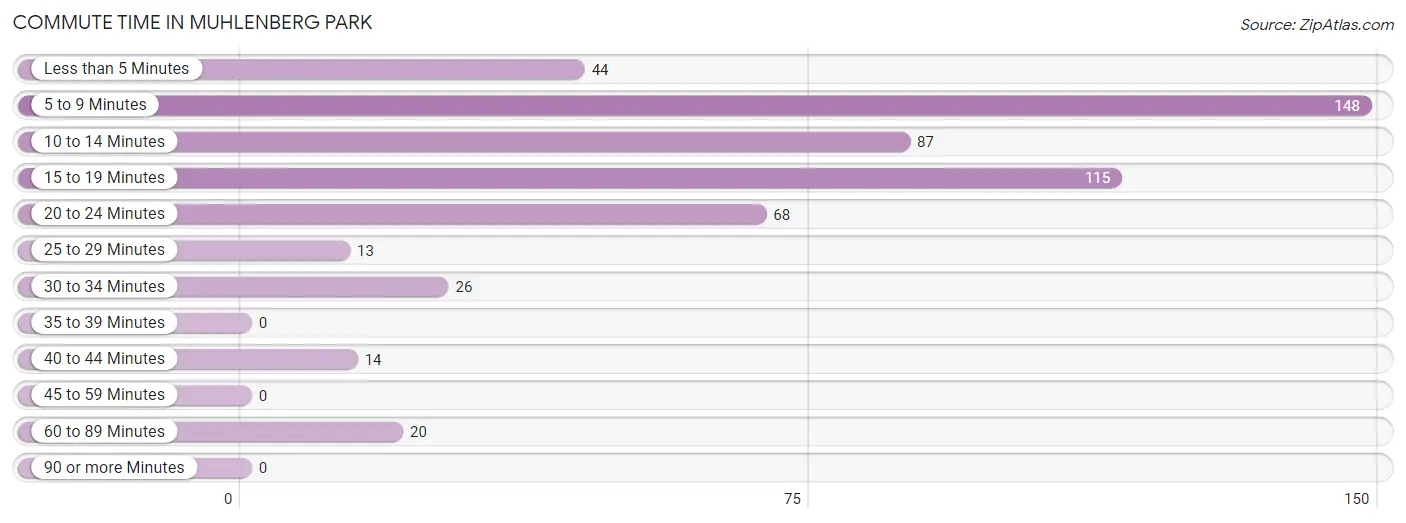
| Commute Time | # Commuters | % Commuters |
| Less than 5 Minutes | 44 | 8.2% |
| 5 to 9 Minutes | 148 | 27.7% |
| 10 to 14 Minutes | 87 | 16.3% |
| 15 to 19 Minutes | 115 | 21.5% |
| 20 to 24 Minutes | 68 | 12.7% |
| 25 to 29 Minutes | 13 | 2.4% |
| 30 to 34 Minutes | 26 | 4.9% |
| 35 to 39 Minutes | 0 | 0.0% |
| 40 to 44 Minutes | 14 | 2.6% |
| 45 to 59 Minutes | 0 | 0.0% |
| 60 to 89 Minutes | 20 | 3.7% |
| 90 or more Minutes | 0 | 0.0% |
Commute Time by Sex in Muhlenberg Park
The most common commute times in Muhlenberg Park are 5 to 9 minutes (78 commuters, 26.4%) for males and 15 to 19 minutes (87 commuters, 36.2%) for females.
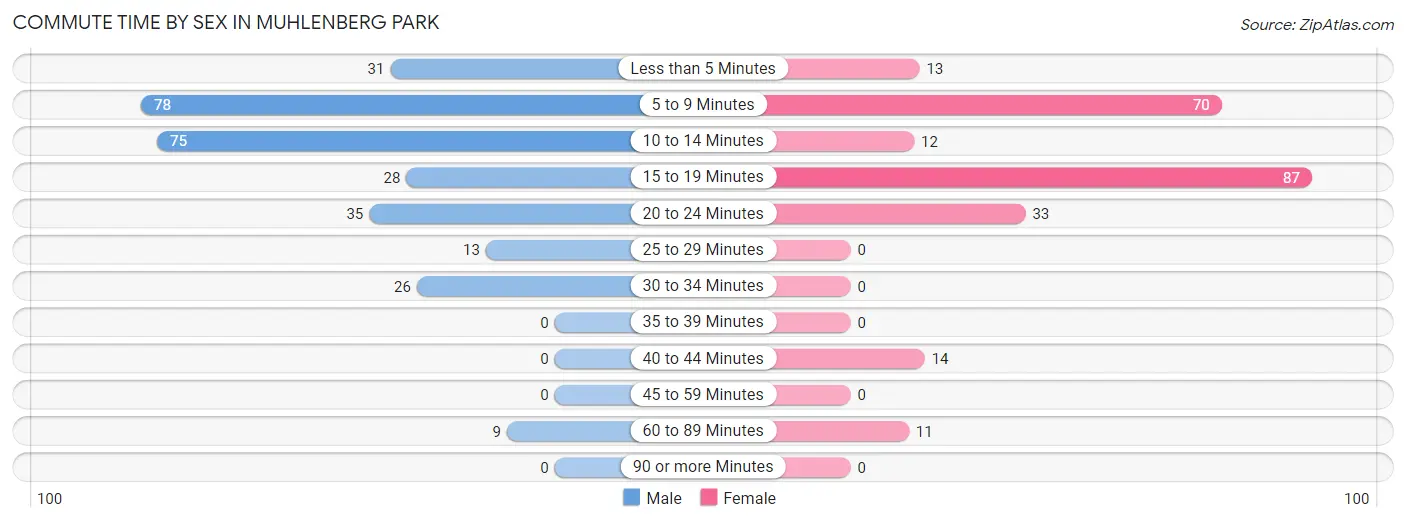
| Commute Time | Male | Female |
| Less than 5 Minutes | 31 (10.5%) | 13 (5.4%) |
| 5 to 9 Minutes | 78 (26.4%) | 70 (29.2%) |
| 10 to 14 Minutes | 75 (25.4%) | 12 (5.0%) |
| 15 to 19 Minutes | 28 (9.5%) | 87 (36.2%) |
| 20 to 24 Minutes | 35 (11.9%) | 33 (13.8%) |
| 25 to 29 Minutes | 13 (4.4%) | 0 (0.0%) |
| 30 to 34 Minutes | 26 (8.8%) | 0 (0.0%) |
| 35 to 39 Minutes | 0 (0.0%) | 0 (0.0%) |
| 40 to 44 Minutes | 0 (0.0%) | 14 (5.8%) |
| 45 to 59 Minutes | 0 (0.0%) | 0 (0.0%) |
| 60 to 89 Minutes | 9 (3.0%) | 11 (4.6%) |
| 90 or more Minutes | 0 (0.0%) | 0 (0.0%) |
Time of Departure to Work by Sex in Muhlenberg Park
The most frequent times of departure to work in Muhlenberg Park are 7:30 AM to 7:59 AM (68, 23.1%) for males and 10:00 AM to 10:59 AM (65, 27.1%) for females.
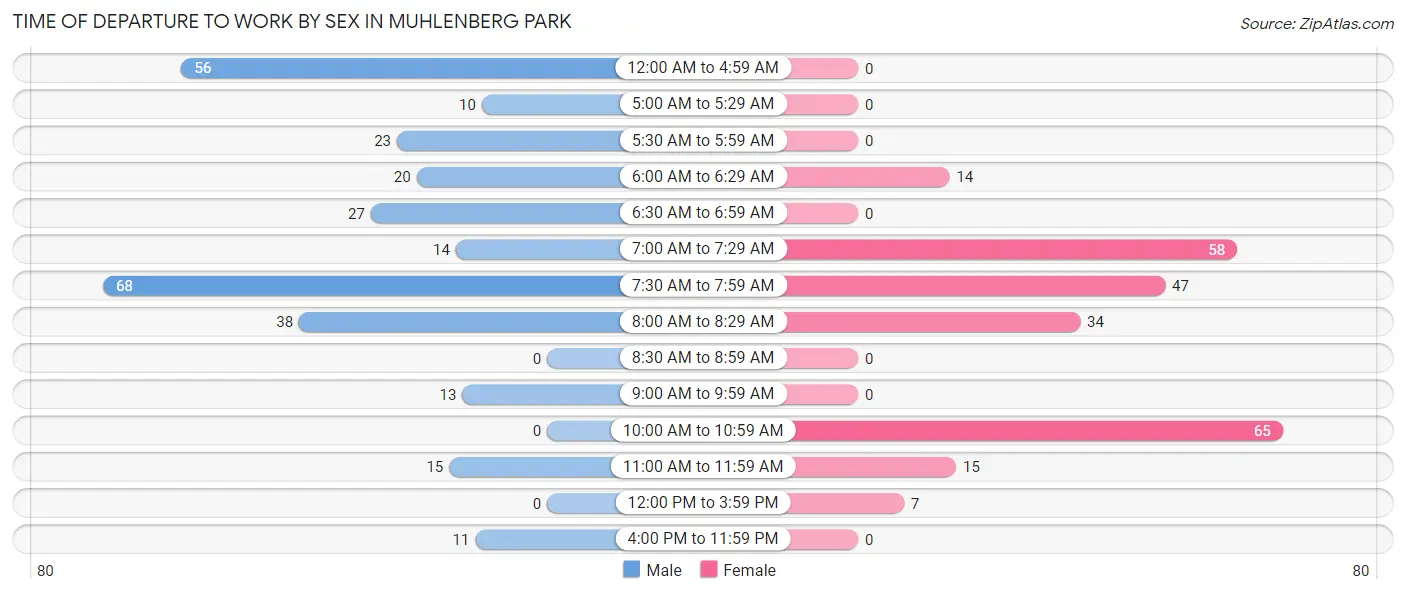
| Time of Departure | Male | Female |
| 12:00 AM to 4:59 AM | 56 (19.0%) | 0 (0.0%) |
| 5:00 AM to 5:29 AM | 10 (3.4%) | 0 (0.0%) |
| 5:30 AM to 5:59 AM | 23 (7.8%) | 0 (0.0%) |
| 6:00 AM to 6:29 AM | 20 (6.8%) | 14 (5.8%) |
| 6:30 AM to 6:59 AM | 27 (9.1%) | 0 (0.0%) |
| 7:00 AM to 7:29 AM | 14 (4.8%) | 58 (24.2%) |
| 7:30 AM to 7:59 AM | 68 (23.1%) | 47 (19.6%) |
| 8:00 AM to 8:29 AM | 38 (12.9%) | 34 (14.2%) |
| 8:30 AM to 8:59 AM | 0 (0.0%) | 0 (0.0%) |
| 9:00 AM to 9:59 AM | 13 (4.4%) | 0 (0.0%) |
| 10:00 AM to 10:59 AM | 0 (0.0%) | 65 (27.1%) |
| 11:00 AM to 11:59 AM | 15 (5.1%) | 15 (6.2%) |
| 12:00 PM to 3:59 PM | 0 (0.0%) | 7 (2.9%) |
| 4:00 PM to 11:59 PM | 11 (3.7%) | 0 (0.0%) |
| Total | 295 (100.0%) | 240 (100.0%) |
Housing Occupancy in Muhlenberg Park
Occupancy by Ownership in Muhlenberg Park
Of the total 559 dwellings in Muhlenberg Park, owner-occupied units account for 545 (97.5%), while renter-occupied units make up 14 (2.5%).
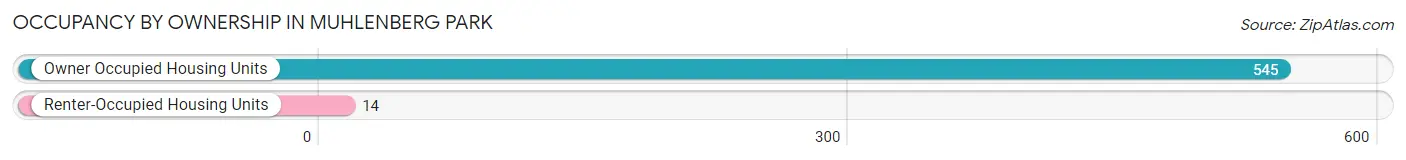
| Occupancy | # Housing Units | % Housing Units |
| Owner Occupied Housing Units | 545 | 97.5% |
| Renter-Occupied Housing Units | 14 | 2.5% |
| Total Occupied Housing Units | 559 | 100.0% |
Occupancy by Household Size in Muhlenberg Park
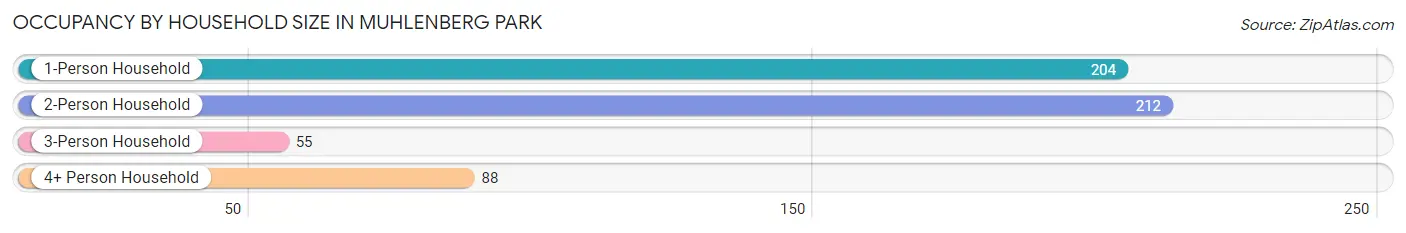
| Household Size | # Housing Units | % Housing Units |
| 1-Person Household | 204 | 36.5% |
| 2-Person Household | 212 | 37.9% |
| 3-Person Household | 55 | 9.8% |
| 4+ Person Household | 88 | 15.7% |
| Total Housing Units | 559 | 100.0% |
Occupancy by Ownership by Household Size in Muhlenberg Park
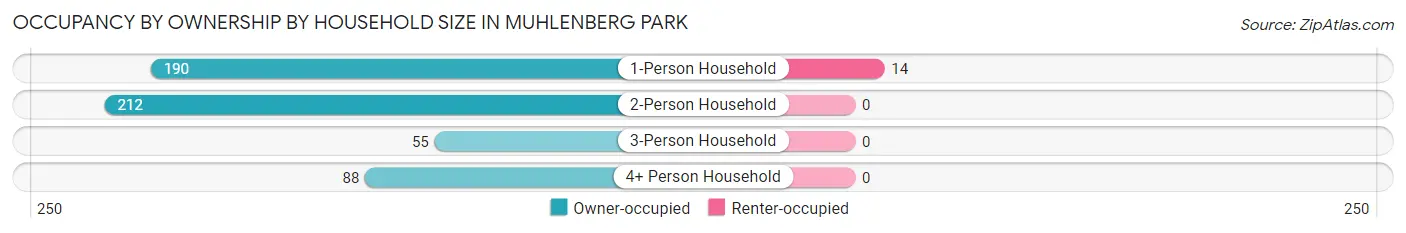
| Household Size | Owner-occupied | Renter-occupied |
| 1-Person Household | 190 (93.1%) | 14 (6.9%) |
| 2-Person Household | 212 (100.0%) | 0 (0.0%) |
| 3-Person Household | 55 (100.0%) | 0 (0.0%) |
| 4+ Person Household | 88 (100.0%) | 0 (0.0%) |
| Total Housing Units | 545 (97.5%) | 14 (2.5%) |
Occupancy by Educational Attainment in Muhlenberg Park
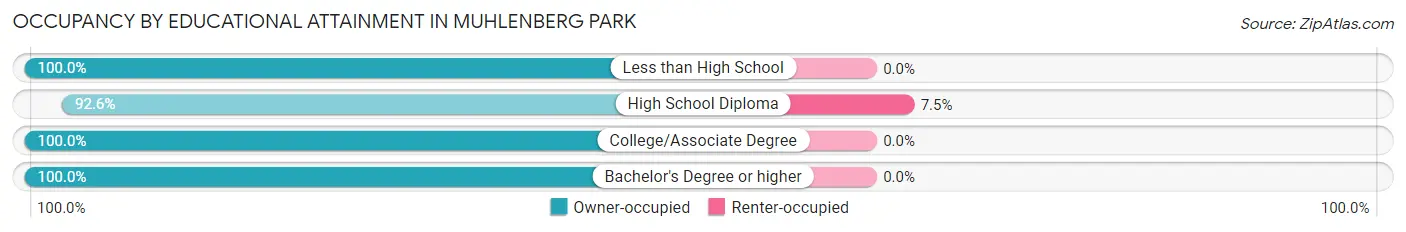
| Household Size | Owner-occupied | Renter-occupied |
| Less than High School | 38 (100.0%) | 0 (0.0%) |
| High School Diploma | 174 (92.5%) | 14 (7.4%) |
| College/Associate Degree | 175 (100.0%) | 0 (0.0%) |
| Bachelor's Degree or higher | 158 (100.0%) | 0 (0.0%) |
Occupancy by Age of Householder in Muhlenberg Park
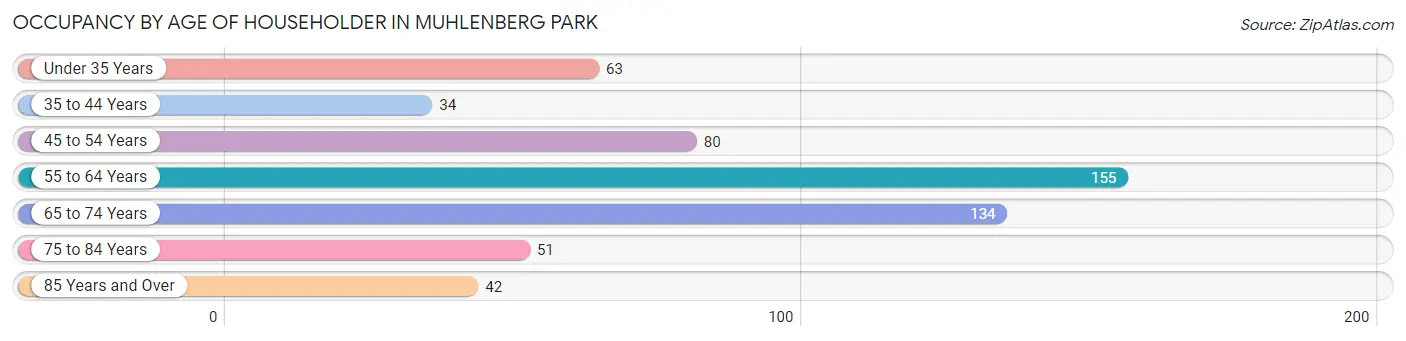
| Age Bracket | # Households | % Households |
| Under 35 Years | 63 | 11.3% |
| 35 to 44 Years | 34 | 6.1% |
| 45 to 54 Years | 80 | 14.3% |
| 55 to 64 Years | 155 | 27.7% |
| 65 to 74 Years | 134 | 24.0% |
| 75 to 84 Years | 51 | 9.1% |
| 85 Years and Over | 42 | 7.5% |
| Total | 559 | 100.0% |
Housing Finances in Muhlenberg Park
Median Income by Occupancy in Muhlenberg Park
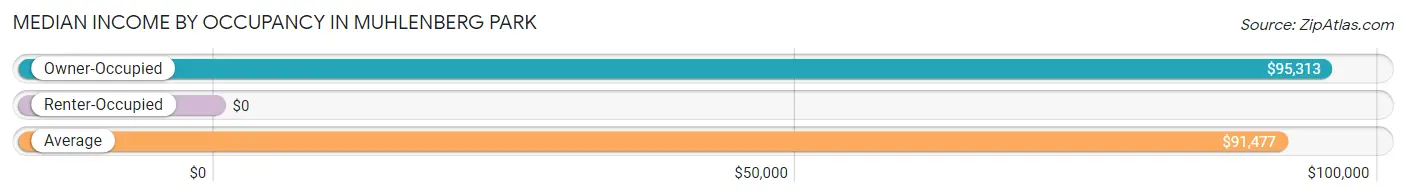
| Occupancy Type | # Households | Median Income |
| Owner-Occupied | 545 (97.5%) | $95,313 |
| Renter-Occupied | 14 (2.5%) | $0 |
| Average | 559 (100.0%) | $91,477 |
Occupancy by Householder Income Bracket in Muhlenberg Park
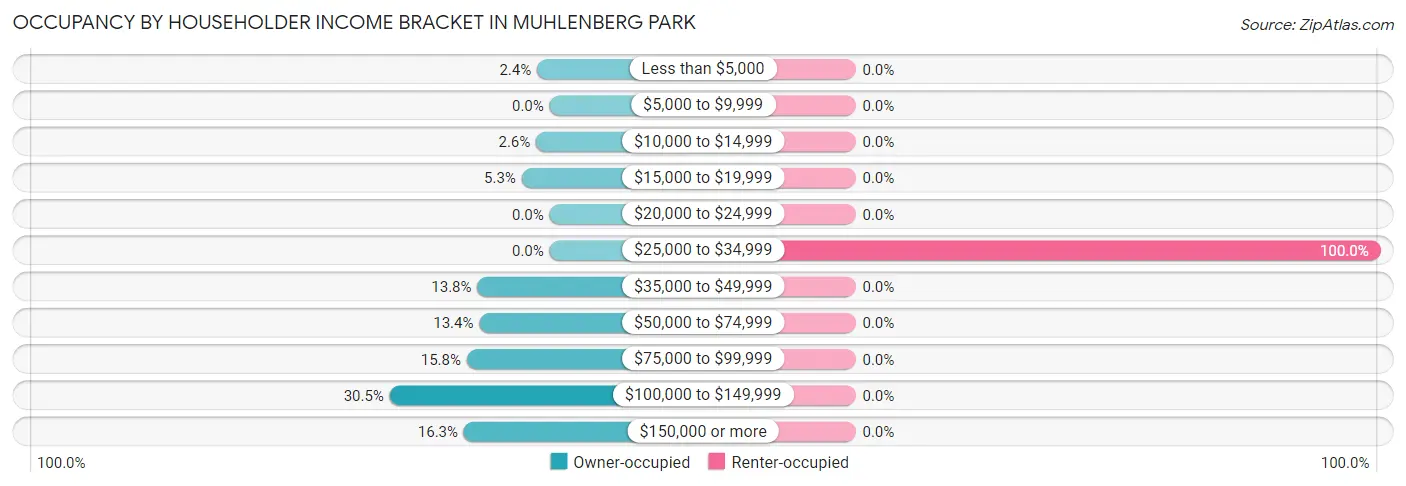
| Income Bracket | Owner-occupied | Renter-occupied |
| Less than $5,000 | 13 (2.4%) | 0 (0.0%) |
| $5,000 to $9,999 | 0 (0.0%) | 0 (0.0%) |
| $10,000 to $14,999 | 14 (2.6%) | 0 (0.0%) |
| $15,000 to $19,999 | 29 (5.3%) | 0 (0.0%) |
| $20,000 to $24,999 | 0 (0.0%) | 0 (0.0%) |
| $25,000 to $34,999 | 0 (0.0%) | 14 (100.0%) |
| $35,000 to $49,999 | 75 (13.8%) | 0 (0.0%) |
| $50,000 to $74,999 | 73 (13.4%) | 0 (0.0%) |
| $75,000 to $99,999 | 86 (15.8%) | 0 (0.0%) |
| $100,000 to $149,999 | 166 (30.5%) | 0 (0.0%) |
| $150,000 or more | 89 (16.3%) | 0 (0.0%) |
| Total | 545 (100.0%) | 14 (100.0%) |
Monthly Housing Cost Tiers in Muhlenberg Park
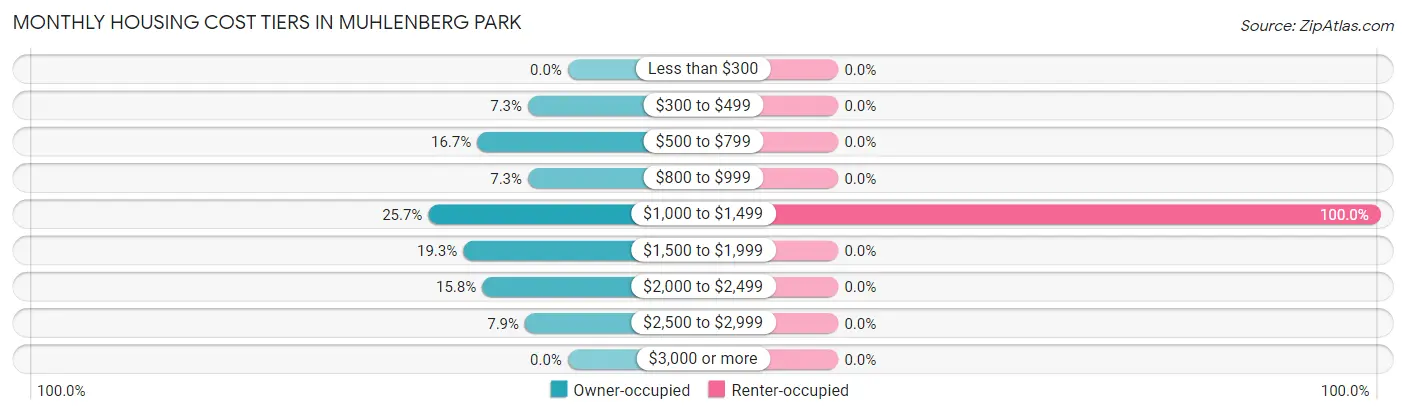
| Monthly Cost | Owner-occupied | Renter-occupied |
| Less than $300 | 0 (0.0%) | 0 (0.0%) |
| $300 to $499 | 40 (7.3%) | 0 (0.0%) |
| $500 to $799 | 91 (16.7%) | 0 (0.0%) |
| $800 to $999 | 40 (7.3%) | 0 (0.0%) |
| $1,000 to $1,499 | 140 (25.7%) | 14 (100.0%) |
| $1,500 to $1,999 | 105 (19.3%) | 0 (0.0%) |
| $2,000 to $2,499 | 86 (15.8%) | 0 (0.0%) |
| $2,500 to $2,999 | 43 (7.9%) | 0 (0.0%) |
| $3,000 or more | 0 (0.0%) | 0 (0.0%) |
| Total | 545 (100.0%) | 14 (100.0%) |
Physical Housing Characteristics in Muhlenberg Park
Housing Structures in Muhlenberg Park
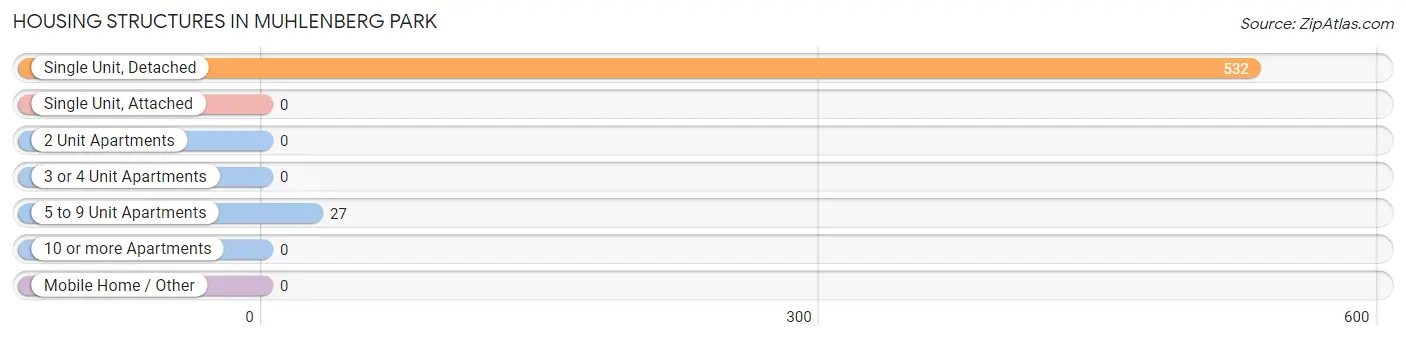
| Structure Type | # Housing Units | % Housing Units |
| Single Unit, Detached | 532 | 95.2% |
| Single Unit, Attached | 0 | 0.0% |
| 2 Unit Apartments | 0 | 0.0% |
| 3 or 4 Unit Apartments | 0 | 0.0% |
| 5 to 9 Unit Apartments | 27 | 4.8% |
| 10 or more Apartments | 0 | 0.0% |
| Mobile Home / Other | 0 | 0.0% |
| Total | 559 | 100.0% |
Housing Structures by Occupancy in Muhlenberg Park
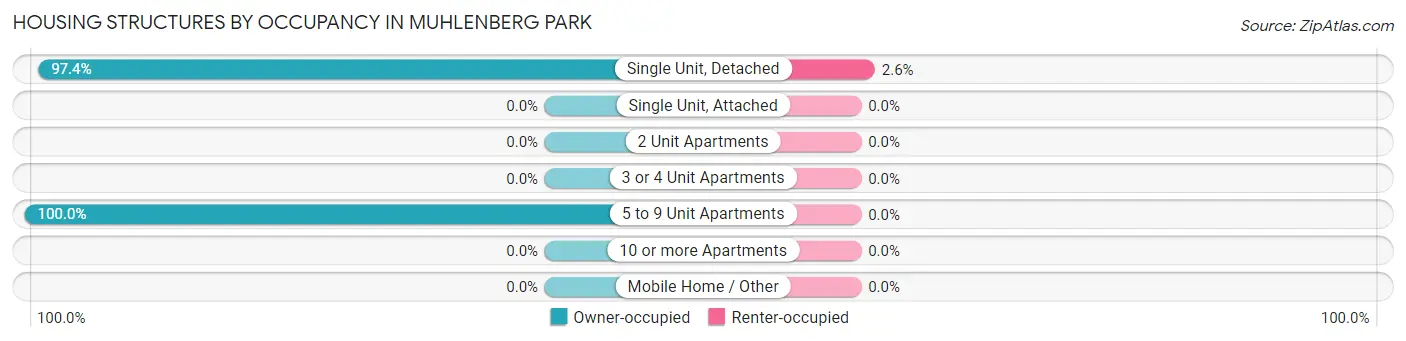
| Structure Type | Owner-occupied | Renter-occupied |
| Single Unit, Detached | 518 (97.4%) | 14 (2.6%) |
| Single Unit, Attached | 0 (0.0%) | 0 (0.0%) |
| 2 Unit Apartments | 0 (0.0%) | 0 (0.0%) |
| 3 or 4 Unit Apartments | 0 (0.0%) | 0 (0.0%) |
| 5 to 9 Unit Apartments | 27 (100.0%) | 0 (0.0%) |
| 10 or more Apartments | 0 (0.0%) | 0 (0.0%) |
| Mobile Home / Other | 0 (0.0%) | 0 (0.0%) |
| Total | 545 (97.5%) | 14 (2.5%) |
Housing Structures by Number of Rooms in Muhlenberg Park
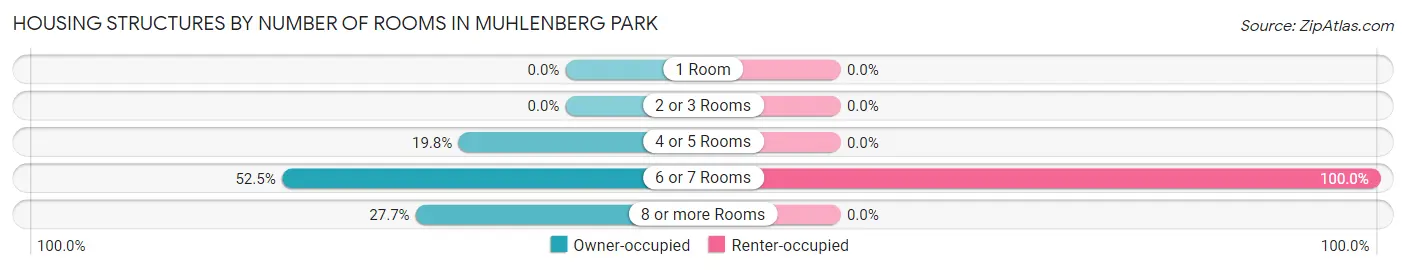
| Number of Rooms | Owner-occupied | Renter-occupied |
| 1 Room | 0 (0.0%) | 0 (0.0%) |
| 2 or 3 Rooms | 0 (0.0%) | 0 (0.0%) |
| 4 or 5 Rooms | 108 (19.8%) | 0 (0.0%) |
| 6 or 7 Rooms | 286 (52.5%) | 14 (100.0%) |
| 8 or more Rooms | 151 (27.7%) | 0 (0.0%) |
| Total | 545 (100.0%) | 14 (100.0%) |
Housing Structure by Heating Type in Muhlenberg Park
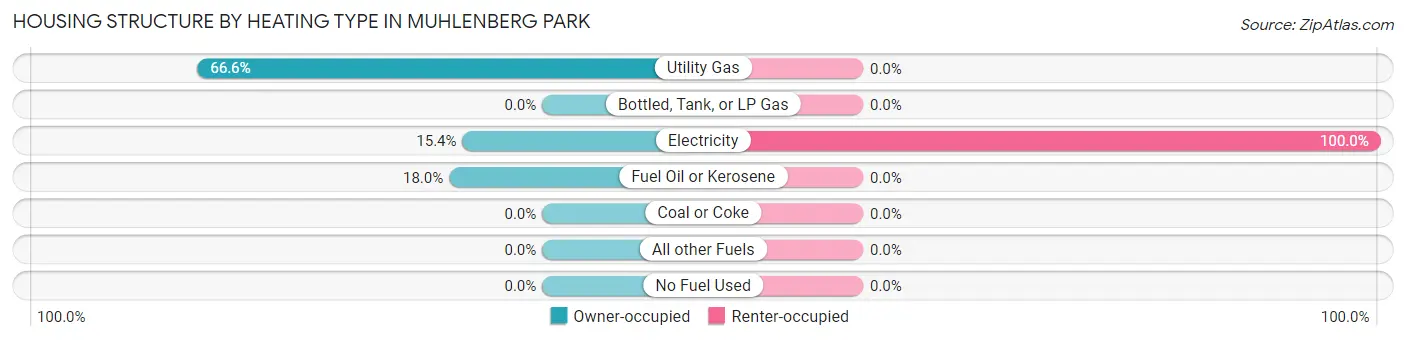
| Heating Type | Owner-occupied | Renter-occupied |
| Utility Gas | 363 (66.6%) | 0 (0.0%) |
| Bottled, Tank, or LP Gas | 0 (0.0%) | 0 (0.0%) |
| Electricity | 84 (15.4%) | 14 (100.0%) |
| Fuel Oil or Kerosene | 98 (18.0%) | 0 (0.0%) |
| Coal or Coke | 0 (0.0%) | 0 (0.0%) |
| All other Fuels | 0 (0.0%) | 0 (0.0%) |
| No Fuel Used | 0 (0.0%) | 0 (0.0%) |
| Total | 545 (100.0%) | 14 (100.0%) |
Household Vehicle Usage in Muhlenberg Park
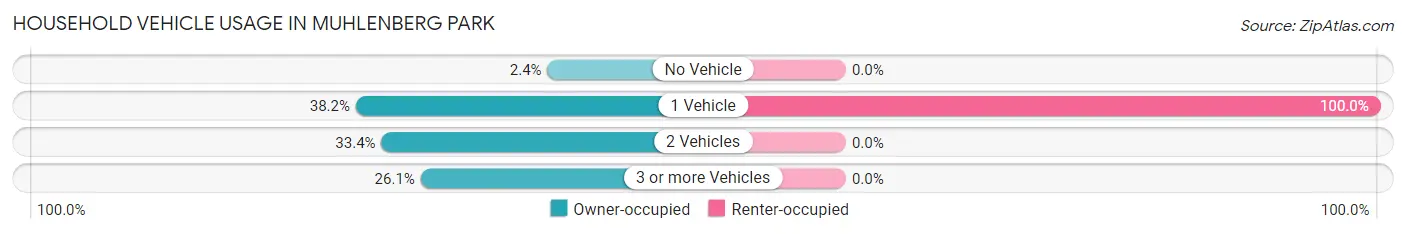
| Vehicles per Household | Owner-occupied | Renter-occupied |
| No Vehicle | 13 (2.4%) | 0 (0.0%) |
| 1 Vehicle | 208 (38.2%) | 14 (100.0%) |
| 2 Vehicles | 182 (33.4%) | 0 (0.0%) |
| 3 or more Vehicles | 142 (26.1%) | 0 (0.0%) |
| Total | 545 (100.0%) | 14 (100.0%) |
Real Estate & Mortgages in Muhlenberg Park
Real Estate and Mortgage Overview in Muhlenberg Park
| Characteristic | Without Mortgage | With Mortgage |
| Housing Units | 243 | 302 |
| Median Property Value | $197,800 | $257,100 |
| Median Household Income | $88,219 | $70 |
| Monthly Housing Costs | $750 | $0 |
| Real Estate Taxes | $4,371 | $43 |
Property Value by Mortgage Status in Muhlenberg Park
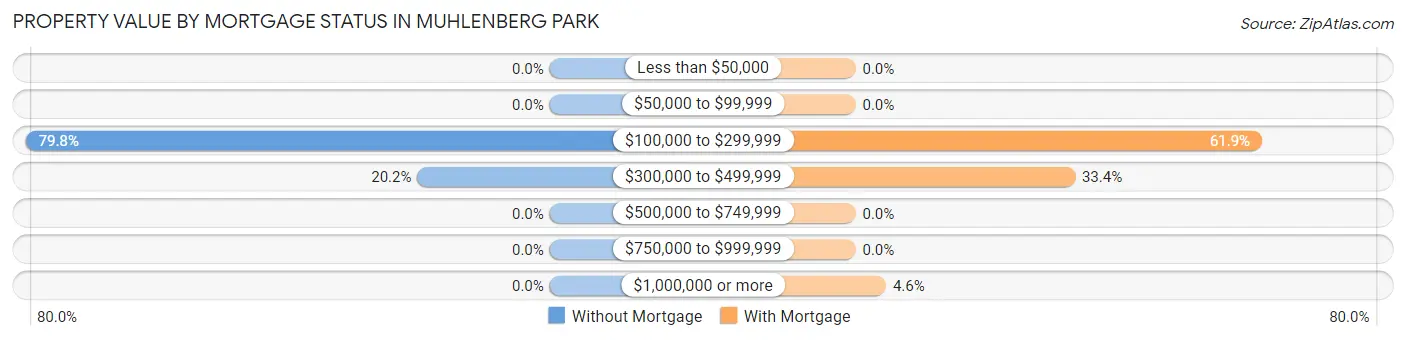
| Property Value | Without Mortgage | With Mortgage |
| Less than $50,000 | 0 (0.0%) | 0 (0.0%) |
| $50,000 to $99,999 | 0 (0.0%) | 0 (0.0%) |
| $100,000 to $299,999 | 194 (79.8%) | 187 (61.9%) |
| $300,000 to $499,999 | 49 (20.2%) | 101 (33.4%) |
| $500,000 to $749,999 | 0 (0.0%) | 0 (0.0%) |
| $750,000 to $999,999 | 0 (0.0%) | 0 (0.0%) |
| $1,000,000 or more | 0 (0.0%) | 14 (4.6%) |
| Total | 243 (100.0%) | 302 (100.0%) |
Household Income by Mortgage Status in Muhlenberg Park
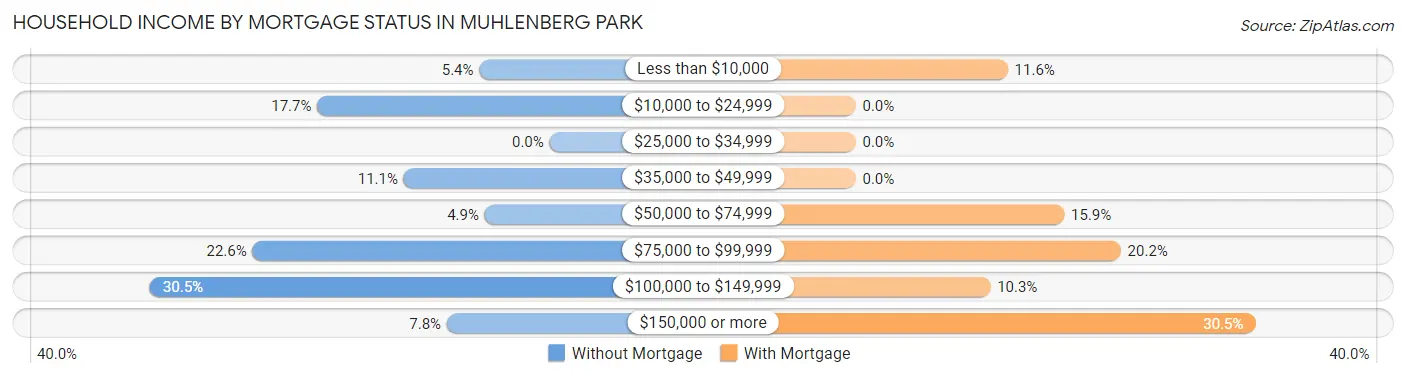
| Household Income | Without Mortgage | With Mortgage |
| Less than $10,000 | 13 (5.3%) | 35 (11.6%) |
| $10,000 to $24,999 | 43 (17.7%) | 0 (0.0%) |
| $25,000 to $34,999 | 0 (0.0%) | 0 (0.0%) |
| $35,000 to $49,999 | 27 (11.1%) | 0 (0.0%) |
| $50,000 to $74,999 | 12 (4.9%) | 48 (15.9%) |
| $75,000 to $99,999 | 55 (22.6%) | 61 (20.2%) |
| $100,000 to $149,999 | 74 (30.4%) | 31 (10.3%) |
| $150,000 or more | 19 (7.8%) | 92 (30.5%) |
| Total | 243 (100.0%) | 302 (100.0%) |
Property Value to Household Income Ratio in Muhlenberg Park
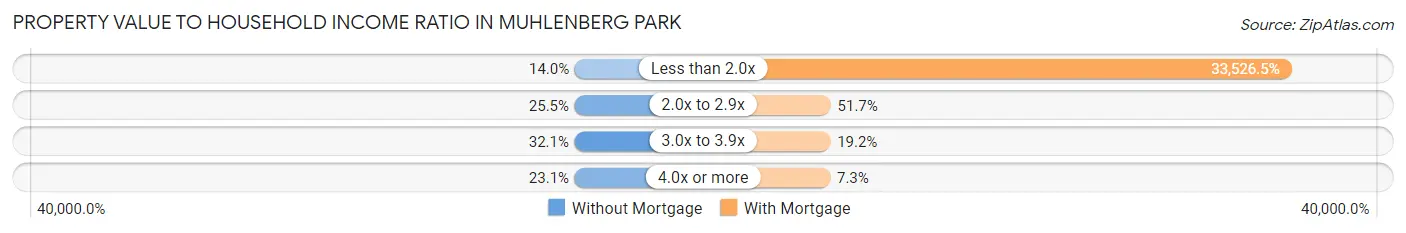
| Value-to-Income Ratio | Without Mortgage | With Mortgage |
| Less than 2.0x | 34 (14.0%) | 101,250 (33,526.5%) |
| 2.0x to 2.9x | 62 (25.5%) | 156 (51.7%) |
| 3.0x to 3.9x | 78 (32.1%) | 58 (19.2%) |
| 4.0x or more | 56 (23.1%) | 22 (7.3%) |
| Total | 243 (100.0%) | 302 (100.0%) |
Real Estate Taxes by Mortgage Status in Muhlenberg Park
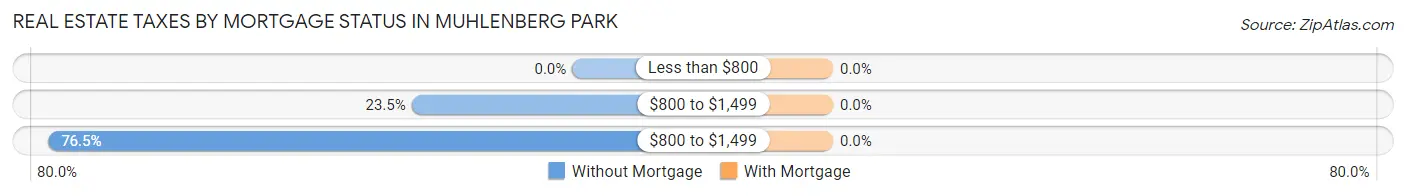
| Property Taxes | Without Mortgage | With Mortgage |
| Less than $800 | 0 (0.0%) | 0 (0.0%) |
| $800 to $1,499 | 57 (23.5%) | 0 (0.0%) |
| $800 to $1,499 | 186 (76.5%) | 0 (0.0%) |
| Total | 243 (100.0%) | 302 (100.0%) |
Health & Disability in Muhlenberg Park
Health Insurance Coverage by Age in Muhlenberg Park
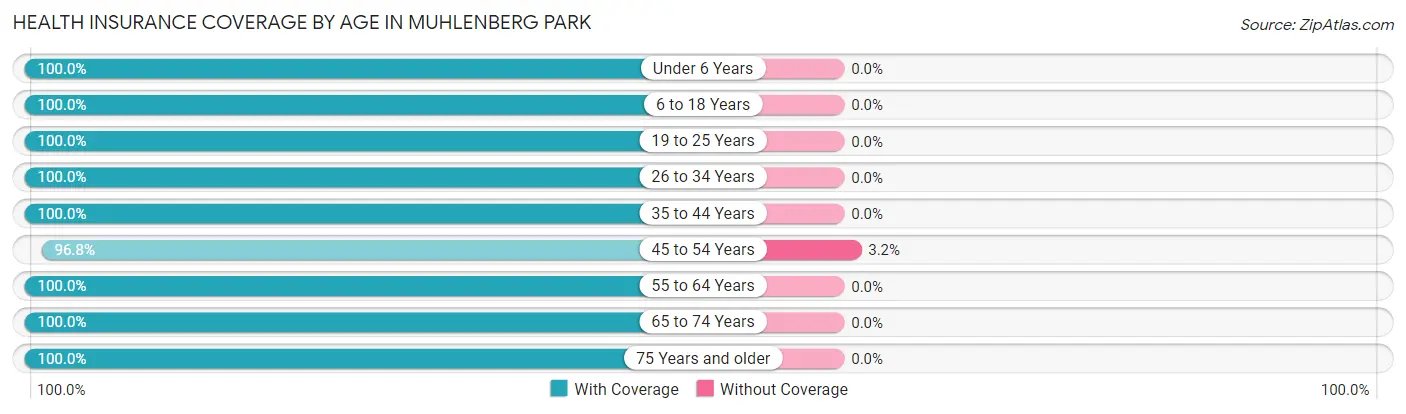
| Age Bracket | With Coverage | Without Coverage |
| Under 6 Years | 9 (100.0%) | 0 (0.0%) |
| 6 to 18 Years | 182 (100.0%) | 0 (0.0%) |
| 19 to 25 Years | 73 (100.0%) | 0 (0.0%) |
| 26 to 34 Years | 84 (100.0%) | 0 (0.0%) |
| 35 to 44 Years | 67 (100.0%) | 0 (0.0%) |
| 45 to 54 Years | 122 (96.8%) | 4 (3.2%) |
| 55 to 64 Years | 268 (100.0%) | 0 (0.0%) |
| 65 to 74 Years | 198 (100.0%) | 0 (0.0%) |
| 75 Years and older | 169 (100.0%) | 0 (0.0%) |
| Total | 1,172 (99.7%) | 4 (0.3%) |
Health Insurance Coverage by Citizenship Status in Muhlenberg Park
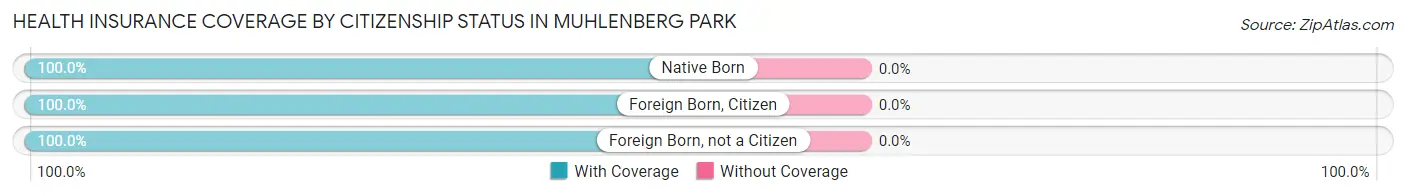
| Citizenship Status | With Coverage | Without Coverage |
| Native Born | 9 (100.0%) | 0 (0.0%) |
| Foreign Born, Citizen | 182 (100.0%) | 0 (0.0%) |
| Foreign Born, not a Citizen | 73 (100.0%) | 0 (0.0%) |
Health Insurance Coverage by Household Income in Muhlenberg Park
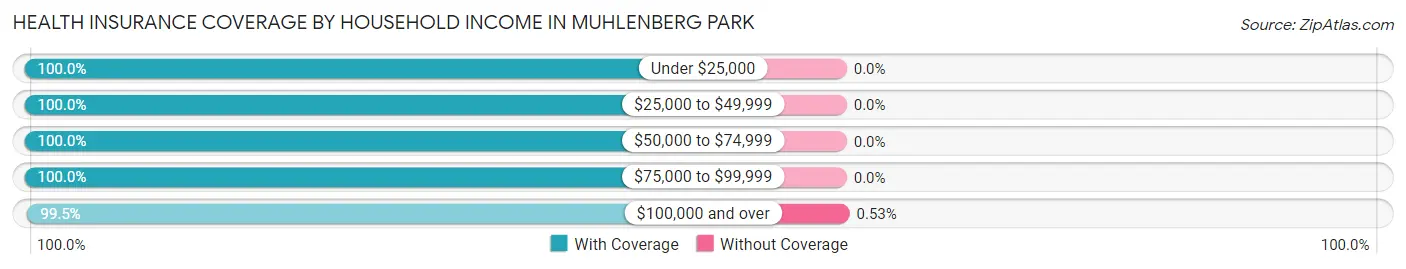
| Household Income | With Coverage | Without Coverage |
| Under $25,000 | 56 (100.0%) | 0 (0.0%) |
| $25,000 to $49,999 | 149 (100.0%) | 0 (0.0%) |
| $50,000 to $74,999 | 105 (100.0%) | 0 (0.0%) |
| $75,000 to $99,999 | 114 (100.0%) | 0 (0.0%) |
| $100,000 and over | 748 (99.5%) | 4 (0.5%) |
Public vs Private Health Insurance Coverage by Age in Muhlenberg Park
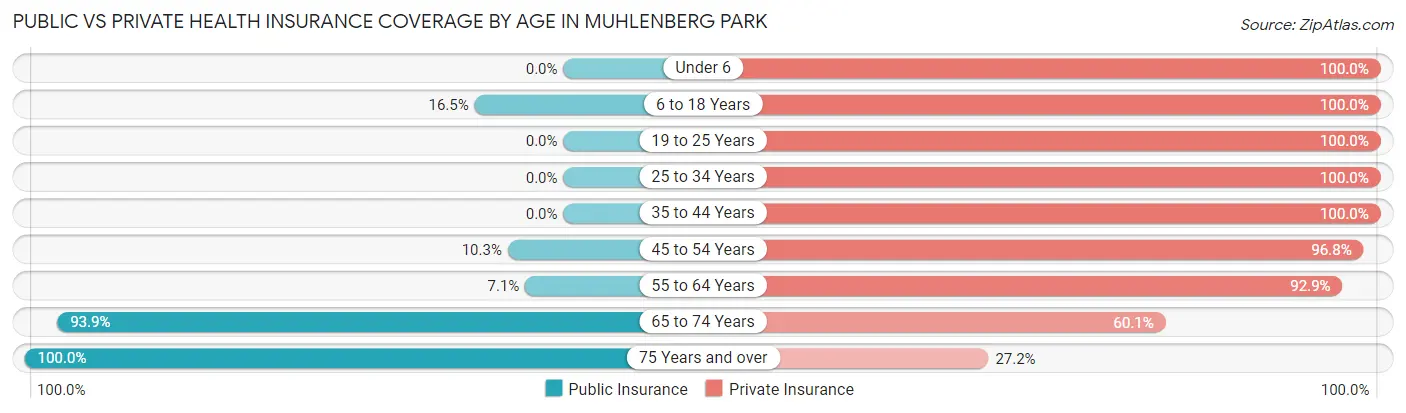
| Age Bracket | Public Insurance | Private Insurance |
| Under 6 | 0 (0.0%) | 9 (100.0%) |
| 6 to 18 Years | 30 (16.5%) | 182 (100.0%) |
| 19 to 25 Years | 0 (0.0%) | 73 (100.0%) |
| 25 to 34 Years | 0 (0.0%) | 84 (100.0%) |
| 35 to 44 Years | 0 (0.0%) | 67 (100.0%) |
| 45 to 54 Years | 13 (10.3%) | 122 (96.8%) |
| 55 to 64 Years | 19 (7.1%) | 249 (92.9%) |
| 65 to 74 Years | 186 (93.9%) | 119 (60.1%) |
| 75 Years and over | 169 (100.0%) | 46 (27.2%) |
| Total | 417 (35.5%) | 951 (80.9%) |
Disability Status by Sex by Age in Muhlenberg Park
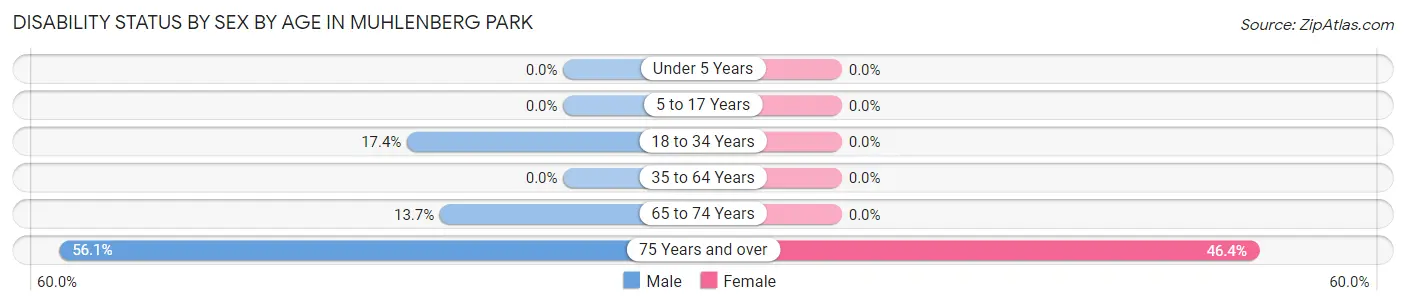
| Age Bracket | Male | Female |
| Under 5 Years | 0 (0.0%) | 0 (0.0%) |
| 5 to 17 Years | 0 (0.0%) | 0 (0.0%) |
| 18 to 34 Years | 20 (17.4%) | 0 (0.0%) |
| 35 to 64 Years | 0 (0.0%) | 0 (0.0%) |
| 65 to 74 Years | 14 (13.7%) | 0 (0.0%) |
| 75 Years and over | 32 (56.1%) | 52 (46.4%) |
Disability Class by Sex by Age in Muhlenberg Park
Disability Class: Hearing Difficulty
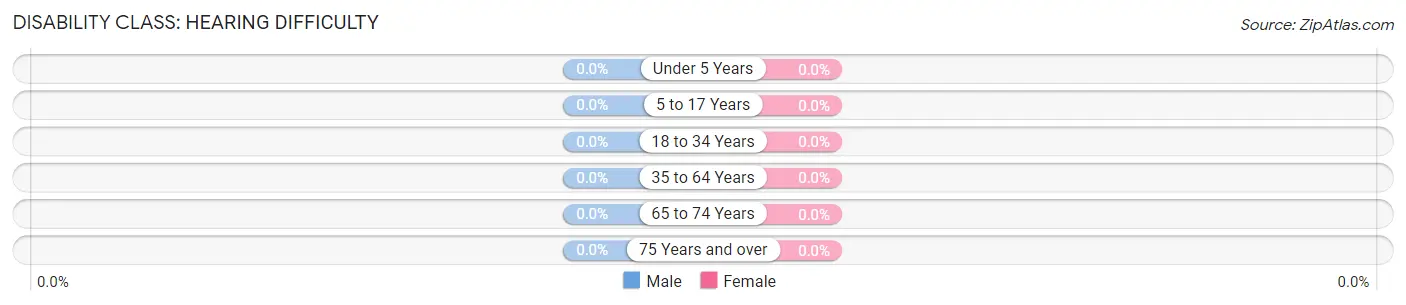
| Age Bracket | Male | Female |
| Under 5 Years | 0 (0.0%) | 0 (0.0%) |
| 5 to 17 Years | 0 (0.0%) | 0 (0.0%) |
| 18 to 34 Years | 0 (0.0%) | 0 (0.0%) |
| 35 to 64 Years | 0 (0.0%) | 0 (0.0%) |
| 65 to 74 Years | 0 (0.0%) | 0 (0.0%) |
| 75 Years and over | 0 (0.0%) | 0 (0.0%) |
Disability Class: Vision Difficulty
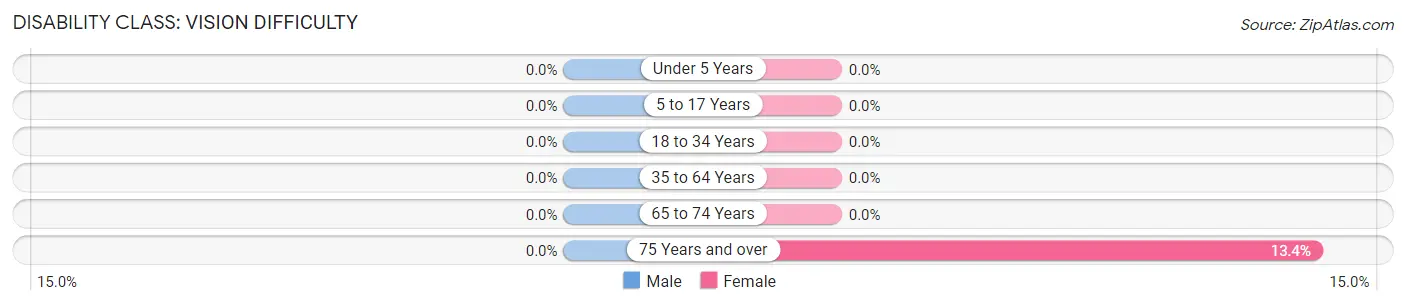
| Age Bracket | Male | Female |
| Under 5 Years | 0 (0.0%) | 0 (0.0%) |
| 5 to 17 Years | 0 (0.0%) | 0 (0.0%) |
| 18 to 34 Years | 0 (0.0%) | 0 (0.0%) |
| 35 to 64 Years | 0 (0.0%) | 0 (0.0%) |
| 65 to 74 Years | 0 (0.0%) | 0 (0.0%) |
| 75 Years and over | 0 (0.0%) | 15 (13.4%) |
Disability Class: Cognitive Difficulty
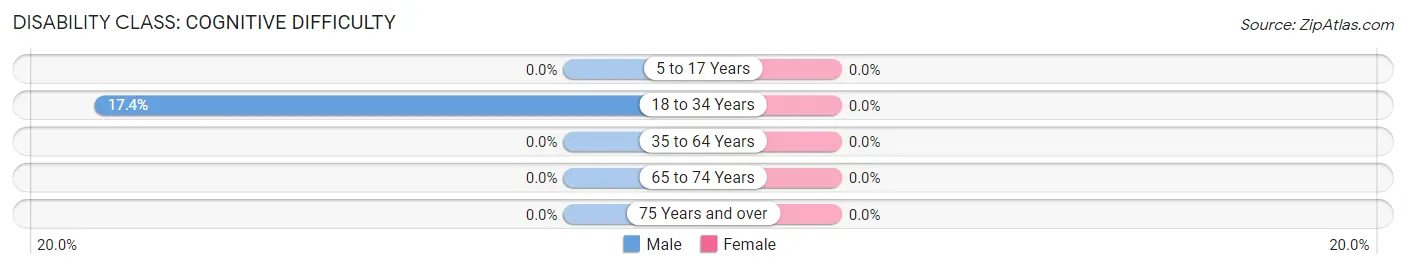
| Age Bracket | Male | Female |
| 5 to 17 Years | 0 (0.0%) | 0 (0.0%) |
| 18 to 34 Years | 20 (17.4%) | 0 (0.0%) |
| 35 to 64 Years | 0 (0.0%) | 0 (0.0%) |
| 65 to 74 Years | 0 (0.0%) | 0 (0.0%) |
| 75 Years and over | 0 (0.0%) | 0 (0.0%) |
Disability Class: Ambulatory Difficulty
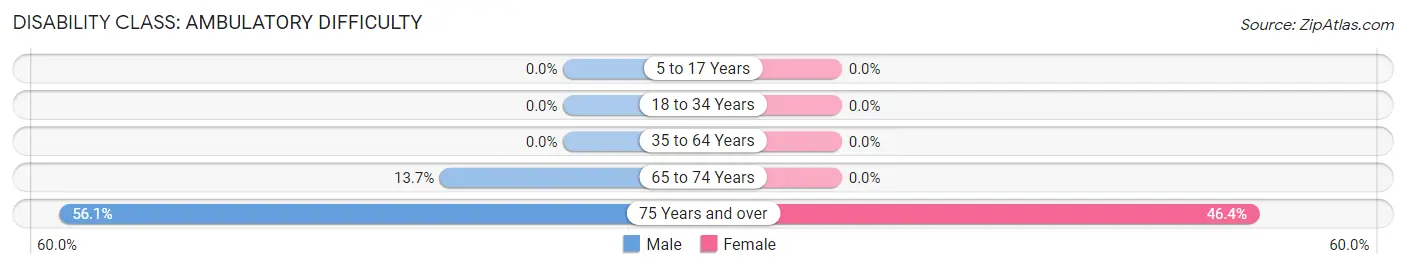
| Age Bracket | Male | Female |
| 5 to 17 Years | 0 (0.0%) | 0 (0.0%) |
| 18 to 34 Years | 0 (0.0%) | 0 (0.0%) |
| 35 to 64 Years | 0 (0.0%) | 0 (0.0%) |
| 65 to 74 Years | 14 (13.7%) | 0 (0.0%) |
| 75 Years and over | 32 (56.1%) | 52 (46.4%) |
Disability Class: Self-Care Difficulty
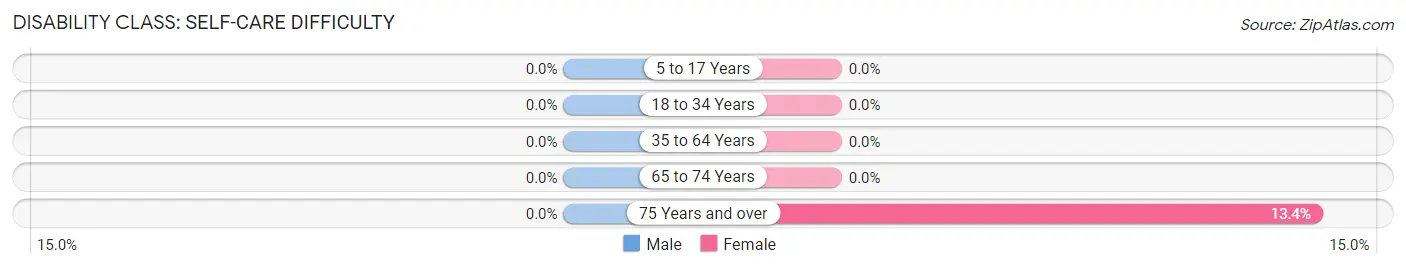
| Age Bracket | Male | Female |
| 5 to 17 Years | 0 (0.0%) | 0 (0.0%) |
| 18 to 34 Years | 0 (0.0%) | 0 (0.0%) |
| 35 to 64 Years | 0 (0.0%) | 0 (0.0%) |
| 65 to 74 Years | 0 (0.0%) | 0 (0.0%) |
| 75 Years and over | 0 (0.0%) | 15 (13.4%) |
Technology Access in Muhlenberg Park
Computing Device Access in Muhlenberg Park
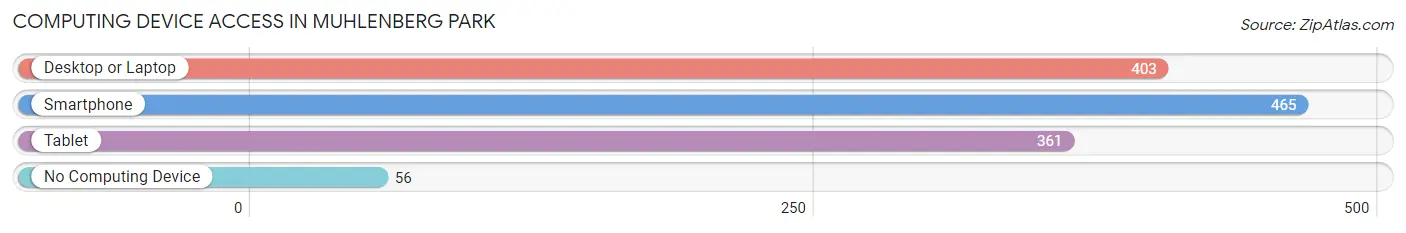
| Device Type | # Households | % Households |
| Desktop or Laptop | 403 | 72.1% |
| Smartphone | 465 | 83.2% |
| Tablet | 361 | 64.6% |
| No Computing Device | 56 | 10.0% |
| Total | 559 | 100.0% |
Internet Access in Muhlenberg Park
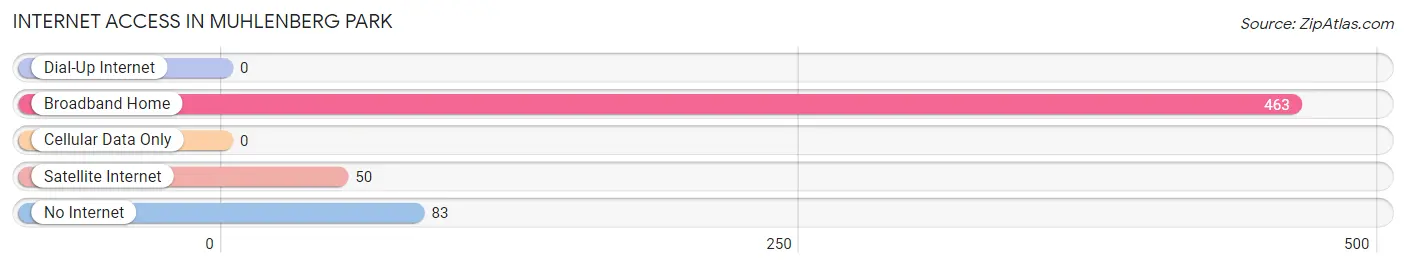
| Internet Type | # Households | % Households |
| Dial-Up Internet | 0 | 0.0% |
| Broadband Home | 463 | 82.8% |
| Cellular Data Only | 0 | 0.0% |
| Satellite Internet | 50 | 8.9% |
| No Internet | 83 | 14.8% |
| Total | 559 | 100.0% |
Muhlenberg Park Summary
Muhlenberg Park is a small borough located in Berks County, Pennsylvania. It is situated in the southeastern part of the state, approximately 10 miles northwest of Reading. The borough is bordered by the city of Reading to the east, the borough of West Reading to the south, and the borough of Wyomissing to the west. The population of Muhlenberg Park was 2,845 at the 2010 census.
History
Muhlenberg Park was founded in 1876 by the Muhlenberg family, who had purchased the land from the Reading Railroad. The family named the borough after their ancestor, Henry Muhlenberg, who was a German-born Lutheran minister and the patriarch of the Lutheran Church in America. The Muhlenbergs built a large mansion on the property, which is now a historic landmark.
The borough was incorporated in 1891 and was originally a farming community. In the early 20th century, the borough began to develop into a residential area. The population grew steadily throughout the 20th century, reaching its peak in the 1970s.
Geography
Muhlenberg Park is located at 40°20'45" North, 75°56'45" West (40.3458, -75.9457). According to the United States Census Bureau, the borough has a total area of 0.7 square miles, all of which is land.
The borough is located in the Schuylkill River watershed. The Schuylkill River forms the eastern boundary of the borough. The borough is located in the Reading Prong of the Appalachian Mountains.
Economy
The economy of Muhlenberg Park is largely based on the service industry. The borough is home to several small businesses, including restaurants, retail stores, and professional services. The borough also has a few manufacturing companies.
Demographics
As of the 2010 census, there were 2,845 people, 1,093 households, and 745 families residing in the borough. The population density was 4,072.3 people per square mile. The racial makeup of the borough was 94.2% White, 1.7% African American, 0.2% Native American, 1.2% Asian, 0.1% Pacific Islander, 1.2% from other races, and 1.6% from two or more races. Hispanic or Latino of any race were 3.3% of the population.
There were 1,093 households, out of which 28.3% had children under the age of 18 living with them, 51.2% were married couples living together, 11.2% had a female householder with no husband present, and 33.2% were non-families. 28.3% of all households were made up of individuals, and 12.2% had someone living alone who was 65 years of age or older. The average household size was 2.60 and the average family size was 3.20.
In the borough, the population was spread out, with 23.2% under the age of 18, 7.2% from 18 to 24, 28.2% from 25 to 44, 24.2% from 45 to 64, and 17.2% who were 65 years of age or older. The median age was 39 years. For every 100 females, there were 92.2 males. For every 100 females age 18 and over, there were 88.2 males.
The median income for a household in the borough was $45,938, and the median income for a family was $54,375. Males had a median income of $37,500 versus $27,500 for females. The per capita income for the borough was $20,945. About 4.2% of families and 6.2% of the population were below the poverty line, including 8.2% of those under age 18 and 5.2% of those age 65 or over.
Common Questions
What is Per Capita Income in Muhlenberg Park?
Per Capita income in Muhlenberg Park is $62,001.
What is the Median Family Income in Muhlenberg Park?
Median Family Income in Muhlenberg Park is $113,382.
What is the Median Household income in Muhlenberg Park?
Median Household Income in Muhlenberg Park is $91,477.
What is Inequality or Gini Index in Muhlenberg Park?
Inequality or Gini Index in Muhlenberg Park is 0.50.
What is the Total Population of Muhlenberg Park?
Total Population of Muhlenberg Park is 1,176.
What is the Total Male Population of Muhlenberg Park?
Total Male Population of Muhlenberg Park is 594.
What is the Total Female Population of Muhlenberg Park?
Total Female Population of Muhlenberg Park is 582.
What is the Ratio of Males per 100 Females in Muhlenberg Park?
There are 102.06 Males per 100 Females in Muhlenberg Park.
What is the Ratio of Females per 100 Males in Muhlenberg Park?
There are 97.98 Females per 100 Males in Muhlenberg Park.
What is the Median Population Age in Muhlenberg Park?
Median Population Age in Muhlenberg Park is 55.9 Years.
What is the Average Family Size in Muhlenberg Park
Average Family Size in Muhlenberg Park is 2.8 People.
What is the Average Household Size in Muhlenberg Park
Average Household Size in Muhlenberg Park is 2.1 People.
How Large is the Labor Force in Muhlenberg Park?
There are 573 People in the Labor Forcein in Muhlenberg Park.
What is the Percentage of People in the Labor Force in Muhlenberg Park?
56.1% of People are in the Labor Force in Muhlenberg Park.
What is the Unemployment Rate in Muhlenberg Park?
Unemployment Rate in Muhlenberg Park is 1.7%.