Brickerville, PA Map & Demographics
Brickerville Map
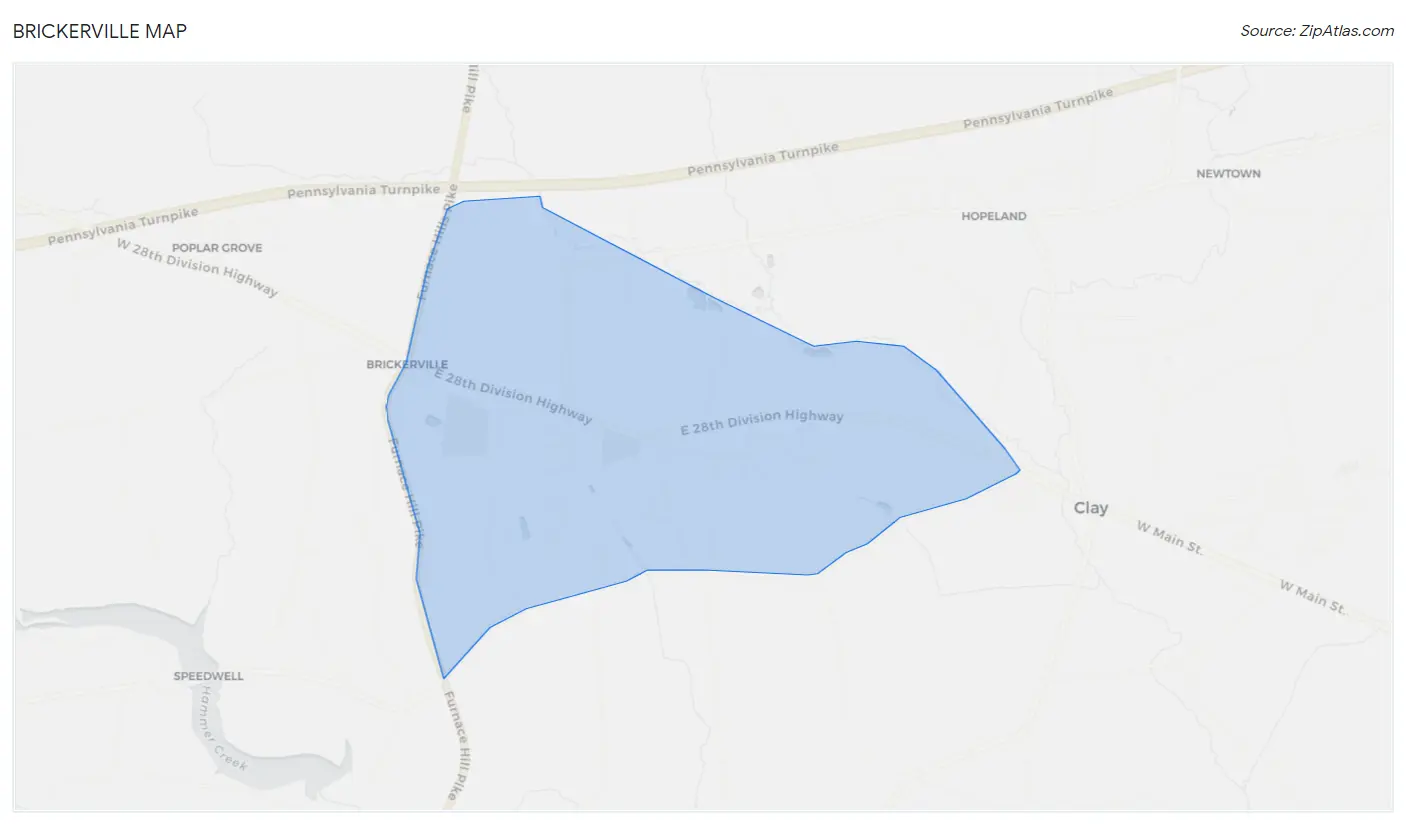
Brickerville Overview
$39,643
PER CAPITA INCOME
$97,600
AVG FAMILY INCOME
$74,107
AVG HOUSEHOLD INCOME
66.0%
WAGE / INCOME GAP [ % ]
34.0¢/ $1
WAGE / INCOME GAP [ $ ]
0.48
INEQUALITY / GINI INDEX
1,407
TOTAL POPULATION
741
MALE POPULATION
666
FEMALE POPULATION
111.26
MALES / 100 FEMALES
89.88
FEMALES / 100 MALES
47.0
MEDIAN AGE
3.0
AVG FAMILY SIZE
2.7
AVG HOUSEHOLD SIZE
854
LABOR FORCE [ PEOPLE ]
73.6%
PERCENT IN LABOR FORCE
Income in Brickerville
Income Overview in Brickerville
Per Capita Income in Brickerville is $39,643, while median incomes of families and households are $97,600 and $74,107 respectively.
| Characteristic | Number | Measure |
| Per Capita Income | 1,407 | $39,643 |
| Median Family Income | 426 | $97,600 |
| Mean Family Income | 426 | $118,465 |
| Median Household Income | 521 | $74,107 |
| Mean Household Income | 521 | $104,414 |
| Income Deficit | 426 | $0 |
| Wage / Income Gap (%) | 1,407 | 66.01% |
| Wage / Income Gap ($) | 1,407 | 33.99¢ per $1 |
| Gini / Inequality Index | 1,407 | 0.48 |
Earnings by Sex in Brickerville
Average Earnings in Brickerville are $33,295, $49,583 for men and $16,854 for women, a difference of 66.0%.
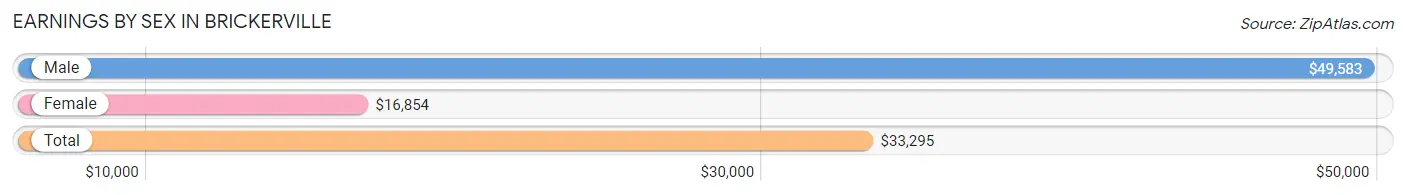
| Sex | Number | Average Earnings |
| Male | 498 (56.9%) | $49,583 |
| Female | 377 (43.1%) | $16,854 |
| Total | 875 (100.0%) | $33,295 |
Earnings by Sex by Income Bracket in Brickerville
The most common earnings brackets in Brickerville are $75,000 to $99,999 for men (120 | 24.1%) and $15,000 to $17,499 for women (60 | 15.9%).
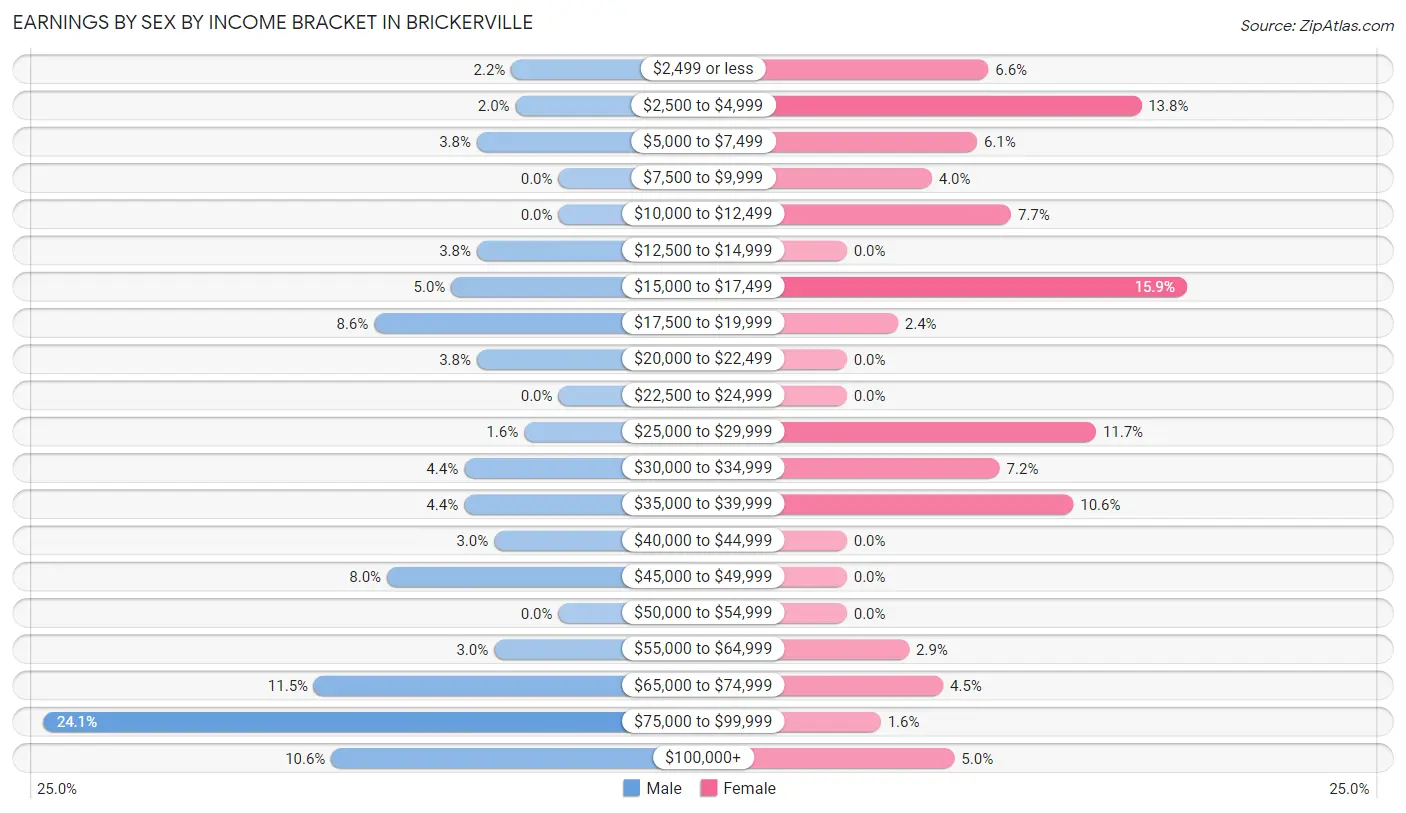
| Income | Male | Female |
| $2,499 or less | 11 (2.2%) | 25 (6.6%) |
| $2,500 to $4,999 | 10 (2.0%) | 52 (13.8%) |
| $5,000 to $7,499 | 19 (3.8%) | 23 (6.1%) |
| $7,500 to $9,999 | 0 (0.0%) | 15 (4.0%) |
| $10,000 to $12,499 | 0 (0.0%) | 29 (7.7%) |
| $12,500 to $14,999 | 19 (3.8%) | 0 (0.0%) |
| $15,000 to $17,499 | 25 (5.0%) | 60 (15.9%) |
| $17,500 to $19,999 | 43 (8.6%) | 9 (2.4%) |
| $20,000 to $22,499 | 19 (3.8%) | 0 (0.0%) |
| $22,500 to $24,999 | 0 (0.0%) | 0 (0.0%) |
| $25,000 to $29,999 | 8 (1.6%) | 44 (11.7%) |
| $30,000 to $34,999 | 22 (4.4%) | 27 (7.2%) |
| $35,000 to $39,999 | 22 (4.4%) | 40 (10.6%) |
| $40,000 to $44,999 | 15 (3.0%) | 0 (0.0%) |
| $45,000 to $49,999 | 40 (8.0%) | 0 (0.0%) |
| $50,000 to $54,999 | 0 (0.0%) | 0 (0.0%) |
| $55,000 to $64,999 | 15 (3.0%) | 11 (2.9%) |
| $65,000 to $74,999 | 57 (11.5%) | 17 (4.5%) |
| $75,000 to $99,999 | 120 (24.1%) | 6 (1.6%) |
| $100,000+ | 53 (10.6%) | 19 (5.0%) |
| Total | 498 (100.0%) | 377 (100.0%) |
Earnings by Sex by Educational Attainment in Brickerville
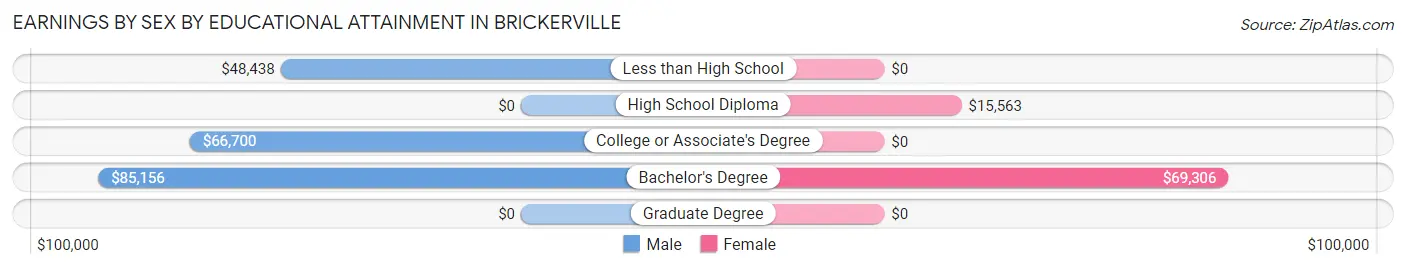
| Educational Attainment | Male Income | Female Income |
| Less than High School | $48,438 | $0 |
| High School Diploma | - | - |
| College or Associate's Degree | $66,700 | $0 |
| Bachelor's Degree | $85,156 | $69,306 |
| Graduate Degree | - | - |
| Total | $65,200 | $0 |
Family Income in Brickerville
Family Income Brackets in Brickerville
According to the Brickerville family income data, there are 106 families falling into the $100,000 to $149,999 income range, which is the most common income bracket and makes up 24.9% of all families.
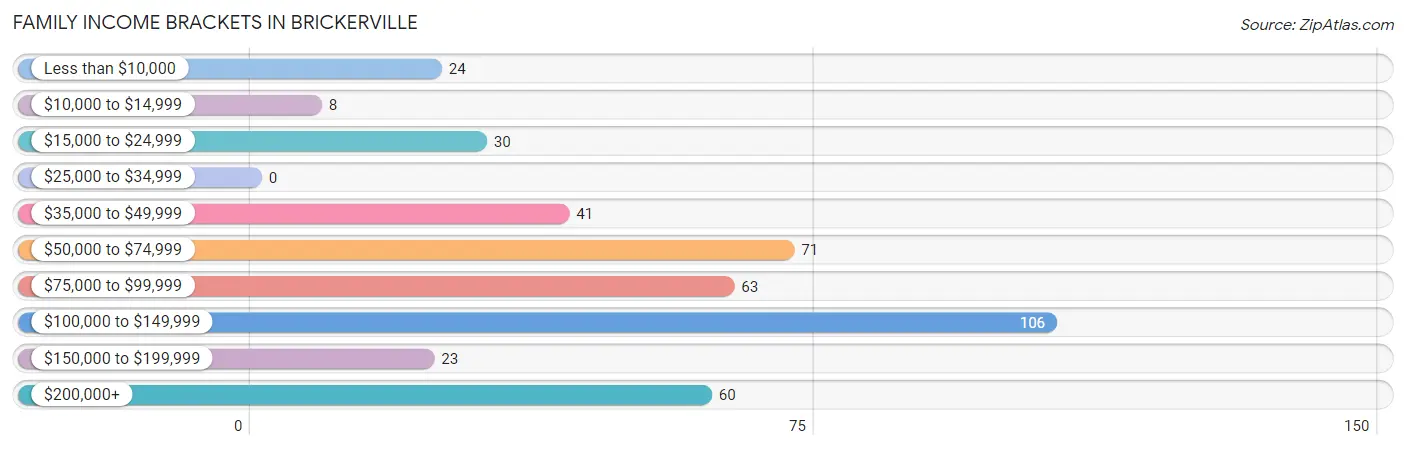
| Income Bracket | # Families | % Families |
| Less than $10,000 | 24 | 5.6% |
| $10,000 to $14,999 | 8 | 1.9% |
| $15,000 to $24,999 | 30 | 7.0% |
| $25,000 to $34,999 | 0 | 0.0% |
| $35,000 to $49,999 | 41 | 9.6% |
| $50,000 to $74,999 | 71 | 16.7% |
| $75,000 to $99,999 | 63 | 14.8% |
| $100,000 to $149,999 | 106 | 24.9% |
| $150,000 to $199,999 | 23 | 5.4% |
| $200,000+ | 60 | 14.1% |
Family Income by Famaliy Size in Brickerville
4-person families (72 | 16.9%) account for the highest median family income in Brickerville with $129,697 per family, while 2-person families (224 | 52.6%) have the highest median income of $42,656 per family member.
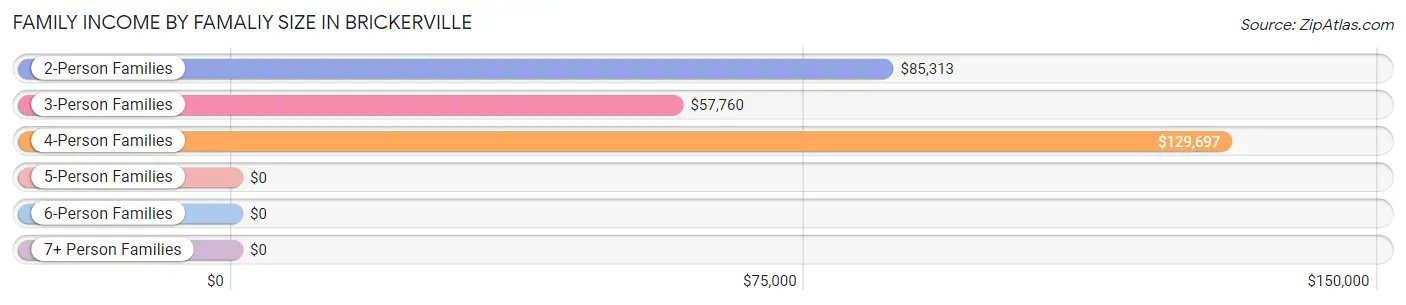
| Income Bracket | # Families | Median Income |
| 2-Person Families | 224 (52.6%) | $85,313 |
| 3-Person Families | 83 (19.5%) | $57,760 |
| 4-Person Families | 72 (16.9%) | $129,697 |
| 5-Person Families | 29 (6.8%) | $0 |
| 6-Person Families | 9 (2.1%) | $0 |
| 7+ Person Families | 9 (2.1%) | $0 |
| Total | 426 (100.0%) | $97,600 |
Family Income by Number of Earners in Brickerville
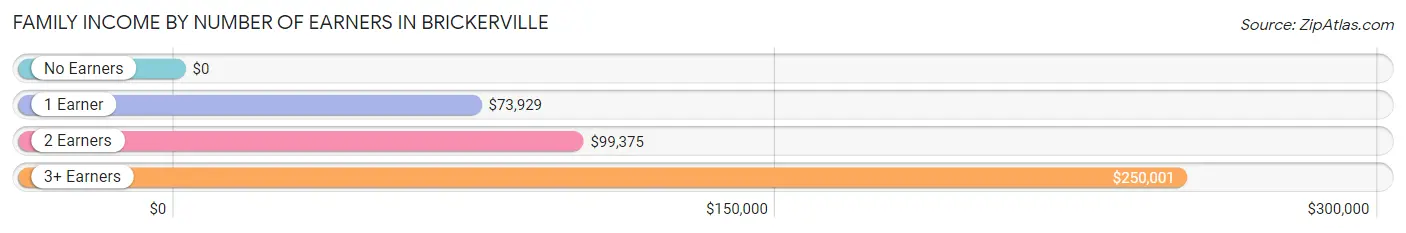
| Number of Earners | # Families | Median Income |
| No Earners | 49 (11.5%) | $0 |
| 1 Earner | 72 (16.9%) | $73,929 |
| 2 Earners | 253 (59.4%) | $99,375 |
| 3+ Earners | 52 (12.2%) | $250,001 |
| Total | 426 (100.0%) | $97,600 |
Household Income in Brickerville
Household Income Brackets in Brickerville
With 106 households falling in the category, the $100,000 to $149,999 income range is the most frequent in Brickerville, accounting for 20.3% of all households. In contrast, only 8 households (1.5%) fall into the $10,000 to $14,999 income bracket, making it the least populous group.
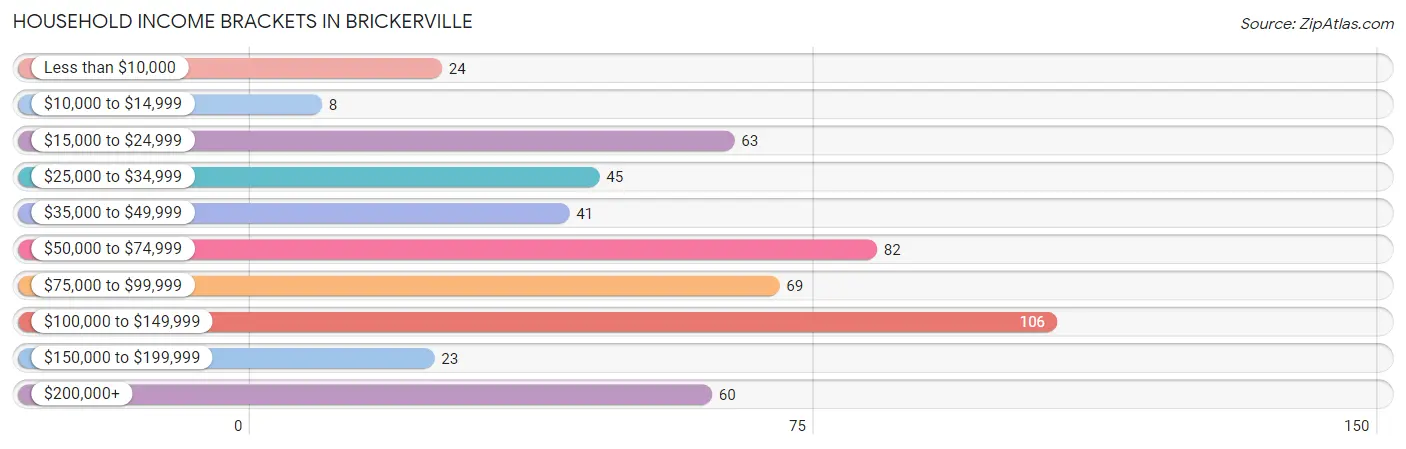
| Income Bracket | # Households | % Households |
| Less than $10,000 | 24 | 4.6% |
| $10,000 to $14,999 | 8 | 1.5% |
| $15,000 to $24,999 | 63 | 12.1% |
| $25,000 to $34,999 | 45 | 8.6% |
| $35,000 to $49,999 | 41 | 7.9% |
| $50,000 to $74,999 | 82 | 15.7% |
| $75,000 to $99,999 | 69 | 13.2% |
| $100,000 to $149,999 | 106 | 20.3% |
| $150,000 to $199,999 | 23 | 4.4% |
| $200,000+ | 60 | 11.5% |
Household Income by Householder Age in Brickerville
The median household income in Brickerville is $74,107, with the highest median household income of $128,482 found in the 25 to 44 years age bracket for the primary householder. A total of 97 households (18.6%) fall into this category.
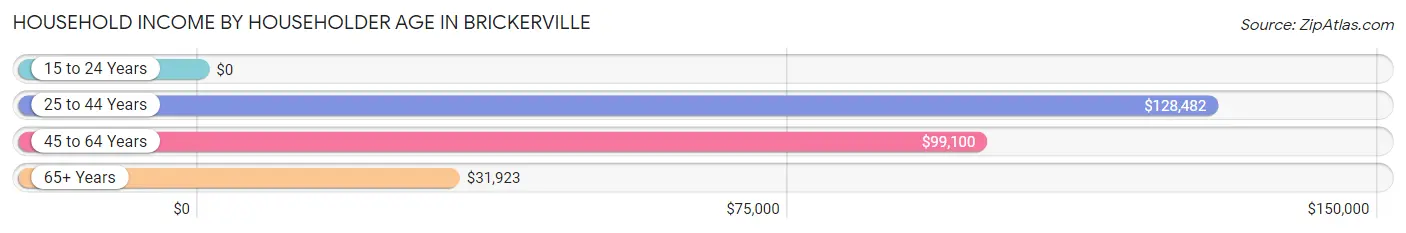
| Income Bracket | # Households | Median Income |
| 15 to 24 Years | 0 (0.0%) | $0 |
| 25 to 44 Years | 97 (18.6%) | $128,482 |
| 45 to 64 Years | 222 (42.6%) | $99,100 |
| 65+ Years | 202 (38.8%) | $31,923 |
| Total | 521 (100.0%) | $74,107 |
Poverty in Brickerville
Income Below Poverty by Sex and Age in Brickerville
With 8.6% poverty level for males and 3.7% for females among the residents of Brickerville, 65 to 74 year old males and 65 to 74 year old females are the most vulnerable to poverty, with 33 males (47.8%) and 25 females (19.5%) in their respective age groups living below the poverty level.
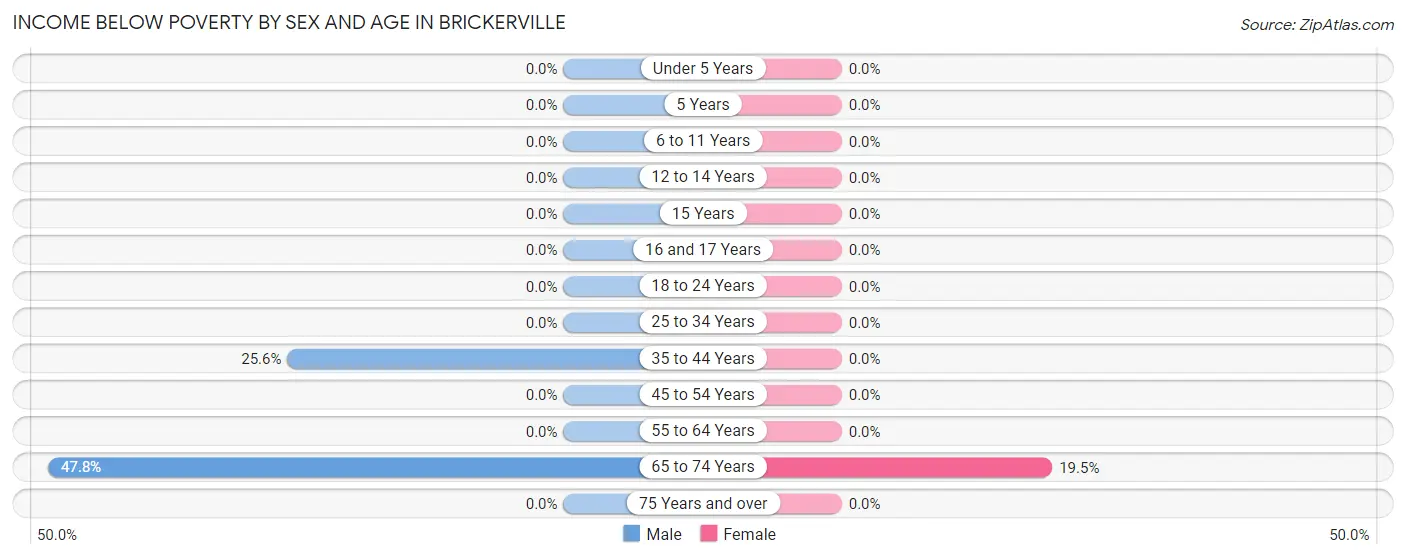
| Age Bracket | Male | Female |
| Under 5 Years | 0 (0.0%) | 0 (0.0%) |
| 5 Years | 0 (0.0%) | 0 (0.0%) |
| 6 to 11 Years | 0 (0.0%) | 0 (0.0%) |
| 12 to 14 Years | 0 (0.0%) | 0 (0.0%) |
| 15 Years | 0 (0.0%) | 0 (0.0%) |
| 16 and 17 Years | 0 (0.0%) | 0 (0.0%) |
| 18 to 24 Years | 0 (0.0%) | 0 (0.0%) |
| 25 to 34 Years | 0 (0.0%) | 0 (0.0%) |
| 35 to 44 Years | 31 (25.6%) | 0 (0.0%) |
| 45 to 54 Years | 0 (0.0%) | 0 (0.0%) |
| 55 to 64 Years | 0 (0.0%) | 0 (0.0%) |
| 65 to 74 Years | 33 (47.8%) | 25 (19.5%) |
| 75 Years and over | 0 (0.0%) | 0 (0.0%) |
| Total | 64 (8.6%) | 25 (3.7%) |
Income Above Poverty by Sex and Age in Brickerville
According to the poverty statistics in Brickerville, males aged under 5 years and females aged under 5 years are the age groups that are most secure financially, with 100.0% of males and 100.0% of females in these age groups living above the poverty line.
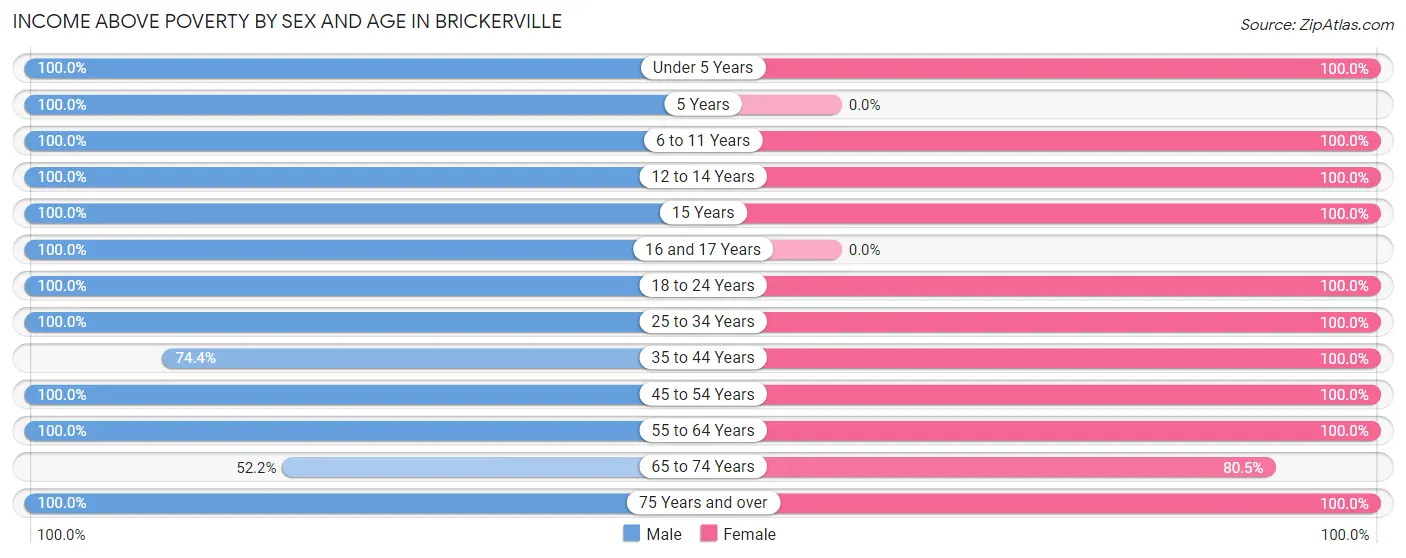
| Age Bracket | Male | Female |
| Under 5 Years | 59 (100.0%) | 10 (100.0%) |
| 5 Years | 11 (100.0%) | 0 (0.0%) |
| 6 to 11 Years | 19 (100.0%) | 56 (100.0%) |
| 12 to 14 Years | 9 (100.0%) | 18 (100.0%) |
| 15 Years | 40 (100.0%) | 25 (100.0%) |
| 16 and 17 Years | 45 (100.0%) | 0 (0.0%) |
| 18 to 24 Years | 54 (100.0%) | 57 (100.0%) |
| 25 to 34 Years | 24 (100.0%) | 35 (100.0%) |
| 35 to 44 Years | 90 (74.4%) | 106 (100.0%) |
| 45 to 54 Years | 116 (100.0%) | 78 (100.0%) |
| 55 to 64 Years | 117 (100.0%) | 104 (100.0%) |
| 65 to 74 Years | 36 (52.2%) | 103 (80.5%) |
| 75 Years and over | 57 (100.0%) | 49 (100.0%) |
| Total | 677 (91.4%) | 641 (96.3%) |
Income Below Poverty Among Married-Couple Families in Brickerville
The poverty statistics for married-couple families in Brickerville show that 8.3% or 32 of the total 385 families live below the poverty line. Families with no children have the highest poverty rate of 11.7%, comprising of 32 families. On the other hand, families with 1 or 2 children have the lowest poverty rate of 0.0%, which includes 0 families.
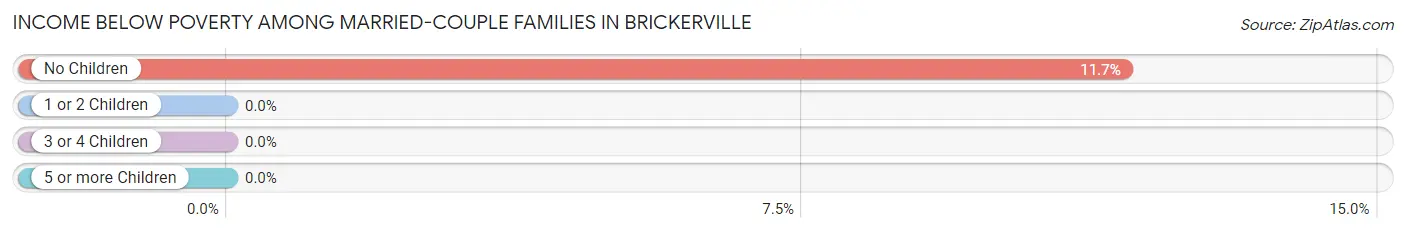
| Children | Above Poverty | Below Poverty |
| No Children | 242 (88.3%) | 32 (11.7%) |
| 1 or 2 Children | 64 (100.0%) | 0 (0.0%) |
| 3 or 4 Children | 47 (100.0%) | 0 (0.0%) |
| 5 or more Children | 0 (0.0%) | 0 (0.0%) |
| Total | 353 (91.7%) | 32 (8.3%) |
Income Below Poverty Among Single-Parent Households in Brickerville
| Children | Single Father | Single Mother |
| No Children | 0 (0.0%) | 0 (0.0%) |
| 1 or 2 Children | 0 (0.0%) | 0 (0.0%) |
| 3 or 4 Children | 0 (0.0%) | 0 (0.0%) |
| 5 or more Children | 0 (0.0%) | 0 (0.0%) |
| Total | 0 (0.0%) | 0 (0.0%) |
Income Below Poverty Among Married-Couple vs Single-Parent Households in Brickerville
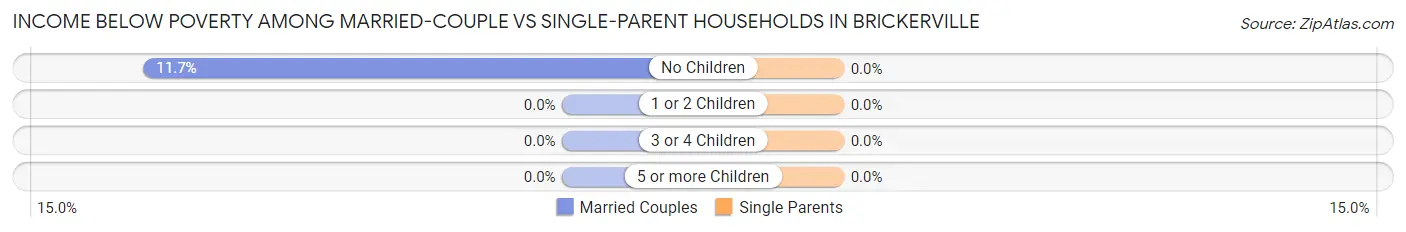
| Children | Married-Couple Families | Single-Parent Households |
| No Children | 32 (11.7%) | 0 (0.0%) |
| 1 or 2 Children | 0 (0.0%) | 0 (0.0%) |
| 3 or 4 Children | 0 (0.0%) | 0 (0.0%) |
| 5 or more Children | 0 (0.0%) | 0 (0.0%) |
| Total | 32 (8.3%) | 0 (0.0%) |
Race in Brickerville
The most populous races in Brickerville are White / Caucasian (1,277 | 90.8%), Two or more Races (90 | 6.4%), and Asian (40 | 2.8%).
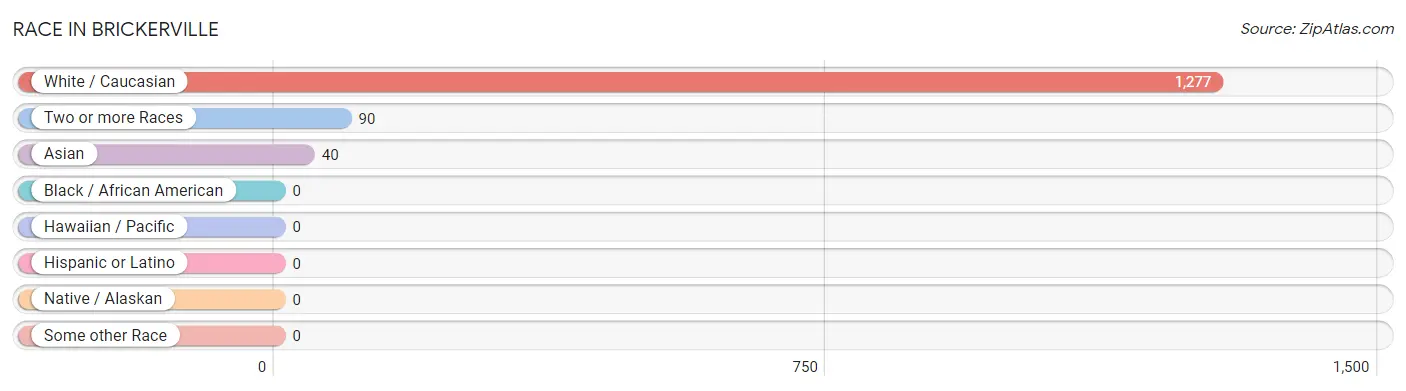
| Race | # Population | % Population |
| Asian | 40 | 2.8% |
| Black / African American | 0 | 0.0% |
| Hawaiian / Pacific | 0 | 0.0% |
| Hispanic or Latino | 0 | 0.0% |
| Native / Alaskan | 0 | 0.0% |
| White / Caucasian | 1,277 | 90.8% |
| Two or more Races | 90 | 6.4% |
| Some other Race | 0 | 0.0% |
| Total | 1,407 | 100.0% |
Ancestry in Brickerville
The most populous ancestries reported in Brickerville are German (621 | 44.1%), American (179 | 12.7%), Irish (131 | 9.3%), Malaysian (130 | 9.2%), and Italian (74 | 5.3%), together accounting for 80.7% of all Brickerville residents.
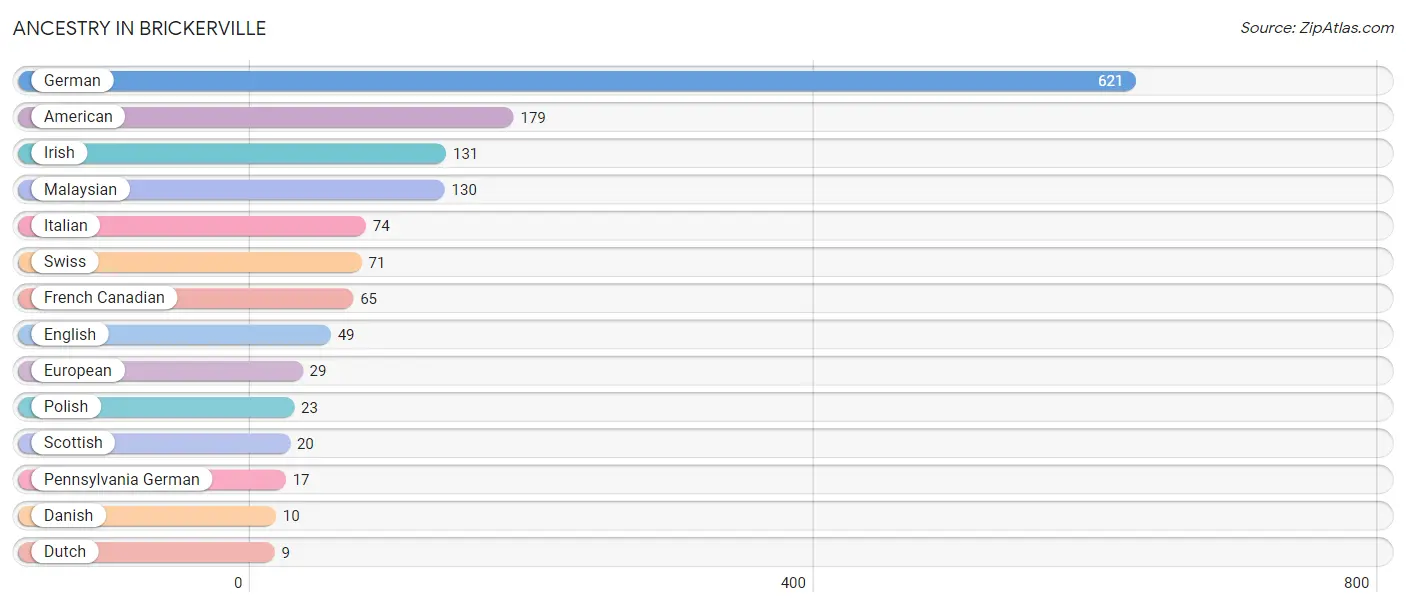
| Ancestry | # Population | % Population |
| American | 179 | 12.7% |
| Danish | 10 | 0.7% |
| Dutch | 9 | 0.6% |
| English | 49 | 3.5% |
| European | 29 | 2.1% |
| French Canadian | 65 | 4.6% |
| German | 621 | 44.1% |
| Irish | 131 | 9.3% |
| Italian | 74 | 5.3% |
| Malaysian | 130 | 9.2% |
| Pennsylvania German | 17 | 1.2% |
| Polish | 23 | 1.6% |
| Scottish | 20 | 1.4% |
| Swiss | 71 | 5.1% | View All 14 Rows |
Immigrants in Brickerville
The most numerous immigrant groups reported in Brickerville came from Asia (40 | 2.8%), Laos (40 | 2.8%), and South Eastern Asia (40 | 2.8%), together accounting for 8.5% of all Brickerville residents.
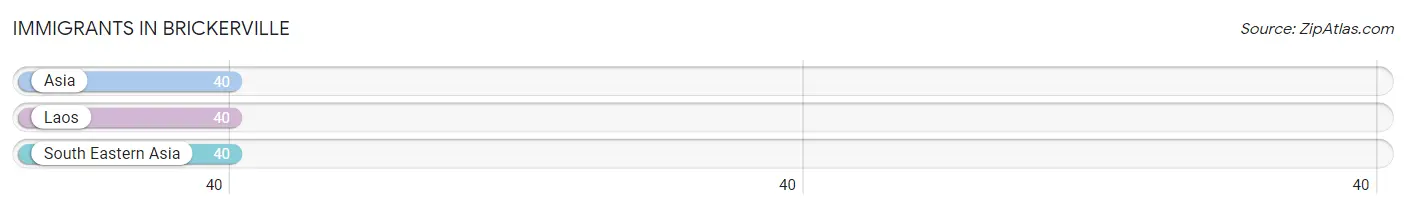
| Immigration Origin | # Population | % Population |
| Asia | 40 | 2.8% |
| Laos | 40 | 2.8% |
| South Eastern Asia | 40 | 2.8% | View All 3 Rows |
Sex and Age in Brickerville
Sex and Age in Brickerville
The most populous age groups in Brickerville are 15 to 19 Years (85 | 11.5%) for men and 55 to 59 Years (76 | 11.4%) for women.
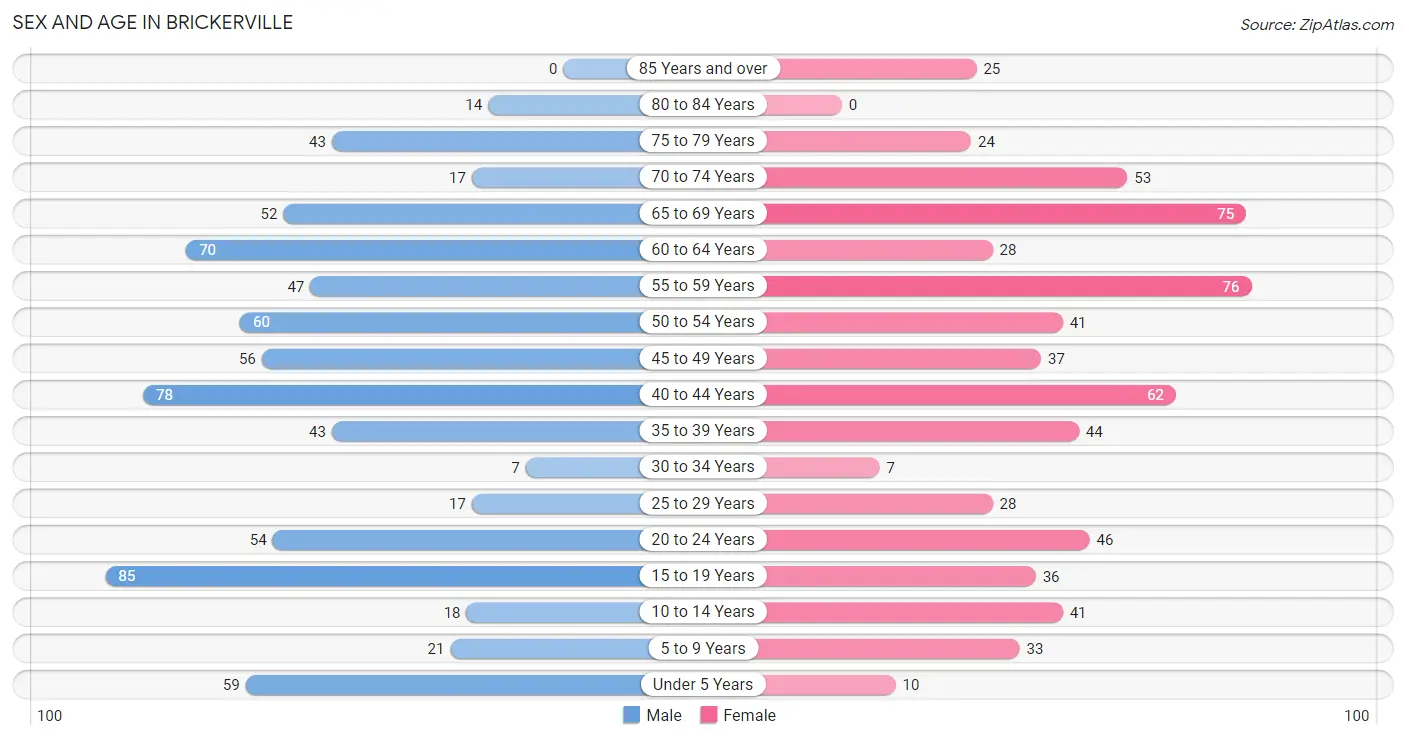
| Age Bracket | Male | Female |
| Under 5 Years | 59 (8.0%) | 10 (1.5%) |
| 5 to 9 Years | 21 (2.8%) | 33 (5.0%) |
| 10 to 14 Years | 18 (2.4%) | 41 (6.2%) |
| 15 to 19 Years | 85 (11.5%) | 36 (5.4%) |
| 20 to 24 Years | 54 (7.3%) | 46 (6.9%) |
| 25 to 29 Years | 17 (2.3%) | 28 (4.2%) |
| 30 to 34 Years | 7 (0.9%) | 7 (1.1%) |
| 35 to 39 Years | 43 (5.8%) | 44 (6.6%) |
| 40 to 44 Years | 78 (10.5%) | 62 (9.3%) |
| 45 to 49 Years | 56 (7.6%) | 37 (5.6%) |
| 50 to 54 Years | 60 (8.1%) | 41 (6.2%) |
| 55 to 59 Years | 47 (6.3%) | 76 (11.4%) |
| 60 to 64 Years | 70 (9.5%) | 28 (4.2%) |
| 65 to 69 Years | 52 (7.0%) | 75 (11.3%) |
| 70 to 74 Years | 17 (2.3%) | 53 (8.0%) |
| 75 to 79 Years | 43 (5.8%) | 24 (3.6%) |
| 80 to 84 Years | 14 (1.9%) | 0 (0.0%) |
| 85 Years and over | 0 (0.0%) | 25 (3.7%) |
| Total | 741 (100.0%) | 666 (100.0%) |
Families and Households in Brickerville
Median Family Size in Brickerville
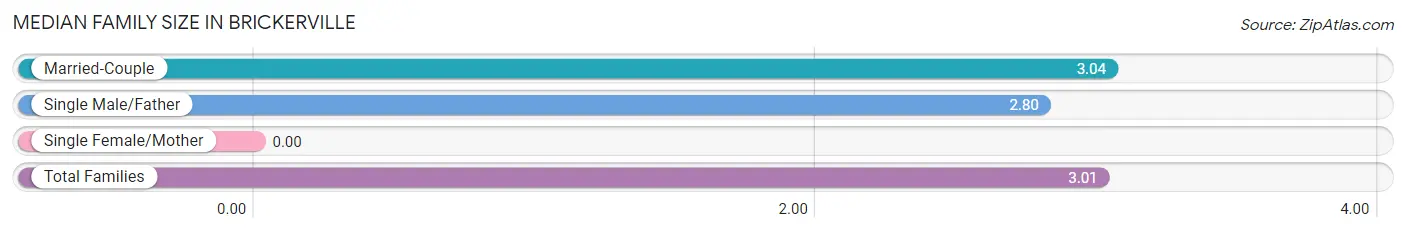
| Family Type | # Families | Family Size |
| Married-Couple | 385 (90.4%) | 3.04 |
| Single Male/Father | 41 (9.6%) | 2.80 |
| Single Female/Mother | 0 (0.0%) | - |
| Total Families | 426 (100.0%) | 3.01 |
Median Household Size in Brickerville
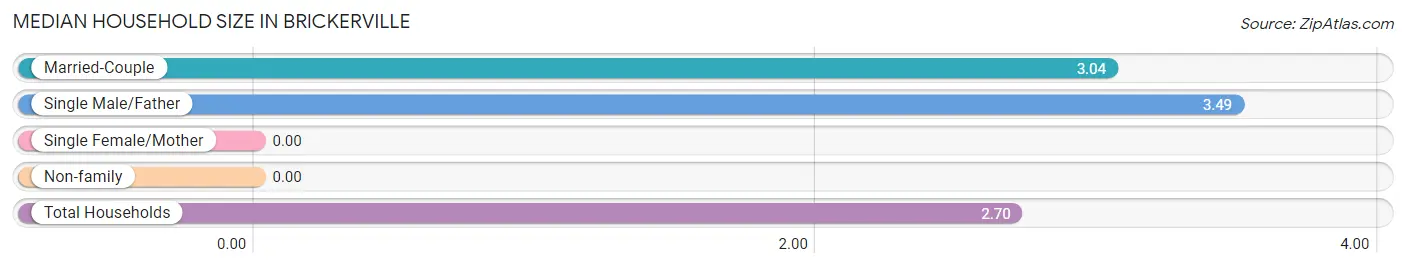
| Household Type | # Households | Household Size |
| Married-Couple | 385 (73.9%) | 3.04 |
| Single Male/Father | 41 (7.9%) | 3.49 |
| Single Female/Mother | 0 (0.0%) | - |
| Non-family | 95 (18.2%) | - |
| Total Households | 521 (100.0%) | 2.70 |
Household Size by Marriage Status in Brickerville
Out of a total of 521 households in Brickerville, 426 (81.8%) are family households, while 95 (18.2%) are nonfamily households. The most numerous type of family households are 2-person households, comprising 196, and the most common type of nonfamily households are 1-person households, comprising 95.
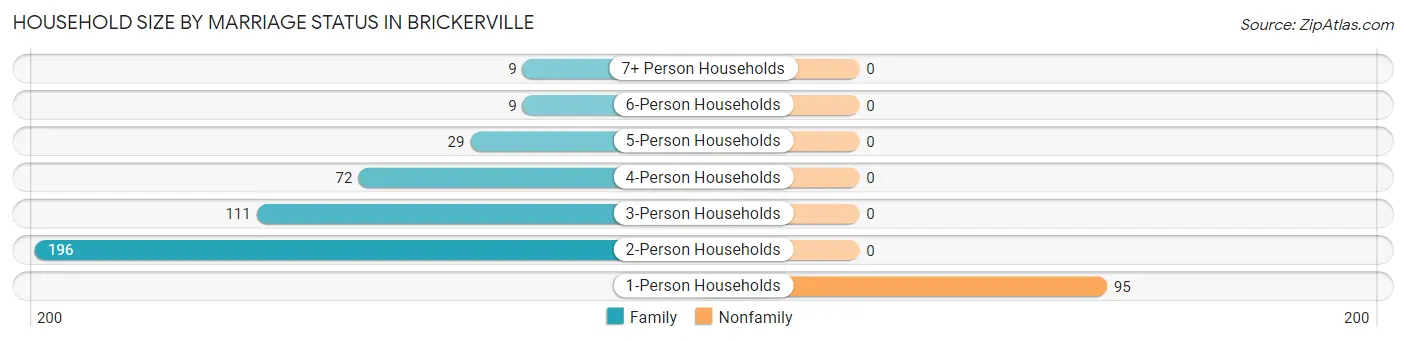
| Household Size | Family Households | Nonfamily Households |
| 1-Person Households | - | 95 (18.2%) |
| 2-Person Households | 196 (37.6%) | 0 (0.0%) |
| 3-Person Households | 111 (21.3%) | 0 (0.0%) |
| 4-Person Households | 72 (13.8%) | 0 (0.0%) |
| 5-Person Households | 29 (5.6%) | 0 (0.0%) |
| 6-Person Households | 9 (1.7%) | 0 (0.0%) |
| 7+ Person Households | 9 (1.7%) | 0 (0.0%) |
| Total | 426 (81.8%) | 95 (18.2%) |
Female Fertility in Brickerville
Fertility by Age in Brickerville
| Age Bracket | Women with Births | Births / 1,000 Women |
| 15 to 19 years | 0 (0.0%) | 0.0 |
| 20 to 34 years | 0 (0.0%) | 0.0 |
| 35 to 50 years | 0 (0.0%) | 0.0 |
| Total | 0 (0.0%) | 0.0 |
Fertility by Age by Marriage Status in Brickerville
| Age Bracket | Married | Unmarried |
| 15 to 19 years | 0 (0.0%) | 0 (0.0%) |
| 20 to 34 years | 0 (0.0%) | 0 (0.0%) |
| 35 to 50 years | 0 (0.0%) | 0 (0.0%) |
| Total | 0 (0.0%) | 0 (0.0%) |
Fertility by Education in Brickerville
| Educational Attainment | Women with Births | Births / 1,000 Women |
| Less than High School | 0 (0.0%) | 0.0 |
| High School Diploma | 0 (0.0%) | 0.0 |
| College or Associate's Degree | 0 (0.0%) | 0.0 |
| Bachelor's Degree | 0 (0.0%) | 0.0 |
| Graduate Degree | 0 (0.0%) | 0.0 |
| Total | 0 (0.0%) | 0.0 |
Fertility by Education by Marriage Status in Brickerville
| Educational Attainment | Married | Unmarried |
| Less than High School | 0 (0.0%) | 0 (0.0%) |
| High School Diploma | 0 (0.0%) | 0 (0.0%) |
| College or Associate's Degree | 0 (0.0%) | 0 (0.0%) |
| Bachelor's Degree | 0 (0.0%) | 0 (0.0%) |
| Graduate Degree | 0 (0.0%) | 0 (0.0%) |
| Total | 0 (0.0%) | 0 (0.0%) |
Employment Characteristics in Brickerville
Employment by Class of Employer in Brickerville
Among the 821 employed individuals in Brickerville, private company employees (680 | 82.8%), not-for-profit organizations (84 | 10.2%), and self-employed (not incorporated) (32 | 3.9%) make up the most common classes of employment.
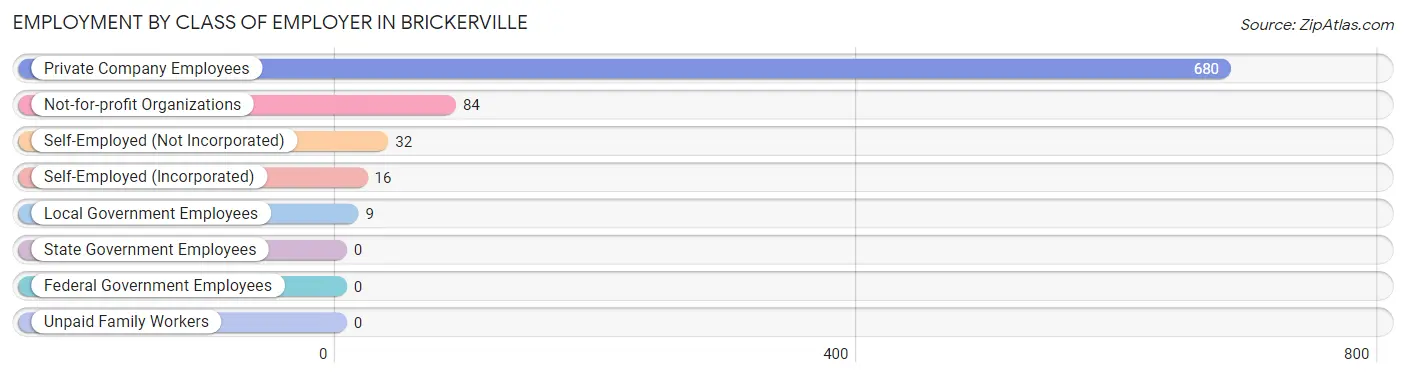
| Employer Class | # Employees | % Employees |
| Private Company Employees | 680 | 82.8% |
| Self-Employed (Incorporated) | 16 | 1.9% |
| Self-Employed (Not Incorporated) | 32 | 3.9% |
| Not-for-profit Organizations | 84 | 10.2% |
| Local Government Employees | 9 | 1.1% |
| State Government Employees | 0 | 0.0% |
| Federal Government Employees | 0 | 0.0% |
| Unpaid Family Workers | 0 | 0.0% |
| Total | 821 | 100.0% |
Employment Status by Age in Brickerville
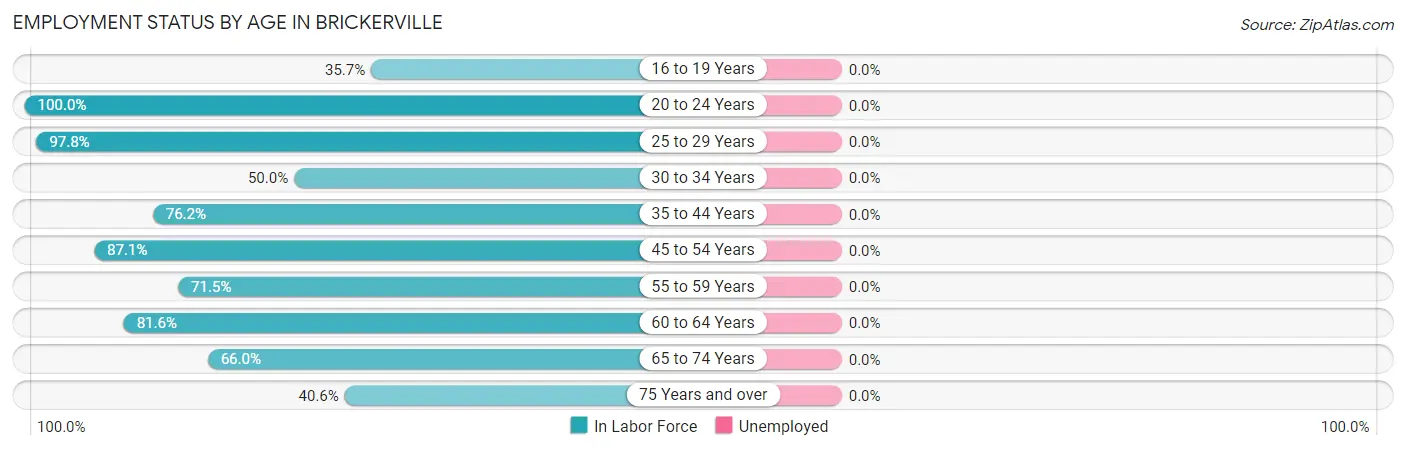
| Age Bracket | In Labor Force | Unemployed |
| 16 to 19 Years | 20 (35.7%) | 0 (0.0%) |
| 20 to 24 Years | 100 (100.0%) | 0 (0.0%) |
| 25 to 29 Years | 44 (97.8%) | 0 (0.0%) |
| 30 to 34 Years | 7 (50.0%) | 0 (0.0%) |
| 35 to 44 Years | 173 (76.2%) | 0 (0.0%) |
| 45 to 54 Years | 169 (87.1%) | 0 (0.0%) |
| 55 to 59 Years | 88 (71.5%) | 0 (0.0%) |
| 60 to 64 Years | 80 (81.6%) | 0 (0.0%) |
| 65 to 74 Years | 130 (66.0%) | 0 (0.0%) |
| 75 Years and over | 43 (40.6%) | 0 (0.0%) |
| Total | 854 (73.6%) | 0 (0.0%) |
Employment Status by Educational Attainment in Brickerville
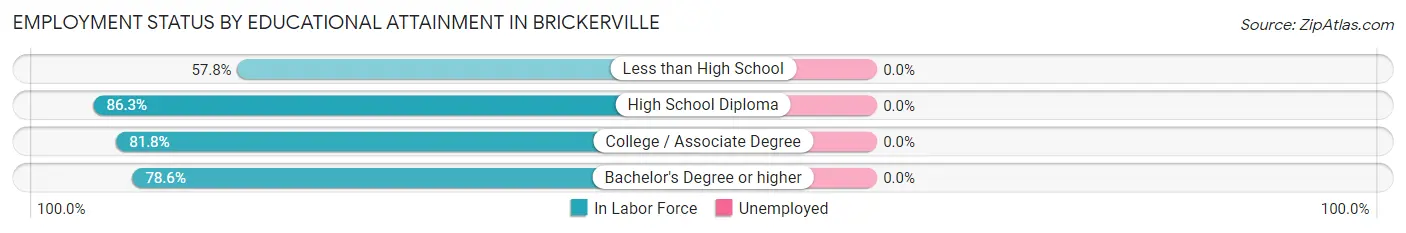
| Educational Attainment | In Labor Force | Unemployed |
| Less than High School | 48 (57.8%) | 0 (0.0%) |
| High School Diploma | 233 (86.3%) | 0 (0.0%) |
| College / Associate Degree | 166 (81.8%) | 0 (0.0%) |
| Bachelor's Degree or higher | 114 (78.6%) | 0 (0.0%) |
| Total | 561 (80.0%) | 0 (0.0%) |
Employment Occupations by Sex in Brickerville
Management, Business, Science and Arts Occupations
The most common Management, Business, Science and Arts occupations in Brickerville are Health Diagnosing & Treating (77 | 9.0%), Management (57 | 6.7%), Community & Social Service (28 | 3.3%), Education Instruction & Library (20 | 2.3%), and Business & Financial (18 | 2.1%).
Management, Business, Science and Arts Occupations by Sex
Within the Management, Business, Science and Arts occupations in Brickerville, the most male-oriented occupations are Computers, Engineering & Science (100.0%), Architecture & Engineering (100.0%), and Education, Arts & Media (100.0%), while the most female-oriented occupations are Business & Financial (100.0%), Health Diagnosing & Treating (79.2%), and Education Instruction & Library (55.0%).
| Occupation | Male | Female |
| Management | 47 (82.5%) | 10 (17.5%) |
| Business & Financial | 0 (0.0%) | 18 (100.0%) |
| Computers, Engineering & Science | 10 (100.0%) | 0 (0.0%) |
| Computers & Mathematics | 0 (0.0%) | 0 (0.0%) |
| Architecture & Engineering | 10 (100.0%) | 0 (0.0%) |
| Life, Physical & Social Science | 0 (0.0%) | 0 (0.0%) |
| Community & Social Service | 17 (60.7%) | 11 (39.3%) |
| Education, Arts & Media | 8 (100.0%) | 0 (0.0%) |
| Legal Services & Support | 0 (0.0%) | 0 (0.0%) |
| Education Instruction & Library | 9 (45.0%) | 11 (55.0%) |
| Arts, Media & Entertainment | 0 (0.0%) | 0 (0.0%) |
| Health Diagnosing & Treating | 16 (20.8%) | 61 (79.2%) |
| Health Technologists | 16 (100.0%) | 0 (0.0%) |
| Total (Category) | 90 (47.4%) | 100 (52.6%) |
| Total (Overall) | 477 (55.8%) | 377 (44.2%) |
Services Occupations
The most common Services occupations in Brickerville are Healthcare Support (45 | 5.3%), Food Preparation & Serving (39 | 4.6%), and Cleaning & Maintenance (21 | 2.5%).
Services Occupations by Sex
Within the Services occupations in Brickerville, the most male-oriented occupations are Food Preparation & Serving (76.9%), and Cleaning & Maintenance (47.6%), while the most female-oriented occupations are Healthcare Support (100.0%), Cleaning & Maintenance (52.4%), and Food Preparation & Serving (23.1%).
| Occupation | Male | Female |
| Healthcare Support | 0 (0.0%) | 45 (100.0%) |
| Security & Protection | 0 (0.0%) | 0 (0.0%) |
| Firefighting & Prevention | 0 (0.0%) | 0 (0.0%) |
| Law Enforcement | 0 (0.0%) | 0 (0.0%) |
| Food Preparation & Serving | 30 (76.9%) | 9 (23.1%) |
| Cleaning & Maintenance | 10 (47.6%) | 11 (52.4%) |
| Personal Care & Service | 0 (0.0%) | 0 (0.0%) |
| Total (Category) | 40 (38.1%) | 65 (61.9%) |
| Total (Overall) | 477 (55.8%) | 377 (44.2%) |
Sales and Office Occupations
The most common Sales and Office occupations in Brickerville are Office & Administration (129 | 15.1%), and Sales & Related (54 | 6.3%).
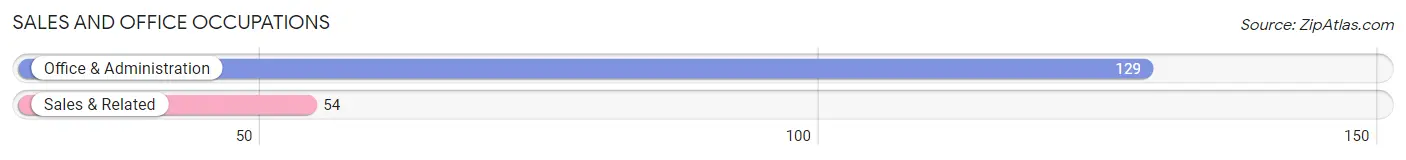
Sales and Office Occupations by Sex
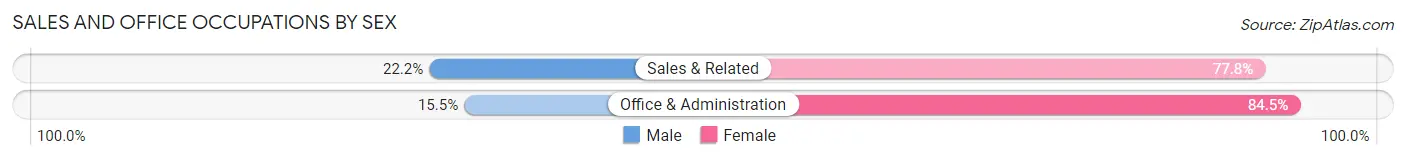
| Occupation | Male | Female |
| Sales & Related | 12 (22.2%) | 42 (77.8%) |
| Office & Administration | 20 (15.5%) | 109 (84.5%) |
| Total (Category) | 32 (17.5%) | 151 (82.5%) |
| Total (Overall) | 477 (55.8%) | 377 (44.2%) |
Natural Resources, Construction and Maintenance Occupations
The most common Natural Resources, Construction and Maintenance occupations in Brickerville are Installation, Maintenance & Repair (66 | 7.7%), Construction & Extraction (44 | 5.1%), and Farming, Fishing & Forestry (22 | 2.6%).
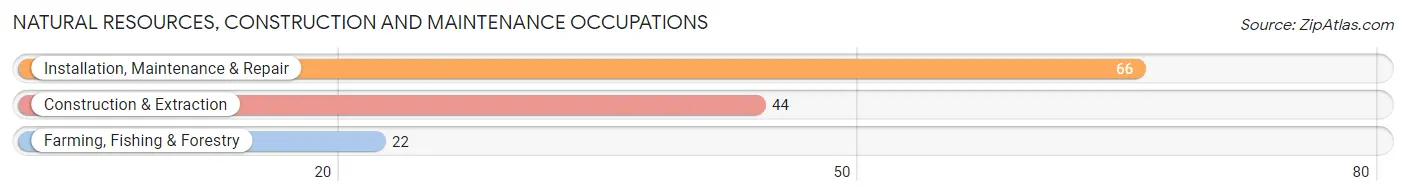
Natural Resources, Construction and Maintenance Occupations by Sex
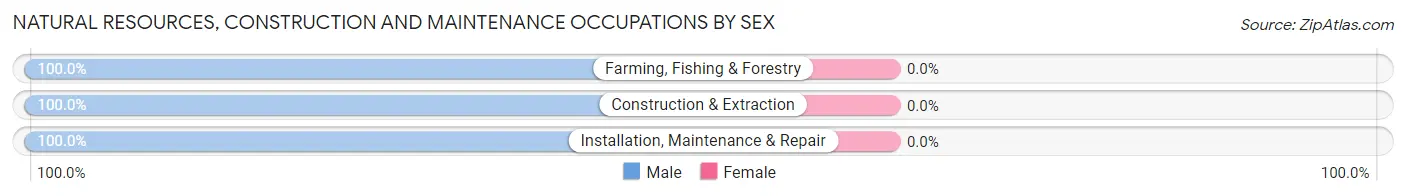
| Occupation | Male | Female |
| Farming, Fishing & Forestry | 22 (100.0%) | 0 (0.0%) |
| Construction & Extraction | 44 (100.0%) | 0 (0.0%) |
| Installation, Maintenance & Repair | 66 (100.0%) | 0 (0.0%) |
| Total (Category) | 132 (100.0%) | 0 (0.0%) |
| Total (Overall) | 477 (55.8%) | 377 (44.2%) |
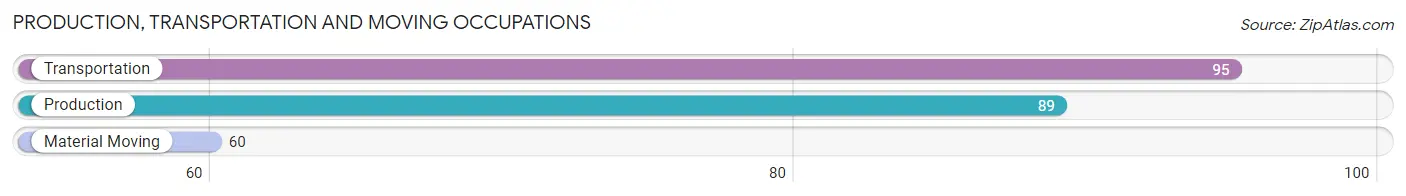
Production, Transportation and Moving Occupations
The most common Production, Transportation and Moving occupations in Brickerville are Transportation (95 | 11.1%), Production (89 | 10.4%), and Material Moving (60 | 7.0%).
Production, Transportation and Moving Occupations by Sex
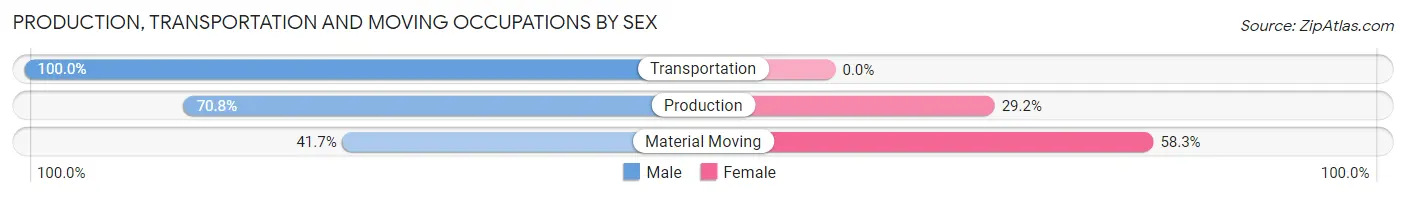
| Occupation | Male | Female |
| Production | 63 (70.8%) | 26 (29.2%) |
| Transportation | 95 (100.0%) | 0 (0.0%) |
| Material Moving | 25 (41.7%) | 35 (58.3%) |
| Total (Category) | 183 (75.0%) | 61 (25.0%) |
| Total (Overall) | 477 (55.8%) | 377 (44.2%) |
Employment Industries by Sex in Brickerville
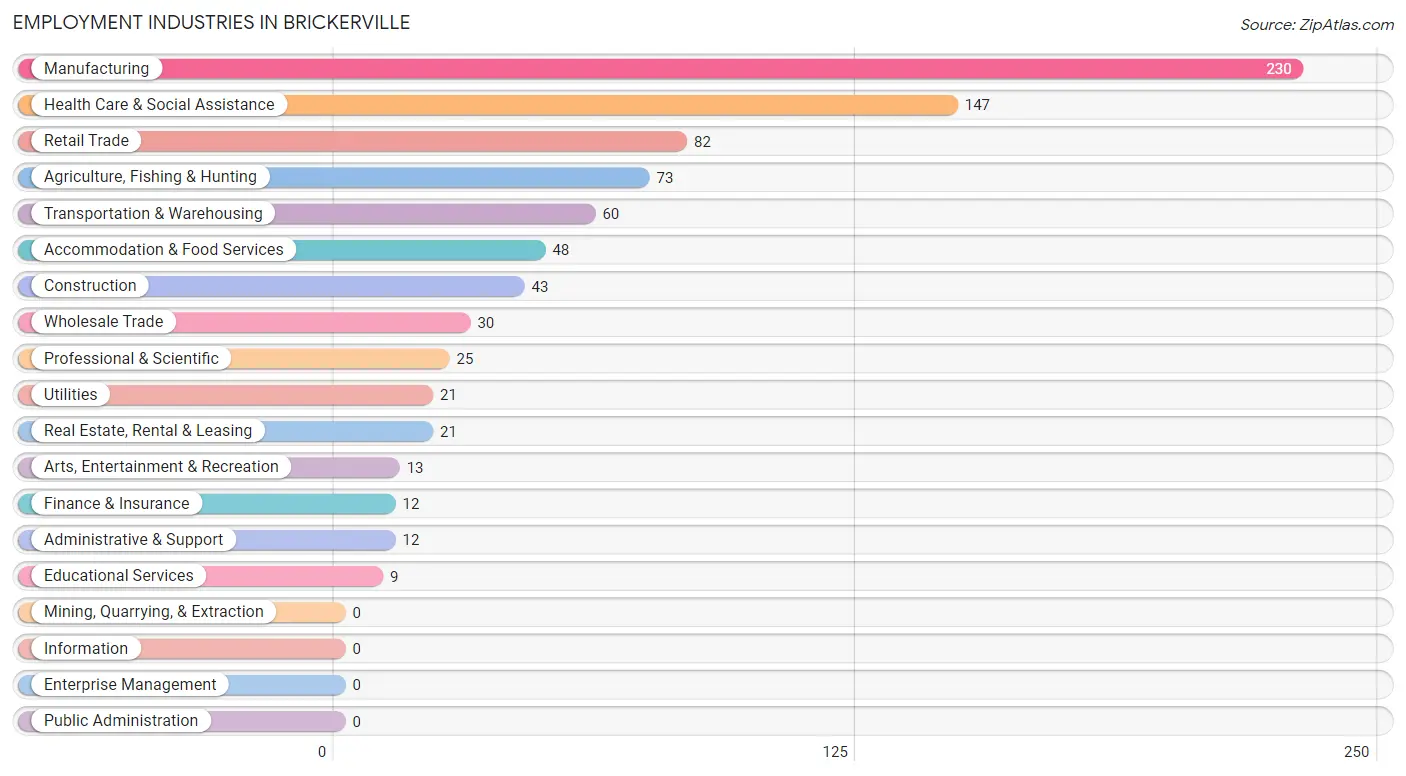
Employment Industries in Brickerville
The major employment industries in Brickerville include Manufacturing (230 | 26.9%), Health Care & Social Assistance (147 | 17.2%), Retail Trade (82 | 9.6%), Agriculture, Fishing & Hunting (73 | 8.6%), and Transportation & Warehousing (60 | 7.0%).
Employment Industries by Sex in Brickerville
The Brickerville industries that see more men than women are Construction (100.0%), Transportation & Warehousing (100.0%), and Finance & Insurance (100.0%), whereas the industries that tend to have a higher number of women are Real Estate, Rental & Leasing (100.0%), Professional & Scientific (100.0%), and Administrative & Support (91.7%).
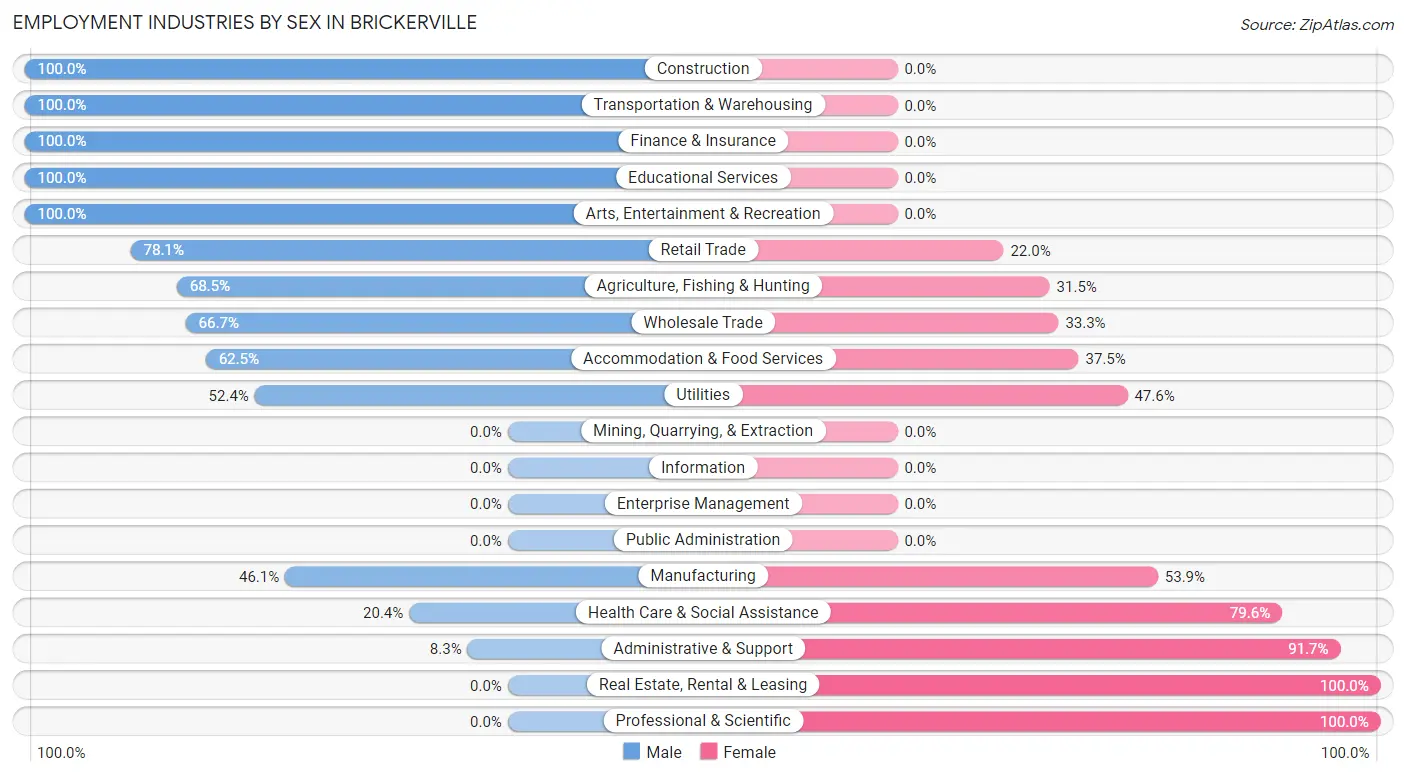
| Industry | Male | Female |
| Agriculture, Fishing & Hunting | 50 (68.5%) | 23 (31.5%) |
| Mining, Quarrying, & Extraction | 0 (0.0%) | 0 (0.0%) |
| Construction | 43 (100.0%) | 0 (0.0%) |
| Manufacturing | 106 (46.1%) | 124 (53.9%) |
| Wholesale Trade | 20 (66.7%) | 10 (33.3%) |
| Retail Trade | 64 (78.0%) | 18 (22.0%) |
| Transportation & Warehousing | 60 (100.0%) | 0 (0.0%) |
| Utilities | 11 (52.4%) | 10 (47.6%) |
| Information | 0 (0.0%) | 0 (0.0%) |
| Finance & Insurance | 12 (100.0%) | 0 (0.0%) |
| Real Estate, Rental & Leasing | 0 (0.0%) | 21 (100.0%) |
| Professional & Scientific | 0 (0.0%) | 25 (100.0%) |
| Enterprise Management | 0 (0.0%) | 0 (0.0%) |
| Administrative & Support | 1 (8.3%) | 11 (91.7%) |
| Educational Services | 9 (100.0%) | 0 (0.0%) |
| Health Care & Social Assistance | 30 (20.4%) | 117 (79.6%) |
| Arts, Entertainment & Recreation | 13 (100.0%) | 0 (0.0%) |
| Accommodation & Food Services | 30 (62.5%) | 18 (37.5%) |
| Public Administration | 0 (0.0%) | 0 (0.0%) |
| Total | 477 (55.8%) | 377 (44.2%) |
Education in Brickerville
School Enrollment in Brickerville
The most common levels of schooling among the 238 students in Brickerville are high school (101 | 42.4%), elementary school (49 | 20.6%), and middle school (37 | 15.5%).
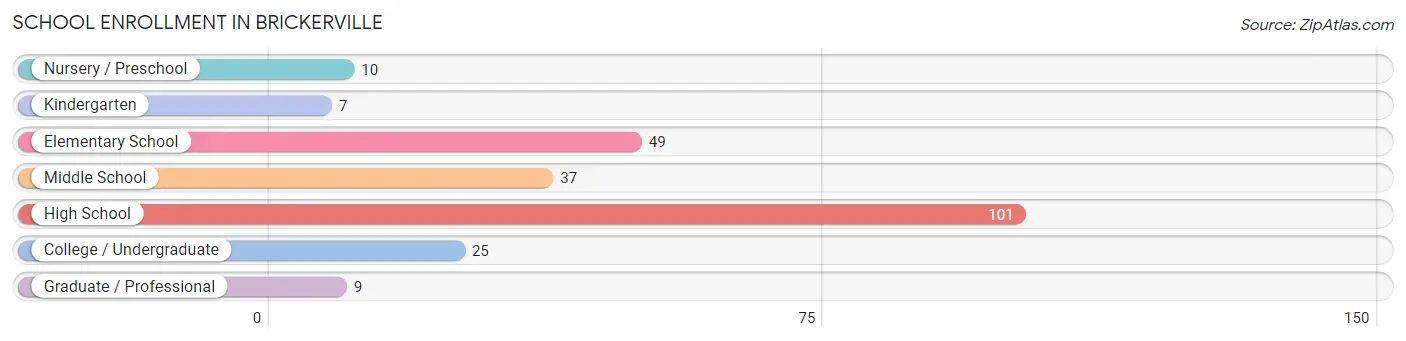
| School Level | # Students | % Students |
| Nursery / Preschool | 10 | 4.2% |
| Kindergarten | 7 | 2.9% |
| Elementary School | 49 | 20.6% |
| Middle School | 37 | 15.5% |
| High School | 101 | 42.4% |
| College / Undergraduate | 25 | 10.5% |
| Graduate / Professional | 9 | 3.8% |
| Total | 238 | 100.0% |
School Enrollment by Age by Funding Source in Brickerville
Out of a total of 238 students who are enrolled in schools in Brickerville, 27 (11.3%) attend a private institution, while the remaining 211 (88.7%) are enrolled in public schools. The age group of 10 to 14 year olds has the highest likelihood of being enrolled in private schools, with 27 (45.8% in the age bracket) enrolled. Conversely, the age group of 3 to 4 year olds has the lowest likelihood of being enrolled in a private school, with 10 (100.0% in the age bracket) attending a public institution.
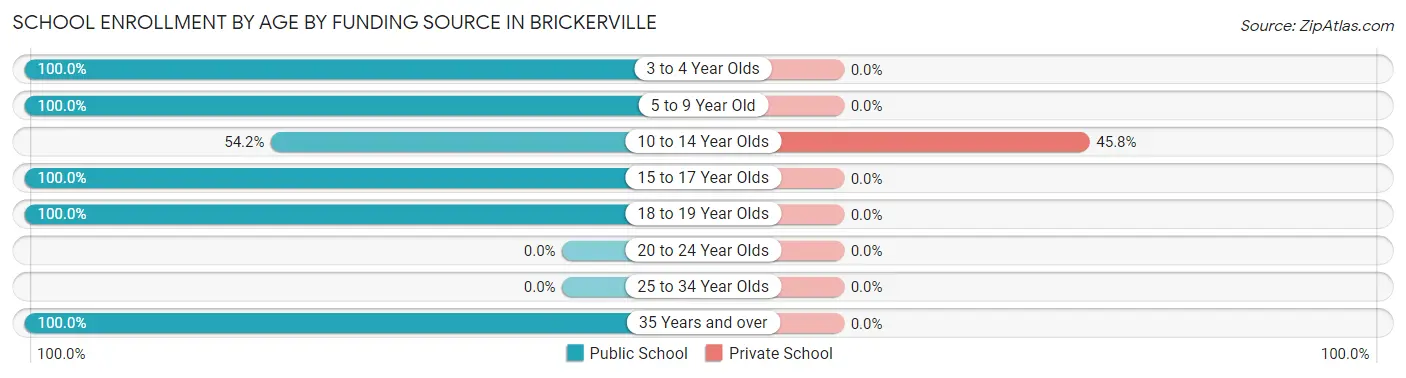
| Age Bracket | Public School | Private School |
| 3 to 4 Year Olds | 10 (100.0%) | 0 (0.0%) |
| 5 to 9 Year Old | 43 (100.0%) | 0 (0.0%) |
| 10 to 14 Year Olds | 32 (54.2%) | 27 (45.8%) |
| 15 to 17 Year Olds | 92 (100.0%) | 0 (0.0%) |
| 18 to 19 Year Olds | 11 (100.0%) | 0 (0.0%) |
| 20 to 24 Year Olds | 0 (0.0%) | 0 (0.0%) |
| 25 to 34 Year Olds | 0 (0.0%) | 0 (0.0%) |
| 35 Years and over | 23 (100.0%) | 0 (0.0%) |
| Total | 211 (88.7%) | 27 (11.3%) |
Educational Attainment by Field of Study in Brickerville
Business (40 | 24.5%), visual & performing arts (31 | 19.0%), psychology (26 | 16.0%), education (26 | 16.0%), and communications (12 | 7.4%) are the most common fields of study among 163 individuals in Brickerville who have obtained a bachelor's degree or higher.
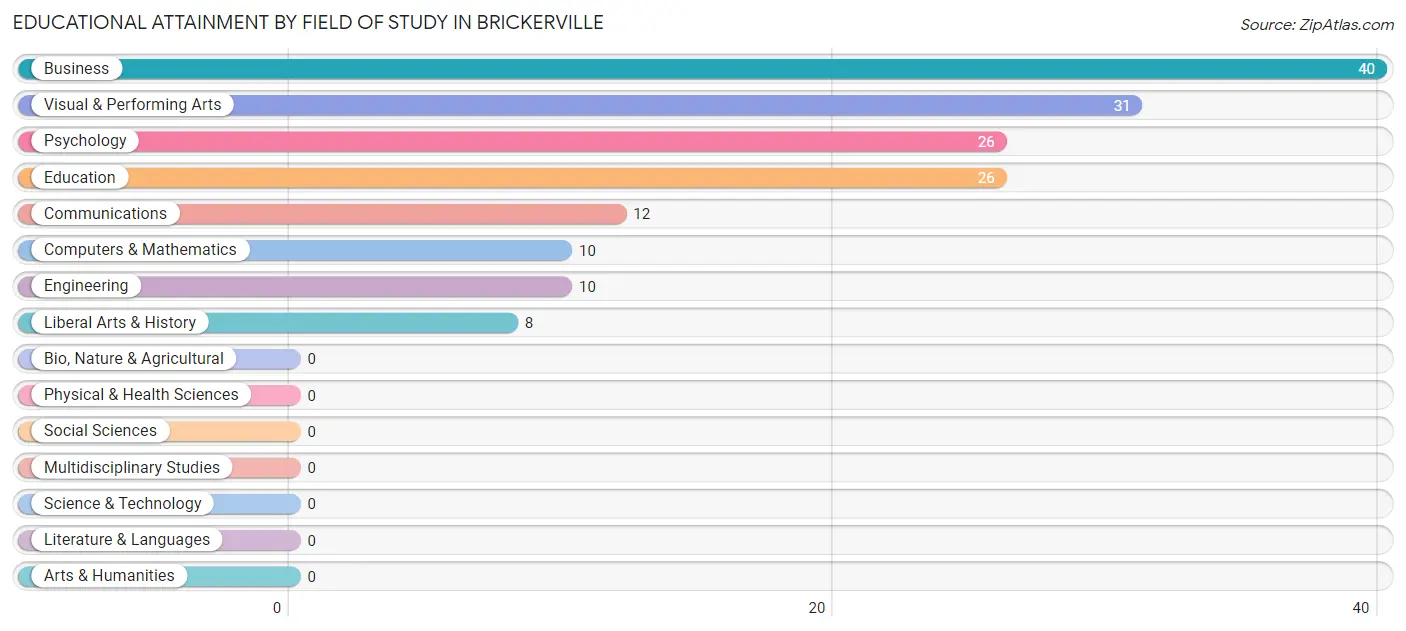
| Field of Study | # Graduates | % Graduates |
| Computers & Mathematics | 10 | 6.1% |
| Bio, Nature & Agricultural | 0 | 0.0% |
| Physical & Health Sciences | 0 | 0.0% |
| Psychology | 26 | 16.0% |
| Social Sciences | 0 | 0.0% |
| Engineering | 10 | 6.1% |
| Multidisciplinary Studies | 0 | 0.0% |
| Science & Technology | 0 | 0.0% |
| Business | 40 | 24.5% |
| Education | 26 | 16.0% |
| Literature & Languages | 0 | 0.0% |
| Liberal Arts & History | 8 | 4.9% |
| Visual & Performing Arts | 31 | 19.0% |
| Communications | 12 | 7.4% |
| Arts & Humanities | 0 | 0.0% |
| Total | 163 | 100.0% |
Transportation & Commute in Brickerville
Vehicle Availability by Sex in Brickerville
The most prevalent vehicle ownership categories in Brickerville are males with 2 vehicles (171, accounting for 36.6%) and females with 2 vehicles (103, making up 48.3%).
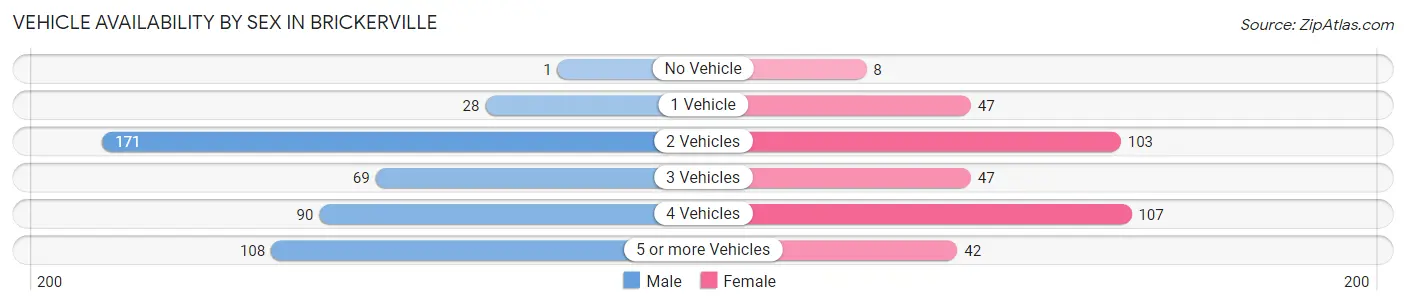
| Vehicles Available | Male | Female |
| No Vehicle | 1 (0.2%) | 8 (2.3%) |
| 1 Vehicle | 28 (6.0%) | 47 (13.3%) |
| 2 Vehicles | 171 (36.6%) | 103 (29.1%) |
| 3 Vehicles | 69 (14.8%) | 47 (13.3%) |
| 4 Vehicles | 90 (19.3%) | 107 (30.2%) |
| 5 or more Vehicles | 108 (23.1%) | 42 (11.9%) |
| Total | 467 (100.0%) | 354 (100.0%) |
Commute Time in Brickerville
The most frequently occuring commute durations in Brickerville are 20 to 24 minutes (184 commuters, 24.7%), 30 to 34 minutes (134 commuters, 18.0%), and 15 to 19 minutes (120 commuters, 16.1%).
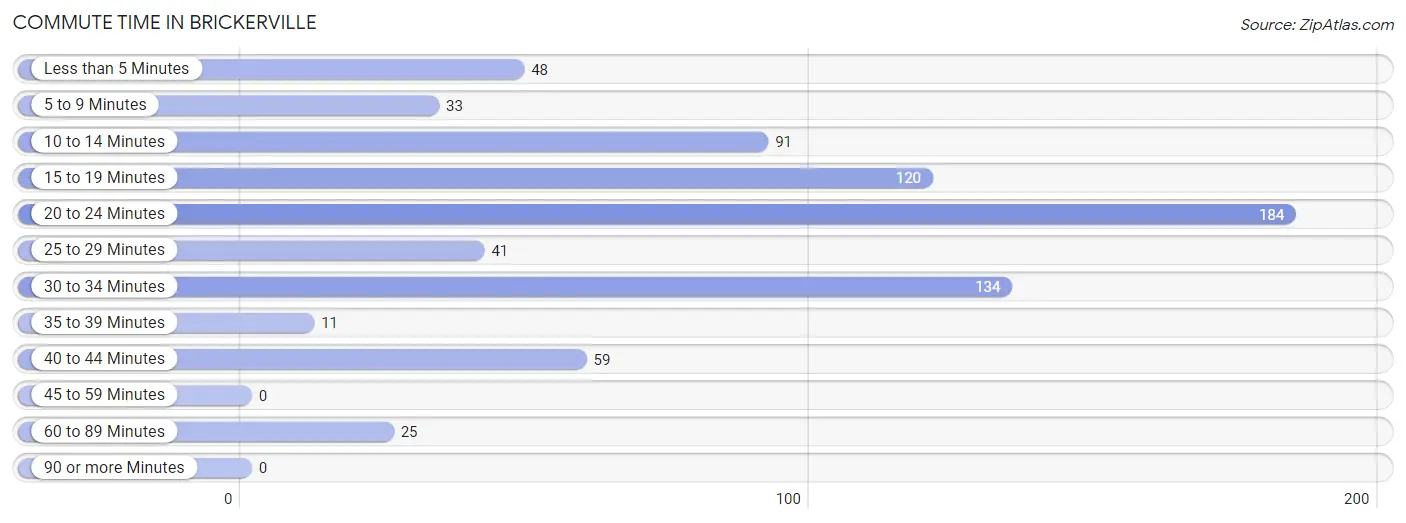
| Commute Time | # Commuters | % Commuters |
| Less than 5 Minutes | 48 | 6.4% |
| 5 to 9 Minutes | 33 | 4.4% |
| 10 to 14 Minutes | 91 | 12.2% |
| 15 to 19 Minutes | 120 | 16.1% |
| 20 to 24 Minutes | 184 | 24.7% |
| 25 to 29 Minutes | 41 | 5.5% |
| 30 to 34 Minutes | 134 | 18.0% |
| 35 to 39 Minutes | 11 | 1.5% |
| 40 to 44 Minutes | 59 | 7.9% |
| 45 to 59 Minutes | 0 | 0.0% |
| 60 to 89 Minutes | 25 | 3.4% |
| 90 or more Minutes | 0 | 0.0% |
Commute Time by Sex in Brickerville
The most common commute times in Brickerville are 30 to 34 minutes (80 commuters, 19.5%) for males and 20 to 24 minutes (121 commuters, 36.0%) for females.
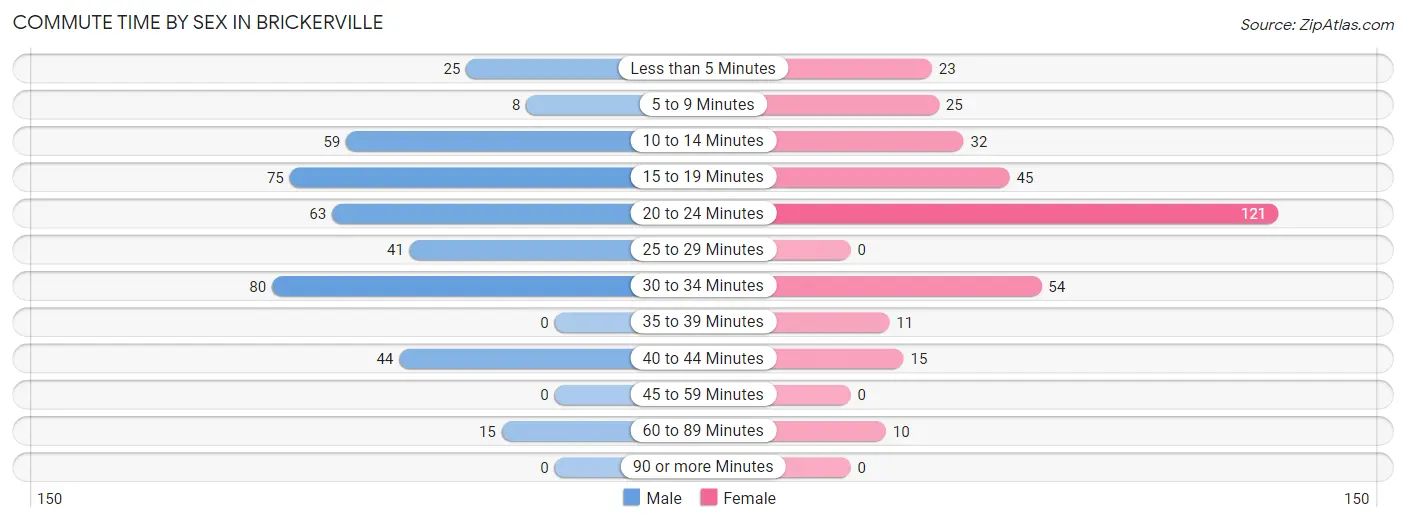
| Commute Time | Male | Female |
| Less than 5 Minutes | 25 (6.1%) | 23 (6.9%) |
| 5 to 9 Minutes | 8 (1.9%) | 25 (7.4%) |
| 10 to 14 Minutes | 59 (14.4%) | 32 (9.5%) |
| 15 to 19 Minutes | 75 (18.3%) | 45 (13.4%) |
| 20 to 24 Minutes | 63 (15.4%) | 121 (36.0%) |
| 25 to 29 Minutes | 41 (10.0%) | 0 (0.0%) |
| 30 to 34 Minutes | 80 (19.5%) | 54 (16.1%) |
| 35 to 39 Minutes | 0 (0.0%) | 11 (3.3%) |
| 40 to 44 Minutes | 44 (10.7%) | 15 (4.5%) |
| 45 to 59 Minutes | 0 (0.0%) | 0 (0.0%) |
| 60 to 89 Minutes | 15 (3.7%) | 10 (3.0%) |
| 90 or more Minutes | 0 (0.0%) | 0 (0.0%) |
Time of Departure to Work by Sex in Brickerville
The most frequent times of departure to work in Brickerville are 5:30 AM to 5:59 AM (87, 21.2%) for males and 7:30 AM to 7:59 AM (89, 26.5%) for females.
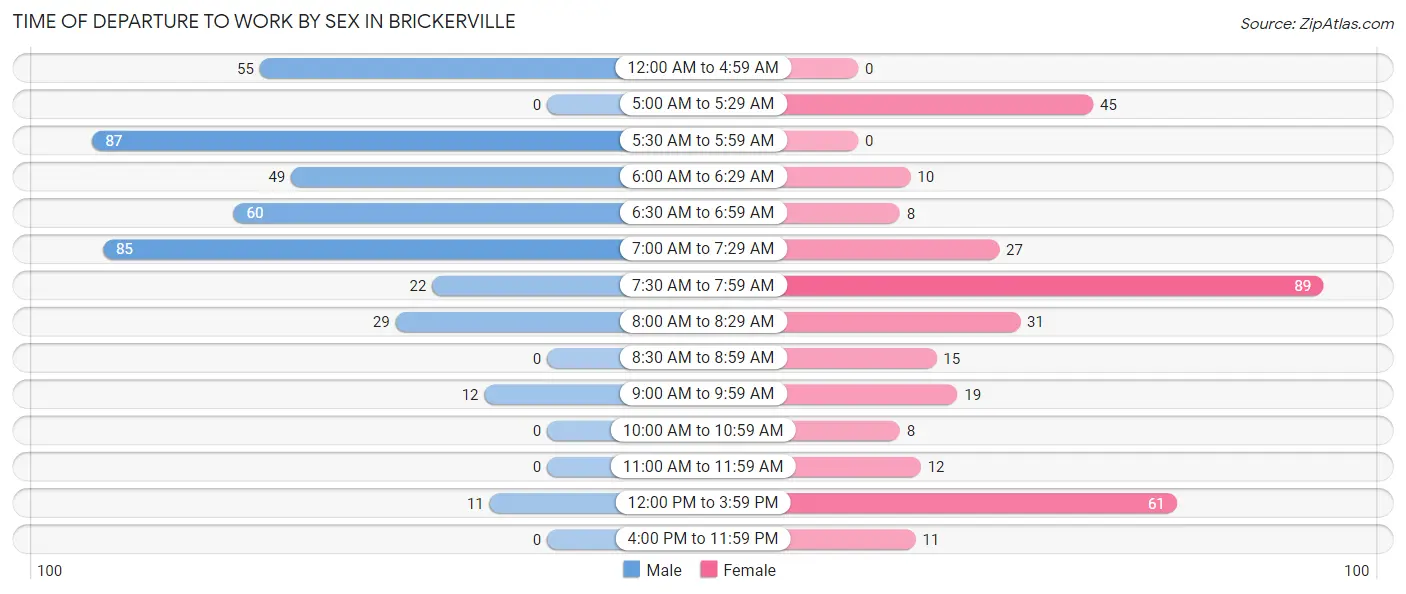
| Time of Departure | Male | Female |
| 12:00 AM to 4:59 AM | 55 (13.4%) | 0 (0.0%) |
| 5:00 AM to 5:29 AM | 0 (0.0%) | 45 (13.4%) |
| 5:30 AM to 5:59 AM | 87 (21.2%) | 0 (0.0%) |
| 6:00 AM to 6:29 AM | 49 (11.9%) | 10 (3.0%) |
| 6:30 AM to 6:59 AM | 60 (14.6%) | 8 (2.4%) |
| 7:00 AM to 7:29 AM | 85 (20.7%) | 27 (8.0%) |
| 7:30 AM to 7:59 AM | 22 (5.4%) | 89 (26.5%) |
| 8:00 AM to 8:29 AM | 29 (7.1%) | 31 (9.2%) |
| 8:30 AM to 8:59 AM | 0 (0.0%) | 15 (4.5%) |
| 9:00 AM to 9:59 AM | 12 (2.9%) | 19 (5.7%) |
| 10:00 AM to 10:59 AM | 0 (0.0%) | 8 (2.4%) |
| 11:00 AM to 11:59 AM | 0 (0.0%) | 12 (3.6%) |
| 12:00 PM to 3:59 PM | 11 (2.7%) | 61 (18.1%) |
| 4:00 PM to 11:59 PM | 0 (0.0%) | 11 (3.3%) |
| Total | 410 (100.0%) | 336 (100.0%) |
Housing Occupancy in Brickerville
Occupancy by Ownership in Brickerville
Of the total 521 dwellings in Brickerville, owner-occupied units account for 487 (93.5%), while renter-occupied units make up 34 (6.5%).
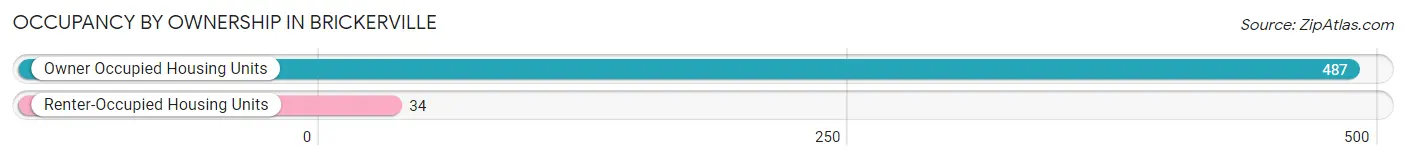
| Occupancy | # Housing Units | % Housing Units |
| Owner Occupied Housing Units | 487 | 93.5% |
| Renter-Occupied Housing Units | 34 | 6.5% |
| Total Occupied Housing Units | 521 | 100.0% |
Occupancy by Household Size in Brickerville
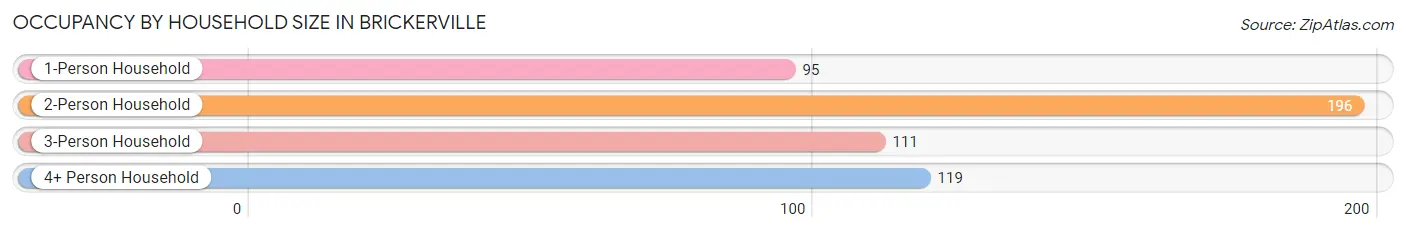
| Household Size | # Housing Units | % Housing Units |
| 1-Person Household | 95 | 18.2% |
| 2-Person Household | 196 | 37.6% |
| 3-Person Household | 111 | 21.3% |
| 4+ Person Household | 119 | 22.8% |
| Total Housing Units | 521 | 100.0% |
Occupancy by Ownership by Household Size in Brickerville
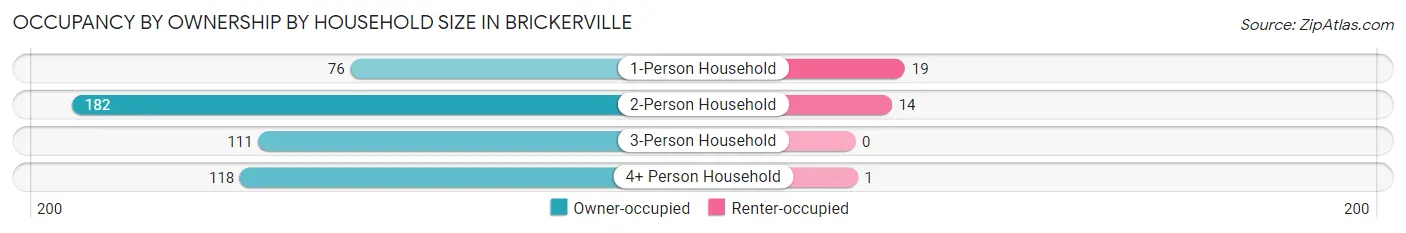
| Household Size | Owner-occupied | Renter-occupied |
| 1-Person Household | 76 (80.0%) | 19 (20.0%) |
| 2-Person Household | 182 (92.9%) | 14 (7.1%) |
| 3-Person Household | 111 (100.0%) | 0 (0.0%) |
| 4+ Person Household | 118 (99.2%) | 1 (0.8%) |
| Total Housing Units | 487 (93.5%) | 34 (6.5%) |
Occupancy by Educational Attainment in Brickerville

| Household Size | Owner-occupied | Renter-occupied |
| Less than High School | 69 (100.0%) | 0 (0.0%) |
| High School Diploma | 220 (94.0%) | 14 (6.0%) |
| College/Associate Degree | 106 (89.8%) | 12 (10.2%) |
| Bachelor's Degree or higher | 92 (92.0%) | 8 (8.0%) |
Occupancy by Age of Householder in Brickerville
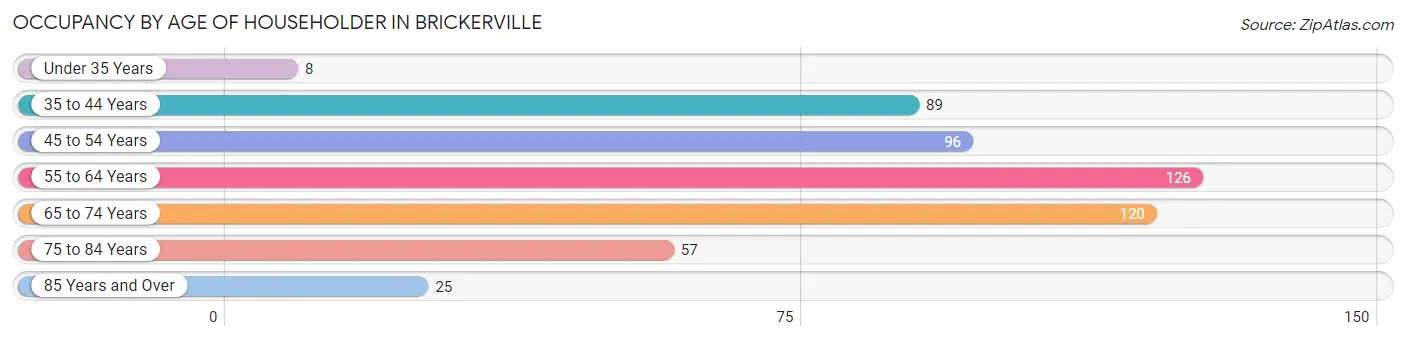
| Age Bracket | # Households | % Households |
| Under 35 Years | 8 | 1.5% |
| 35 to 44 Years | 89 | 17.1% |
| 45 to 54 Years | 96 | 18.4% |
| 55 to 64 Years | 126 | 24.2% |
| 65 to 74 Years | 120 | 23.0% |
| 75 to 84 Years | 57 | 10.9% |
| 85 Years and Over | 25 | 4.8% |
| Total | 521 | 100.0% |
Housing Finances in Brickerville
Median Income by Occupancy in Brickerville
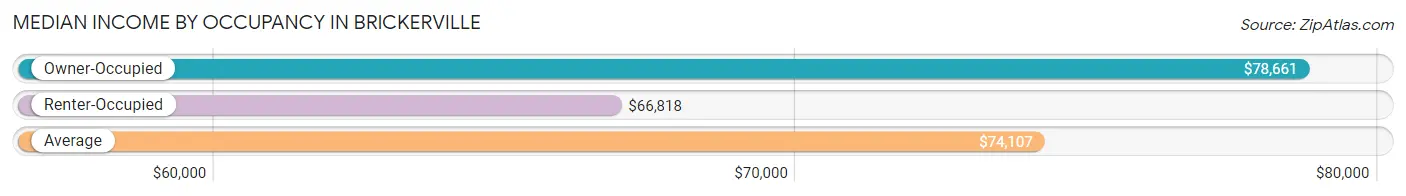
| Occupancy Type | # Households | Median Income |
| Owner-Occupied | 487 (93.5%) | $78,661 |
| Renter-Occupied | 34 (6.5%) | $66,818 |
| Average | 521 (100.0%) | $74,107 |
Occupancy by Householder Income Bracket in Brickerville
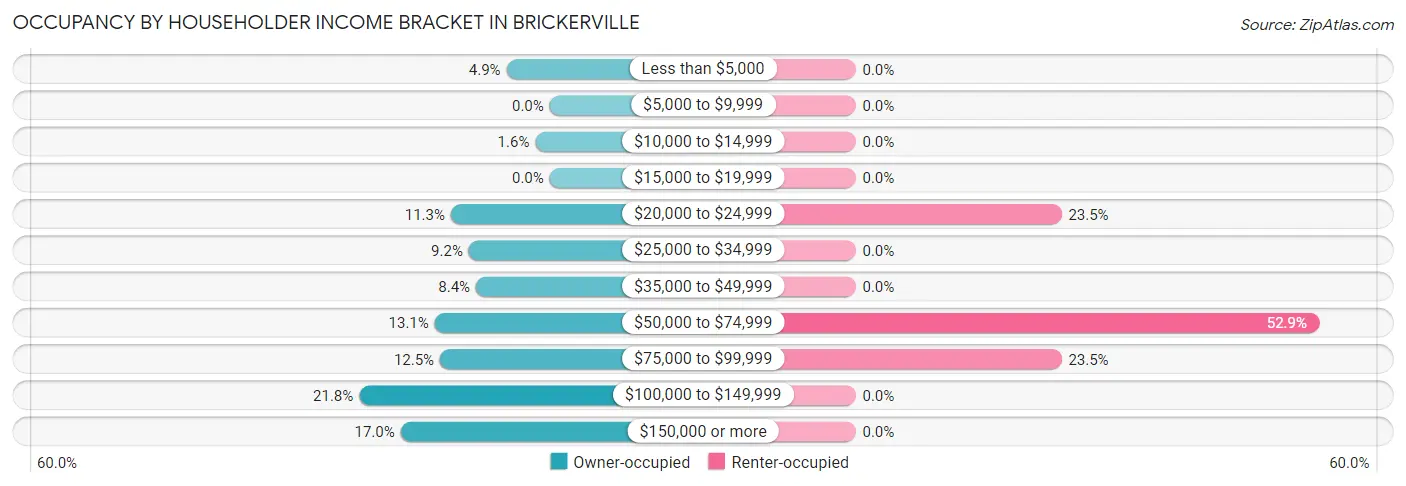
| Income Bracket | Owner-occupied | Renter-occupied |
| Less than $5,000 | 24 (4.9%) | 0 (0.0%) |
| $5,000 to $9,999 | 0 (0.0%) | 0 (0.0%) |
| $10,000 to $14,999 | 8 (1.6%) | 0 (0.0%) |
| $15,000 to $19,999 | 0 (0.0%) | 0 (0.0%) |
| $20,000 to $24,999 | 55 (11.3%) | 8 (23.5%) |
| $25,000 to $34,999 | 45 (9.2%) | 0 (0.0%) |
| $35,000 to $49,999 | 41 (8.4%) | 0 (0.0%) |
| $50,000 to $74,999 | 64 (13.1%) | 18 (52.9%) |
| $75,000 to $99,999 | 61 (12.5%) | 8 (23.5%) |
| $100,000 to $149,999 | 106 (21.8%) | 0 (0.0%) |
| $150,000 or more | 83 (17.0%) | 0 (0.0%) |
| Total | 487 (100.0%) | 34 (100.0%) |
Monthly Housing Cost Tiers in Brickerville
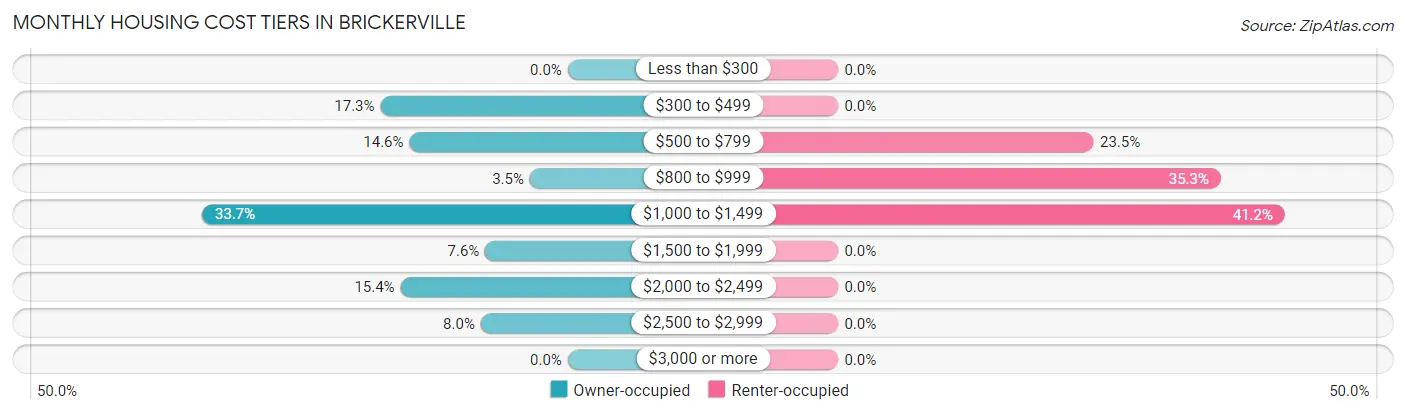
| Monthly Cost | Owner-occupied | Renter-occupied |
| Less than $300 | 0 (0.0%) | 0 (0.0%) |
| $300 to $499 | 84 (17.2%) | 0 (0.0%) |
| $500 to $799 | 71 (14.6%) | 8 (23.5%) |
| $800 to $999 | 17 (3.5%) | 12 (35.3%) |
| $1,000 to $1,499 | 164 (33.7%) | 14 (41.2%) |
| $1,500 to $1,999 | 37 (7.6%) | 0 (0.0%) |
| $2,000 to $2,499 | 75 (15.4%) | 0 (0.0%) |
| $2,500 to $2,999 | 39 (8.0%) | 0 (0.0%) |
| $3,000 or more | 0 (0.0%) | 0 (0.0%) |
| Total | 487 (100.0%) | 34 (100.0%) |
Physical Housing Characteristics in Brickerville
Housing Structures in Brickerville
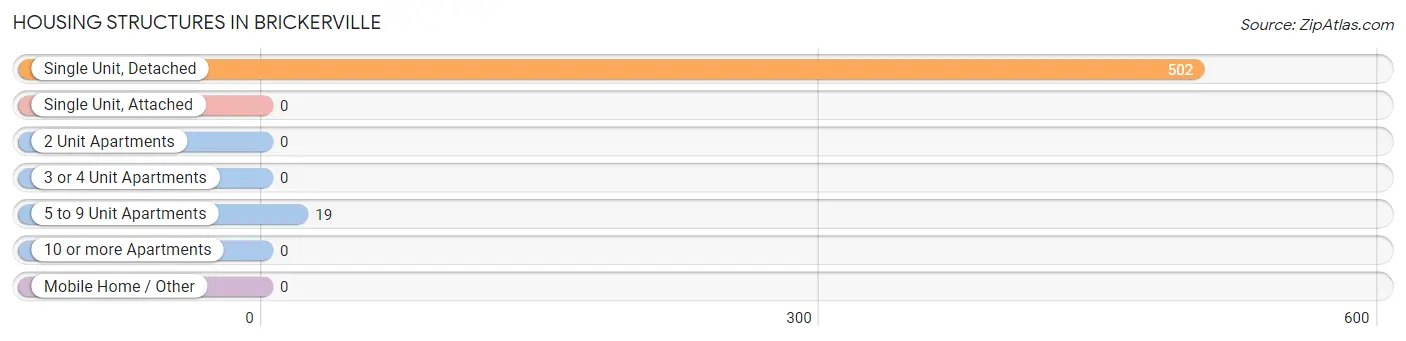
| Structure Type | # Housing Units | % Housing Units |
| Single Unit, Detached | 502 | 96.4% |
| Single Unit, Attached | 0 | 0.0% |
| 2 Unit Apartments | 0 | 0.0% |
| 3 or 4 Unit Apartments | 0 | 0.0% |
| 5 to 9 Unit Apartments | 19 | 3.6% |
| 10 or more Apartments | 0 | 0.0% |
| Mobile Home / Other | 0 | 0.0% |
| Total | 521 | 100.0% |
Housing Structures by Occupancy in Brickerville
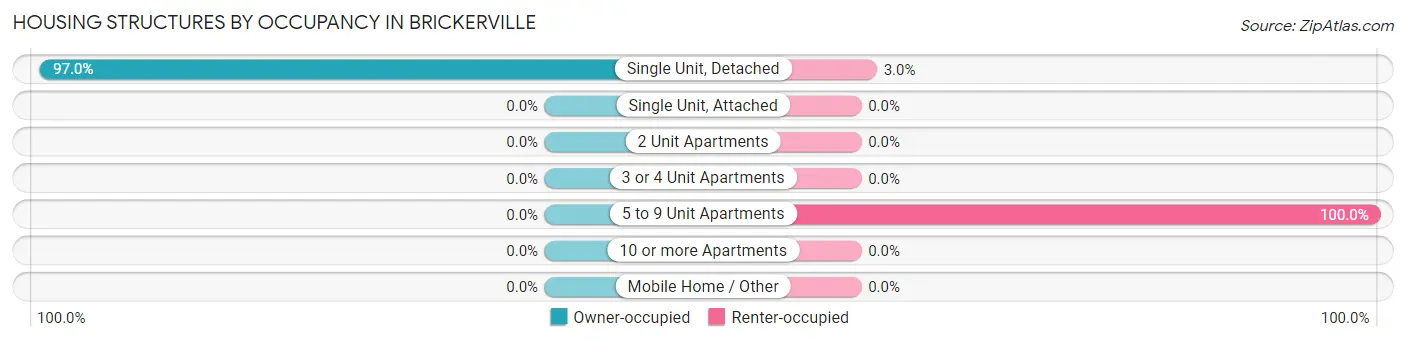
| Structure Type | Owner-occupied | Renter-occupied |
| Single Unit, Detached | 487 (97.0%) | 15 (3.0%) |
| Single Unit, Attached | 0 (0.0%) | 0 (0.0%) |
| 2 Unit Apartments | 0 (0.0%) | 0 (0.0%) |
| 3 or 4 Unit Apartments | 0 (0.0%) | 0 (0.0%) |
| 5 to 9 Unit Apartments | 0 (0.0%) | 19 (100.0%) |
| 10 or more Apartments | 0 (0.0%) | 0 (0.0%) |
| Mobile Home / Other | 0 (0.0%) | 0 (0.0%) |
| Total | 487 (93.5%) | 34 (6.5%) |
Housing Structures by Number of Rooms in Brickerville
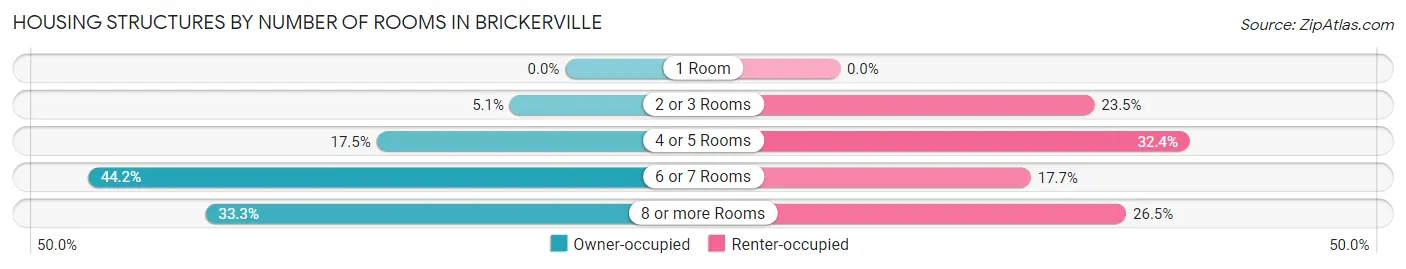
| Number of Rooms | Owner-occupied | Renter-occupied |
| 1 Room | 0 (0.0%) | 0 (0.0%) |
| 2 or 3 Rooms | 25 (5.1%) | 8 (23.5%) |
| 4 or 5 Rooms | 85 (17.4%) | 11 (32.4%) |
| 6 or 7 Rooms | 215 (44.2%) | 6 (17.6%) |
| 8 or more Rooms | 162 (33.3%) | 9 (26.5%) |
| Total | 487 (100.0%) | 34 (100.0%) |
Housing Structure by Heating Type in Brickerville
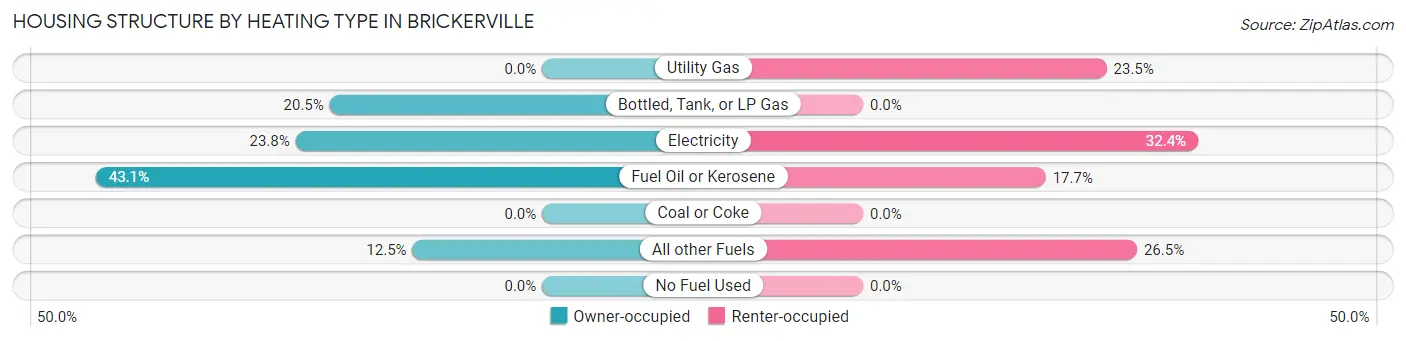
| Heating Type | Owner-occupied | Renter-occupied |
| Utility Gas | 0 (0.0%) | 8 (23.5%) |
| Bottled, Tank, or LP Gas | 100 (20.5%) | 0 (0.0%) |
| Electricity | 116 (23.8%) | 11 (32.4%) |
| Fuel Oil or Kerosene | 210 (43.1%) | 6 (17.6%) |
| Coal or Coke | 0 (0.0%) | 0 (0.0%) |
| All other Fuels | 61 (12.5%) | 9 (26.5%) |
| No Fuel Used | 0 (0.0%) | 0 (0.0%) |
| Total | 487 (100.0%) | 34 (100.0%) |
Household Vehicle Usage in Brickerville
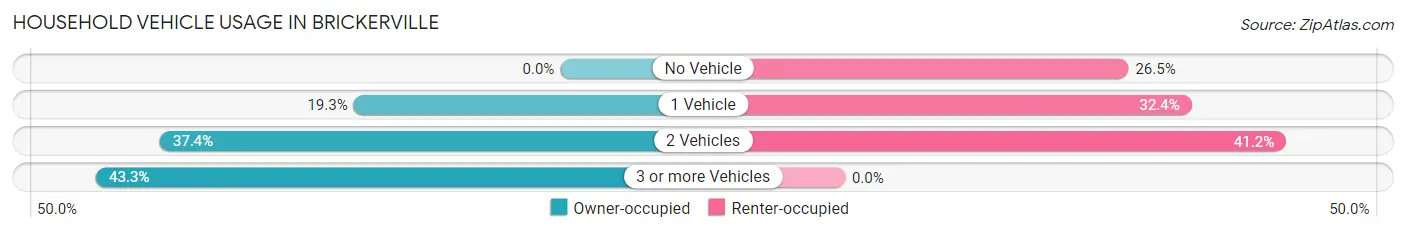
| Vehicles per Household | Owner-occupied | Renter-occupied |
| No Vehicle | 0 (0.0%) | 9 (26.5%) |
| 1 Vehicle | 94 (19.3%) | 11 (32.4%) |
| 2 Vehicles | 182 (37.4%) | 14 (41.2%) |
| 3 or more Vehicles | 211 (43.3%) | 0 (0.0%) |
| Total | 487 (100.0%) | 34 (100.0%) |
Real Estate & Mortgages in Brickerville
Real Estate and Mortgage Overview in Brickerville
| Characteristic | Without Mortgage | With Mortgage |
| Housing Units | 174 | 313 |
| Median Property Value | $243,200 | $292,000 |
| Median Household Income | - | - |
| Monthly Housing Costs | $527 | $0 |
| Real Estate Taxes | $3,667 | $14 |
Property Value by Mortgage Status in Brickerville
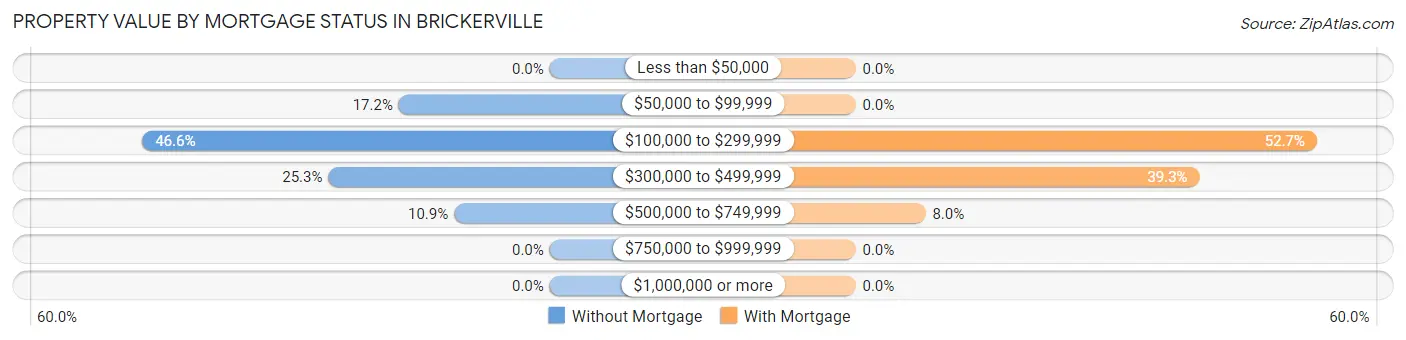
| Property Value | Without Mortgage | With Mortgage |
| Less than $50,000 | 0 (0.0%) | 0 (0.0%) |
| $50,000 to $99,999 | 30 (17.2%) | 0 (0.0%) |
| $100,000 to $299,999 | 81 (46.6%) | 165 (52.7%) |
| $300,000 to $499,999 | 44 (25.3%) | 123 (39.3%) |
| $500,000 to $749,999 | 19 (10.9%) | 25 (8.0%) |
| $750,000 to $999,999 | 0 (0.0%) | 0 (0.0%) |
| $1,000,000 or more | 0 (0.0%) | 0 (0.0%) |
| Total | 174 (100.0%) | 313 (100.0%) |
Household Income by Mortgage Status in Brickerville
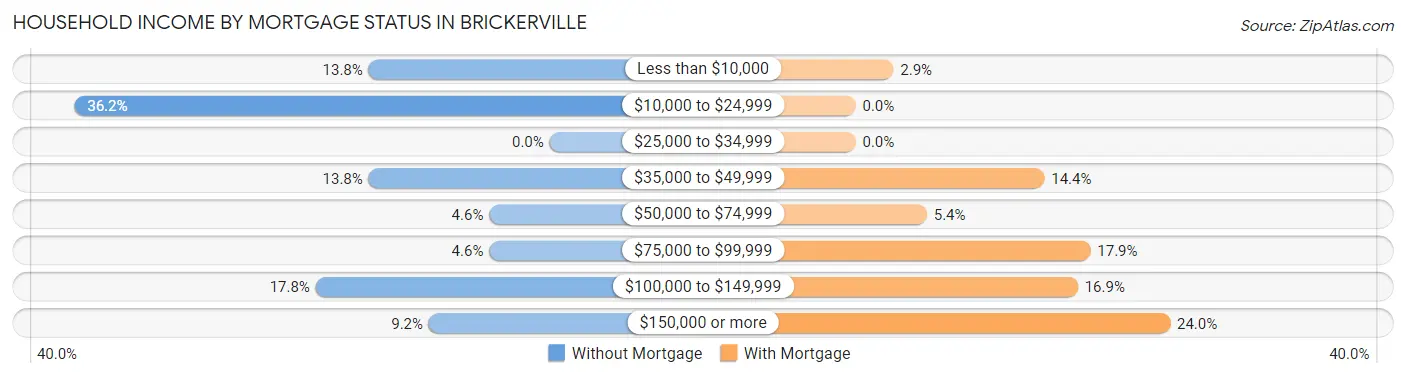
| Household Income | Without Mortgage | With Mortgage |
| Less than $10,000 | 24 (13.8%) | 9 (2.9%) |
| $10,000 to $24,999 | 63 (36.2%) | 0 (0.0%) |
| $25,000 to $34,999 | 0 (0.0%) | 0 (0.0%) |
| $35,000 to $49,999 | 24 (13.8%) | 45 (14.4%) |
| $50,000 to $74,999 | 8 (4.6%) | 17 (5.4%) |
| $75,000 to $99,999 | 8 (4.6%) | 56 (17.9%) |
| $100,000 to $149,999 | 31 (17.8%) | 53 (16.9%) |
| $150,000 or more | 16 (9.2%) | 75 (24.0%) |
| Total | 174 (100.0%) | 313 (100.0%) |
Property Value to Household Income Ratio in Brickerville
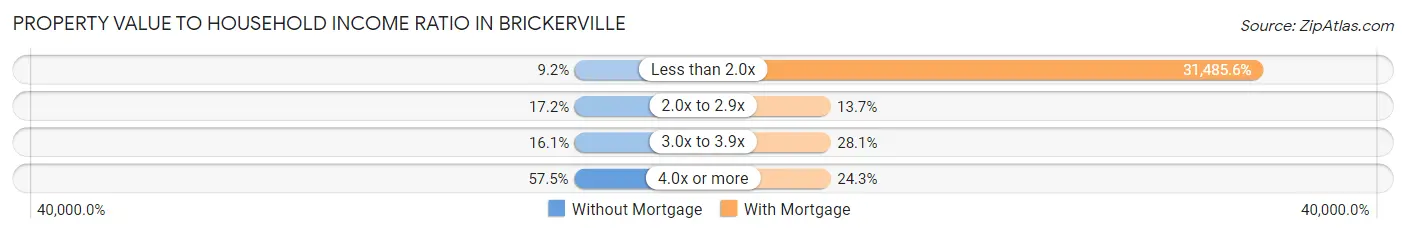
| Value-to-Income Ratio | Without Mortgage | With Mortgage |
| Less than 2.0x | 16 (9.2%) | 98,550 (31,485.6%) |
| 2.0x to 2.9x | 30 (17.2%) | 43 (13.7%) |
| 3.0x to 3.9x | 28 (16.1%) | 88 (28.1%) |
| 4.0x or more | 100 (57.5%) | 76 (24.3%) |
| Total | 174 (100.0%) | 313 (100.0%) |
Real Estate Taxes by Mortgage Status in Brickerville
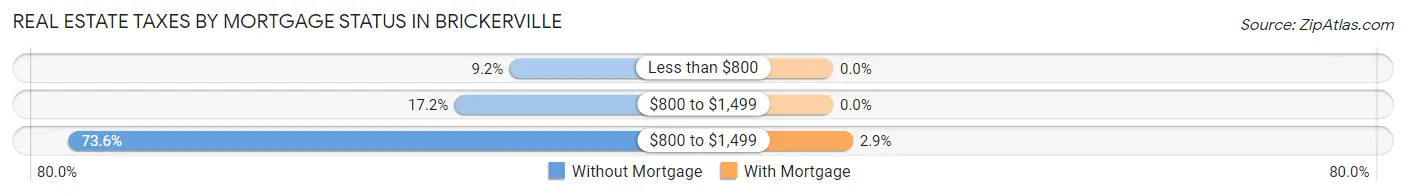
| Property Taxes | Without Mortgage | With Mortgage |
| Less than $800 | 16 (9.2%) | 0 (0.0%) |
| $800 to $1,499 | 30 (17.2%) | 0 (0.0%) |
| $800 to $1,499 | 128 (73.6%) | 9 (2.9%) |
| Total | 174 (100.0%) | 313 (100.0%) |
Health & Disability in Brickerville
Health Insurance Coverage by Age in Brickerville
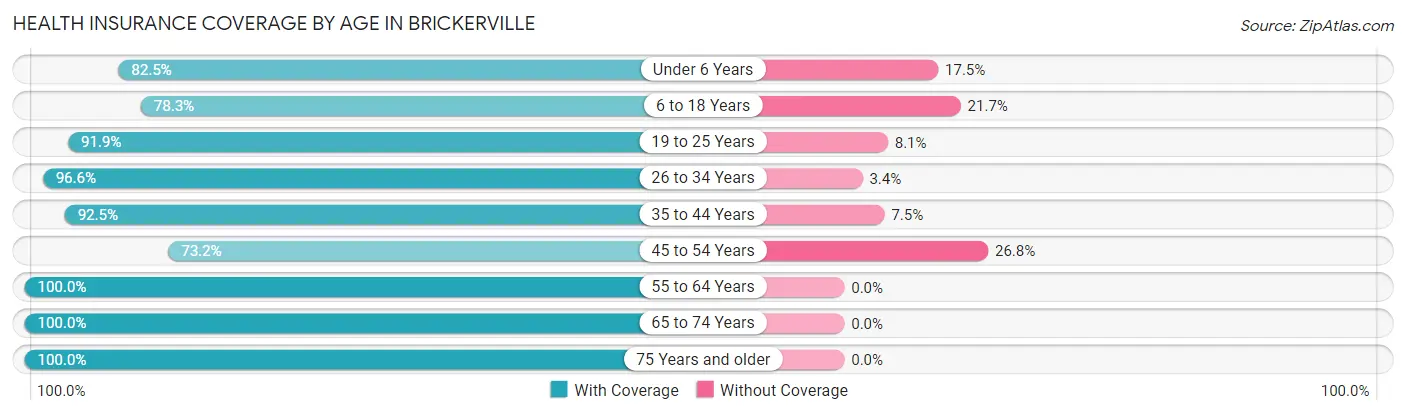
| Age Bracket | With Coverage | Without Coverage |
| Under 6 Years | 66 (82.5%) | 14 (17.5%) |
| 6 to 18 Years | 166 (78.3%) | 46 (21.7%) |
| 19 to 25 Years | 102 (91.9%) | 9 (8.1%) |
| 26 to 34 Years | 57 (96.6%) | 2 (3.4%) |
| 35 to 44 Years | 210 (92.5%) | 17 (7.5%) |
| 45 to 54 Years | 142 (73.2%) | 52 (26.8%) |
| 55 to 64 Years | 221 (100.0%) | 0 (0.0%) |
| 65 to 74 Years | 197 (100.0%) | 0 (0.0%) |
| 75 Years and older | 106 (100.0%) | 0 (0.0%) |
| Total | 1,267 (90.0%) | 140 (10.0%) |
Health Insurance Coverage by Citizenship Status in Brickerville
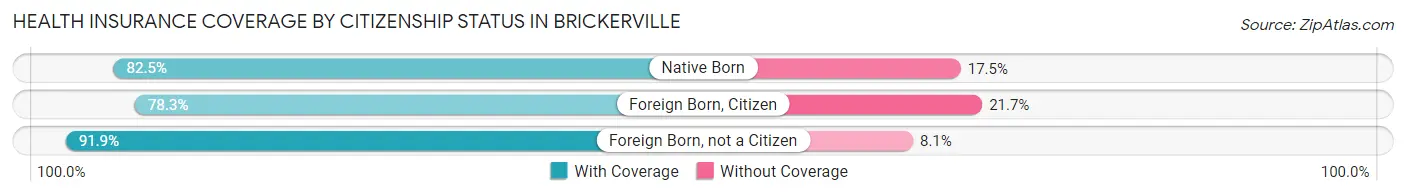
| Citizenship Status | With Coverage | Without Coverage |
| Native Born | 66 (82.5%) | 14 (17.5%) |
| Foreign Born, Citizen | 166 (78.3%) | 46 (21.7%) |
| Foreign Born, not a Citizen | 102 (91.9%) | 9 (8.1%) |
Health Insurance Coverage by Household Income in Brickerville
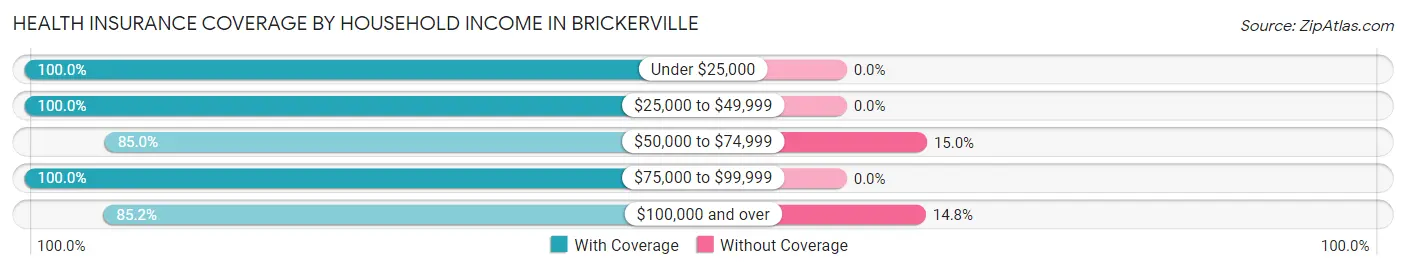
| Household Income | With Coverage | Without Coverage |
| Under $25,000 | 177 (100.0%) | 0 (0.0%) |
| $25,000 to $49,999 | 131 (100.0%) | 0 (0.0%) |
| $50,000 to $74,999 | 181 (85.0%) | 32 (15.0%) |
| $75,000 to $99,999 | 157 (100.0%) | 0 (0.0%) |
| $100,000 and over | 621 (85.2%) | 108 (14.8%) |
Public vs Private Health Insurance Coverage by Age in Brickerville
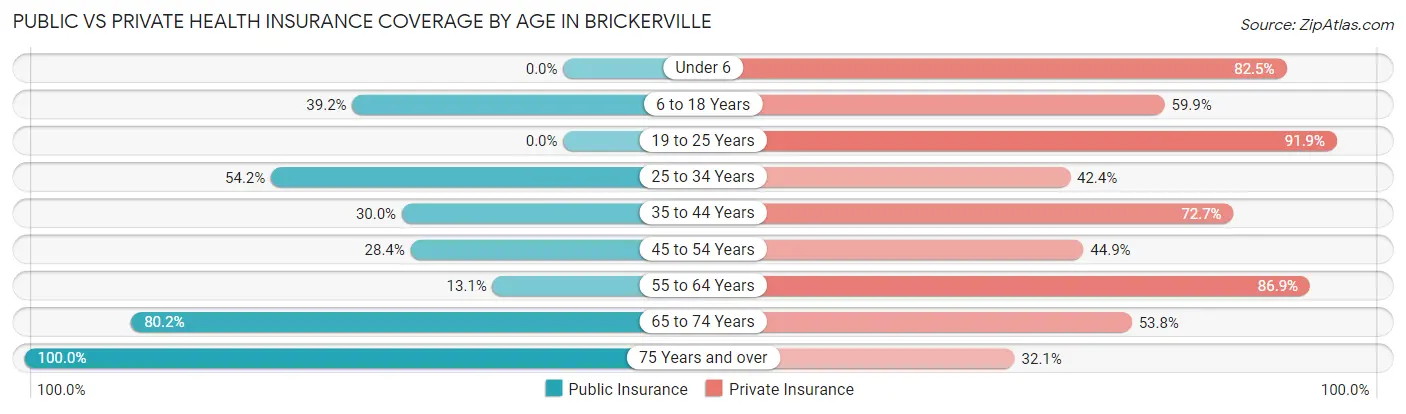
| Age Bracket | Public Insurance | Private Insurance |
| Under 6 | 0 (0.0%) | 66 (82.5%) |
| 6 to 18 Years | 83 (39.2%) | 127 (59.9%) |
| 19 to 25 Years | 0 (0.0%) | 102 (91.9%) |
| 25 to 34 Years | 32 (54.2%) | 25 (42.4%) |
| 35 to 44 Years | 68 (30.0%) | 165 (72.7%) |
| 45 to 54 Years | 55 (28.3%) | 87 (44.9%) |
| 55 to 64 Years | 29 (13.1%) | 192 (86.9%) |
| 65 to 74 Years | 158 (80.2%) | 106 (53.8%) |
| 75 Years and over | 106 (100.0%) | 34 (32.1%) |
| Total | 531 (37.7%) | 904 (64.2%) |
Disability Status by Sex by Age in Brickerville
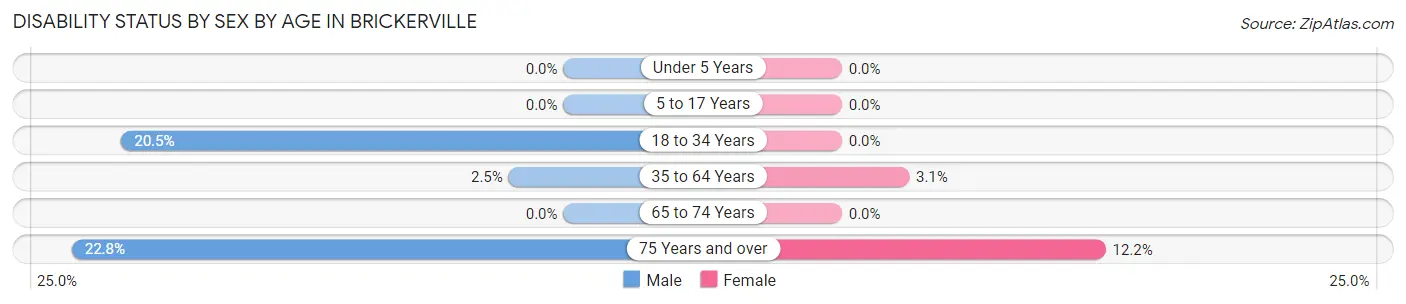
| Age Bracket | Male | Female |
| Under 5 Years | 0 (0.0%) | 0 (0.0%) |
| 5 to 17 Years | 0 (0.0%) | 0 (0.0%) |
| 18 to 34 Years | 16 (20.5%) | 0 (0.0%) |
| 35 to 64 Years | 9 (2.5%) | 9 (3.1%) |
| 65 to 74 Years | 0 (0.0%) | 0 (0.0%) |
| 75 Years and over | 13 (22.8%) | 6 (12.2%) |
Disability Class by Sex by Age in Brickerville
Disability Class: Hearing Difficulty
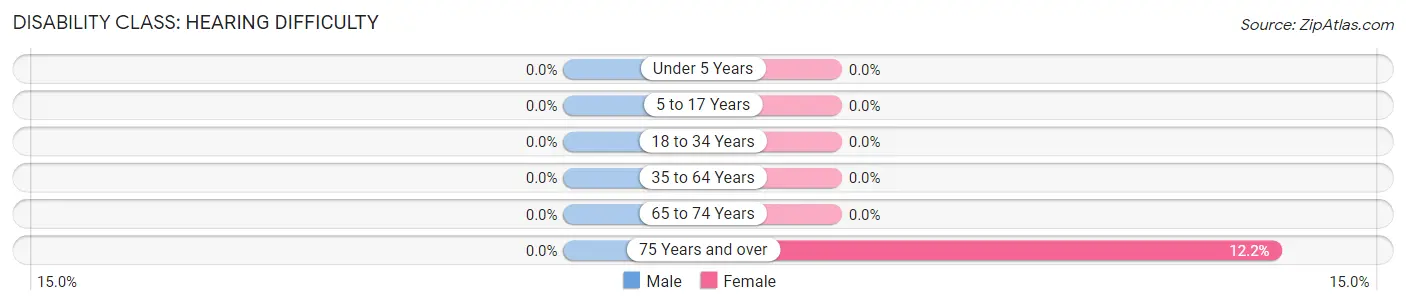
| Age Bracket | Male | Female |
| Under 5 Years | 0 (0.0%) | 0 (0.0%) |
| 5 to 17 Years | 0 (0.0%) | 0 (0.0%) |
| 18 to 34 Years | 0 (0.0%) | 0 (0.0%) |
| 35 to 64 Years | 0 (0.0%) | 0 (0.0%) |
| 65 to 74 Years | 0 (0.0%) | 0 (0.0%) |
| 75 Years and over | 0 (0.0%) | 6 (12.2%) |
Disability Class: Vision Difficulty
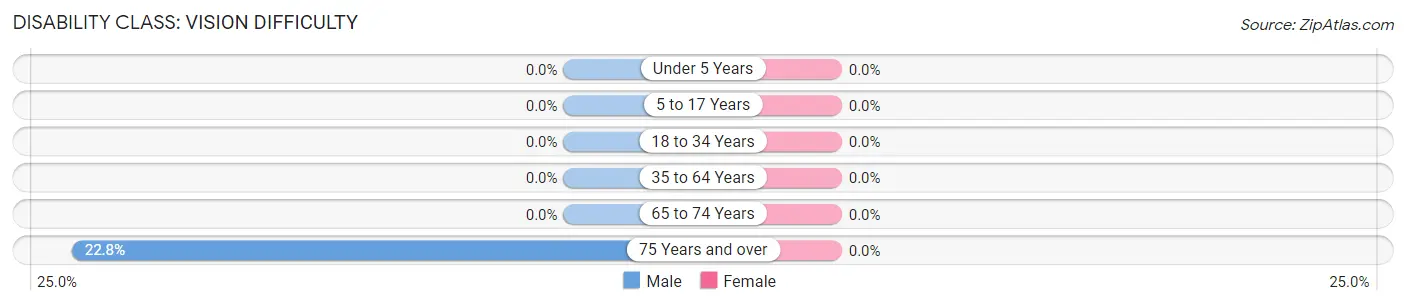
| Age Bracket | Male | Female |
| Under 5 Years | 0 (0.0%) | 0 (0.0%) |
| 5 to 17 Years | 0 (0.0%) | 0 (0.0%) |
| 18 to 34 Years | 0 (0.0%) | 0 (0.0%) |
| 35 to 64 Years | 0 (0.0%) | 0 (0.0%) |
| 65 to 74 Years | 0 (0.0%) | 0 (0.0%) |
| 75 Years and over | 13 (22.8%) | 0 (0.0%) |
Disability Class: Cognitive Difficulty
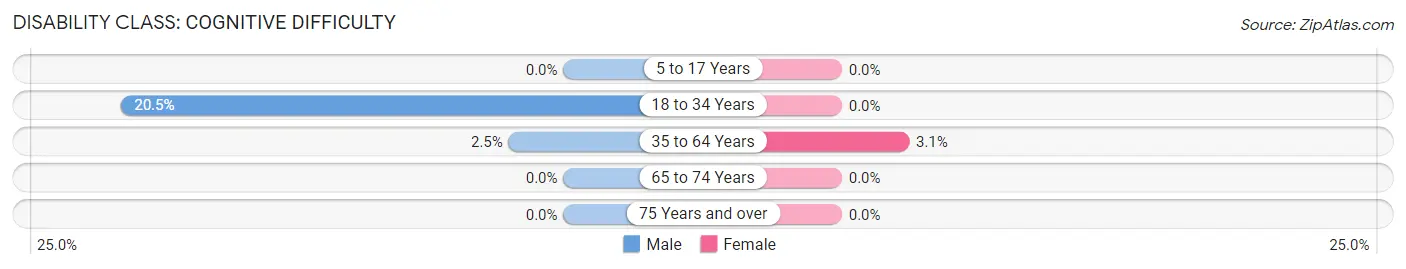
| Age Bracket | Male | Female |
| 5 to 17 Years | 0 (0.0%) | 0 (0.0%) |
| 18 to 34 Years | 16 (20.5%) | 0 (0.0%) |
| 35 to 64 Years | 9 (2.5%) | 9 (3.1%) |
| 65 to 74 Years | 0 (0.0%) | 0 (0.0%) |
| 75 Years and over | 0 (0.0%) | 0 (0.0%) |
Disability Class: Ambulatory Difficulty
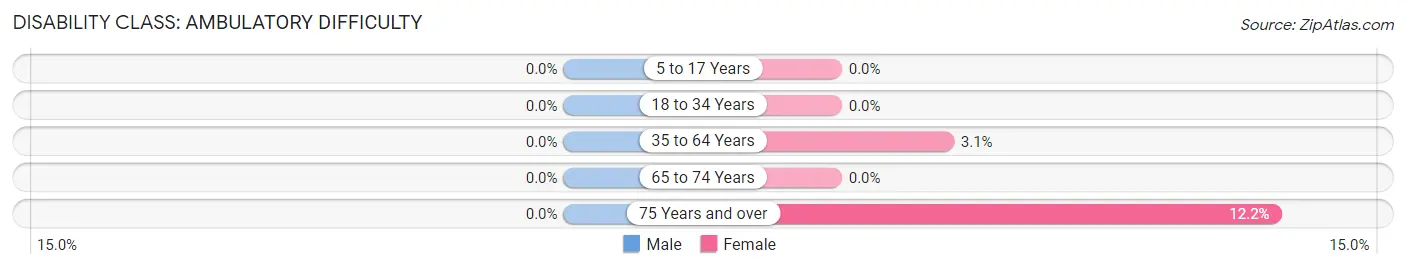
| Age Bracket | Male | Female |
| 5 to 17 Years | 0 (0.0%) | 0 (0.0%) |
| 18 to 34 Years | 0 (0.0%) | 0 (0.0%) |
| 35 to 64 Years | 0 (0.0%) | 9 (3.1%) |
| 65 to 74 Years | 0 (0.0%) | 0 (0.0%) |
| 75 Years and over | 0 (0.0%) | 6 (12.2%) |
Disability Class: Self-Care Difficulty
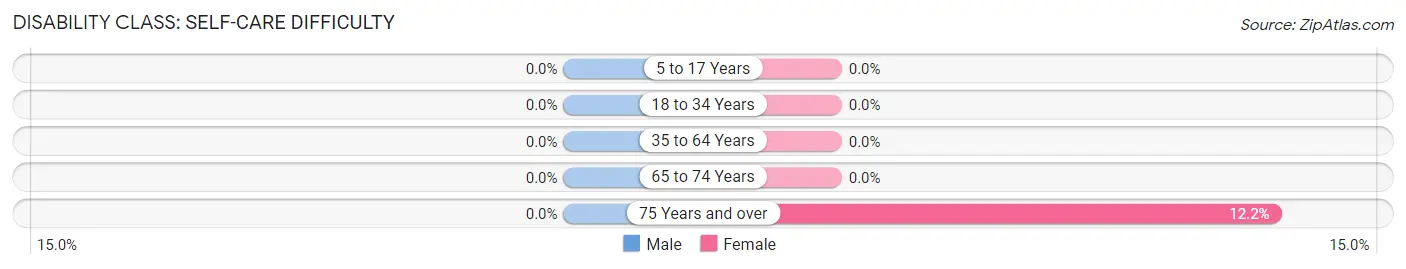
| Age Bracket | Male | Female |
| 5 to 17 Years | 0 (0.0%) | 0 (0.0%) |
| 18 to 34 Years | 0 (0.0%) | 0 (0.0%) |
| 35 to 64 Years | 0 (0.0%) | 0 (0.0%) |
| 65 to 74 Years | 0 (0.0%) | 0 (0.0%) |
| 75 Years and over | 0 (0.0%) | 6 (12.2%) |
Technology Access in Brickerville
Computing Device Access in Brickerville
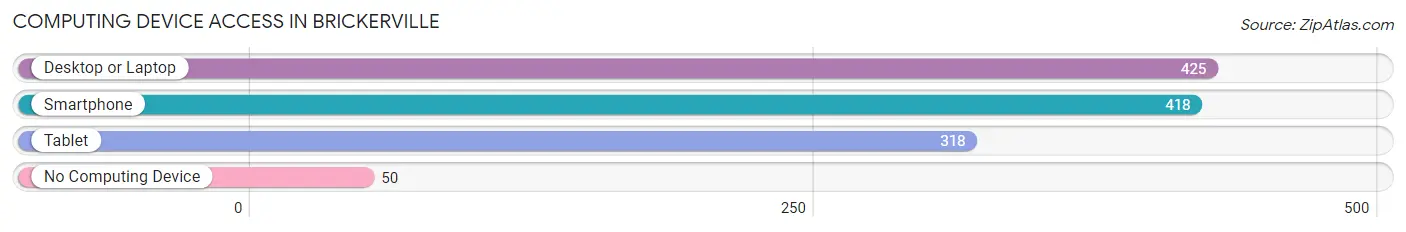
| Device Type | # Households | % Households |
| Desktop or Laptop | 425 | 81.6% |
| Smartphone | 418 | 80.2% |
| Tablet | 318 | 61.0% |
| No Computing Device | 50 | 9.6% |
| Total | 521 | 100.0% |
Internet Access in Brickerville
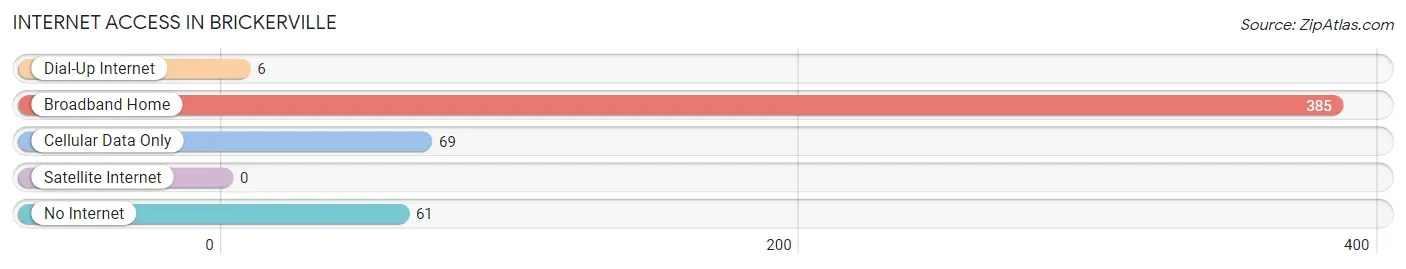
| Internet Type | # Households | % Households |
| Dial-Up Internet | 6 | 1.1% |
| Broadband Home | 385 | 73.9% |
| Cellular Data Only | 69 | 13.2% |
| Satellite Internet | 0 | 0.0% |
| No Internet | 61 | 11.7% |
| Total | 521 | 100.0% |
Brickerville Summary
Brickerville is a small unincorporated community located in East Hempfield Township, Lancaster County, Pennsylvania. It is situated along the banks of the Conestoga River, approximately 8 miles east of the city of Lancaster. The population of Brickerville was estimated to be 1,845 in 2019.
History
Brickerville was founded in 1737 by a group of German settlers who were looking for a place to settle and build a community. The settlers named the area after the brick kilns that were built in the area. The kilns were used to produce bricks for the construction of homes and other buildings in the area.
The first church in Brickerville was built in 1741 and was called the Brickerville Union Church. The church was used by both the Lutheran and Reformed denominations. The church still stands today and is a popular tourist attraction.
In the late 19th century, Brickerville was a thriving community with a variety of businesses, including a brickyard, a sawmill, a gristmill, a tannery, a blacksmith shop, a general store, and a post office. The town also had a school, a hotel, and a number of churches.
Geography
Brickerville is located in East Hempfield Township, Lancaster County, Pennsylvania. It is situated along the banks of the Conestoga River, approximately 8 miles east of the city of Lancaster. The area is mostly rural, with rolling hills and farmland. The climate is temperate, with hot summers and cold winters.
Economy
Brickerville’s economy is largely based on agriculture. The area is home to a number of farms, which produce a variety of crops, including corn, soybeans, wheat, and hay. The area also has a number of small businesses, including restaurants, retail stores, and service providers.
Demographics
As of 2019, the population of Brickerville was estimated to be 1,845. The population is predominantly white (94.3%), with a small percentage of African Americans (2.2%) and Hispanics (2.2%). The median household income is $60,945, and the median age is 43.7 years.
Conclusion
Brickerville is a small unincorporated community located in East Hempfield Township, Lancaster County, Pennsylvania. It was founded in 1737 by a group of German settlers and has a rich history and culture. The economy is largely based on agriculture, and the population is predominantly white. Brickerville is a great place to live and work, and it is a popular tourist destination.
Common Questions
What is Per Capita Income in Brickerville?
Per Capita income in Brickerville is $39,643.
What is the Median Family Income in Brickerville?
Median Family Income in Brickerville is $97,600.
What is the Median Household income in Brickerville?
Median Household Income in Brickerville is $74,107.
What is Income or Wage Gap in Brickerville?
Income or Wage Gap in Brickerville is 66.0%.
Women in Brickerville earn 34.0 cents for every dollar earned by a man.
What is Inequality or Gini Index in Brickerville?
Inequality or Gini Index in Brickerville is 0.48.
What is the Total Population of Brickerville?
Total Population of Brickerville is 1,407.
What is the Total Male Population of Brickerville?
Total Male Population of Brickerville is 741.
What is the Total Female Population of Brickerville?
Total Female Population of Brickerville is 666.
What is the Ratio of Males per 100 Females in Brickerville?
There are 111.26 Males per 100 Females in Brickerville.
What is the Ratio of Females per 100 Males in Brickerville?
There are 89.88 Females per 100 Males in Brickerville.
What is the Median Population Age in Brickerville?
Median Population Age in Brickerville is 47.0 Years.
What is the Average Family Size in Brickerville
Average Family Size in Brickerville is 3.0 People.
What is the Average Household Size in Brickerville
Average Household Size in Brickerville is 2.7 People.
How Large is the Labor Force in Brickerville?
There are 854 People in the Labor Forcein in Brickerville.
What is the Percentage of People in the Labor Force in Brickerville?
73.6% of People are in the Labor Force in Brickerville.