Zip Codes with the Highest Percentage of Population with a Degree in Visual and Performing Arts in Altoona, PA
RELATED REPORTS & OPTIONS
Visual and Performing Arts
Altoona
Compare Zip Codes
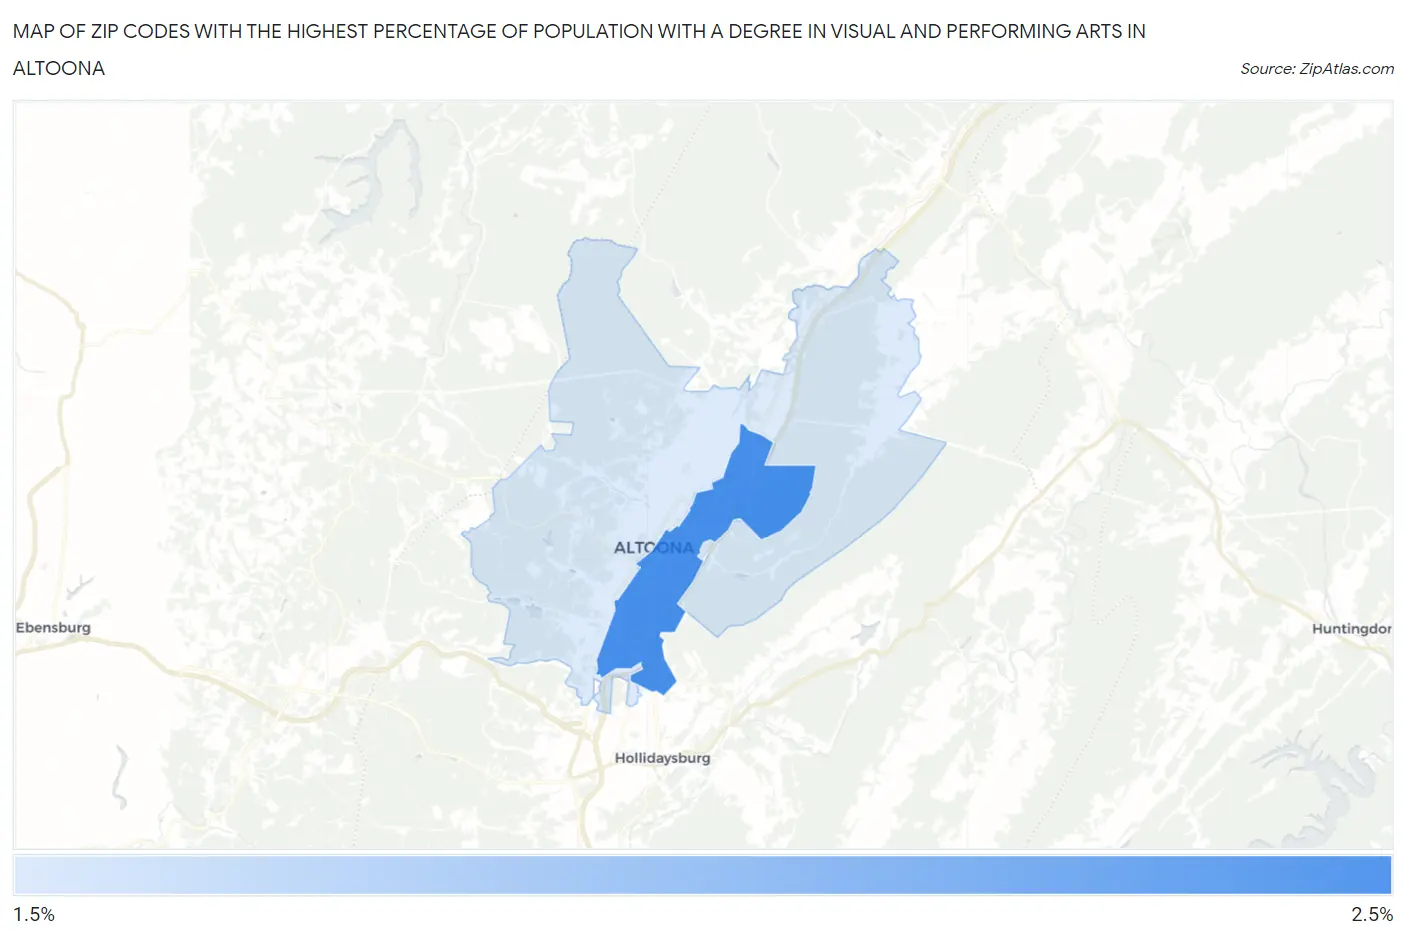
Map of Zip Codes with the Highest Percentage of Population with a Degree in Visual and Performing Arts in Altoona
1.8%
2.0%
Zip Codes with the Highest Percentage of Population with a Degree in Visual and Performing Arts in Altoona, PA
| Zip Code | % Graduates | vs State | vs National | |
| 1. | 16602 | 2.0% | 3.8%(-1.80)#827 | 4.3%(-2.22)#16,353 |
| 2. | 16601 | 1.8% | 3.8%(-2.05)#877 | 4.3%(-2.48)#17,238 |
1
Common Questions
What are the Top Zip Codes with the Highest Percentage of Population with a Degree in Visual and Performing Arts in Altoona, PA?
Top Zip Codes with the Highest Percentage of Population with a Degree in Visual and Performing Arts in Altoona, PA are:
What zip code has the Highest Percentage of Population with a Degree in Visual and Performing Arts in Altoona, PA?
16602 has the Highest Percentage of Population with a Degree in Visual and Performing Arts in Altoona, PA with 2.0%.
What is the Percentage of Population with a Degree in Visual and Performing Arts in Altoona, PA?
Percentage of Population with a Degree in Visual and Performing Arts in Altoona is 1.5%.
What is the Percentage of Population with a Degree in Visual and Performing Arts in Pennsylvania?
Percentage of Population with a Degree in Visual and Performing Arts in Pennsylvania is 3.8%.
What is the Percentage of Population with a Degree in Visual and Performing Arts in the United States?
Percentage of Population with a Degree in Visual and Performing Arts in the United States is 4.3%.