Zip Codes with the Highest Percentage of Population with a Degree in Visual and Performing Arts in Mechanicsburg, PA
RELATED REPORTS & OPTIONS
Visual and Performing Arts
Mechanicsburg
Compare Zip Codes
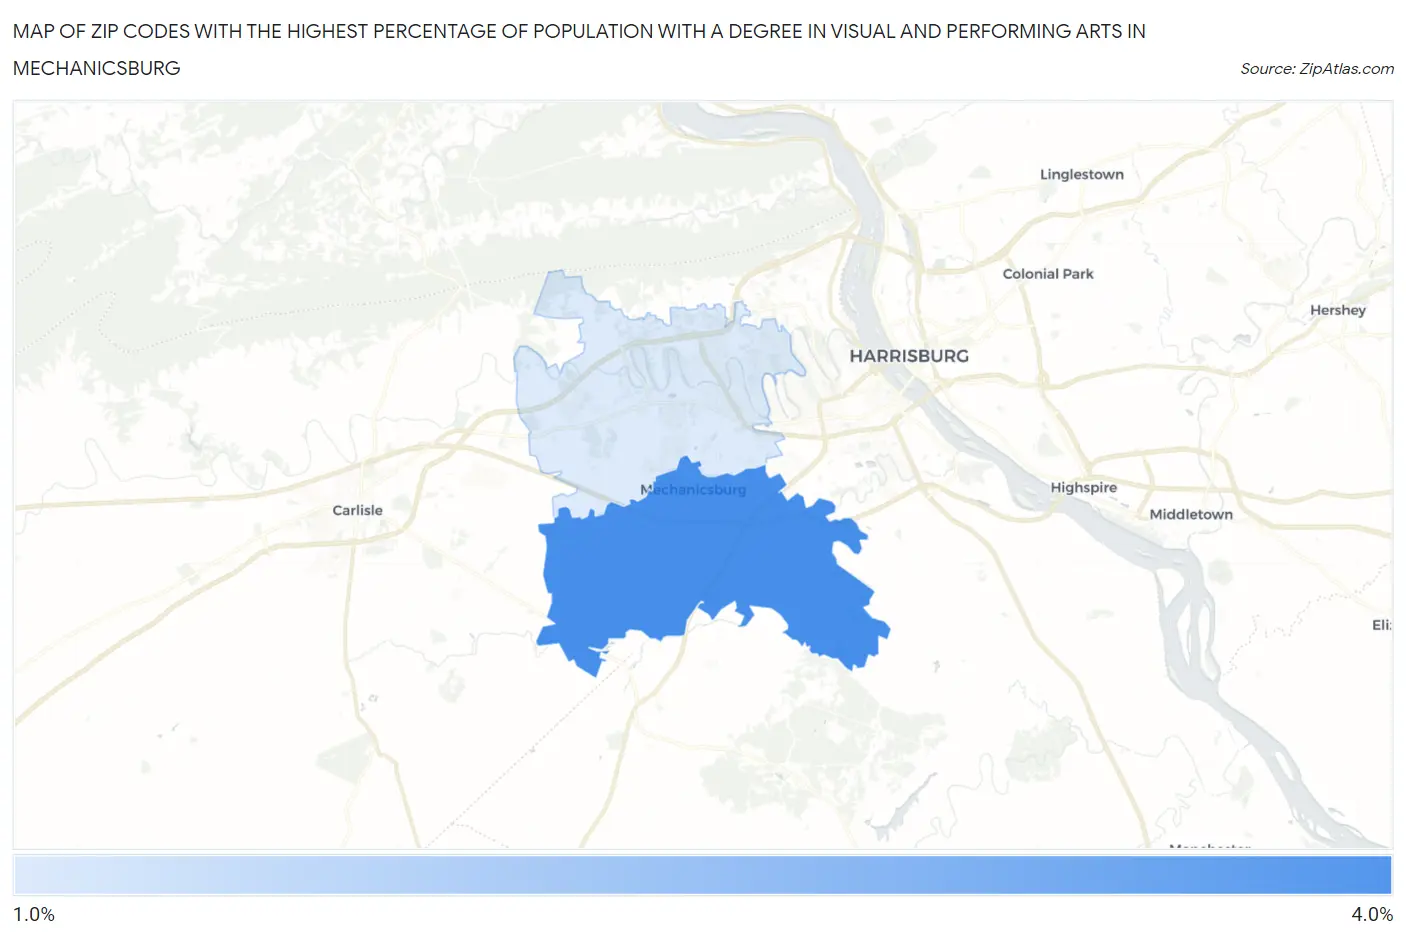
Map of Zip Codes with the Highest Percentage of Population with a Degree in Visual and Performing Arts in Mechanicsburg
1.9%
3.3%
Zip Codes with the Highest Percentage of Population with a Degree in Visual and Performing Arts in Mechanicsburg, PA
| Zip Code | % Graduates | vs State | vs National | |
| 1. | 17055 | 3.3% | 3.8%(-0.535)#568 | 4.3%(-0.964)#11,663 |
| 2. | 17050 | 1.9% | 3.8%(-1.92)#851 | 4.3%(-2.35)#16,774 |
1
Common Questions
What are the Top Zip Codes with the Highest Percentage of Population with a Degree in Visual and Performing Arts in Mechanicsburg, PA?
Top Zip Codes with the Highest Percentage of Population with a Degree in Visual and Performing Arts in Mechanicsburg, PA are:
What zip code has the Highest Percentage of Population with a Degree in Visual and Performing Arts in Mechanicsburg, PA?
17055 has the Highest Percentage of Population with a Degree in Visual and Performing Arts in Mechanicsburg, PA with 3.3%.
What is the Percentage of Population with a Degree in Visual and Performing Arts in Pennsylvania?
Percentage of Population with a Degree in Visual and Performing Arts in Pennsylvania is 3.8%.
What is the Percentage of Population with a Degree in Visual and Performing Arts in the United States?
Percentage of Population with a Degree in Visual and Performing Arts in the United States is 4.3%.