Rossiter, PA Map & Demographics
Rossiter Map
Rossiter Overview
$21,763
PER CAPITA INCOME
$77,171
AVG FAMILY INCOME
$67,292
AVG HOUSEHOLD INCOME
$17,508
FAMILY INCOME DEFICIT
0.36
INEQUALITY / GINI INDEX
661
TOTAL POPULATION
350
MALE POPULATION
311
FEMALE POPULATION
112.54
MALES / 100 FEMALES
88.86
FEMALES / 100 MALES
34.8
MEDIAN AGE
3.9
AVG FAMILY SIZE
3.2
AVG HOUSEHOLD SIZE
373
LABOR FORCE [ PEOPLE ]
65.0%
PERCENT IN LABOR FORCE
8.6%
UNEMPLOYMENT RATE
Rossiter Zip Codes
Income in Rossiter
Income Overview in Rossiter
Per Capita Income in Rossiter is $21,763, while median incomes of families and households are $77,171 and $67,292 respectively.
| Characteristic | Number | Measure |
| Per Capita Income | 661 | $21,763 |
| Median Family Income | 137 | $77,171 |
| Mean Family Income | 137 | $75,763 |
| Median Household Income | 191 | $67,292 |
| Mean Household Income | 191 | $64,153 |
| Income Deficit | 137 | $17,508 |
| Wage / Income Gap (%) | 661 | 0.00% |
| Wage / Income Gap ($) | 661 | 100.00¢ per $1 |
| Gini / Inequality Index | 661 | 0.36 |
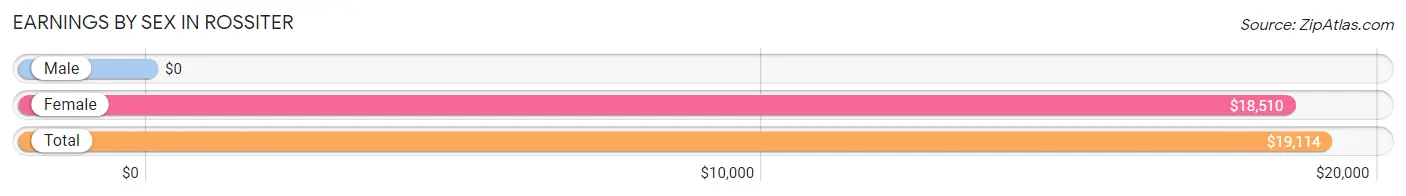
Earnings by Sex in Rossiter
| Sex | Number | Average Earnings |
| Male | 147 (40.1%) | $0 |
| Female | 220 (60.0%) | $18,510 |
| Total | 367 (100.0%) | $19,114 |
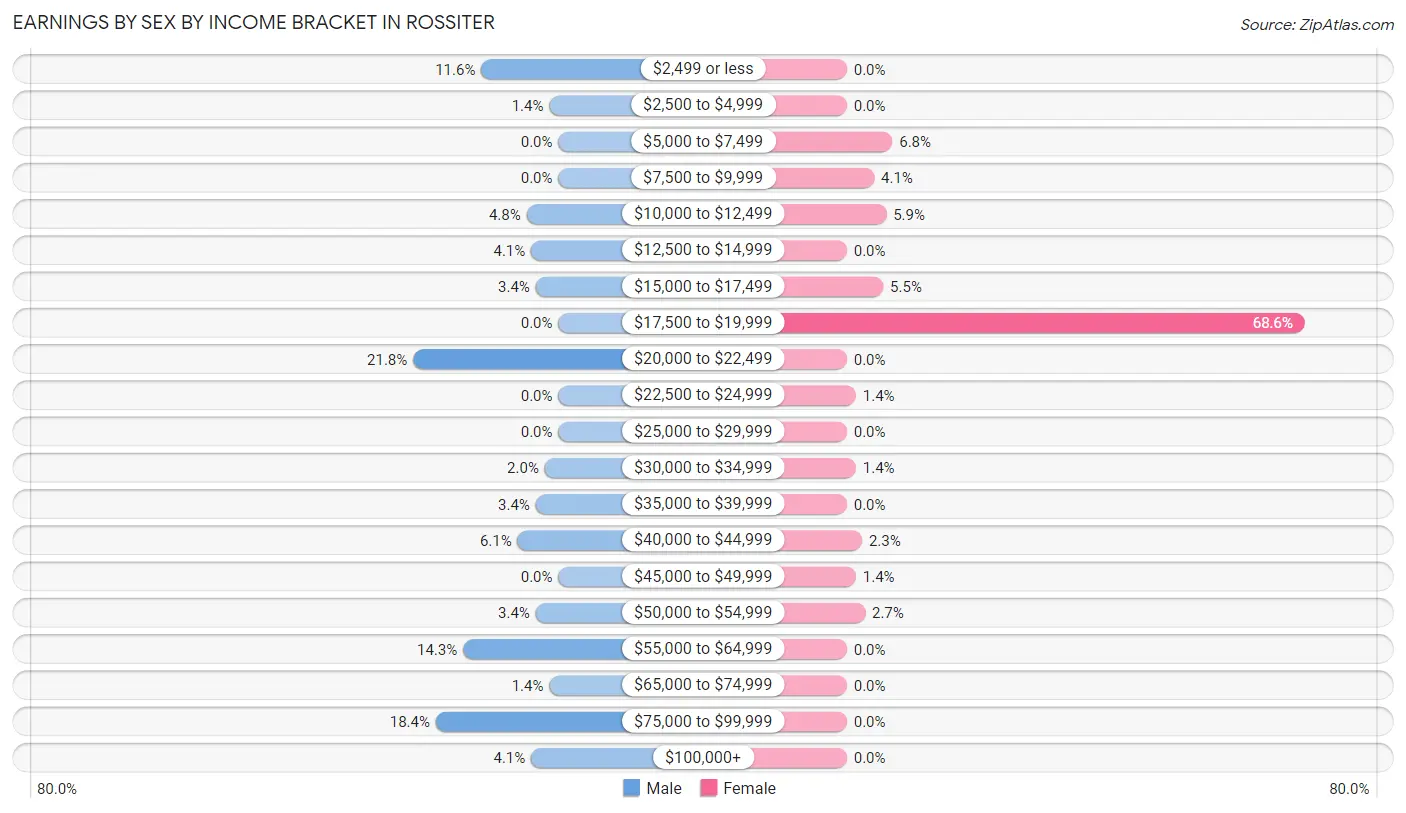
Earnings by Sex by Income Bracket in Rossiter
The most common earnings brackets in Rossiter are $20,000 to $22,499 for men (32 | 21.8%) and $17,500 to $19,999 for women (151 | 68.6%).
| Income | Male | Female |
| $2,499 or less | 17 (11.6%) | 0 (0.0%) |
| $2,500 to $4,999 | 2 (1.4%) | 0 (0.0%) |
| $5,000 to $7,499 | 0 (0.0%) | 15 (6.8%) |
| $7,500 to $9,999 | 0 (0.0%) | 9 (4.1%) |
| $10,000 to $12,499 | 7 (4.8%) | 13 (5.9%) |
| $12,500 to $14,999 | 6 (4.1%) | 0 (0.0%) |
| $15,000 to $17,499 | 5 (3.4%) | 12 (5.4%) |
| $17,500 to $19,999 | 0 (0.0%) | 151 (68.6%) |
| $20,000 to $22,499 | 32 (21.8%) | 0 (0.0%) |
| $22,500 to $24,999 | 0 (0.0%) | 3 (1.4%) |
| $25,000 to $29,999 | 0 (0.0%) | 0 (0.0%) |
| $30,000 to $34,999 | 3 (2.0%) | 3 (1.4%) |
| $35,000 to $39,999 | 5 (3.4%) | 0 (0.0%) |
| $40,000 to $44,999 | 9 (6.1%) | 5 (2.3%) |
| $45,000 to $49,999 | 0 (0.0%) | 3 (1.4%) |
| $50,000 to $54,999 | 5 (3.4%) | 6 (2.7%) |
| $55,000 to $64,999 | 21 (14.3%) | 0 (0.0%) |
| $65,000 to $74,999 | 2 (1.4%) | 0 (0.0%) |
| $75,000 to $99,999 | 27 (18.4%) | 0 (0.0%) |
| $100,000+ | 6 (4.1%) | 0 (0.0%) |
| Total | 147 (100.0%) | 220 (100.0%) |
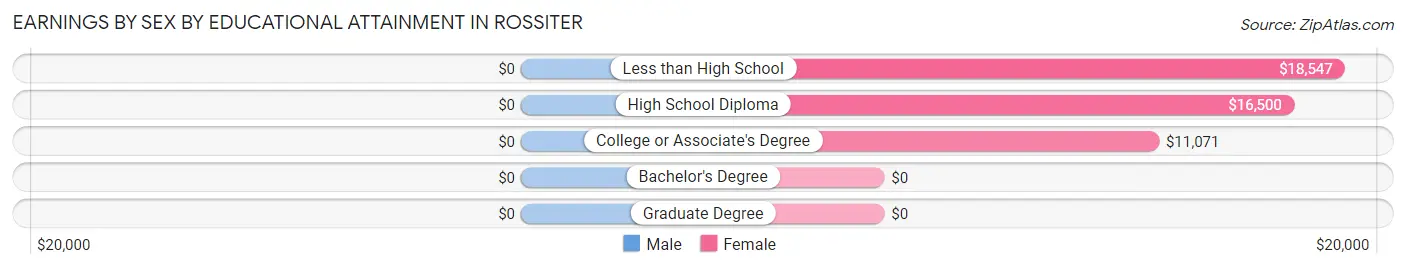
Earnings by Sex by Educational Attainment in Rossiter
| Educational Attainment | Male Income | Female Income |
| Less than High School | - | - |
| High School Diploma | - | - |
| College or Associate's Degree | - | - |
| Bachelor's Degree | - | - |
| Graduate Degree | - | - |
| Total | $43,333 | $18,378 |
Family Income in Rossiter
Family Income Brackets in Rossiter
According to the Rossiter family income data, there are 64 families falling into the $75,000 to $99,999 income range, which is the most common income bracket and makes up 46.7% of all families. Conversely, the $200,000+ income bracket is the least frequent group with only 2 families (1.5%) belonging to this category.
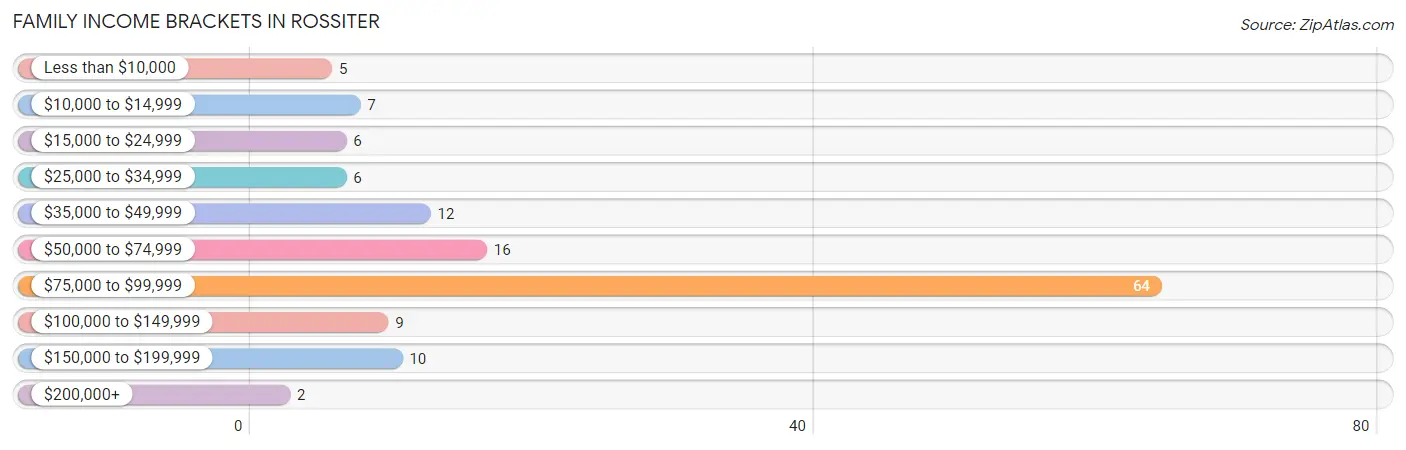
| Income Bracket | # Families | % Families |
| Less than $10,000 | 5 | 3.6% |
| $10,000 to $14,999 | 7 | 5.1% |
| $15,000 to $24,999 | 6 | 4.4% |
| $25,000 to $34,999 | 6 | 4.4% |
| $35,000 to $49,999 | 12 | 8.8% |
| $50,000 to $74,999 | 16 | 11.7% |
| $75,000 to $99,999 | 64 | 46.7% |
| $100,000 to $149,999 | 9 | 6.6% |
| $150,000 to $199,999 | 10 | 7.3% |
| $200,000+ | 2 | 1.5% |
Family Income by Famaliy Size in Rossiter
3-person families (25 | 18.2%) account for the highest median family income in Rossiter with $94,583 per family, while 2-person families (52 | 38.0%) have the highest median income of $37,763 per family member.
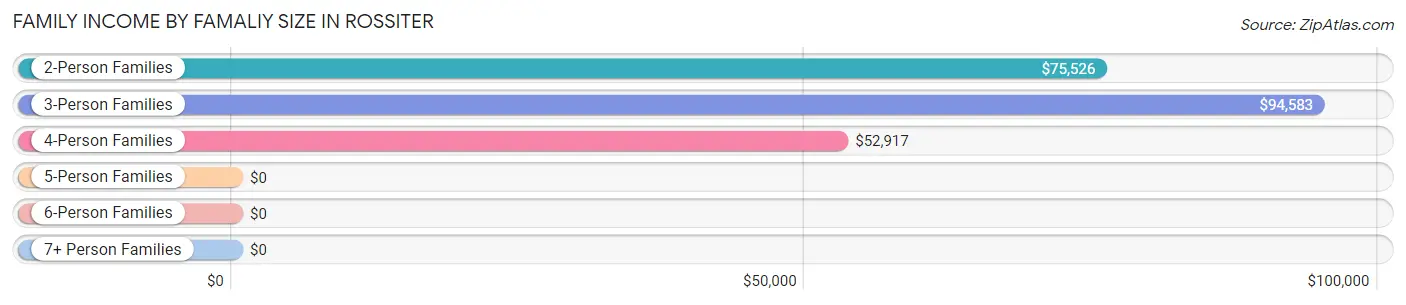
| Income Bracket | # Families | Median Income |
| 2-Person Families | 52 (38.0%) | $75,526 |
| 3-Person Families | 25 (18.2%) | $94,583 |
| 4-Person Families | 23 (16.8%) | $52,917 |
| 5-Person Families | 37 (27.0%) | $0 |
| 6-Person Families | 0 (0.0%) | $0 |
| 7+ Person Families | 0 (0.0%) | $0 |
| Total | 137 (100.0%) | $77,171 |
Family Income by Number of Earners in Rossiter
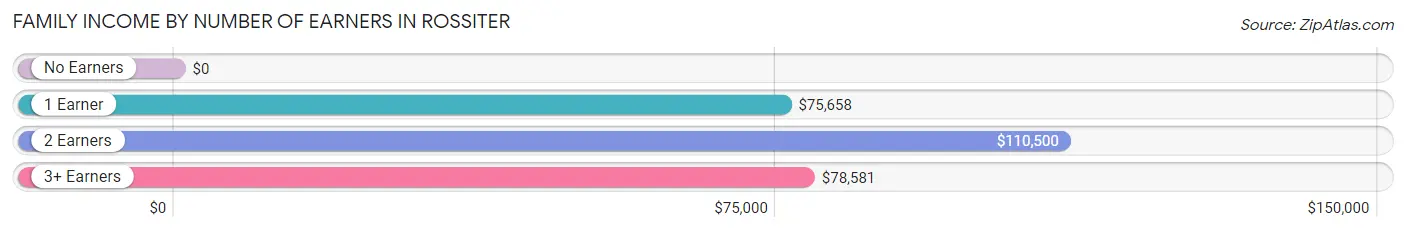
| Number of Earners | # Families | Median Income |
| No Earners | 21 (15.3%) | $0 |
| 1 Earner | 32 (23.4%) | $75,658 |
| 2 Earners | 36 (26.3%) | $110,500 |
| 3+ Earners | 48 (35.0%) | $78,581 |
| Total | 137 (100.0%) | $77,171 |
Household Income in Rossiter
Household Income Brackets in Rossiter
With 64 households falling in the category, the $75,000 to $99,999 income range is the most frequent in Rossiter, accounting for 33.5% of all households. In contrast, only 2 households (1.1%) fall into the $200,000+ income bracket, making it the least populous group.
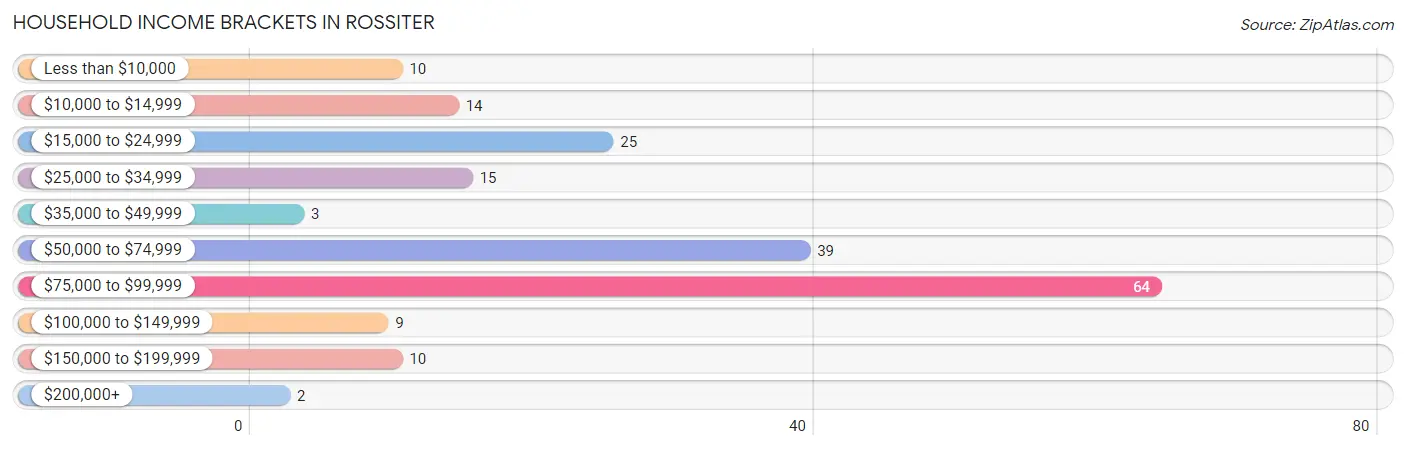
| Income Bracket | # Households | % Households |
| Less than $10,000 | 10 | 5.2% |
| $10,000 to $14,999 | 14 | 7.3% |
| $15,000 to $24,999 | 25 | 13.1% |
| $25,000 to $34,999 | 15 | 7.9% |
| $35,000 to $49,999 | 3 | 1.6% |
| $50,000 to $74,999 | 39 | 20.4% |
| $75,000 to $99,999 | 64 | 33.5% |
| $100,000 to $149,999 | 9 | 4.7% |
| $150,000 to $199,999 | 10 | 5.2% |
| $200,000+ | 2 | 1.0% |
Household Income by Householder Age in Rossiter
The median household income in Rossiter is $67,292, with the highest median household income of $77,601 found in the 25 to 44 years age bracket for the primary householder. A total of 93 households (48.7%) fall into this category. Meanwhile, the 15 to 24 years age bracket for the primary householder has the lowest median household income of $0, with 4 households (2.1%) in this group.
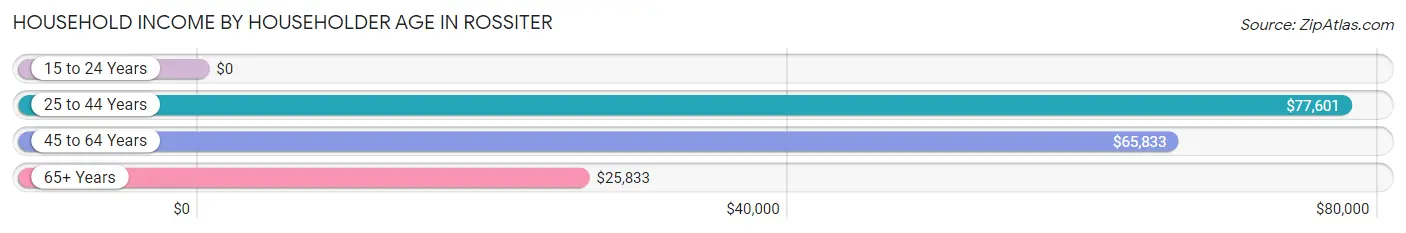
| Income Bracket | # Households | Median Income |
| 15 to 24 Years | 4 (2.1%) | $0 |
| 25 to 44 Years | 93 (48.7%) | $77,601 |
| 45 to 64 Years | 54 (28.3%) | $65,833 |
| 65+ Years | 40 (20.9%) | $25,833 |
| Total | 191 (100.0%) | $67,292 |
Poverty in Rossiter
Income Below Poverty by Sex and Age in Rossiter
With 17.9% poverty level for males and 10.3% for females among the residents of Rossiter, 15 year old males and under 5 year old females are the most vulnerable to poverty, with 3 males (100.0%) and 11 females (78.6%) in their respective age groups living below the poverty level.
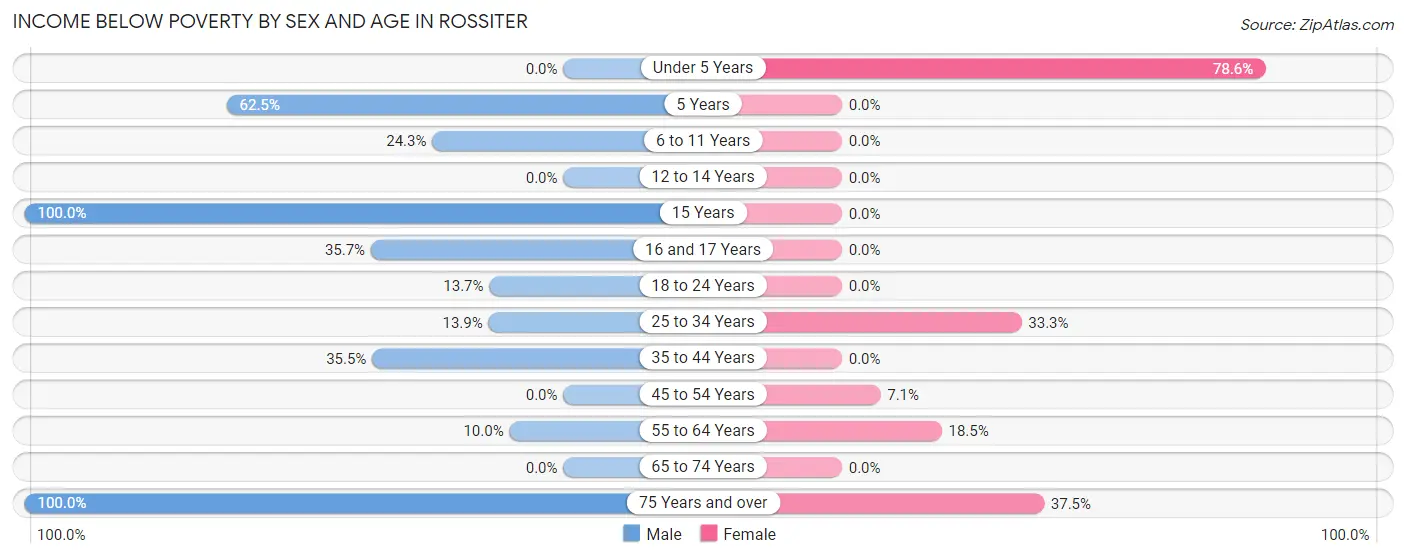
| Age Bracket | Male | Female |
| Under 5 Years | 0 (0.0%) | 11 (78.6%) |
| 5 Years | 5 (62.5%) | 0 (0.0%) |
| 6 to 11 Years | 9 (24.3%) | 0 (0.0%) |
| 12 to 14 Years | 0 (0.0%) | 0 (0.0%) |
| 15 Years | 3 (100.0%) | 0 (0.0%) |
| 16 and 17 Years | 5 (35.7%) | 0 (0.0%) |
| 18 to 24 Years | 7 (13.7%) | 0 (0.0%) |
| 25 to 34 Years | 5 (13.9%) | 5 (33.3%) |
| 35 to 44 Years | 11 (35.5%) | 0 (0.0%) |
| 45 to 54 Years | 0 (0.0%) | 2 (7.1%) |
| 55 to 64 Years | 5 (10.0%) | 5 (18.5%) |
| 65 to 74 Years | 0 (0.0%) | 0 (0.0%) |
| 75 Years and over | 12 (100.0%) | 9 (37.5%) |
| Total | 62 (17.9%) | 32 (10.3%) |
Income Above Poverty by Sex and Age in Rossiter
According to the poverty statistics in Rossiter, males aged under 5 years and females aged 6 to 11 years are the age groups that are most secure financially, with 100.0% of males and 100.0% of females in these age groups living above the poverty line.
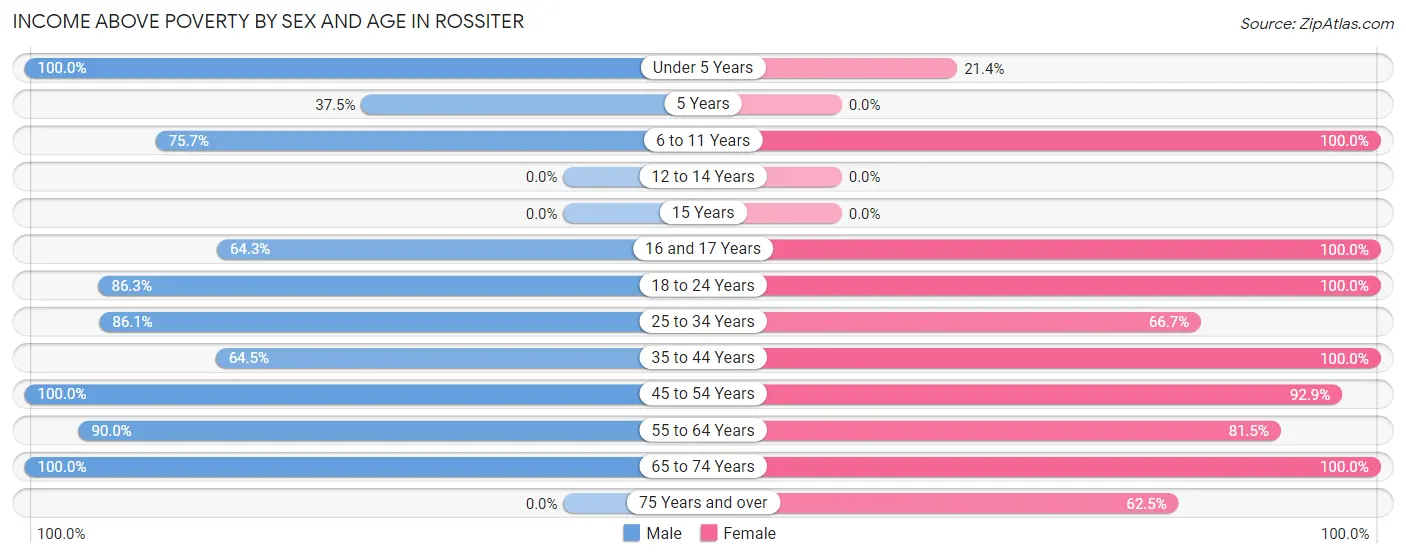
| Age Bracket | Male | Female |
| Under 5 Years | 16 (100.0%) | 3 (21.4%) |
| 5 Years | 3 (37.5%) | 0 (0.0%) |
| 6 to 11 Years | 28 (75.7%) | 6 (100.0%) |
| 12 to 14 Years | 0 (0.0%) | 0 (0.0%) |
| 15 Years | 0 (0.0%) | 0 (0.0%) |
| 16 and 17 Years | 9 (64.3%) | 6 (100.0%) |
| 18 to 24 Years | 44 (86.3%) | 126 (100.0%) |
| 25 to 34 Years | 31 (86.1%) | 10 (66.7%) |
| 35 to 44 Years | 20 (64.5%) | 43 (100.0%) |
| 45 to 54 Years | 43 (100.0%) | 26 (92.9%) |
| 55 to 64 Years | 45 (90.0%) | 22 (81.5%) |
| 65 to 74 Years | 46 (100.0%) | 22 (100.0%) |
| 75 Years and over | 0 (0.0%) | 15 (62.5%) |
| Total | 285 (82.1%) | 279 (89.7%) |
Income Below Poverty Among Married-Couple Families in Rossiter
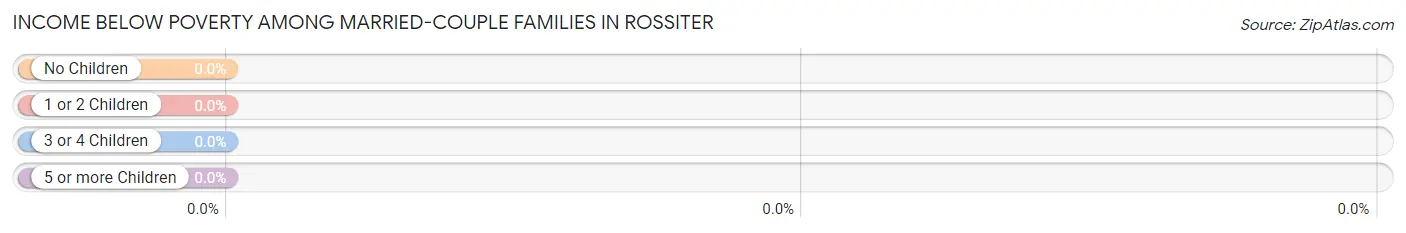
| Children | Above Poverty | Below Poverty |
| No Children | 69 (100.0%) | 0 (0.0%) |
| 1 or 2 Children | 26 (100.0%) | 0 (0.0%) |
| 3 or 4 Children | 0 (0.0%) | 0 (0.0%) |
| 5 or more Children | 0 (0.0%) | 0 (0.0%) |
| Total | 95 (100.0%) | 0 (0.0%) |
Income Below Poverty Among Single-Parent Households in Rossiter
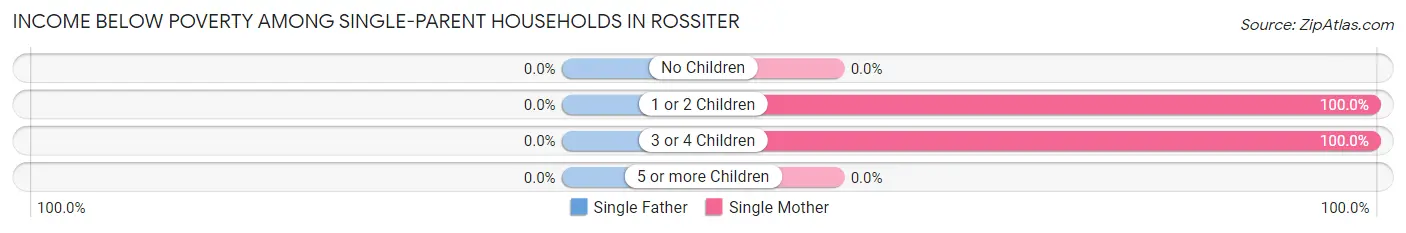
| Children | Single Father | Single Mother |
| No Children | 0 (0.0%) | 0 (0.0%) |
| 1 or 2 Children | 0 (0.0%) | 7 (100.0%) |
| 3 or 4 Children | 0 (0.0%) | 5 (100.0%) |
| 5 or more Children | 0 (0.0%) | 0 (0.0%) |
| Total | 0 (0.0%) | 12 (70.6%) |
Income Below Poverty Among Married-Couple vs Single-Parent Households in Rossiter
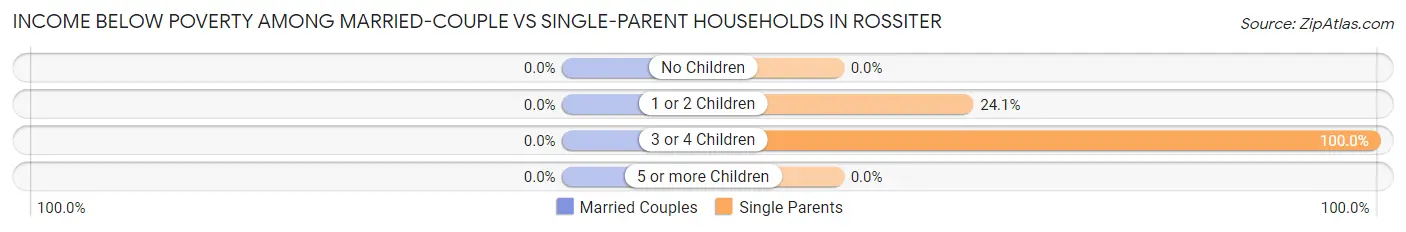
| Children | Married-Couple Families | Single-Parent Households |
| No Children | 0 (0.0%) | 0 (0.0%) |
| 1 or 2 Children | 0 (0.0%) | 7 (24.1%) |
| 3 or 4 Children | 0 (0.0%) | 5 (100.0%) |
| 5 or more Children | 0 (0.0%) | 0 (0.0%) |
| Total | 0 (0.0%) | 12 (28.6%) |
Race in Rossiter
The most populous races in Rossiter are White / Caucasian (648 | 98.0%), Two or more Races (11 | 1.7%), and Hawaiian / Pacific (2 | 0.3%).
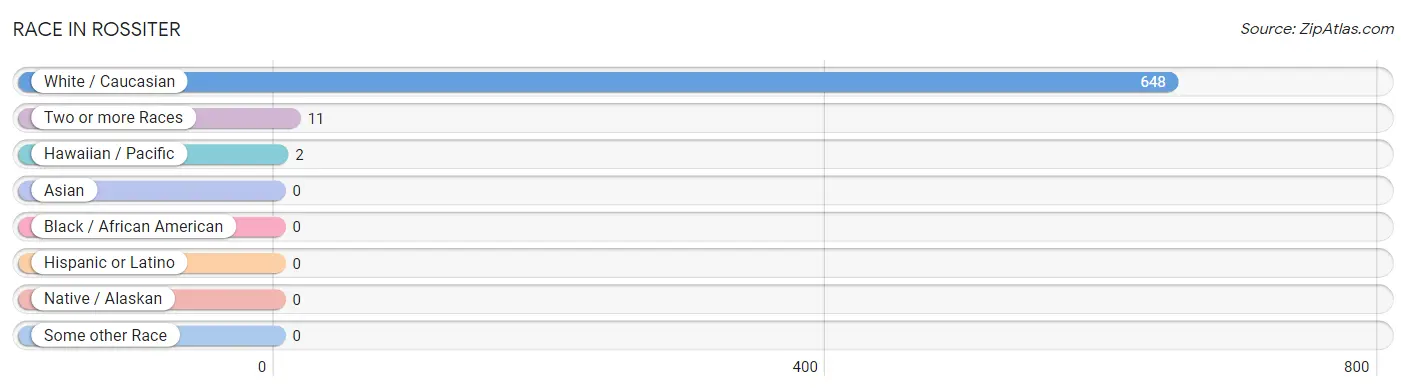
| Race | # Population | % Population |
| Asian | 0 | 0.0% |
| Black / African American | 0 | 0.0% |
| Hawaiian / Pacific | 2 | 0.3% |
| Hispanic or Latino | 0 | 0.0% |
| Native / Alaskan | 0 | 0.0% |
| White / Caucasian | 648 | 98.0% |
| Two or more Races | 11 | 1.7% |
| Some other Race | 0 | 0.0% |
| Total | 661 | 100.0% |
Ancestry in Rossiter
The most populous ancestries reported in Rossiter are German (116 | 17.5%), English (56 | 8.5%), Italian (54 | 8.2%), Polish (52 | 7.9%), and Swedish (37 | 5.6%), together accounting for 47.7% of all Rossiter residents.
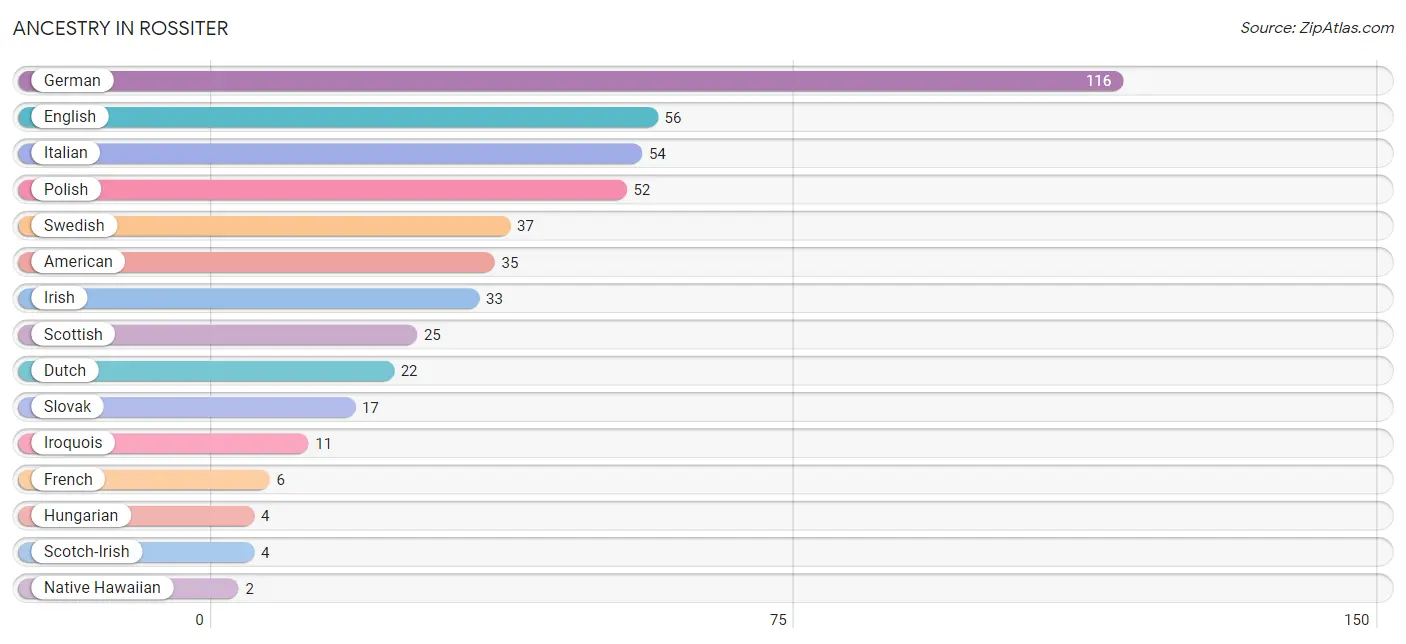
| Ancestry | # Population | % Population |
| American | 35 | 5.3% |
| Dutch | 22 | 3.3% |
| English | 56 | 8.5% |
| French | 6 | 0.9% |
| German | 116 | 17.5% |
| Hungarian | 4 | 0.6% |
| Irish | 33 | 5.0% |
| Iroquois | 11 | 1.7% |
| Italian | 54 | 8.2% |
| Native Hawaiian | 2 | 0.3% |
| Polish | 52 | 7.9% |
| Scotch-Irish | 4 | 0.6% |
| Scottish | 25 | 3.8% |
| Slovak | 17 | 2.6% |
| Swedish | 37 | 5.6% | View All 15 Rows |
Immigrants in Rossiter

| Immigration Origin | # Population | % Population | View All 0 Rows |
Sex and Age in Rossiter
Sex and Age in Rossiter
The most populous age groups in Rossiter are 20 to 24 Years (51 | 14.6%) for men and 20 to 24 Years (126 | 40.5%) for women.
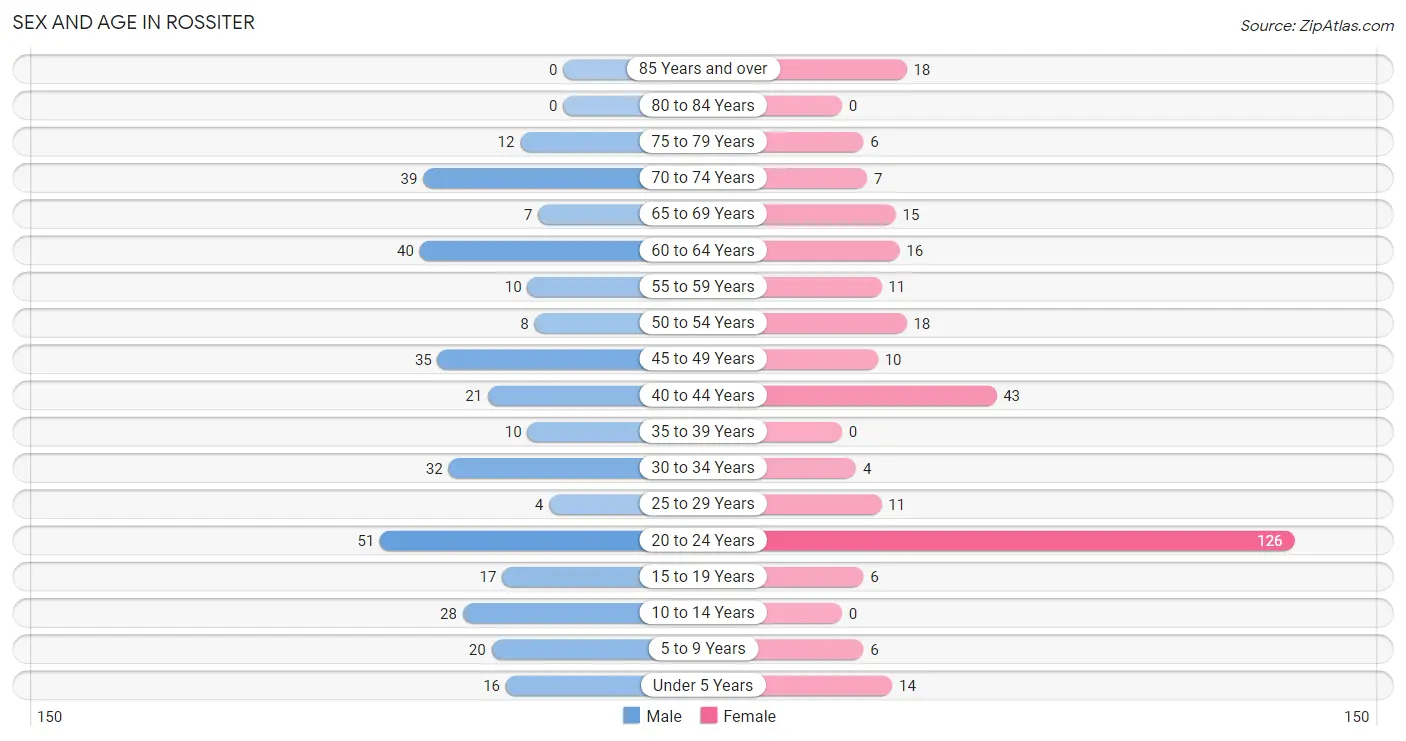
| Age Bracket | Male | Female |
| Under 5 Years | 16 (4.6%) | 14 (4.5%) |
| 5 to 9 Years | 20 (5.7%) | 6 (1.9%) |
| 10 to 14 Years | 28 (8.0%) | 0 (0.0%) |
| 15 to 19 Years | 17 (4.9%) | 6 (1.9%) |
| 20 to 24 Years | 51 (14.6%) | 126 (40.5%) |
| 25 to 29 Years | 4 (1.1%) | 11 (3.5%) |
| 30 to 34 Years | 32 (9.1%) | 4 (1.3%) |
| 35 to 39 Years | 10 (2.9%) | 0 (0.0%) |
| 40 to 44 Years | 21 (6.0%) | 43 (13.8%) |
| 45 to 49 Years | 35 (10.0%) | 10 (3.2%) |
| 50 to 54 Years | 8 (2.3%) | 18 (5.8%) |
| 55 to 59 Years | 10 (2.9%) | 11 (3.5%) |
| 60 to 64 Years | 40 (11.4%) | 16 (5.1%) |
| 65 to 69 Years | 7 (2.0%) | 15 (4.8%) |
| 70 to 74 Years | 39 (11.1%) | 7 (2.2%) |
| 75 to 79 Years | 12 (3.4%) | 6 (1.9%) |
| 80 to 84 Years | 0 (0.0%) | 0 (0.0%) |
| 85 Years and over | 0 (0.0%) | 18 (5.8%) |
| Total | 350 (100.0%) | 311 (100.0%) |
Families and Households in Rossiter
Median Family Size in Rossiter
The median family size in Rossiter is 3.88 persons per family, with married-couple families (95 | 69.3%) accounting for the largest median family size of 4.36 persons per family. On the other hand, single male/father families (25 | 18.2%) represent the smallest median family size with 2.60 persons per family.
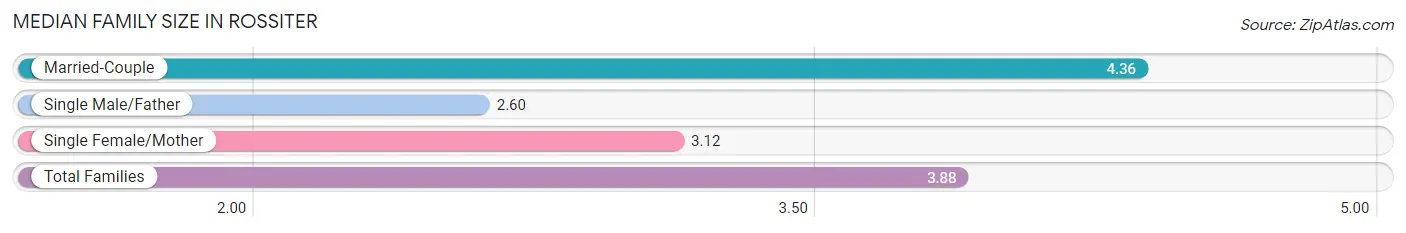
| Family Type | # Families | Family Size |
| Married-Couple | 95 (69.3%) | 4.36 |
| Single Male/Father | 25 (18.2%) | 2.60 |
| Single Female/Mother | 17 (12.4%) | 3.12 |
| Total Families | 137 (100.0%) | 3.88 |
Median Household Size in Rossiter
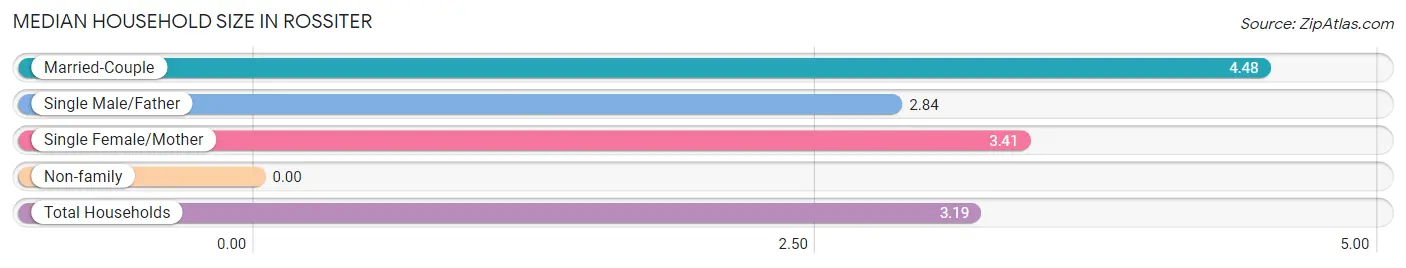
| Household Type | # Households | Household Size |
| Married-Couple | 95 (49.7%) | 4.48 |
| Single Male/Father | 25 (13.1%) | 2.84 |
| Single Female/Mother | 17 (8.9%) | 3.41 |
| Non-family | 54 (28.3%) | - |
| Total Households | 191 (100.0%) | 3.19 |
Household Size by Marriage Status in Rossiter
Out of a total of 191 households in Rossiter, 137 (71.7%) are family households, while 54 (28.3%) are nonfamily households. The most numerous type of family households are 2-person households, comprising 49, and the most common type of nonfamily households are 1-person households, comprising 54.
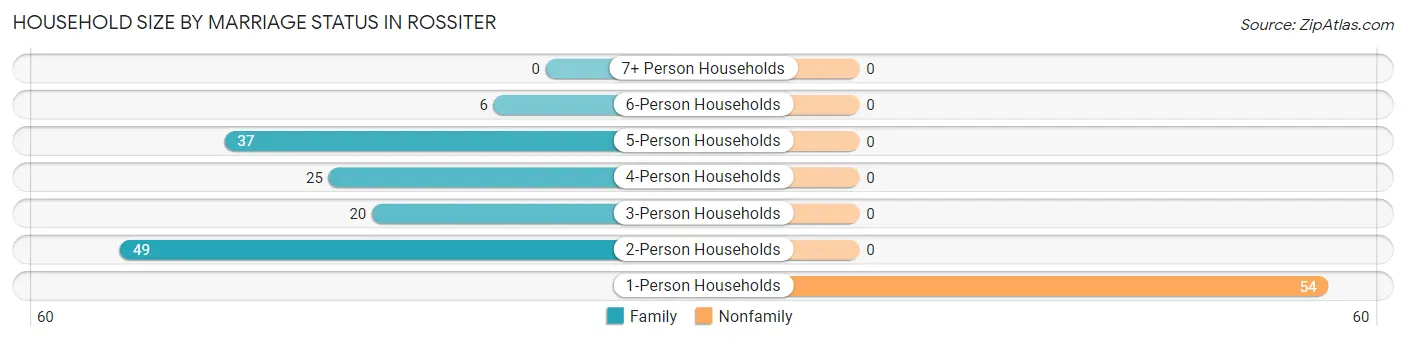
| Household Size | Family Households | Nonfamily Households |
| 1-Person Households | - | 54 (28.3%) |
| 2-Person Households | 49 (25.7%) | 0 (0.0%) |
| 3-Person Households | 20 (10.5%) | 0 (0.0%) |
| 4-Person Households | 25 (13.1%) | 0 (0.0%) |
| 5-Person Households | 37 (19.4%) | 0 (0.0%) |
| 6-Person Households | 6 (3.1%) | 0 (0.0%) |
| 7+ Person Households | 0 (0.0%) | 0 (0.0%) |
| Total | 137 (71.7%) | 54 (28.3%) |
Female Fertility in Rossiter
Fertility by Age in Rossiter
Average fertility rate in Rossiter is 40.0 births per 1,000 women. Women in the age bracket of 20 to 34 years have the highest fertility rate with 57.0 births per 1,000 women. Women in the age bracket of 20 to 34 years acount for 100.0% of all women with births.
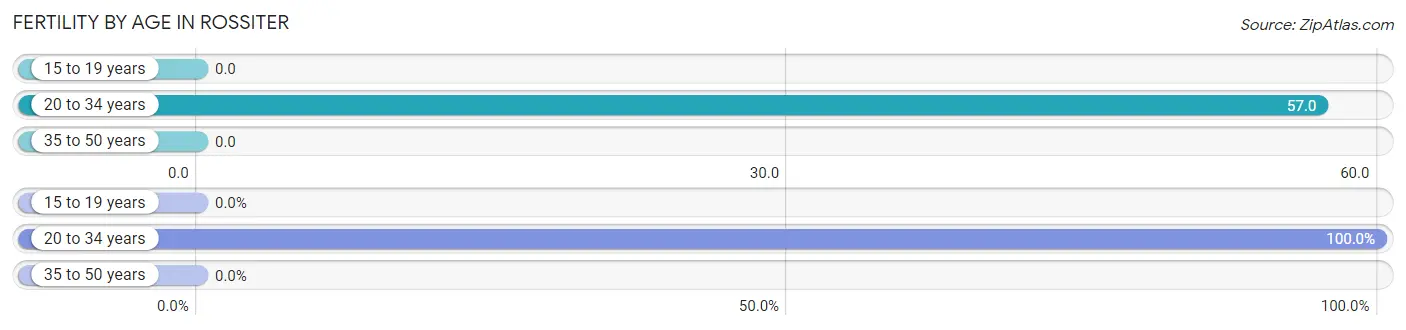
| Age Bracket | Women with Births | Births / 1,000 Women |
| 15 to 19 years | 0 (0.0%) | 0.0 |
| 20 to 34 years | 8 (100.0%) | 57.0 |
| 35 to 50 years | 0 (0.0%) | 0.0 |
| Total | 8 (100.0%) | 40.0 |
Fertility by Age by Marriage Status in Rossiter
37.5% of women with births (8) in Rossiter are married. The highest percentage of unmarried women with births falls into 20 to 34 years age bracket with 62.5% of them unmarried at the time of birth, while the lowest percentage of unmarried women with births belong to 20 to 34 years age bracket with 62.5% of them unmarried.
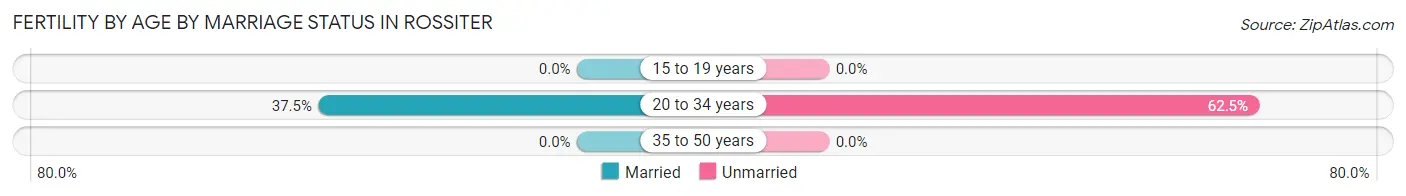
| Age Bracket | Married | Unmarried |
| 15 to 19 years | 0 (0.0%) | 0 (0.0%) |
| 20 to 34 years | 3 (37.5%) | 5 (62.5%) |
| 35 to 50 years | 0 (0.0%) | 0 (0.0%) |
| Total | 3 (37.5%) | 5 (62.5%) |
Fertility by Education in Rossiter
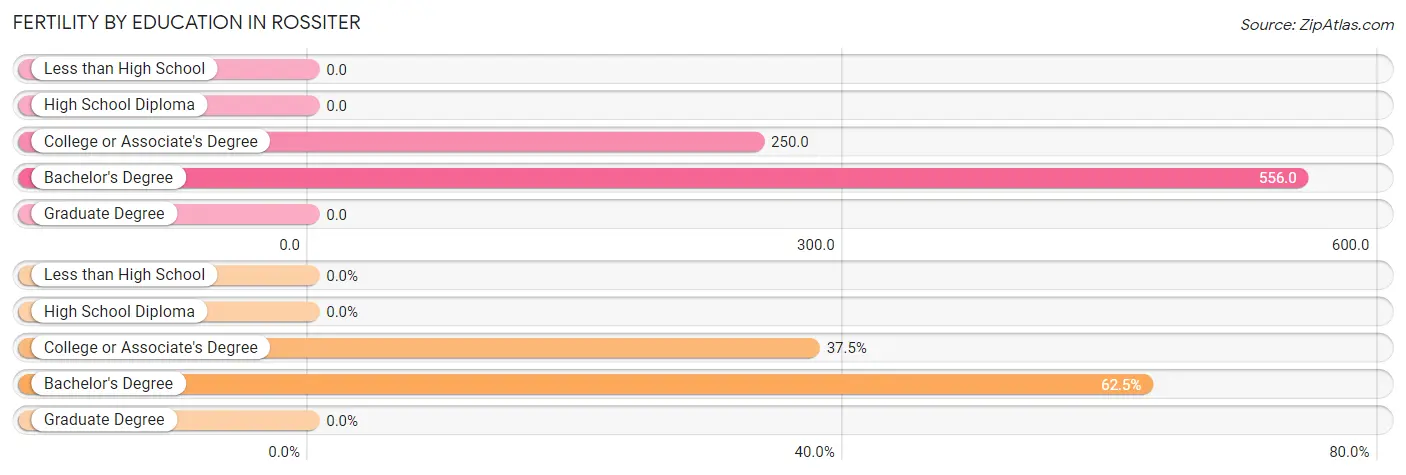
| Educational Attainment | Women with Births | Births / 1,000 Women |
| Less than High School | 0 (0.0%) | 0.0 |
| High School Diploma | 0 (0.0%) | 0.0 |
| College or Associate's Degree | 3 (37.5%) | 250.0 |
| Bachelor's Degree | 5 (62.5%) | 556.0 |
| Graduate Degree | 0 (0.0%) | 0.0 |
| Total | 8 (100.0%) | 40.0 |
Fertility by Education by Marriage Status in Rossiter
62.5% of women with births in Rossiter are unmarried. Women with the educational attainment of college or associate's degree are most likely to be married with 100.0% of them married at childbirth, while women with the educational attainment of bachelor's degree are least likely to be married with 100.0% of them unmarried at childbirth.
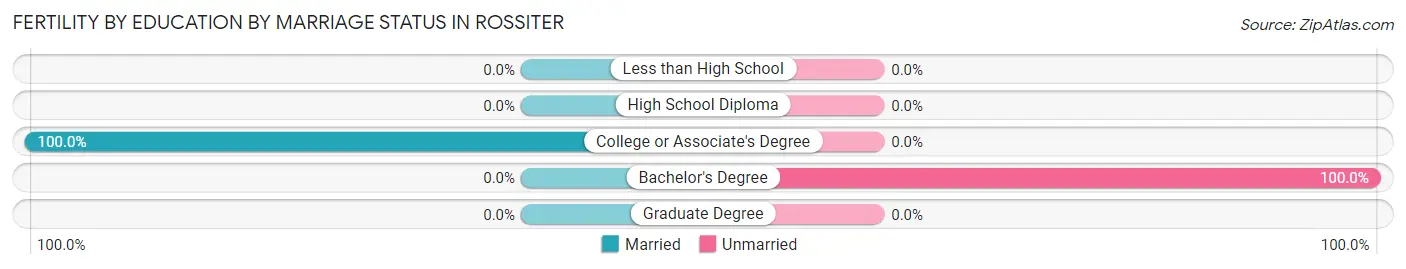
| Educational Attainment | Married | Unmarried |
| Less than High School | 0 (0.0%) | 0 (0.0%) |
| High School Diploma | 0 (0.0%) | 0 (0.0%) |
| College or Associate's Degree | 3 (100.0%) | 0 (0.0%) |
| Bachelor's Degree | 0 (0.0%) | 5 (100.0%) |
| Graduate Degree | 0 (0.0%) | 0 (0.0%) |
| Total | 3 (37.5%) | 5 (62.5%) |
Employment Characteristics in Rossiter
Employment by Class of Employer in Rossiter
Among the 341 employed individuals in Rossiter, private company employees (317 | 93.0%), state government employees (9 | 2.6%), and not-for-profit organizations (6 | 1.8%) make up the most common classes of employment.
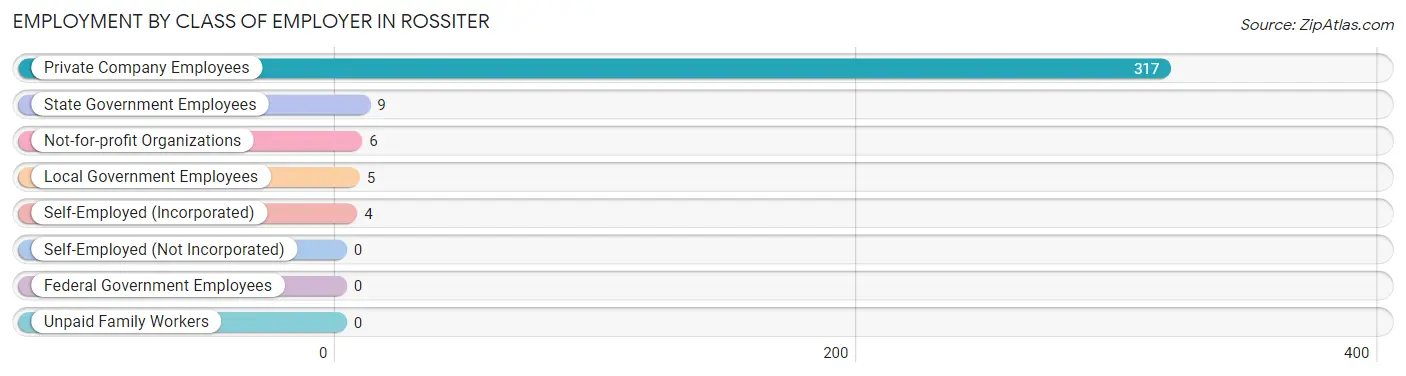
| Employer Class | # Employees | % Employees |
| Private Company Employees | 317 | 93.0% |
| Self-Employed (Incorporated) | 4 | 1.2% |
| Self-Employed (Not Incorporated) | 0 | 0.0% |
| Not-for-profit Organizations | 6 | 1.8% |
| Local Government Employees | 5 | 1.5% |
| State Government Employees | 9 | 2.6% |
| Federal Government Employees | 0 | 0.0% |
| Unpaid Family Workers | 0 | 0.0% |
| Total | 341 | 100.0% |
Employment Status by Age in Rossiter
According to the labor force statistics for Rossiter, out of the total population over 16 years of age (574), 65.0% or 373 individuals are in the labor force, with 8.6% or 32 of them unemployed. The age group with the highest labor force participation rate is 35 to 44 years, with 100.0% or 74 individuals in the labor force. Within the labor force, the 75 years and over age range has the highest percentage of unemployed individuals, with 100.0% or 12 of them being unemployed.
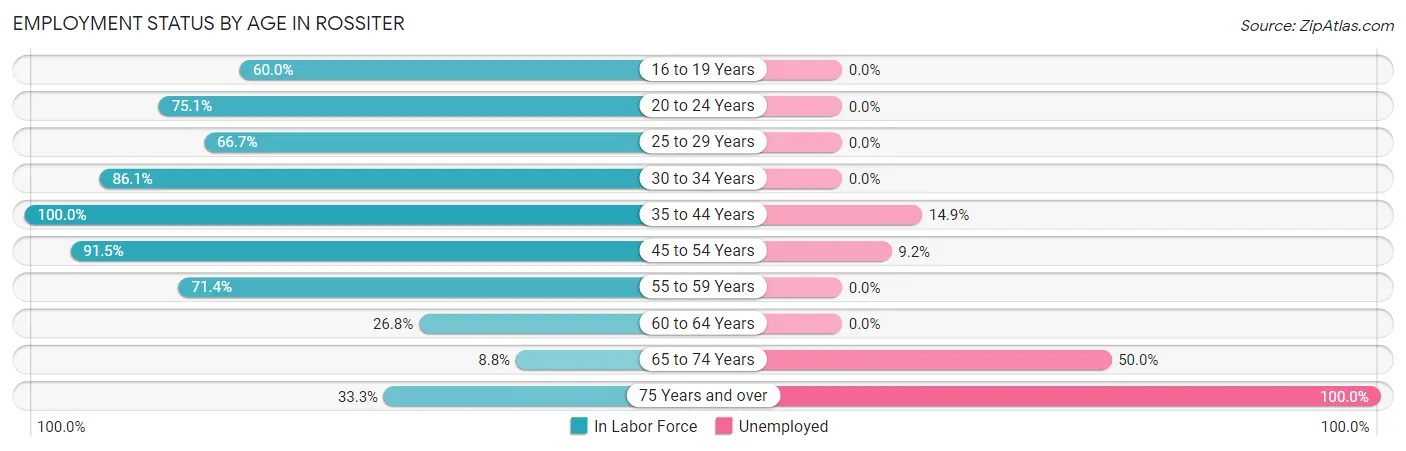
| Age Bracket | In Labor Force | Unemployed |
| 16 to 19 Years | 12 (60.0%) | 0 (0.0%) |
| 20 to 24 Years | 133 (75.1%) | 0 (0.0%) |
| 25 to 29 Years | 10 (66.7%) | 0 (0.0%) |
| 30 to 34 Years | 31 (86.1%) | 0 (0.0%) |
| 35 to 44 Years | 74 (100.0%) | 11 (14.9%) |
| 45 to 54 Years | 65 (91.5%) | 6 (9.2%) |
| 55 to 59 Years | 15 (71.4%) | 0 (0.0%) |
| 60 to 64 Years | 15 (26.8%) | 0 (0.0%) |
| 65 to 74 Years | 6 (8.8%) | 3 (50.0%) |
| 75 Years and over | 12 (33.3%) | 12 (100.0%) |
| Total | 373 (65.0%) | 32 (8.6%) |
Employment Status by Educational Attainment in Rossiter
According to labor force statistics for Rossiter, 76.9% of individuals (210) out of the total population between 25 and 64 years of age (273) are in the labor force, with 8.1% or 17 of them being unemployed. The group with the highest labor force participation rate are those with the educational attainment of less than high school, with 84.4% or 54 individuals in the labor force. Within the labor force, individuals with less than high school education have the highest percentage of unemployment, with 20.4% or 11 of them being unemployed.
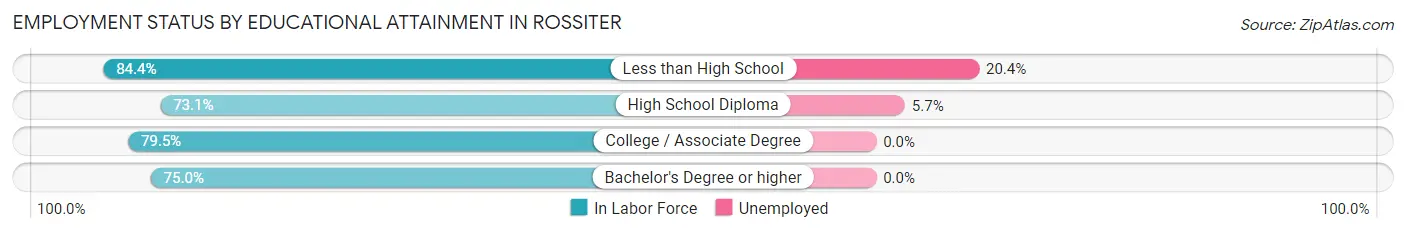
| Educational Attainment | In Labor Force | Unemployed |
| Less than High School | 54 (84.4%) | 13 (20.4%) |
| High School Diploma | 106 (73.1%) | 8 (5.7%) |
| College / Associate Degree | 35 (79.5%) | 0 (0.0%) |
| Bachelor's Degree or higher | 15 (75.0%) | 0 (0.0%) |
| Total | 210 (76.9%) | 22 (8.1%) |
Employment Occupations by Sex in Rossiter
Management, Business, Science and Arts Occupations
The most common Management, Business, Science and Arts occupations in Rossiter are Management (24 | 7.0%), Community & Social Service (13 | 3.8%), Education Instruction & Library (13 | 3.8%), Health Diagnosing & Treating (7 | 2.1%), and Computers, Engineering & Science (3 | 0.9%).
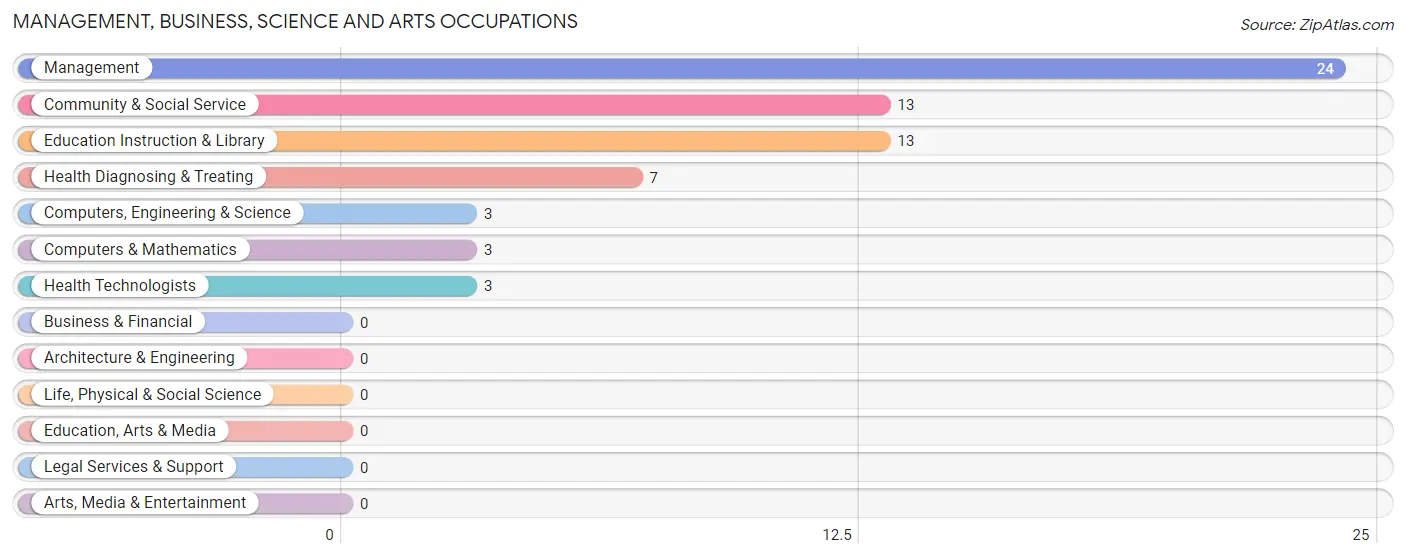
Management, Business, Science and Arts Occupations by Sex
Within the Management, Business, Science and Arts occupations in Rossiter, the most male-oriented occupations are Computers, Engineering & Science (100.0%), Computers & Mathematics (100.0%), and Management (91.7%), while the most female-oriented occupations are Community & Social Service (100.0%), Education Instruction & Library (100.0%), and Health Diagnosing & Treating (100.0%).
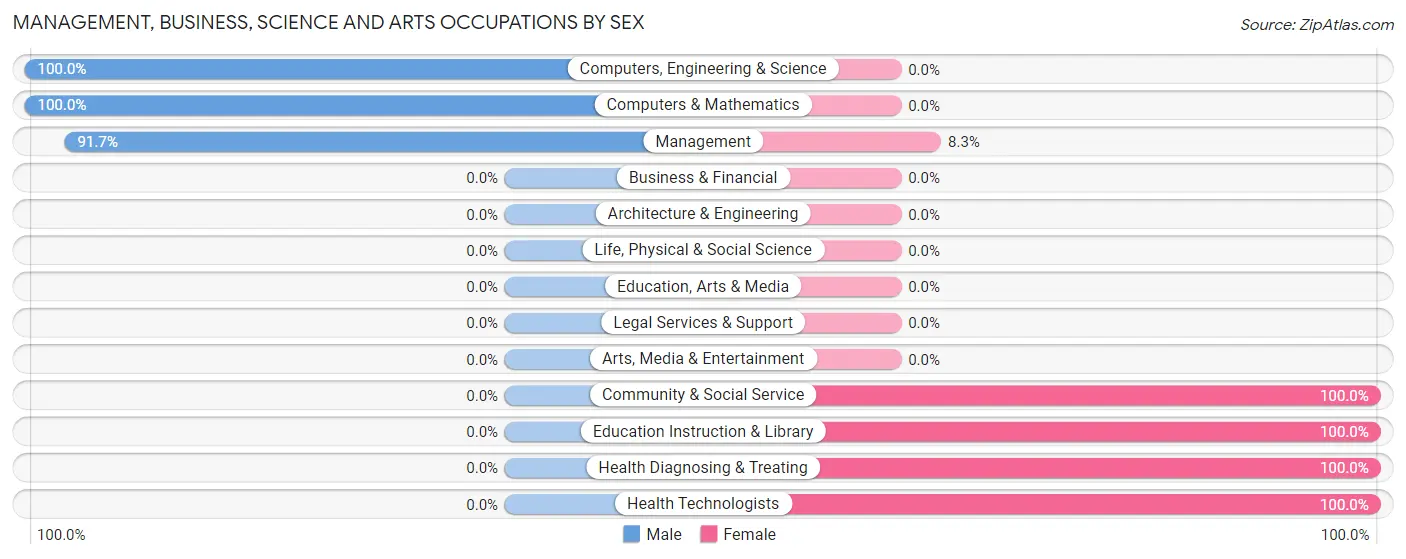
| Occupation | Male | Female |
| Management | 22 (91.7%) | 2 (8.3%) |
| Business & Financial | 0 (0.0%) | 0 (0.0%) |
| Computers, Engineering & Science | 3 (100.0%) | 0 (0.0%) |
| Computers & Mathematics | 3 (100.0%) | 0 (0.0%) |
| Architecture & Engineering | 0 (0.0%) | 0 (0.0%) |
| Life, Physical & Social Science | 0 (0.0%) | 0 (0.0%) |
| Community & Social Service | 0 (0.0%) | 13 (100.0%) |
| Education, Arts & Media | 0 (0.0%) | 0 (0.0%) |
| Legal Services & Support | 0 (0.0%) | 0 (0.0%) |
| Education Instruction & Library | 0 (0.0%) | 13 (100.0%) |
| Arts, Media & Entertainment | 0 (0.0%) | 0 (0.0%) |
| Health Diagnosing & Treating | 0 (0.0%) | 7 (100.0%) |
| Health Technologists | 0 (0.0%) | 3 (100.0%) |
| Total (Category) | 25 (53.2%) | 22 (46.8%) |
| Total (Overall) | 130 (38.1%) | 211 (61.9%) |
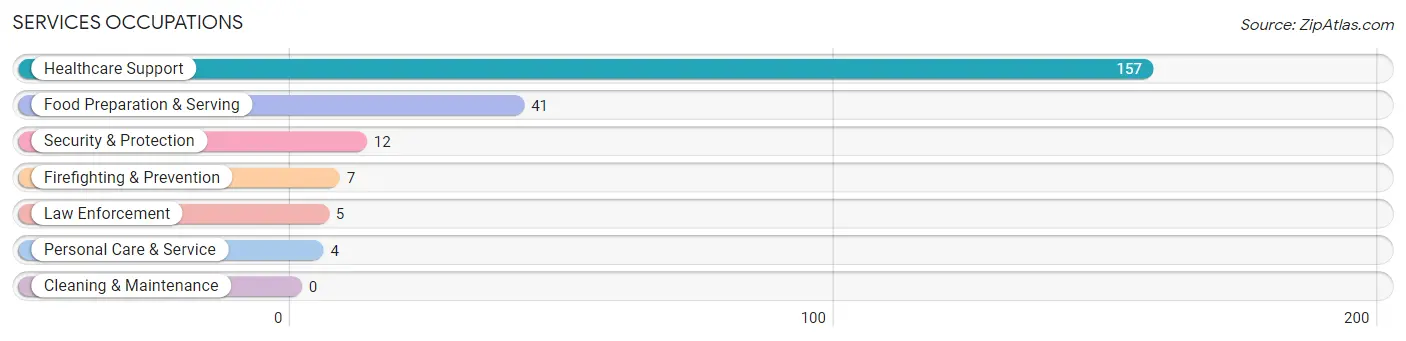
Services Occupations
The most common Services occupations in Rossiter are Healthcare Support (157 | 46.0%), Food Preparation & Serving (41 | 12.0%), Security & Protection (12 | 3.5%), Firefighting & Prevention (7 | 2.1%), and Law Enforcement (5 | 1.5%).
Services Occupations by Sex
Within the Services occupations in Rossiter, the most male-oriented occupations are Security & Protection (100.0%), Firefighting & Prevention (100.0%), and Law Enforcement (100.0%), while the most female-oriented occupations are Healthcare Support (100.0%), Personal Care & Service (100.0%), and Food Preparation & Serving (22.0%).
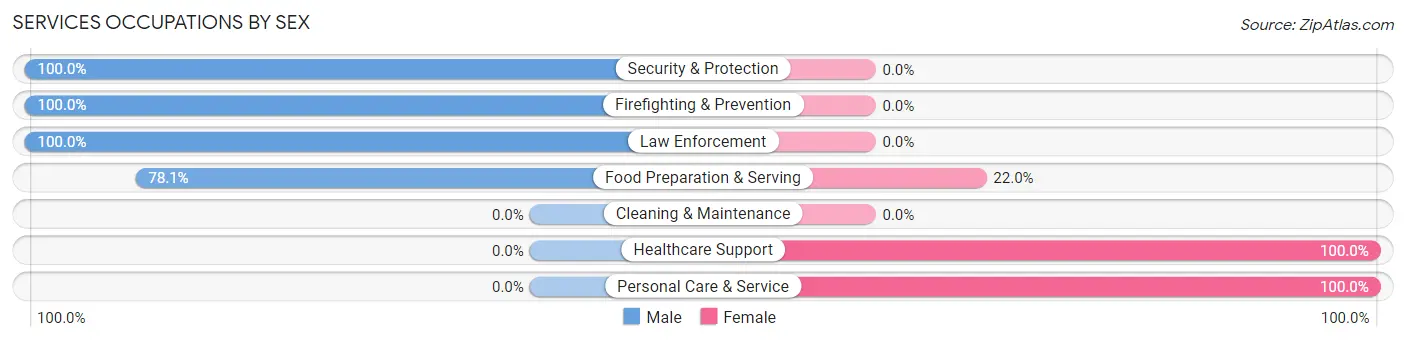
| Occupation | Male | Female |
| Healthcare Support | 0 (0.0%) | 157 (100.0%) |
| Security & Protection | 12 (100.0%) | 0 (0.0%) |
| Firefighting & Prevention | 7 (100.0%) | 0 (0.0%) |
| Law Enforcement | 5 (100.0%) | 0 (0.0%) |
| Food Preparation & Serving | 32 (78.0%) | 9 (22.0%) |
| Cleaning & Maintenance | 0 (0.0%) | 0 (0.0%) |
| Personal Care & Service | 0 (0.0%) | 4 (100.0%) |
| Total (Category) | 44 (20.6%) | 170 (79.4%) |
| Total (Overall) | 130 (38.1%) | 211 (61.9%) |
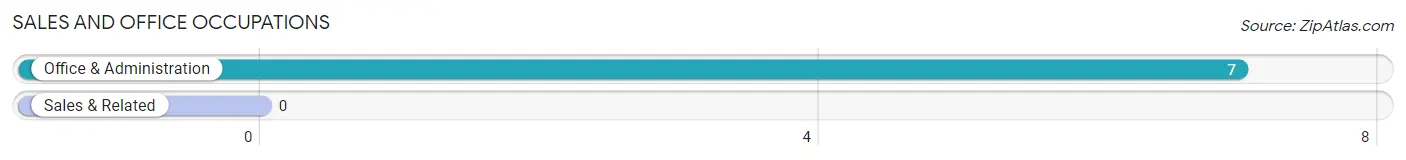
Sales and Office Occupations
The most common Sales and Office occupations in Rossiter are , and Office & Administration (7 | 2.1%).
Sales and Office Occupations by Sex
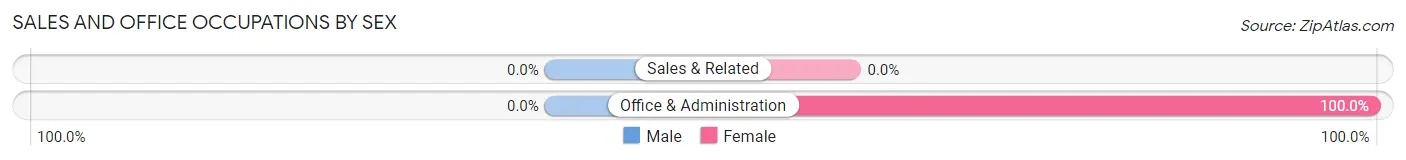
| Occupation | Male | Female |
| Sales & Related | 0 (0.0%) | 0 (0.0%) |
| Office & Administration | 0 (0.0%) | 7 (100.0%) |
| Total (Category) | 0 (0.0%) | 7 (100.0%) |
| Total (Overall) | 130 (38.1%) | 211 (61.9%) |
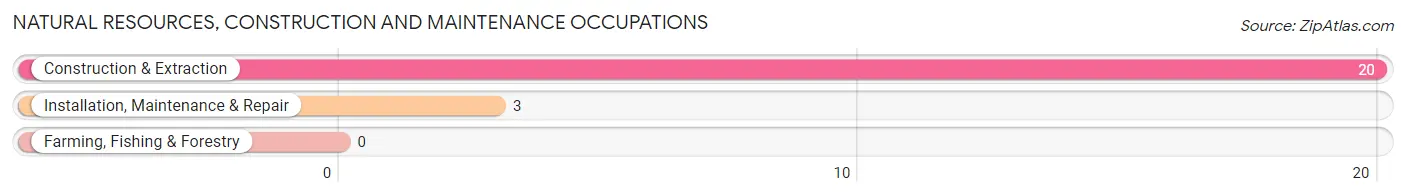
Natural Resources, Construction and Maintenance Occupations
The most common Natural Resources, Construction and Maintenance occupations in Rossiter are Construction & Extraction (20 | 5.9%), and Installation, Maintenance & Repair (3 | 0.9%).
Natural Resources, Construction and Maintenance Occupations by Sex
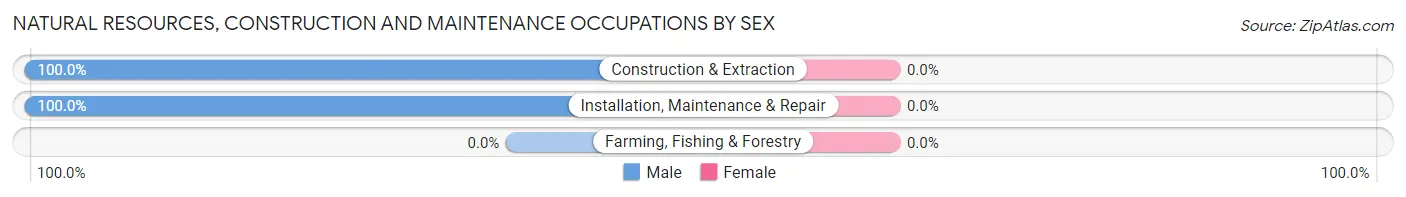
| Occupation | Male | Female |
| Farming, Fishing & Forestry | 0 (0.0%) | 0 (0.0%) |
| Construction & Extraction | 20 (100.0%) | 0 (0.0%) |
| Installation, Maintenance & Repair | 3 (100.0%) | 0 (0.0%) |
| Total (Category) | 23 (100.0%) | 0 (0.0%) |
| Total (Overall) | 130 (38.1%) | 211 (61.9%) |
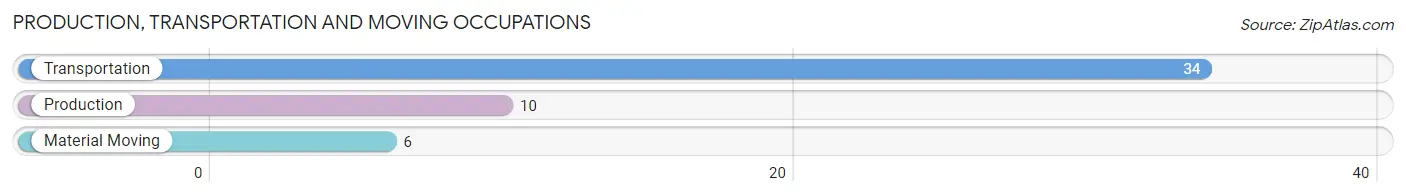
Production, Transportation and Moving Occupations
The most common Production, Transportation and Moving occupations in Rossiter are Transportation (34 | 10.0%), Production (10 | 2.9%), and Material Moving (6 | 1.8%).
Production, Transportation and Moving Occupations by Sex
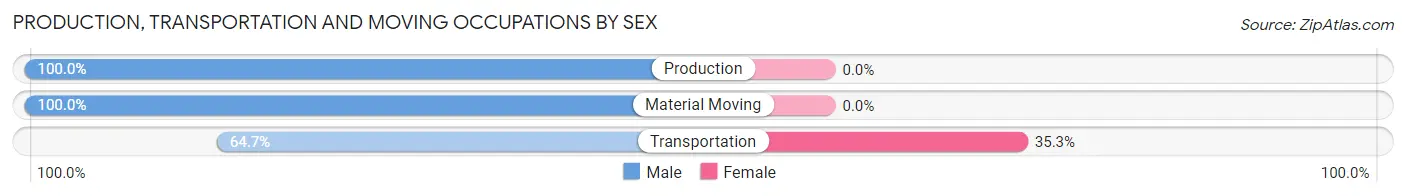
| Occupation | Male | Female |
| Production | 10 (100.0%) | 0 (0.0%) |
| Transportation | 22 (64.7%) | 12 (35.3%) |
| Material Moving | 6 (100.0%) | 0 (0.0%) |
| Total (Category) | 38 (76.0%) | 12 (24.0%) |
| Total (Overall) | 130 (38.1%) | 211 (61.9%) |
Employment Industries by Sex in Rossiter
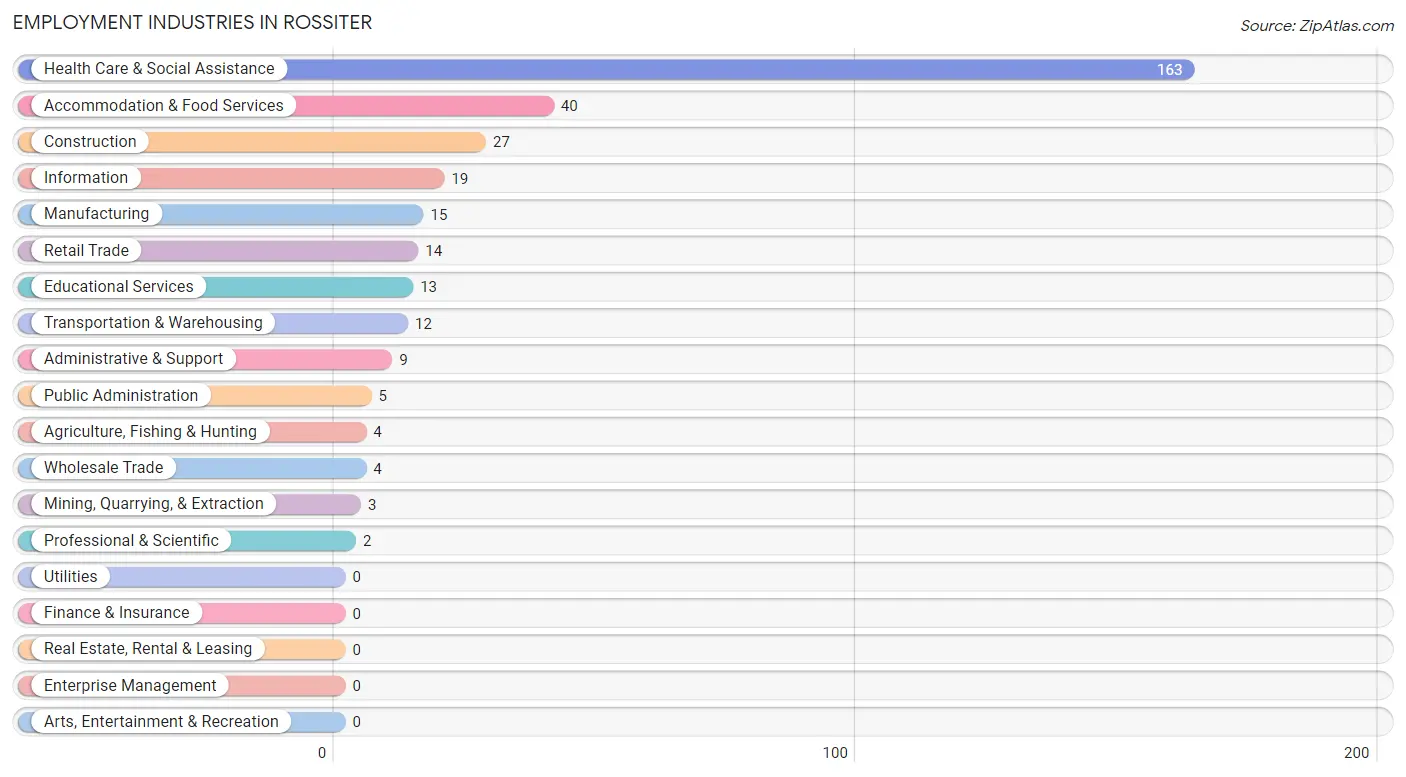
Employment Industries in Rossiter
The major employment industries in Rossiter include Health Care & Social Assistance (163 | 47.8%), Accommodation & Food Services (40 | 11.7%), Construction (27 | 7.9%), Information (19 | 5.6%), and Manufacturing (15 | 4.4%).
Employment Industries by Sex in Rossiter
The Rossiter industries that see more men than women are Mining, Quarrying, & Extraction (100.0%), Construction (100.0%), and Manufacturing (100.0%), whereas the industries that tend to have a higher number of women are Agriculture, Fishing & Hunting (100.0%), Wholesale Trade (100.0%), and Professional & Scientific (100.0%).
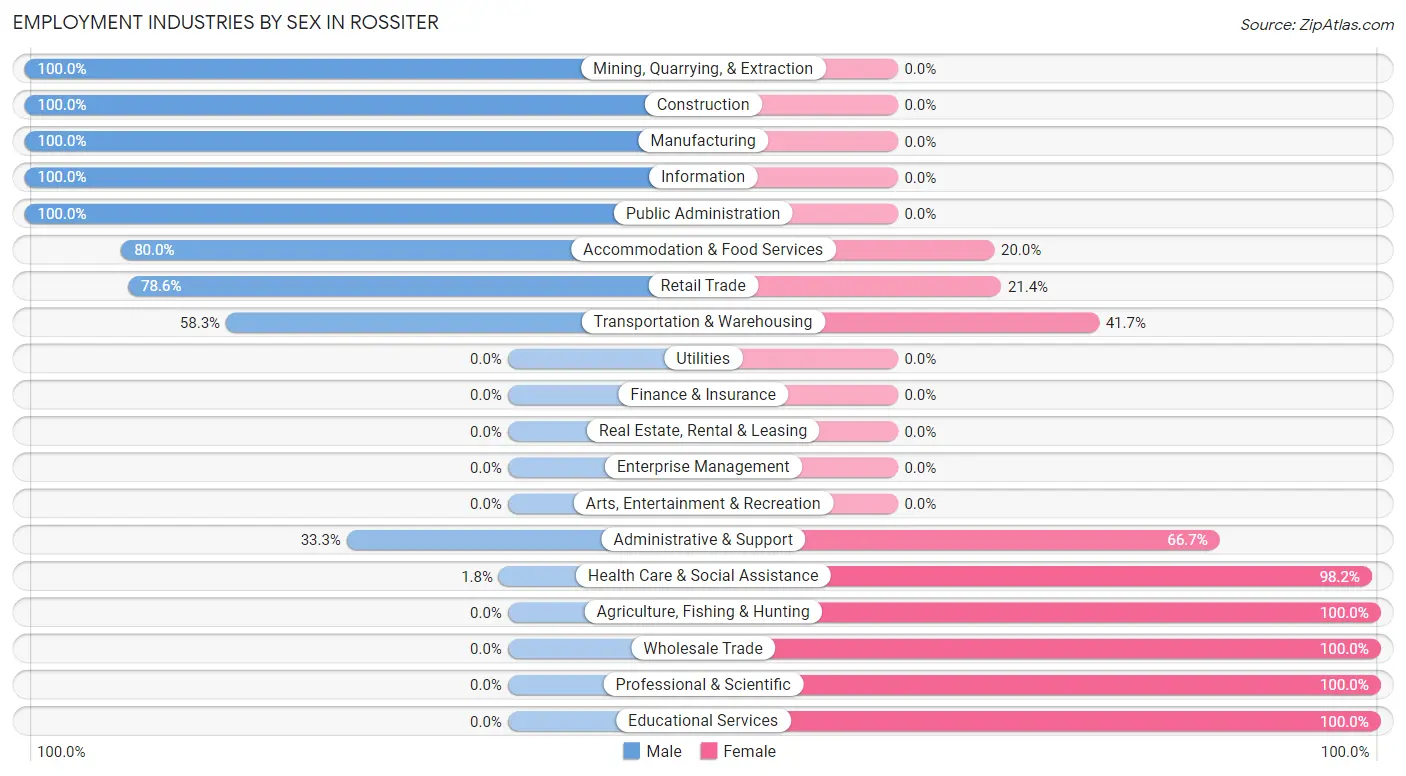
| Industry | Male | Female |
| Agriculture, Fishing & Hunting | 0 (0.0%) | 4 (100.0%) |
| Mining, Quarrying, & Extraction | 3 (100.0%) | 0 (0.0%) |
| Construction | 27 (100.0%) | 0 (0.0%) |
| Manufacturing | 15 (100.0%) | 0 (0.0%) |
| Wholesale Trade | 0 (0.0%) | 4 (100.0%) |
| Retail Trade | 11 (78.6%) | 3 (21.4%) |
| Transportation & Warehousing | 7 (58.3%) | 5 (41.7%) |
| Utilities | 0 (0.0%) | 0 (0.0%) |
| Information | 19 (100.0%) | 0 (0.0%) |
| Finance & Insurance | 0 (0.0%) | 0 (0.0%) |
| Real Estate, Rental & Leasing | 0 (0.0%) | 0 (0.0%) |
| Professional & Scientific | 0 (0.0%) | 2 (100.0%) |
| Enterprise Management | 0 (0.0%) | 0 (0.0%) |
| Administrative & Support | 3 (33.3%) | 6 (66.7%) |
| Educational Services | 0 (0.0%) | 13 (100.0%) |
| Health Care & Social Assistance | 3 (1.8%) | 160 (98.2%) |
| Arts, Entertainment & Recreation | 0 (0.0%) | 0 (0.0%) |
| Accommodation & Food Services | 32 (80.0%) | 8 (20.0%) |
| Public Administration | 5 (100.0%) | 0 (0.0%) |
| Total | 130 (38.1%) | 211 (61.9%) |
Education in Rossiter
School Enrollment in Rossiter
The most common levels of schooling among the 66 students in Rossiter are high school (23 | 34.8%), elementary school (14 | 21.2%), and nursery / preschool (13 | 19.7%).
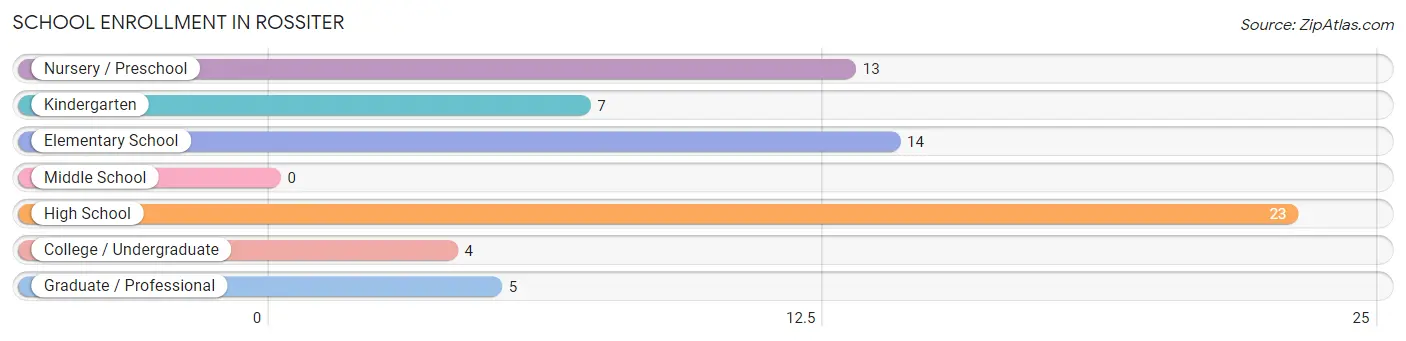
| School Level | # Students | % Students |
| Nursery / Preschool | 13 | 19.7% |
| Kindergarten | 7 | 10.6% |
| Elementary School | 14 | 21.2% |
| Middle School | 0 | 0.0% |
| High School | 23 | 34.8% |
| College / Undergraduate | 4 | 6.1% |
| Graduate / Professional | 5 | 7.6% |
| Total | 66 | 100.0% |
School Enrollment by Age by Funding Source in Rossiter
Out of a total of 66 students who are enrolled in schools in Rossiter, 6 (9.1%) attend a private institution, while the remaining 60 (90.9%) are enrolled in public schools. The age group of 15 to 17 year olds has the highest likelihood of being enrolled in private schools, with 6 (26.1% in the age bracket) enrolled. Conversely, the age group of 3 to 4 year olds has the lowest likelihood of being enrolled in a private school, with 8 (100.0% in the age bracket) attending a public institution.
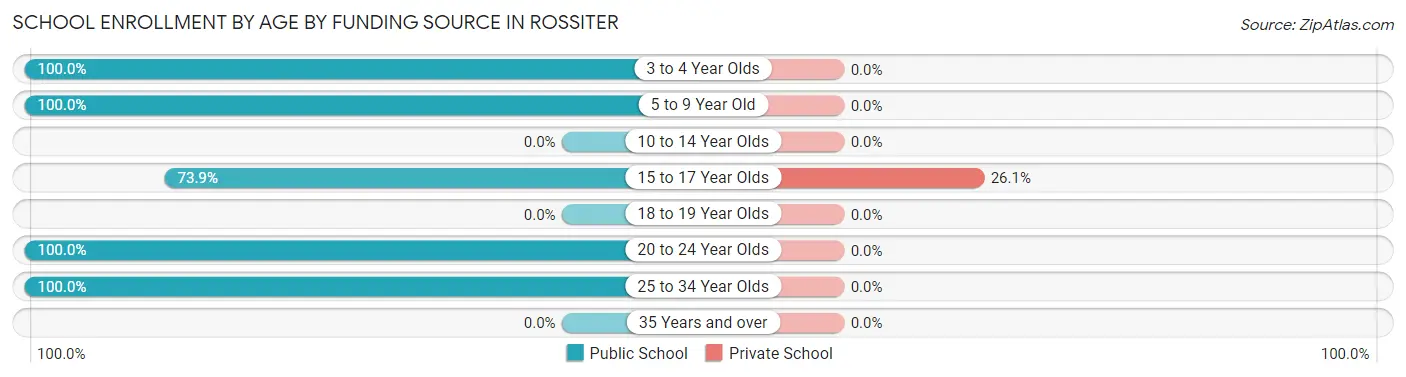
| Age Bracket | Public School | Private School |
| 3 to 4 Year Olds | 8 (100.0%) | 0 (0.0%) |
| 5 to 9 Year Old | 26 (100.0%) | 0 (0.0%) |
| 10 to 14 Year Olds | 0 (0.0%) | 0 (0.0%) |
| 15 to 17 Year Olds | 17 (73.9%) | 6 (26.1%) |
| 18 to 19 Year Olds | 0 (0.0%) | 0 (0.0%) |
| 20 to 24 Year Olds | 4 (100.0%) | 0 (0.0%) |
| 25 to 34 Year Olds | 5 (100.0%) | 0 (0.0%) |
| 35 Years and over | 0 (0.0%) | 0 (0.0%) |
| Total | 60 (90.9%) | 6 (9.1%) |
Educational Attainment by Field of Study in Rossiter
Education (8 | 34.8%), science & technology (7 | 30.4%), social sciences (5 | 21.7%), and visual & performing arts (3 | 13.0%) are the most common fields of study among 23 individuals in Rossiter who have obtained a bachelor's degree or higher.
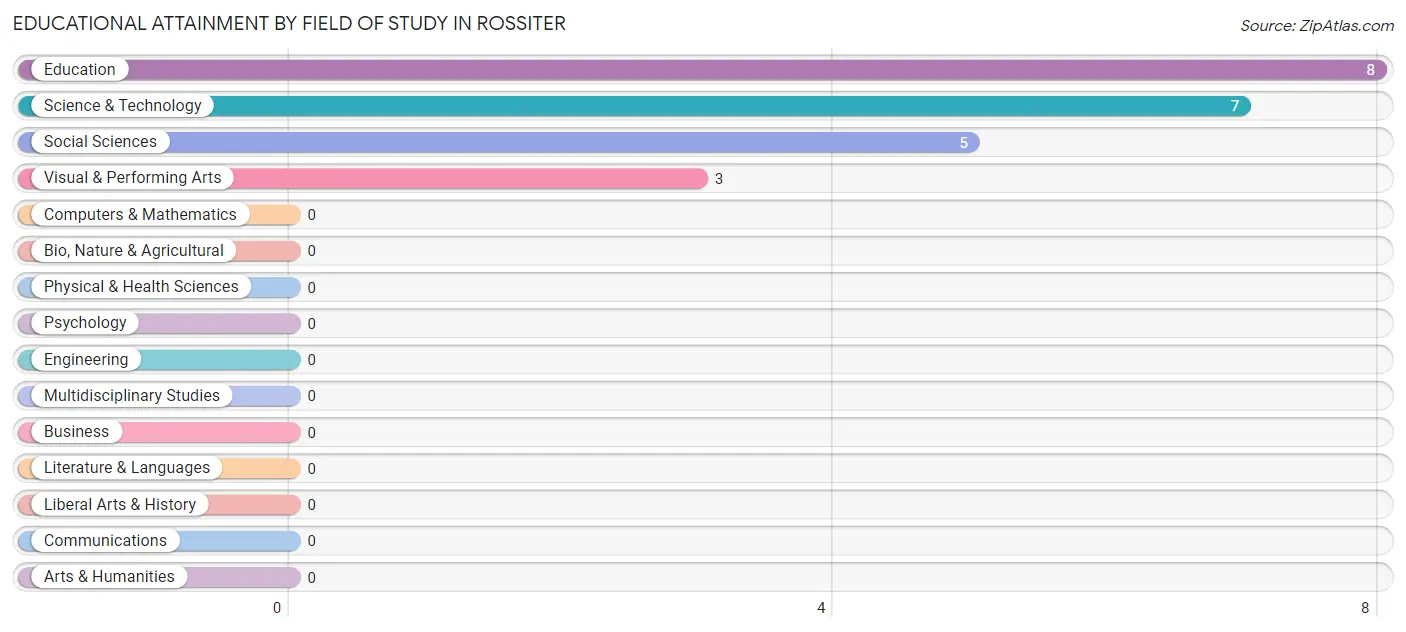
| Field of Study | # Graduates | % Graduates |
| Computers & Mathematics | 0 | 0.0% |
| Bio, Nature & Agricultural | 0 | 0.0% |
| Physical & Health Sciences | 0 | 0.0% |
| Psychology | 0 | 0.0% |
| Social Sciences | 5 | 21.7% |
| Engineering | 0 | 0.0% |
| Multidisciplinary Studies | 0 | 0.0% |
| Science & Technology | 7 | 30.4% |
| Business | 0 | 0.0% |
| Education | 8 | 34.8% |
| Literature & Languages | 0 | 0.0% |
| Liberal Arts & History | 0 | 0.0% |
| Visual & Performing Arts | 3 | 13.0% |
| Communications | 0 | 0.0% |
| Arts & Humanities | 0 | 0.0% |
| Total | 23 | 100.0% |
Transportation & Commute in Rossiter
Vehicle Availability by Sex in Rossiter
The most prevalent vehicle ownership categories in Rossiter are males with 2 vehicles (56, accounting for 43.1%) and females with 2 vehicles (178, making up 26.5%).
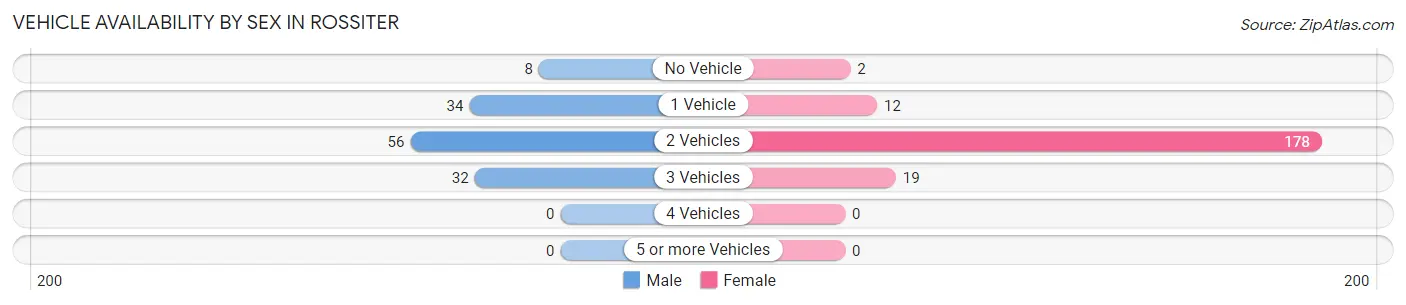
| Vehicles Available | Male | Female |
| No Vehicle | 8 (6.1%) | 2 (0.9%) |
| 1 Vehicle | 34 (26.2%) | 12 (5.7%) |
| 2 Vehicles | 56 (43.1%) | 178 (84.4%) |
| 3 Vehicles | 32 (24.6%) | 19 (9.0%) |
| 4 Vehicles | 0 (0.0%) | 0 (0.0%) |
| 5 or more Vehicles | 0 (0.0%) | 0 (0.0%) |
| Total | 130 (100.0%) | 211 (100.0%) |
Commute Time in Rossiter
The most frequently occuring commute durations in Rossiter are 10 to 14 minutes (146 commuters, 43.2%), 15 to 19 minutes (48 commuters, 14.2%), and 45 to 59 minutes (33 commuters, 9.8%).
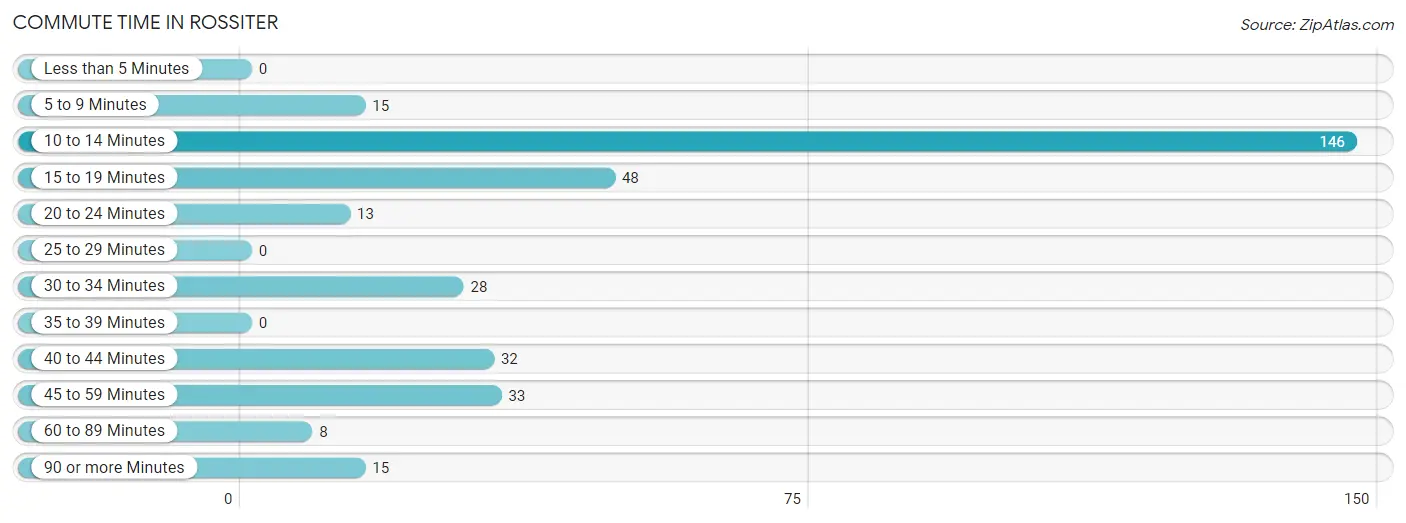
| Commute Time | # Commuters | % Commuters |
| Less than 5 Minutes | 0 | 0.0% |
| 5 to 9 Minutes | 15 | 4.4% |
| 10 to 14 Minutes | 146 | 43.2% |
| 15 to 19 Minutes | 48 | 14.2% |
| 20 to 24 Minutes | 13 | 3.8% |
| 25 to 29 Minutes | 0 | 0.0% |
| 30 to 34 Minutes | 28 | 8.3% |
| 35 to 39 Minutes | 0 | 0.0% |
| 40 to 44 Minutes | 32 | 9.5% |
| 45 to 59 Minutes | 33 | 9.8% |
| 60 to 89 Minutes | 8 | 2.4% |
| 90 or more Minutes | 15 | 4.4% |
Commute Time by Sex in Rossiter
The most common commute times in Rossiter are 40 to 44 minutes (32 commuters, 24.6%) for males and 10 to 14 minutes (140 commuters, 67.3%) for females.
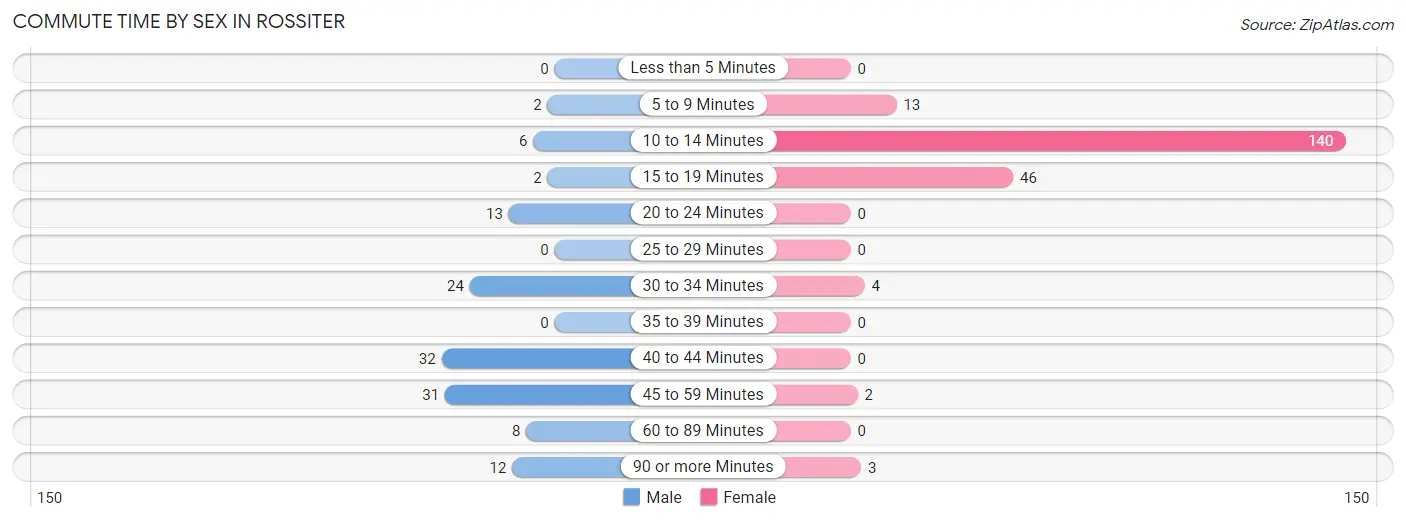
| Commute Time | Male | Female |
| Less than 5 Minutes | 0 (0.0%) | 0 (0.0%) |
| 5 to 9 Minutes | 2 (1.5%) | 13 (6.2%) |
| 10 to 14 Minutes | 6 (4.6%) | 140 (67.3%) |
| 15 to 19 Minutes | 2 (1.5%) | 46 (22.1%) |
| 20 to 24 Minutes | 13 (10.0%) | 0 (0.0%) |
| 25 to 29 Minutes | 0 (0.0%) | 0 (0.0%) |
| 30 to 34 Minutes | 24 (18.5%) | 4 (1.9%) |
| 35 to 39 Minutes | 0 (0.0%) | 0 (0.0%) |
| 40 to 44 Minutes | 32 (24.6%) | 0 (0.0%) |
| 45 to 59 Minutes | 31 (23.8%) | 2 (1.0%) |
| 60 to 89 Minutes | 8 (6.1%) | 0 (0.0%) |
| 90 or more Minutes | 12 (9.2%) | 3 (1.4%) |
Time of Departure to Work by Sex in Rossiter
The most frequent times of departure to work in Rossiter are 12:00 PM to 3:59 PM (48, 36.9%) for males and 5:30 AM to 5:59 AM (151, 72.6%) for females.
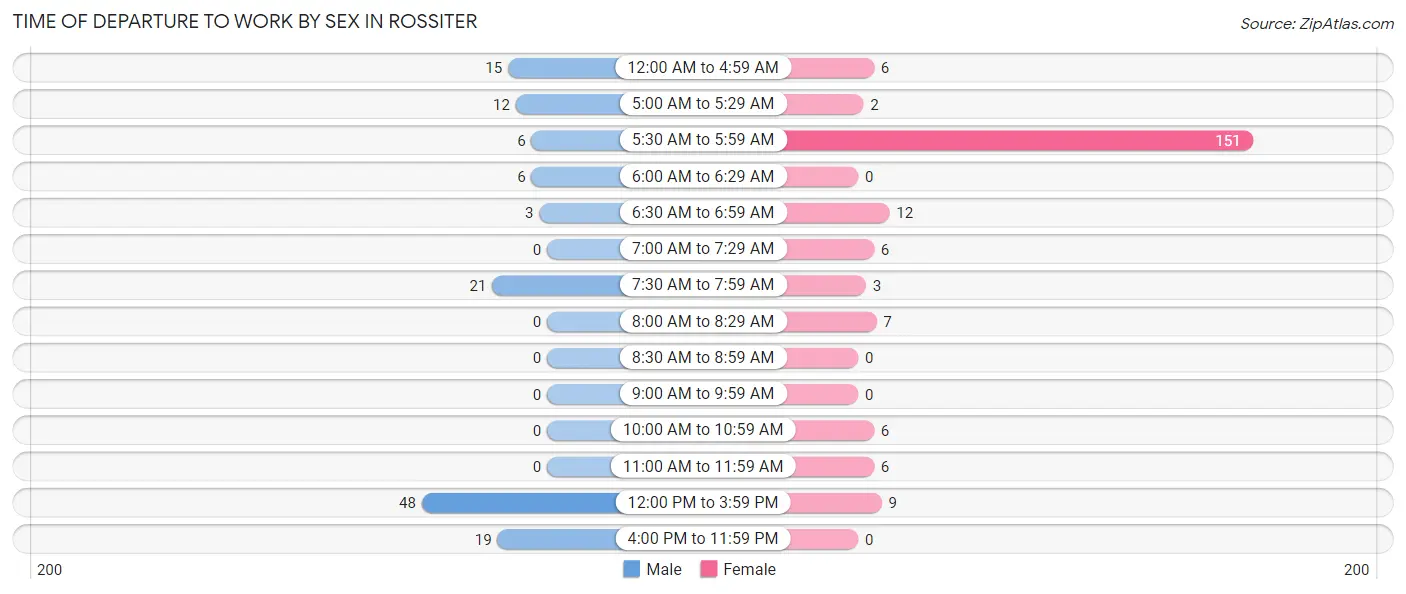
| Time of Departure | Male | Female |
| 12:00 AM to 4:59 AM | 15 (11.5%) | 6 (2.9%) |
| 5:00 AM to 5:29 AM | 12 (9.2%) | 2 (1.0%) |
| 5:30 AM to 5:59 AM | 6 (4.6%) | 151 (72.6%) |
| 6:00 AM to 6:29 AM | 6 (4.6%) | 0 (0.0%) |
| 6:30 AM to 6:59 AM | 3 (2.3%) | 12 (5.8%) |
| 7:00 AM to 7:29 AM | 0 (0.0%) | 6 (2.9%) |
| 7:30 AM to 7:59 AM | 21 (16.2%) | 3 (1.4%) |
| 8:00 AM to 8:29 AM | 0 (0.0%) | 7 (3.4%) |
| 8:30 AM to 8:59 AM | 0 (0.0%) | 0 (0.0%) |
| 9:00 AM to 9:59 AM | 0 (0.0%) | 0 (0.0%) |
| 10:00 AM to 10:59 AM | 0 (0.0%) | 6 (2.9%) |
| 11:00 AM to 11:59 AM | 0 (0.0%) | 6 (2.9%) |
| 12:00 PM to 3:59 PM | 48 (36.9%) | 9 (4.3%) |
| 4:00 PM to 11:59 PM | 19 (14.6%) | 0 (0.0%) |
| Total | 130 (100.0%) | 208 (100.0%) |
Housing Occupancy in Rossiter
Occupancy by Ownership in Rossiter
Of the total 191 dwellings in Rossiter, owner-occupied units account for 119 (62.3%), while renter-occupied units make up 72 (37.7%).
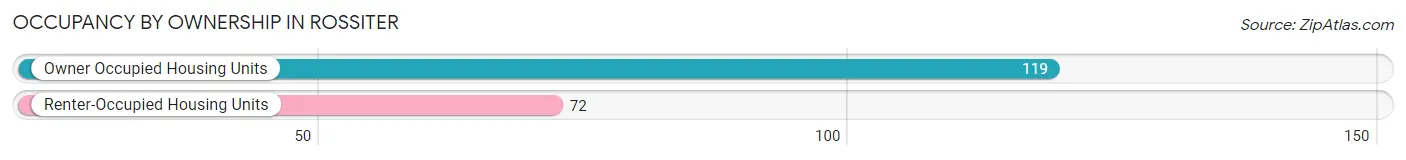
| Occupancy | # Housing Units | % Housing Units |
| Owner Occupied Housing Units | 119 | 62.3% |
| Renter-Occupied Housing Units | 72 | 37.7% |
| Total Occupied Housing Units | 191 | 100.0% |
Occupancy by Household Size in Rossiter
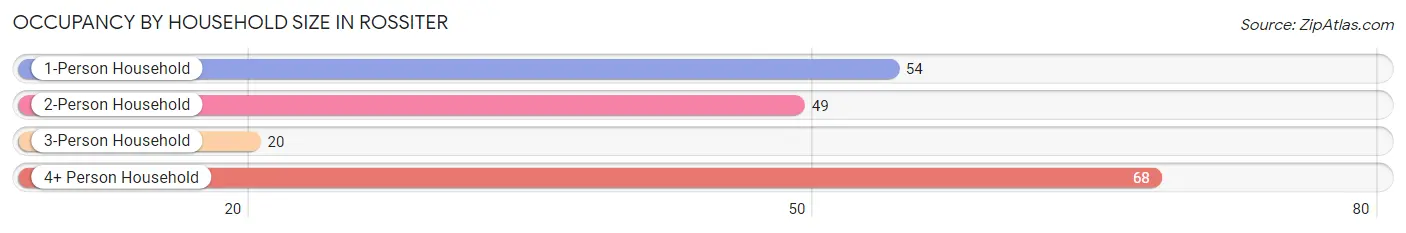
| Household Size | # Housing Units | % Housing Units |
| 1-Person Household | 54 | 28.3% |
| 2-Person Household | 49 | 25.7% |
| 3-Person Household | 20 | 10.5% |
| 4+ Person Household | 68 | 35.6% |
| Total Housing Units | 191 | 100.0% |
Occupancy by Ownership by Household Size in Rossiter
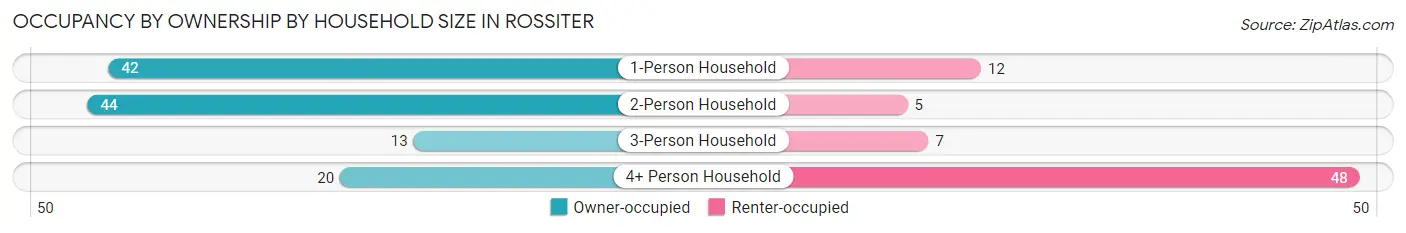
| Household Size | Owner-occupied | Renter-occupied |
| 1-Person Household | 42 (77.8%) | 12 (22.2%) |
| 2-Person Household | 44 (89.8%) | 5 (10.2%) |
| 3-Person Household | 13 (65.0%) | 7 (35.0%) |
| 4+ Person Household | 20 (29.4%) | 48 (70.6%) |
| Total Housing Units | 119 (62.3%) | 72 (37.7%) |
Occupancy by Educational Attainment in Rossiter
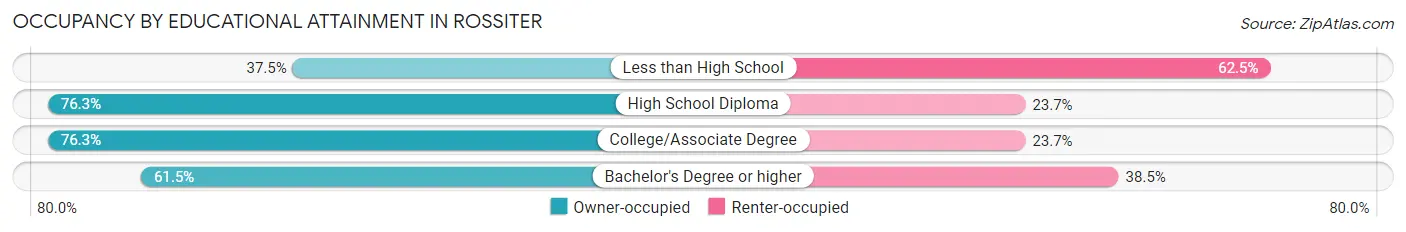
| Household Size | Owner-occupied | Renter-occupied |
| Less than High School | 24 (37.5%) | 40 (62.5%) |
| High School Diploma | 58 (76.3%) | 18 (23.7%) |
| College/Associate Degree | 29 (76.3%) | 9 (23.7%) |
| Bachelor's Degree or higher | 8 (61.5%) | 5 (38.5%) |
Occupancy by Age of Householder in Rossiter
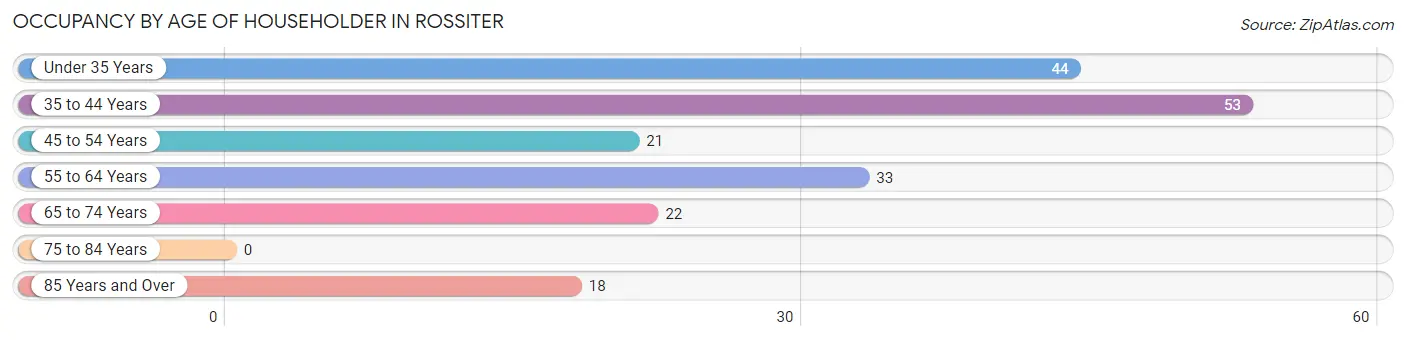
| Age Bracket | # Households | % Households |
| Under 35 Years | 44 | 23.0% |
| 35 to 44 Years | 53 | 27.8% |
| 45 to 54 Years | 21 | 11.0% |
| 55 to 64 Years | 33 | 17.3% |
| 65 to 74 Years | 22 | 11.5% |
| 75 to 84 Years | 0 | 0.0% |
| 85 Years and Over | 18 | 9.4% |
| Total | 191 | 100.0% |
Housing Finances in Rossiter
Median Income by Occupancy in Rossiter
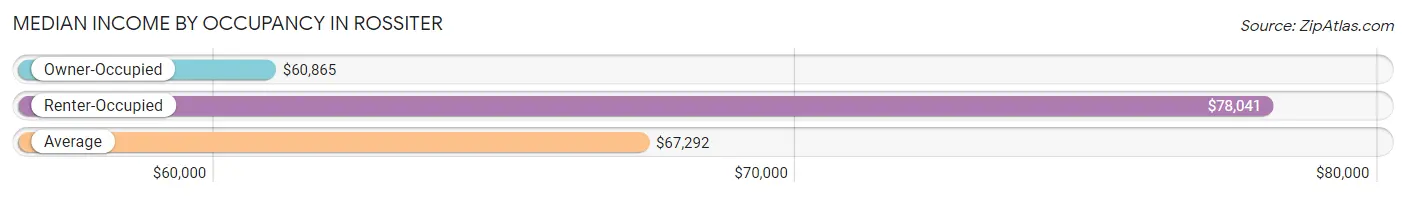
| Occupancy Type | # Households | Median Income |
| Owner-Occupied | 119 (62.3%) | $60,865 |
| Renter-Occupied | 72 (37.7%) | $78,041 |
| Average | 191 (100.0%) | $67,292 |
Occupancy by Householder Income Bracket in Rossiter
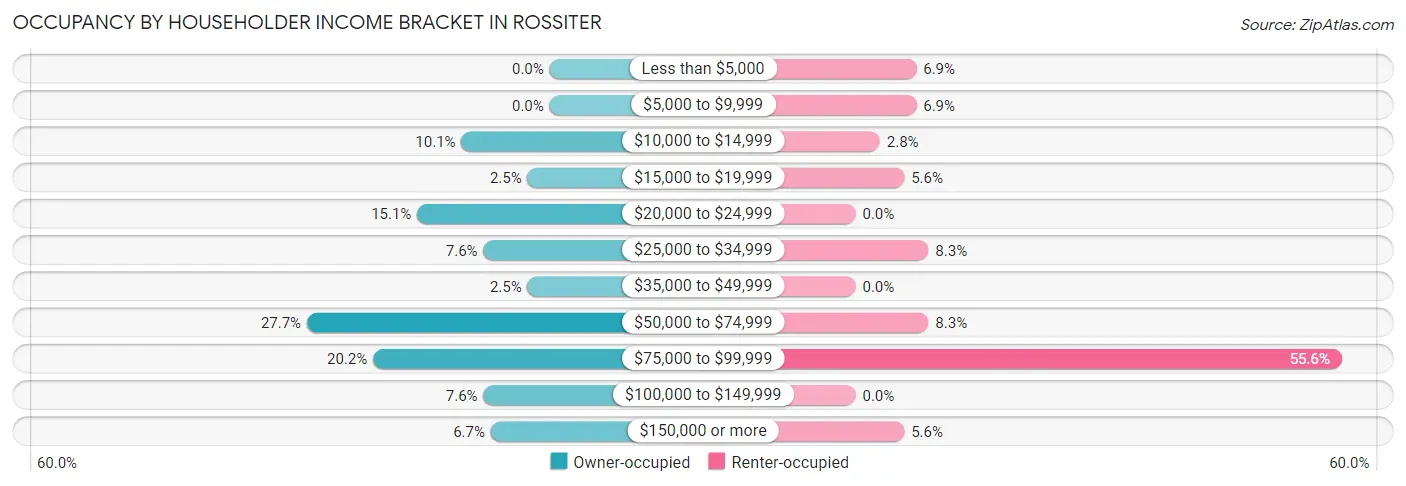
| Income Bracket | Owner-occupied | Renter-occupied |
| Less than $5,000 | 0 (0.0%) | 5 (6.9%) |
| $5,000 to $9,999 | 0 (0.0%) | 5 (6.9%) |
| $10,000 to $14,999 | 12 (10.1%) | 2 (2.8%) |
| $15,000 to $19,999 | 3 (2.5%) | 4 (5.6%) |
| $20,000 to $24,999 | 18 (15.1%) | 0 (0.0%) |
| $25,000 to $34,999 | 9 (7.6%) | 6 (8.3%) |
| $35,000 to $49,999 | 3 (2.5%) | 0 (0.0%) |
| $50,000 to $74,999 | 33 (27.7%) | 6 (8.3%) |
| $75,000 to $99,999 | 24 (20.2%) | 40 (55.6%) |
| $100,000 to $149,999 | 9 (7.6%) | 0 (0.0%) |
| $150,000 or more | 8 (6.7%) | 4 (5.6%) |
| Total | 119 (100.0%) | 72 (100.0%) |
Monthly Housing Cost Tiers in Rossiter
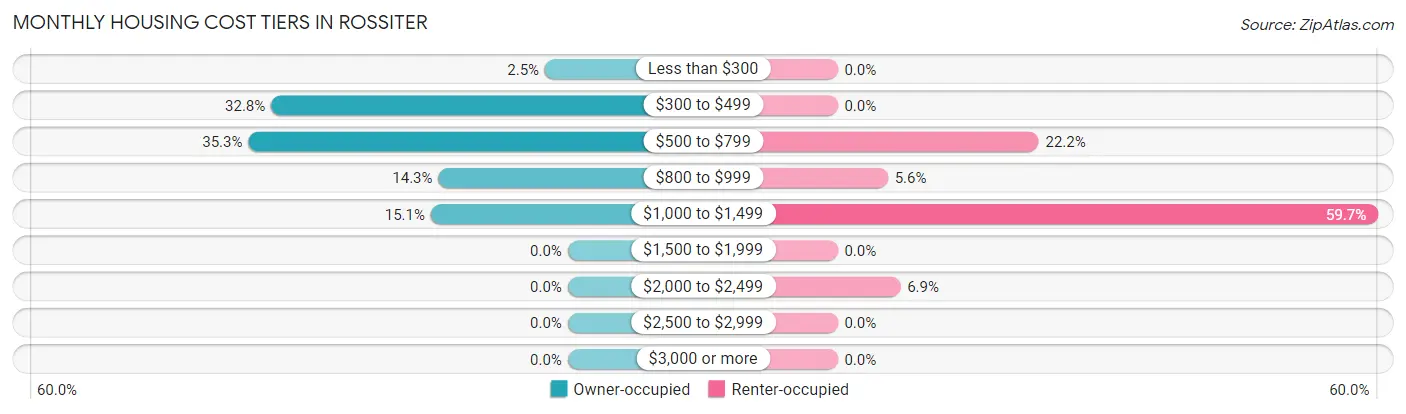
| Monthly Cost | Owner-occupied | Renter-occupied |
| Less than $300 | 3 (2.5%) | 0 (0.0%) |
| $300 to $499 | 39 (32.8%) | 0 (0.0%) |
| $500 to $799 | 42 (35.3%) | 16 (22.2%) |
| $800 to $999 | 17 (14.3%) | 4 (5.6%) |
| $1,000 to $1,499 | 18 (15.1%) | 43 (59.7%) |
| $1,500 to $1,999 | 0 (0.0%) | 0 (0.0%) |
| $2,000 to $2,499 | 0 (0.0%) | 5 (6.9%) |
| $2,500 to $2,999 | 0 (0.0%) | 0 (0.0%) |
| $3,000 or more | 0 (0.0%) | 0 (0.0%) |
| Total | 119 (100.0%) | 72 (100.0%) |
Physical Housing Characteristics in Rossiter
Housing Structures in Rossiter
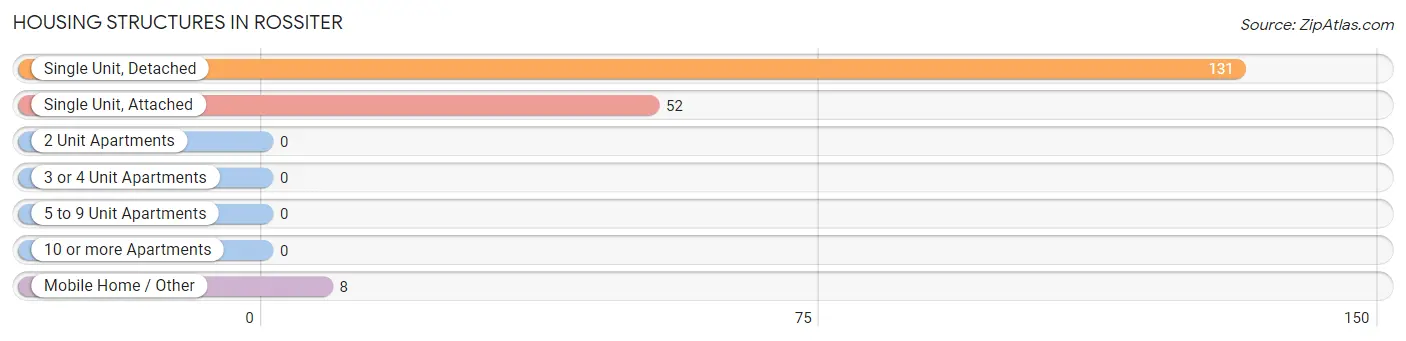
| Structure Type | # Housing Units | % Housing Units |
| Single Unit, Detached | 131 | 68.6% |
| Single Unit, Attached | 52 | 27.2% |
| 2 Unit Apartments | 0 | 0.0% |
| 3 or 4 Unit Apartments | 0 | 0.0% |
| 5 to 9 Unit Apartments | 0 | 0.0% |
| 10 or more Apartments | 0 | 0.0% |
| Mobile Home / Other | 8 | 4.2% |
| Total | 191 | 100.0% |
Housing Structures by Occupancy in Rossiter
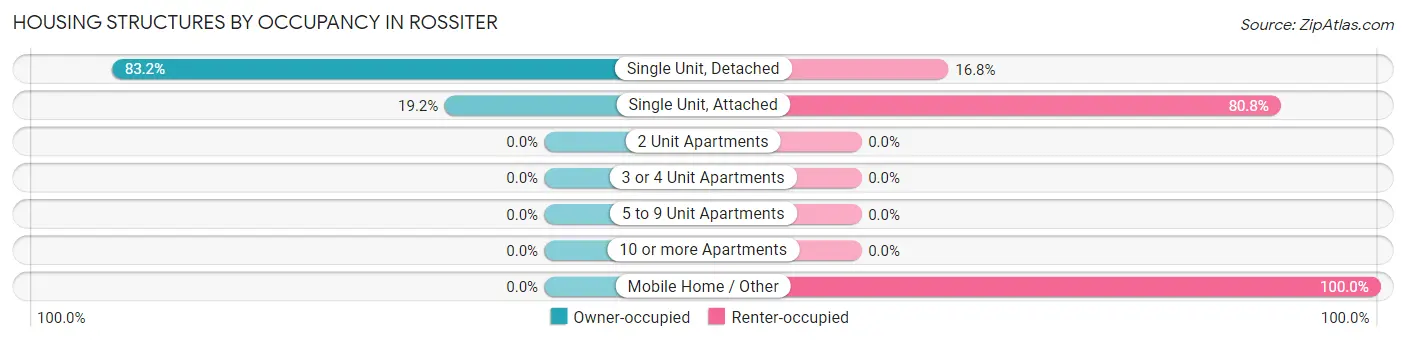
| Structure Type | Owner-occupied | Renter-occupied |
| Single Unit, Detached | 109 (83.2%) | 22 (16.8%) |
| Single Unit, Attached | 10 (19.2%) | 42 (80.8%) |
| 2 Unit Apartments | 0 (0.0%) | 0 (0.0%) |
| 3 or 4 Unit Apartments | 0 (0.0%) | 0 (0.0%) |
| 5 to 9 Unit Apartments | 0 (0.0%) | 0 (0.0%) |
| 10 or more Apartments | 0 (0.0%) | 0 (0.0%) |
| Mobile Home / Other | 0 (0.0%) | 8 (100.0%) |
| Total | 119 (62.3%) | 72 (37.7%) |
Housing Structures by Number of Rooms in Rossiter
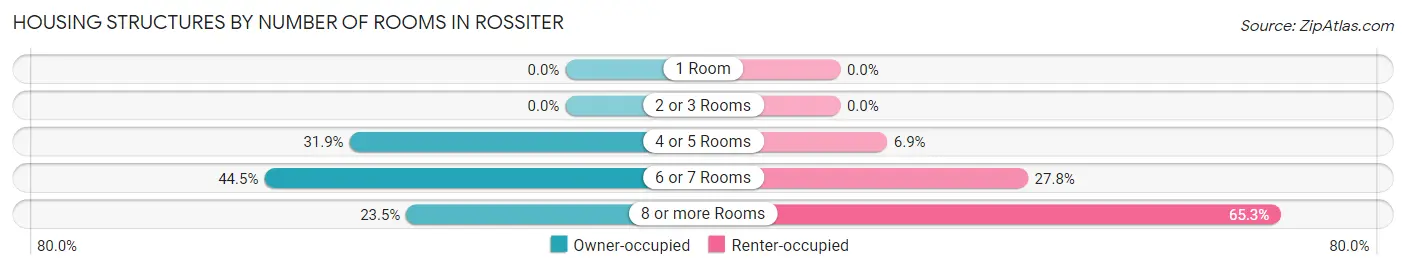
| Number of Rooms | Owner-occupied | Renter-occupied |
| 1 Room | 0 (0.0%) | 0 (0.0%) |
| 2 or 3 Rooms | 0 (0.0%) | 0 (0.0%) |
| 4 or 5 Rooms | 38 (31.9%) | 5 (6.9%) |
| 6 or 7 Rooms | 53 (44.5%) | 20 (27.8%) |
| 8 or more Rooms | 28 (23.5%) | 47 (65.3%) |
| Total | 119 (100.0%) | 72 (100.0%) |
Housing Structure by Heating Type in Rossiter
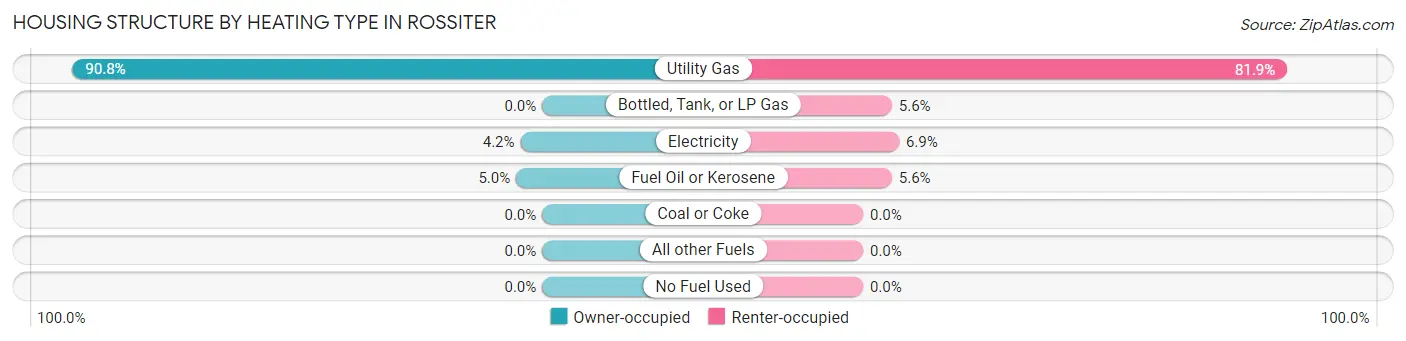
| Heating Type | Owner-occupied | Renter-occupied |
| Utility Gas | 108 (90.8%) | 59 (81.9%) |
| Bottled, Tank, or LP Gas | 0 (0.0%) | 4 (5.6%) |
| Electricity | 5 (4.2%) | 5 (6.9%) |
| Fuel Oil or Kerosene | 6 (5.0%) | 4 (5.6%) |
| Coal or Coke | 0 (0.0%) | 0 (0.0%) |
| All other Fuels | 0 (0.0%) | 0 (0.0%) |
| No Fuel Used | 0 (0.0%) | 0 (0.0%) |
| Total | 119 (100.0%) | 72 (100.0%) |
Household Vehicle Usage in Rossiter
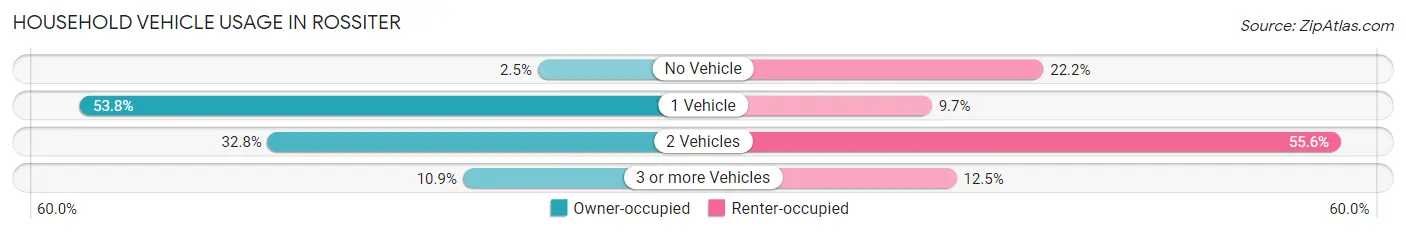
| Vehicles per Household | Owner-occupied | Renter-occupied |
| No Vehicle | 3 (2.5%) | 16 (22.2%) |
| 1 Vehicle | 64 (53.8%) | 7 (9.7%) |
| 2 Vehicles | 39 (32.8%) | 40 (55.6%) |
| 3 or more Vehicles | 13 (10.9%) | 9 (12.5%) |
| Total | 119 (100.0%) | 72 (100.0%) |
Real Estate & Mortgages in Rossiter
Real Estate and Mortgage Overview in Rossiter
| Characteristic | Without Mortgage | With Mortgage |
| Housing Units | 63 | 56 |
| Median Property Value | $70,600 | $96,300 |
| Median Household Income | $31,042 | $0 |
| Monthly Housing Costs | $390 | $0 |
| Real Estate Taxes | $505 | $0 |
Property Value by Mortgage Status in Rossiter
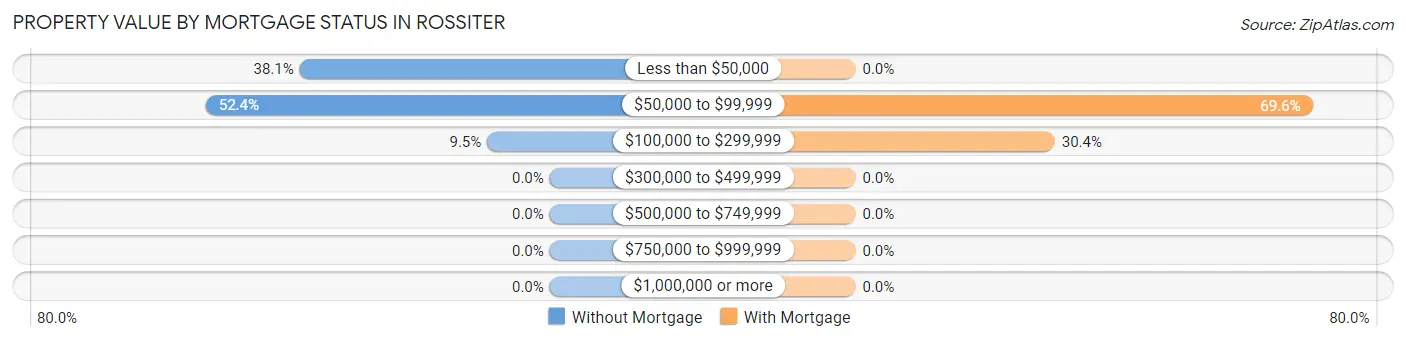
| Property Value | Without Mortgage | With Mortgage |
| Less than $50,000 | 24 (38.1%) | 0 (0.0%) |
| $50,000 to $99,999 | 33 (52.4%) | 39 (69.6%) |
| $100,000 to $299,999 | 6 (9.5%) | 17 (30.4%) |
| $300,000 to $499,999 | 0 (0.0%) | 0 (0.0%) |
| $500,000 to $749,999 | 0 (0.0%) | 0 (0.0%) |
| $750,000 to $999,999 | 0 (0.0%) | 0 (0.0%) |
| $1,000,000 or more | 0 (0.0%) | 0 (0.0%) |
| Total | 63 (100.0%) | 56 (100.0%) |
Household Income by Mortgage Status in Rossiter
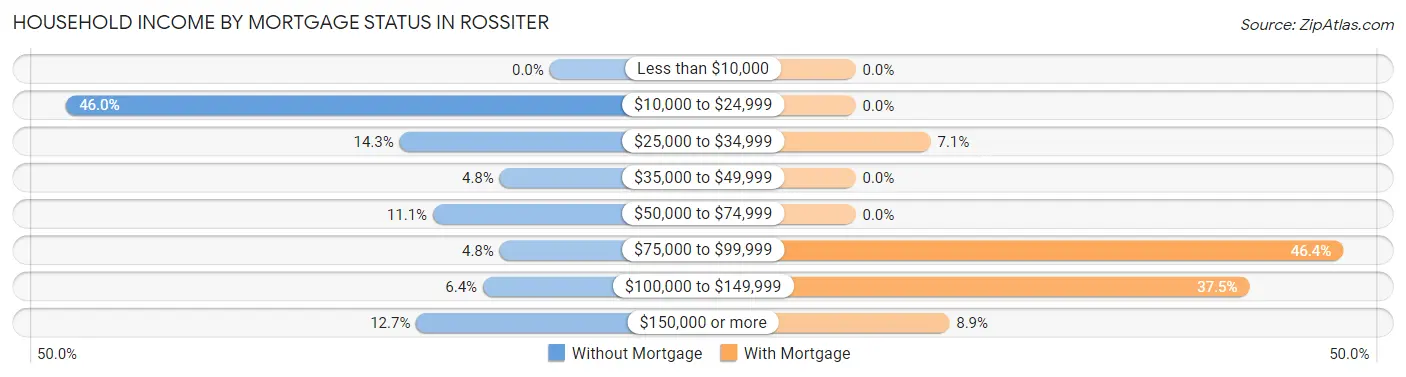
| Household Income | Without Mortgage | With Mortgage |
| Less than $10,000 | 0 (0.0%) | 0 (0.0%) |
| $10,000 to $24,999 | 29 (46.0%) | 0 (0.0%) |
| $25,000 to $34,999 | 9 (14.3%) | 4 (7.1%) |
| $35,000 to $49,999 | 3 (4.8%) | 0 (0.0%) |
| $50,000 to $74,999 | 7 (11.1%) | 0 (0.0%) |
| $75,000 to $99,999 | 3 (4.8%) | 26 (46.4%) |
| $100,000 to $149,999 | 4 (6.4%) | 21 (37.5%) |
| $150,000 or more | 8 (12.7%) | 5 (8.9%) |
| Total | 63 (100.0%) | 56 (100.0%) |
Property Value to Household Income Ratio in Rossiter
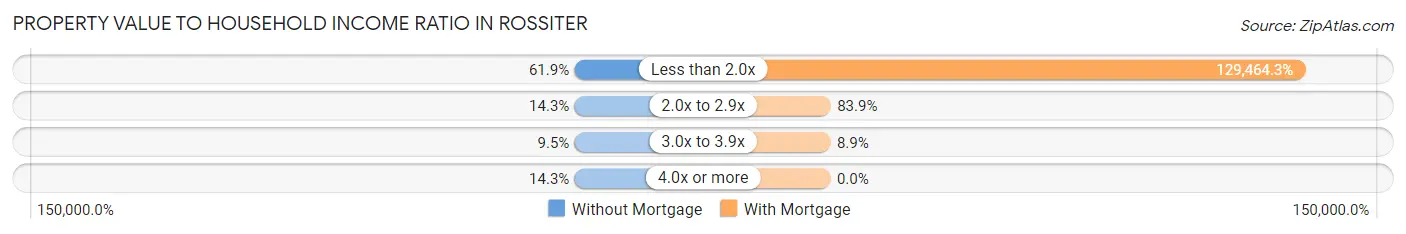
| Value-to-Income Ratio | Without Mortgage | With Mortgage |
| Less than 2.0x | 39 (61.9%) | 72,500 (129,464.3%) |
| 2.0x to 2.9x | 9 (14.3%) | 47 (83.9%) |
| 3.0x to 3.9x | 6 (9.5%) | 5 (8.9%) |
| 4.0x or more | 9 (14.3%) | 0 (0.0%) |
| Total | 63 (100.0%) | 56 (100.0%) |
Real Estate Taxes by Mortgage Status in Rossiter
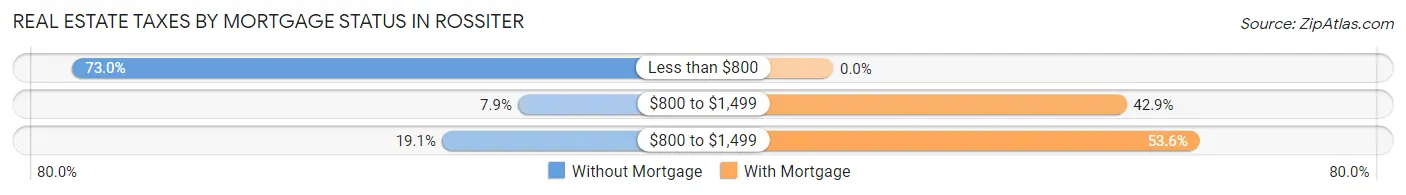
| Property Taxes | Without Mortgage | With Mortgage |
| Less than $800 | 46 (73.0%) | 0 (0.0%) |
| $800 to $1,499 | 5 (7.9%) | 24 (42.9%) |
| $800 to $1,499 | 12 (19.1%) | 30 (53.6%) |
| Total | 63 (100.0%) | 56 (100.0%) |
Health & Disability in Rossiter
Health Insurance Coverage by Age in Rossiter
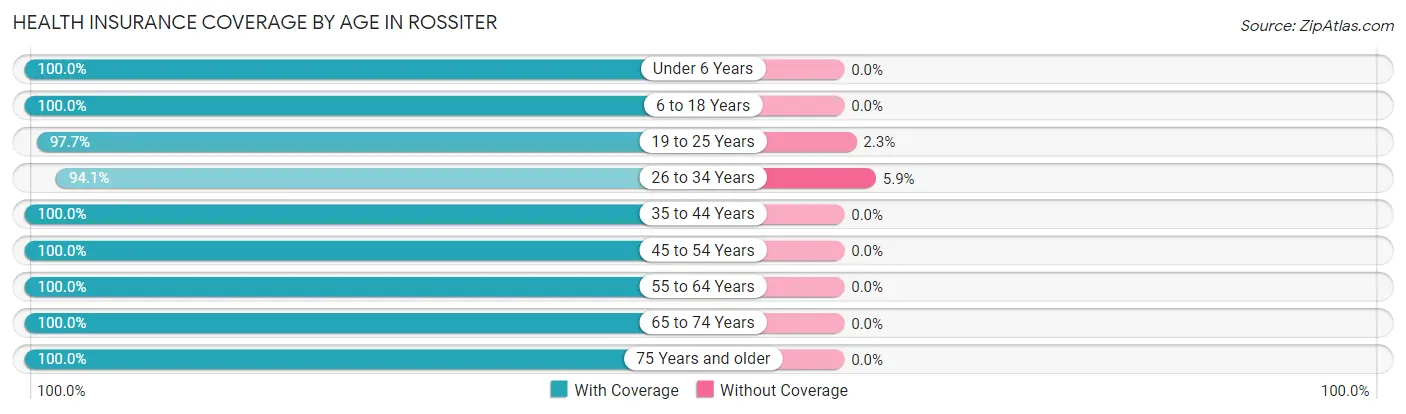
| Age Bracket | With Coverage | Without Coverage |
| Under 6 Years | 38 (100.0%) | 0 (0.0%) |
| 6 to 18 Years | 69 (100.0%) | 0 (0.0%) |
| 19 to 25 Years | 173 (97.7%) | 4 (2.3%) |
| 26 to 34 Years | 48 (94.1%) | 3 (5.9%) |
| 35 to 44 Years | 74 (100.0%) | 0 (0.0%) |
| 45 to 54 Years | 71 (100.0%) | 0 (0.0%) |
| 55 to 64 Years | 77 (100.0%) | 0 (0.0%) |
| 65 to 74 Years | 68 (100.0%) | 0 (0.0%) |
| 75 Years and older | 36 (100.0%) | 0 (0.0%) |
| Total | 654 (98.9%) | 7 (1.1%) |
Health Insurance Coverage by Citizenship Status in Rossiter
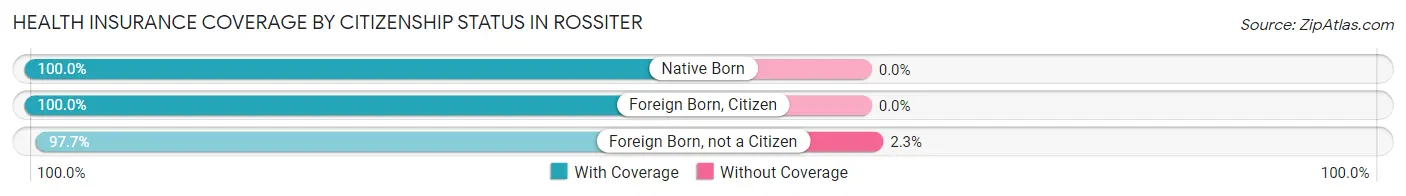
| Citizenship Status | With Coverage | Without Coverage |
| Native Born | 38 (100.0%) | 0 (0.0%) |
| Foreign Born, Citizen | 69 (100.0%) | 0 (0.0%) |
| Foreign Born, not a Citizen | 173 (97.7%) | 4 (2.3%) |
Health Insurance Coverage by Household Income in Rossiter
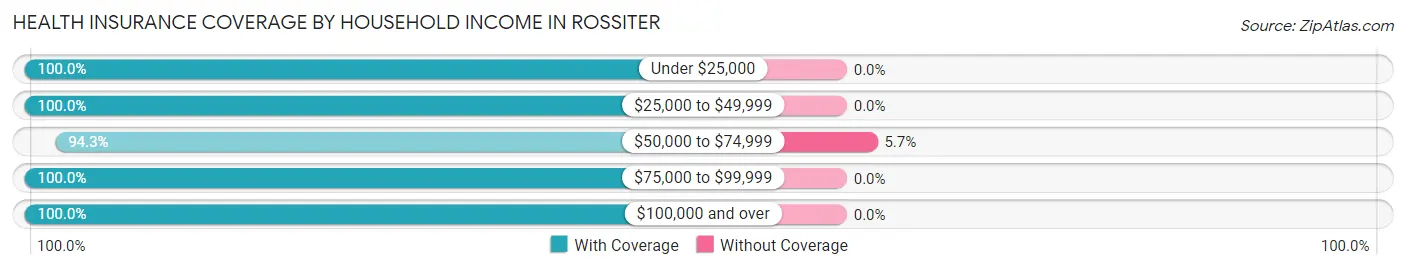
| Household Income | With Coverage | Without Coverage |
| Under $25,000 | 88 (100.0%) | 0 (0.0%) |
| $25,000 to $49,999 | 37 (100.0%) | 0 (0.0%) |
| $50,000 to $74,999 | 115 (94.3%) | 7 (5.7%) |
| $75,000 to $99,999 | 306 (100.0%) | 0 (0.0%) |
| $100,000 and over | 56 (100.0%) | 0 (0.0%) |
Public vs Private Health Insurance Coverage by Age in Rossiter
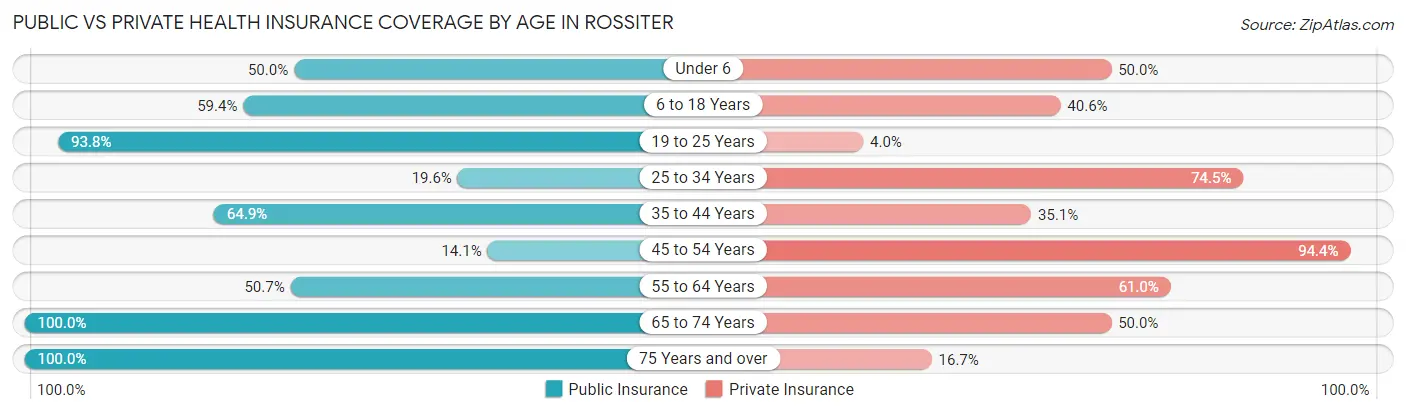
| Age Bracket | Public Insurance | Private Insurance |
| Under 6 | 19 (50.0%) | 19 (50.0%) |
| 6 to 18 Years | 41 (59.4%) | 28 (40.6%) |
| 19 to 25 Years | 166 (93.8%) | 7 (4.0%) |
| 25 to 34 Years | 10 (19.6%) | 38 (74.5%) |
| 35 to 44 Years | 48 (64.9%) | 26 (35.1%) |
| 45 to 54 Years | 10 (14.1%) | 67 (94.4%) |
| 55 to 64 Years | 39 (50.6%) | 47 (61.0%) |
| 65 to 74 Years | 68 (100.0%) | 34 (50.0%) |
| 75 Years and over | 36 (100.0%) | 6 (16.7%) |
| Total | 437 (66.1%) | 272 (41.1%) |
Disability Status by Sex by Age in Rossiter
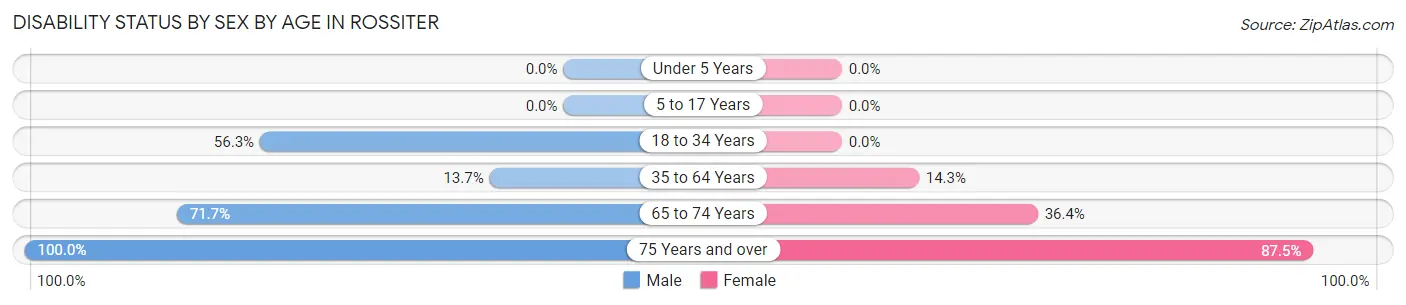
| Age Bracket | Male | Female |
| Under 5 Years | 0 (0.0%) | 0 (0.0%) |
| 5 to 17 Years | 0 (0.0%) | 0 (0.0%) |
| 18 to 34 Years | 49 (56.3%) | 0 (0.0%) |
| 35 to 64 Years | 17 (13.7%) | 14 (14.3%) |
| 65 to 74 Years | 33 (71.7%) | 8 (36.4%) |
| 75 Years and over | 12 (100.0%) | 21 (87.5%) |
Disability Class by Sex by Age in Rossiter
Disability Class: Hearing Difficulty
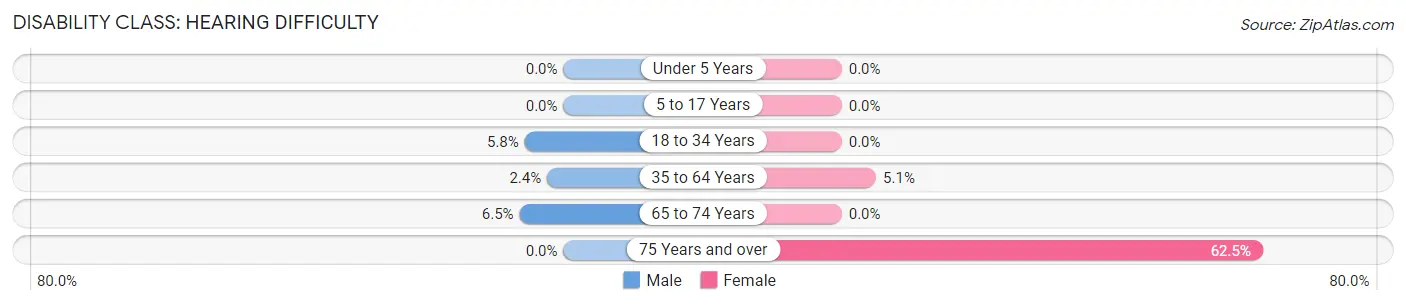
| Age Bracket | Male | Female |
| Under 5 Years | 0 (0.0%) | 0 (0.0%) |
| 5 to 17 Years | 0 (0.0%) | 0 (0.0%) |
| 18 to 34 Years | 5 (5.8%) | 0 (0.0%) |
| 35 to 64 Years | 3 (2.4%) | 5 (5.1%) |
| 65 to 74 Years | 3 (6.5%) | 0 (0.0%) |
| 75 Years and over | 0 (0.0%) | 15 (62.5%) |
Disability Class: Vision Difficulty
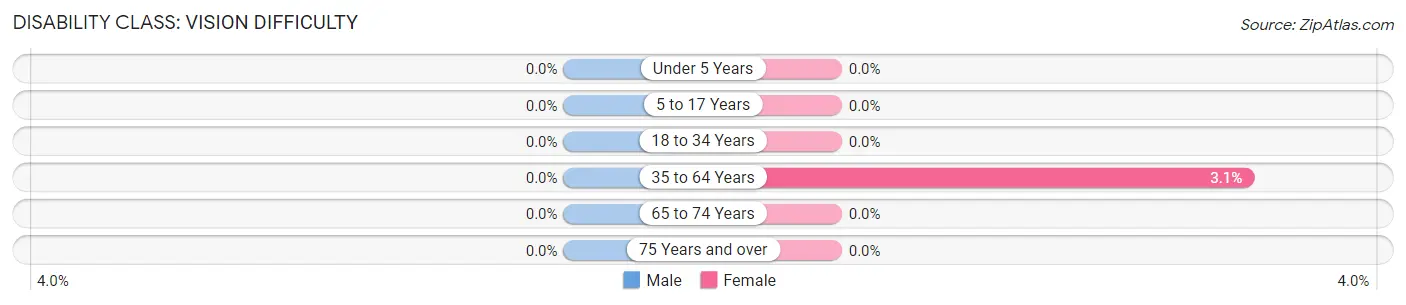
| Age Bracket | Male | Female |
| Under 5 Years | 0 (0.0%) | 0 (0.0%) |
| 5 to 17 Years | 0 (0.0%) | 0 (0.0%) |
| 18 to 34 Years | 0 (0.0%) | 0 (0.0%) |
| 35 to 64 Years | 0 (0.0%) | 3 (3.1%) |
| 65 to 74 Years | 0 (0.0%) | 0 (0.0%) |
| 75 Years and over | 0 (0.0%) | 0 (0.0%) |
Disability Class: Cognitive Difficulty
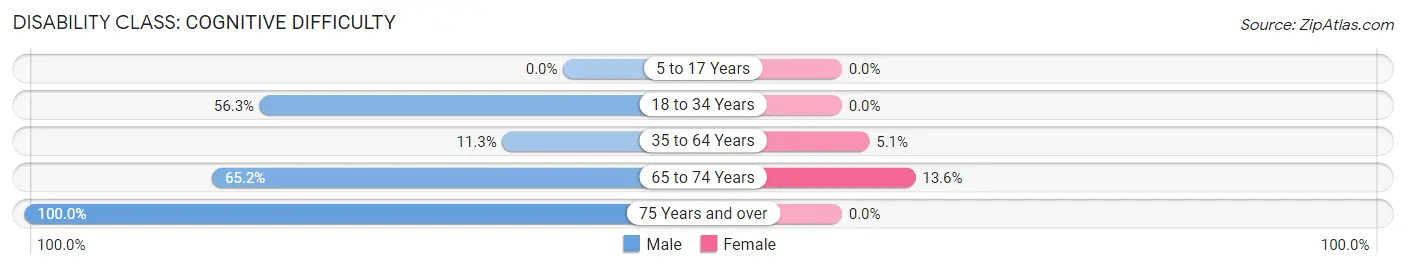
| Age Bracket | Male | Female |
| 5 to 17 Years | 0 (0.0%) | 0 (0.0%) |
| 18 to 34 Years | 49 (56.3%) | 0 (0.0%) |
| 35 to 64 Years | 14 (11.3%) | 5 (5.1%) |
| 65 to 74 Years | 30 (65.2%) | 3 (13.6%) |
| 75 Years and over | 12 (100.0%) | 0 (0.0%) |
Disability Class: Ambulatory Difficulty
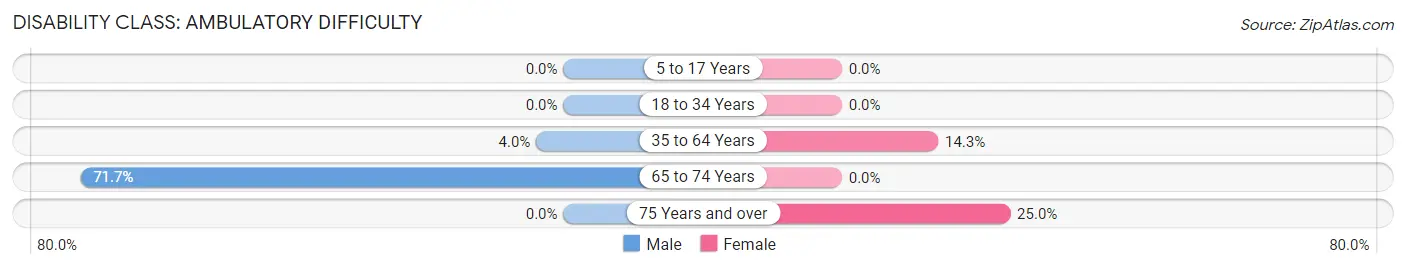
| Age Bracket | Male | Female |
| 5 to 17 Years | 0 (0.0%) | 0 (0.0%) |
| 18 to 34 Years | 0 (0.0%) | 0 (0.0%) |
| 35 to 64 Years | 5 (4.0%) | 14 (14.3%) |
| 65 to 74 Years | 33 (71.7%) | 0 (0.0%) |
| 75 Years and over | 0 (0.0%) | 6 (25.0%) |
Disability Class: Self-Care Difficulty
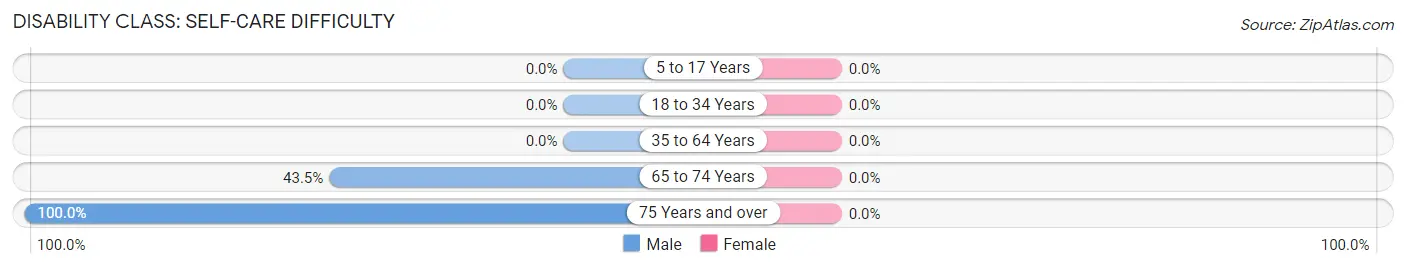
| Age Bracket | Male | Female |
| 5 to 17 Years | 0 (0.0%) | 0 (0.0%) |
| 18 to 34 Years | 0 (0.0%) | 0 (0.0%) |
| 35 to 64 Years | 0 (0.0%) | 0 (0.0%) |
| 65 to 74 Years | 20 (43.5%) | 0 (0.0%) |
| 75 Years and over | 12 (100.0%) | 0 (0.0%) |
Technology Access in Rossiter
Computing Device Access in Rossiter
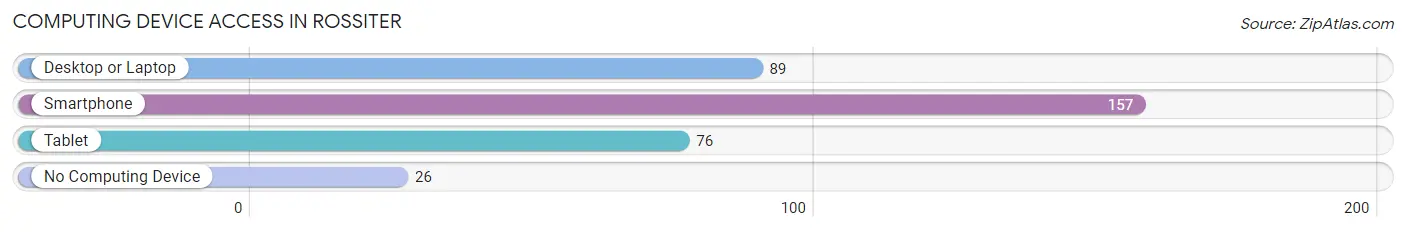
| Device Type | # Households | % Households |
| Desktop or Laptop | 89 | 46.6% |
| Smartphone | 157 | 82.2% |
| Tablet | 76 | 39.8% |
| No Computing Device | 26 | 13.6% |
| Total | 191 | 100.0% |
Internet Access in Rossiter
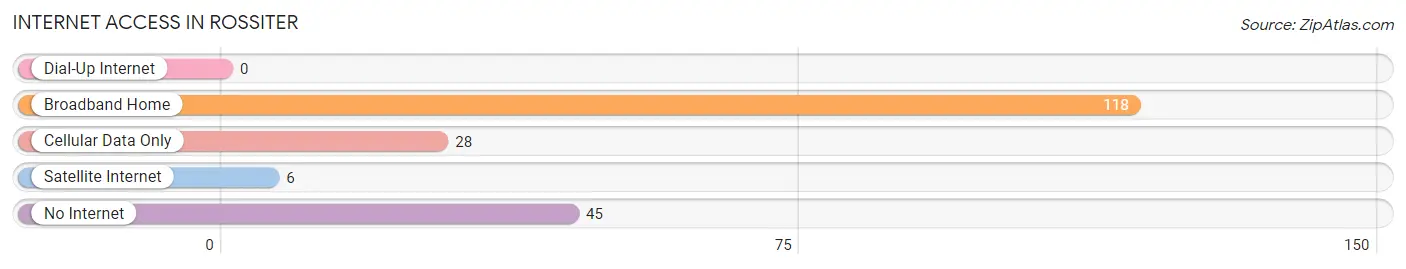
| Internet Type | # Households | % Households |
| Dial-Up Internet | 0 | 0.0% |
| Broadband Home | 118 | 61.8% |
| Cellular Data Only | 28 | 14.7% |
| Satellite Internet | 6 | 3.1% |
| No Internet | 45 | 23.6% |
| Total | 191 | 100.0% |
Rossiter Summary
History
The small town of Rossiter, Pennsylvania is located in Jefferson County, in the western part of the state. It was founded in 1845 by William Rossiter, a local farmer and businessman. The town was originally known as Rossiter’s Station, and was a stop on the Pittsburgh and Lake Erie Railroad. The town was officially incorporated in 1876.
In the late 19th century, Rossiter was a thriving industrial center, with several coal mines, a brickyard, and a sawmill. The town also had a number of stores and businesses, including a hotel, a bank, and a post office. The town’s population peaked in the early 20th century, with over 1,000 residents.
The Great Depression hit Rossiter hard, and the town’s population began to decline. The coal mines and other industries closed, and many of the town’s businesses shut down. The population continued to decline throughout the 20th century, and by the year 2000, the population had dropped to just over 500.
Geography
Rossiter is located in western Pennsylvania, in Jefferson County. It is situated in the foothills of the Allegheny Mountains, and is surrounded by rolling hills and forests. The town is located along the Redbank Creek, and is about 25 miles from the city of Pittsburgh.
The town covers an area of about 1.5 square miles, and has a population density of about 330 people per square mile. The town is located at an elevation of about 1,000 feet above sea level.
Economy
The economy of Rossiter is largely based on agriculture and tourism. The town is home to several farms, which produce a variety of crops, including corn, soybeans, and hay. The town also has several small businesses, including a few restaurants, a grocery store, and a hardware store.
The town is also a popular tourist destination, with several attractions, including a historic train station, a museum, and a number of outdoor activities, such as hiking, fishing, and camping.
Demographics
As of the year 2000, the population of Rossiter was 517. The town is predominantly white, with about 95% of the population being Caucasian. The median age of the population is about 44 years old. The median household income is about $35,000, and the median home value is about $90,000. The town has a poverty rate of about 15%.
Common Questions
What is Per Capita Income in Rossiter?
Per Capita income in Rossiter is $21,763.
What is the Median Family Income in Rossiter?
Median Family Income in Rossiter is $77,171.
What is the Median Household income in Rossiter?
Median Household Income in Rossiter is $67,292.
What is Family Income Deficit in Rossiter?
Family Income Deficit in Rossiter is $17,508.
Families that are below poverty line in Rossiter earn $17,508 less on average than the poverty threshold level.
What is Inequality or Gini Index in Rossiter?
Inequality or Gini Index in Rossiter is 0.36.
What is the Total Population of Rossiter?
Total Population of Rossiter is 661.
What is the Total Male Population of Rossiter?
Total Male Population of Rossiter is 350.
What is the Total Female Population of Rossiter?
Total Female Population of Rossiter is 311.
What is the Ratio of Males per 100 Females in Rossiter?
There are 112.54 Males per 100 Females in Rossiter.
What is the Ratio of Females per 100 Males in Rossiter?
There are 88.86 Females per 100 Males in Rossiter.
What is the Median Population Age in Rossiter?
Median Population Age in Rossiter is 34.8 Years.
What is the Average Family Size in Rossiter
Average Family Size in Rossiter is 3.9 People.
What is the Average Household Size in Rossiter
Average Household Size in Rossiter is 3.2 People.
How Large is the Labor Force in Rossiter?
There are 373 People in the Labor Forcein in Rossiter.
What is the Percentage of People in the Labor Force in Rossiter?
65.0% of People are in the Labor Force in Rossiter.
What is the Unemployment Rate in Rossiter?
Unemployment Rate in Rossiter is 8.6%.