Orangeville borough, PA Map & Demographics
Orangeville borough Overview
$22,860
PER CAPITA INCOME
$68,125
AVG FAMILY INCOME
$58,971
AVG HOUSEHOLD INCOME
59.6%
WAGE / INCOME GAP [ % ]
40.4¢/ $1
WAGE / INCOME GAP [ $ ]
0.31
INEQUALITY / GINI INDEX
404
TOTAL POPULATION
197
MALE POPULATION
207
FEMALE POPULATION
95.17
MALES / 100 FEMALES
105.08
FEMALES / 100 MALES
59.8
MEDIAN AGE
3.5
AVG FAMILY SIZE
2.7
AVG HOUSEHOLD SIZE
169
LABOR FORCE [ PEOPLE ]
46.9%
PERCENT IN LABOR FORCE
5.3%
UNEMPLOYMENT RATE
Income in Orangeville borough
Income Overview in Orangeville borough
Per Capita Income in Orangeville borough is $22,860, while median incomes of families and households are $68,125 and $58,971 respectively.
| Characteristic | Number | Measure |
| Per Capita Income | 404 | $22,860 |
| Median Family Income | 61 | $68,125 |
| Mean Family Income | 61 | $77,903 |
| Median Household Income | 102 | $58,971 |
| Mean Household Income | 102 | $65,948 |
| Income Deficit | 61 | $0 |
| Wage / Income Gap (%) | 404 | 59.62% |
| Wage / Income Gap ($) | 404 | 40.38¢ per $1 |
| Gini / Inequality Index | 404 | 0.31 |
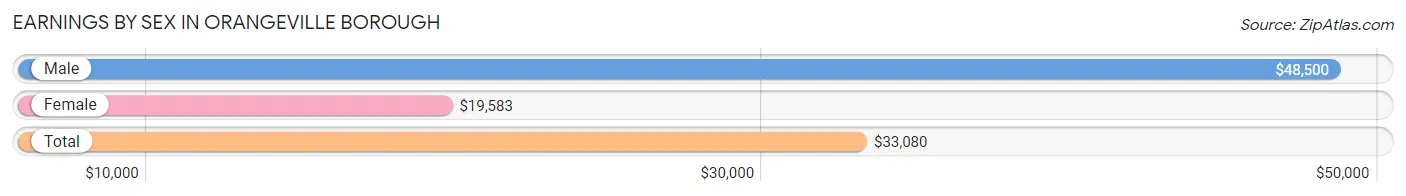
Earnings by Sex in Orangeville borough
Average Earnings in Orangeville borough are $33,080, $48,500 for men and $19,583 for women, a difference of 59.6%.
| Sex | Number | Average Earnings |
| Male | 84 (49.7%) | $48,500 |
| Female | 85 (50.3%) | $19,583 |
| Total | 169 (100.0%) | $33,080 |
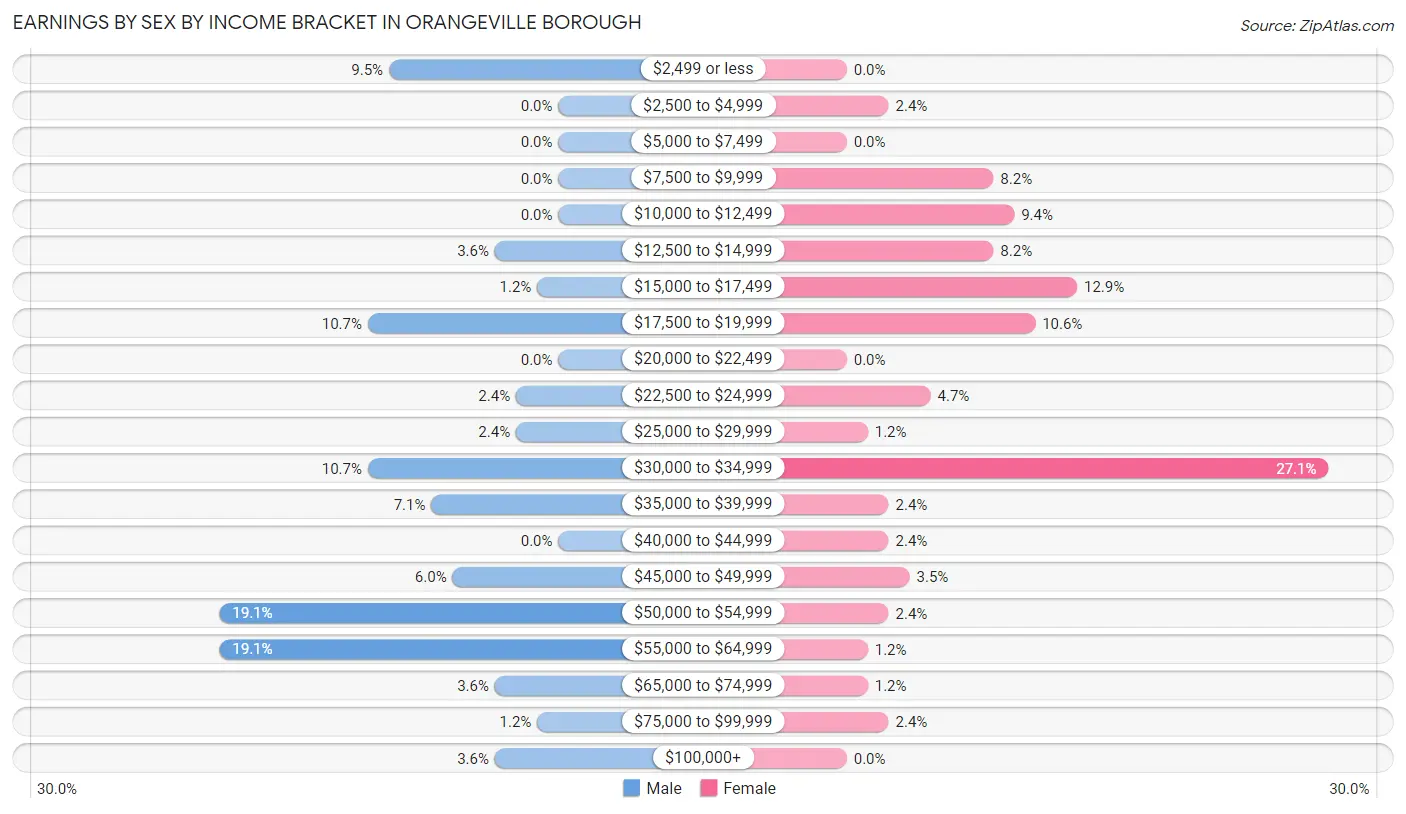
Earnings by Sex by Income Bracket in Orangeville borough
The most common earnings brackets in Orangeville borough are $50,000 to $54,999 for men (16 | 19.1%) and $30,000 to $34,999 for women (23 | 27.1%).
| Income | Male | Female |
| $2,499 or less | 8 (9.5%) | 0 (0.0%) |
| $2,500 to $4,999 | 0 (0.0%) | 2 (2.4%) |
| $5,000 to $7,499 | 0 (0.0%) | 0 (0.0%) |
| $7,500 to $9,999 | 0 (0.0%) | 7 (8.2%) |
| $10,000 to $12,499 | 0 (0.0%) | 8 (9.4%) |
| $12,500 to $14,999 | 3 (3.6%) | 7 (8.2%) |
| $15,000 to $17,499 | 1 (1.2%) | 11 (12.9%) |
| $17,500 to $19,999 | 9 (10.7%) | 9 (10.6%) |
| $20,000 to $22,499 | 0 (0.0%) | 0 (0.0%) |
| $22,500 to $24,999 | 2 (2.4%) | 4 (4.7%) |
| $25,000 to $29,999 | 2 (2.4%) | 1 (1.2%) |
| $30,000 to $34,999 | 9 (10.7%) | 23 (27.1%) |
| $35,000 to $39,999 | 6 (7.1%) | 2 (2.4%) |
| $40,000 to $44,999 | 0 (0.0%) | 2 (2.4%) |
| $45,000 to $49,999 | 5 (5.9%) | 3 (3.5%) |
| $50,000 to $54,999 | 16 (19.1%) | 2 (2.4%) |
| $55,000 to $64,999 | 16 (19.1%) | 1 (1.2%) |
| $65,000 to $74,999 | 3 (3.6%) | 1 (1.2%) |
| $75,000 to $99,999 | 1 (1.2%) | 2 (2.4%) |
| $100,000+ | 3 (3.6%) | 0 (0.0%) |
| Total | 84 (100.0%) | 85 (100.0%) |
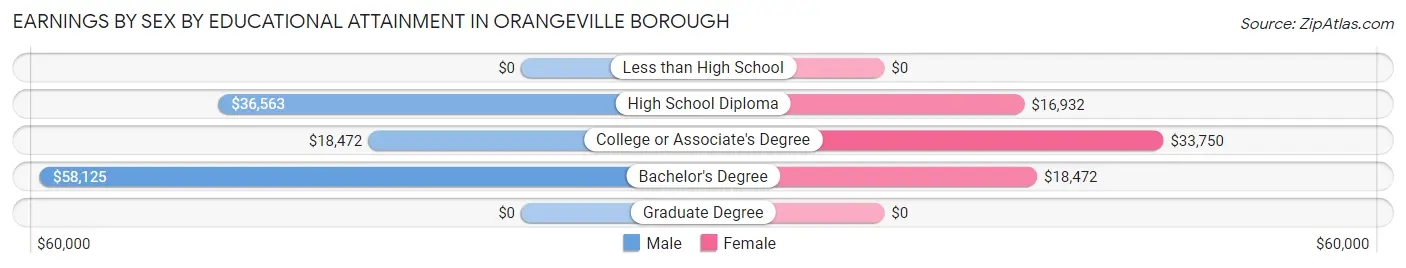
Earnings by Sex by Educational Attainment in Orangeville borough
Average earnings in Orangeville borough are $49,000 for men and $19,028 for women, a difference of 61.2%. Men with an educational attainment of bachelor's degree enjoy the highest average annual earnings of $58,125, while those with college or associate's degree education earn the least with $18,472. Women with an educational attainment of college or associate's degree earn the most with the average annual earnings of $33,750, while those with high school diploma education have the smallest earnings of $16,932.
| Educational Attainment | Male Income | Female Income |
| Less than High School | - | - |
| High School Diploma | $36,563 | $16,932 |
| College or Associate's Degree | $18,472 | $33,750 |
| Bachelor's Degree | $58,125 | $18,472 |
| Graduate Degree | - | - |
| Total | $49,000 | $19,028 |
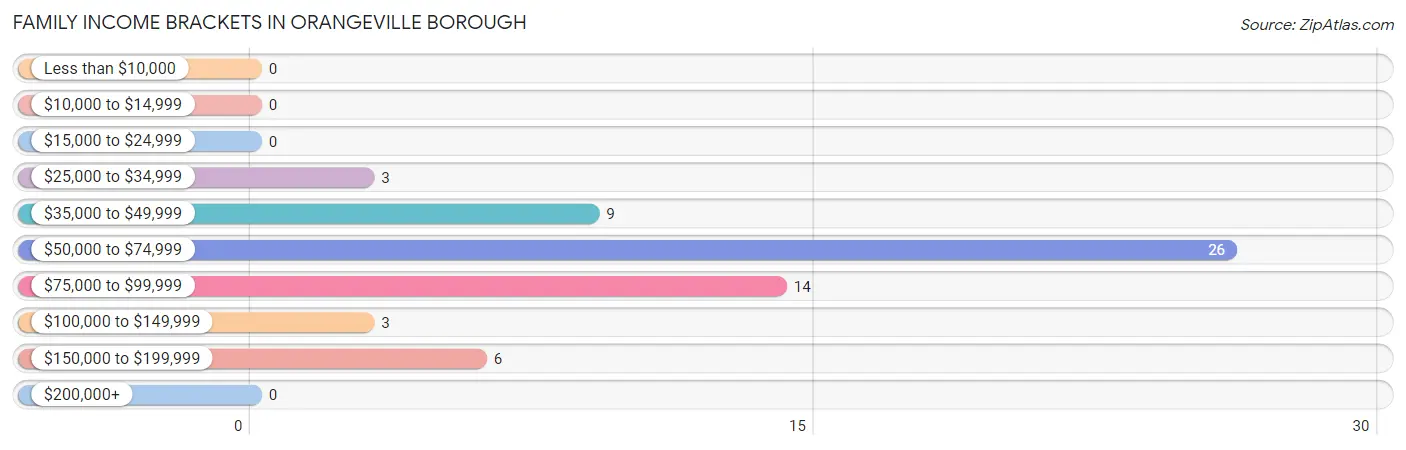
Family Income in Orangeville borough
Family Income Brackets in Orangeville borough
According to the Orangeville borough family income data, there are 26 families falling into the $50,000 to $74,999 income range, which is the most common income bracket and makes up 42.6% of all families.
| Income Bracket | # Families | % Families |
| Less than $10,000 | 0 | 0.0% |
| $10,000 to $14,999 | 0 | 0.0% |
| $15,000 to $24,999 | 0 | 0.0% |
| $25,000 to $34,999 | 3 | 4.9% |
| $35,000 to $49,999 | 9 | 14.8% |
| $50,000 to $74,999 | 26 | 42.6% |
| $75,000 to $99,999 | 14 | 23.0% |
| $100,000 to $149,999 | 3 | 4.9% |
| $150,000 to $199,999 | 6 | 9.8% |
| $200,000+ | 0 | 0.0% |
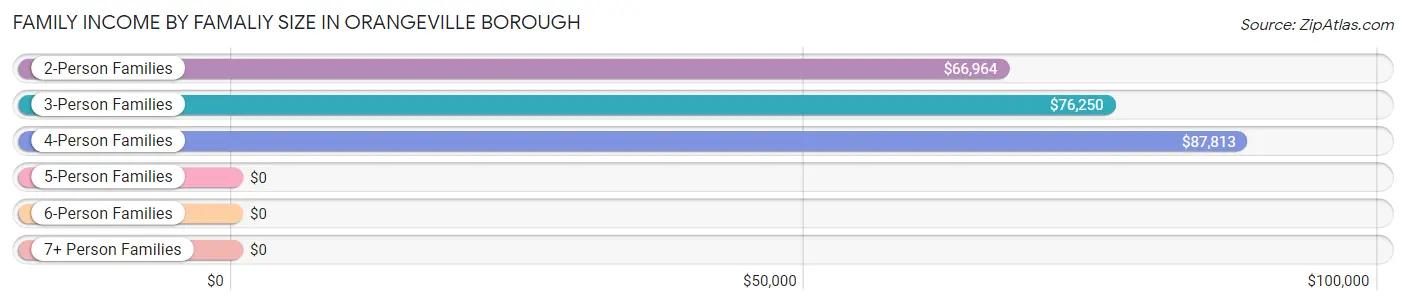
Family Income by Famaliy Size in Orangeville borough
4-person families (7 | 11.5%) account for the highest median family income in Orangeville borough with $87,813 per family, while 2-person families (37 | 60.7%) have the highest median income of $33,482 per family member.
| Income Bracket | # Families | Median Income |
| 2-Person Families | 37 (60.7%) | $66,964 |
| 3-Person Families | 9 (14.7%) | $76,250 |
| 4-Person Families | 7 (11.5%) | $87,813 |
| 5-Person Families | 5 (8.2%) | $0 |
| 6-Person Families | 0 (0.0%) | $0 |
| 7+ Person Families | 3 (4.9%) | $0 |
| Total | 61 (100.0%) | $68,125 |
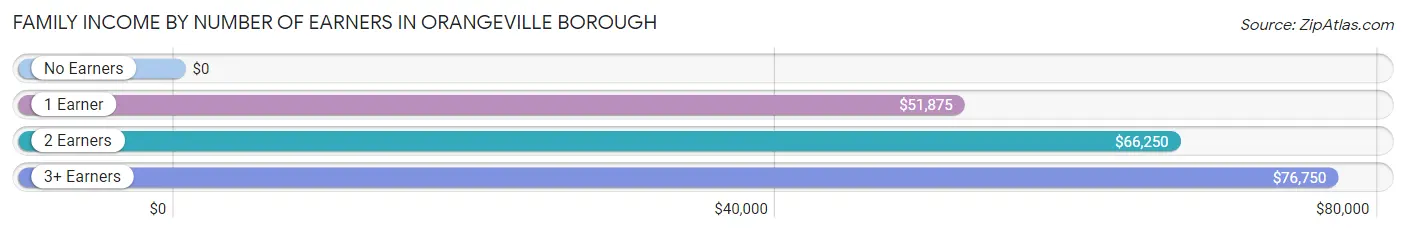
Family Income by Number of Earners in Orangeville borough
| Number of Earners | # Families | Median Income |
| No Earners | 10 (16.4%) | $0 |
| 1 Earner | 19 (31.1%) | $51,875 |
| 2 Earners | 21 (34.4%) | $66,250 |
| 3+ Earners | 11 (18.0%) | $76,750 |
| Total | 61 (100.0%) | $68,125 |
Household Income in Orangeville borough
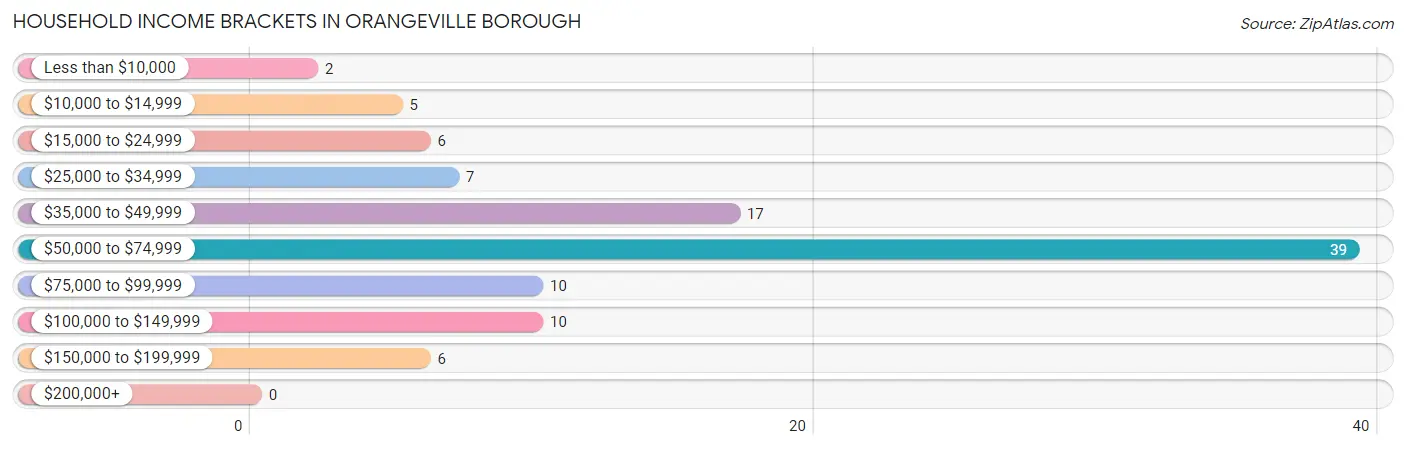
Household Income Brackets in Orangeville borough
With 39 households falling in the category, the $50,000 to $74,999 income range is the most frequent in Orangeville borough, accounting for 38.2% of all households.
| Income Bracket | # Households | % Households |
| Less than $10,000 | 2 | 2.0% |
| $10,000 to $14,999 | 5 | 4.9% |
| $15,000 to $24,999 | 6 | 5.9% |
| $25,000 to $34,999 | 7 | 6.9% |
| $35,000 to $49,999 | 17 | 16.7% |
| $50,000 to $74,999 | 39 | 38.2% |
| $75,000 to $99,999 | 10 | 9.8% |
| $100,000 to $149,999 | 10 | 9.8% |
| $150,000 to $199,999 | 6 | 5.9% |
| $200,000+ | 0 | 0.0% |
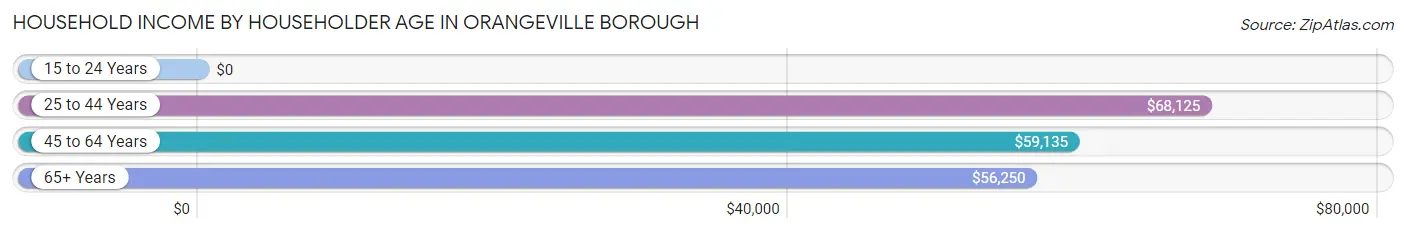
Household Income by Householder Age in Orangeville borough
The median household income in Orangeville borough is $58,971, with the highest median household income of $68,125 found in the 25 to 44 years age bracket for the primary householder. A total of 23 households (22.6%) fall into this category. Meanwhile, the 15 to 24 years age bracket for the primary householder has the lowest median household income of $0, with 5 households (4.9%) in this group.
| Income Bracket | # Households | Median Income |
| 15 to 24 Years | 5 (4.9%) | $0 |
| 25 to 44 Years | 23 (22.6%) | $68,125 |
| 45 to 64 Years | 39 (38.2%) | $59,135 |
| 65+ Years | 35 (34.3%) | $56,250 |
| Total | 102 (100.0%) | $58,971 |
Poverty in Orangeville borough
Income Below Poverty by Sex and Age in Orangeville borough
With 2.2% poverty level for males and 5.1% for females among the residents of Orangeville borough, 18 to 24 year old males and 75 year old and over females are the most vulnerable to poverty, with 3 males (75.0%) and 3 females (15.8%) in their respective age groups living below the poverty level.
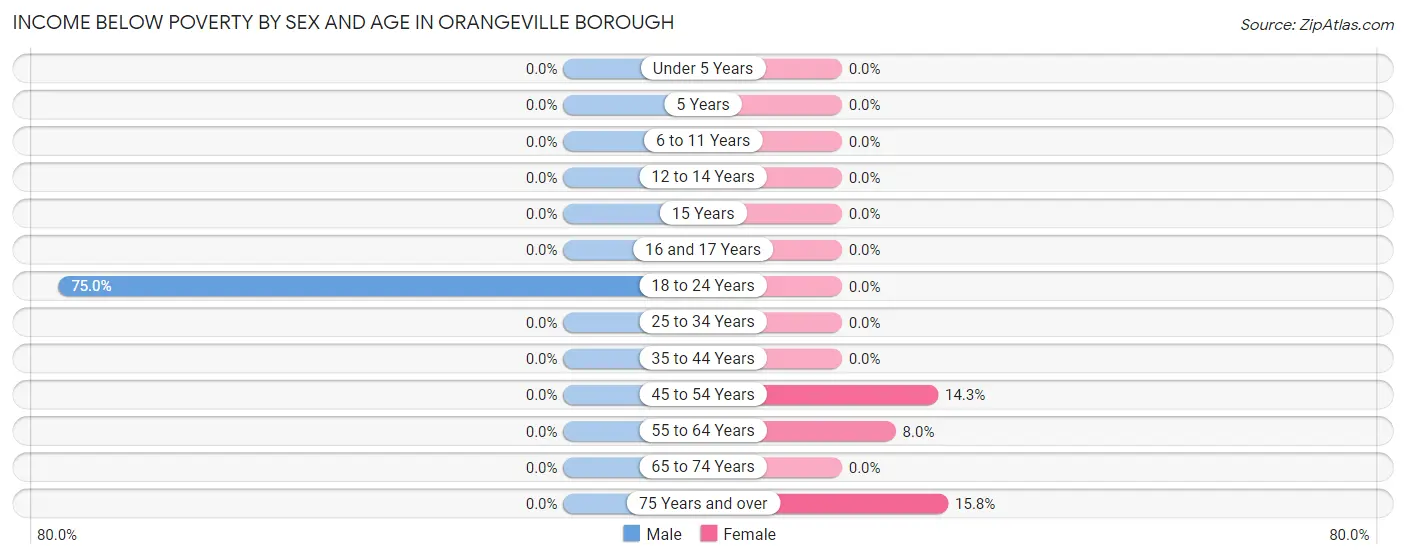
| Age Bracket | Male | Female |
| Under 5 Years | 0 (0.0%) | 0 (0.0%) |
| 5 Years | 0 (0.0%) | 0 (0.0%) |
| 6 to 11 Years | 0 (0.0%) | 0 (0.0%) |
| 12 to 14 Years | 0 (0.0%) | 0 (0.0%) |
| 15 Years | 0 (0.0%) | 0 (0.0%) |
| 16 and 17 Years | 0 (0.0%) | 0 (0.0%) |
| 18 to 24 Years | 3 (75.0%) | 0 (0.0%) |
| 25 to 34 Years | 0 (0.0%) | 0 (0.0%) |
| 35 to 44 Years | 0 (0.0%) | 0 (0.0%) |
| 45 to 54 Years | 0 (0.0%) | 2 (14.3%) |
| 55 to 64 Years | 0 (0.0%) | 2 (8.0%) |
| 65 to 74 Years | 0 (0.0%) | 0 (0.0%) |
| 75 Years and over | 0 (0.0%) | 3 (15.8%) |
| Total | 3 (2.2%) | 7 (5.1%) |
Income Above Poverty by Sex and Age in Orangeville borough
According to the poverty statistics in Orangeville borough, males aged under 5 years and females aged under 5 years are the age groups that are most secure financially, with 100.0% of males and 100.0% of females in these age groups living above the poverty line.
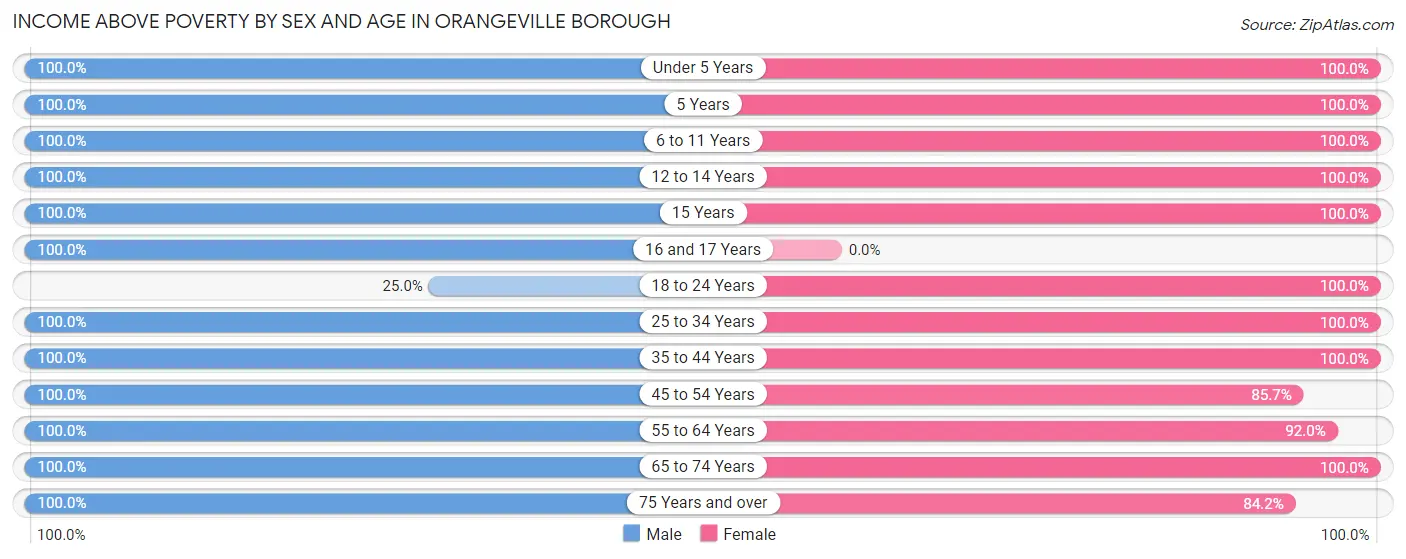
| Age Bracket | Male | Female |
| Under 5 Years | 4 (100.0%) | 3 (100.0%) |
| 5 Years | 5 (100.0%) | 2 (100.0%) |
| 6 to 11 Years | 5 (100.0%) | 8 (100.0%) |
| 12 to 14 Years | 5 (100.0%) | 5 (100.0%) |
| 15 Years | 3 (100.0%) | 3 (100.0%) |
| 16 and 17 Years | 2 (100.0%) | 0 (0.0%) |
| 18 to 24 Years | 1 (25.0%) | 4 (100.0%) |
| 25 to 34 Years | 18 (100.0%) | 17 (100.0%) |
| 35 to 44 Years | 13 (100.0%) | 8 (100.0%) |
| 45 to 54 Years | 17 (100.0%) | 12 (85.7%) |
| 55 to 64 Years | 35 (100.0%) | 23 (92.0%) |
| 65 to 74 Years | 20 (100.0%) | 28 (100.0%) |
| 75 Years and over | 8 (100.0%) | 16 (84.2%) |
| Total | 136 (97.8%) | 129 (94.9%) |
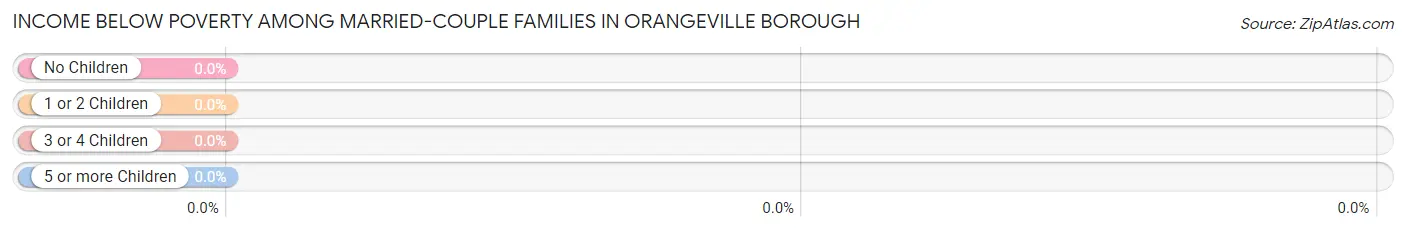
Income Below Poverty Among Married-Couple Families in Orangeville borough
| Children | Above Poverty | Below Poverty |
| No Children | 31 (100.0%) | 0 (0.0%) |
| 1 or 2 Children | 4 (100.0%) | 0 (0.0%) |
| 3 or 4 Children | 3 (100.0%) | 0 (0.0%) |
| 5 or more Children | 3 (100.0%) | 0 (0.0%) |
| Total | 41 (100.0%) | 0 (0.0%) |
Income Below Poverty Among Single-Parent Households in Orangeville borough
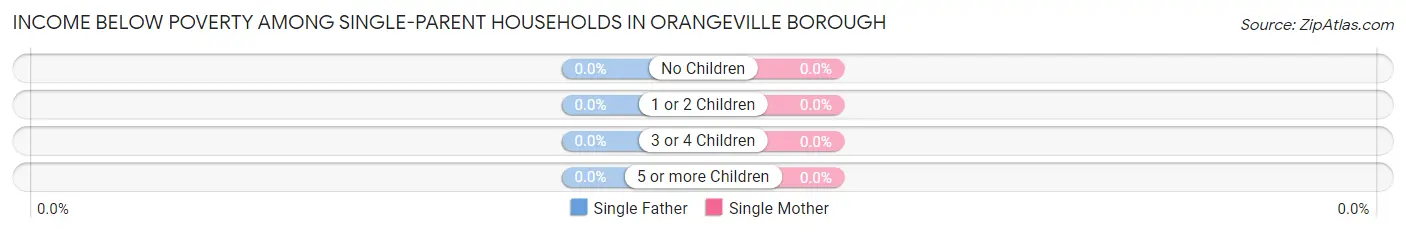
| Children | Single Father | Single Mother |
| No Children | 0 (0.0%) | 0 (0.0%) |
| 1 or 2 Children | 0 (0.0%) | 0 (0.0%) |
| 3 or 4 Children | 0 (0.0%) | 0 (0.0%) |
| 5 or more Children | 0 (0.0%) | 0 (0.0%) |
| Total | 0 (0.0%) | 0 (0.0%) |
Income Below Poverty Among Married-Couple vs Single-Parent Households in Orangeville borough
| Children | Married-Couple Families | Single-Parent Households |
| No Children | 0 (0.0%) | 0 (0.0%) |
| 1 or 2 Children | 0 (0.0%) | 0 (0.0%) |
| 3 or 4 Children | 0 (0.0%) | 0 (0.0%) |
| 5 or more Children | 0 (0.0%) | 0 (0.0%) |
| Total | 0 (0.0%) | 0 (0.0%) |
Race in Orangeville borough
The most populous races in Orangeville borough are White / Caucasian (386 | 95.5%), Black / African American (9 | 2.2%), and Native / Alaskan (8 | 2.0%).
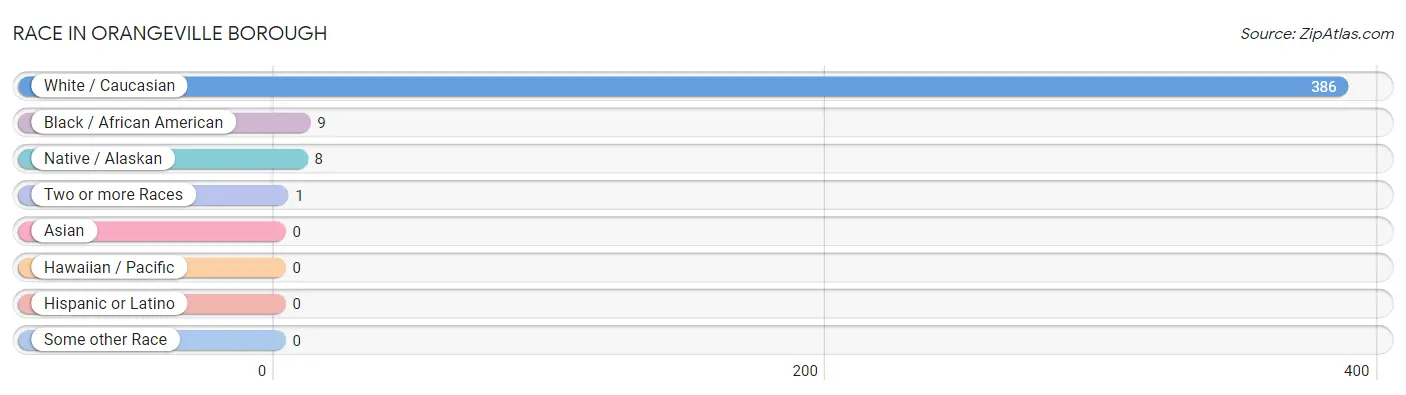
| Race | # Population | % Population |
| Asian | 0 | 0.0% |
| Black / African American | 9 | 2.2% |
| Hawaiian / Pacific | 0 | 0.0% |
| Hispanic or Latino | 0 | 0.0% |
| Native / Alaskan | 8 | 2.0% |
| White / Caucasian | 386 | 95.5% |
| Two or more Races | 1 | 0.3% |
| Some other Race | 0 | 0.0% |
| Total | 404 | 100.0% |
Ancestry in Orangeville borough
The most populous ancestries reported in Orangeville borough are German (165 | 40.8%), English (52 | 12.9%), Pennsylvania German (25 | 6.2%), Dutch (24 | 5.9%), and Irish (23 | 5.7%), together accounting for 71.5% of all Orangeville borough residents.
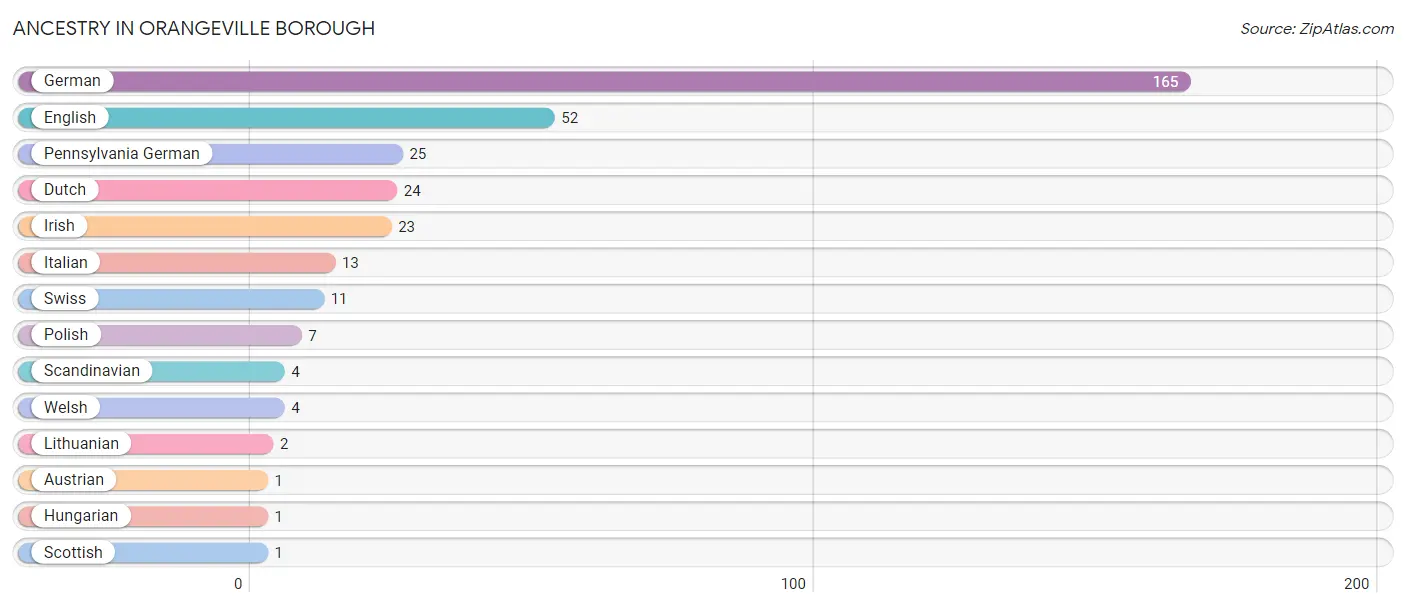
| Ancestry | # Population | % Population |
| Austrian | 1 | 0.3% |
| Dutch | 24 | 5.9% |
| English | 52 | 12.9% |
| German | 165 | 40.8% |
| Hungarian | 1 | 0.3% |
| Irish | 23 | 5.7% |
| Italian | 13 | 3.2% |
| Lithuanian | 2 | 0.5% |
| Pennsylvania German | 25 | 6.2% |
| Polish | 7 | 1.7% |
| Scandinavian | 4 | 1.0% |
| Scottish | 1 | 0.3% |
| Swiss | 11 | 2.7% |
| Welsh | 4 | 1.0% | View All 14 Rows |
Immigrants in Orangeville borough

| Immigration Origin | # Population | % Population | View All 0 Rows |
Sex and Age in Orangeville borough
Sex and Age in Orangeville borough
The most populous age groups in Orangeville borough are 50 to 54 Years (39 | 19.8%) for men and 65 to 69 Years (41 | 19.8%) for women.
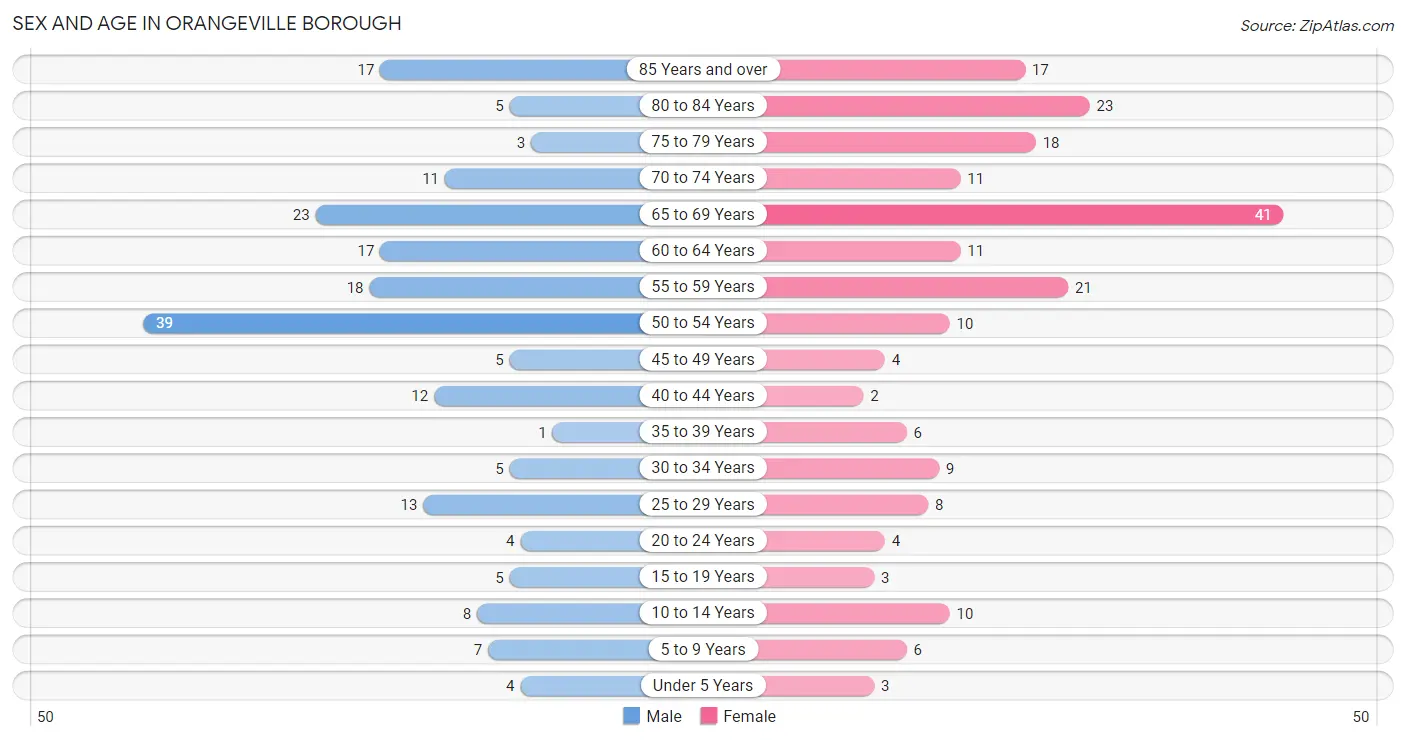
| Age Bracket | Male | Female |
| Under 5 Years | 4 (2.0%) | 3 (1.5%) |
| 5 to 9 Years | 7 (3.5%) | 6 (2.9%) |
| 10 to 14 Years | 8 (4.1%) | 10 (4.8%) |
| 15 to 19 Years | 5 (2.5%) | 3 (1.5%) |
| 20 to 24 Years | 4 (2.0%) | 4 (1.9%) |
| 25 to 29 Years | 13 (6.6%) | 8 (3.9%) |
| 30 to 34 Years | 5 (2.5%) | 9 (4.3%) |
| 35 to 39 Years | 1 (0.5%) | 6 (2.9%) |
| 40 to 44 Years | 12 (6.1%) | 2 (1.0%) |
| 45 to 49 Years | 5 (2.5%) | 4 (1.9%) |
| 50 to 54 Years | 39 (19.8%) | 10 (4.8%) |
| 55 to 59 Years | 18 (9.1%) | 21 (10.1%) |
| 60 to 64 Years | 17 (8.6%) | 11 (5.3%) |
| 65 to 69 Years | 23 (11.7%) | 41 (19.8%) |
| 70 to 74 Years | 11 (5.6%) | 11 (5.3%) |
| 75 to 79 Years | 3 (1.5%) | 18 (8.7%) |
| 80 to 84 Years | 5 (2.5%) | 23 (11.1%) |
| 85 Years and over | 17 (8.6%) | 17 (8.2%) |
| Total | 197 (100.0%) | 207 (100.0%) |
Families and Households in Orangeville borough
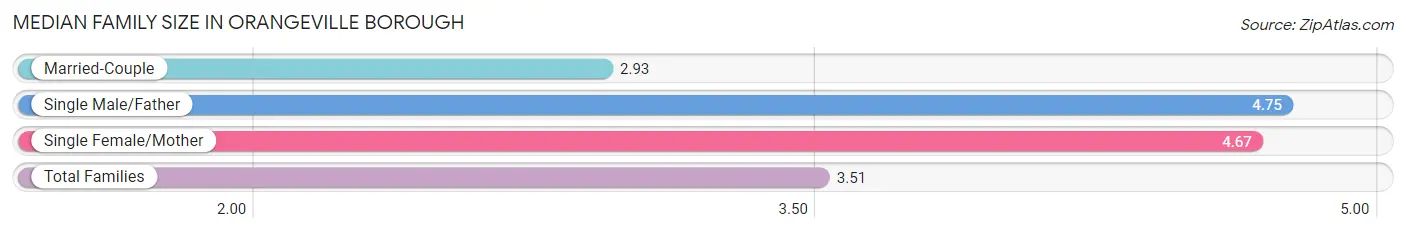
Median Family Size in Orangeville borough
The median family size in Orangeville borough is 3.51 persons per family, with single male/father families (8 | 13.1%) accounting for the largest median family size of 4.75 persons per family. On the other hand, married-couple families (41 | 67.2%) represent the smallest median family size with 2.93 persons per family.
| Family Type | # Families | Family Size |
| Married-Couple | 41 (67.2%) | 2.93 |
| Single Male/Father | 8 (13.1%) | 4.75 |
| Single Female/Mother | 12 (19.7%) | 4.67 |
| Total Families | 61 (100.0%) | 3.51 |
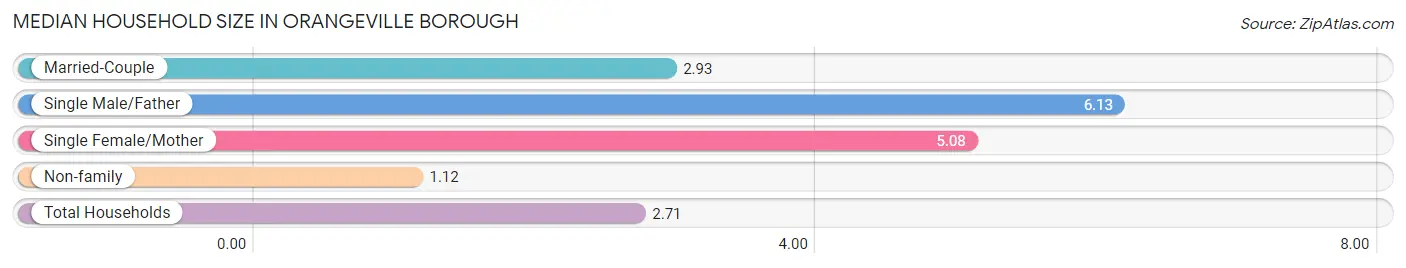
Median Household Size in Orangeville borough
The median household size in Orangeville borough is 2.71 persons per household, with single male/father households (8 | 7.8%) accounting for the largest median household size of 6.13 persons per household. non-family households (41 | 40.2%) represent the smallest median household size with 1.12 persons per household.
| Household Type | # Households | Household Size |
| Married-Couple | 41 (40.2%) | 2.93 |
| Single Male/Father | 8 (7.8%) | 6.13 |
| Single Female/Mother | 12 (11.8%) | 5.08 |
| Non-family | 41 (40.2%) | 1.12 |
| Total Households | 102 (100.0%) | 2.71 |
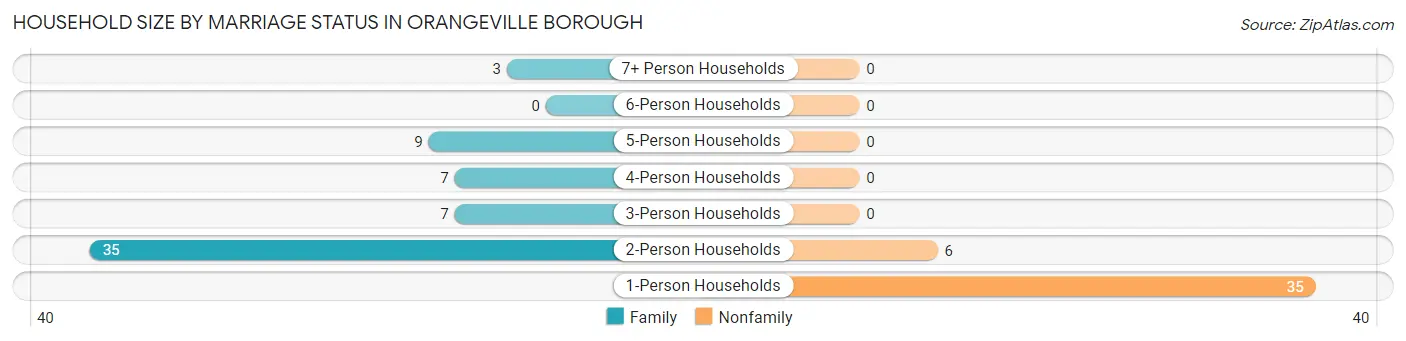
Household Size by Marriage Status in Orangeville borough
Out of a total of 102 households in Orangeville borough, 61 (59.8%) are family households, while 41 (40.2%) are nonfamily households. The most numerous type of family households are 2-person households, comprising 35, and the most common type of nonfamily households are 1-person households, comprising 35.
| Household Size | Family Households | Nonfamily Households |
| 1-Person Households | - | 35 (34.3%) |
| 2-Person Households | 35 (34.3%) | 6 (5.9%) |
| 3-Person Households | 7 (6.9%) | 0 (0.0%) |
| 4-Person Households | 7 (6.9%) | 0 (0.0%) |
| 5-Person Households | 9 (8.8%) | 0 (0.0%) |
| 6-Person Households | 0 (0.0%) | 0 (0.0%) |
| 7+ Person Households | 3 (2.9%) | 0 (0.0%) |
| Total | 61 (59.8%) | 41 (40.2%) |
Female Fertility in Orangeville borough
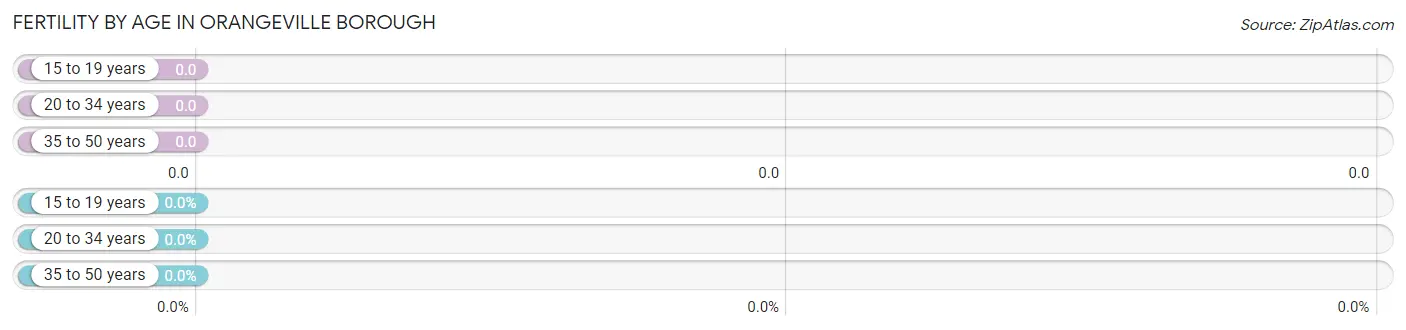
Fertility by Age in Orangeville borough
| Age Bracket | Women with Births | Births / 1,000 Women |
| 15 to 19 years | 0 (0.0%) | 0.0 |
| 20 to 34 years | 0 (0.0%) | 0.0 |
| 35 to 50 years | 0 (0.0%) | 0.0 |
| Total | 0 (0.0%) | 0.0 |
Fertility by Age by Marriage Status in Orangeville borough
| Age Bracket | Married | Unmarried |
| 15 to 19 years | 0 (0.0%) | 0 (0.0%) |
| 20 to 34 years | 0 (0.0%) | 0 (0.0%) |
| 35 to 50 years | 0 (0.0%) | 0 (0.0%) |
| Total | 0 (0.0%) | 0 (0.0%) |
Fertility by Education in Orangeville borough
| Educational Attainment | Women with Births | Births / 1,000 Women |
| Less than High School | 0 (0.0%) | 0.0 |
| High School Diploma | 0 (0.0%) | 0.0 |
| College or Associate's Degree | 0 (0.0%) | 0.0 |
| Bachelor's Degree | 0 (0.0%) | 0.0 |
| Graduate Degree | 0 (0.0%) | 0.0 |
| Total | 0 (0.0%) | 0.0 |
Fertility by Education by Marriage Status in Orangeville borough
| Educational Attainment | Married | Unmarried |
| Less than High School | 0 (0.0%) | 0 (0.0%) |
| High School Diploma | 0 (0.0%) | 0 (0.0%) |
| College or Associate's Degree | 0 (0.0%) | 0 (0.0%) |
| Bachelor's Degree | 0 (0.0%) | 0 (0.0%) |
| Graduate Degree | 0 (0.0%) | 0 (0.0%) |
| Total | 0 (0.0%) | 0 (0.0%) |
Employment Characteristics in Orangeville borough
Employment by Class of Employer in Orangeville borough
Among the 160 employed individuals in Orangeville borough, private company employees (72 | 45.0%), state government employees (33 | 20.6%), and federal government employees (27 | 16.9%) make up the most common classes of employment.
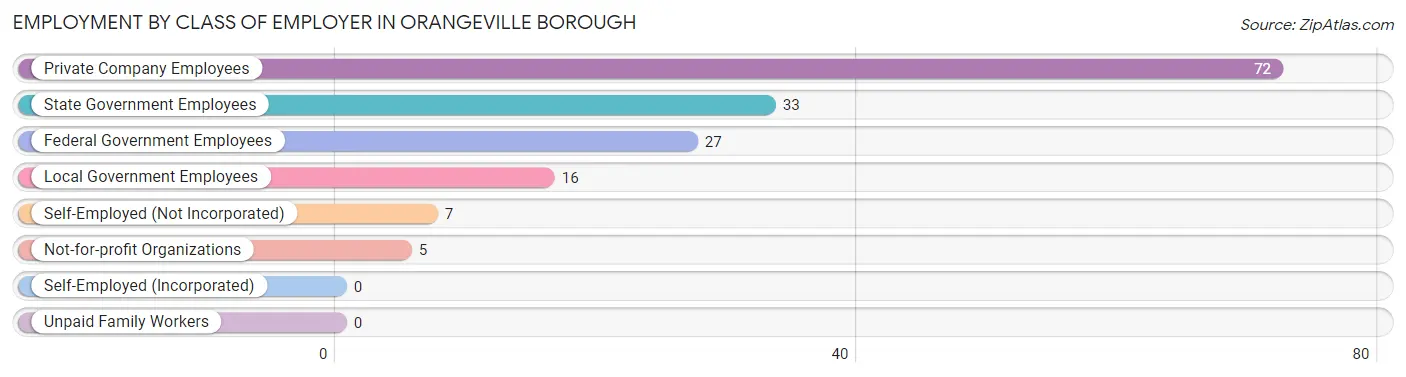
| Employer Class | # Employees | % Employees |
| Private Company Employees | 72 | 45.0% |
| Self-Employed (Incorporated) | 0 | 0.0% |
| Self-Employed (Not Incorporated) | 7 | 4.4% |
| Not-for-profit Organizations | 5 | 3.1% |
| Local Government Employees | 16 | 10.0% |
| State Government Employees | 33 | 20.6% |
| Federal Government Employees | 27 | 16.9% |
| Unpaid Family Workers | 0 | 0.0% |
| Total | 160 | 100.0% |
Employment Status by Age in Orangeville borough
According to the labor force statistics for Orangeville borough, out of the total population over 16 years of age (360), 46.9% or 169 individuals are in the labor force, with 5.3% or 9 of them unemployed. The age group with the highest labor force participation rate is 20 to 24 years, with 100.0% or 8 individuals in the labor force. Within the labor force, the 75 years and over age range has the highest percentage of unemployed individuals, with 40.0% or 4 of them being unemployed.
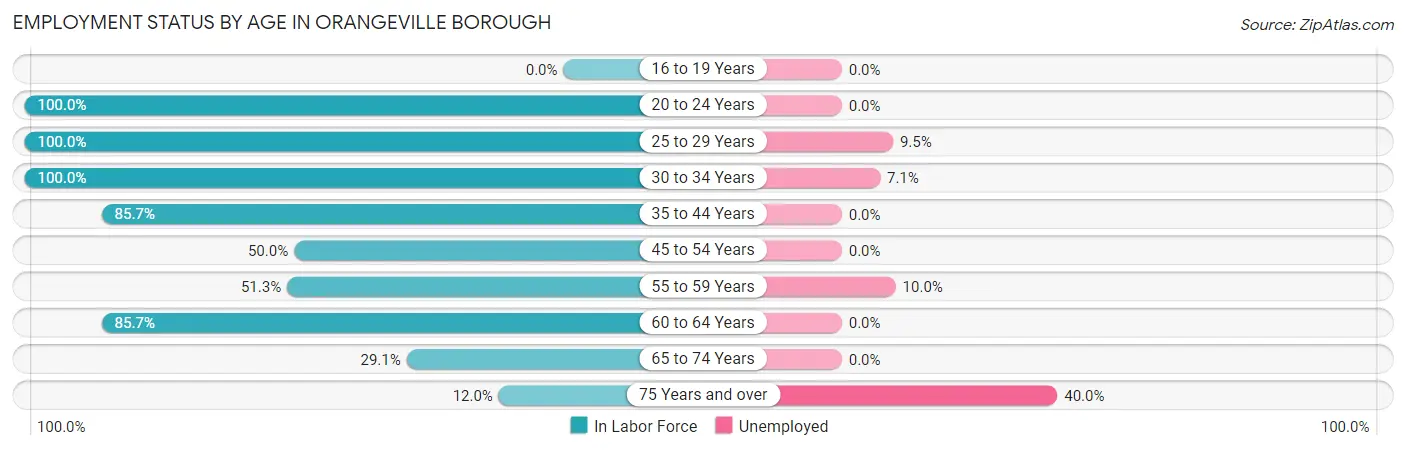
| Age Bracket | In Labor Force | Unemployed |
| 16 to 19 Years | 0 (0.0%) | 0 (0.0%) |
| 20 to 24 Years | 8 (100.0%) | 0 (0.0%) |
| 25 to 29 Years | 21 (100.0%) | 2 (9.5%) |
| 30 to 34 Years | 14 (100.0%) | 1 (7.1%) |
| 35 to 44 Years | 18 (85.7%) | 0 (0.0%) |
| 45 to 54 Years | 29 (50.0%) | 0 (0.0%) |
| 55 to 59 Years | 20 (51.3%) | 2 (10.0%) |
| 60 to 64 Years | 24 (85.7%) | 0 (0.0%) |
| 65 to 74 Years | 25 (29.1%) | 0 (0.0%) |
| 75 Years and over | 10 (12.0%) | 4 (40.0%) |
| Total | 169 (46.9%) | 9 (5.3%) |
Employment Status by Educational Attainment in Orangeville borough
According to labor force statistics for Orangeville borough, 69.6% of individuals (126) out of the total population between 25 and 64 years of age (181) are in the labor force, with 4.0% or 5 of them being unemployed. The group with the highest labor force participation rate are those with the educational attainment of less than high school, with 86.7% or 13 individuals in the labor force. Within the labor force, individuals with high school diploma education have the highest percentage of unemployment, with 6.7% or 4 of them being unemployed.
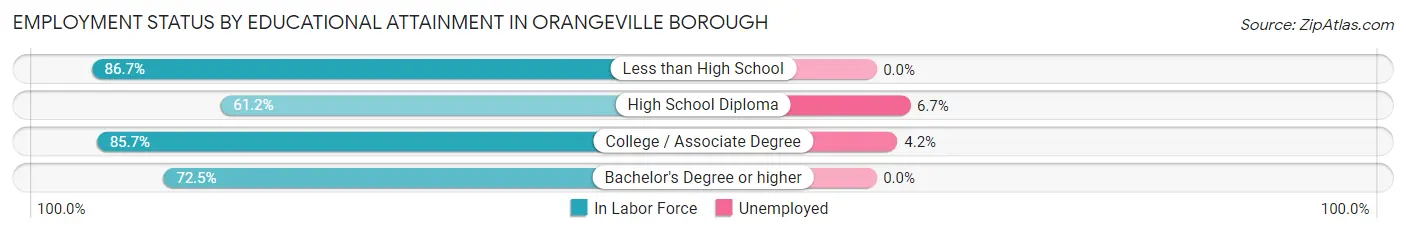
| Educational Attainment | In Labor Force | Unemployed |
| Less than High School | 13 (86.7%) | 0 (0.0%) |
| High School Diploma | 60 (61.2%) | 7 (6.7%) |
| College / Associate Degree | 24 (85.7%) | 1 (4.2%) |
| Bachelor's Degree or higher | 29 (72.5%) | 0 (0.0%) |
| Total | 126 (69.6%) | 7 (4.0%) |
Employment Occupations by Sex in Orangeville borough
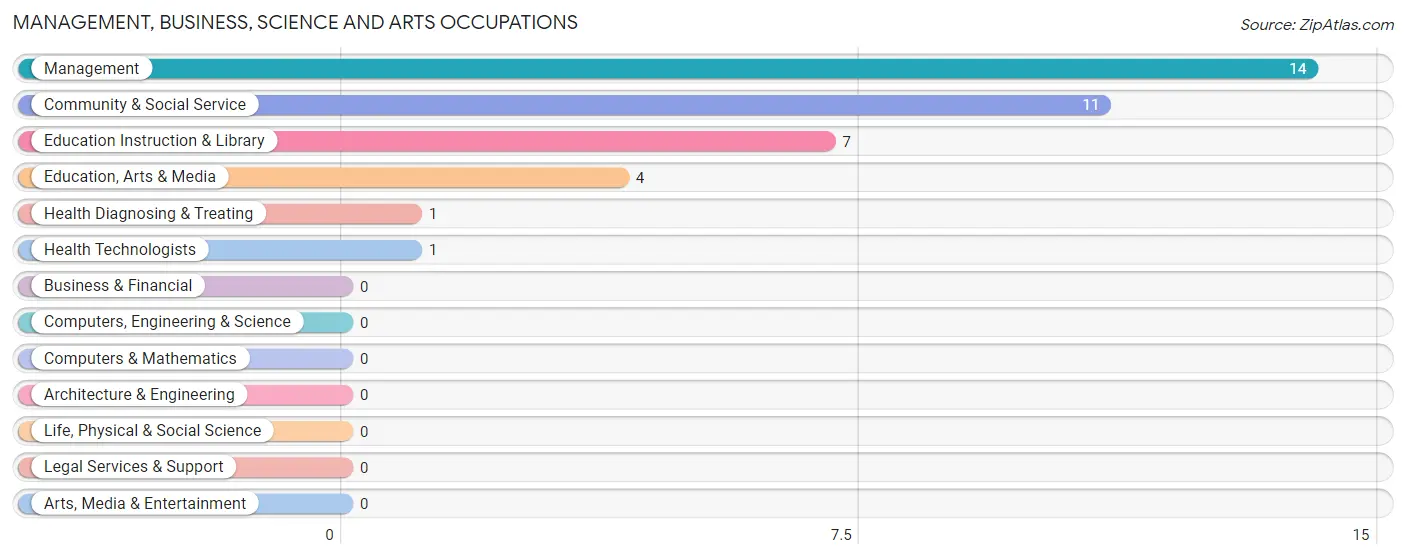
Management, Business, Science and Arts Occupations
The most common Management, Business, Science and Arts occupations in Orangeville borough are Management (14 | 8.7%), Community & Social Service (11 | 6.9%), Education Instruction & Library (7 | 4.4%), Education, Arts & Media (4 | 2.5%), and Health Diagnosing & Treating (1 | 0.6%).
Management, Business, Science and Arts Occupations by Sex
Within the Management, Business, Science and Arts occupations in Orangeville borough, the most male-oriented occupations are Education, Arts & Media (100.0%), Management (92.9%), and Community & Social Service (36.4%), while the most female-oriented occupations are Education Instruction & Library (100.0%), Health Diagnosing & Treating (100.0%), and Health Technologists (100.0%).
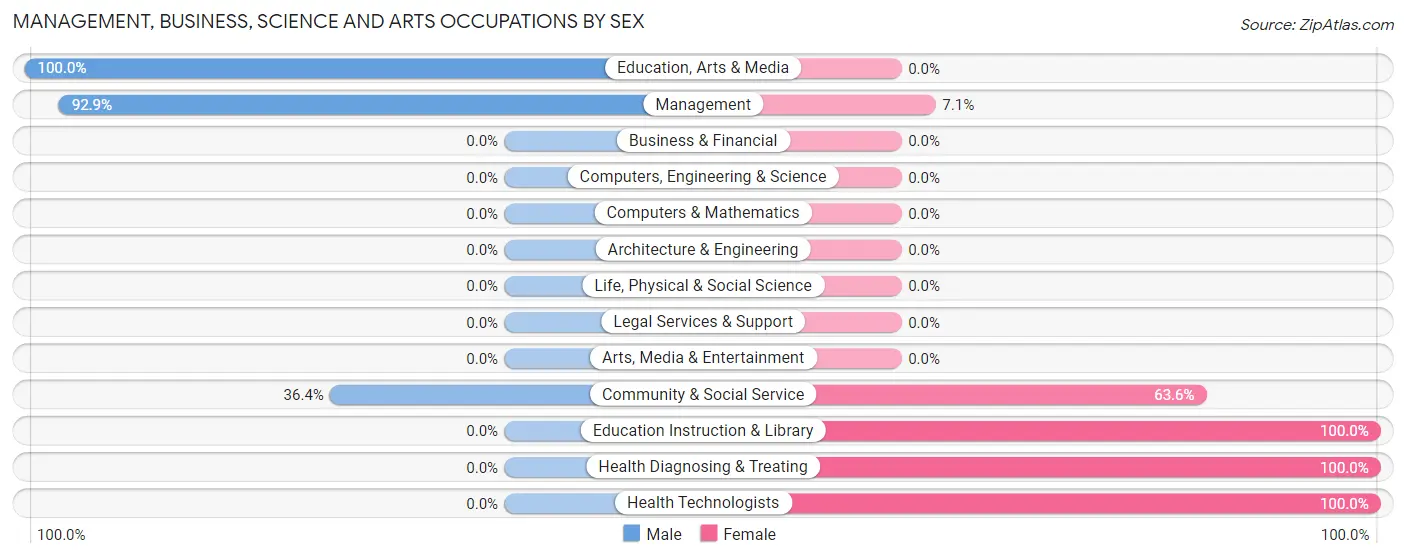
| Occupation | Male | Female |
| Management | 13 (92.9%) | 1 (7.1%) |
| Business & Financial | 0 (0.0%) | 0 (0.0%) |
| Computers, Engineering & Science | 0 (0.0%) | 0 (0.0%) |
| Computers & Mathematics | 0 (0.0%) | 0 (0.0%) |
| Architecture & Engineering | 0 (0.0%) | 0 (0.0%) |
| Life, Physical & Social Science | 0 (0.0%) | 0 (0.0%) |
| Community & Social Service | 4 (36.4%) | 7 (63.6%) |
| Education, Arts & Media | 4 (100.0%) | 0 (0.0%) |
| Legal Services & Support | 0 (0.0%) | 0 (0.0%) |
| Education Instruction & Library | 0 (0.0%) | 7 (100.0%) |
| Arts, Media & Entertainment | 0 (0.0%) | 0 (0.0%) |
| Health Diagnosing & Treating | 0 (0.0%) | 1 (100.0%) |
| Health Technologists | 0 (0.0%) | 1 (100.0%) |
| Total (Category) | 17 (65.4%) | 9 (34.6%) |
| Total (Overall) | 81 (50.6%) | 79 (49.4%) |
Services Occupations
The most common Services occupations in Orangeville borough are Healthcare Support (14 | 8.7%), Cleaning & Maintenance (9 | 5.6%), Food Preparation & Serving (3 | 1.9%), Personal Care & Service (3 | 1.9%), and Security & Protection (1 | 0.6%).
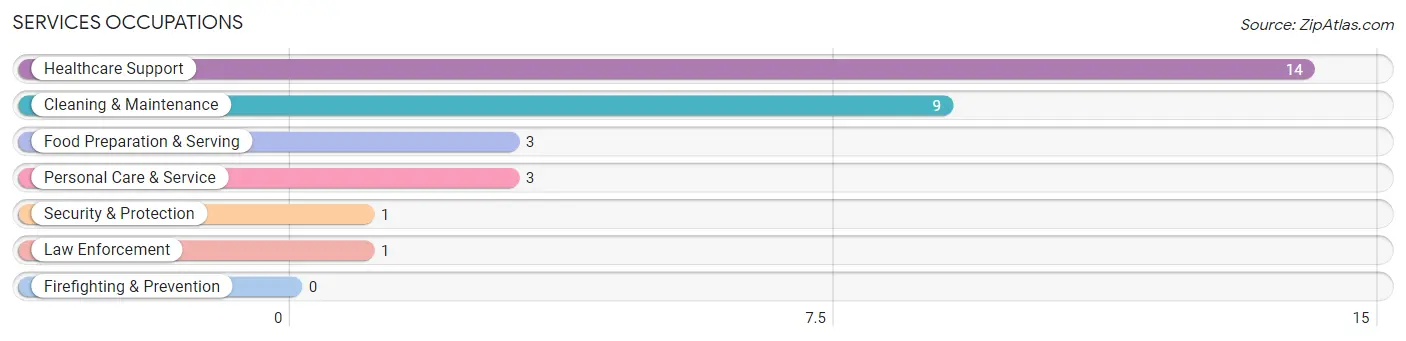
Services Occupations by Sex
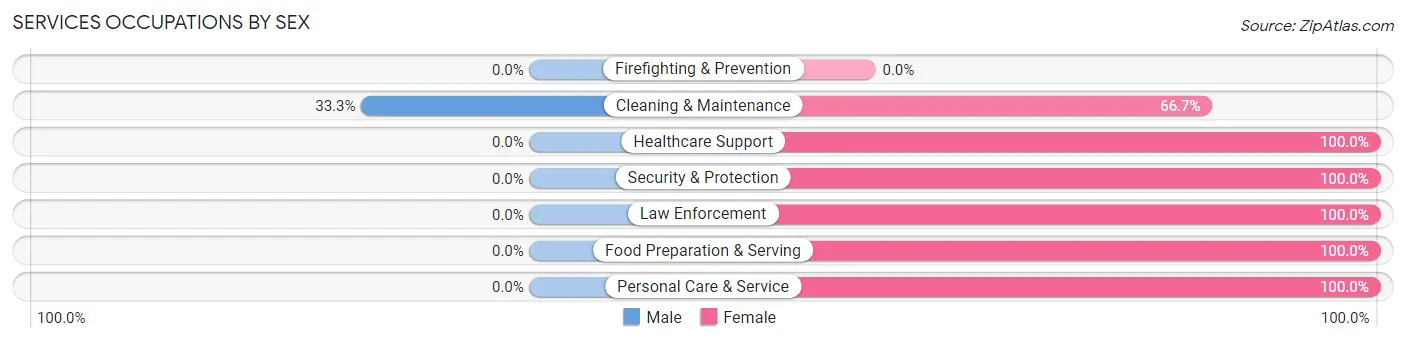
| Occupation | Male | Female |
| Healthcare Support | 0 (0.0%) | 14 (100.0%) |
| Security & Protection | 0 (0.0%) | 1 (100.0%) |
| Firefighting & Prevention | 0 (0.0%) | 0 (0.0%) |
| Law Enforcement | 0 (0.0%) | 1 (100.0%) |
| Food Preparation & Serving | 0 (0.0%) | 3 (100.0%) |
| Cleaning & Maintenance | 3 (33.3%) | 6 (66.7%) |
| Personal Care & Service | 0 (0.0%) | 3 (100.0%) |
| Total (Category) | 3 (10.0%) | 27 (90.0%) |
| Total (Overall) | 81 (50.6%) | 79 (49.4%) |
Sales and Office Occupations
The most common Sales and Office occupations in Orangeville borough are Office & Administration (40 | 25.0%), and Sales & Related (3 | 1.9%).
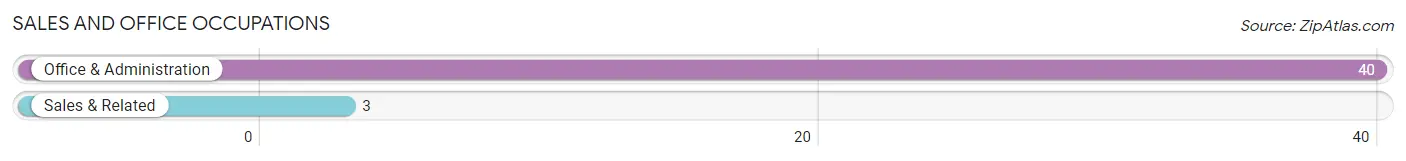
Sales and Office Occupations by Sex
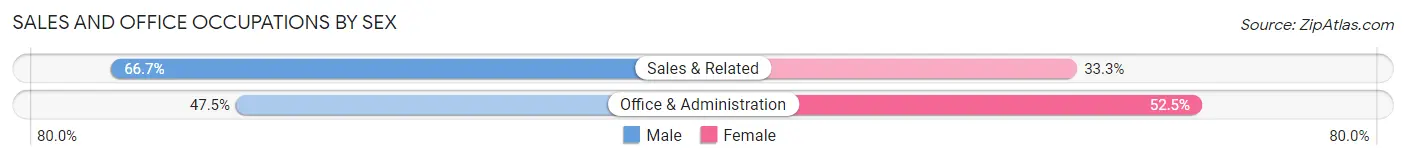
| Occupation | Male | Female |
| Sales & Related | 2 (66.7%) | 1 (33.3%) |
| Office & Administration | 19 (47.5%) | 21 (52.5%) |
| Total (Category) | 21 (48.8%) | 22 (51.2%) |
| Total (Overall) | 81 (50.6%) | 79 (49.4%) |
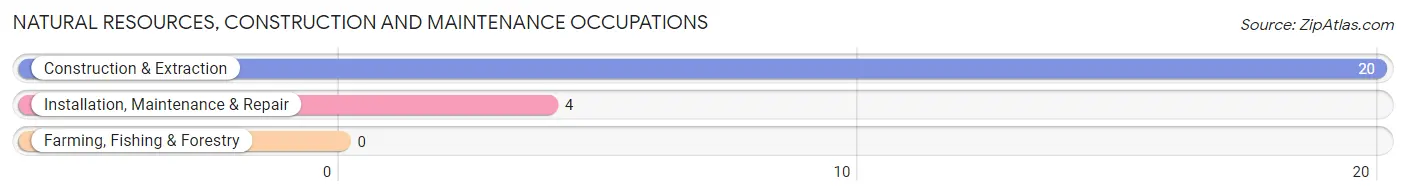
Natural Resources, Construction and Maintenance Occupations
The most common Natural Resources, Construction and Maintenance occupations in Orangeville borough are Construction & Extraction (20 | 12.5%), and Installation, Maintenance & Repair (4 | 2.5%).
Natural Resources, Construction and Maintenance Occupations by Sex
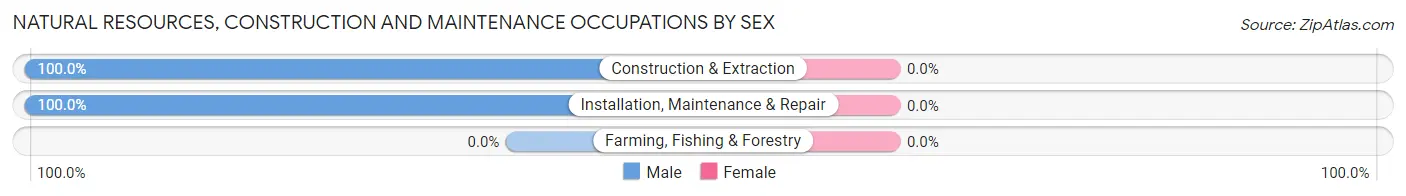
| Occupation | Male | Female |
| Farming, Fishing & Forestry | 0 (0.0%) | 0 (0.0%) |
| Construction & Extraction | 20 (100.0%) | 0 (0.0%) |
| Installation, Maintenance & Repair | 4 (100.0%) | 0 (0.0%) |
| Total (Category) | 24 (100.0%) | 0 (0.0%) |
| Total (Overall) | 81 (50.6%) | 79 (49.4%) |
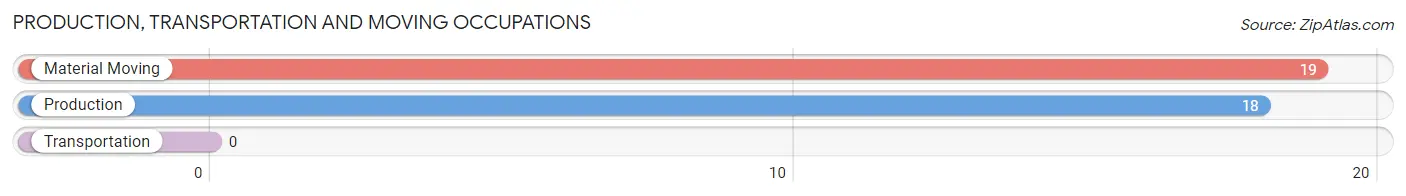
Production, Transportation and Moving Occupations
The most common Production, Transportation and Moving occupations in Orangeville borough are Material Moving (19 | 11.9%), and Production (18 | 11.3%).
Production, Transportation and Moving Occupations by Sex
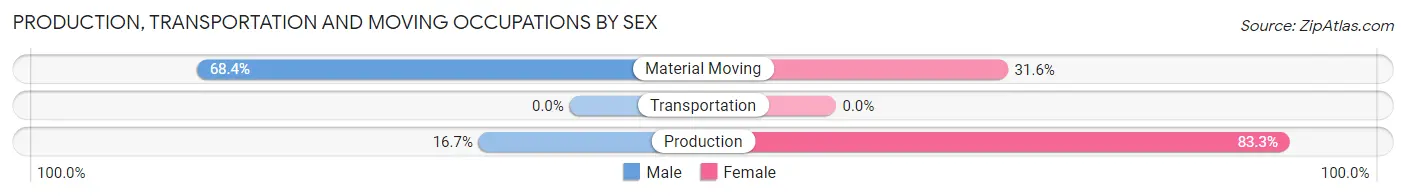
| Occupation | Male | Female |
| Production | 3 (16.7%) | 15 (83.3%) |
| Transportation | 0 (0.0%) | 0 (0.0%) |
| Material Moving | 13 (68.4%) | 6 (31.6%) |
| Total (Category) | 16 (43.2%) | 21 (56.8%) |
| Total (Overall) | 81 (50.6%) | 79 (49.4%) |
Employment Industries by Sex in Orangeville borough
Employment Industries in Orangeville borough
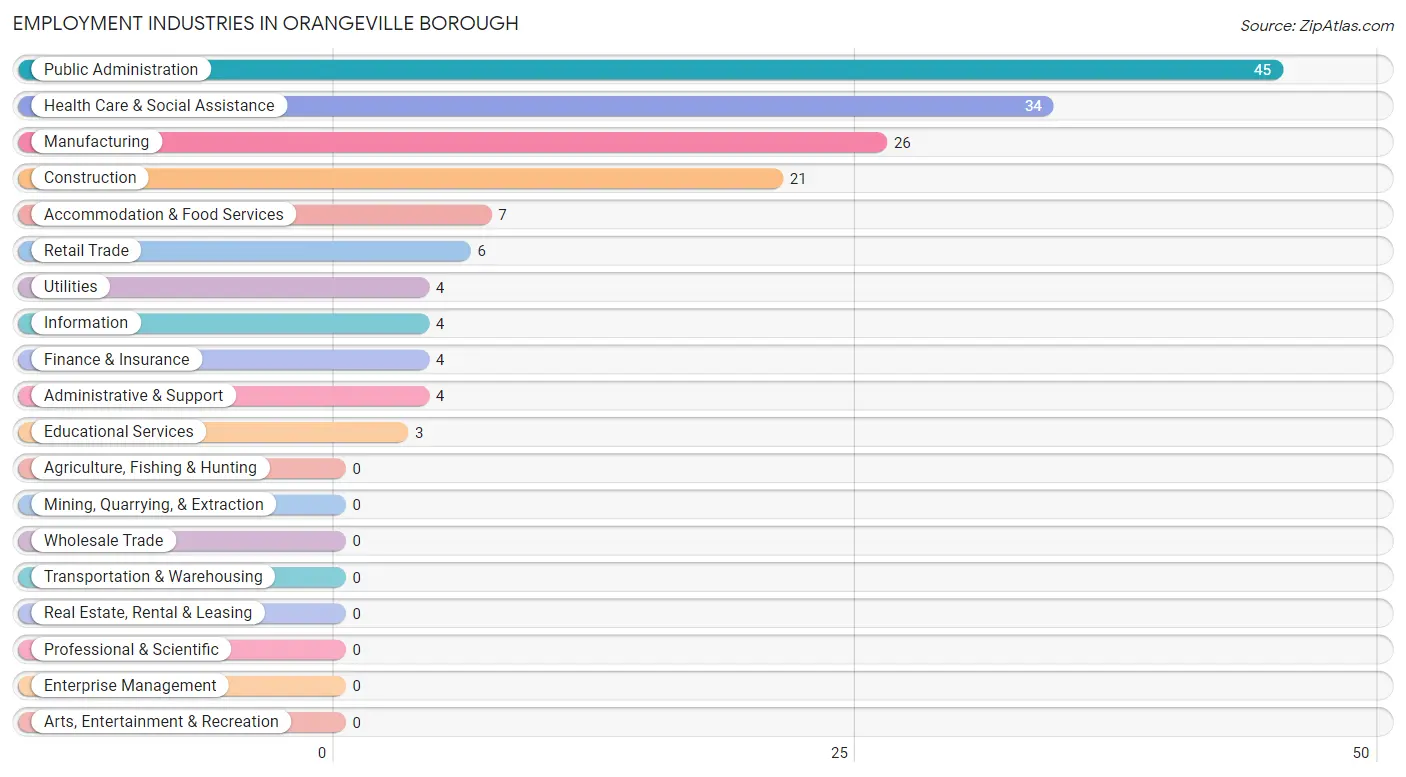
The major employment industries in Orangeville borough include Public Administration (45 | 28.1%), Health Care & Social Assistance (34 | 21.2%), Manufacturing (26 | 16.3%), Construction (21 | 13.1%), and Accommodation & Food Services (7 | 4.4%).
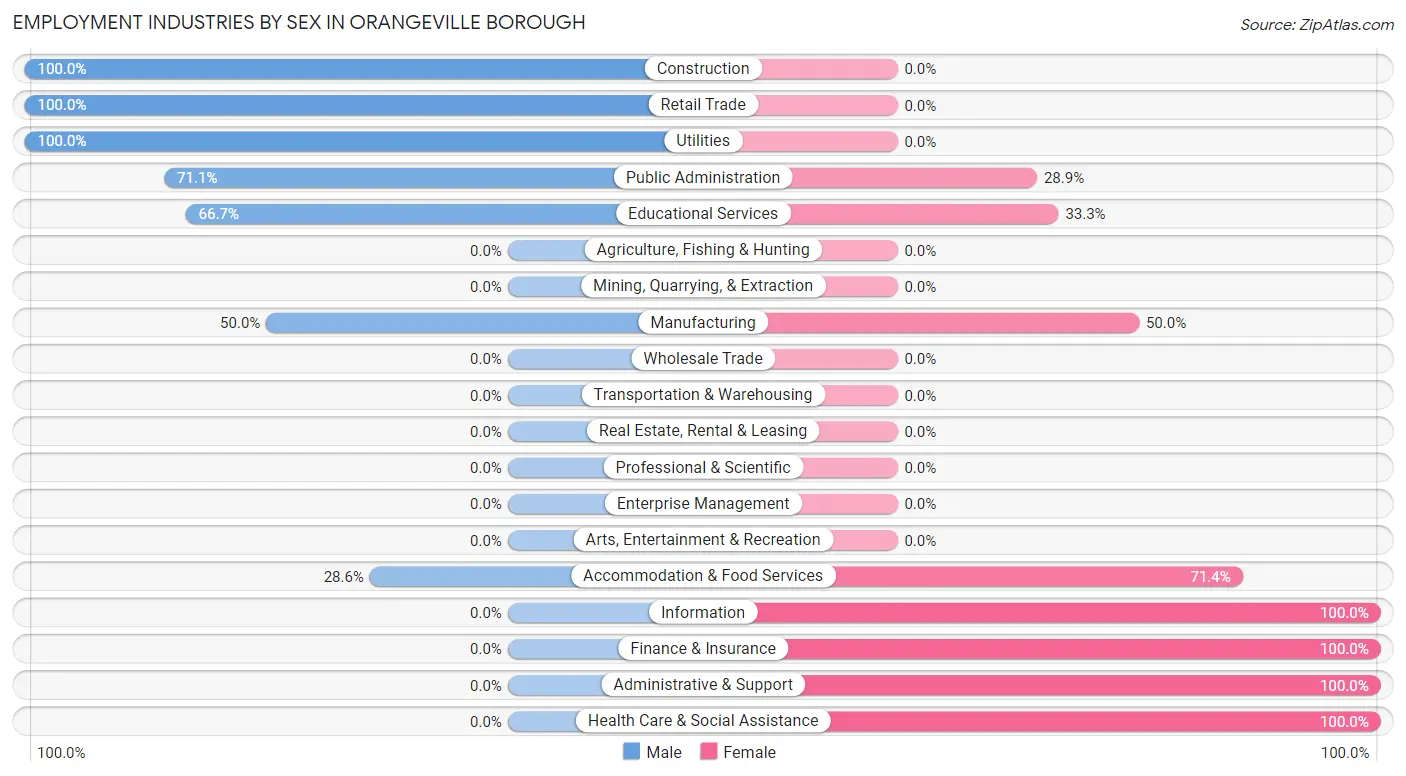
Employment Industries by Sex in Orangeville borough
The Orangeville borough industries that see more men than women are Construction (100.0%), Retail Trade (100.0%), and Utilities (100.0%), whereas the industries that tend to have a higher number of women are Information (100.0%), Finance & Insurance (100.0%), and Administrative & Support (100.0%).
| Industry | Male | Female |
| Agriculture, Fishing & Hunting | 0 (0.0%) | 0 (0.0%) |
| Mining, Quarrying, & Extraction | 0 (0.0%) | 0 (0.0%) |
| Construction | 21 (100.0%) | 0 (0.0%) |
| Manufacturing | 13 (50.0%) | 13 (50.0%) |
| Wholesale Trade | 0 (0.0%) | 0 (0.0%) |
| Retail Trade | 6 (100.0%) | 0 (0.0%) |
| Transportation & Warehousing | 0 (0.0%) | 0 (0.0%) |
| Utilities | 4 (100.0%) | 0 (0.0%) |
| Information | 0 (0.0%) | 4 (100.0%) |
| Finance & Insurance | 0 (0.0%) | 4 (100.0%) |
| Real Estate, Rental & Leasing | 0 (0.0%) | 0 (0.0%) |
| Professional & Scientific | 0 (0.0%) | 0 (0.0%) |
| Enterprise Management | 0 (0.0%) | 0 (0.0%) |
| Administrative & Support | 0 (0.0%) | 4 (100.0%) |
| Educational Services | 2 (66.7%) | 1 (33.3%) |
| Health Care & Social Assistance | 0 (0.0%) | 34 (100.0%) |
| Arts, Entertainment & Recreation | 0 (0.0%) | 0 (0.0%) |
| Accommodation & Food Services | 2 (28.6%) | 5 (71.4%) |
| Public Administration | 32 (71.1%) | 13 (28.9%) |
| Total | 81 (50.6%) | 79 (49.4%) |
Education in Orangeville borough
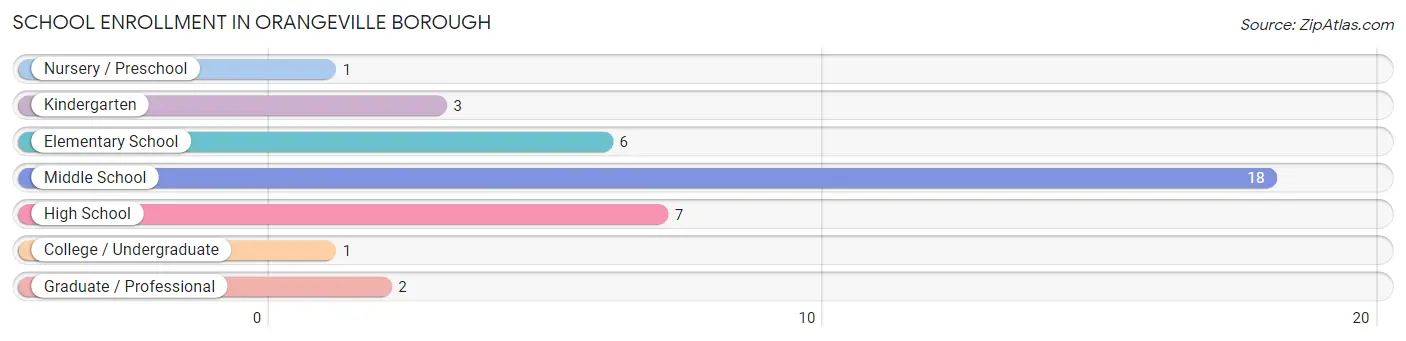
School Enrollment in Orangeville borough
The most common levels of schooling among the 38 students in Orangeville borough are middle school (18 | 47.4%), high school (7 | 18.4%), and elementary school (6 | 15.8%).
| School Level | # Students | % Students |
| Nursery / Preschool | 1 | 2.6% |
| Kindergarten | 3 | 7.9% |
| Elementary School | 6 | 15.8% |
| Middle School | 18 | 47.4% |
| High School | 7 | 18.4% |
| College / Undergraduate | 1 | 2.6% |
| Graduate / Professional | 2 | 5.3% |
| Total | 38 | 100.0% |
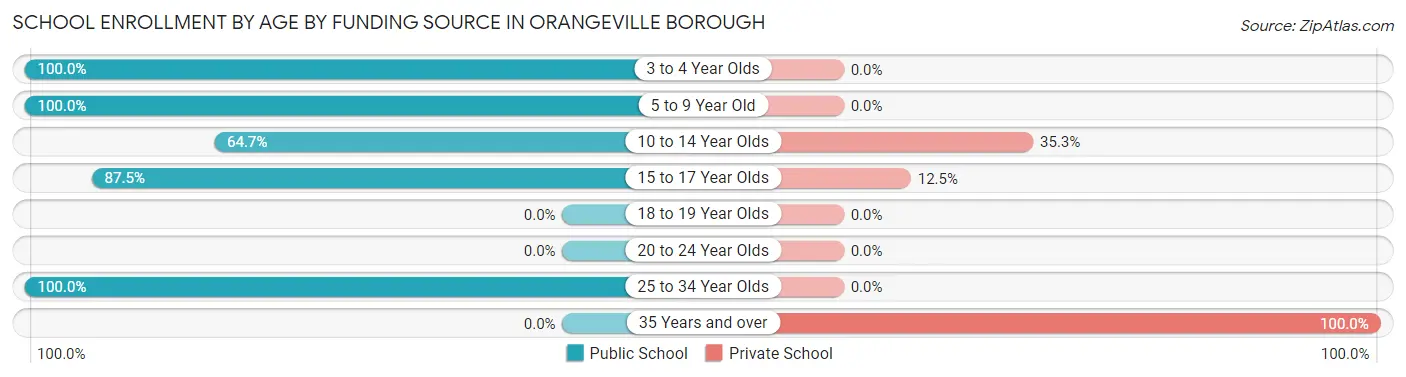
School Enrollment by Age by Funding Source in Orangeville borough
Out of a total of 38 students who are enrolled in schools in Orangeville borough, 8 (21.1%) attend a private institution, while the remaining 30 (78.9%) are enrolled in public schools. The age group of 35 years and over has the highest likelihood of being enrolled in private schools, with 1 (100.0% in the age bracket) enrolled. Conversely, the age group of 3 to 4 year olds has the lowest likelihood of being enrolled in a private school, with 1 (100.0% in the age bracket) attending a public institution.
| Age Bracket | Public School | Private School |
| 3 to 4 Year Olds | 1 (100.0%) | 0 (0.0%) |
| 5 to 9 Year Old | 9 (100.0%) | 0 (0.0%) |
| 10 to 14 Year Olds | 11 (64.7%) | 6 (35.3%) |
| 15 to 17 Year Olds | 7 (87.5%) | 1 (12.5%) |
| 18 to 19 Year Olds | 0 (0.0%) | 0 (0.0%) |
| 20 to 24 Year Olds | 0 (0.0%) | 0 (0.0%) |
| 25 to 34 Year Olds | 2 (100.0%) | 0 (0.0%) |
| 35 Years and over | 0 (0.0%) | 1 (100.0%) |
| Total | 30 (78.9%) | 8 (21.1%) |
Educational Attainment by Field of Study in Orangeville borough
Literature & languages (23 | 25.8%), education (14 | 15.7%), science & technology (11 | 12.4%), arts & humanities (11 | 12.4%), and social sciences (10 | 11.2%) are the most common fields of study among 89 individuals in Orangeville borough who have obtained a bachelor's degree or higher.
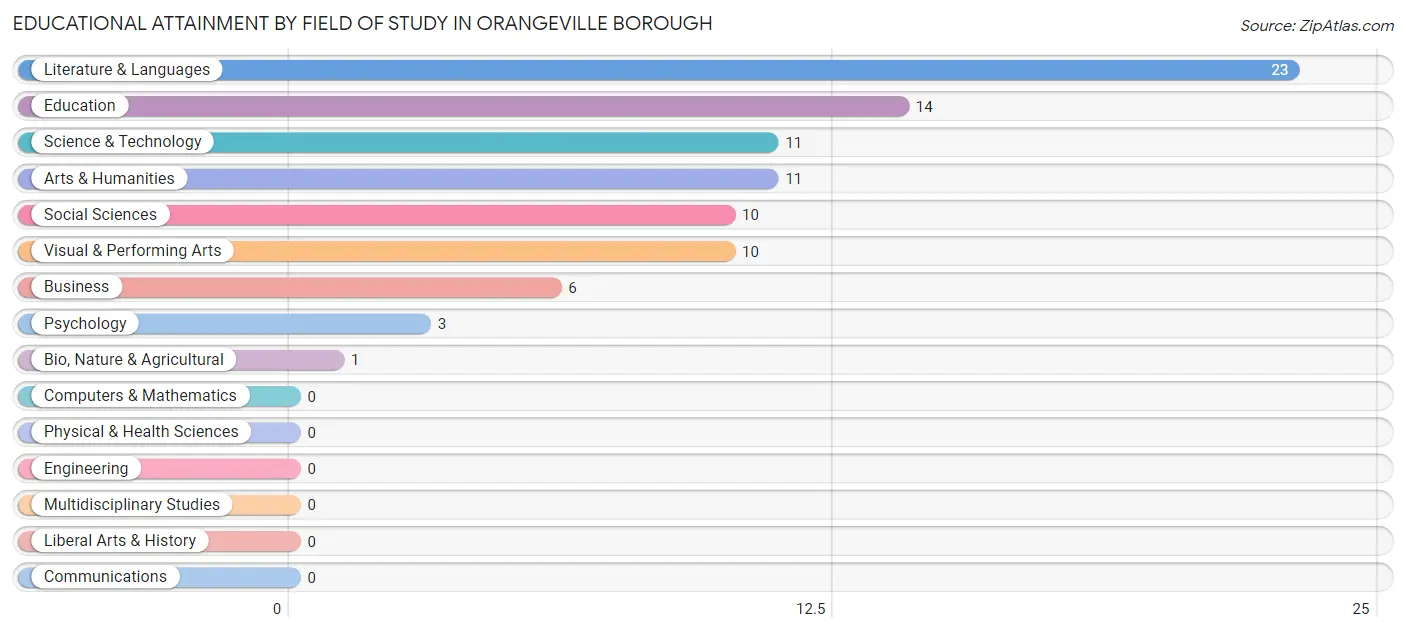
| Field of Study | # Graduates | % Graduates |
| Computers & Mathematics | 0 | 0.0% |
| Bio, Nature & Agricultural | 1 | 1.1% |
| Physical & Health Sciences | 0 | 0.0% |
| Psychology | 3 | 3.4% |
| Social Sciences | 10 | 11.2% |
| Engineering | 0 | 0.0% |
| Multidisciplinary Studies | 0 | 0.0% |
| Science & Technology | 11 | 12.4% |
| Business | 6 | 6.7% |
| Education | 14 | 15.7% |
| Literature & Languages | 23 | 25.8% |
| Liberal Arts & History | 0 | 0.0% |
| Visual & Performing Arts | 10 | 11.2% |
| Communications | 0 | 0.0% |
| Arts & Humanities | 11 | 12.4% |
| Total | 89 | 100.0% |
Transportation & Commute in Orangeville borough
Vehicle Availability by Sex in Orangeville borough
The most prevalent vehicle ownership categories in Orangeville borough are males with 3 vehicles (31, accounting for 38.3%) and females with 3 vehicles (31, making up 39.2%).
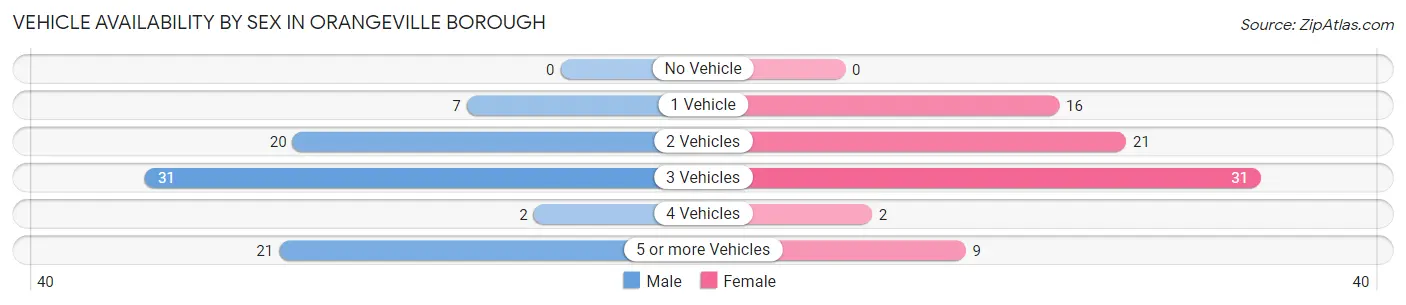
| Vehicles Available | Male | Female |
| No Vehicle | 0 (0.0%) | 0 (0.0%) |
| 1 Vehicle | 7 (8.6%) | 16 (20.3%) |
| 2 Vehicles | 20 (24.7%) | 21 (26.6%) |
| 3 Vehicles | 31 (38.3%) | 31 (39.2%) |
| 4 Vehicles | 2 (2.5%) | 2 (2.5%) |
| 5 or more Vehicles | 21 (25.9%) | 9 (11.4%) |
| Total | 81 (100.0%) | 79 (100.0%) |
Commute Time in Orangeville borough
The most frequently occuring commute durations in Orangeville borough are 25 to 29 minutes (32 commuters, 21.0%), 5 to 9 minutes (26 commuters, 17.1%), and 20 to 24 minutes (25 commuters, 16.5%).
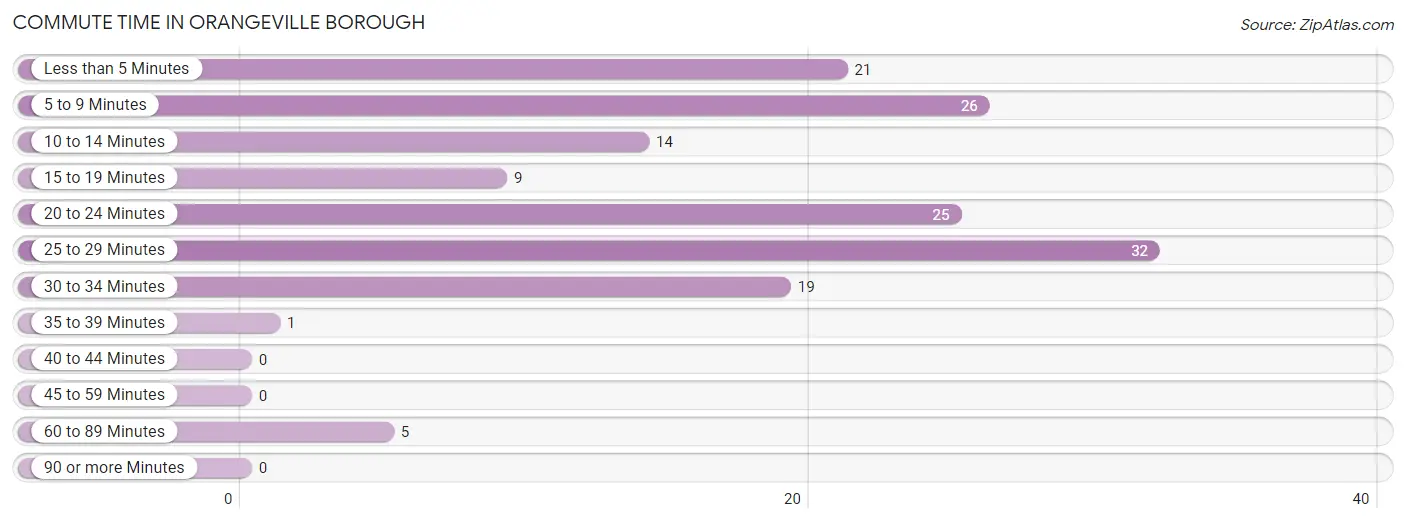
| Commute Time | # Commuters | % Commuters |
| Less than 5 Minutes | 21 | 13.8% |
| 5 to 9 Minutes | 26 | 17.1% |
| 10 to 14 Minutes | 14 | 9.2% |
| 15 to 19 Minutes | 9 | 5.9% |
| 20 to 24 Minutes | 25 | 16.5% |
| 25 to 29 Minutes | 32 | 21.0% |
| 30 to 34 Minutes | 19 | 12.5% |
| 35 to 39 Minutes | 1 | 0.7% |
| 40 to 44 Minutes | 0 | 0.0% |
| 45 to 59 Minutes | 0 | 0.0% |
| 60 to 89 Minutes | 5 | 3.3% |
| 90 or more Minutes | 0 | 0.0% |
Commute Time by Sex in Orangeville borough
The most common commute times in Orangeville borough are 5 to 9 minutes (14 commuters, 18.9%) for males and 25 to 29 minutes (21 commuters, 26.9%) for females.
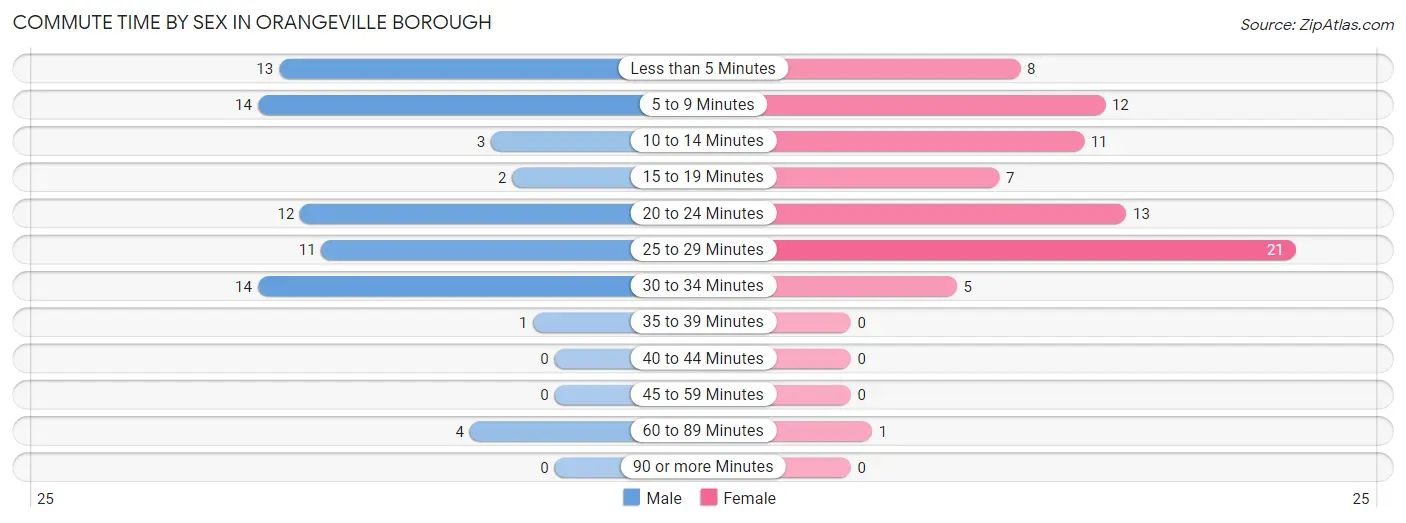
| Commute Time | Male | Female |
| Less than 5 Minutes | 13 (17.6%) | 8 (10.3%) |
| 5 to 9 Minutes | 14 (18.9%) | 12 (15.4%) |
| 10 to 14 Minutes | 3 (4.1%) | 11 (14.1%) |
| 15 to 19 Minutes | 2 (2.7%) | 7 (9.0%) |
| 20 to 24 Minutes | 12 (16.2%) | 13 (16.7%) |
| 25 to 29 Minutes | 11 (14.9%) | 21 (26.9%) |
| 30 to 34 Minutes | 14 (18.9%) | 5 (6.4%) |
| 35 to 39 Minutes | 1 (1.3%) | 0 (0.0%) |
| 40 to 44 Minutes | 0 (0.0%) | 0 (0.0%) |
| 45 to 59 Minutes | 0 (0.0%) | 0 (0.0%) |
| 60 to 89 Minutes | 4 (5.4%) | 1 (1.3%) |
| 90 or more Minutes | 0 (0.0%) | 0 (0.0%) |
Time of Departure to Work by Sex in Orangeville borough
The most frequent times of departure to work in Orangeville borough are 7:30 AM to 7:59 AM (21, 28.4%) for males and 6:30 AM to 6:59 AM (24, 30.8%) for females.
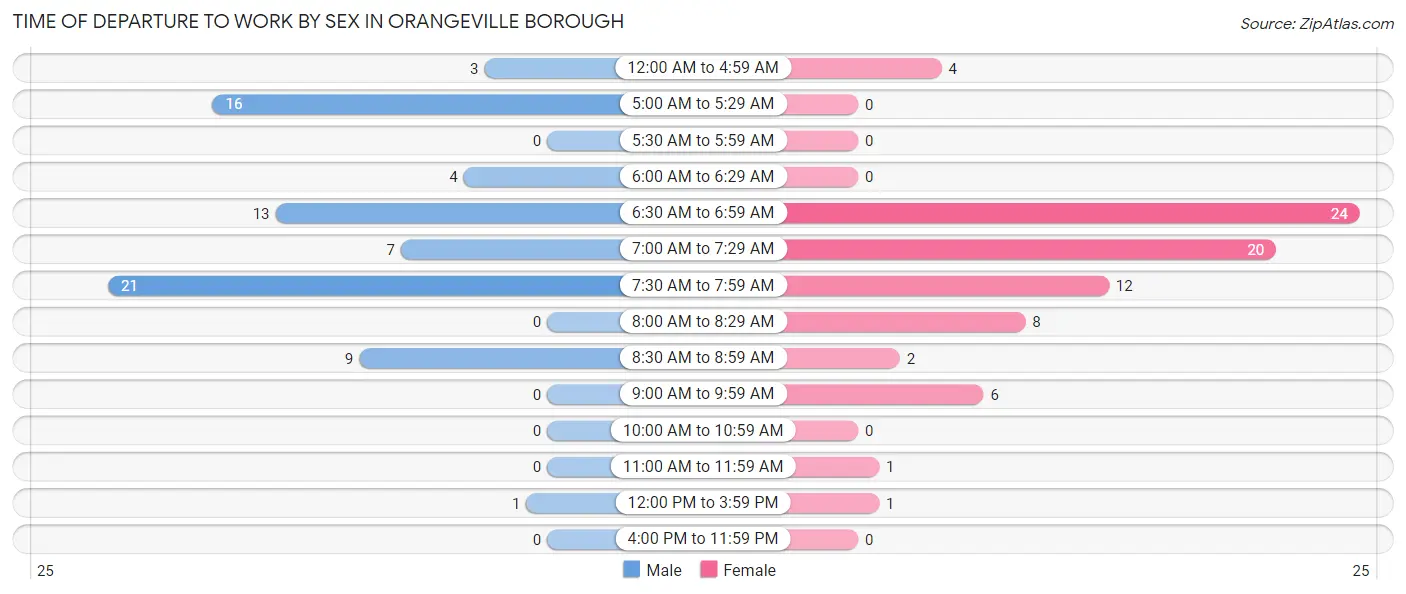
| Time of Departure | Male | Female |
| 12:00 AM to 4:59 AM | 3 (4.1%) | 4 (5.1%) |
| 5:00 AM to 5:29 AM | 16 (21.6%) | 0 (0.0%) |
| 5:30 AM to 5:59 AM | 0 (0.0%) | 0 (0.0%) |
| 6:00 AM to 6:29 AM | 4 (5.4%) | 0 (0.0%) |
| 6:30 AM to 6:59 AM | 13 (17.6%) | 24 (30.8%) |
| 7:00 AM to 7:29 AM | 7 (9.5%) | 20 (25.6%) |
| 7:30 AM to 7:59 AM | 21 (28.4%) | 12 (15.4%) |
| 8:00 AM to 8:29 AM | 0 (0.0%) | 8 (10.3%) |
| 8:30 AM to 8:59 AM | 9 (12.2%) | 2 (2.6%) |
| 9:00 AM to 9:59 AM | 0 (0.0%) | 6 (7.7%) |
| 10:00 AM to 10:59 AM | 0 (0.0%) | 0 (0.0%) |
| 11:00 AM to 11:59 AM | 0 (0.0%) | 1 (1.3%) |
| 12:00 PM to 3:59 PM | 1 (1.3%) | 1 (1.3%) |
| 4:00 PM to 11:59 PM | 0 (0.0%) | 0 (0.0%) |
| Total | 74 (100.0%) | 78 (100.0%) |
Housing Occupancy in Orangeville borough
Occupancy by Ownership in Orangeville borough
Of the total 102 dwellings in Orangeville borough, owner-occupied units account for 71 (69.6%), while renter-occupied units make up 31 (30.4%).
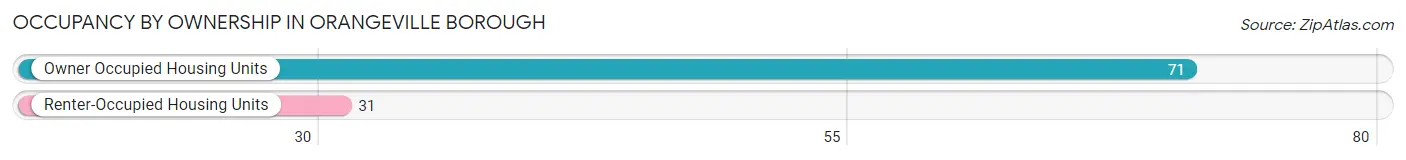
| Occupancy | # Housing Units | % Housing Units |
| Owner Occupied Housing Units | 71 | 69.6% |
| Renter-Occupied Housing Units | 31 | 30.4% |
| Total Occupied Housing Units | 102 | 100.0% |
Occupancy by Household Size in Orangeville borough
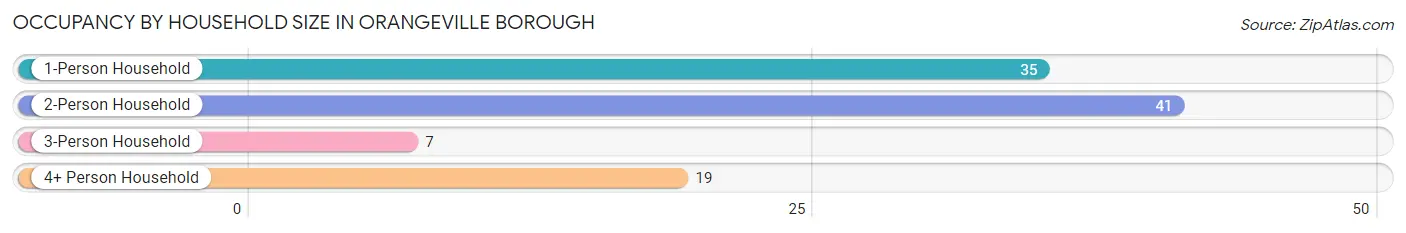
| Household Size | # Housing Units | % Housing Units |
| 1-Person Household | 35 | 34.3% |
| 2-Person Household | 41 | 40.2% |
| 3-Person Household | 7 | 6.9% |
| 4+ Person Household | 19 | 18.6% |
| Total Housing Units | 102 | 100.0% |
Occupancy by Ownership by Household Size in Orangeville borough
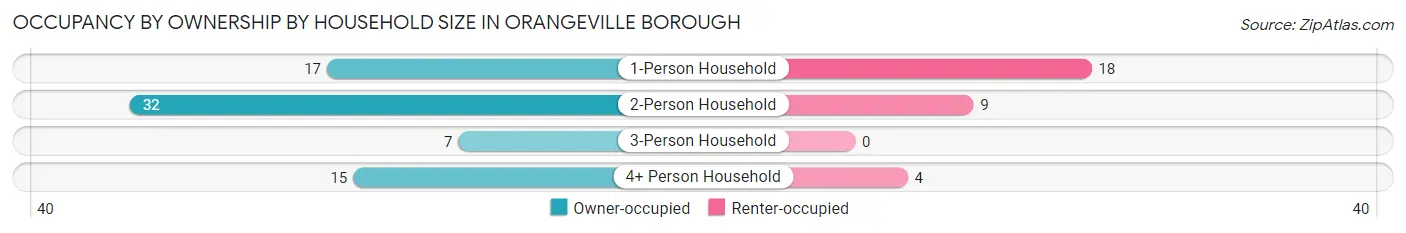
| Household Size | Owner-occupied | Renter-occupied |
| 1-Person Household | 17 (48.6%) | 18 (51.4%) |
| 2-Person Household | 32 (78.0%) | 9 (22.0%) |
| 3-Person Household | 7 (100.0%) | 0 (0.0%) |
| 4+ Person Household | 15 (78.9%) | 4 (21.0%) |
| Total Housing Units | 71 (69.6%) | 31 (30.4%) |
Occupancy by Educational Attainment in Orangeville borough
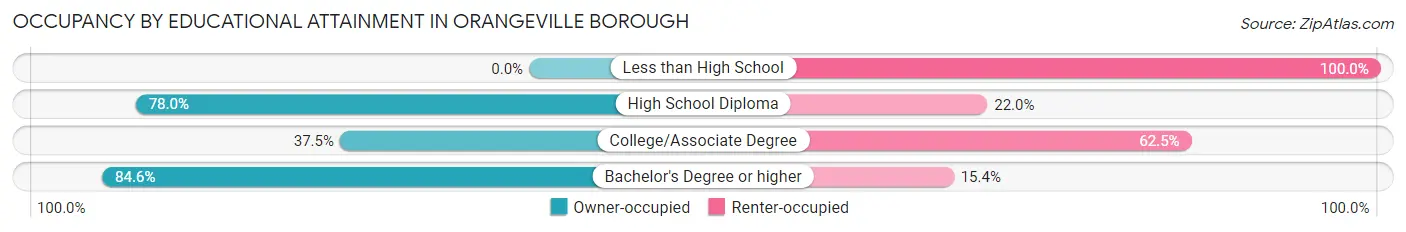
| Household Size | Owner-occupied | Renter-occupied |
| Less than High School | 0 (0.0%) | 9 (100.0%) |
| High School Diploma | 46 (78.0%) | 13 (22.0%) |
| College/Associate Degree | 3 (37.5%) | 5 (62.5%) |
| Bachelor's Degree or higher | 22 (84.6%) | 4 (15.4%) |
Occupancy by Age of Householder in Orangeville borough
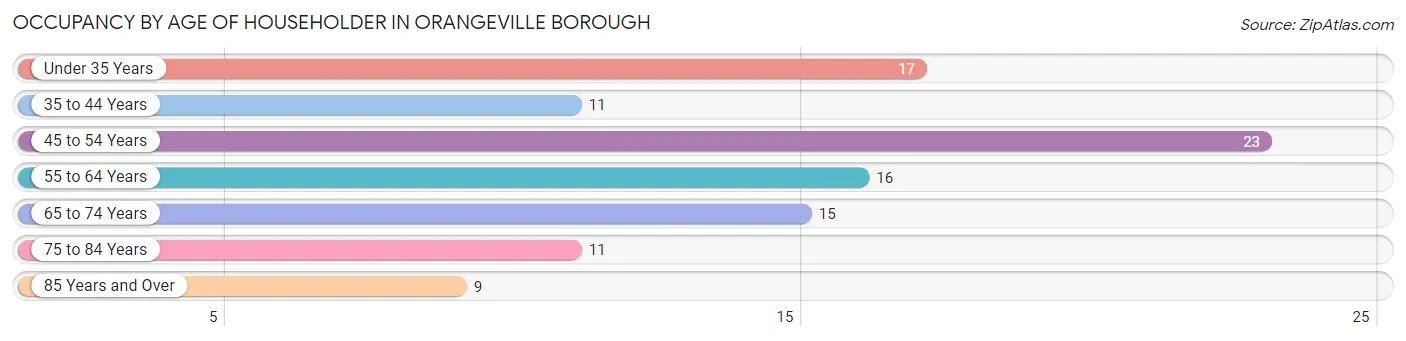
| Age Bracket | # Households | % Households |
| Under 35 Years | 17 | 16.7% |
| 35 to 44 Years | 11 | 10.8% |
| 45 to 54 Years | 23 | 22.6% |
| 55 to 64 Years | 16 | 15.7% |
| 65 to 74 Years | 15 | 14.7% |
| 75 to 84 Years | 11 | 10.8% |
| 85 Years and Over | 9 | 8.8% |
| Total | 102 | 100.0% |
Housing Finances in Orangeville borough
Median Income by Occupancy in Orangeville borough
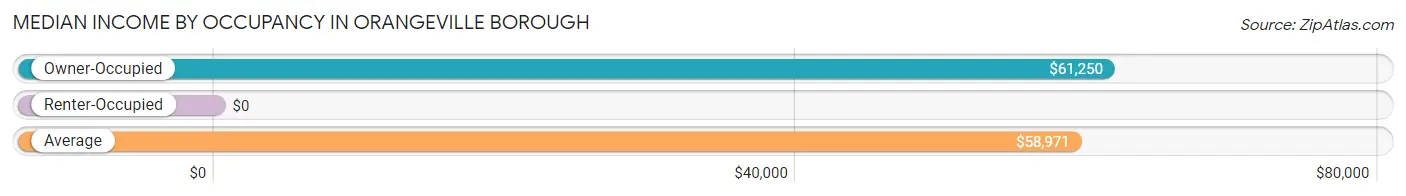
| Occupancy Type | # Households | Median Income |
| Owner-Occupied | 71 (69.6%) | $61,250 |
| Renter-Occupied | 31 (30.4%) | $0 |
| Average | 102 (100.0%) | $58,971 |
Occupancy by Householder Income Bracket in Orangeville borough
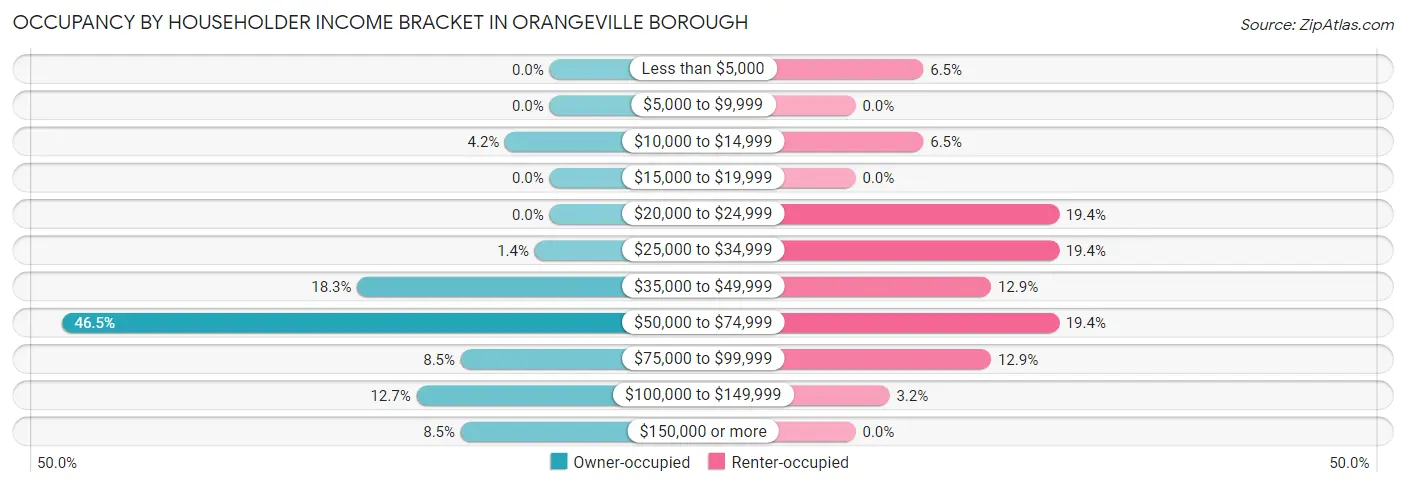
| Income Bracket | Owner-occupied | Renter-occupied |
| Less than $5,000 | 0 (0.0%) | 2 (6.5%) |
| $5,000 to $9,999 | 0 (0.0%) | 0 (0.0%) |
| $10,000 to $14,999 | 3 (4.2%) | 2 (6.5%) |
| $15,000 to $19,999 | 0 (0.0%) | 0 (0.0%) |
| $20,000 to $24,999 | 0 (0.0%) | 6 (19.4%) |
| $25,000 to $34,999 | 1 (1.4%) | 6 (19.4%) |
| $35,000 to $49,999 | 13 (18.3%) | 4 (12.9%) |
| $50,000 to $74,999 | 33 (46.5%) | 6 (19.4%) |
| $75,000 to $99,999 | 6 (8.5%) | 4 (12.9%) |
| $100,000 to $149,999 | 9 (12.7%) | 1 (3.2%) |
| $150,000 or more | 6 (8.5%) | 0 (0.0%) |
| Total | 71 (100.0%) | 31 (100.0%) |
Monthly Housing Cost Tiers in Orangeville borough
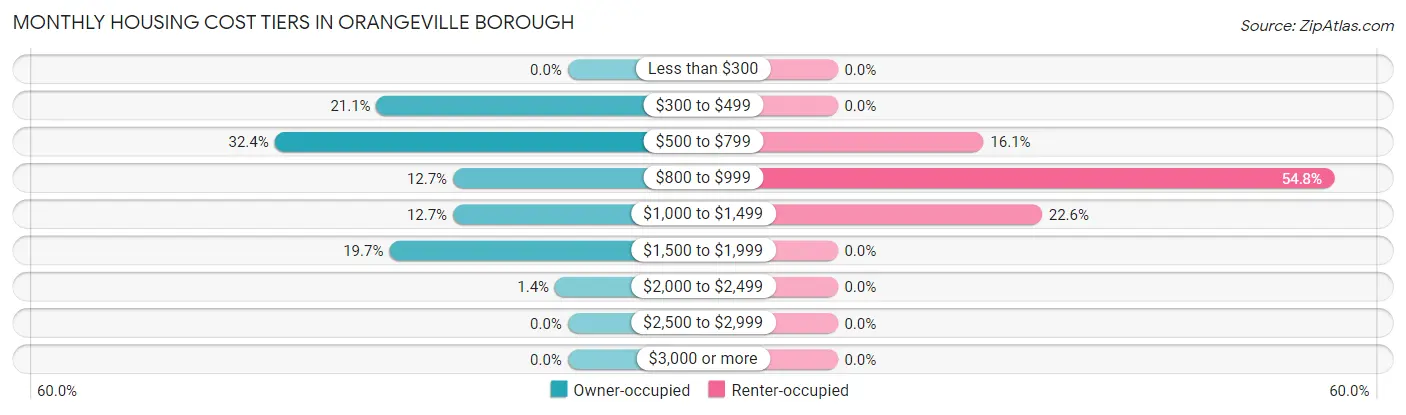
| Monthly Cost | Owner-occupied | Renter-occupied |
| Less than $300 | 0 (0.0%) | 0 (0.0%) |
| $300 to $499 | 15 (21.1%) | 0 (0.0%) |
| $500 to $799 | 23 (32.4%) | 5 (16.1%) |
| $800 to $999 | 9 (12.7%) | 17 (54.8%) |
| $1,000 to $1,499 | 9 (12.7%) | 7 (22.6%) |
| $1,500 to $1,999 | 14 (19.7%) | 0 (0.0%) |
| $2,000 to $2,499 | 1 (1.4%) | 0 (0.0%) |
| $2,500 to $2,999 | 0 (0.0%) | 0 (0.0%) |
| $3,000 or more | 0 (0.0%) | 0 (0.0%) |
| Total | 71 (100.0%) | 31 (100.0%) |
Physical Housing Characteristics in Orangeville borough
Housing Structures in Orangeville borough
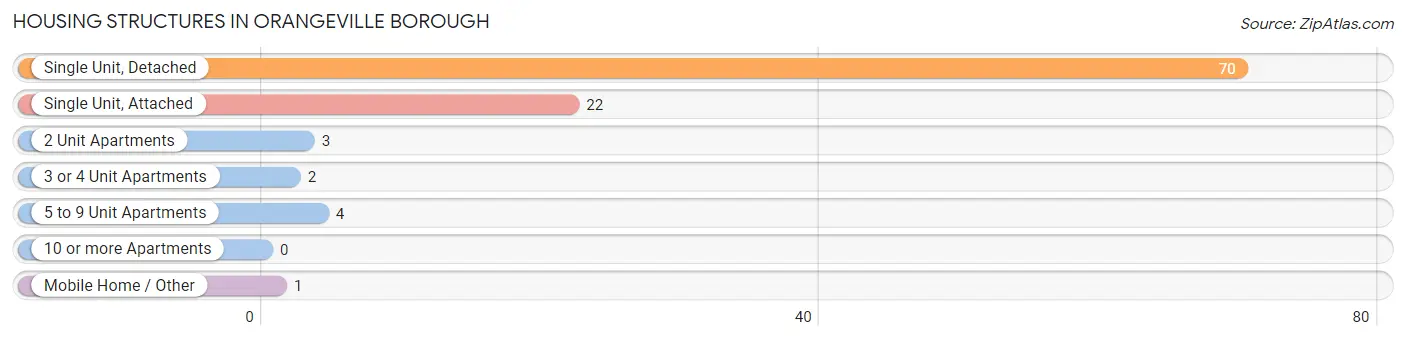
| Structure Type | # Housing Units | % Housing Units |
| Single Unit, Detached | 70 | 68.6% |
| Single Unit, Attached | 22 | 21.6% |
| 2 Unit Apartments | 3 | 2.9% |
| 3 or 4 Unit Apartments | 2 | 2.0% |
| 5 to 9 Unit Apartments | 4 | 3.9% |
| 10 or more Apartments | 0 | 0.0% |
| Mobile Home / Other | 1 | 1.0% |
| Total | 102 | 100.0% |
Housing Structures by Occupancy in Orangeville borough
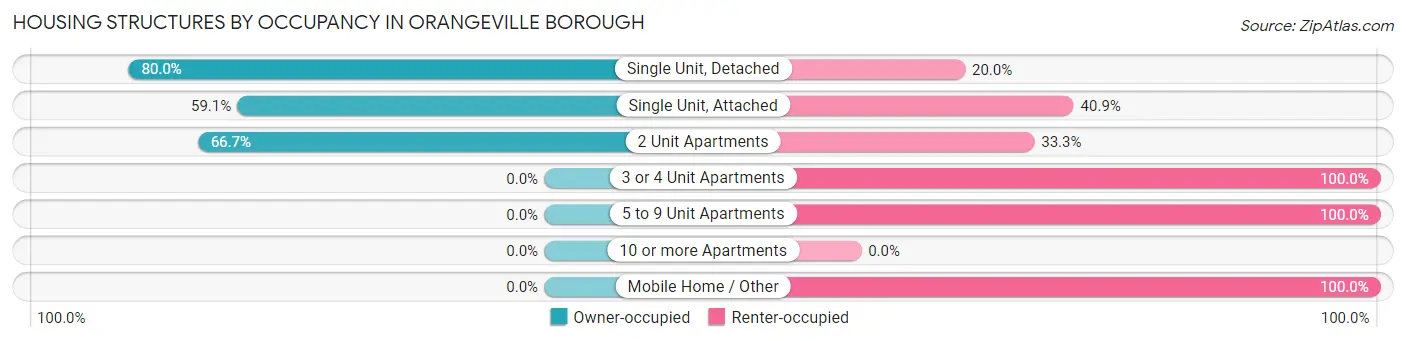
| Structure Type | Owner-occupied | Renter-occupied |
| Single Unit, Detached | 56 (80.0%) | 14 (20.0%) |
| Single Unit, Attached | 13 (59.1%) | 9 (40.9%) |
| 2 Unit Apartments | 2 (66.7%) | 1 (33.3%) |
| 3 or 4 Unit Apartments | 0 (0.0%) | 2 (100.0%) |
| 5 to 9 Unit Apartments | 0 (0.0%) | 4 (100.0%) |
| 10 or more Apartments | 0 (0.0%) | 0 (0.0%) |
| Mobile Home / Other | 0 (0.0%) | 1 (100.0%) |
| Total | 71 (69.6%) | 31 (30.4%) |
Housing Structures by Number of Rooms in Orangeville borough
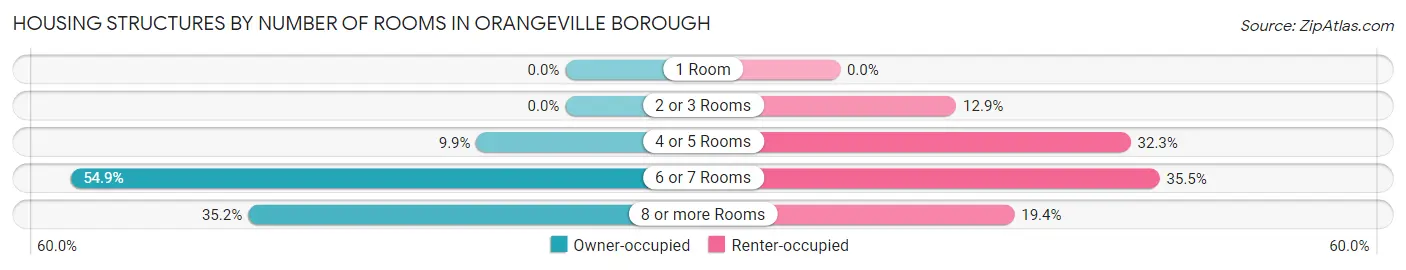
| Number of Rooms | Owner-occupied | Renter-occupied |
| 1 Room | 0 (0.0%) | 0 (0.0%) |
| 2 or 3 Rooms | 0 (0.0%) | 4 (12.9%) |
| 4 or 5 Rooms | 7 (9.9%) | 10 (32.3%) |
| 6 or 7 Rooms | 39 (54.9%) | 11 (35.5%) |
| 8 or more Rooms | 25 (35.2%) | 6 (19.4%) |
| Total | 71 (100.0%) | 31 (100.0%) |
Housing Structure by Heating Type in Orangeville borough
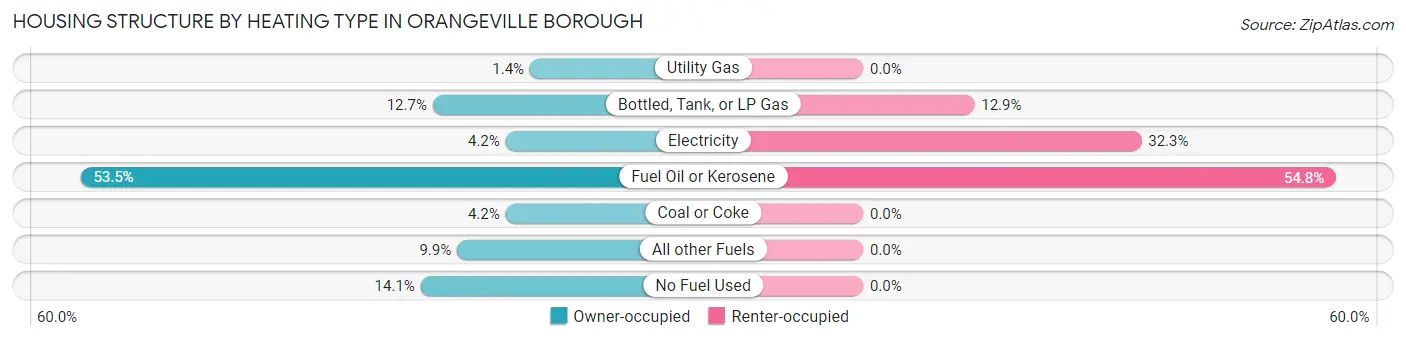
| Heating Type | Owner-occupied | Renter-occupied |
| Utility Gas | 1 (1.4%) | 0 (0.0%) |
| Bottled, Tank, or LP Gas | 9 (12.7%) | 4 (12.9%) |
| Electricity | 3 (4.2%) | 10 (32.3%) |
| Fuel Oil or Kerosene | 38 (53.5%) | 17 (54.8%) |
| Coal or Coke | 3 (4.2%) | 0 (0.0%) |
| All other Fuels | 7 (9.9%) | 0 (0.0%) |
| No Fuel Used | 10 (14.1%) | 0 (0.0%) |
| Total | 71 (100.0%) | 31 (100.0%) |
Household Vehicle Usage in Orangeville borough
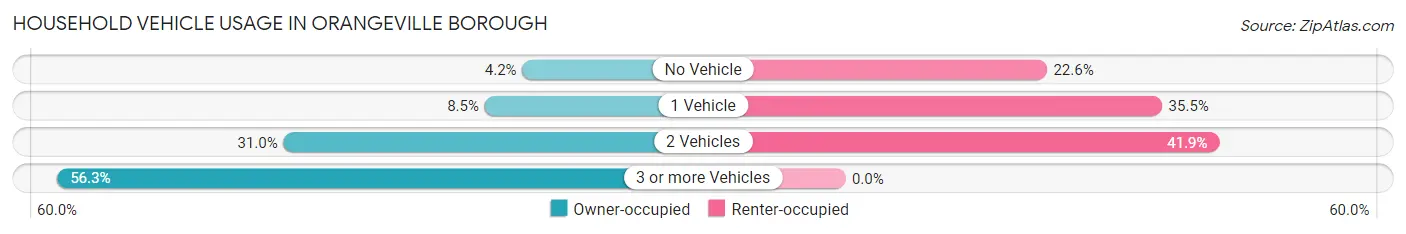
| Vehicles per Household | Owner-occupied | Renter-occupied |
| No Vehicle | 3 (4.2%) | 7 (22.6%) |
| 1 Vehicle | 6 (8.5%) | 11 (35.5%) |
| 2 Vehicles | 22 (31.0%) | 13 (41.9%) |
| 3 or more Vehicles | 40 (56.3%) | 0 (0.0%) |
| Total | 71 (100.0%) | 31 (100.0%) |
Real Estate & Mortgages in Orangeville borough
Real Estate and Mortgage Overview in Orangeville borough
| Characteristic | Without Mortgage | With Mortgage |
| Housing Units | 44 | 27 |
| Median Property Value | $207,100 | $156,700 |
| Median Household Income | $59,286 | $3 |
| Monthly Housing Costs | $554 | $0 |
| Real Estate Taxes | $2,250 | $0 |
Property Value by Mortgage Status in Orangeville borough
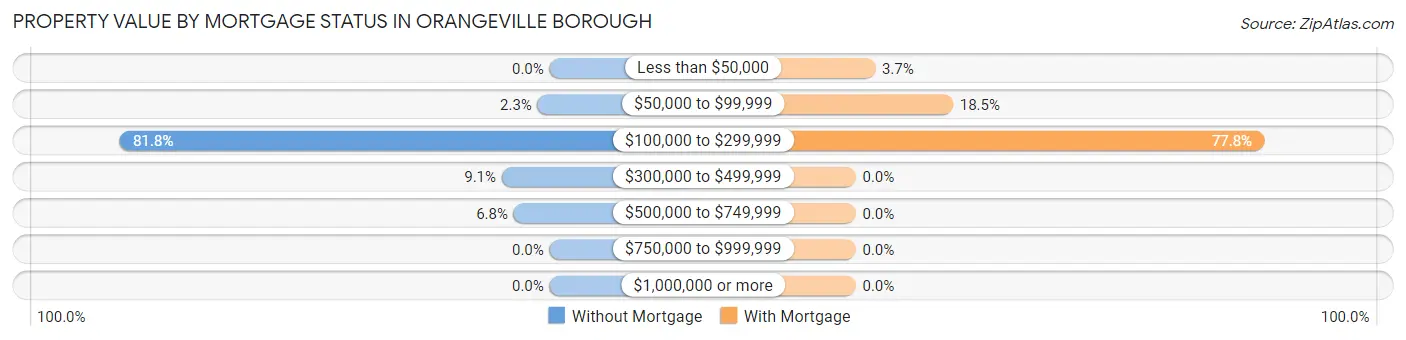
| Property Value | Without Mortgage | With Mortgage |
| Less than $50,000 | 0 (0.0%) | 1 (3.7%) |
| $50,000 to $99,999 | 1 (2.3%) | 5 (18.5%) |
| $100,000 to $299,999 | 36 (81.8%) | 21 (77.8%) |
| $300,000 to $499,999 | 4 (9.1%) | 0 (0.0%) |
| $500,000 to $749,999 | 3 (6.8%) | 0 (0.0%) |
| $750,000 to $999,999 | 0 (0.0%) | 0 (0.0%) |
| $1,000,000 or more | 0 (0.0%) | 0 (0.0%) |
| Total | 44 (100.0%) | 27 (100.0%) |
Household Income by Mortgage Status in Orangeville borough
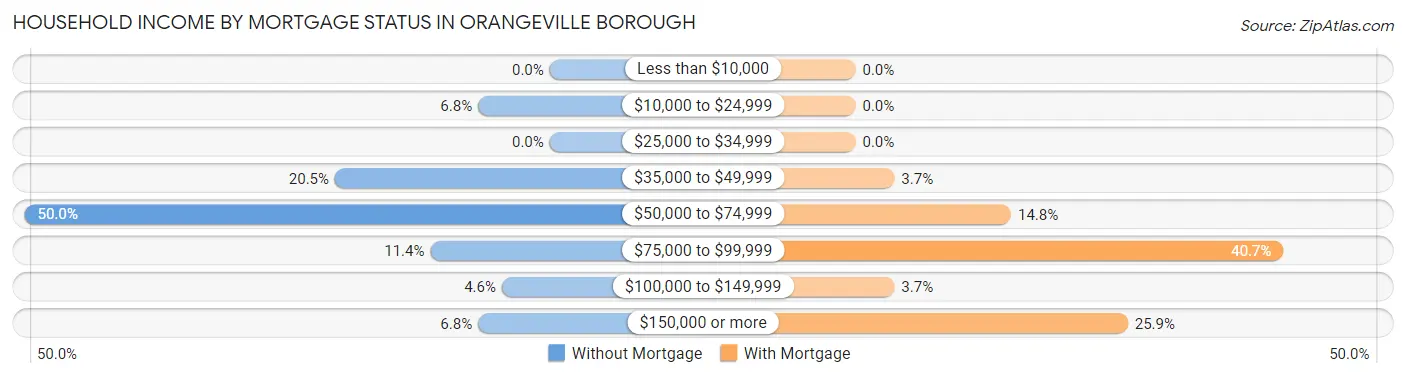
| Household Income | Without Mortgage | With Mortgage |
| Less than $10,000 | 0 (0.0%) | 0 (0.0%) |
| $10,000 to $24,999 | 3 (6.8%) | 0 (0.0%) |
| $25,000 to $34,999 | 0 (0.0%) | 0 (0.0%) |
| $35,000 to $49,999 | 9 (20.4%) | 1 (3.7%) |
| $50,000 to $74,999 | 22 (50.0%) | 4 (14.8%) |
| $75,000 to $99,999 | 5 (11.4%) | 11 (40.7%) |
| $100,000 to $149,999 | 2 (4.5%) | 1 (3.7%) |
| $150,000 or more | 3 (6.8%) | 7 (25.9%) |
| Total | 44 (100.0%) | 27 (100.0%) |
Property Value to Household Income Ratio in Orangeville borough
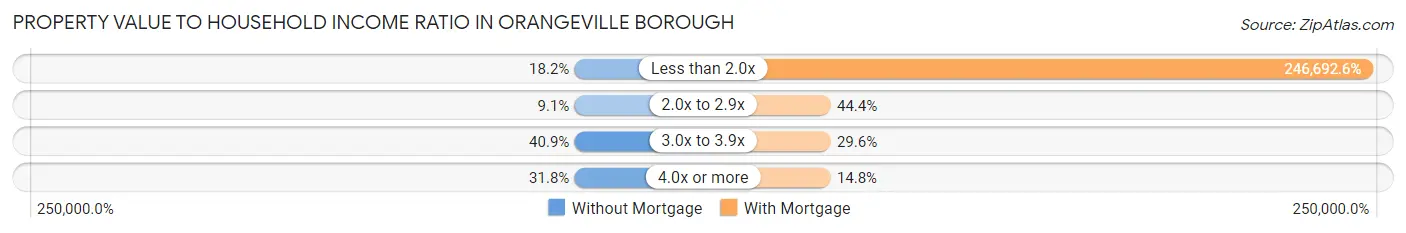
| Value-to-Income Ratio | Without Mortgage | With Mortgage |
| Less than 2.0x | 8 (18.2%) | 66,607 (246,692.6%) |
| 2.0x to 2.9x | 4 (9.1%) | 12 (44.4%) |
| 3.0x to 3.9x | 18 (40.9%) | 8 (29.6%) |
| 4.0x or more | 14 (31.8%) | 4 (14.8%) |
| Total | 44 (100.0%) | 27 (100.0%) |
Real Estate Taxes by Mortgage Status in Orangeville borough
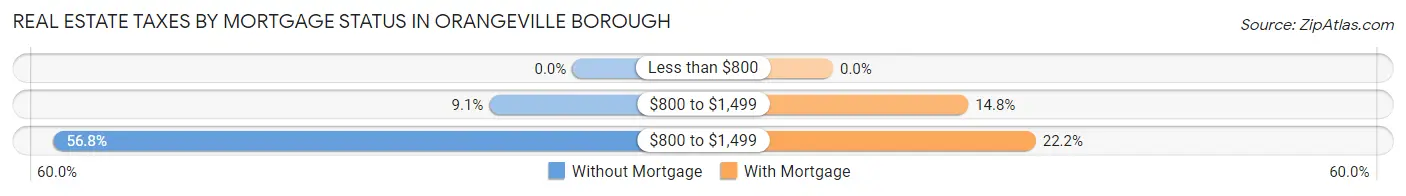
| Property Taxes | Without Mortgage | With Mortgage |
| Less than $800 | 0 (0.0%) | 0 (0.0%) |
| $800 to $1,499 | 4 (9.1%) | 4 (14.8%) |
| $800 to $1,499 | 25 (56.8%) | 6 (22.2%) |
| Total | 44 (100.0%) | 27 (100.0%) |
Health & Disability in Orangeville borough
Health Insurance Coverage by Age in Orangeville borough
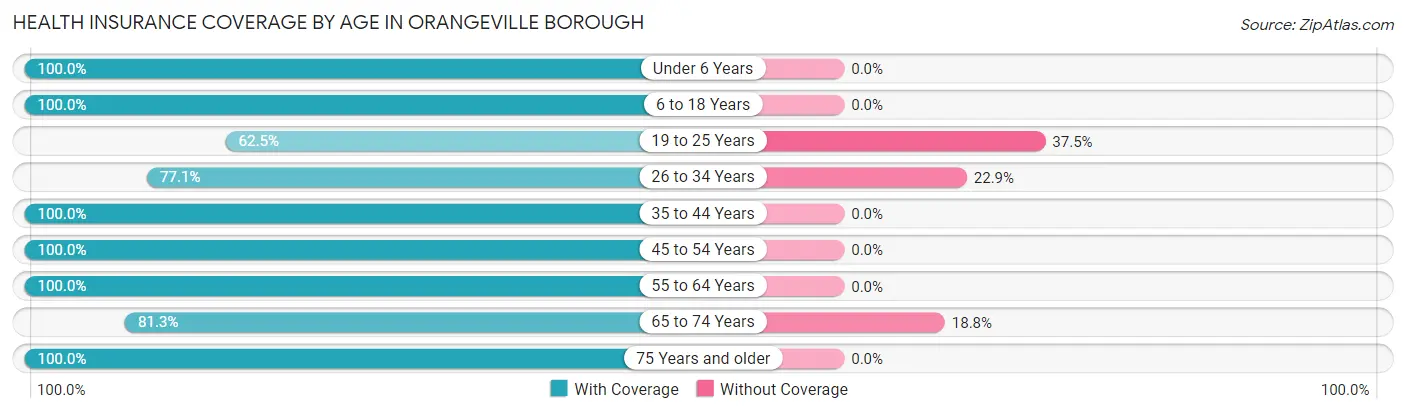
| Age Bracket | With Coverage | Without Coverage |
| Under 6 Years | 14 (100.0%) | 0 (0.0%) |
| 6 to 18 Years | 32 (100.0%) | 0 (0.0%) |
| 19 to 25 Years | 5 (62.5%) | 3 (37.5%) |
| 26 to 34 Years | 27 (77.1%) | 8 (22.9%) |
| 35 to 44 Years | 21 (100.0%) | 0 (0.0%) |
| 45 to 54 Years | 31 (100.0%) | 0 (0.0%) |
| 55 to 64 Years | 60 (100.0%) | 0 (0.0%) |
| 65 to 74 Years | 39 (81.2%) | 9 (18.8%) |
| 75 Years and older | 27 (100.0%) | 0 (0.0%) |
| Total | 256 (92.7%) | 20 (7.2%) |
Health Insurance Coverage by Citizenship Status in Orangeville borough
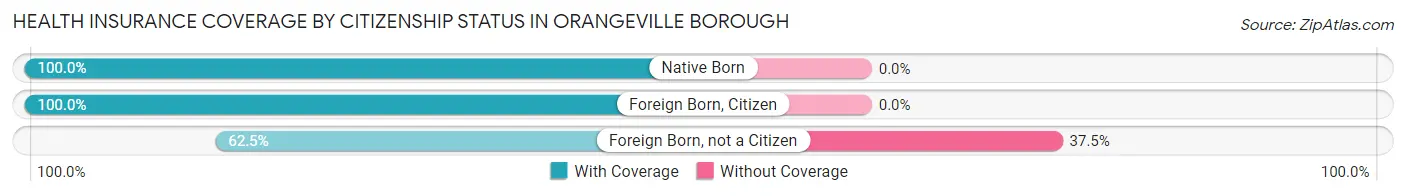
| Citizenship Status | With Coverage | Without Coverage |
| Native Born | 14 (100.0%) | 0 (0.0%) |
| Foreign Born, Citizen | 32 (100.0%) | 0 (0.0%) |
| Foreign Born, not a Citizen | 5 (62.5%) | 3 (37.5%) |
Health Insurance Coverage by Household Income in Orangeville borough
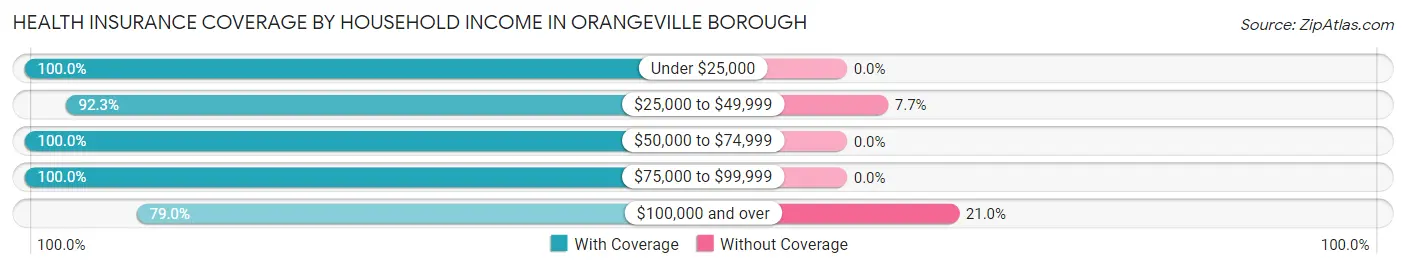
| Household Income | With Coverage | Without Coverage |
| Under $25,000 | 13 (100.0%) | 0 (0.0%) |
| $25,000 to $49,999 | 36 (92.3%) | 3 (7.7%) |
| $50,000 to $74,999 | 105 (100.0%) | 0 (0.0%) |
| $75,000 to $99,999 | 38 (100.0%) | 0 (0.0%) |
| $100,000 and over | 64 (79.0%) | 17 (21.0%) |
Public vs Private Health Insurance Coverage by Age in Orangeville borough
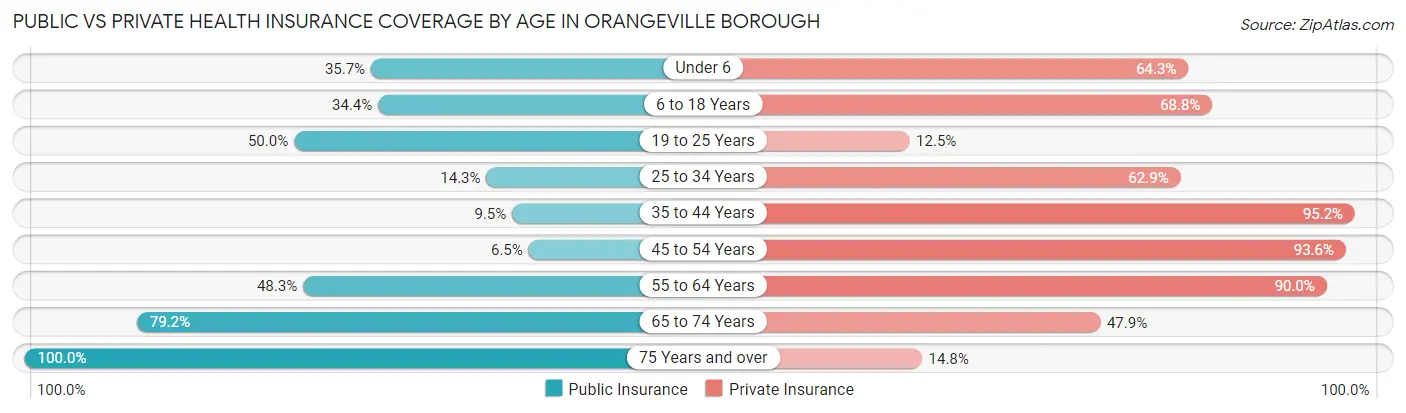
| Age Bracket | Public Insurance | Private Insurance |
| Under 6 | 5 (35.7%) | 9 (64.3%) |
| 6 to 18 Years | 11 (34.4%) | 22 (68.8%) |
| 19 to 25 Years | 4 (50.0%) | 1 (12.5%) |
| 25 to 34 Years | 5 (14.3%) | 22 (62.9%) |
| 35 to 44 Years | 2 (9.5%) | 20 (95.2%) |
| 45 to 54 Years | 2 (6.5%) | 29 (93.5%) |
| 55 to 64 Years | 29 (48.3%) | 54 (90.0%) |
| 65 to 74 Years | 38 (79.2%) | 23 (47.9%) |
| 75 Years and over | 27 (100.0%) | 4 (14.8%) |
| Total | 123 (44.6%) | 184 (66.7%) |
Disability Status by Sex by Age in Orangeville borough
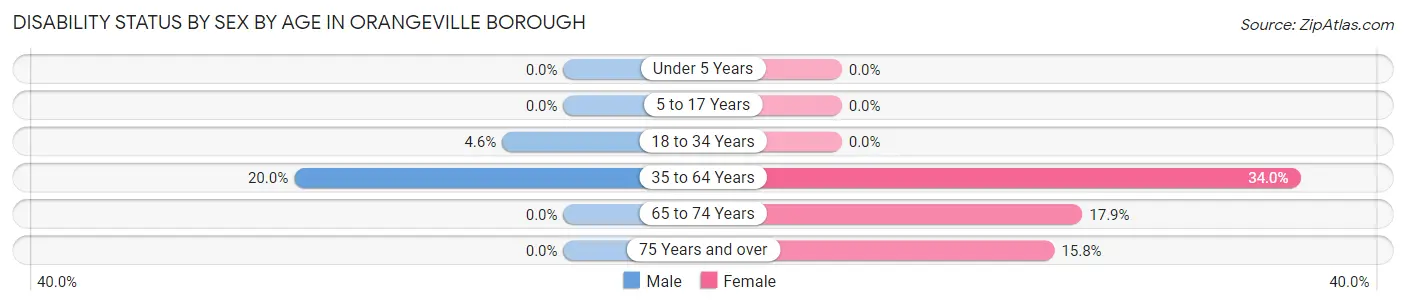
| Age Bracket | Male | Female |
| Under 5 Years | 0 (0.0%) | 0 (0.0%) |
| 5 to 17 Years | 0 (0.0%) | 0 (0.0%) |
| 18 to 34 Years | 1 (4.5%) | 0 (0.0%) |
| 35 to 64 Years | 13 (20.0%) | 16 (34.0%) |
| 65 to 74 Years | 0 (0.0%) | 5 (17.9%) |
| 75 Years and over | 0 (0.0%) | 3 (15.8%) |
Disability Class by Sex by Age in Orangeville borough
Disability Class: Hearing Difficulty
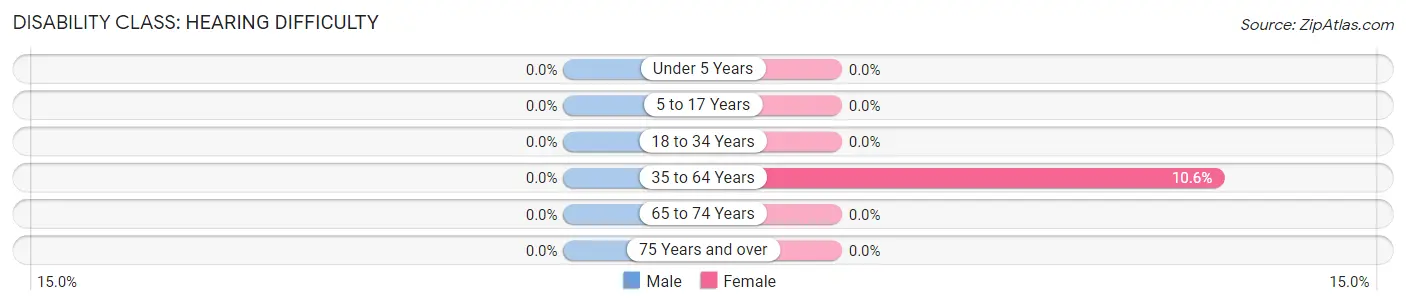
| Age Bracket | Male | Female |
| Under 5 Years | 0 (0.0%) | 0 (0.0%) |
| 5 to 17 Years | 0 (0.0%) | 0 (0.0%) |
| 18 to 34 Years | 0 (0.0%) | 0 (0.0%) |
| 35 to 64 Years | 0 (0.0%) | 5 (10.6%) |
| 65 to 74 Years | 0 (0.0%) | 0 (0.0%) |
| 75 Years and over | 0 (0.0%) | 0 (0.0%) |
Disability Class: Vision Difficulty
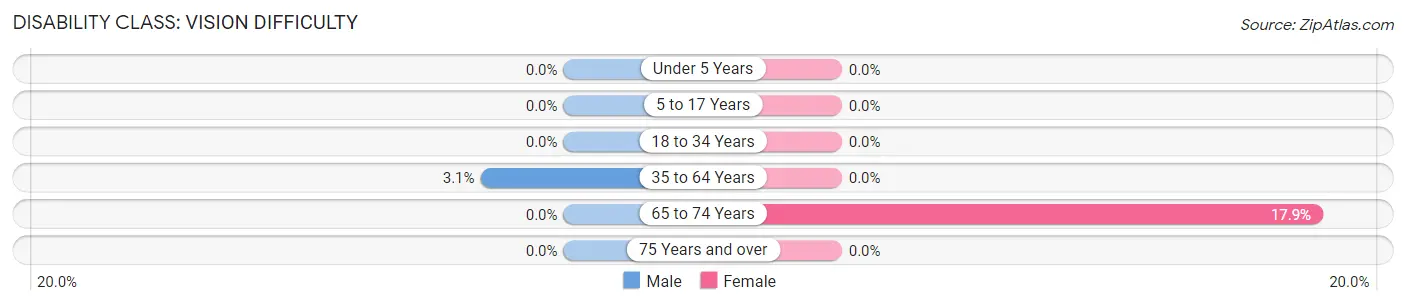
| Age Bracket | Male | Female |
| Under 5 Years | 0 (0.0%) | 0 (0.0%) |
| 5 to 17 Years | 0 (0.0%) | 0 (0.0%) |
| 18 to 34 Years | 0 (0.0%) | 0 (0.0%) |
| 35 to 64 Years | 2 (3.1%) | 0 (0.0%) |
| 65 to 74 Years | 0 (0.0%) | 5 (17.9%) |
| 75 Years and over | 0 (0.0%) | 0 (0.0%) |
Disability Class: Cognitive Difficulty
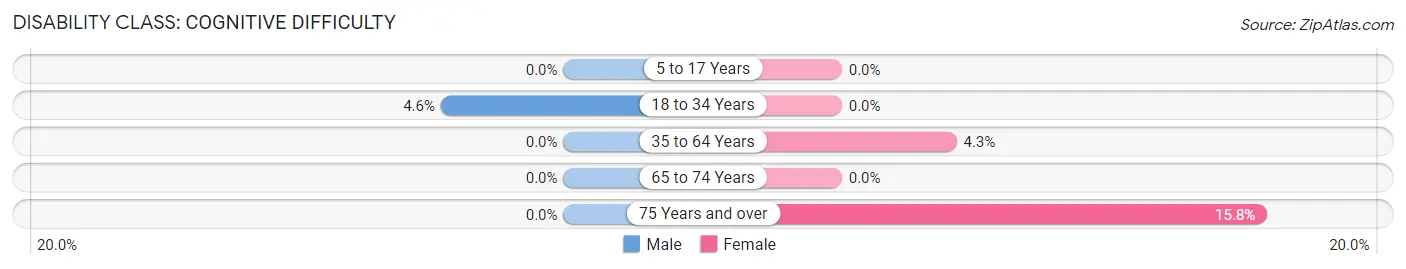
| Age Bracket | Male | Female |
| 5 to 17 Years | 0 (0.0%) | 0 (0.0%) |
| 18 to 34 Years | 1 (4.5%) | 0 (0.0%) |
| 35 to 64 Years | 0 (0.0%) | 2 (4.3%) |
| 65 to 74 Years | 0 (0.0%) | 0 (0.0%) |
| 75 Years and over | 0 (0.0%) | 3 (15.8%) |
Disability Class: Ambulatory Difficulty
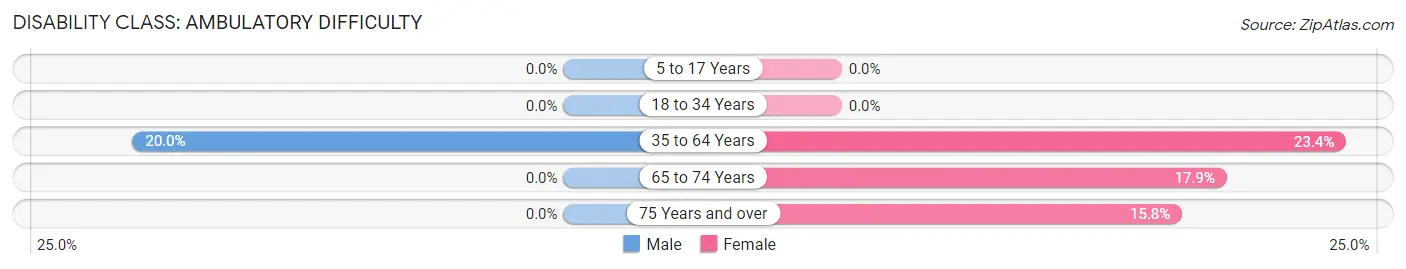
| Age Bracket | Male | Female |
| 5 to 17 Years | 0 (0.0%) | 0 (0.0%) |
| 18 to 34 Years | 0 (0.0%) | 0 (0.0%) |
| 35 to 64 Years | 13 (20.0%) | 11 (23.4%) |
| 65 to 74 Years | 0 (0.0%) | 5 (17.9%) |
| 75 Years and over | 0 (0.0%) | 3 (15.8%) |
Disability Class: Self-Care Difficulty
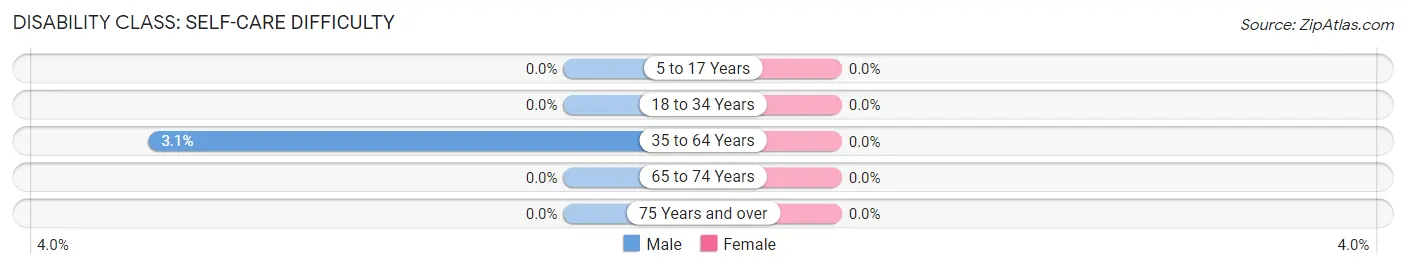
| Age Bracket | Male | Female |
| 5 to 17 Years | 0 (0.0%) | 0 (0.0%) |
| 18 to 34 Years | 0 (0.0%) | 0 (0.0%) |
| 35 to 64 Years | 2 (3.1%) | 0 (0.0%) |
| 65 to 74 Years | 0 (0.0%) | 0 (0.0%) |
| 75 Years and over | 0 (0.0%) | 0 (0.0%) |
Technology Access in Orangeville borough
Computing Device Access in Orangeville borough
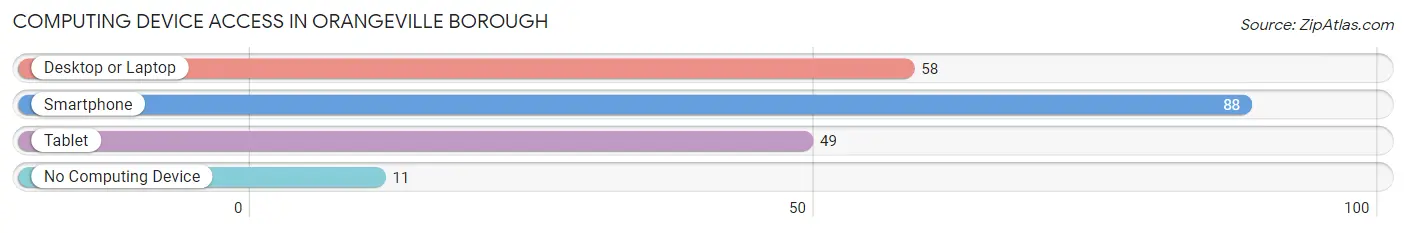
| Device Type | # Households | % Households |
| Desktop or Laptop | 58 | 56.9% |
| Smartphone | 88 | 86.3% |
| Tablet | 49 | 48.0% |
| No Computing Device | 11 | 10.8% |
| Total | 102 | 100.0% |
Internet Access in Orangeville borough
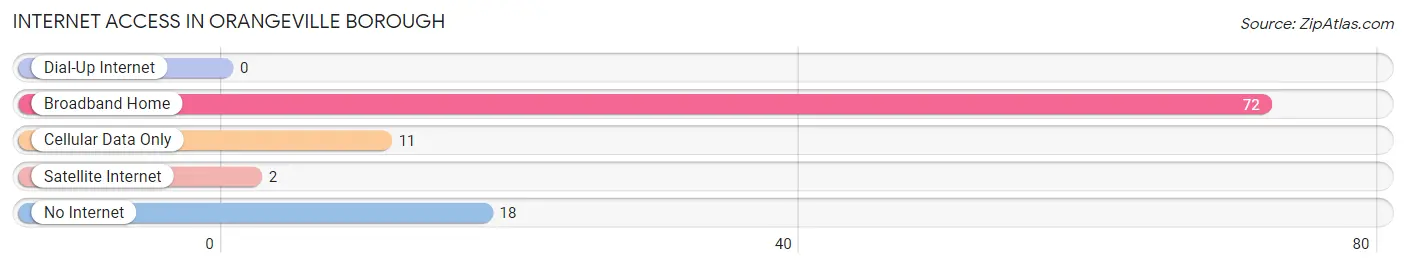
| Internet Type | # Households | % Households |
| Dial-Up Internet | 0 | 0.0% |
| Broadband Home | 72 | 70.6% |
| Cellular Data Only | 11 | 10.8% |
| Satellite Internet | 2 | 2.0% |
| No Internet | 18 | 17.6% |
| Total | 102 | 100.0% |
Orangeville borough Summary
Introduction
The Borough of Orangeville is located in Columbia County, Pennsylvania, United States. It is situated in the western part of the county, approximately 10 miles south of Bloomsburg. The borough was incorporated in 1872 and has a population of 1,845 as of the 2010 census. The borough is home to a variety of businesses, including a grocery store, a hardware store, a pharmacy, a bank, and several restaurants.
History
The area that is now Orangeville was first settled in the late 1700s by German immigrants. The first settler was John Miller, who arrived in 1790 and built a log cabin near the present-day intersection of Main and Orange Streets. The area was originally known as Millersburg, but the name was changed to Orangeville in 1872 when the borough was incorporated.
The borough was named after Orange Township, which was named after Orange County, New York. The name was chosen to honor the many settlers who had come from Orange County.
The first post office in Orangeville was established in 1873. The first school was built in 1876 and the first church was built in 1877. The first newspaper, the Orangeville Herald, was established in 1878.
Geography
Orangeville is located at 40°56'N 76°17'W (40.9333, -76.2833). It is situated in the western part of Columbia County, approximately 10 miles south of Bloomsburg. The borough has a total area of 0.6 square miles, all of which is land.
The borough is located in the Susquehanna River Valley, which is part of the Ridge and Valley physiographic province of the Appalachian Mountains. The terrain is mostly rolling hills, with some flat areas along the river. The borough is located in the Eastern Broadleaf Forest ecoregion.
Economy
The economy of Orangeville is largely based on agriculture and small businesses. The borough is home to a variety of businesses, including a grocery store, a hardware store, a pharmacy, a bank, and several restaurants.
The borough is also home to several manufacturing companies, including a plastics manufacturer, a metal fabricator, and a printing company. The borough is also home to a number of small businesses, including a bakery, a florist, a furniture store, and a gift shop.
Demographics
As of the 2010 census, the borough had a population of 1,845. The racial makeup of the borough was 97.2% White, 0.7% African American, 0.2% Native American, 0.3% Asian, 0.2% from other races, and 1.4% from two or more races. Hispanic or Latino of any race were 1.2% of the population.
The median household income in the borough was $41,250, and the median family income was $50,000. The per capita income was $20,945. About 8.3% of families and 10.2% of the population were below the poverty line, including 14.2% of those under age 18 and 6.2% of those age 65 or over.
Conclusion
Orangeville is a small borough located in Columbia County, Pennsylvania. It was incorporated in 1872 and has a population of 1,845 as of the 2010 census. The borough is home to a variety of businesses, including a grocery store, a hardware store, a pharmacy, a bank, and several restaurants. The economy of Orangeville is largely based on agriculture and small businesses. The racial makeup of the borough is predominantly White, with a small percentage of African American, Native American, and Asian residents. The median household income in the borough is $41,250, and the median family income is $50,000.
Common Questions
What is Per Capita Income in Orangeville borough?
Per Capita income in Orangeville borough is $22,860.
What is the Median Family Income in Orangeville borough?
Median Family Income in Orangeville borough is $68,125.
What is the Median Household income in Orangeville borough?
Median Household Income in Orangeville borough is $58,971.
What is Income or Wage Gap in Orangeville borough?
Income or Wage Gap in Orangeville borough is 59.6%.
Women in Orangeville borough earn 40.4 cents for every dollar earned by a man.
What is Inequality or Gini Index in Orangeville borough?
Inequality or Gini Index in Orangeville borough is 0.31.
What is the Total Population of Orangeville borough?
Total Population of Orangeville borough is 404.
What is the Total Male Population of Orangeville borough?
Total Male Population of Orangeville borough is 197.
What is the Total Female Population of Orangeville borough?
Total Female Population of Orangeville borough is 207.
What is the Ratio of Males per 100 Females in Orangeville borough?
There are 95.17 Males per 100 Females in Orangeville borough.
What is the Ratio of Females per 100 Males in Orangeville borough?
There are 105.08 Females per 100 Males in Orangeville borough.
What is the Median Population Age in Orangeville borough?
Median Population Age in Orangeville borough is 59.8 Years.
What is the Average Family Size in Orangeville borough
Average Family Size in Orangeville borough is 3.5 People.
What is the Average Household Size in Orangeville borough
Average Household Size in Orangeville borough is 2.7 People.
How Large is the Labor Force in Orangeville borough?
There are 169 People in the Labor Forcein in Orangeville borough.
What is the Percentage of People in the Labor Force in Orangeville borough?
46.9% of People are in the Labor Force in Orangeville borough.
What is the Unemployment Rate in Orangeville borough?
Unemployment Rate in Orangeville borough is 5.3%.