Lamar, PA Map & Demographics
Lamar Map
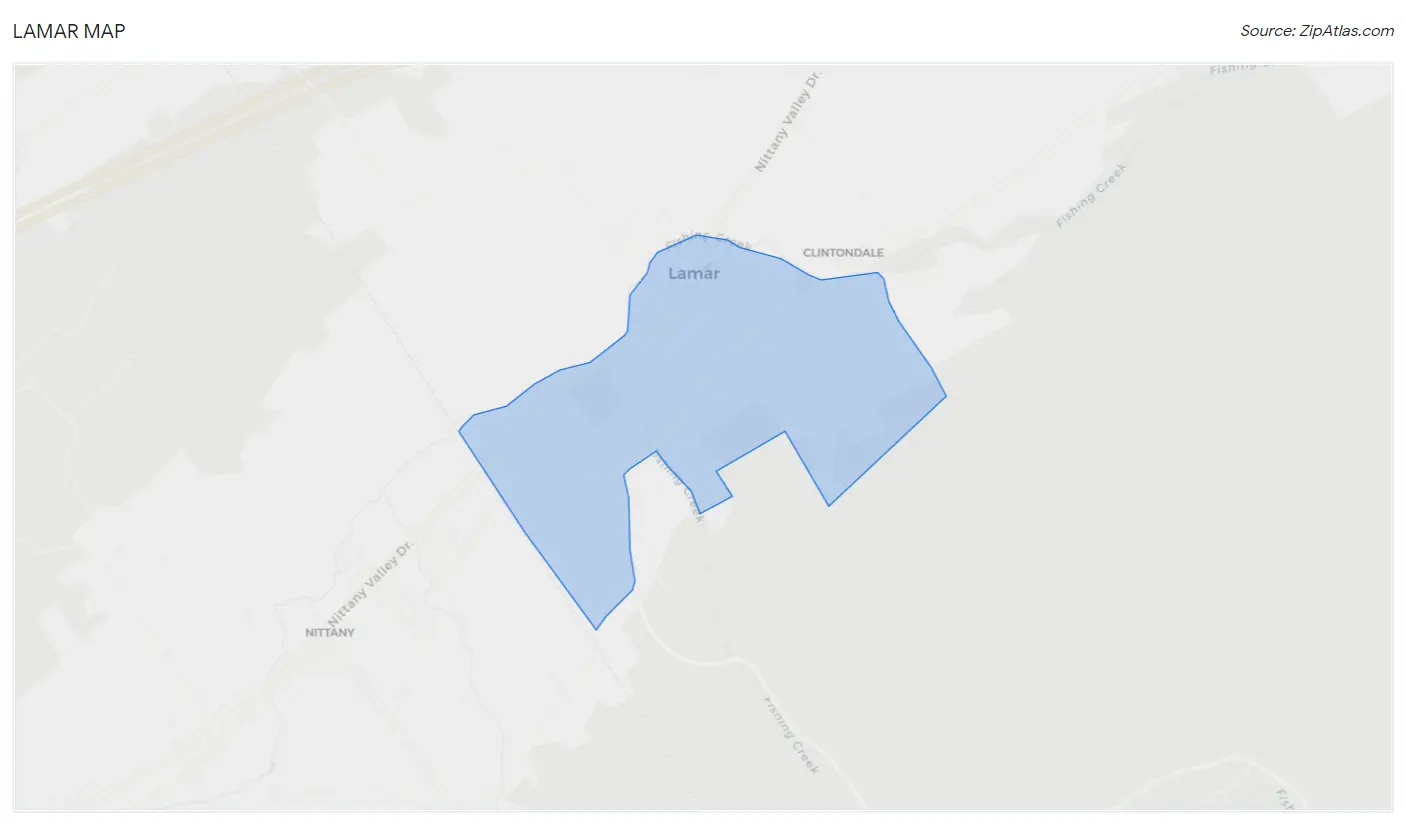
Lamar Overview
$34,501
PER CAPITA INCOME
$83,750
AVG FAMILY INCOME
$71,875
AVG HOUSEHOLD INCOME
30.9%
WAGE / INCOME GAP [ % ]
69.1¢/ $1
WAGE / INCOME GAP [ $ ]
0.31
INEQUALITY / GINI INDEX
641
TOTAL POPULATION
328
MALE POPULATION
313
FEMALE POPULATION
104.79
MALES / 100 FEMALES
95.43
FEMALES / 100 MALES
42.4
MEDIAN AGE
2.7
AVG FAMILY SIZE
2.4
AVG HOUSEHOLD SIZE
382
LABOR FORCE [ PEOPLE ]
75.6%
PERCENT IN LABOR FORCE
6.3%
UNEMPLOYMENT RATE
Lamar Zip Codes
Lamar Area Codes
Income in Lamar
Income Overview in Lamar
Per Capita Income in Lamar is $34,501, while median incomes of families and households are $83,750 and $71,875 respectively.
| Characteristic | Number | Measure |
| Per Capita Income | 641 | $34,501 |
| Median Family Income | 172 | $83,750 |
| Mean Family Income | 172 | $87,338 |
| Median Household Income | 265 | $71,875 |
| Mean Household Income | 265 | $82,467 |
| Income Deficit | 172 | $0 |
| Wage / Income Gap (%) | 641 | 30.91% |
| Wage / Income Gap ($) | 641 | 69.09¢ per $1 |
| Gini / Inequality Index | 641 | 0.31 |
Earnings by Sex in Lamar
Average Earnings in Lamar are $48,750, $56,667 for men and $39,152 for women, a difference of 30.9%.
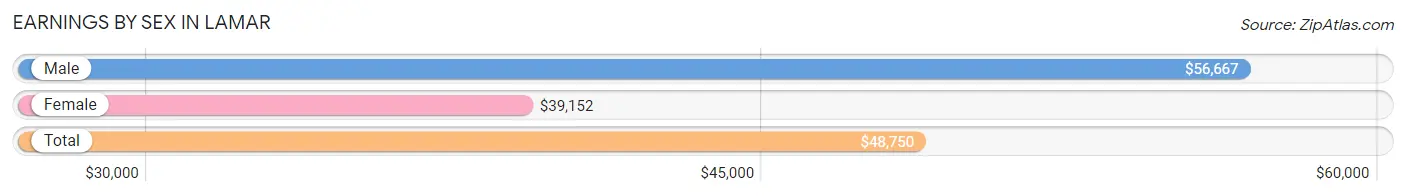
| Sex | Number | Average Earnings |
| Male | 200 (53.3%) | $56,667 |
| Female | 175 (46.7%) | $39,152 |
| Total | 375 (100.0%) | $48,750 |
Earnings by Sex by Income Bracket in Lamar
The most common earnings brackets in Lamar are $55,000 to $64,999 for men (38 | 19.0%) and $35,000 to $39,999 for women (28 | 16.0%).
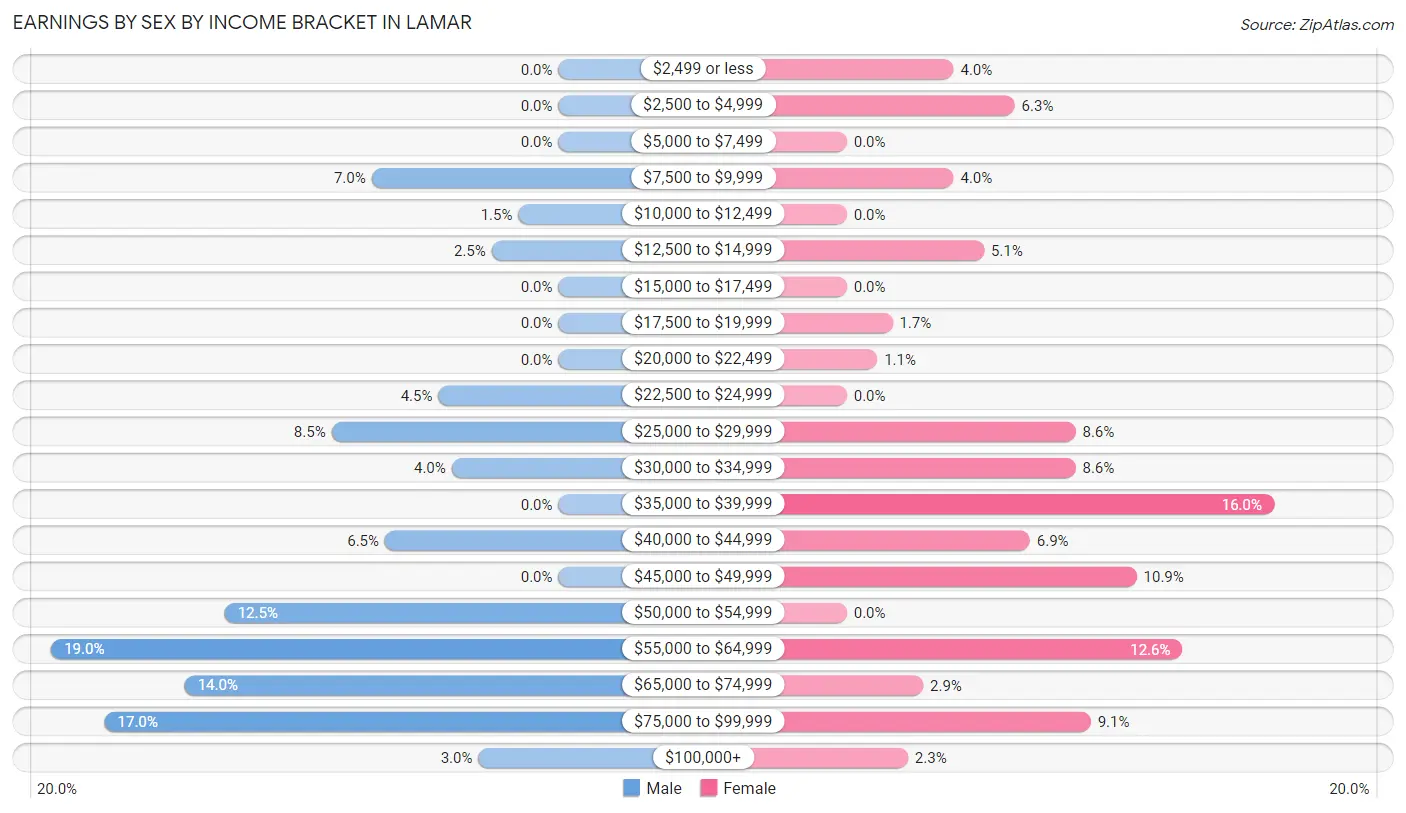
| Income | Male | Female |
| $2,499 or less | 0 (0.0%) | 7 (4.0%) |
| $2,500 to $4,999 | 0 (0.0%) | 11 (6.3%) |
| $5,000 to $7,499 | 0 (0.0%) | 0 (0.0%) |
| $7,500 to $9,999 | 14 (7.0%) | 7 (4.0%) |
| $10,000 to $12,499 | 3 (1.5%) | 0 (0.0%) |
| $12,500 to $14,999 | 5 (2.5%) | 9 (5.1%) |
| $15,000 to $17,499 | 0 (0.0%) | 0 (0.0%) |
| $17,500 to $19,999 | 0 (0.0%) | 3 (1.7%) |
| $20,000 to $22,499 | 0 (0.0%) | 2 (1.1%) |
| $22,500 to $24,999 | 9 (4.5%) | 0 (0.0%) |
| $25,000 to $29,999 | 17 (8.5%) | 15 (8.6%) |
| $30,000 to $34,999 | 8 (4.0%) | 15 (8.6%) |
| $35,000 to $39,999 | 0 (0.0%) | 28 (16.0%) |
| $40,000 to $44,999 | 13 (6.5%) | 12 (6.9%) |
| $45,000 to $49,999 | 0 (0.0%) | 19 (10.9%) |
| $50,000 to $54,999 | 25 (12.5%) | 0 (0.0%) |
| $55,000 to $64,999 | 38 (19.0%) | 22 (12.6%) |
| $65,000 to $74,999 | 28 (14.0%) | 5 (2.9%) |
| $75,000 to $99,999 | 34 (17.0%) | 16 (9.1%) |
| $100,000+ | 6 (3.0%) | 4 (2.3%) |
| Total | 200 (100.0%) | 175 (100.0%) |
Earnings by Sex by Educational Attainment in Lamar
Average earnings in Lamar are $58,750 for men and $39,866 for women, a difference of 32.1%. Men with an educational attainment of college or associate's degree enjoy the highest average annual earnings of $63,958, while those with high school diploma education earn the least with $53,750. Women with an educational attainment of college or associate's degree earn the most with the average annual earnings of $55,625, while those with high school diploma education have the smallest earnings of $31,250.
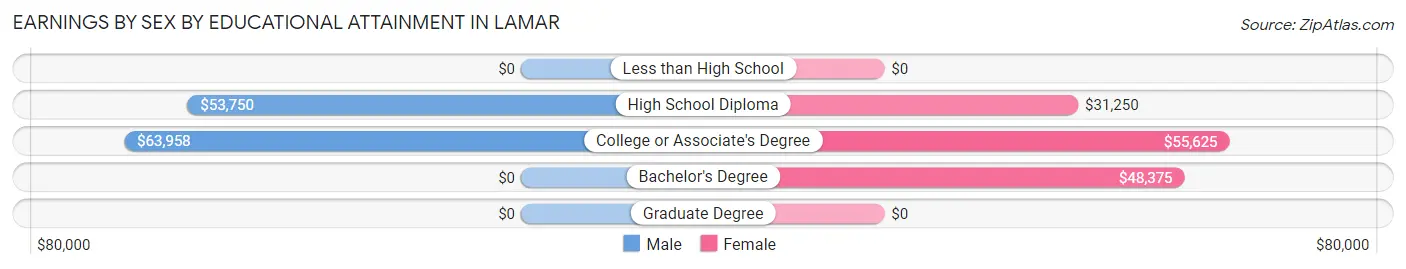
| Educational Attainment | Male Income | Female Income |
| Less than High School | - | - |
| High School Diploma | $53,750 | $31,250 |
| College or Associate's Degree | $63,958 | $55,625 |
| Bachelor's Degree | - | - |
| Graduate Degree | - | - |
| Total | $58,750 | $39,866 |
Family Income in Lamar
Family Income Brackets in Lamar
According to the Lamar family income data, there are 73 families falling into the $75,000 to $99,999 income range, which is the most common income bracket and makes up 42.4% of all families.
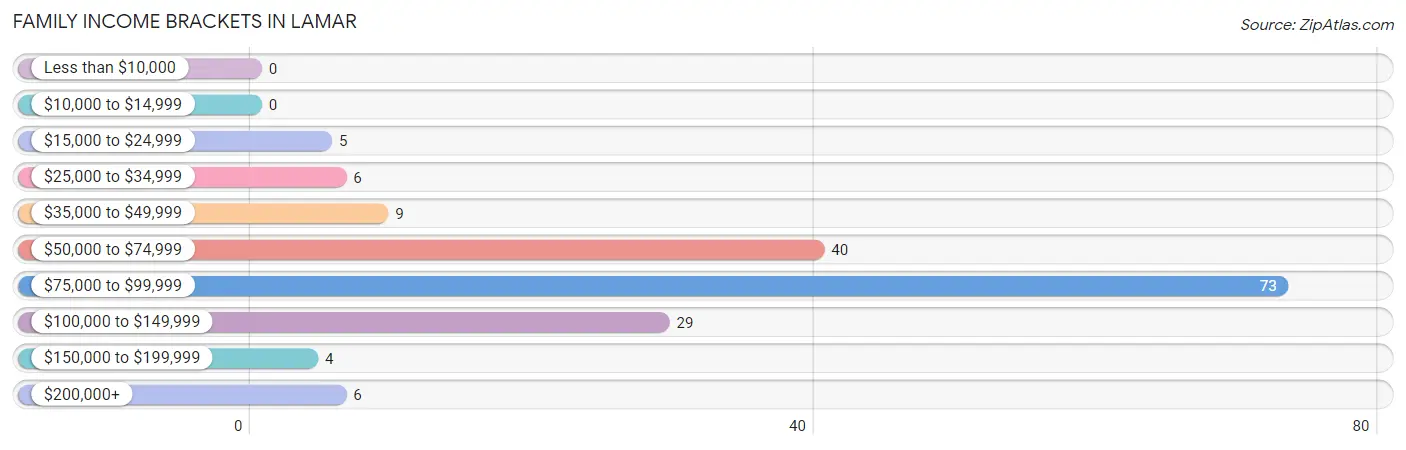
| Income Bracket | # Families | % Families |
| Less than $10,000 | 0 | 0.0% |
| $10,000 to $14,999 | 0 | 0.0% |
| $15,000 to $24,999 | 5 | 2.9% |
| $25,000 to $34,999 | 6 | 3.5% |
| $35,000 to $49,999 | 9 | 5.2% |
| $50,000 to $74,999 | 40 | 23.3% |
| $75,000 to $99,999 | 73 | 42.4% |
| $100,000 to $149,999 | 29 | 16.9% |
| $150,000 to $199,999 | 4 | 2.3% |
| $200,000+ | 6 | 3.5% |
Family Income by Famaliy Size in Lamar
2-person families (119 | 69.2%) account for the highest median family income in Lamar with $85,288 per family, while 2-person families (119 | 69.2%) have the highest median income of $42,644 per family member.
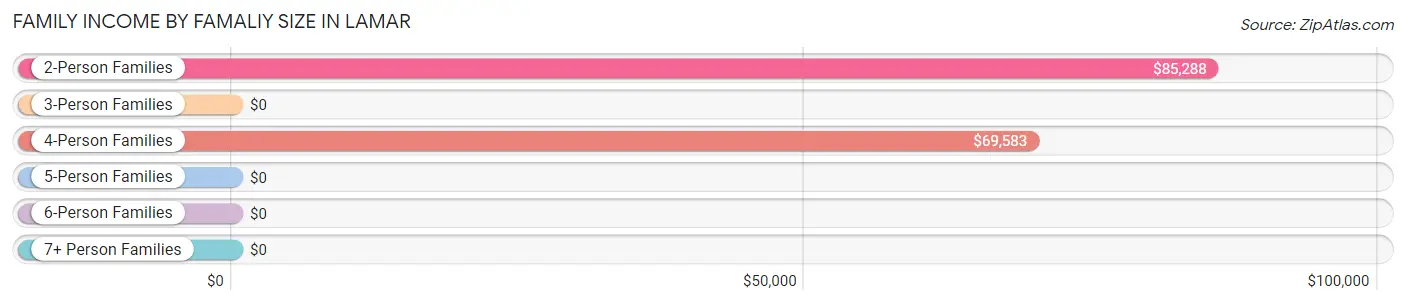
| Income Bracket | # Families | Median Income |
| 2-Person Families | 119 (69.2%) | $85,288 |
| 3-Person Families | 25 (14.5%) | $0 |
| 4-Person Families | 17 (9.9%) | $69,583 |
| 5-Person Families | 0 (0.0%) | $0 |
| 6-Person Families | 11 (6.4%) | $0 |
| 7+ Person Families | 0 (0.0%) | $0 |
| Total | 172 (100.0%) | $83,750 |
Family Income by Number of Earners in Lamar
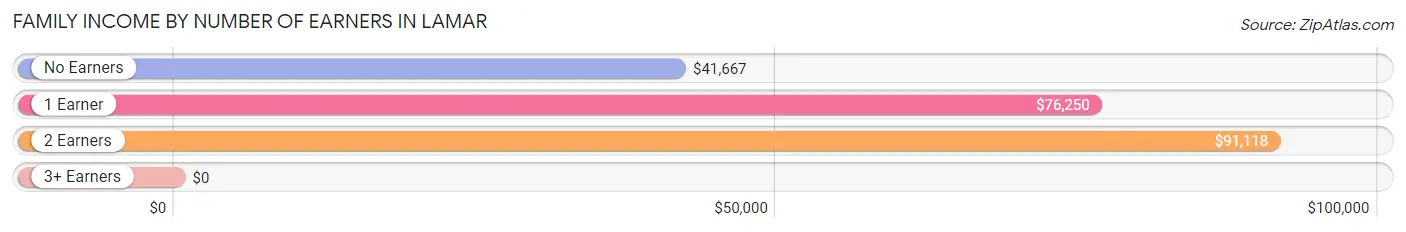
| Number of Earners | # Families | Median Income |
| No Earners | 14 (8.1%) | $41,667 |
| 1 Earner | 69 (40.1%) | $76,250 |
| 2 Earners | 81 (47.1%) | $91,118 |
| 3+ Earners | 8 (4.6%) | $0 |
| Total | 172 (100.0%) | $83,750 |
Household Income in Lamar
Household Income Brackets in Lamar
With 76 households falling in the category, the $50,000 to $74,999 income range is the most frequent in Lamar, accounting for 28.7% of all households.
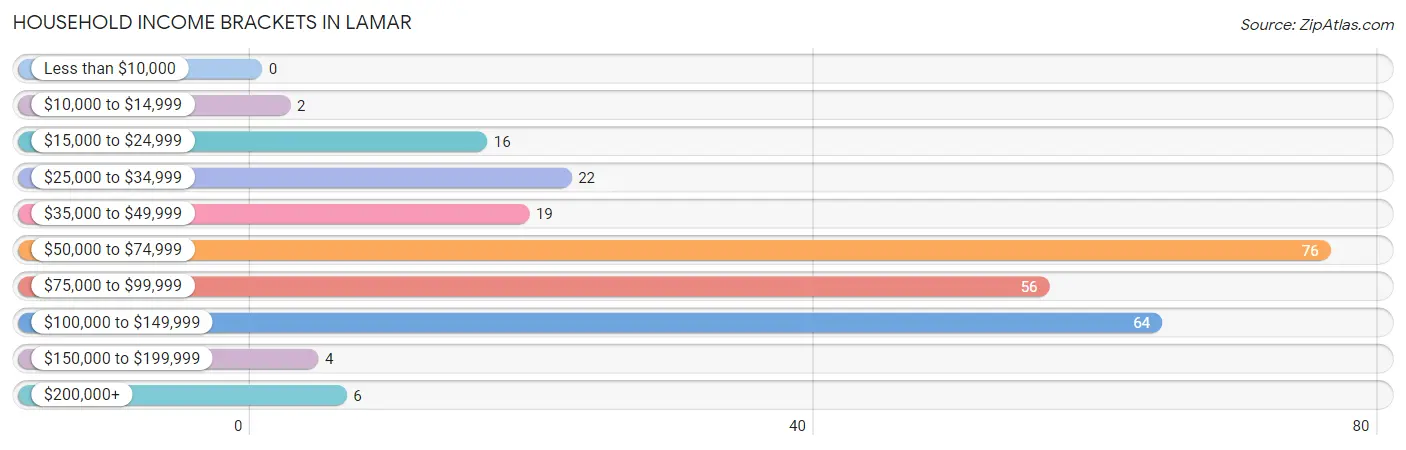
| Income Bracket | # Households | % Households |
| Less than $10,000 | 0 | 0.0% |
| $10,000 to $14,999 | 2 | 0.8% |
| $15,000 to $24,999 | 16 | 6.0% |
| $25,000 to $34,999 | 22 | 8.3% |
| $35,000 to $49,999 | 19 | 7.2% |
| $50,000 to $74,999 | 76 | 28.7% |
| $75,000 to $99,999 | 56 | 21.1% |
| $100,000 to $149,999 | 64 | 24.2% |
| $150,000 to $199,999 | 4 | 1.5% |
| $200,000+ | 6 | 2.3% |
Household Income by Householder Age in Lamar
The median household income in Lamar is $71,875, with the highest median household income of $98,750 found in the 25 to 44 years age bracket for the primary householder. A total of 95 households (35.8%) fall into this category. Meanwhile, the 15 to 24 years age bracket for the primary householder has the lowest median household income of $0, with 6 households (2.3%) in this group.
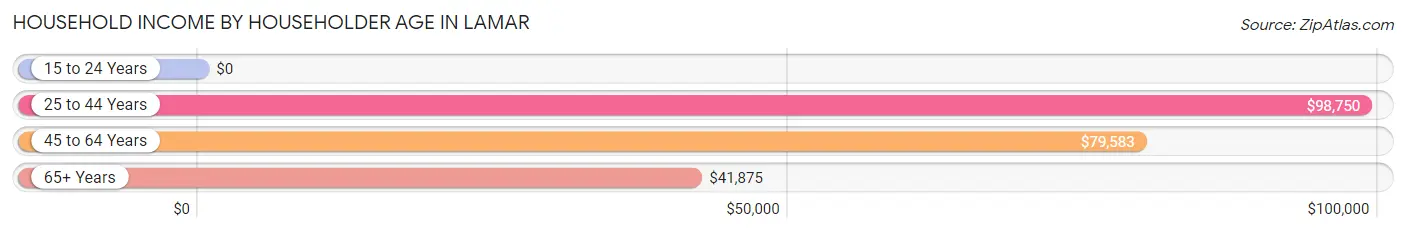
| Income Bracket | # Households | Median Income |
| 15 to 24 Years | 6 (2.3%) | $0 |
| 25 to 44 Years | 95 (35.8%) | $98,750 |
| 45 to 64 Years | 110 (41.5%) | $79,583 |
| 65+ Years | 54 (20.4%) | $41,875 |
| Total | 265 (100.0%) | $71,875 |
Poverty in Lamar
Income Below Poverty by Sex and Age in Lamar
With 3.5% poverty level for males and 0.6% for females among the residents of Lamar, 18 to 24 year old males and 55 to 64 year old females are the most vulnerable to poverty, with 6 males (37.5%) and 2 females (5.9%) in their respective age groups living below the poverty level.
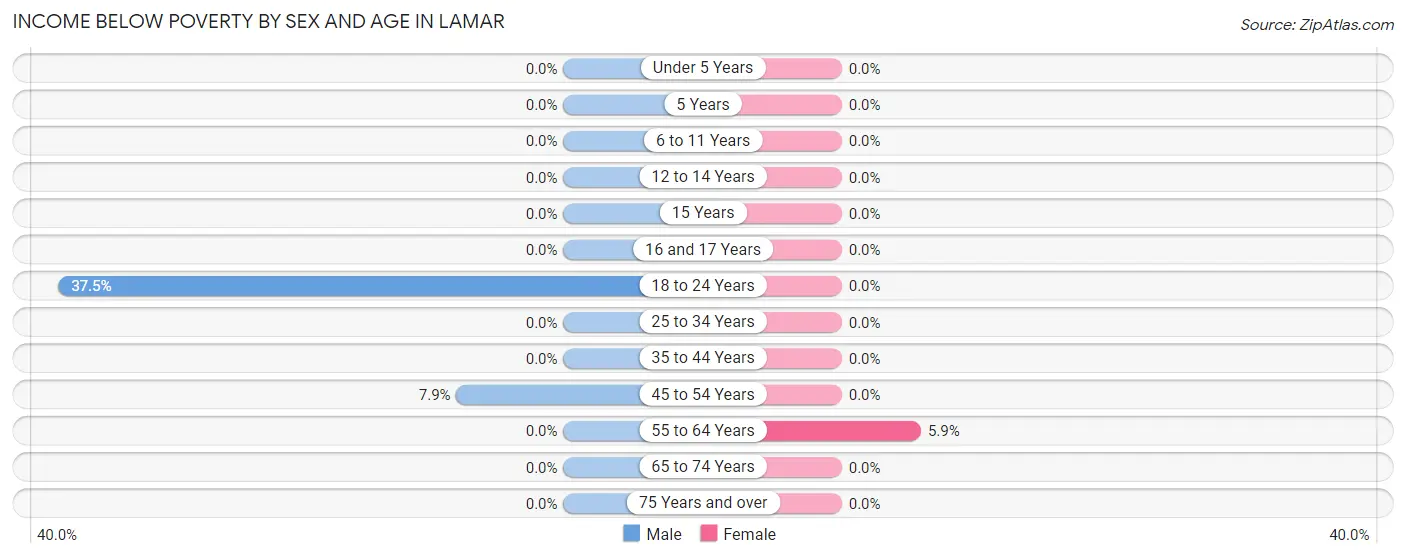
| Age Bracket | Male | Female |
| Under 5 Years | 0 (0.0%) | 0 (0.0%) |
| 5 Years | 0 (0.0%) | 0 (0.0%) |
| 6 to 11 Years | 0 (0.0%) | 0 (0.0%) |
| 12 to 14 Years | 0 (0.0%) | 0 (0.0%) |
| 15 Years | 0 (0.0%) | 0 (0.0%) |
| 16 and 17 Years | 0 (0.0%) | 0 (0.0%) |
| 18 to 24 Years | 6 (37.5%) | 0 (0.0%) |
| 25 to 34 Years | 0 (0.0%) | 0 (0.0%) |
| 35 to 44 Years | 0 (0.0%) | 0 (0.0%) |
| 45 to 54 Years | 5 (7.9%) | 0 (0.0%) |
| 55 to 64 Years | 0 (0.0%) | 2 (5.9%) |
| 65 to 74 Years | 0 (0.0%) | 0 (0.0%) |
| 75 Years and over | 0 (0.0%) | 0 (0.0%) |
| Total | 11 (3.5%) | 2 (0.6%) |
Income Above Poverty by Sex and Age in Lamar
According to the poverty statistics in Lamar, males aged under 5 years and females aged under 5 years are the age groups that are most secure financially, with 100.0% of males and 100.0% of females in these age groups living above the poverty line.
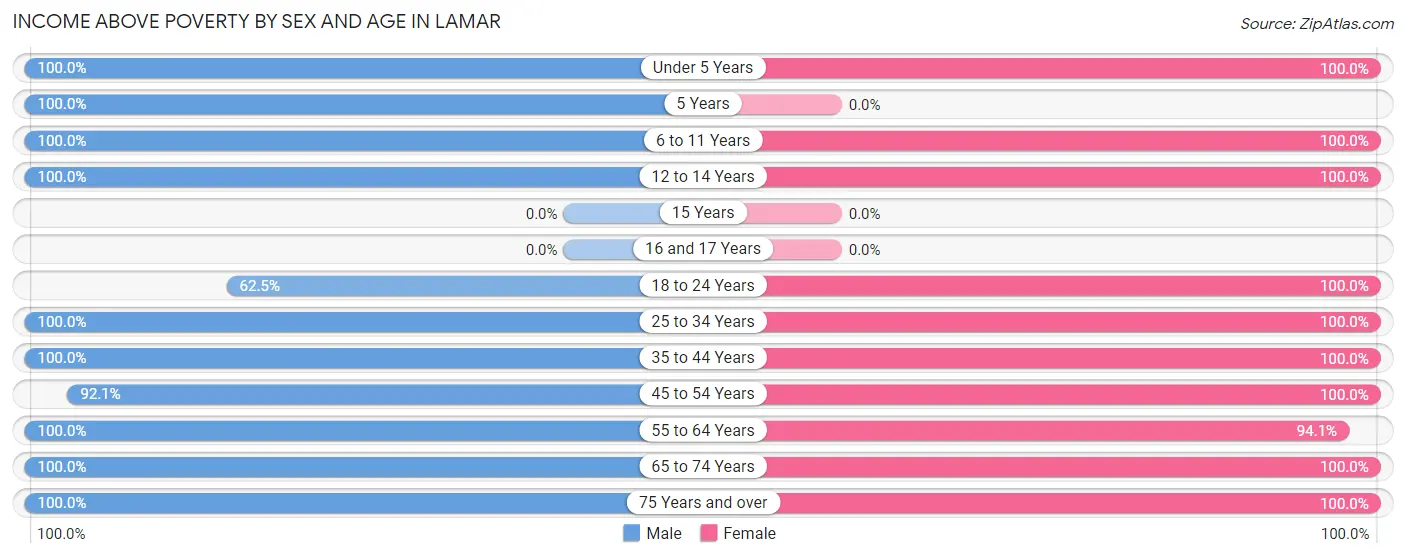
| Age Bracket | Male | Female |
| Under 5 Years | 34 (100.0%) | 10 (100.0%) |
| 5 Years | 13 (100.0%) | 0 (0.0%) |
| 6 to 11 Years | 5 (100.0%) | 23 (100.0%) |
| 12 to 14 Years | 4 (100.0%) | 37 (100.0%) |
| 15 Years | 0 (0.0%) | 0 (0.0%) |
| 16 and 17 Years | 0 (0.0%) | 0 (0.0%) |
| 18 to 24 Years | 10 (62.5%) | 28 (100.0%) |
| 25 to 34 Years | 66 (100.0%) | 45 (100.0%) |
| 35 to 44 Years | 24 (100.0%) | 28 (100.0%) |
| 45 to 54 Years | 58 (92.1%) | 70 (100.0%) |
| 55 to 64 Years | 48 (100.0%) | 32 (94.1%) |
| 65 to 74 Years | 23 (100.0%) | 20 (100.0%) |
| 75 Years and over | 22 (100.0%) | 18 (100.0%) |
| Total | 307 (96.5%) | 311 (99.4%) |
Income Below Poverty Among Married-Couple Families in Lamar
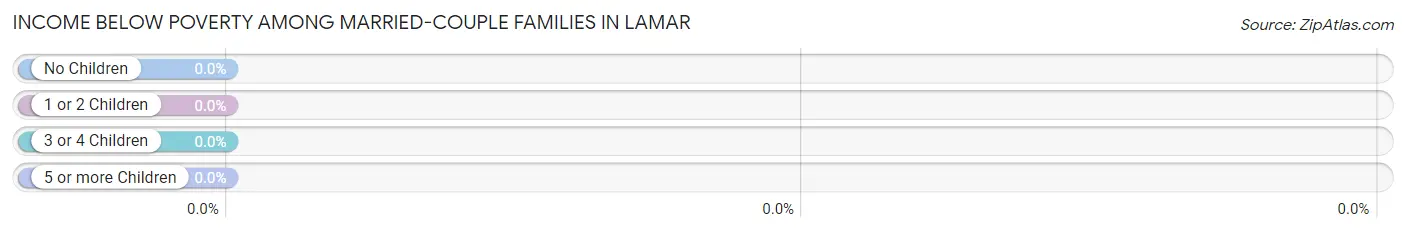
| Children | Above Poverty | Below Poverty |
| No Children | 87 (100.0%) | 0 (0.0%) |
| 1 or 2 Children | 35 (100.0%) | 0 (0.0%) |
| 3 or 4 Children | 11 (100.0%) | 0 (0.0%) |
| 5 or more Children | 0 (0.0%) | 0 (0.0%) |
| Total | 133 (100.0%) | 0 (0.0%) |
Income Below Poverty Among Single-Parent Households in Lamar
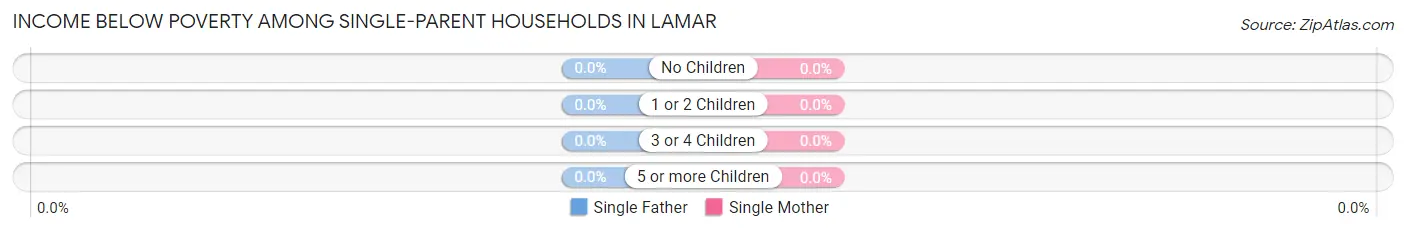
| Children | Single Father | Single Mother |
| No Children | 0 (0.0%) | 0 (0.0%) |
| 1 or 2 Children | 0 (0.0%) | 0 (0.0%) |
| 3 or 4 Children | 0 (0.0%) | 0 (0.0%) |
| 5 or more Children | 0 (0.0%) | 0 (0.0%) |
| Total | 0 (0.0%) | 0 (0.0%) |
Income Below Poverty Among Married-Couple vs Single-Parent Households in Lamar
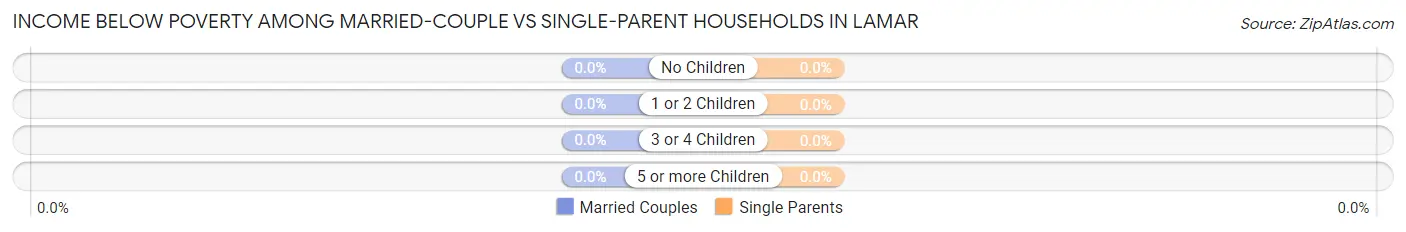
| Children | Married-Couple Families | Single-Parent Households |
| No Children | 0 (0.0%) | 0 (0.0%) |
| 1 or 2 Children | 0 (0.0%) | 0 (0.0%) |
| 3 or 4 Children | 0 (0.0%) | 0 (0.0%) |
| 5 or more Children | 0 (0.0%) | 0 (0.0%) |
| Total | 0 (0.0%) | 0 (0.0%) |
Race in Lamar
The most populous races in Lamar are White / Caucasian (629 | 98.1%), Hispanic or Latino (24 | 3.7%), and Asian (9 | 1.4%).
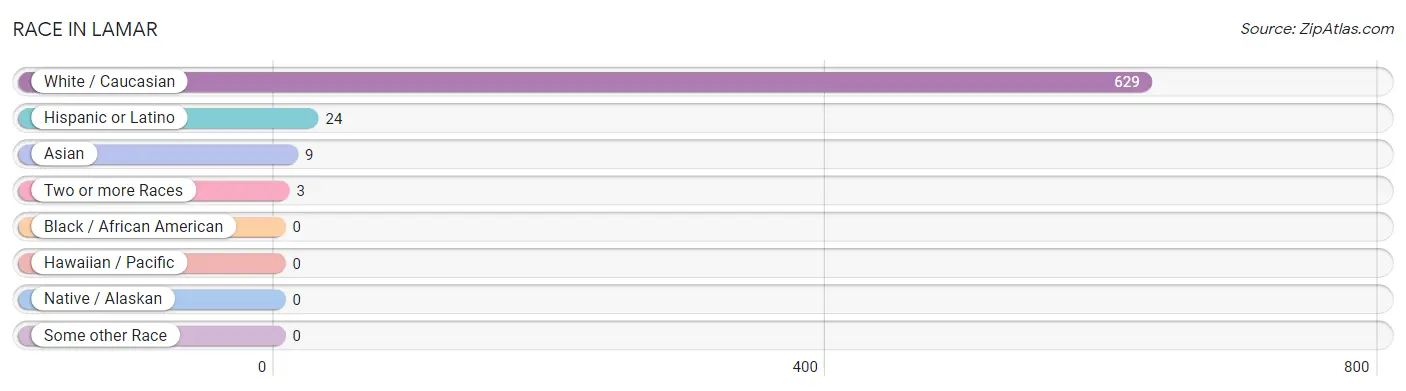
| Race | # Population | % Population |
| Asian | 9 | 1.4% |
| Black / African American | 0 | 0.0% |
| Hawaiian / Pacific | 0 | 0.0% |
| Hispanic or Latino | 24 | 3.7% |
| Native / Alaskan | 0 | 0.0% |
| White / Caucasian | 629 | 98.1% |
| Two or more Races | 3 | 0.5% |
| Some other Race | 0 | 0.0% |
| Total | 641 | 100.0% |
Ancestry in Lamar
The most populous ancestries reported in Lamar are German (280 | 43.7%), American (46 | 7.2%), Irish (46 | 7.2%), English (19 | 3.0%), and Dutch (13 | 2.0%), together accounting for 63.0% of all Lamar residents.
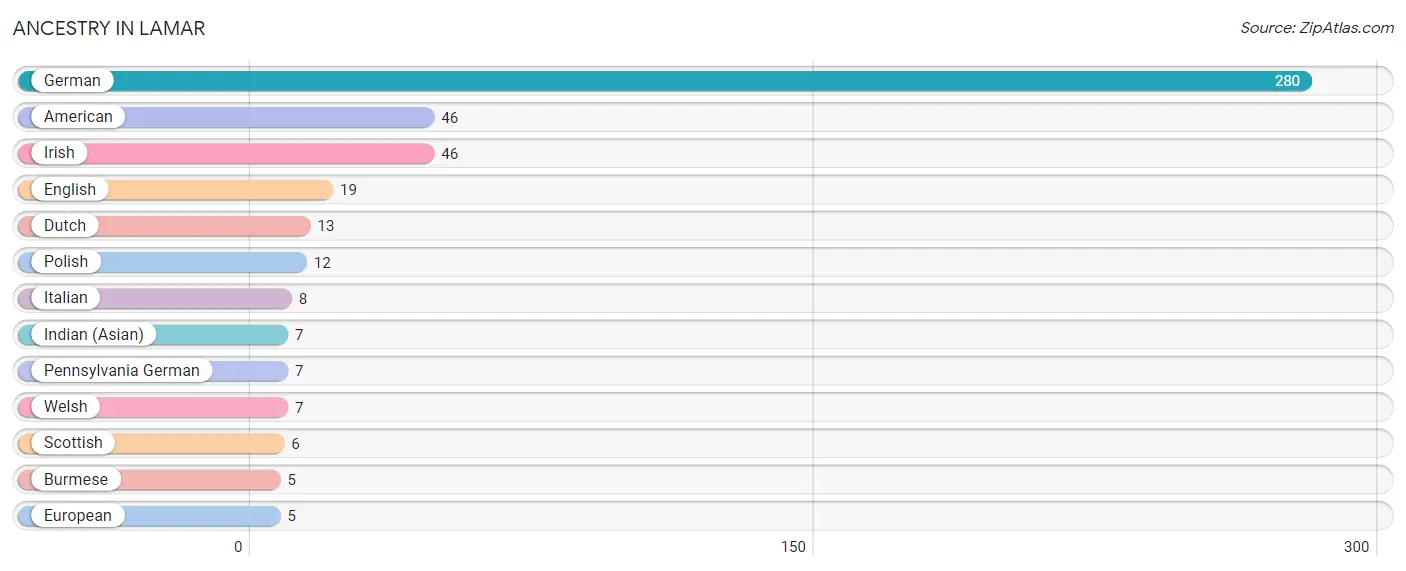
| Ancestry | # Population | % Population |
| American | 46 | 7.2% |
| Burmese | 5 | 0.8% |
| Dutch | 13 | 2.0% |
| English | 19 | 3.0% |
| European | 5 | 0.8% |
| German | 280 | 43.7% |
| Indian (Asian) | 7 | 1.1% |
| Irish | 46 | 7.2% |
| Italian | 8 | 1.3% |
| Pennsylvania German | 7 | 1.1% |
| Polish | 12 | 1.9% |
| Scottish | 6 | 0.9% |
| Welsh | 7 | 1.1% | View All 13 Rows |
Immigrants in Lamar
The most numerous immigrant groups reported in Lamar came from Asia (7 | 1.1%), China (7 | 1.1%), and Eastern Asia (7 | 1.1%), together accounting for 3.3% of all Lamar residents.
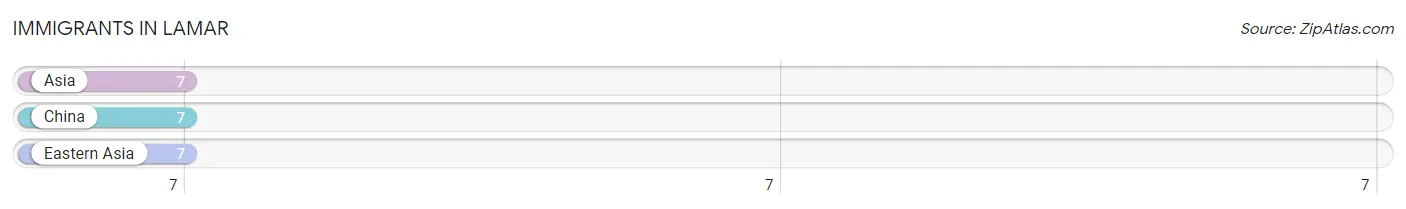
| Immigration Origin | # Population | % Population |
| Asia | 7 | 1.1% |
| China | 7 | 1.1% |
| Eastern Asia | 7 | 1.1% | View All 3 Rows |
Sex and Age in Lamar
Sex and Age in Lamar
The most populous age groups in Lamar are 50 to 54 Years (52 | 15.9%) for men and 10 to 14 Years (57 | 18.2%) for women.
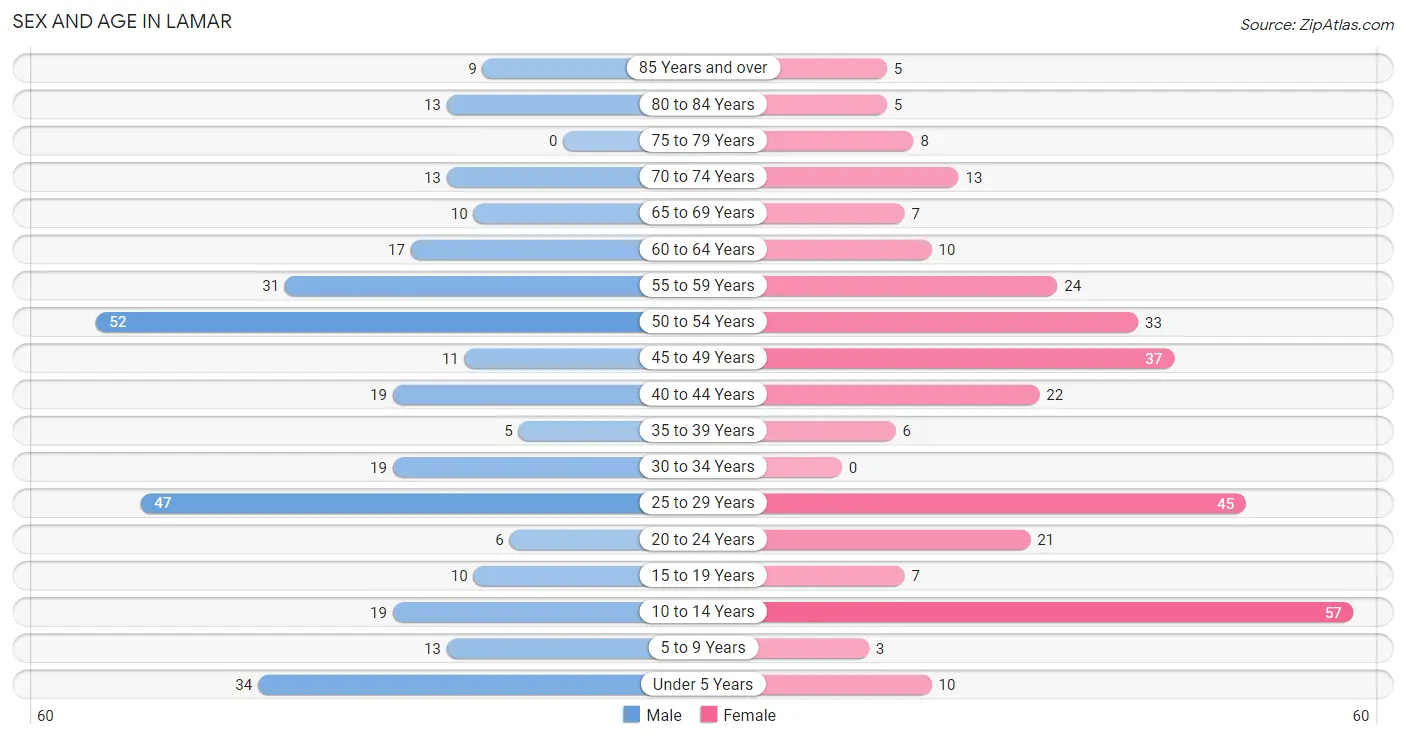
| Age Bracket | Male | Female |
| Under 5 Years | 34 (10.4%) | 10 (3.2%) |
| 5 to 9 Years | 13 (4.0%) | 3 (1.0%) |
| 10 to 14 Years | 19 (5.8%) | 57 (18.2%) |
| 15 to 19 Years | 10 (3.0%) | 7 (2.2%) |
| 20 to 24 Years | 6 (1.8%) | 21 (6.7%) |
| 25 to 29 Years | 47 (14.3%) | 45 (14.4%) |
| 30 to 34 Years | 19 (5.8%) | 0 (0.0%) |
| 35 to 39 Years | 5 (1.5%) | 6 (1.9%) |
| 40 to 44 Years | 19 (5.8%) | 22 (7.0%) |
| 45 to 49 Years | 11 (3.4%) | 37 (11.8%) |
| 50 to 54 Years | 52 (15.9%) | 33 (10.5%) |
| 55 to 59 Years | 31 (9.5%) | 24 (7.7%) |
| 60 to 64 Years | 17 (5.2%) | 10 (3.2%) |
| 65 to 69 Years | 10 (3.0%) | 7 (2.2%) |
| 70 to 74 Years | 13 (4.0%) | 13 (4.2%) |
| 75 to 79 Years | 0 (0.0%) | 8 (2.6%) |
| 80 to 84 Years | 13 (4.0%) | 5 (1.6%) |
| 85 Years and over | 9 (2.7%) | 5 (1.6%) |
| Total | 328 (100.0%) | 313 (100.0%) |
Families and Households in Lamar
Median Family Size in Lamar
The median family size in Lamar is 2.70 persons per family, with married-couple families (133 | 77.3%) accounting for the largest median family size of 2.87 persons per family. On the other hand, single female/mother families (23 | 13.4%) represent the smallest median family size with 2.04 persons per family.
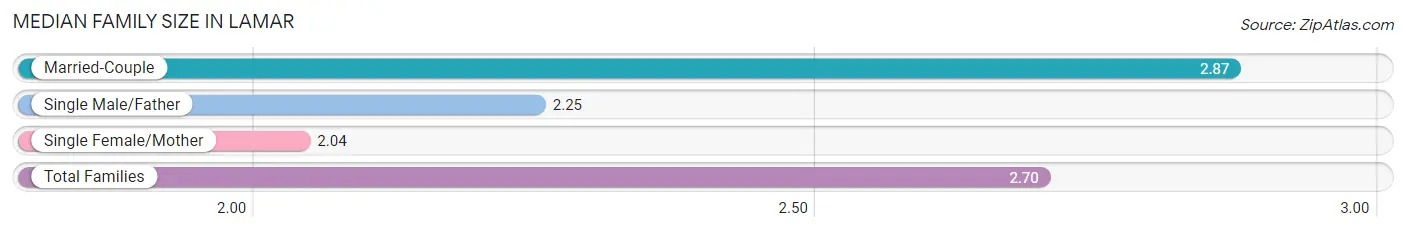
| Family Type | # Families | Family Size |
| Married-Couple | 133 (77.3%) | 2.87 |
| Single Male/Father | 16 (9.3%) | 2.25 |
| Single Female/Mother | 23 (13.4%) | 2.04 |
| Total Families | 172 (100.0%) | 2.70 |
Median Household Size in Lamar
The median household size in Lamar is 2.42 persons per household, with single male/father households (16 | 6.0%) accounting for the largest median household size of 3.63 persons per household. non-family households (93 | 35.1%) represent the smallest median household size with 1.44 persons per household.
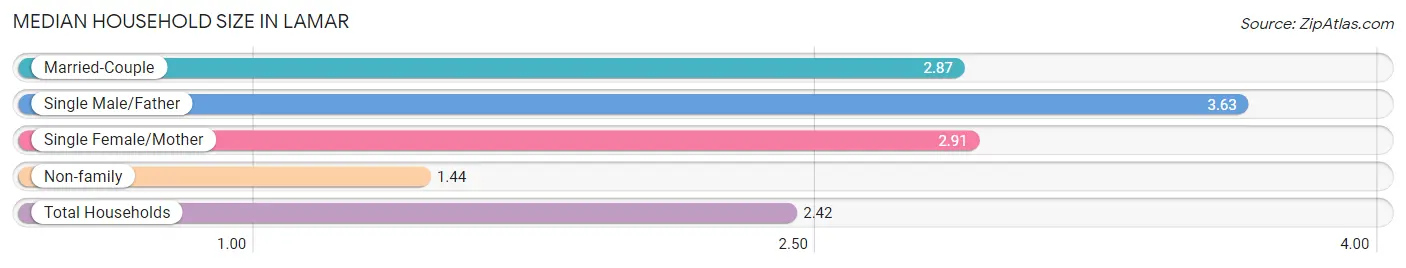
| Household Type | # Households | Household Size |
| Married-Couple | 133 (50.2%) | 2.87 |
| Single Male/Father | 16 (6.0%) | 3.63 |
| Single Female/Mother | 23 (8.7%) | 2.91 |
| Non-family | 93 (35.1%) | 1.44 |
| Total Households | 265 (100.0%) | 2.42 |
Household Size by Marriage Status in Lamar
Out of a total of 265 households in Lamar, 172 (64.9%) are family households, while 93 (35.1%) are nonfamily households. The most numerous type of family households are 2-person households, comprising 89, and the most common type of nonfamily households are 1-person households, comprising 62.
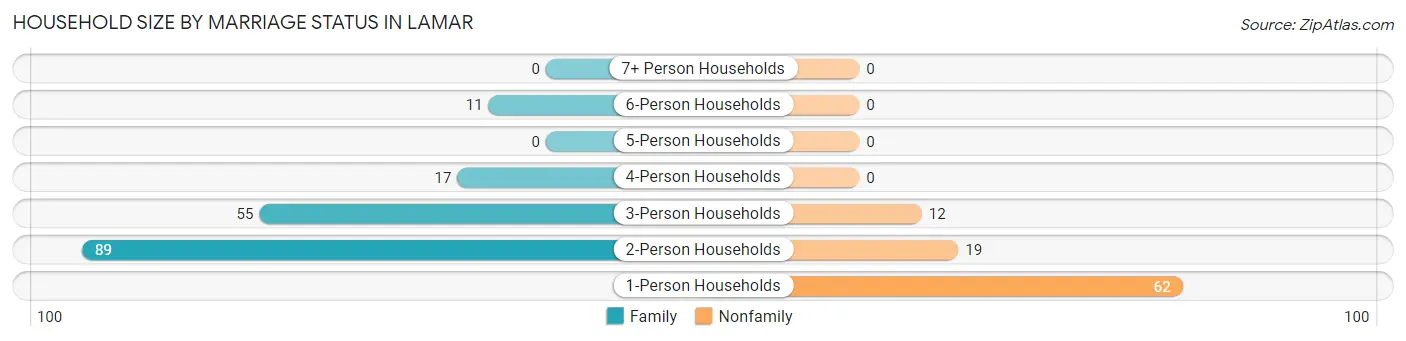
| Household Size | Family Households | Nonfamily Households |
| 1-Person Households | - | 62 (23.4%) |
| 2-Person Households | 89 (33.6%) | 19 (7.2%) |
| 3-Person Households | 55 (20.7%) | 12 (4.5%) |
| 4-Person Households | 17 (6.4%) | 0 (0.0%) |
| 5-Person Households | 0 (0.0%) | 0 (0.0%) |
| 6-Person Households | 11 (4.2%) | 0 (0.0%) |
| 7+ Person Households | 0 (0.0%) | 0 (0.0%) |
| Total | 172 (64.9%) | 93 (35.1%) |
Female Fertility in Lamar
Fertility by Age in Lamar
Average fertility rate in Lamar is 138.0 births per 1,000 women. Women in the age bracket of 20 to 34 years have the highest fertility rate with 303.0 births per 1,000 women. Women in the age bracket of 20 to 34 years acount for 100.0% of all women with births.
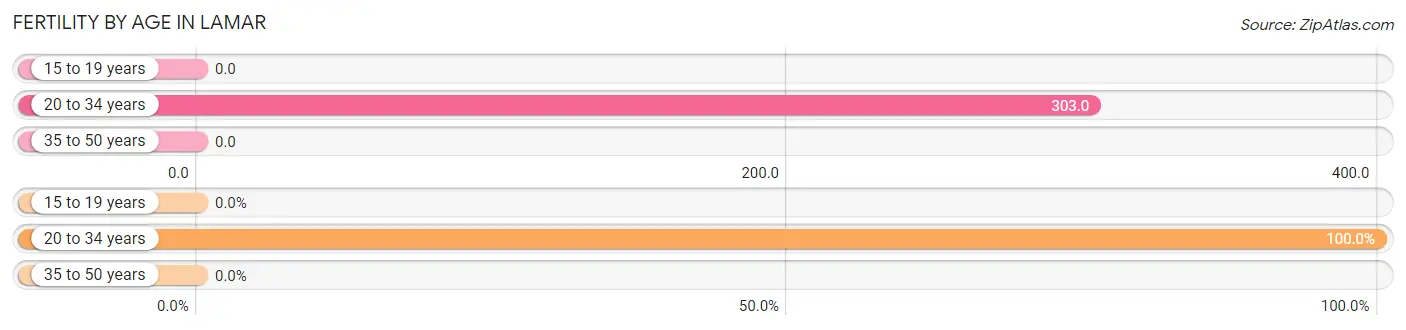
| Age Bracket | Women with Births | Births / 1,000 Women |
| 15 to 19 years | 0 (0.0%) | 0.0 |
| 20 to 34 years | 20 (100.0%) | 303.0 |
| 35 to 50 years | 0 (0.0%) | 0.0 |
| Total | 20 (100.0%) | 138.0 |
Fertility by Age by Marriage Status in Lamar
70.0% of women with births (20) in Lamar are married. The highest percentage of unmarried women with births falls into 20 to 34 years age bracket with 30.0% of them unmarried at the time of birth, while the lowest percentage of unmarried women with births belong to 20 to 34 years age bracket with 30.0% of them unmarried.
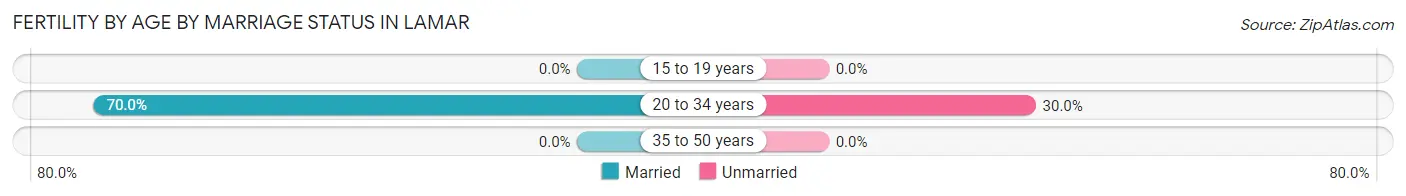
| Age Bracket | Married | Unmarried |
| 15 to 19 years | 0 (0.0%) | 0 (0.0%) |
| 20 to 34 years | 14 (70.0%) | 6 (30.0%) |
| 35 to 50 years | 0 (0.0%) | 0 (0.0%) |
| Total | 14 (70.0%) | 6 (30.0%) |
Fertility by Education in Lamar
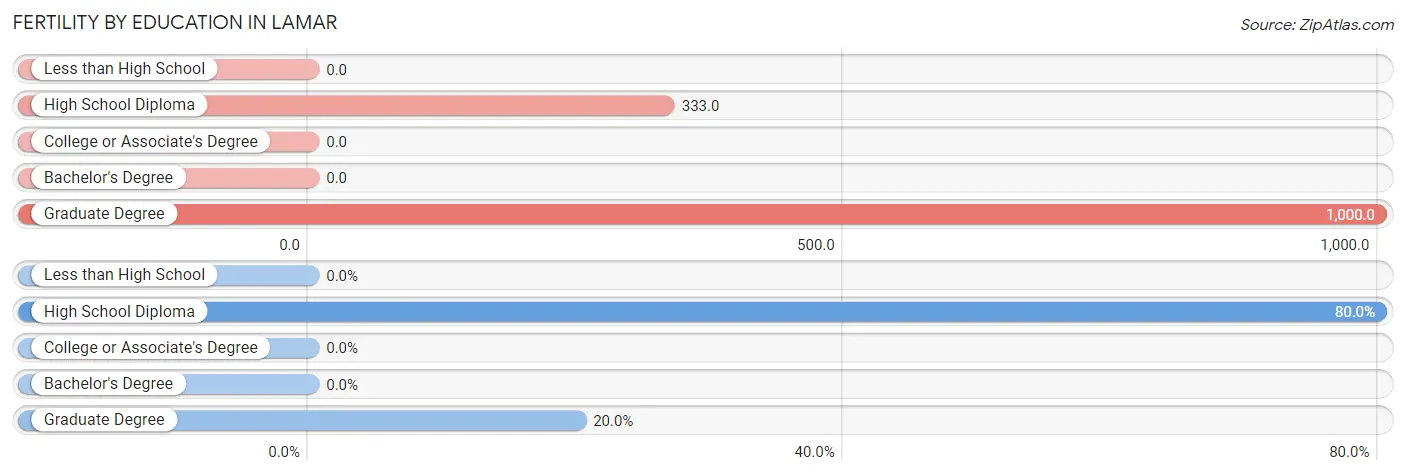
| Educational Attainment | Women with Births | Births / 1,000 Women |
| Less than High School | 0 (0.0%) | 0.0 |
| High School Diploma | 16 (80.0%) | 333.0 |
| College or Associate's Degree | 0 (0.0%) | 0.0 |
| Bachelor's Degree | 0 (0.0%) | 0.0 |
| Graduate Degree | 4 (20.0%) | 1,000.0 |
| Total | 20 (100.0%) | 138.0 |
Fertility by Education by Marriage Status in Lamar
30.0% of women with births in Lamar are unmarried. Women with the educational attainment of graduate degree are most likely to be married with 100.0% of them married at childbirth, while women with the educational attainment of high school diploma are least likely to be married with 37.5% of them unmarried at childbirth.
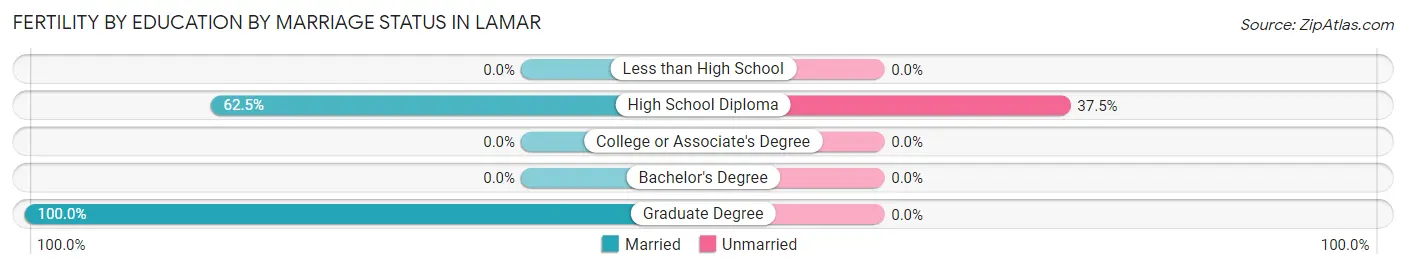
| Educational Attainment | Married | Unmarried |
| Less than High School | 0 (0.0%) | 0 (0.0%) |
| High School Diploma | 10 (62.5%) | 6 (37.5%) |
| College or Associate's Degree | 0 (0.0%) | 0 (0.0%) |
| Bachelor's Degree | 0 (0.0%) | 0 (0.0%) |
| Graduate Degree | 4 (100.0%) | 0 (0.0%) |
| Total | 14 (70.0%) | 6 (30.0%) |
Employment Characteristics in Lamar
Employment by Class of Employer in Lamar
Among the 343 employed individuals in Lamar, private company employees (225 | 65.6%), state government employees (40 | 11.7%), and local government employees (33 | 9.6%) make up the most common classes of employment.
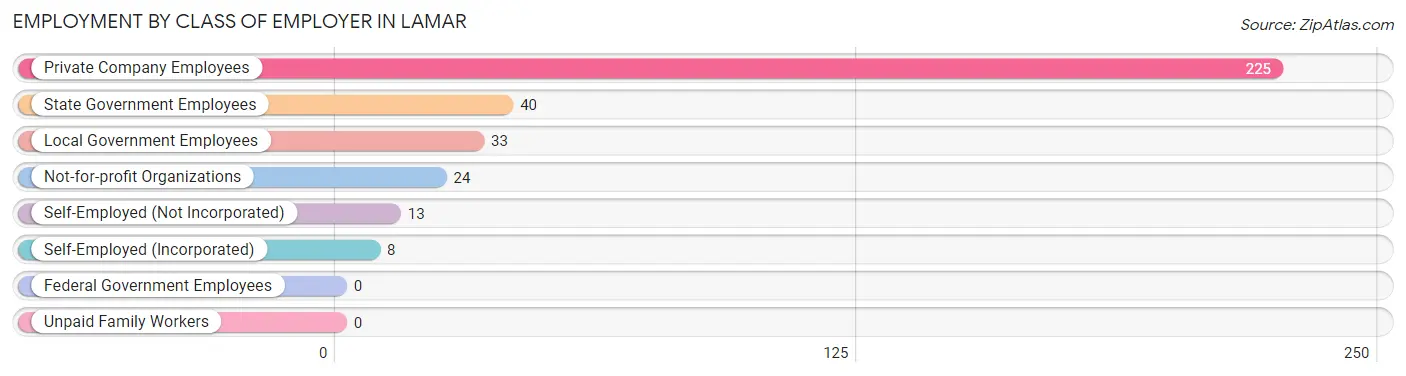
| Employer Class | # Employees | % Employees |
| Private Company Employees | 225 | 65.6% |
| Self-Employed (Incorporated) | 8 | 2.3% |
| Self-Employed (Not Incorporated) | 13 | 3.8% |
| Not-for-profit Organizations | 24 | 7.0% |
| Local Government Employees | 33 | 9.6% |
| State Government Employees | 40 | 11.7% |
| Federal Government Employees | 0 | 0.0% |
| Unpaid Family Workers | 0 | 0.0% |
| Total | 343 | 100.0% |
Employment Status by Age in Lamar
According to the labor force statistics for Lamar, out of the total population over 16 years of age (505), 75.6% or 382 individuals are in the labor force, with 6.3% or 24 of them unemployed. The age group with the highest labor force participation rate is 16 to 19 years, with 100.0% or 17 individuals in the labor force. Within the labor force, the 16 to 19 years age range has the highest percentage of unemployed individuals, with 58.8% or 10 of them being unemployed.
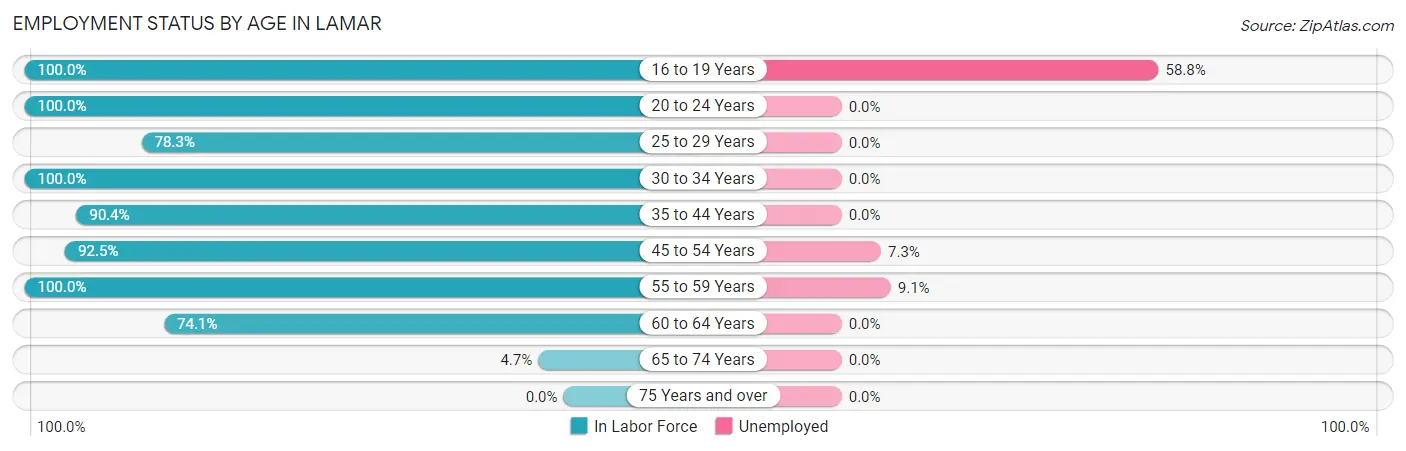
| Age Bracket | In Labor Force | Unemployed |
| 16 to 19 Years | 17 (100.0%) | 10 (58.8%) |
| 20 to 24 Years | 27 (100.0%) | 0 (0.0%) |
| 25 to 29 Years | 72 (78.3%) | 0 (0.0%) |
| 30 to 34 Years | 19 (100.0%) | 0 (0.0%) |
| 35 to 44 Years | 47 (90.4%) | 0 (0.0%) |
| 45 to 54 Years | 123 (92.5%) | 9 (7.3%) |
| 55 to 59 Years | 55 (100.0%) | 5 (9.1%) |
| 60 to 64 Years | 20 (74.1%) | 0 (0.0%) |
| 65 to 74 Years | 2 (4.7%) | 0 (0.0%) |
| 75 Years and over | 0 (0.0%) | 0 (0.0%) |
| Total | 382 (75.6%) | 24 (6.3%) |
Employment Status by Educational Attainment in Lamar
According to labor force statistics for Lamar, 88.9% of individuals (336) out of the total population between 25 and 64 years of age (378) are in the labor force, with 4.2% or 14 of them being unemployed. The group with the highest labor force participation rate are those with the educational attainment of college / associate degree, with 100.0% or 125 individuals in the labor force. Within the labor force, individuals with high school diploma education have the highest percentage of unemployment, with 6.3% or 10 of them being unemployed.
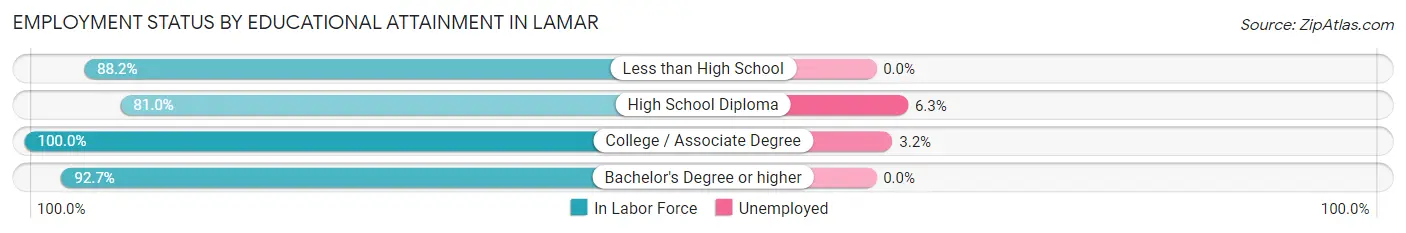
| Educational Attainment | In Labor Force | Unemployed |
| Less than High School | 15 (88.2%) | 0 (0.0%) |
| High School Diploma | 158 (81.0%) | 12 (6.3%) |
| College / Associate Degree | 125 (100.0%) | 4 (3.2%) |
| Bachelor's Degree or higher | 38 (92.7%) | 0 (0.0%) |
| Total | 336 (88.9%) | 16 (4.2%) |
Employment Occupations by Sex in Lamar
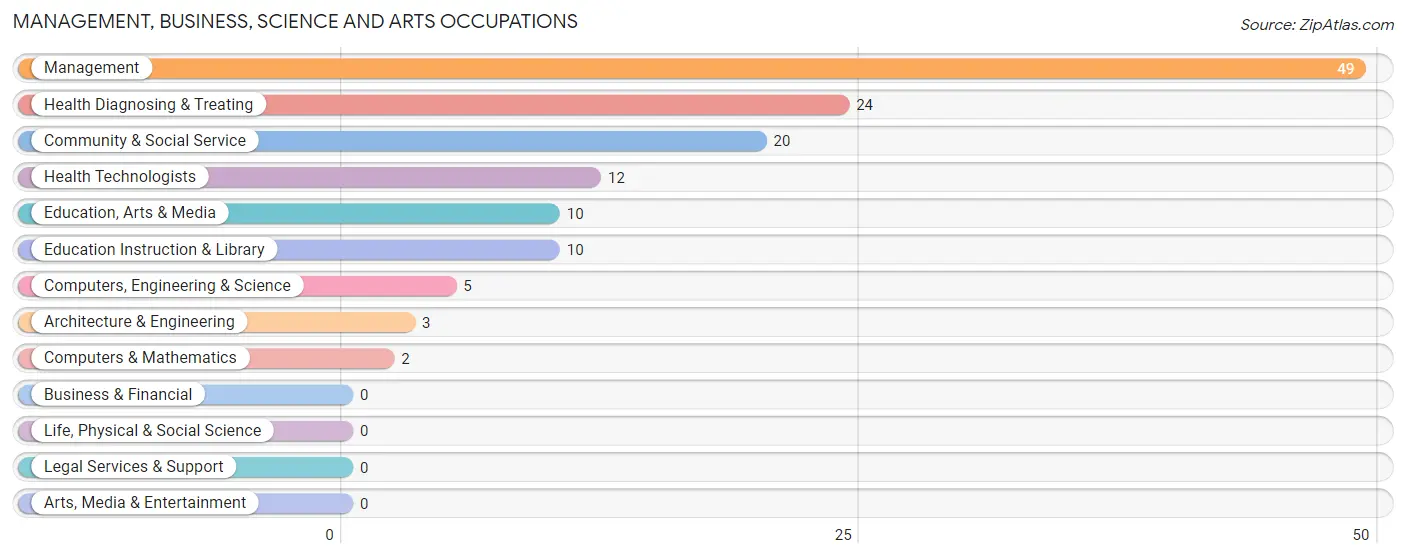
Management, Business, Science and Arts Occupations
The most common Management, Business, Science and Arts occupations in Lamar are Management (49 | 13.7%), Health Diagnosing & Treating (24 | 6.7%), Community & Social Service (20 | 5.6%), Health Technologists (12 | 3.4%), and Education, Arts & Media (10 | 2.8%).
Management, Business, Science and Arts Occupations by Sex
Within the Management, Business, Science and Arts occupations in Lamar, the most male-oriented occupations are Management (100.0%), Architecture & Engineering (100.0%), and Computers, Engineering & Science (60.0%), while the most female-oriented occupations are Computers & Mathematics (100.0%), Community & Social Service (100.0%), and Education, Arts & Media (100.0%).
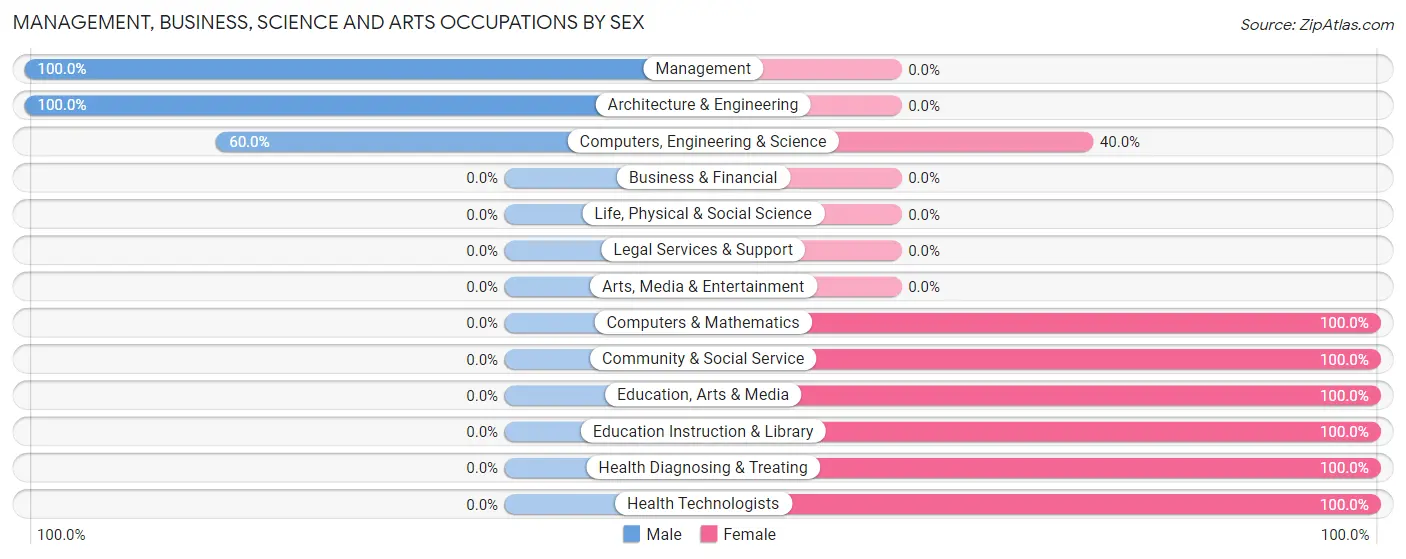
| Occupation | Male | Female |
| Management | 49 (100.0%) | 0 (0.0%) |
| Business & Financial | 0 (0.0%) | 0 (0.0%) |
| Computers, Engineering & Science | 3 (60.0%) | 2 (40.0%) |
| Computers & Mathematics | 0 (0.0%) | 2 (100.0%) |
| Architecture & Engineering | 3 (100.0%) | 0 (0.0%) |
| Life, Physical & Social Science | 0 (0.0%) | 0 (0.0%) |
| Community & Social Service | 0 (0.0%) | 20 (100.0%) |
| Education, Arts & Media | 0 (0.0%) | 10 (100.0%) |
| Legal Services & Support | 0 (0.0%) | 0 (0.0%) |
| Education Instruction & Library | 0 (0.0%) | 10 (100.0%) |
| Arts, Media & Entertainment | 0 (0.0%) | 0 (0.0%) |
| Health Diagnosing & Treating | 0 (0.0%) | 24 (100.0%) |
| Health Technologists | 0 (0.0%) | 12 (100.0%) |
| Total (Category) | 52 (53.1%) | 46 (46.9%) |
| Total (Overall) | 188 (52.5%) | 170 (47.5%) |
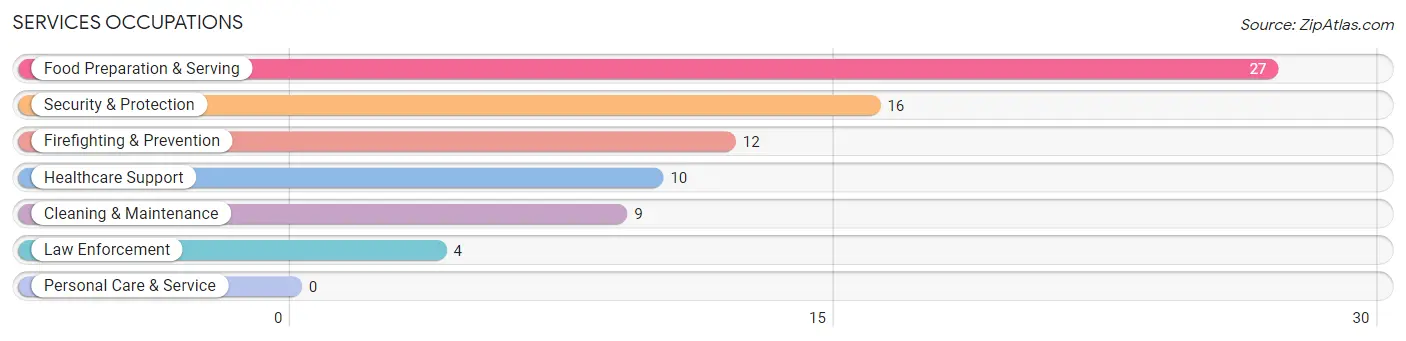
Services Occupations
The most common Services occupations in Lamar are Food Preparation & Serving (27 | 7.5%), Security & Protection (16 | 4.5%), Firefighting & Prevention (12 | 3.4%), Healthcare Support (10 | 2.8%), and Cleaning & Maintenance (9 | 2.5%).
Services Occupations by Sex
Within the Services occupations in Lamar, the most male-oriented occupations are Law Enforcement (100.0%), Cleaning & Maintenance (100.0%), and Food Preparation & Serving (63.0%), while the most female-oriented occupations are Healthcare Support (100.0%), Firefighting & Prevention (100.0%), and Security & Protection (75.0%).
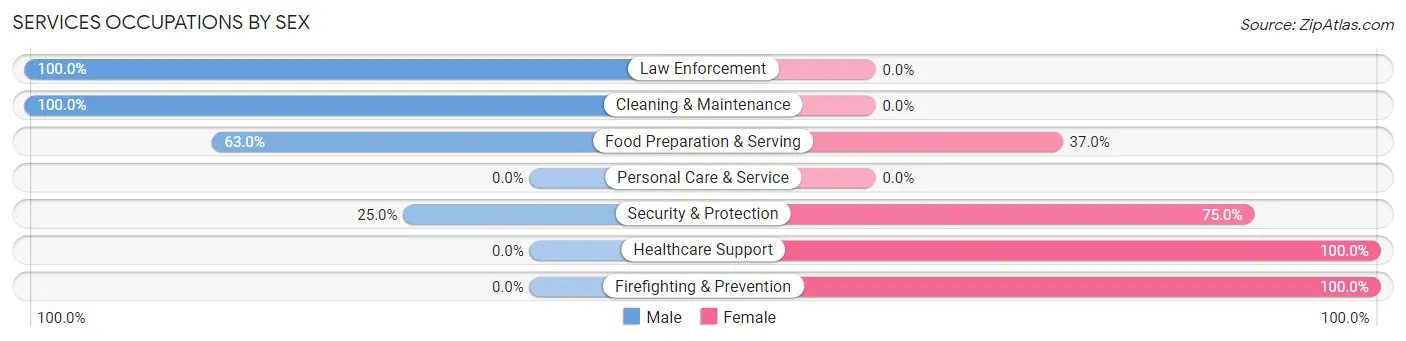
| Occupation | Male | Female |
| Healthcare Support | 0 (0.0%) | 10 (100.0%) |
| Security & Protection | 4 (25.0%) | 12 (75.0%) |
| Firefighting & Prevention | 0 (0.0%) | 12 (100.0%) |
| Law Enforcement | 4 (100.0%) | 0 (0.0%) |
| Food Preparation & Serving | 17 (63.0%) | 10 (37.0%) |
| Cleaning & Maintenance | 9 (100.0%) | 0 (0.0%) |
| Personal Care & Service | 0 (0.0%) | 0 (0.0%) |
| Total (Category) | 30 (48.4%) | 32 (51.6%) |
| Total (Overall) | 188 (52.5%) | 170 (47.5%) |
Sales and Office Occupations
The most common Sales and Office occupations in Lamar are Office & Administration (53 | 14.8%), and Sales & Related (38 | 10.6%).

Sales and Office Occupations by Sex

| Occupation | Male | Female |
| Sales & Related | 12 (31.6%) | 26 (68.4%) |
| Office & Administration | 4 (7.5%) | 49 (92.4%) |
| Total (Category) | 16 (17.6%) | 75 (82.4%) |
| Total (Overall) | 188 (52.5%) | 170 (47.5%) |
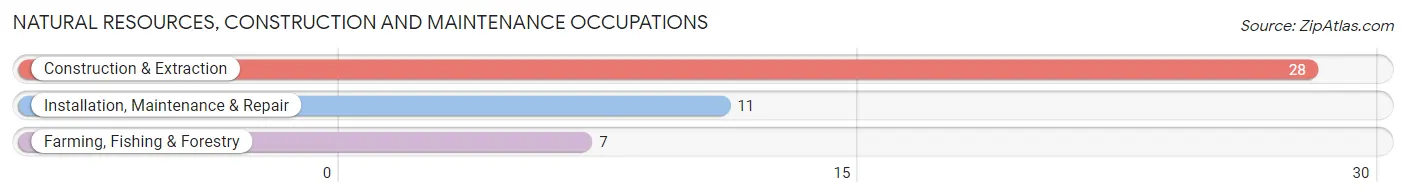
Natural Resources, Construction and Maintenance Occupations
The most common Natural Resources, Construction and Maintenance occupations in Lamar are Construction & Extraction (28 | 7.8%), Installation, Maintenance & Repair (11 | 3.1%), and Farming, Fishing & Forestry (7 | 2.0%).
Natural Resources, Construction and Maintenance Occupations by Sex
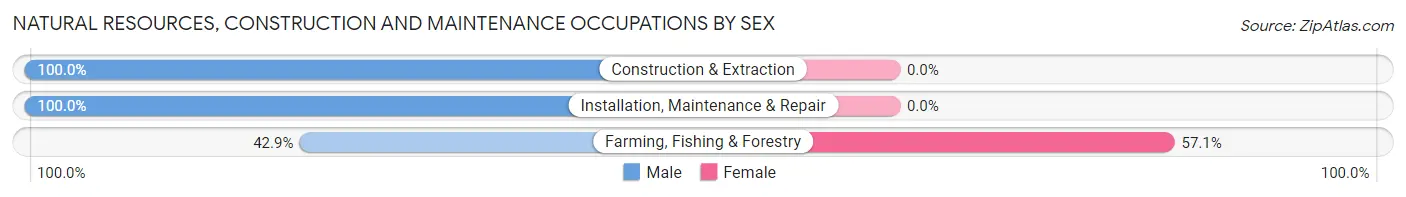
| Occupation | Male | Female |
| Farming, Fishing & Forestry | 3 (42.9%) | 4 (57.1%) |
| Construction & Extraction | 28 (100.0%) | 0 (0.0%) |
| Installation, Maintenance & Repair | 11 (100.0%) | 0 (0.0%) |
| Total (Category) | 42 (91.3%) | 4 (8.7%) |
| Total (Overall) | 188 (52.5%) | 170 (47.5%) |
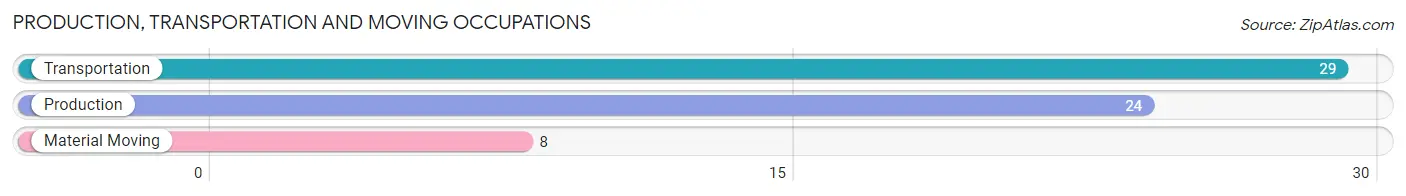
Production, Transportation and Moving Occupations
The most common Production, Transportation and Moving occupations in Lamar are Transportation (29 | 8.1%), Production (24 | 6.7%), and Material Moving (8 | 2.2%).
Production, Transportation and Moving Occupations by Sex
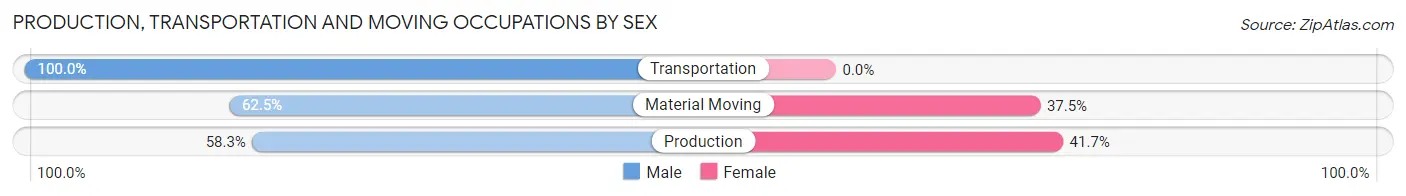
| Occupation | Male | Female |
| Production | 14 (58.3%) | 10 (41.7%) |
| Transportation | 29 (100.0%) | 0 (0.0%) |
| Material Moving | 5 (62.5%) | 3 (37.5%) |
| Total (Category) | 48 (78.7%) | 13 (21.3%) |
| Total (Overall) | 188 (52.5%) | 170 (47.5%) |
Employment Industries by Sex in Lamar
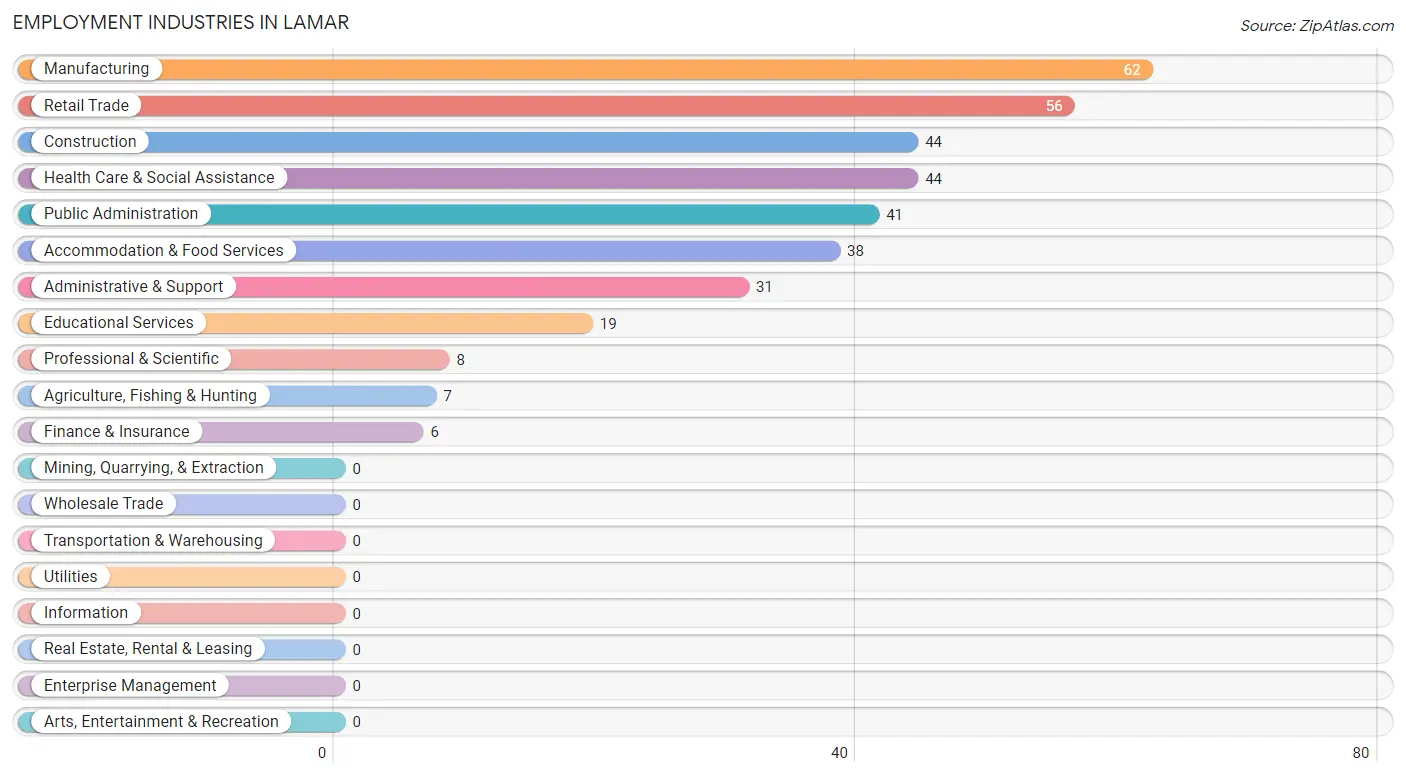
Employment Industries in Lamar
The major employment industries in Lamar include Manufacturing (62 | 17.3%), Retail Trade (56 | 15.6%), Construction (44 | 12.3%), Health Care & Social Assistance (44 | 12.3%), and Public Administration (41 | 11.5%).
Employment Industries by Sex in Lamar
The Lamar industries that see more men than women are Construction (100.0%), Finance & Insurance (100.0%), and Administrative & Support (80.6%), whereas the industries that tend to have a higher number of women are Professional & Scientific (100.0%), Health Care & Social Assistance (100.0%), and Public Administration (68.3%).
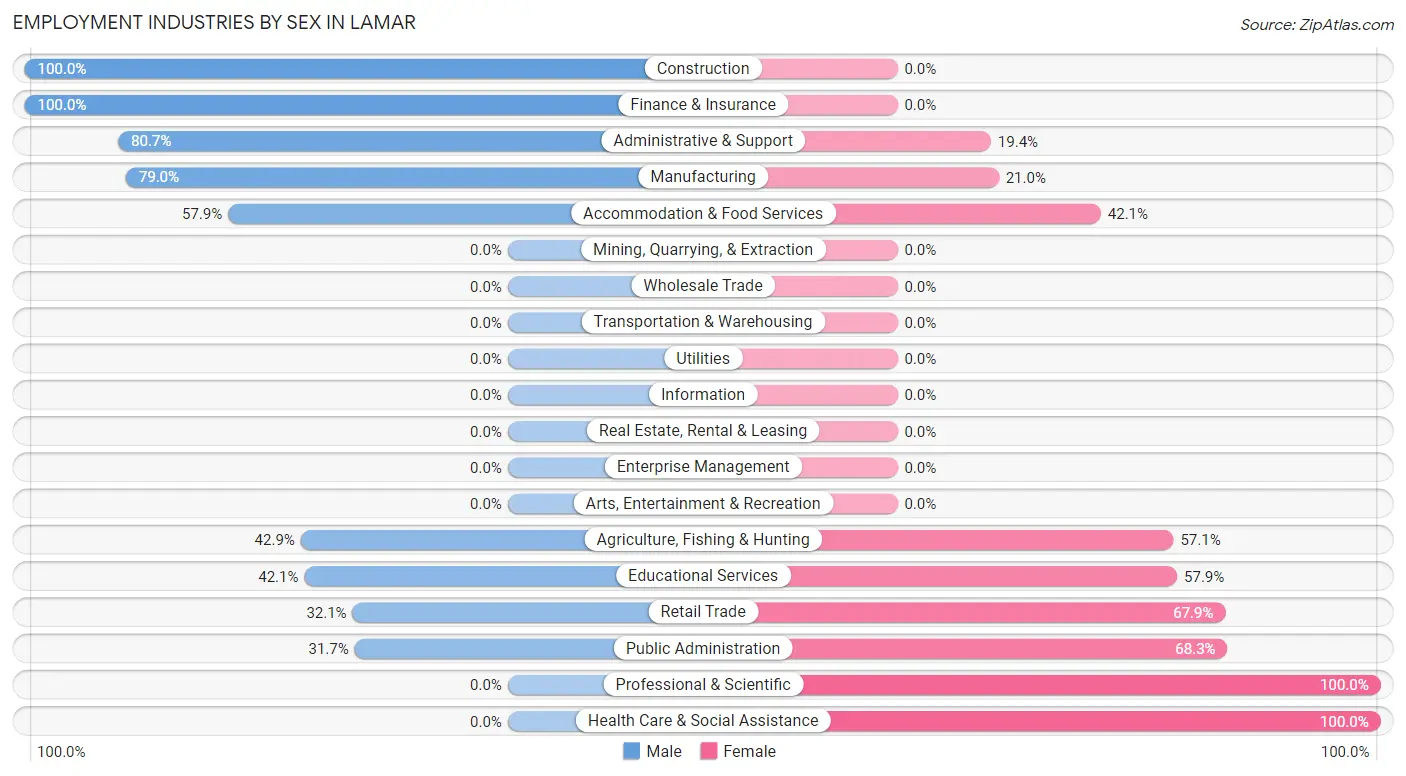
| Industry | Male | Female |
| Agriculture, Fishing & Hunting | 3 (42.9%) | 4 (57.1%) |
| Mining, Quarrying, & Extraction | 0 (0.0%) | 0 (0.0%) |
| Construction | 44 (100.0%) | 0 (0.0%) |
| Manufacturing | 49 (79.0%) | 13 (21.0%) |
| Wholesale Trade | 0 (0.0%) | 0 (0.0%) |
| Retail Trade | 18 (32.1%) | 38 (67.9%) |
| Transportation & Warehousing | 0 (0.0%) | 0 (0.0%) |
| Utilities | 0 (0.0%) | 0 (0.0%) |
| Information | 0 (0.0%) | 0 (0.0%) |
| Finance & Insurance | 6 (100.0%) | 0 (0.0%) |
| Real Estate, Rental & Leasing | 0 (0.0%) | 0 (0.0%) |
| Professional & Scientific | 0 (0.0%) | 8 (100.0%) |
| Enterprise Management | 0 (0.0%) | 0 (0.0%) |
| Administrative & Support | 25 (80.6%) | 6 (19.4%) |
| Educational Services | 8 (42.1%) | 11 (57.9%) |
| Health Care & Social Assistance | 0 (0.0%) | 44 (100.0%) |
| Arts, Entertainment & Recreation | 0 (0.0%) | 0 (0.0%) |
| Accommodation & Food Services | 22 (57.9%) | 16 (42.1%) |
| Public Administration | 13 (31.7%) | 28 (68.3%) |
| Total | 188 (52.5%) | 170 (47.5%) |
Education in Lamar
School Enrollment in Lamar
The most common levels of schooling among the 99 students in Lamar are middle school (53 | 53.5%), high school (23 | 23.2%), and college / undergraduate (16 | 16.2%).
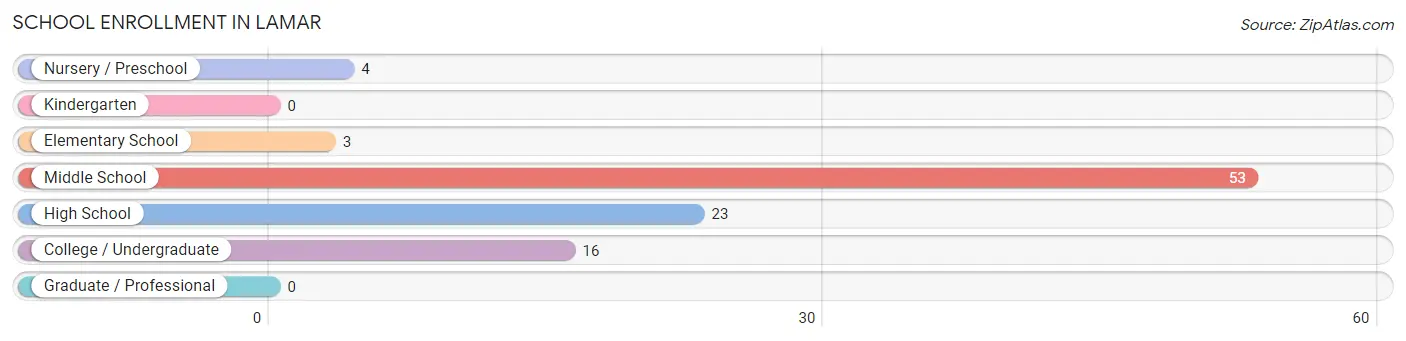
| School Level | # Students | % Students |
| Nursery / Preschool | 4 | 4.0% |
| Kindergarten | 0 | 0.0% |
| Elementary School | 3 | 3.0% |
| Middle School | 53 | 53.5% |
| High School | 23 | 23.2% |
| College / Undergraduate | 16 | 16.2% |
| Graduate / Professional | 0 | 0.0% |
| Total | 99 | 100.0% |
School Enrollment by Age by Funding Source in Lamar
Out of a total of 99 students who are enrolled in schools in Lamar, 11 (11.1%) attend a private institution, while the remaining 88 (88.9%) are enrolled in public schools. The age group of 3 to 4 year olds has the highest likelihood of being enrolled in private schools, with 4 (100.0% in the age bracket) enrolled. Conversely, the age group of 5 to 9 year old has the lowest likelihood of being enrolled in a private school, with 3 (100.0% in the age bracket) attending a public institution.
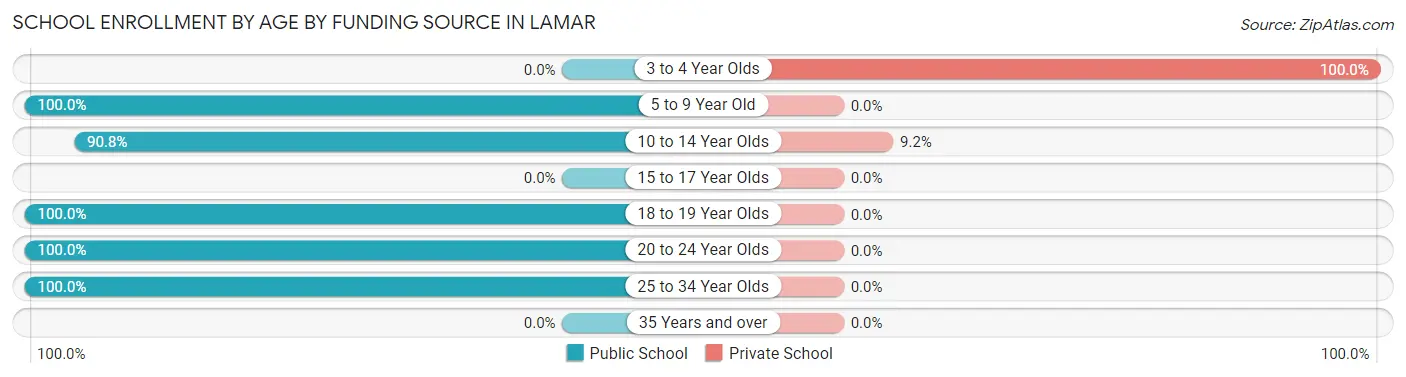
| Age Bracket | Public School | Private School |
| 3 to 4 Year Olds | 0 (0.0%) | 4 (100.0%) |
| 5 to 9 Year Old | 3 (100.0%) | 0 (0.0%) |
| 10 to 14 Year Olds | 69 (90.8%) | 7 (9.2%) |
| 15 to 17 Year Olds | 0 (0.0%) | 0 (0.0%) |
| 18 to 19 Year Olds | 7 (100.0%) | 0 (0.0%) |
| 20 to 24 Year Olds | 6 (100.0%) | 0 (0.0%) |
| 25 to 34 Year Olds | 3 (100.0%) | 0 (0.0%) |
| 35 Years and over | 0 (0.0%) | 0 (0.0%) |
| Total | 88 (88.9%) | 11 (11.1%) |
Educational Attainment by Field of Study in Lamar
Arts & humanities (10 | 23.3%), visual & performing arts (8 | 18.6%), science & technology (6 | 14.0%), bio, nature & agricultural (5 | 11.6%), and communications (5 | 11.6%) are the most common fields of study among 43 individuals in Lamar who have obtained a bachelor's degree or higher.
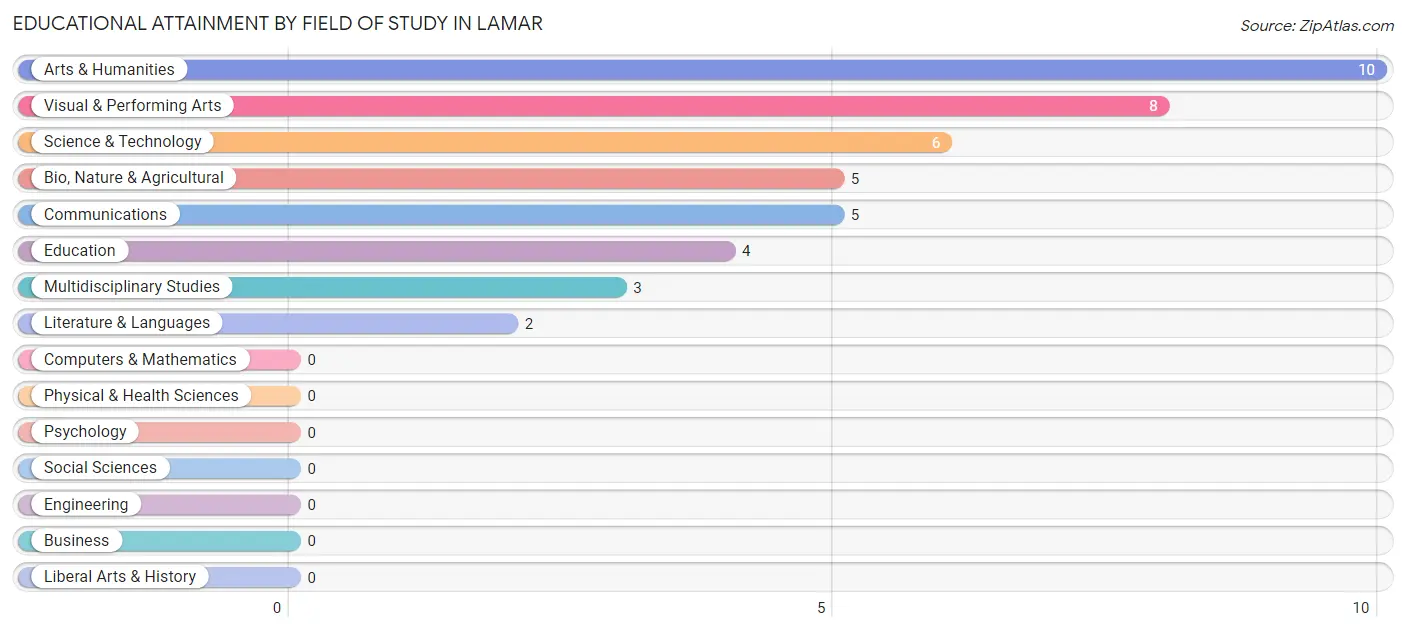
| Field of Study | # Graduates | % Graduates |
| Computers & Mathematics | 0 | 0.0% |
| Bio, Nature & Agricultural | 5 | 11.6% |
| Physical & Health Sciences | 0 | 0.0% |
| Psychology | 0 | 0.0% |
| Social Sciences | 0 | 0.0% |
| Engineering | 0 | 0.0% |
| Multidisciplinary Studies | 3 | 7.0% |
| Science & Technology | 6 | 14.0% |
| Business | 0 | 0.0% |
| Education | 4 | 9.3% |
| Literature & Languages | 2 | 4.6% |
| Liberal Arts & History | 0 | 0.0% |
| Visual & Performing Arts | 8 | 18.6% |
| Communications | 5 | 11.6% |
| Arts & Humanities | 10 | 23.3% |
| Total | 43 | 100.0% |
Transportation & Commute in Lamar
Vehicle Availability by Sex in Lamar
The most prevalent vehicle ownership categories in Lamar are males with 2 vehicles (70, accounting for 37.2%) and females with 2 vehicles (64, making up 45.2%).
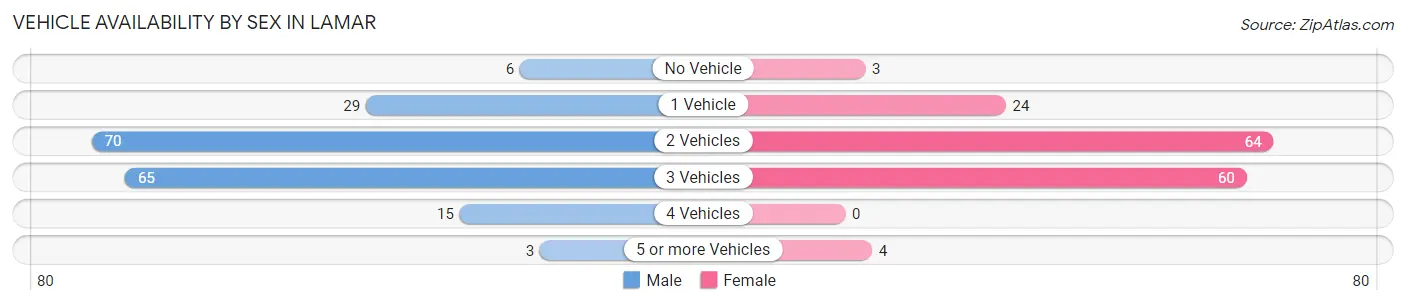
| Vehicles Available | Male | Female |
| No Vehicle | 6 (3.2%) | 3 (1.9%) |
| 1 Vehicle | 29 (15.4%) | 24 (15.5%) |
| 2 Vehicles | 70 (37.2%) | 64 (41.3%) |
| 3 Vehicles | 65 (34.6%) | 60 (38.7%) |
| 4 Vehicles | 15 (8.0%) | 0 (0.0%) |
| 5 or more Vehicles | 3 (1.6%) | 4 (2.6%) |
| Total | 188 (100.0%) | 155 (100.0%) |
Commute Time in Lamar
The most frequently occuring commute durations in Lamar are 5 to 9 minutes (71 commuters, 21.3%), 20 to 24 minutes (56 commuters, 16.8%), and 30 to 34 minutes (56 commuters, 16.8%).
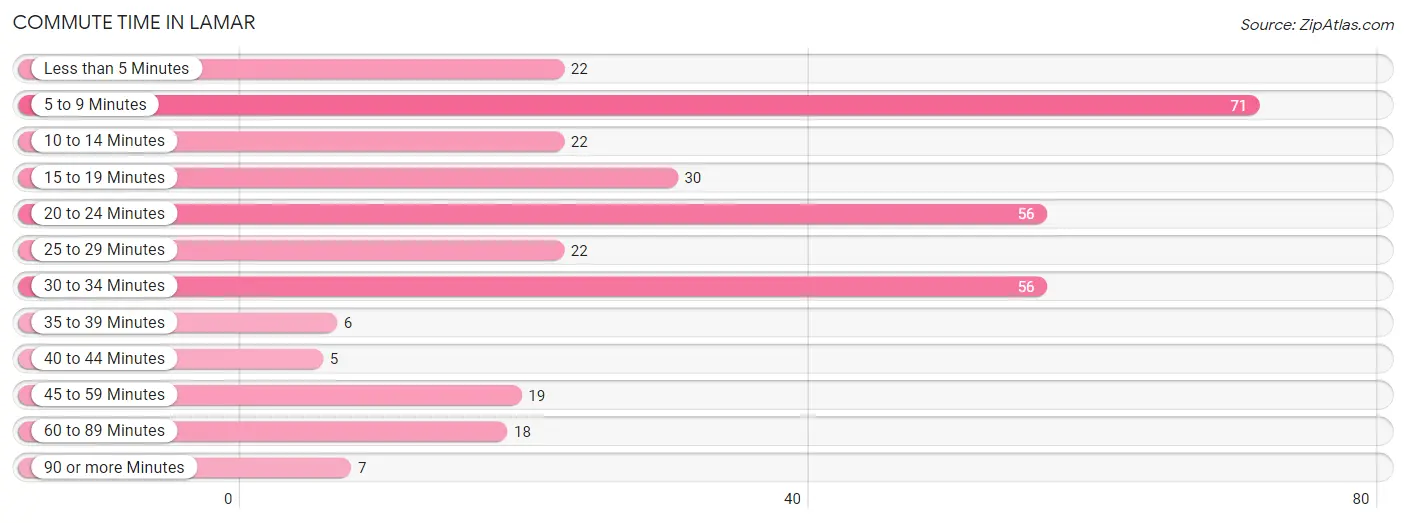
| Commute Time | # Commuters | % Commuters |
| Less than 5 Minutes | 22 | 6.6% |
| 5 to 9 Minutes | 71 | 21.3% |
| 10 to 14 Minutes | 22 | 6.6% |
| 15 to 19 Minutes | 30 | 9.0% |
| 20 to 24 Minutes | 56 | 16.8% |
| 25 to 29 Minutes | 22 | 6.6% |
| 30 to 34 Minutes | 56 | 16.8% |
| 35 to 39 Minutes | 6 | 1.8% |
| 40 to 44 Minutes | 5 | 1.5% |
| 45 to 59 Minutes | 19 | 5.7% |
| 60 to 89 Minutes | 18 | 5.4% |
| 90 or more Minutes | 7 | 2.1% |
Commute Time by Sex in Lamar
The most common commute times in Lamar are 30 to 34 minutes (46 commuters, 24.5%) for males and 20 to 24 minutes (40 commuters, 27.4%) for females.
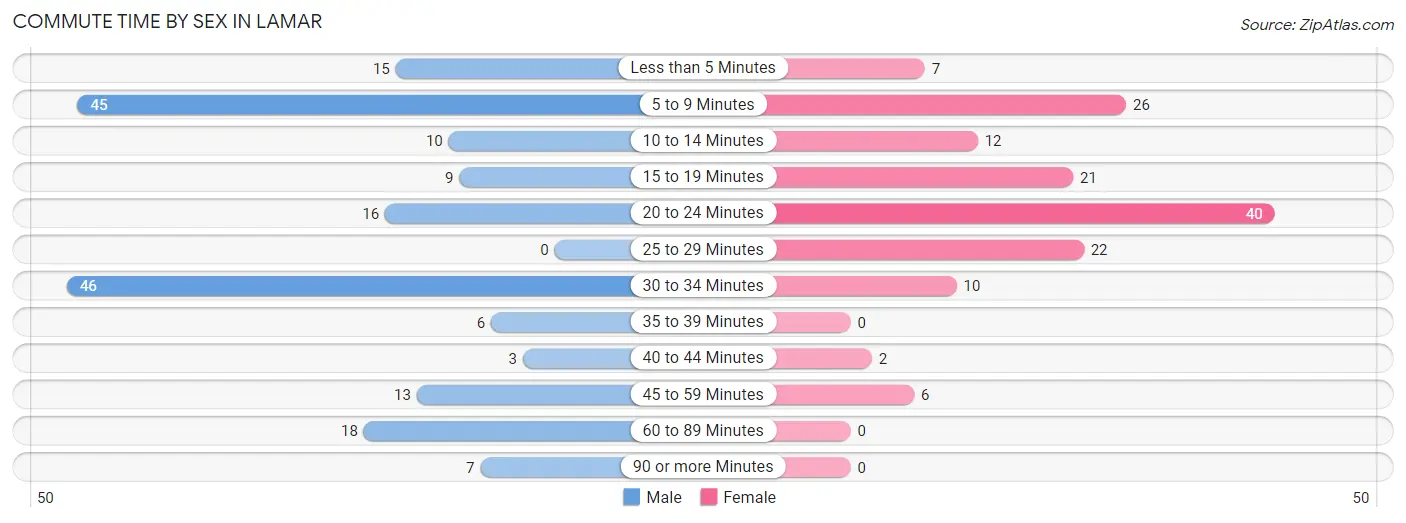
| Commute Time | Male | Female |
| Less than 5 Minutes | 15 (8.0%) | 7 (4.8%) |
| 5 to 9 Minutes | 45 (23.9%) | 26 (17.8%) |
| 10 to 14 Minutes | 10 (5.3%) | 12 (8.2%) |
| 15 to 19 Minutes | 9 (4.8%) | 21 (14.4%) |
| 20 to 24 Minutes | 16 (8.5%) | 40 (27.4%) |
| 25 to 29 Minutes | 0 (0.0%) | 22 (15.1%) |
| 30 to 34 Minutes | 46 (24.5%) | 10 (6.9%) |
| 35 to 39 Minutes | 6 (3.2%) | 0 (0.0%) |
| 40 to 44 Minutes | 3 (1.6%) | 2 (1.4%) |
| 45 to 59 Minutes | 13 (6.9%) | 6 (4.1%) |
| 60 to 89 Minutes | 18 (9.6%) | 0 (0.0%) |
| 90 or more Minutes | 7 (3.7%) | 0 (0.0%) |
Time of Departure to Work by Sex in Lamar
The most frequent times of departure to work in Lamar are 6:00 AM to 6:29 AM (65, 34.6%) for males and 7:30 AM to 7:59 AM (45, 30.8%) for females.
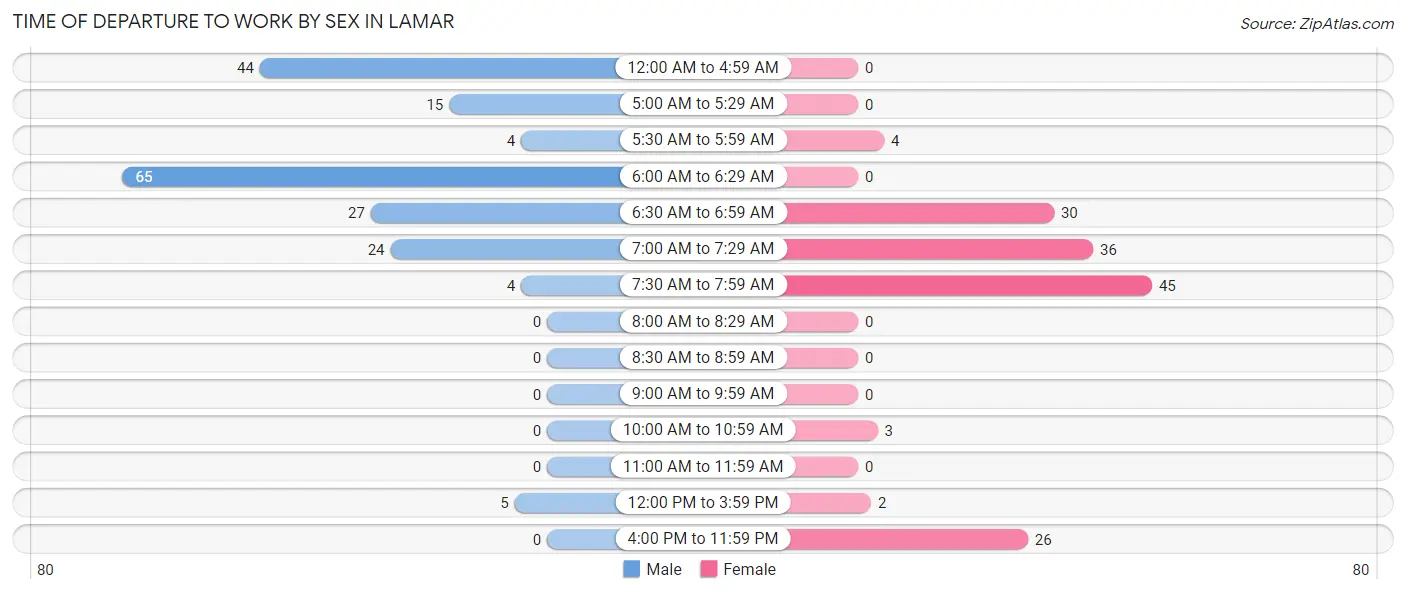
| Time of Departure | Male | Female |
| 12:00 AM to 4:59 AM | 44 (23.4%) | 0 (0.0%) |
| 5:00 AM to 5:29 AM | 15 (8.0%) | 0 (0.0%) |
| 5:30 AM to 5:59 AM | 4 (2.1%) | 4 (2.7%) |
| 6:00 AM to 6:29 AM | 65 (34.6%) | 0 (0.0%) |
| 6:30 AM to 6:59 AM | 27 (14.4%) | 30 (20.5%) |
| 7:00 AM to 7:29 AM | 24 (12.8%) | 36 (24.7%) |
| 7:30 AM to 7:59 AM | 4 (2.1%) | 45 (30.8%) |
| 8:00 AM to 8:29 AM | 0 (0.0%) | 0 (0.0%) |
| 8:30 AM to 8:59 AM | 0 (0.0%) | 0 (0.0%) |
| 9:00 AM to 9:59 AM | 0 (0.0%) | 0 (0.0%) |
| 10:00 AM to 10:59 AM | 0 (0.0%) | 3 (2.1%) |
| 11:00 AM to 11:59 AM | 0 (0.0%) | 0 (0.0%) |
| 12:00 PM to 3:59 PM | 5 (2.7%) | 2 (1.4%) |
| 4:00 PM to 11:59 PM | 0 (0.0%) | 26 (17.8%) |
| Total | 188 (100.0%) | 146 (100.0%) |
Housing Occupancy in Lamar
Occupancy by Ownership in Lamar
Of the total 265 dwellings in Lamar, owner-occupied units account for 208 (78.5%), while renter-occupied units make up 57 (21.5%).
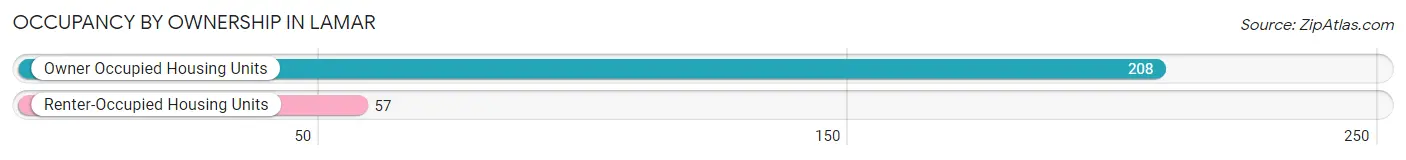
| Occupancy | # Housing Units | % Housing Units |
| Owner Occupied Housing Units | 208 | 78.5% |
| Renter-Occupied Housing Units | 57 | 21.5% |
| Total Occupied Housing Units | 265 | 100.0% |
Occupancy by Household Size in Lamar
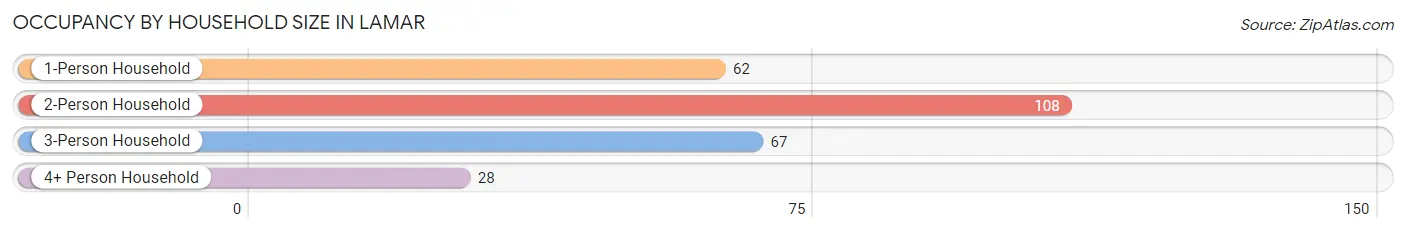
| Household Size | # Housing Units | % Housing Units |
| 1-Person Household | 62 | 23.4% |
| 2-Person Household | 108 | 40.7% |
| 3-Person Household | 67 | 25.3% |
| 4+ Person Household | 28 | 10.6% |
| Total Housing Units | 265 | 100.0% |
Occupancy by Ownership by Household Size in Lamar
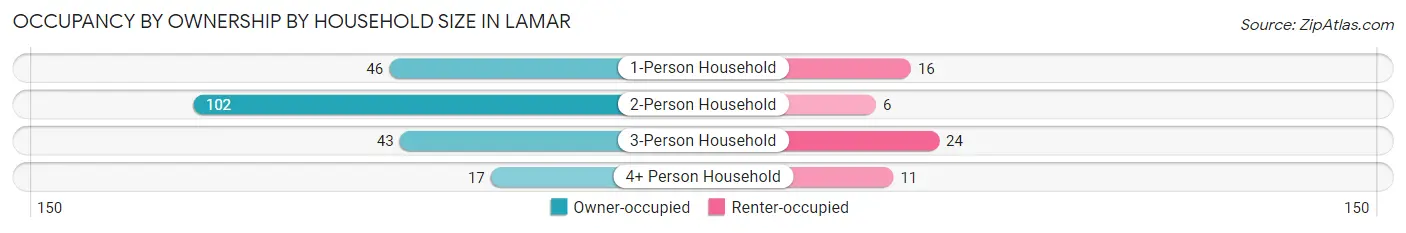
| Household Size | Owner-occupied | Renter-occupied |
| 1-Person Household | 46 (74.2%) | 16 (25.8%) |
| 2-Person Household | 102 (94.4%) | 6 (5.6%) |
| 3-Person Household | 43 (64.2%) | 24 (35.8%) |
| 4+ Person Household | 17 (60.7%) | 11 (39.3%) |
| Total Housing Units | 208 (78.5%) | 57 (21.5%) |
Occupancy by Educational Attainment in Lamar
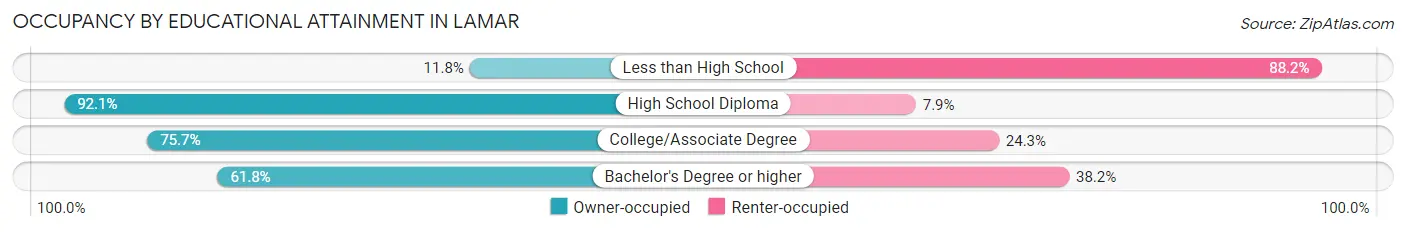
| Household Size | Owner-occupied | Renter-occupied |
| Less than High School | 2 (11.8%) | 15 (88.2%) |
| High School Diploma | 129 (92.1%) | 11 (7.9%) |
| College/Associate Degree | 56 (75.7%) | 18 (24.3%) |
| Bachelor's Degree or higher | 21 (61.8%) | 13 (38.2%) |
Occupancy by Age of Householder in Lamar
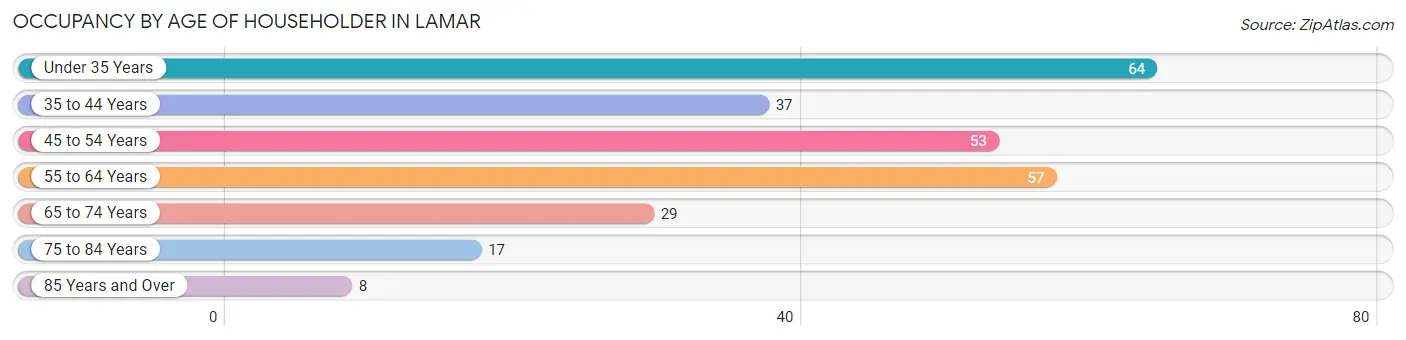
| Age Bracket | # Households | % Households |
| Under 35 Years | 64 | 24.1% |
| 35 to 44 Years | 37 | 14.0% |
| 45 to 54 Years | 53 | 20.0% |
| 55 to 64 Years | 57 | 21.5% |
| 65 to 74 Years | 29 | 10.9% |
| 75 to 84 Years | 17 | 6.4% |
| 85 Years and Over | 8 | 3.0% |
| Total | 265 | 100.0% |
Housing Finances in Lamar
Median Income by Occupancy in Lamar
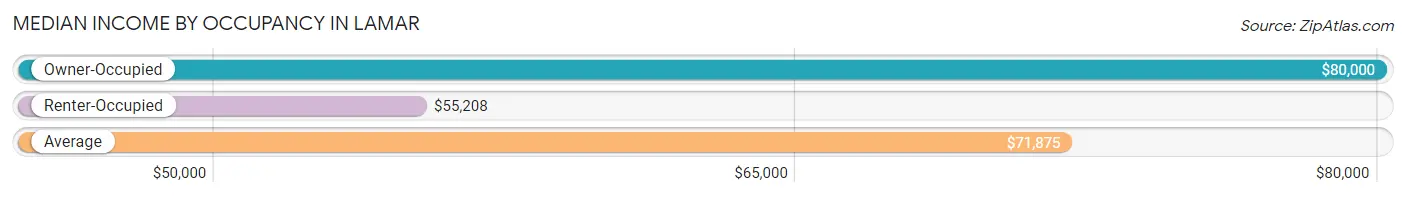
| Occupancy Type | # Households | Median Income |
| Owner-Occupied | 208 (78.5%) | $80,000 |
| Renter-Occupied | 57 (21.5%) | $55,208 |
| Average | 265 (100.0%) | $71,875 |
Occupancy by Householder Income Bracket in Lamar
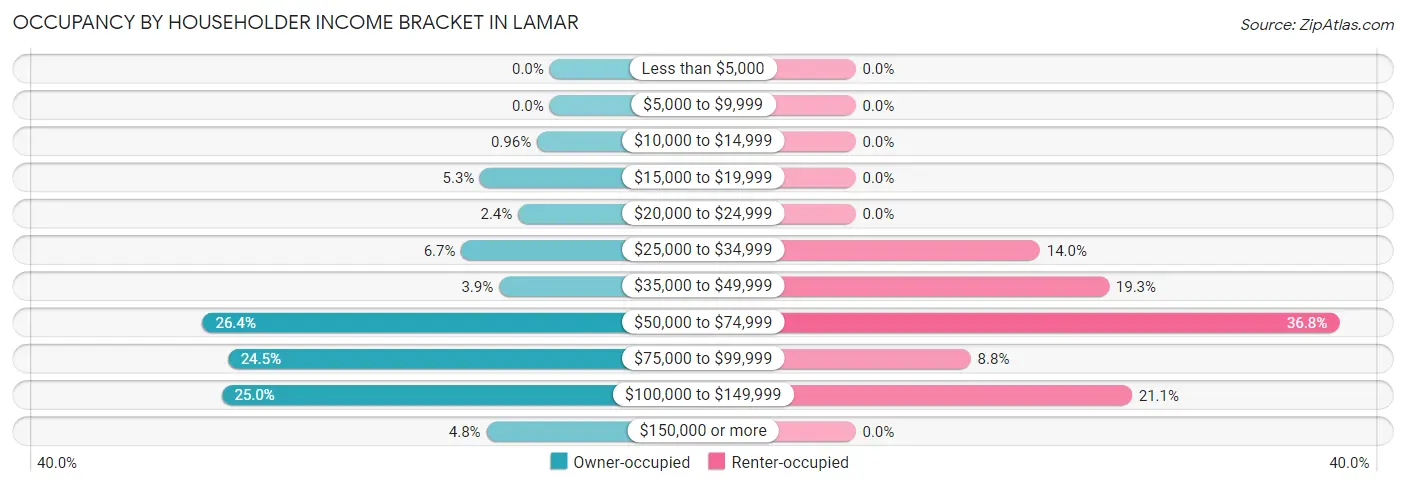
| Income Bracket | Owner-occupied | Renter-occupied |
| Less than $5,000 | 0 (0.0%) | 0 (0.0%) |
| $5,000 to $9,999 | 0 (0.0%) | 0 (0.0%) |
| $10,000 to $14,999 | 2 (1.0%) | 0 (0.0%) |
| $15,000 to $19,999 | 11 (5.3%) | 0 (0.0%) |
| $20,000 to $24,999 | 5 (2.4%) | 0 (0.0%) |
| $25,000 to $34,999 | 14 (6.7%) | 8 (14.0%) |
| $35,000 to $49,999 | 8 (3.8%) | 11 (19.3%) |
| $50,000 to $74,999 | 55 (26.4%) | 21 (36.8%) |
| $75,000 to $99,999 | 51 (24.5%) | 5 (8.8%) |
| $100,000 to $149,999 | 52 (25.0%) | 12 (21.0%) |
| $150,000 or more | 10 (4.8%) | 0 (0.0%) |
| Total | 208 (100.0%) | 57 (100.0%) |
Monthly Housing Cost Tiers in Lamar
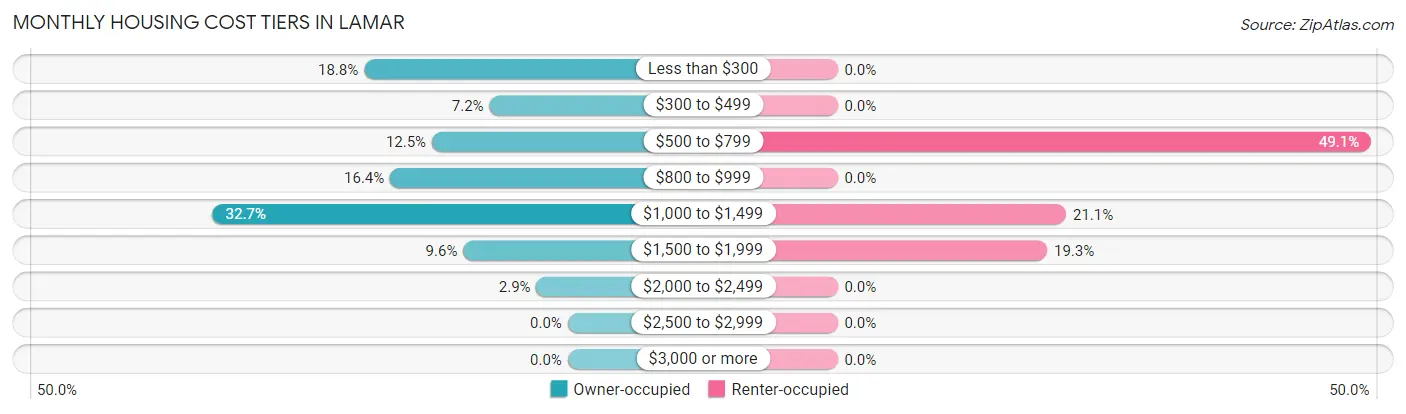
| Monthly Cost | Owner-occupied | Renter-occupied |
| Less than $300 | 39 (18.8%) | 0 (0.0%) |
| $300 to $499 | 15 (7.2%) | 0 (0.0%) |
| $500 to $799 | 26 (12.5%) | 28 (49.1%) |
| $800 to $999 | 34 (16.4%) | 0 (0.0%) |
| $1,000 to $1,499 | 68 (32.7%) | 12 (21.0%) |
| $1,500 to $1,999 | 20 (9.6%) | 11 (19.3%) |
| $2,000 to $2,499 | 6 (2.9%) | 0 (0.0%) |
| $2,500 to $2,999 | 0 (0.0%) | 0 (0.0%) |
| $3,000 or more | 0 (0.0%) | 0 (0.0%) |
| Total | 208 (100.0%) | 57 (100.0%) |
Physical Housing Characteristics in Lamar
Housing Structures in Lamar
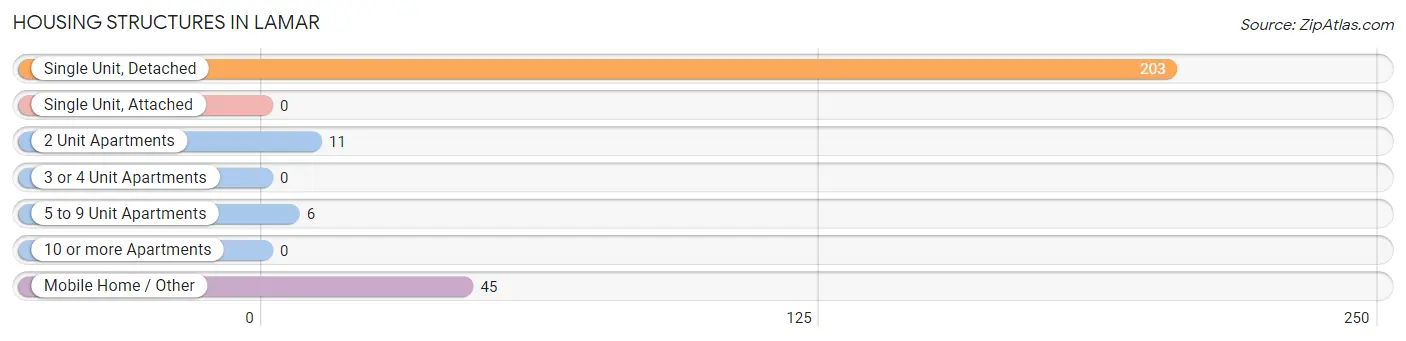
| Structure Type | # Housing Units | % Housing Units |
| Single Unit, Detached | 203 | 76.6% |
| Single Unit, Attached | 0 | 0.0% |
| 2 Unit Apartments | 11 | 4.2% |
| 3 or 4 Unit Apartments | 0 | 0.0% |
| 5 to 9 Unit Apartments | 6 | 2.3% |
| 10 or more Apartments | 0 | 0.0% |
| Mobile Home / Other | 45 | 17.0% |
| Total | 265 | 100.0% |
Housing Structures by Occupancy in Lamar
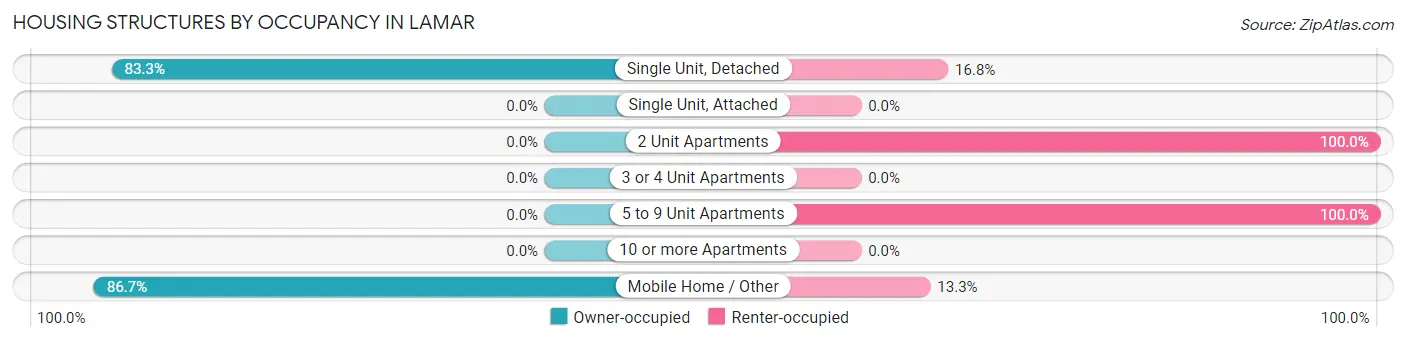
| Structure Type | Owner-occupied | Renter-occupied |
| Single Unit, Detached | 169 (83.3%) | 34 (16.8%) |
| Single Unit, Attached | 0 (0.0%) | 0 (0.0%) |
| 2 Unit Apartments | 0 (0.0%) | 11 (100.0%) |
| 3 or 4 Unit Apartments | 0 (0.0%) | 0 (0.0%) |
| 5 to 9 Unit Apartments | 0 (0.0%) | 6 (100.0%) |
| 10 or more Apartments | 0 (0.0%) | 0 (0.0%) |
| Mobile Home / Other | 39 (86.7%) | 6 (13.3%) |
| Total | 208 (78.5%) | 57 (21.5%) |
Housing Structures by Number of Rooms in Lamar
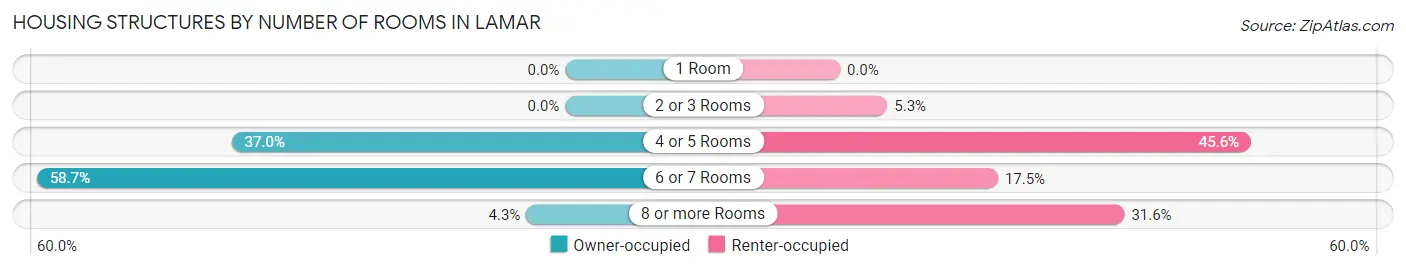
| Number of Rooms | Owner-occupied | Renter-occupied |
| 1 Room | 0 (0.0%) | 0 (0.0%) |
| 2 or 3 Rooms | 0 (0.0%) | 3 (5.3%) |
| 4 or 5 Rooms | 77 (37.0%) | 26 (45.6%) |
| 6 or 7 Rooms | 122 (58.7%) | 10 (17.5%) |
| 8 or more Rooms | 9 (4.3%) | 18 (31.6%) |
| Total | 208 (100.0%) | 57 (100.0%) |
Housing Structure by Heating Type in Lamar
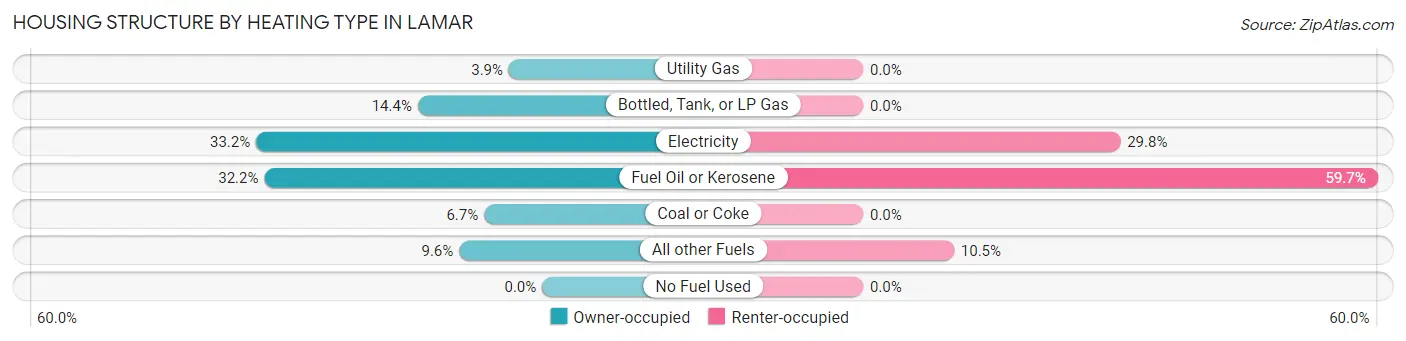
| Heating Type | Owner-occupied | Renter-occupied |
| Utility Gas | 8 (3.8%) | 0 (0.0%) |
| Bottled, Tank, or LP Gas | 30 (14.4%) | 0 (0.0%) |
| Electricity | 69 (33.2%) | 17 (29.8%) |
| Fuel Oil or Kerosene | 67 (32.2%) | 34 (59.7%) |
| Coal or Coke | 14 (6.7%) | 0 (0.0%) |
| All other Fuels | 20 (9.6%) | 6 (10.5%) |
| No Fuel Used | 0 (0.0%) | 0 (0.0%) |
| Total | 208 (100.0%) | 57 (100.0%) |
Household Vehicle Usage in Lamar
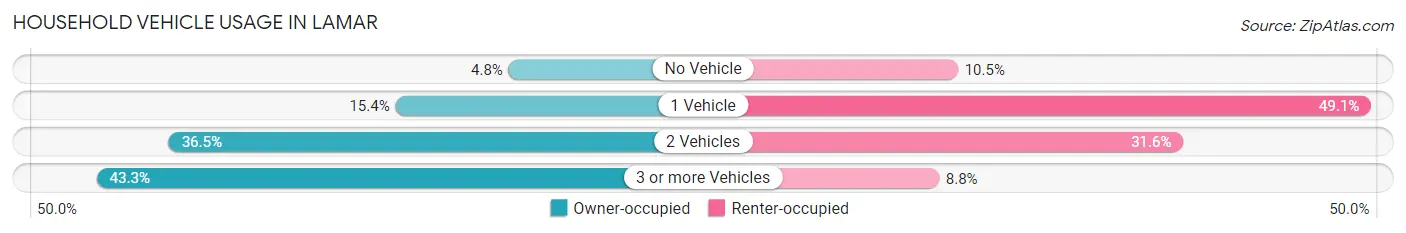
| Vehicles per Household | Owner-occupied | Renter-occupied |
| No Vehicle | 10 (4.8%) | 6 (10.5%) |
| 1 Vehicle | 32 (15.4%) | 28 (49.1%) |
| 2 Vehicles | 76 (36.5%) | 18 (31.6%) |
| 3 or more Vehicles | 90 (43.3%) | 5 (8.8%) |
| Total | 208 (100.0%) | 57 (100.0%) |
Real Estate & Mortgages in Lamar
Real Estate and Mortgage Overview in Lamar
| Characteristic | Without Mortgage | With Mortgage |
| Housing Units | 80 | 128 |
| Median Property Value | $168,200 | $171,300 |
| Median Household Income | $50,000 | $10 |
| Monthly Housing Costs | $357 | $0 |
| Real Estate Taxes | $1,417 | $2 |
Property Value by Mortgage Status in Lamar
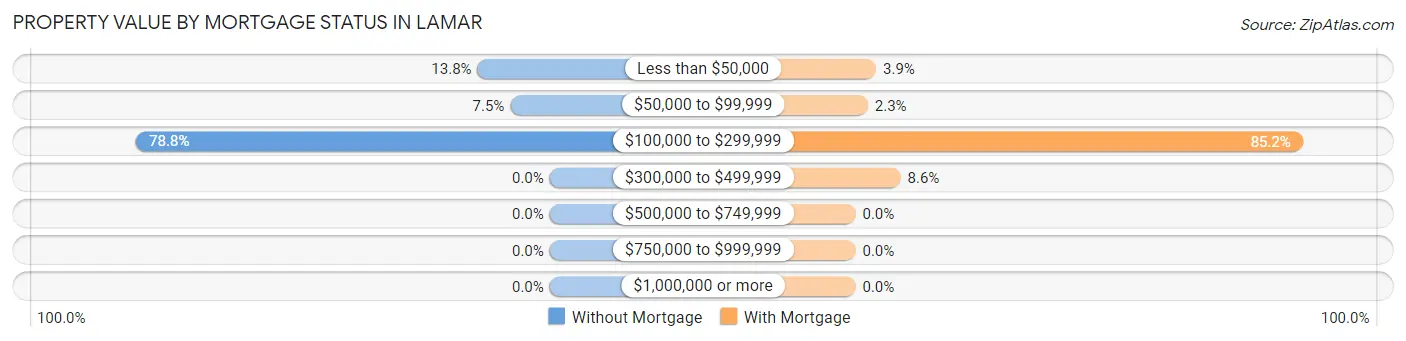
| Property Value | Without Mortgage | With Mortgage |
| Less than $50,000 | 11 (13.8%) | 5 (3.9%) |
| $50,000 to $99,999 | 6 (7.5%) | 3 (2.3%) |
| $100,000 to $299,999 | 63 (78.7%) | 109 (85.2%) |
| $300,000 to $499,999 | 0 (0.0%) | 11 (8.6%) |
| $500,000 to $749,999 | 0 (0.0%) | 0 (0.0%) |
| $750,000 to $999,999 | 0 (0.0%) | 0 (0.0%) |
| $1,000,000 or more | 0 (0.0%) | 0 (0.0%) |
| Total | 80 (100.0%) | 128 (100.0%) |
Household Income by Mortgage Status in Lamar
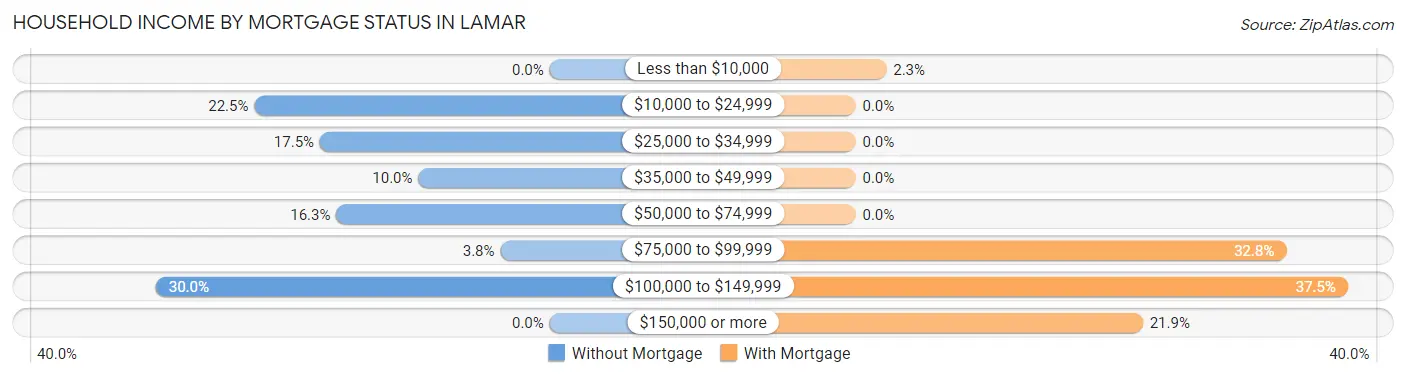
| Household Income | Without Mortgage | With Mortgage |
| Less than $10,000 | 0 (0.0%) | 3 (2.3%) |
| $10,000 to $24,999 | 18 (22.5%) | 0 (0.0%) |
| $25,000 to $34,999 | 14 (17.5%) | 0 (0.0%) |
| $35,000 to $49,999 | 8 (10.0%) | 0 (0.0%) |
| $50,000 to $74,999 | 13 (16.3%) | 0 (0.0%) |
| $75,000 to $99,999 | 3 (3.7%) | 42 (32.8%) |
| $100,000 to $149,999 | 24 (30.0%) | 48 (37.5%) |
| $150,000 or more | 0 (0.0%) | 28 (21.9%) |
| Total | 80 (100.0%) | 128 (100.0%) |
Property Value to Household Income Ratio in Lamar
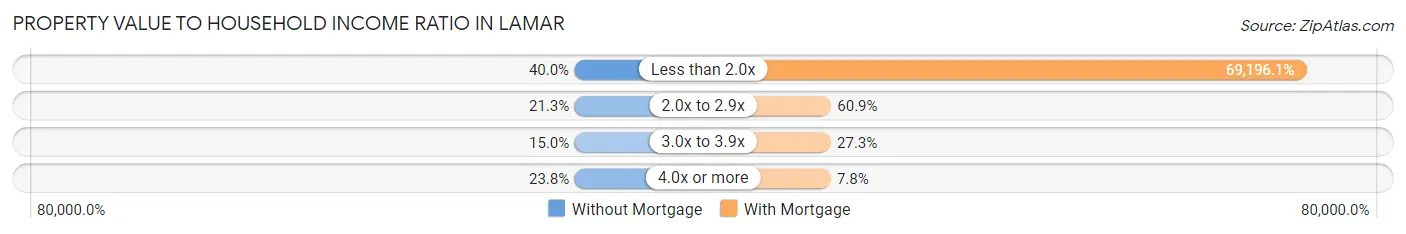
| Value-to-Income Ratio | Without Mortgage | With Mortgage |
| Less than 2.0x | 32 (40.0%) | 88,571 (69,196.1%) |
| 2.0x to 2.9x | 17 (21.2%) | 78 (60.9%) |
| 3.0x to 3.9x | 12 (15.0%) | 35 (27.3%) |
| 4.0x or more | 19 (23.7%) | 10 (7.8%) |
| Total | 80 (100.0%) | 128 (100.0%) |
Real Estate Taxes by Mortgage Status in Lamar
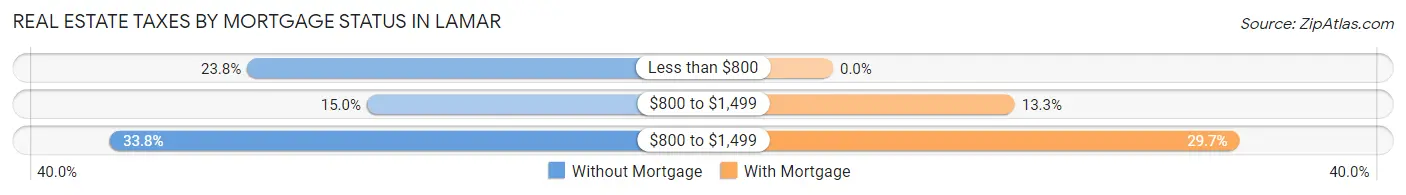
| Property Taxes | Without Mortgage | With Mortgage |
| Less than $800 | 19 (23.7%) | 0 (0.0%) |
| $800 to $1,499 | 12 (15.0%) | 17 (13.3%) |
| $800 to $1,499 | 27 (33.8%) | 38 (29.7%) |
| Total | 80 (100.0%) | 128 (100.0%) |
Health & Disability in Lamar
Health Insurance Coverage by Age in Lamar
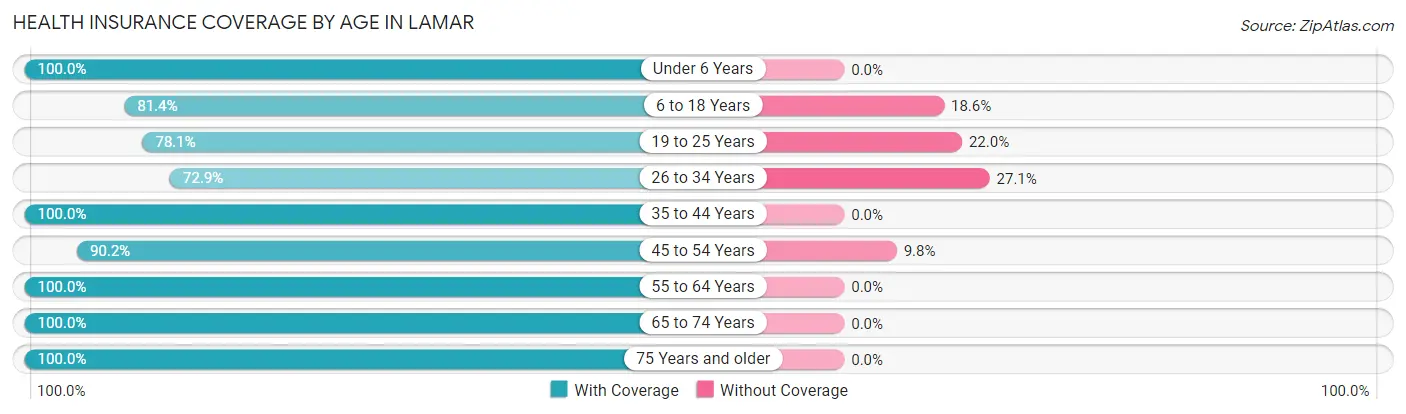
| Age Bracket | With Coverage | Without Coverage |
| Under 6 Years | 57 (100.0%) | 0 (0.0%) |
| 6 to 18 Years | 70 (81.4%) | 16 (18.6%) |
| 19 to 25 Years | 32 (78.0%) | 9 (22.0%) |
| 26 to 34 Years | 78 (72.9%) | 29 (27.1%) |
| 35 to 44 Years | 52 (100.0%) | 0 (0.0%) |
| 45 to 54 Years | 120 (90.2%) | 13 (9.8%) |
| 55 to 64 Years | 82 (100.0%) | 0 (0.0%) |
| 65 to 74 Years | 43 (100.0%) | 0 (0.0%) |
| 75 Years and older | 40 (100.0%) | 0 (0.0%) |
| Total | 574 (89.5%) | 67 (10.4%) |
Health Insurance Coverage by Citizenship Status in Lamar
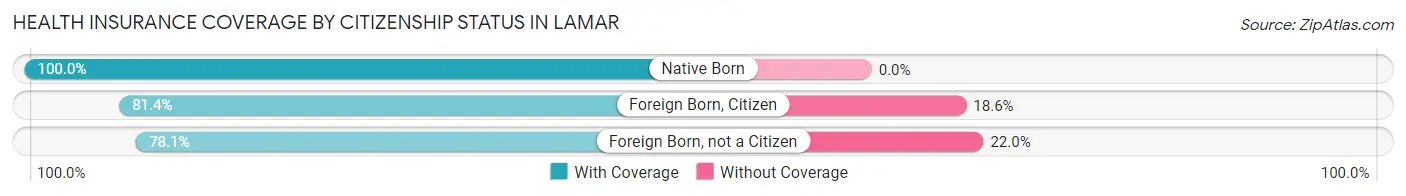
| Citizenship Status | With Coverage | Without Coverage |
| Native Born | 57 (100.0%) | 0 (0.0%) |
| Foreign Born, Citizen | 70 (81.4%) | 16 (18.6%) |
| Foreign Born, not a Citizen | 32 (78.0%) | 9 (22.0%) |
Health Insurance Coverage by Household Income in Lamar
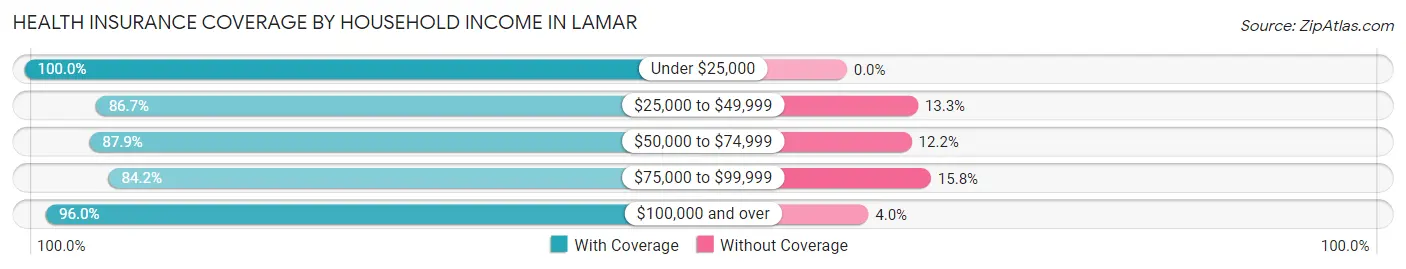
| Household Income | With Coverage | Without Coverage |
| Under $25,000 | 18 (100.0%) | 0 (0.0%) |
| $25,000 to $49,999 | 52 (86.7%) | 8 (13.3%) |
| $50,000 to $74,999 | 159 (87.8%) | 22 (12.1%) |
| $75,000 to $99,999 | 155 (84.2%) | 29 (15.8%) |
| $100,000 and over | 190 (96.0%) | 8 (4.0%) |
Public vs Private Health Insurance Coverage by Age in Lamar
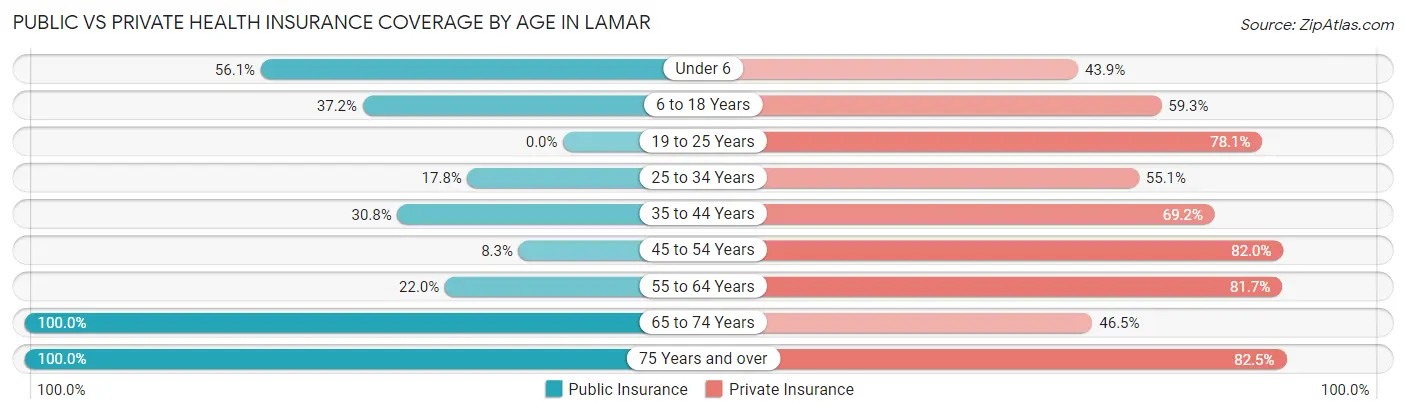
| Age Bracket | Public Insurance | Private Insurance |
| Under 6 | 32 (56.1%) | 25 (43.9%) |
| 6 to 18 Years | 32 (37.2%) | 51 (59.3%) |
| 19 to 25 Years | 0 (0.0%) | 32 (78.0%) |
| 25 to 34 Years | 19 (17.8%) | 59 (55.1%) |
| 35 to 44 Years | 16 (30.8%) | 36 (69.2%) |
| 45 to 54 Years | 11 (8.3%) | 109 (82.0%) |
| 55 to 64 Years | 18 (22.0%) | 67 (81.7%) |
| 65 to 74 Years | 43 (100.0%) | 20 (46.5%) |
| 75 Years and over | 40 (100.0%) | 33 (82.5%) |
| Total | 211 (32.9%) | 432 (67.4%) |
Disability Status by Sex by Age in Lamar
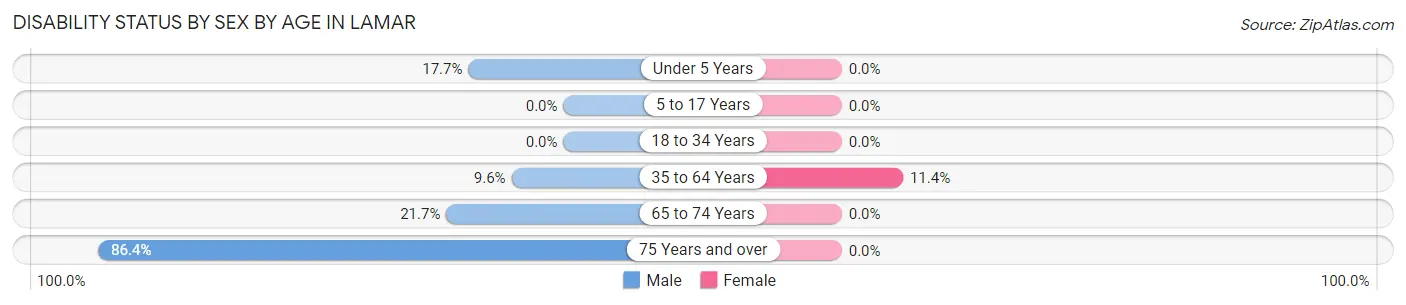
| Age Bracket | Male | Female |
| Under 5 Years | 6 (17.6%) | 0 (0.0%) |
| 5 to 17 Years | 0 (0.0%) | 0 (0.0%) |
| 18 to 34 Years | 0 (0.0%) | 0 (0.0%) |
| 35 to 64 Years | 13 (9.6%) | 15 (11.4%) |
| 65 to 74 Years | 5 (21.7%) | 0 (0.0%) |
| 75 Years and over | 19 (86.4%) | 0 (0.0%) |
Disability Class by Sex by Age in Lamar
Disability Class: Hearing Difficulty
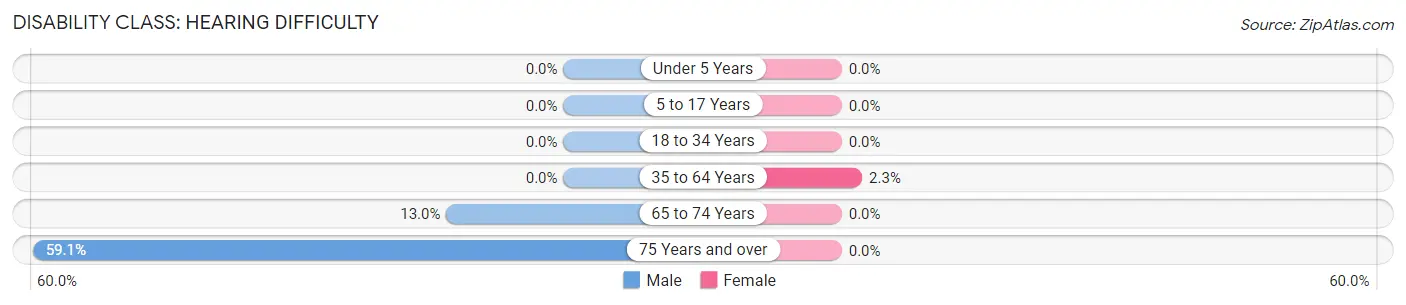
| Age Bracket | Male | Female |
| Under 5 Years | 0 (0.0%) | 0 (0.0%) |
| 5 to 17 Years | 0 (0.0%) | 0 (0.0%) |
| 18 to 34 Years | 0 (0.0%) | 0 (0.0%) |
| 35 to 64 Years | 0 (0.0%) | 3 (2.3%) |
| 65 to 74 Years | 3 (13.0%) | 0 (0.0%) |
| 75 Years and over | 13 (59.1%) | 0 (0.0%) |
Disability Class: Vision Difficulty
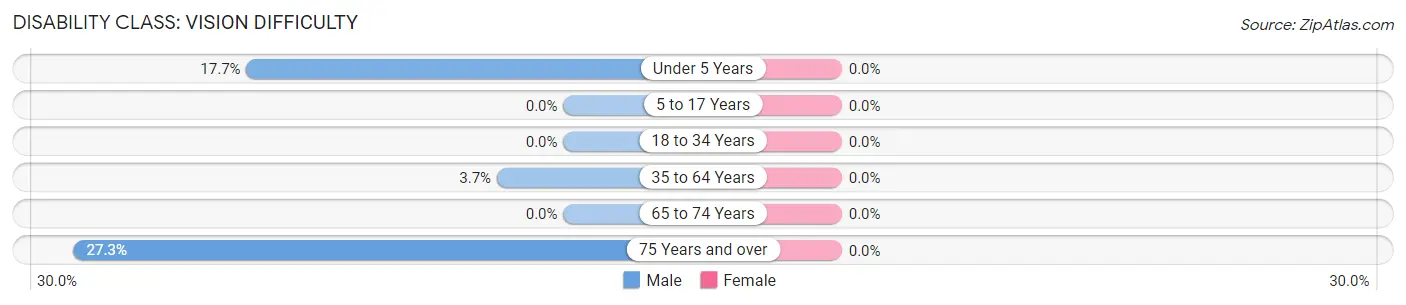
| Age Bracket | Male | Female |
| Under 5 Years | 6 (17.6%) | 0 (0.0%) |
| 5 to 17 Years | 0 (0.0%) | 0 (0.0%) |
| 18 to 34 Years | 0 (0.0%) | 0 (0.0%) |
| 35 to 64 Years | 5 (3.7%) | 0 (0.0%) |
| 65 to 74 Years | 0 (0.0%) | 0 (0.0%) |
| 75 Years and over | 6 (27.3%) | 0 (0.0%) |
Disability Class: Cognitive Difficulty
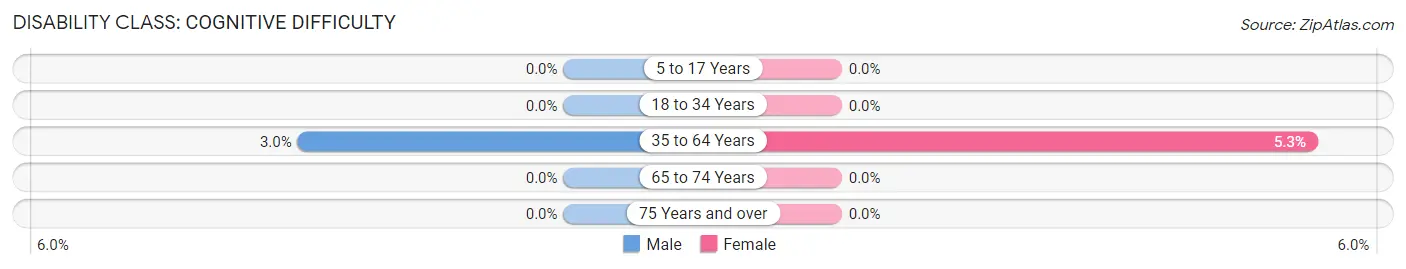
| Age Bracket | Male | Female |
| 5 to 17 Years | 0 (0.0%) | 0 (0.0%) |
| 18 to 34 Years | 0 (0.0%) | 0 (0.0%) |
| 35 to 64 Years | 4 (3.0%) | 7 (5.3%) |
| 65 to 74 Years | 0 (0.0%) | 0 (0.0%) |
| 75 Years and over | 0 (0.0%) | 0 (0.0%) |
Disability Class: Ambulatory Difficulty
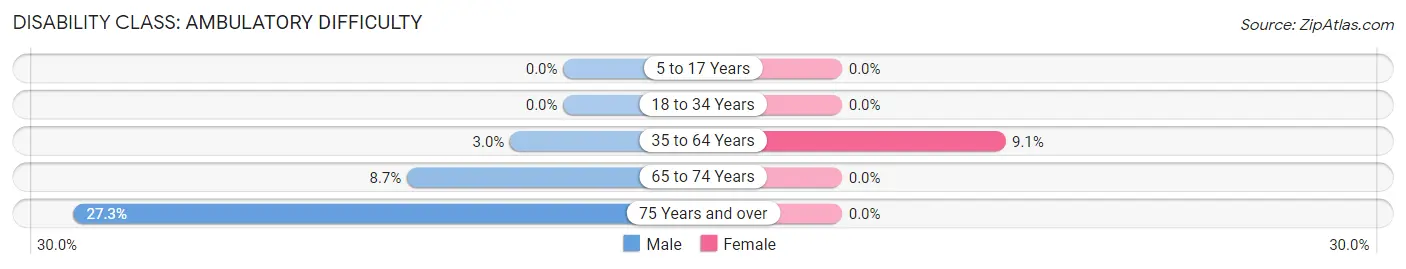
| Age Bracket | Male | Female |
| 5 to 17 Years | 0 (0.0%) | 0 (0.0%) |
| 18 to 34 Years | 0 (0.0%) | 0 (0.0%) |
| 35 to 64 Years | 4 (3.0%) | 12 (9.1%) |
| 65 to 74 Years | 2 (8.7%) | 0 (0.0%) |
| 75 Years and over | 6 (27.3%) | 0 (0.0%) |
Disability Class: Self-Care Difficulty
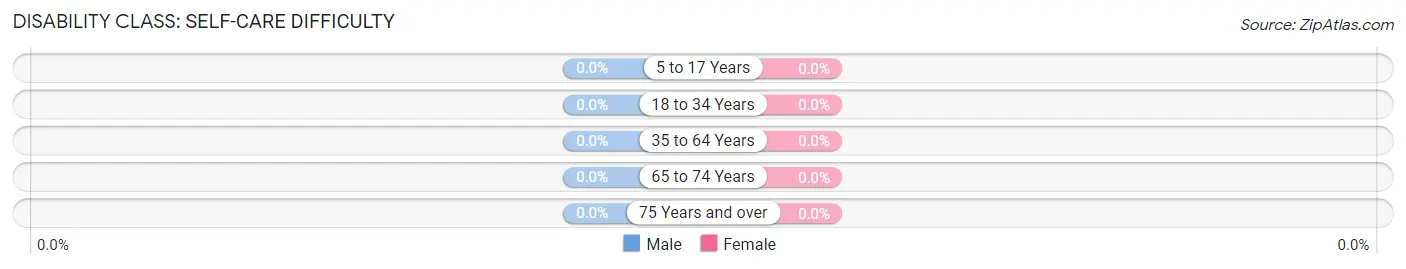
| Age Bracket | Male | Female |
| 5 to 17 Years | 0 (0.0%) | 0 (0.0%) |
| 18 to 34 Years | 0 (0.0%) | 0 (0.0%) |
| 35 to 64 Years | 0 (0.0%) | 0 (0.0%) |
| 65 to 74 Years | 0 (0.0%) | 0 (0.0%) |
| 75 Years and over | 0 (0.0%) | 0 (0.0%) |
Technology Access in Lamar
Computing Device Access in Lamar
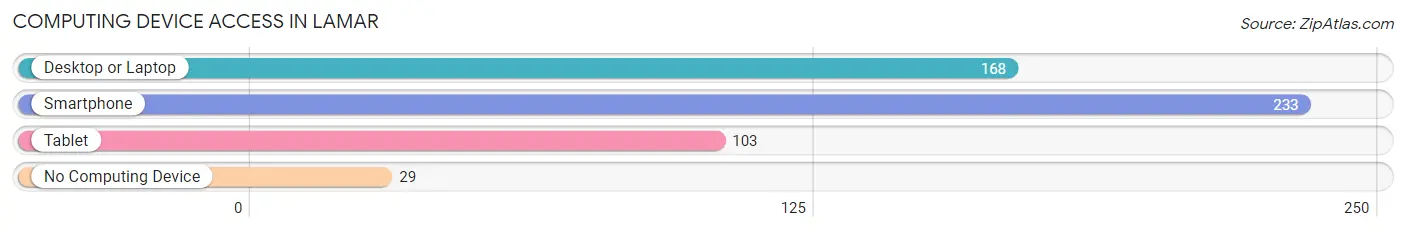
| Device Type | # Households | % Households |
| Desktop or Laptop | 168 | 63.4% |
| Smartphone | 233 | 87.9% |
| Tablet | 103 | 38.9% |
| No Computing Device | 29 | 10.9% |
| Total | 265 | 100.0% |
Internet Access in Lamar
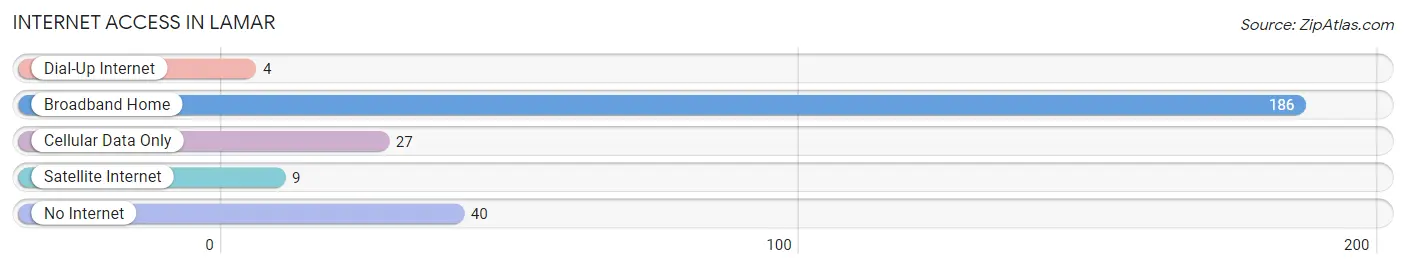
| Internet Type | # Households | % Households |
| Dial-Up Internet | 4 | 1.5% |
| Broadband Home | 186 | 70.2% |
| Cellular Data Only | 27 | 10.2% |
| Satellite Internet | 9 | 3.4% |
| No Internet | 40 | 15.1% |
| Total | 265 | 100.0% |
Lamar Summary
Lamar, Pennsylvania is a small borough located in Clearfield County, Pennsylvania. It is situated in the foothills of the Allegheny Mountains, approximately 20 miles east of the city of DuBois. The population of Lamar was 1,845 as of the 2010 census.
History
The area that is now Lamar was first settled in the early 1800s by a group of settlers from the nearby town of Clearfield. The town was originally known as “Lamartown”, named after the first settler, John Lamar. The town was officially incorporated in 1876.
In the late 1800s, the town was a major hub for the lumber industry. The town was home to several sawmills and lumber yards, and the lumber industry was the primary source of employment for the town’s residents. The lumber industry declined in the early 1900s, and the town’s economy shifted to coal mining. The coal industry was the primary source of employment for the town’s residents until the mid-1900s, when the coal industry began to decline.
Geography
Lamar is located in the foothills of the Allegheny Mountains, approximately 20 miles east of the city of DuBois. The town is situated on the banks of the West Branch of the Susquehanna River. The town is surrounded by rolling hills and forests, and is home to several small streams and creeks.
The climate in Lamar is classified as humid continental, with cold winters and warm summers. The average annual temperature is 48°F, and the average annual precipitation is 40 inches.
Economy
The economy of Lamar is largely based on agriculture and tourism. The town is home to several small farms, and the surrounding area is known for its production of dairy products, beef, and poultry. The town is also home to several small businesses, including restaurants, retail stores, and service providers.
Tourism is an important part of the local economy, as the town is home to several attractions, including the Clearfield County Fairgrounds, the Clearfield County Historical Society Museum, and the Clearfield County Courthouse. The town is also home to several parks and recreational areas, including the West Branch State Park and the Clearfield County Park.
Demographics
As of the 2010 census, the population of Lamar was 1,845. The racial makeup of the town was 97.3% White, 0.7% African American, 0.2% Native American, 0.3% Asian, 0.2% from other races, and 1.3% from two or more races. Hispanic or Latino of any race were 0.7% of the population.
The median household income in Lamar was $37,917, and the median family income was $45,938. The per capita income in Lamar was $18,945. About 11.2% of families and 14.2% of the population were below the poverty line, including 19.2% of those under age 18 and 8.2% of those age 65 or over.
Common Questions
What is Per Capita Income in Lamar?
Per Capita income in Lamar is $34,501.
What is the Median Family Income in Lamar?
Median Family Income in Lamar is $83,750.
What is the Median Household income in Lamar?
Median Household Income in Lamar is $71,875.
What is Income or Wage Gap in Lamar?
Income or Wage Gap in Lamar is 30.9%.
Women in Lamar earn 69.1 cents for every dollar earned by a man.
What is Inequality or Gini Index in Lamar?
Inequality or Gini Index in Lamar is 0.31.
What is the Total Population of Lamar?
Total Population of Lamar is 641.
What is the Total Male Population of Lamar?
Total Male Population of Lamar is 328.
What is the Total Female Population of Lamar?
Total Female Population of Lamar is 313.
What is the Ratio of Males per 100 Females in Lamar?
There are 104.79 Males per 100 Females in Lamar.
What is the Ratio of Females per 100 Males in Lamar?
There are 95.43 Females per 100 Males in Lamar.
What is the Median Population Age in Lamar?
Median Population Age in Lamar is 42.4 Years.
What is the Average Family Size in Lamar
Average Family Size in Lamar is 2.7 People.
What is the Average Household Size in Lamar
Average Household Size in Lamar is 2.4 People.
How Large is the Labor Force in Lamar?
There are 382 People in the Labor Forcein in Lamar.
What is the Percentage of People in the Labor Force in Lamar?
75.6% of People are in the Labor Force in Lamar.
What is the Unemployment Rate in Lamar?
Unemployment Rate in Lamar is 6.3%.