Jessup borough, PA Map & Demographics
Jessup borough Overview
$31,237
PER CAPITA INCOME
$79,144
AVG FAMILY INCOME
$58,869
AVG HOUSEHOLD INCOME
55.8%
WAGE / INCOME GAP [ % ]
44.2¢/ $1
WAGE / INCOME GAP [ $ ]
0.39
INEQUALITY / GINI INDEX
4,510
TOTAL POPULATION
2,144
MALE POPULATION
2,366
FEMALE POPULATION
90.62
MALES / 100 FEMALES
110.35
FEMALES / 100 MALES
44.9
MEDIAN AGE
2.9
AVG FAMILY SIZE
2.4
AVG HOUSEHOLD SIZE
1,960
LABOR FORCE [ PEOPLE ]
53.9%
PERCENT IN LABOR FORCE
2.7%
UNEMPLOYMENT RATE
Income in Jessup borough
Income Overview in Jessup borough
Per Capita Income in Jessup borough is $31,237, while median incomes of families and households are $79,144 and $58,869 respectively.
| Characteristic | Number | Measure |
| Per Capita Income | 4,510 | $31,237 |
| Median Family Income | 1,259 | $79,144 |
| Mean Family Income | 1,259 | $85,205 |
| Median Household Income | 1,915 | $58,869 |
| Mean Household Income | 1,915 | $71,581 |
| Income Deficit | 1,259 | $0 |
| Wage / Income Gap (%) | 4,510 | 55.84% |
| Wage / Income Gap ($) | 4,510 | 44.16¢ per $1 |
| Gini / Inequality Index | 4,510 | 0.39 |
Earnings by Sex in Jessup borough
Average Earnings in Jessup borough are $40,117, $52,153 for men and $23,032 for women, a difference of 55.8%.
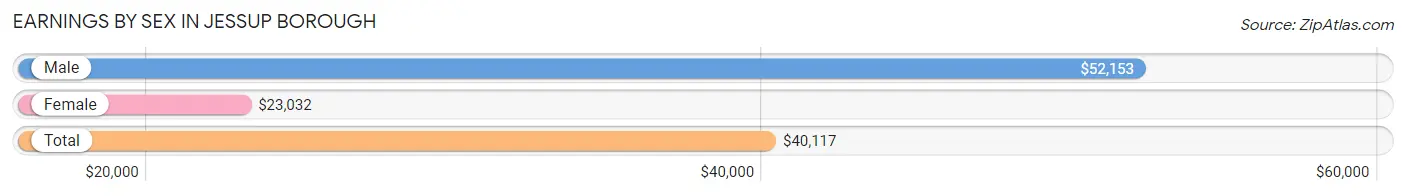
| Sex | Number | Average Earnings |
| Male | 1,150 (48.6%) | $52,153 |
| Female | 1,217 (51.4%) | $23,032 |
| Total | 2,367 (100.0%) | $40,117 |
Earnings by Sex by Income Bracket in Jessup borough
The most common earnings brackets in Jessup borough are $55,000 to $64,999 for men (236 | 20.5%) and $2,499 or less for women (178 | 14.6%).
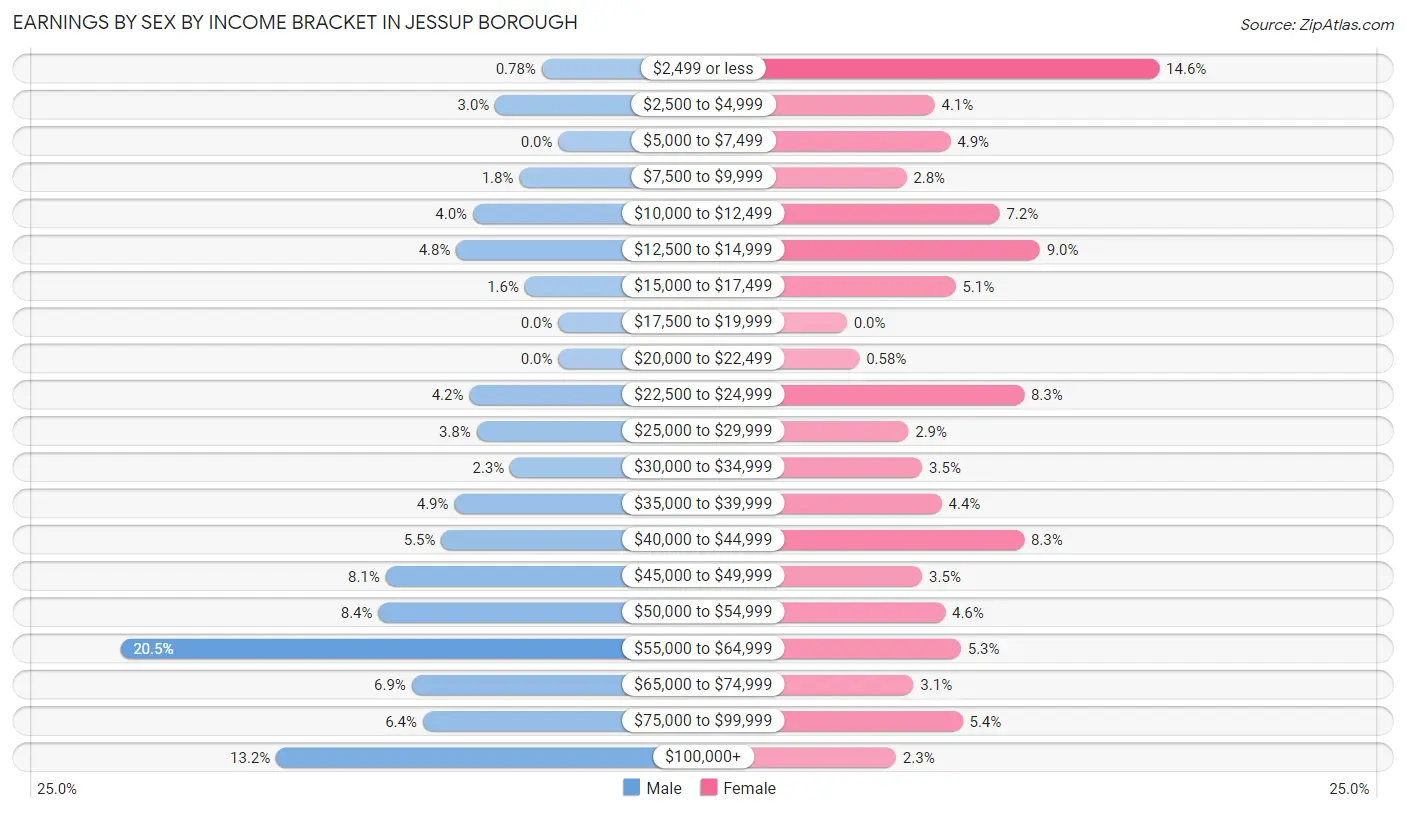
| Income | Male | Female |
| $2,499 or less | 9 (0.8%) | 178 (14.6%) |
| $2,500 to $4,999 | 34 (3.0%) | 50 (4.1%) |
| $5,000 to $7,499 | 0 (0.0%) | 59 (4.9%) |
| $7,500 to $9,999 | 21 (1.8%) | 34 (2.8%) |
| $10,000 to $12,499 | 46 (4.0%) | 87 (7.1%) |
| $12,500 to $14,999 | 55 (4.8%) | 110 (9.0%) |
| $15,000 to $17,499 | 18 (1.6%) | 62 (5.1%) |
| $17,500 to $19,999 | 0 (0.0%) | 0 (0.0%) |
| $20,000 to $22,499 | 0 (0.0%) | 7 (0.6%) |
| $22,500 to $24,999 | 48 (4.2%) | 101 (8.3%) |
| $25,000 to $29,999 | 44 (3.8%) | 35 (2.9%) |
| $30,000 to $34,999 | 26 (2.3%) | 43 (3.5%) |
| $35,000 to $39,999 | 56 (4.9%) | 54 (4.4%) |
| $40,000 to $44,999 | 63 (5.5%) | 101 (8.3%) |
| $45,000 to $49,999 | 93 (8.1%) | 43 (3.5%) |
| $50,000 to $54,999 | 97 (8.4%) | 56 (4.6%) |
| $55,000 to $64,999 | 236 (20.5%) | 65 (5.3%) |
| $65,000 to $74,999 | 79 (6.9%) | 38 (3.1%) |
| $75,000 to $99,999 | 73 (6.4%) | 66 (5.4%) |
| $100,000+ | 152 (13.2%) | 28 (2.3%) |
| Total | 1,150 (100.0%) | 1,217 (100.0%) |
Earnings by Sex by Educational Attainment in Jessup borough
Average earnings in Jessup borough are $55,417 for men and $24,270 for women, a difference of 56.2%. Men with an educational attainment of graduate degree enjoy the highest average annual earnings of $117,697, while those with bachelor's degree education earn the least with $42,411. Women with an educational attainment of graduate degree earn the most with the average annual earnings of $74,181, while those with high school diploma education have the smallest earnings of $16,472.
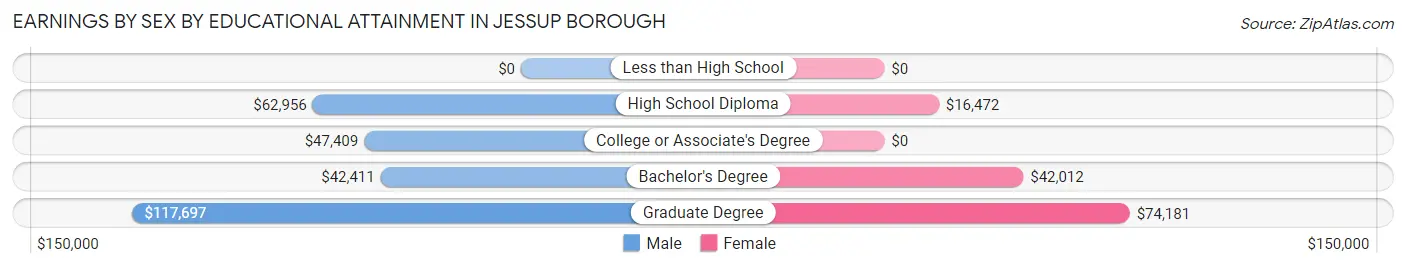
| Educational Attainment | Male Income | Female Income |
| Less than High School | - | - |
| High School Diploma | $62,956 | $16,472 |
| College or Associate's Degree | $47,409 | $0 |
| Bachelor's Degree | $42,411 | $42,012 |
| Graduate Degree | $117,697 | $74,181 |
| Total | $55,417 | $24,270 |
Family Income in Jessup borough
Family Income Brackets in Jessup borough
According to the Jessup borough family income data, there are 355 families falling into the $100,000 to $149,999 income range, which is the most common income bracket and makes up 28.2% of all families.
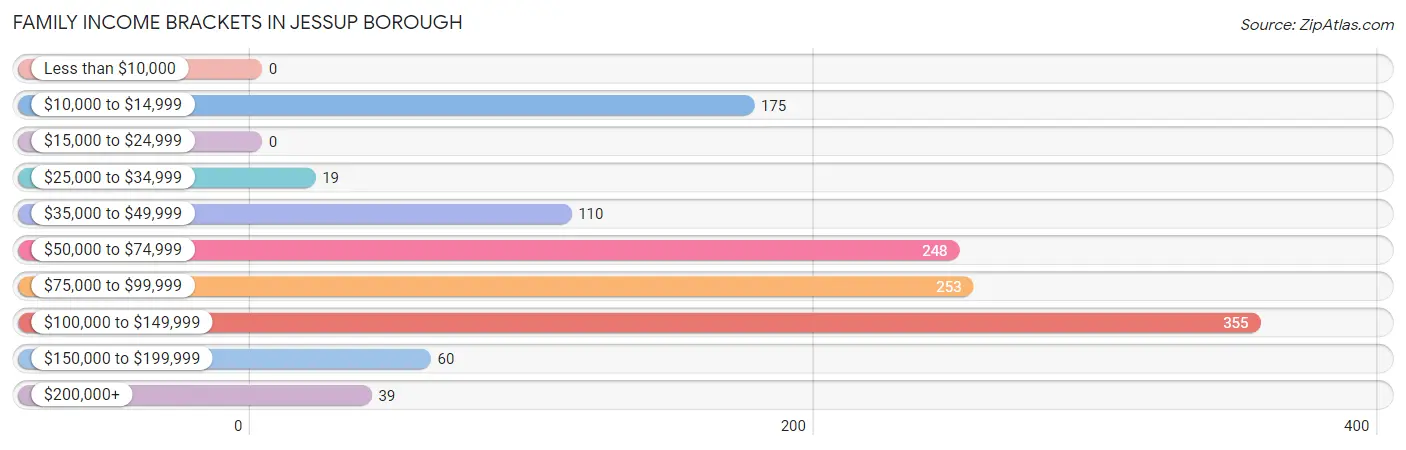
| Income Bracket | # Families | % Families |
| Less than $10,000 | 0 | 0.0% |
| $10,000 to $14,999 | 175 | 13.9% |
| $15,000 to $24,999 | 0 | 0.0% |
| $25,000 to $34,999 | 19 | 1.5% |
| $35,000 to $49,999 | 110 | 8.7% |
| $50,000 to $74,999 | 248 | 19.7% |
| $75,000 to $99,999 | 253 | 20.1% |
| $100,000 to $149,999 | 355 | 28.2% |
| $150,000 to $199,999 | 60 | 4.8% |
| $200,000+ | 39 | 3.1% |
Family Income by Famaliy Size in Jessup borough
4-person families (248 | 19.7%) account for the highest median family income in Jessup borough with $106,615 per family, while 2-person families (608 | 48.3%) have the highest median income of $39,579 per family member.
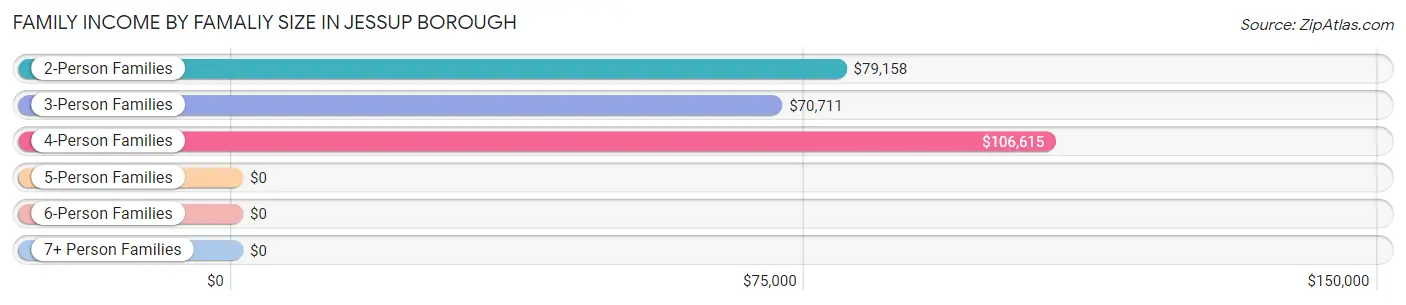
| Income Bracket | # Families | Median Income |
| 2-Person Families | 608 (48.3%) | $79,158 |
| 3-Person Families | 273 (21.7%) | $70,711 |
| 4-Person Families | 248 (19.7%) | $106,615 |
| 5-Person Families | 115 (9.1%) | $0 |
| 6-Person Families | 15 (1.2%) | $0 |
| 7+ Person Families | 0 (0.0%) | $0 |
| Total | 1,259 (100.0%) | $79,144 |
Family Income by Number of Earners in Jessup borough
The median family income in Jessup borough is $79,144, with families comprising 3+ earners (122) having the highest median family income of $120,185, while families with no earners (101) have the lowest median family income of $48,646, accounting for 9.7% and 8.0% of families, respectively.
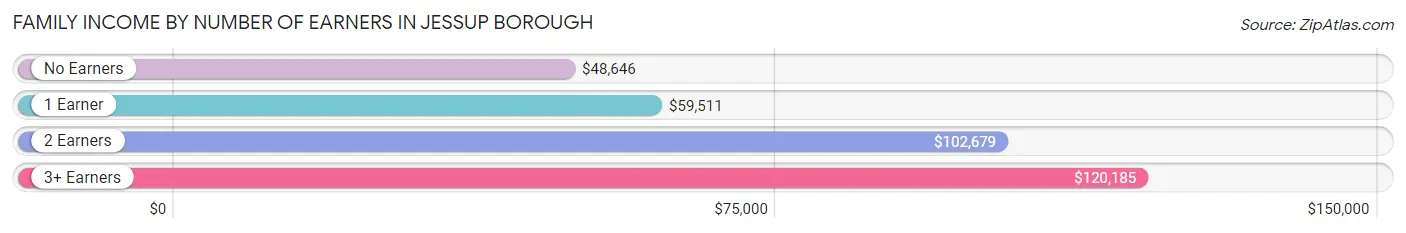
| Number of Earners | # Families | Median Income |
| No Earners | 101 (8.0%) | $48,646 |
| 1 Earner | 565 (44.9%) | $59,511 |
| 2 Earners | 471 (37.4%) | $102,679 |
| 3+ Earners | 122 (9.7%) | $120,185 |
| Total | 1,259 (100.0%) | $79,144 |
Household Income in Jessup borough
Household Income Brackets in Jessup borough
With 419 households falling in the category, the $50,000 to $74,999 income range is the most frequent in Jessup borough, accounting for 21.9% of all households. In contrast, only 34 households (1.8%) fall into the less than $10,000 income bracket, making it the least populous group.
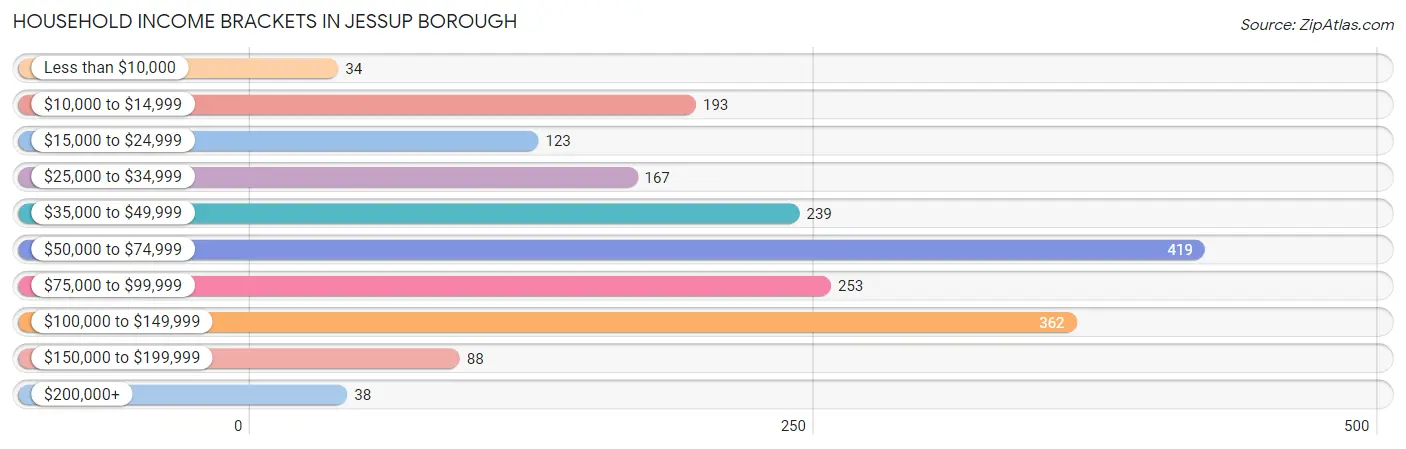
| Income Bracket | # Households | % Households |
| Less than $10,000 | 34 | 1.8% |
| $10,000 to $14,999 | 193 | 10.1% |
| $15,000 to $24,999 | 123 | 6.4% |
| $25,000 to $34,999 | 167 | 8.7% |
| $35,000 to $49,999 | 239 | 12.5% |
| $50,000 to $74,999 | 419 | 21.9% |
| $75,000 to $99,999 | 253 | 13.2% |
| $100,000 to $149,999 | 362 | 18.9% |
| $150,000 to $199,999 | 88 | 4.6% |
| $200,000+ | 38 | 2.0% |
Household Income by Householder Age in Jessup borough
The median household income in Jessup borough is $58,869, with the highest median household income of $59,296 found in the 45 to 64 years age bracket for the primary householder. A total of 918 households (47.9%) fall into this category.
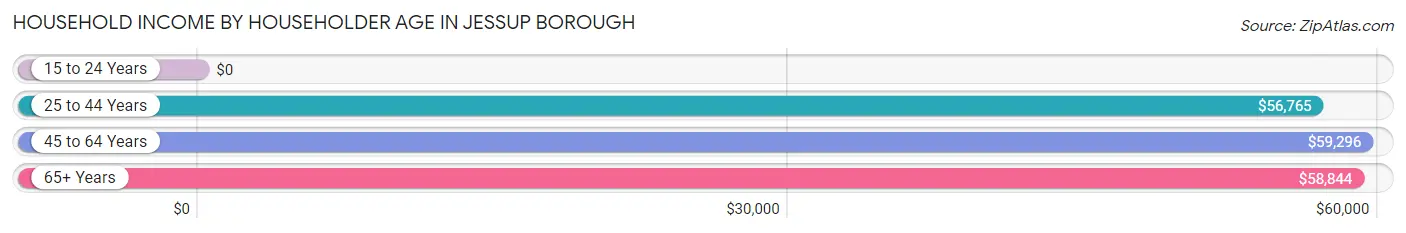
| Income Bracket | # Households | Median Income |
| 15 to 24 Years | 0 (0.0%) | $0 |
| 25 to 44 Years | 564 (29.4%) | $56,765 |
| 45 to 64 Years | 918 (47.9%) | $59,296 |
| 65+ Years | 433 (22.6%) | $58,844 |
| Total | 1,915 (100.0%) | $58,869 |
Poverty in Jessup borough
Income Below Poverty by Sex and Age in Jessup borough
With 9.8% poverty level for males and 22.4% for females among the residents of Jessup borough, under 5 year old males and 6 to 11 year old females are the most vulnerable to poverty, with 93 males (60.0%) and 100 females (58.8%) in their respective age groups living below the poverty level.
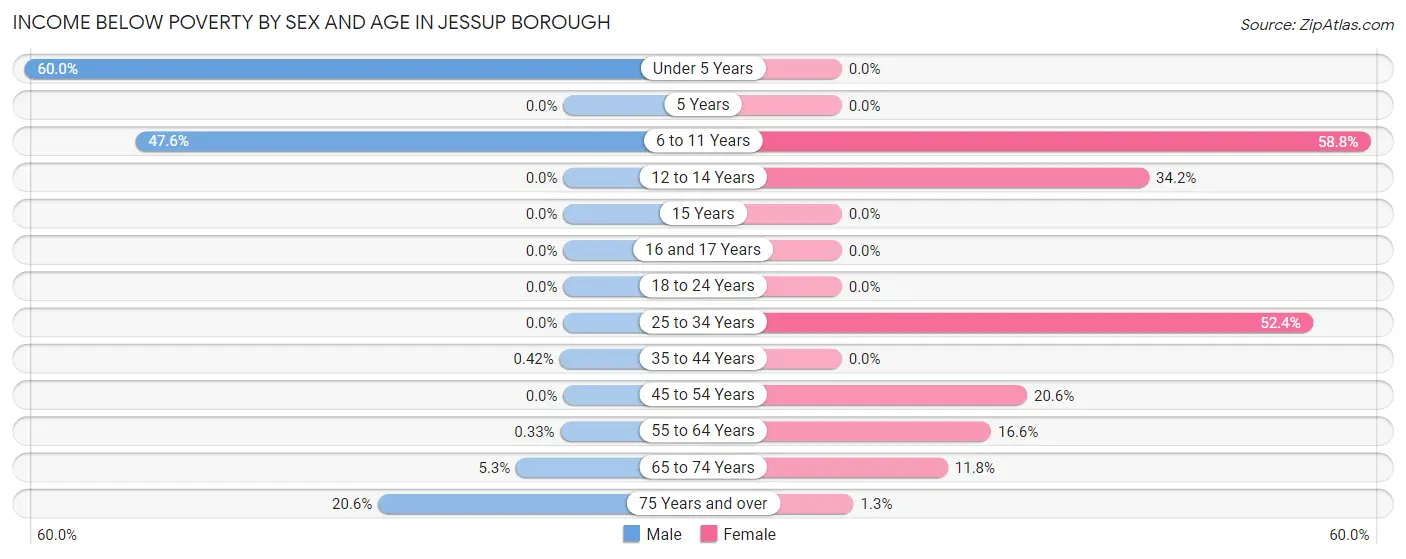
| Age Bracket | Male | Female |
| Under 5 Years | 93 (60.0%) | 0 (0.0%) |
| 5 Years | 0 (0.0%) | 0 (0.0%) |
| 6 to 11 Years | 91 (47.6%) | 100 (58.8%) |
| 12 to 14 Years | 0 (0.0%) | 38 (34.2%) |
| 15 Years | 0 (0.0%) | 0 (0.0%) |
| 16 and 17 Years | 0 (0.0%) | 0 (0.0%) |
| 18 to 24 Years | 0 (0.0%) | 0 (0.0%) |
| 25 to 34 Years | 0 (0.0%) | 227 (52.4%) |
| 35 to 44 Years | 1 (0.4%) | 0 (0.0%) |
| 45 to 54 Years | 0 (0.0%) | 46 (20.6%) |
| 55 to 64 Years | 1 (0.3%) | 87 (16.6%) |
| 65 to 74 Years | 11 (5.3%) | 30 (11.8%) |
| 75 Years and over | 13 (20.6%) | 2 (1.3%) |
| Total | 210 (9.8%) | 530 (22.4%) |
Income Above Poverty by Sex and Age in Jessup borough
According to the poverty statistics in Jessup borough, males aged 5 years and females aged under 5 years are the age groups that are most secure financially, with 100.0% of males and 100.0% of females in these age groups living above the poverty line.
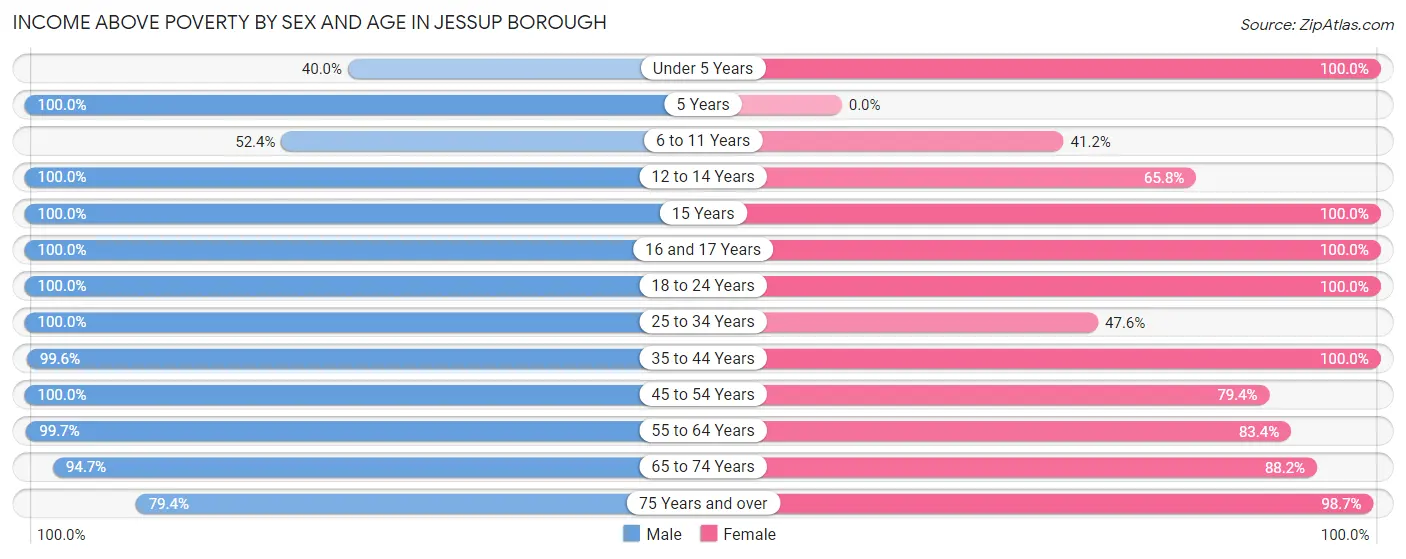
| Age Bracket | Male | Female |
| Under 5 Years | 62 (40.0%) | 42 (100.0%) |
| 5 Years | 4 (100.0%) | 0 (0.0%) |
| 6 to 11 Years | 100 (52.4%) | 70 (41.2%) |
| 12 to 14 Years | 119 (100.0%) | 73 (65.8%) |
| 15 Years | 10 (100.0%) | 71 (100.0%) |
| 16 and 17 Years | 39 (100.0%) | 47 (100.0%) |
| 18 to 24 Years | 101 (100.0%) | 100 (100.0%) |
| 25 to 34 Years | 191 (100.0%) | 206 (47.6%) |
| 35 to 44 Years | 237 (99.6%) | 240 (100.0%) |
| 45 to 54 Years | 525 (100.0%) | 177 (79.4%) |
| 55 to 64 Years | 298 (99.7%) | 436 (83.4%) |
| 65 to 74 Years | 198 (94.7%) | 224 (88.2%) |
| 75 Years and over | 50 (79.4%) | 150 (98.7%) |
| Total | 1,934 (90.2%) | 1,836 (77.6%) |
Income Below Poverty Among Married-Couple Families in Jessup borough
The poverty statistics for married-couple families in Jessup borough show that 1.6% or 12 of the total 730 families live below the poverty line. Families with no children have the highest poverty rate of 2.2%, comprising of 12 families. On the other hand, families with 1 or 2 children have the lowest poverty rate of 0.0%, which includes 0 families.
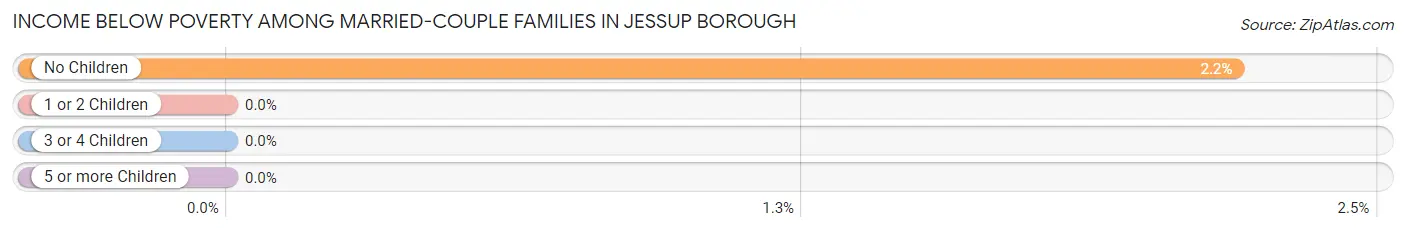
| Children | Above Poverty | Below Poverty |
| No Children | 536 (97.8%) | 12 (2.2%) |
| 1 or 2 Children | 144 (100.0%) | 0 (0.0%) |
| 3 or 4 Children | 38 (100.0%) | 0 (0.0%) |
| 5 or more Children | 0 (0.0%) | 0 (0.0%) |
| Total | 718 (98.4%) | 12 (1.6%) |
Income Below Poverty Among Single-Parent Households in Jessup borough
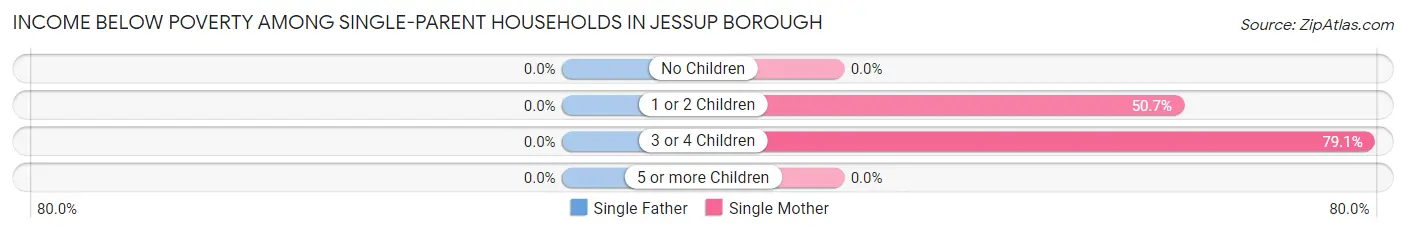
| Children | Single Father | Single Mother |
| No Children | 0 (0.0%) | 0 (0.0%) |
| 1 or 2 Children | 0 (0.0%) | 76 (50.7%) |
| 3 or 4 Children | 0 (0.0%) | 87 (79.1%) |
| 5 or more Children | 0 (0.0%) | 0 (0.0%) |
| Total | 0 (0.0%) | 163 (40.6%) |
Income Below Poverty Among Married-Couple vs Single-Parent Households in Jessup borough
The poverty data for Jessup borough shows that 12 of the married-couple family households (1.6%) and 163 of the single-parent households (30.8%) are living below the poverty level. Within the married-couple family households, those with no children have the highest poverty rate, with 12 households (2.2%) falling below the poverty line. Among the single-parent households, those with 3 or 4 children have the highest poverty rate, with 87 household (79.1%) living below poverty.
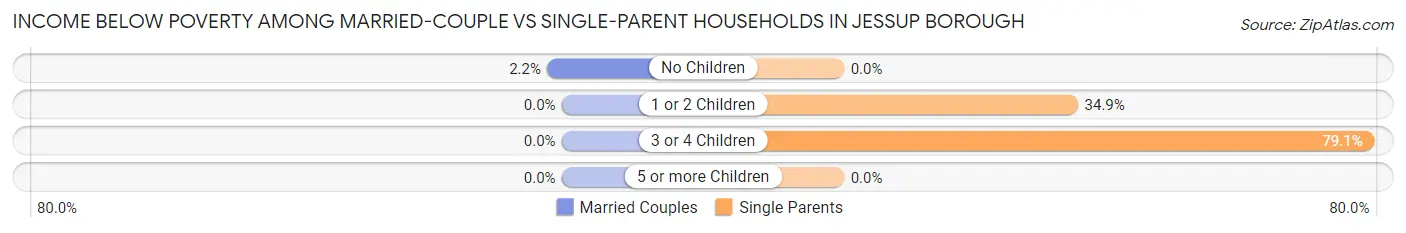
| Children | Married-Couple Families | Single-Parent Households |
| No Children | 12 (2.2%) | 0 (0.0%) |
| 1 or 2 Children | 0 (0.0%) | 76 (34.9%) |
| 3 or 4 Children | 0 (0.0%) | 87 (79.1%) |
| 5 or more Children | 0 (0.0%) | 0 (0.0%) |
| Total | 12 (1.6%) | 163 (30.8%) |
Race in Jessup borough
The most populous races in Jessup borough are White / Caucasian (3,823 | 84.8%), Two or more Races (580 | 12.9%), and Hispanic or Latino (399 | 8.8%).
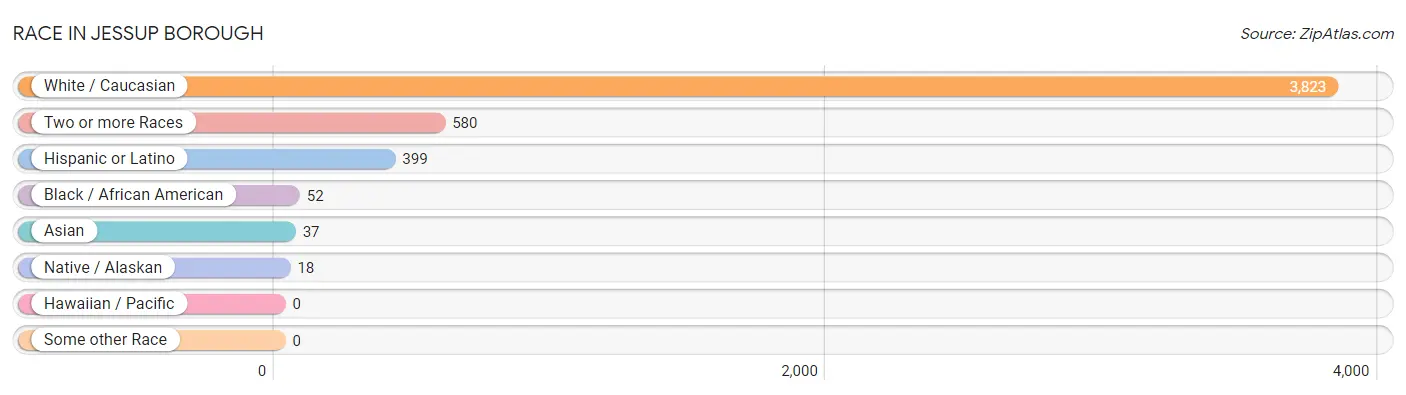
| Race | # Population | % Population |
| Asian | 37 | 0.8% |
| Black / African American | 52 | 1.1% |
| Hawaiian / Pacific | 0 | 0.0% |
| Hispanic or Latino | 399 | 8.8% |
| Native / Alaskan | 18 | 0.4% |
| White / Caucasian | 3,823 | 84.8% |
| Two or more Races | 580 | 12.9% |
| Some other Race | 0 | 0.0% |
| Total | 4,510 | 100.0% |
Ancestry in Jessup borough
The most populous ancestries reported in Jessup borough are Irish (1,150 | 25.5%), Italian (1,127 | 25.0%), Polish (1,086 | 24.1%), German (678 | 15.0%), and Russian (470 | 10.4%), together accounting for 100.0% of all Jessup borough residents.
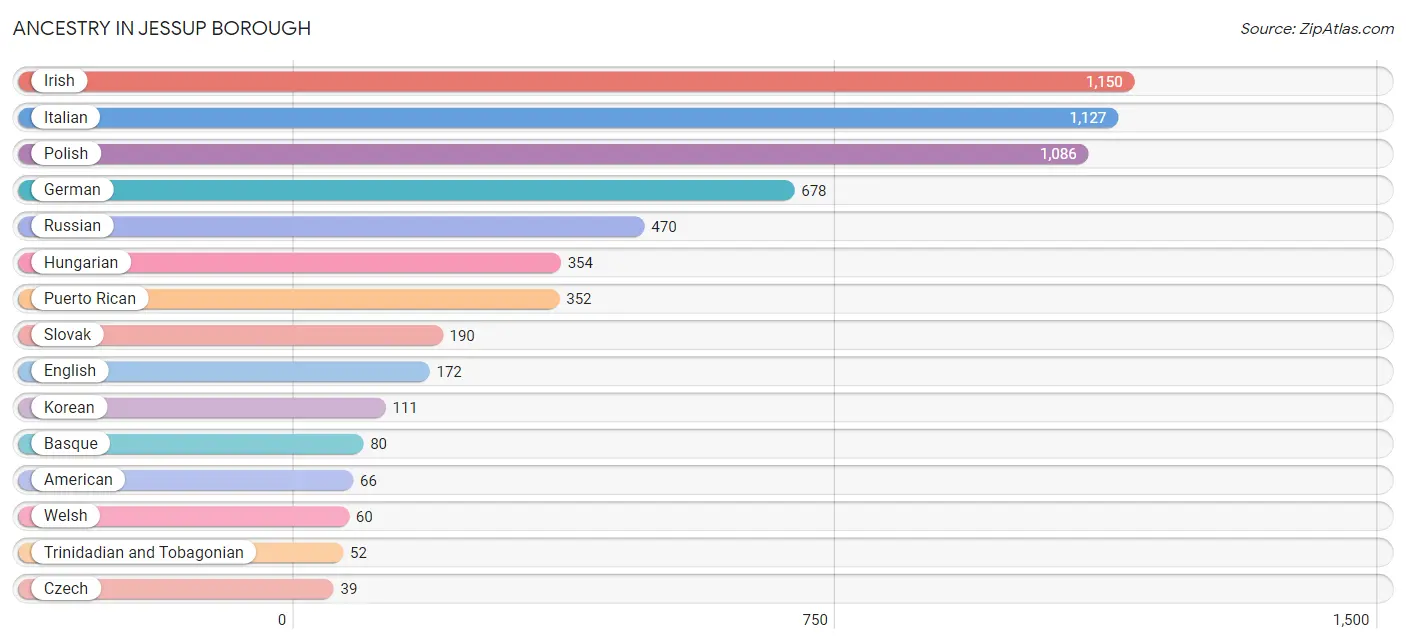
| Ancestry | # Population | % Population |
| American | 66 | 1.5% |
| Austrian | 4 | 0.1% |
| Basque | 80 | 1.8% |
| Bhutanese | 10 | 0.2% |
| Blackfeet | 3 | 0.1% |
| Central American | 17 | 0.4% |
| Cherokee | 3 | 0.1% |
| Croatian | 23 | 0.5% |
| Czech | 39 | 0.9% |
| Czechoslovakian | 30 | 0.7% |
| Eastern European | 11 | 0.2% |
| English | 172 | 3.8% |
| European | 18 | 0.4% |
| French | 18 | 0.4% |
| German | 678 | 15.0% |
| Hungarian | 354 | 7.9% |
| Irish | 1,150 | 25.5% |
| Italian | 1,127 | 25.0% |
| Korean | 111 | 2.5% |
| Lithuanian | 12 | 0.3% |
| Mexican | 30 | 0.7% |
| Polish | 1,086 | 24.1% |
| Puerto Rican | 352 | 7.8% |
| Russian | 470 | 10.4% |
| Salvadoran | 17 | 0.4% |
| Scotch-Irish | 3 | 0.1% |
| Sioux | 35 | 0.8% |
| Slavic | 24 | 0.5% |
| Slovak | 190 | 4.2% |
| Swedish | 16 | 0.4% |
| Trinidadian and Tobagonian | 52 | 1.1% |
| Ukrainian | 10 | 0.2% |
| Welsh | 60 | 1.3% | View All 33 Rows |
Immigrants in Jessup borough
The most numerous immigrant groups reported in Jessup borough came from Asia (50 | 1.1%), Philippines (50 | 1.1%), South Eastern Asia (50 | 1.1%), Europe (16 | 0.4%), and Italy (16 | 0.4%), together accounting for 4.0% of all Jessup borough residents.
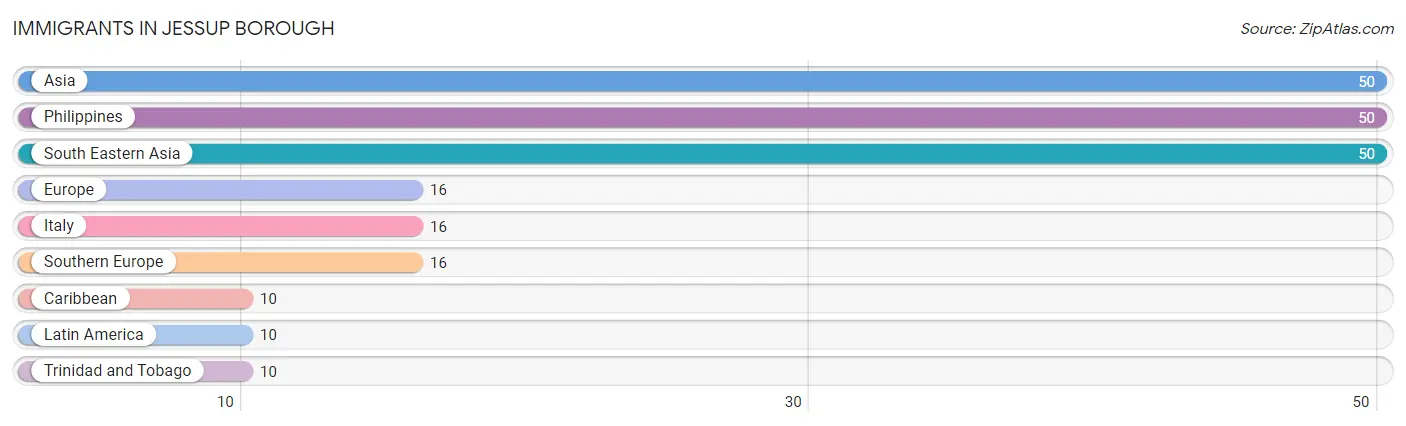
| Immigration Origin | # Population | % Population |
| Asia | 50 | 1.1% |
| Caribbean | 10 | 0.2% |
| Europe | 16 | 0.4% |
| Italy | 16 | 0.4% |
| Latin America | 10 | 0.2% |
| Philippines | 50 | 1.1% |
| South Eastern Asia | 50 | 1.1% |
| Southern Europe | 16 | 0.4% |
| Trinidad and Tobago | 10 | 0.2% | View All 9 Rows |
Sex and Age in Jessup borough
Sex and Age in Jessup borough
The most populous age groups in Jessup borough are 45 to 49 Years (434 | 20.2%) for men and 60 to 64 Years (381 | 16.1%) for women.
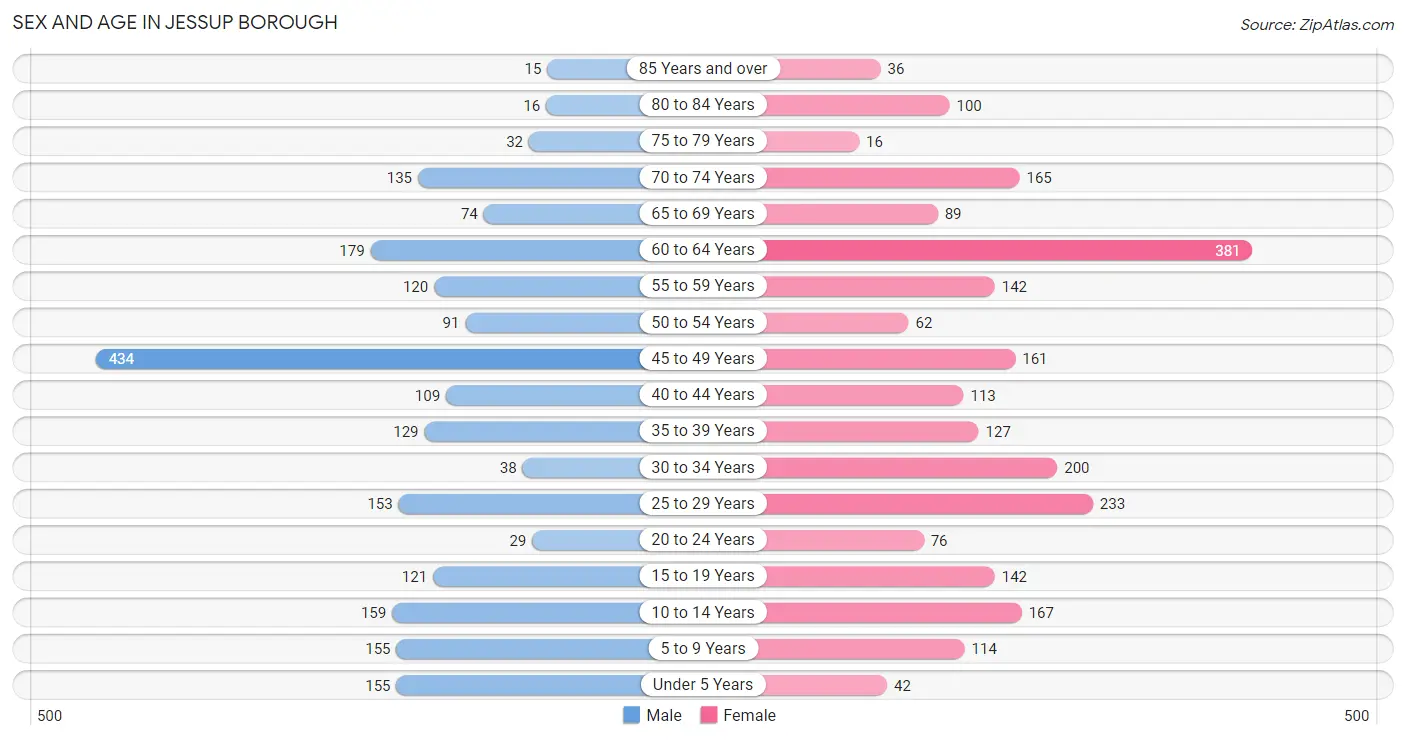
| Age Bracket | Male | Female |
| Under 5 Years | 155 (7.2%) | 42 (1.8%) |
| 5 to 9 Years | 155 (7.2%) | 114 (4.8%) |
| 10 to 14 Years | 159 (7.4%) | 167 (7.1%) |
| 15 to 19 Years | 121 (5.6%) | 142 (6.0%) |
| 20 to 24 Years | 29 (1.3%) | 76 (3.2%) |
| 25 to 29 Years | 153 (7.1%) | 233 (9.9%) |
| 30 to 34 Years | 38 (1.8%) | 200 (8.5%) |
| 35 to 39 Years | 129 (6.0%) | 127 (5.4%) |
| 40 to 44 Years | 109 (5.1%) | 113 (4.8%) |
| 45 to 49 Years | 434 (20.2%) | 161 (6.8%) |
| 50 to 54 Years | 91 (4.2%) | 62 (2.6%) |
| 55 to 59 Years | 120 (5.6%) | 142 (6.0%) |
| 60 to 64 Years | 179 (8.4%) | 381 (16.1%) |
| 65 to 69 Years | 74 (3.5%) | 89 (3.8%) |
| 70 to 74 Years | 135 (6.3%) | 165 (7.0%) |
| 75 to 79 Years | 32 (1.5%) | 16 (0.7%) |
| 80 to 84 Years | 16 (0.7%) | 100 (4.2%) |
| 85 Years and over | 15 (0.7%) | 36 (1.5%) |
| Total | 2,144 (100.0%) | 2,366 (100.0%) |
Families and Households in Jessup borough
Median Family Size in Jessup borough
The median family size in Jessup borough is 2.88 persons per family, with married-couple families (730 | 58.0%) accounting for the largest median family size of 2.9 persons per family. On the other hand, single male/father families (128 | 10.2%) represent the smallest median family size with 2.84 persons per family.
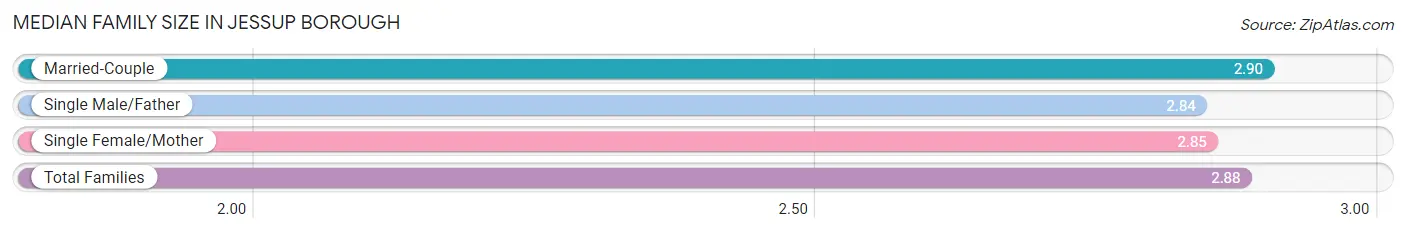
| Family Type | # Families | Family Size |
| Married-Couple | 730 (58.0%) | 2.90 |
| Single Male/Father | 128 (10.2%) | 2.84 |
| Single Female/Mother | 401 (31.9%) | 2.85 |
| Total Families | 1,259 (100.0%) | 2.88 |
Median Household Size in Jessup borough
The median household size in Jessup borough is 2.35 persons per household, with single male/father households (128 | 6.7%) accounting for the largest median household size of 3.2 persons per household. non-family households (656 | 34.3%) represent the smallest median household size with 1.19 persons per household.
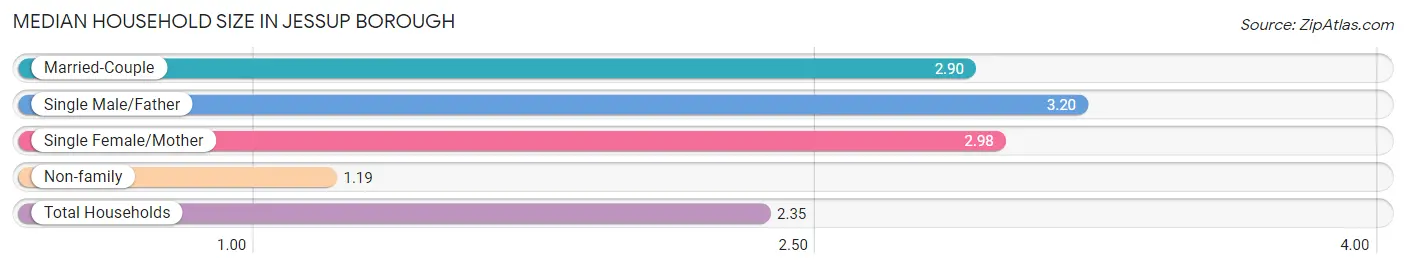
| Household Type | # Households | Household Size |
| Married-Couple | 730 (38.1%) | 2.90 |
| Single Male/Father | 128 (6.7%) | 3.20 |
| Single Female/Mother | 401 (20.9%) | 2.98 |
| Non-family | 656 (34.3%) | 1.19 |
| Total Households | 1,915 (100.0%) | 2.35 |
Household Size by Marriage Status in Jessup borough
Out of a total of 1,915 households in Jessup borough, 1,259 (65.7%) are family households, while 656 (34.3%) are nonfamily households. The most numerous type of family households are 2-person households, comprising 563, and the most common type of nonfamily households are 1-person households, comprising 527.
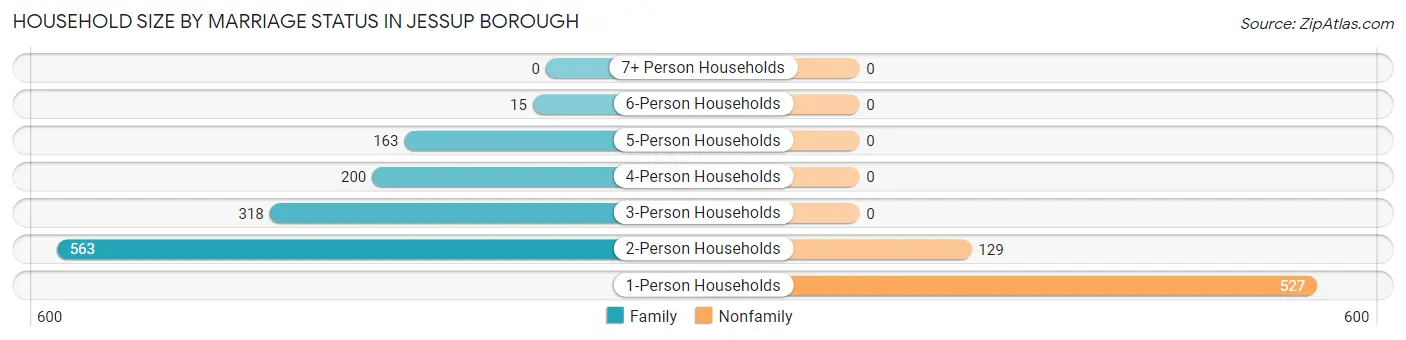
| Household Size | Family Households | Nonfamily Households |
| 1-Person Households | - | 527 (27.5%) |
| 2-Person Households | 563 (29.4%) | 129 (6.7%) |
| 3-Person Households | 318 (16.6%) | 0 (0.0%) |
| 4-Person Households | 200 (10.4%) | 0 (0.0%) |
| 5-Person Households | 163 (8.5%) | 0 (0.0%) |
| 6-Person Households | 15 (0.8%) | 0 (0.0%) |
| 7+ Person Households | 0 (0.0%) | 0 (0.0%) |
| Total | 1,259 (65.7%) | 656 (34.3%) |
Female Fertility in Jessup borough
Fertility by Age in Jessup borough
Average fertility rate in Jessup borough is 151.0 births per 1,000 women. Women in the age bracket of 20 to 34 years have the highest fertility rate with 275.0 births per 1,000 women. Women in the age bracket of 20 to 34 years acount for 87.0% of all women with births.
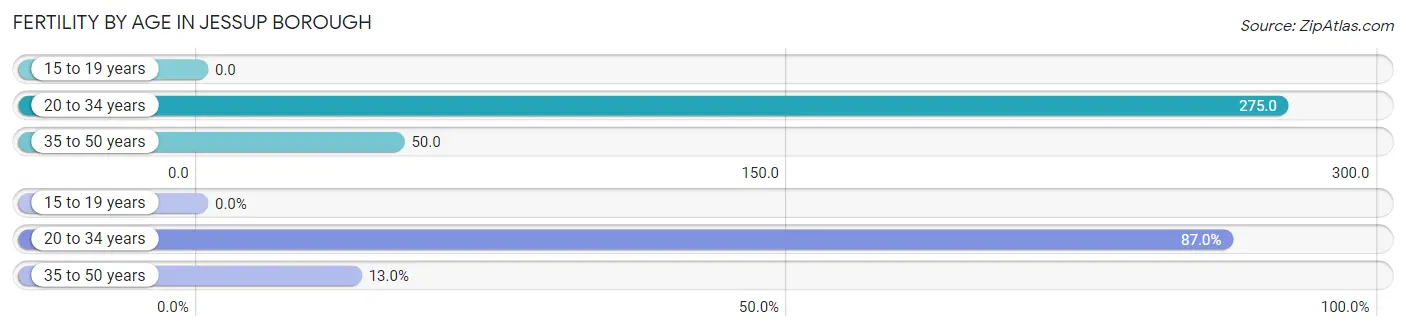
| Age Bracket | Women with Births | Births / 1,000 Women |
| 15 to 19 years | 0 (0.0%) | 0.0 |
| 20 to 34 years | 140 (87.0%) | 275.0 |
| 35 to 50 years | 21 (13.0%) | 50.0 |
| Total | 161 (100.0%) | 151.0 |
Fertility by Age by Marriage Status in Jessup borough
32.9% of women with births (161) in Jessup borough are married. The highest percentage of unmarried women with births falls into 35 to 50 years age bracket with 100.0% of them unmarried at the time of birth, while the lowest percentage of unmarried women with births belong to 20 to 34 years age bracket with 62.1% of them unmarried.
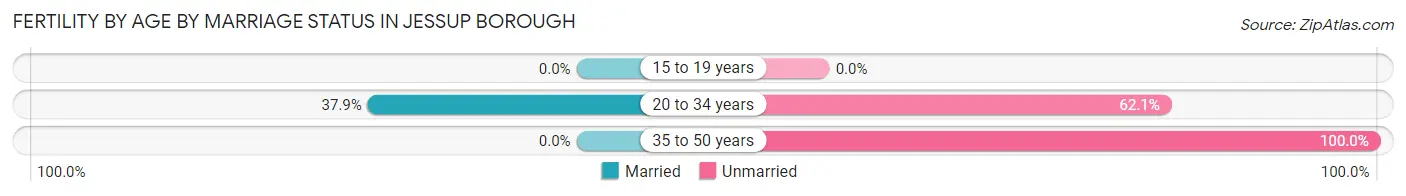
| Age Bracket | Married | Unmarried |
| 15 to 19 years | 0 (0.0%) | 0 (0.0%) |
| 20 to 34 years | 53 (37.9%) | 87 (62.1%) |
| 35 to 50 years | 0 (0.0%) | 21 (100.0%) |
| Total | 53 (32.9%) | 108 (67.1%) |
Fertility by Education in Jessup borough
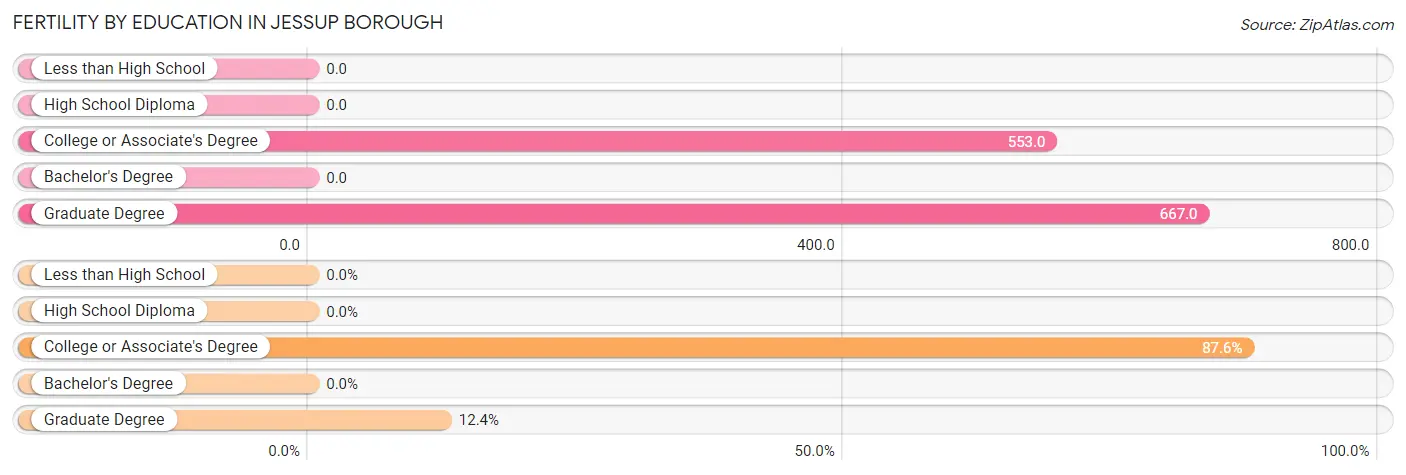
| Educational Attainment | Women with Births | Births / 1,000 Women |
| Less than High School | 0 (0.0%) | 0.0 |
| High School Diploma | 0 (0.0%) | 0.0 |
| College or Associate's Degree | 141 (87.6%) | 553.0 |
| Bachelor's Degree | 0 (0.0%) | 0.0 |
| Graduate Degree | 20 (12.4%) | 667.0 |
| Total | 161 (100.0%) | 151.0 |
Fertility by Education by Marriage Status in Jessup borough
67.1% of women with births in Jessup borough are unmarried. Women with the educational attainment of graduate degree are most likely to be married with 100.0% of them married at childbirth, while women with the educational attainment of college or associate's degree are least likely to be married with 76.6% of them unmarried at childbirth.
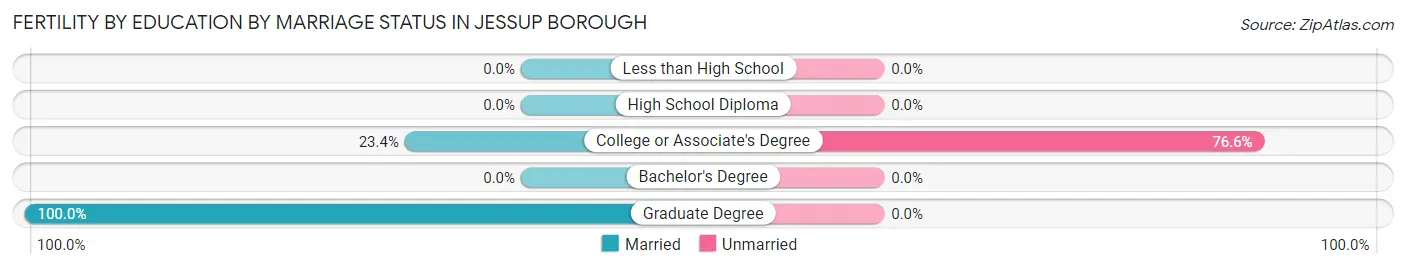
| Educational Attainment | Married | Unmarried |
| Less than High School | 0 (0.0%) | 0 (0.0%) |
| High School Diploma | 0 (0.0%) | 0 (0.0%) |
| College or Associate's Degree | 33 (23.4%) | 108 (76.6%) |
| Bachelor's Degree | 0 (0.0%) | 0 (0.0%) |
| Graduate Degree | 20 (100.0%) | 0 (0.0%) |
| Total | 53 (32.9%) | 108 (67.1%) |
Employment Characteristics in Jessup borough
Employment by Class of Employer in Jessup borough
Among the 1,889 employed individuals in Jessup borough, private company employees (1,293 | 68.4%), not-for-profit organizations (210 | 11.1%), and local government employees (127 | 6.7%) make up the most common classes of employment.
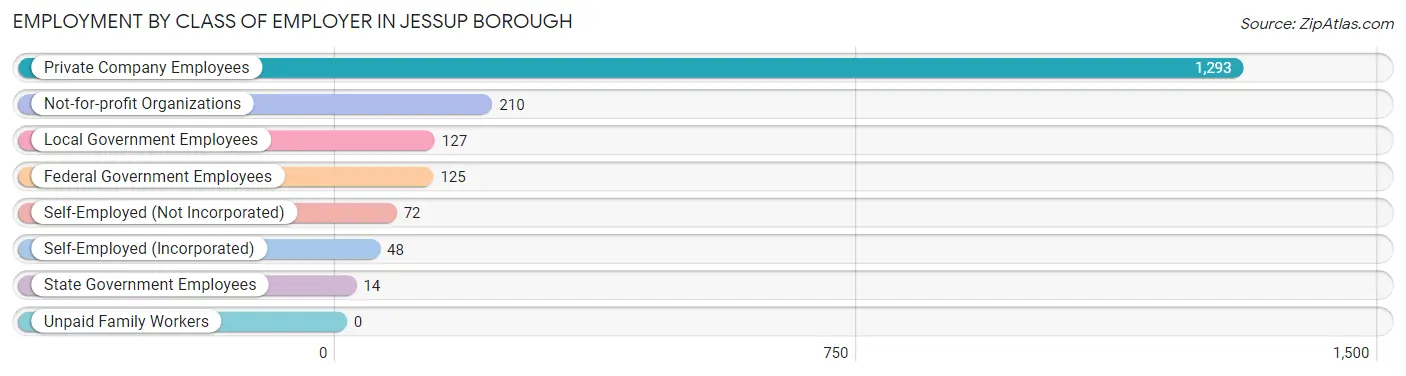
| Employer Class | # Employees | % Employees |
| Private Company Employees | 1,293 | 68.4% |
| Self-Employed (Incorporated) | 48 | 2.5% |
| Self-Employed (Not Incorporated) | 72 | 3.8% |
| Not-for-profit Organizations | 210 | 11.1% |
| Local Government Employees | 127 | 6.7% |
| State Government Employees | 14 | 0.7% |
| Federal Government Employees | 125 | 6.6% |
| Unpaid Family Workers | 0 | 0.0% |
| Total | 1,889 | 100.0% |
Employment Status by Age in Jessup borough
According to the labor force statistics for Jessup borough, out of the total population over 16 years of age (3,637), 53.9% or 1,960 individuals are in the labor force, with 2.7% or 53 of them unemployed. The age group with the highest labor force participation rate is 20 to 24 years, with 100.0% or 105 individuals in the labor force. Within the labor force, the 20 to 24 years age range has the highest percentage of unemployed individuals, with 49.5% or 52 of them being unemployed.
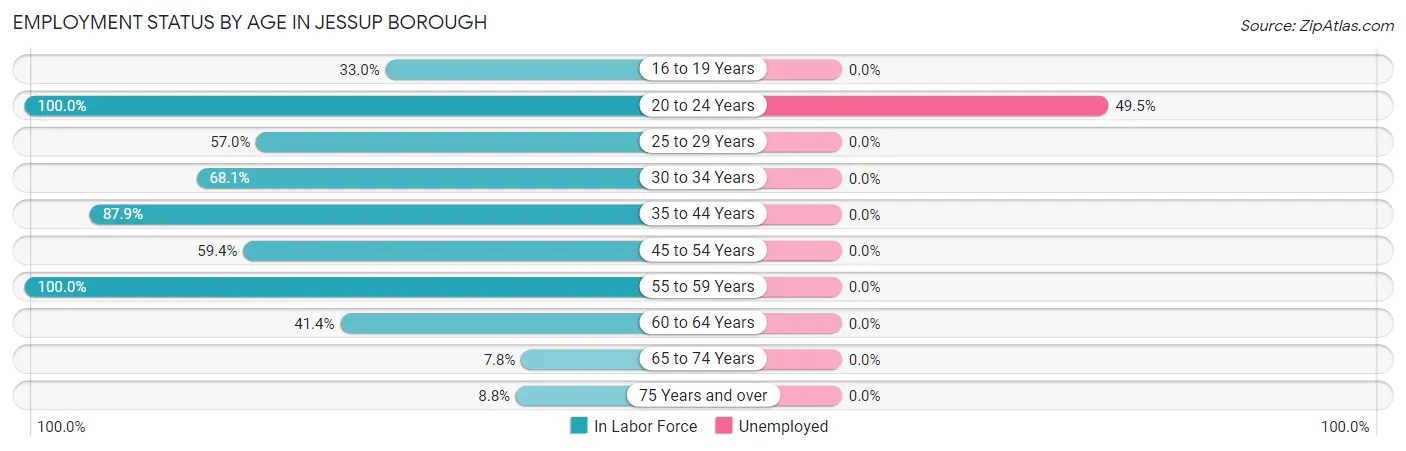
| Age Bracket | In Labor Force | Unemployed |
| 16 to 19 Years | 60 (33.0%) | 0 (0.0%) |
| 20 to 24 Years | 105 (100.0%) | 52 (49.5%) |
| 25 to 29 Years | 220 (57.0%) | 0 (0.0%) |
| 30 to 34 Years | 162 (68.1%) | 0 (0.0%) |
| 35 to 44 Years | 420 (87.9%) | 0 (0.0%) |
| 45 to 54 Years | 444 (59.4%) | 0 (0.0%) |
| 55 to 59 Years | 262 (100.0%) | 0 (0.0%) |
| 60 to 64 Years | 232 (41.4%) | 0 (0.0%) |
| 65 to 74 Years | 36 (7.8%) | 0 (0.0%) |
| 75 Years and over | 19 (8.8%) | 0 (0.0%) |
| Total | 1,960 (53.9%) | 53 (2.7%) |
Employment Status by Educational Attainment in Jessup borough
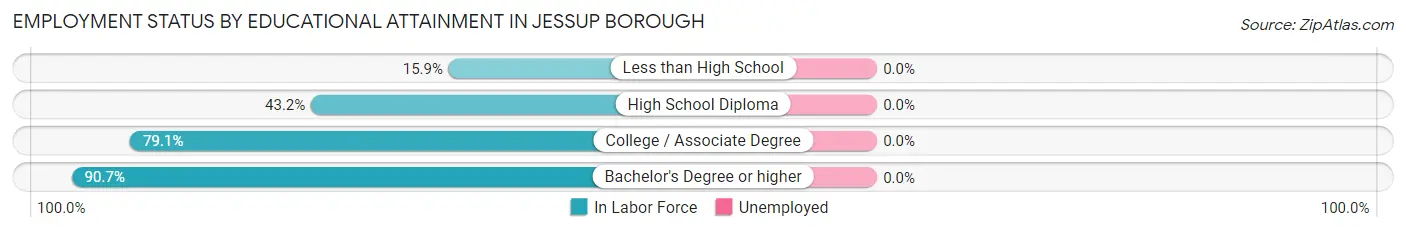
| Educational Attainment | In Labor Force | Unemployed |
| Less than High School | 32 (15.9%) | 0 (0.0%) |
| High School Diploma | 409 (43.2%) | 0 (0.0%) |
| College / Associate Degree | 575 (79.1%) | 0 (0.0%) |
| Bachelor's Degree or higher | 724 (90.7%) | 0 (0.0%) |
| Total | 1,739 (65.1%) | 0 (0.0%) |
Employment Occupations by Sex in Jessup borough
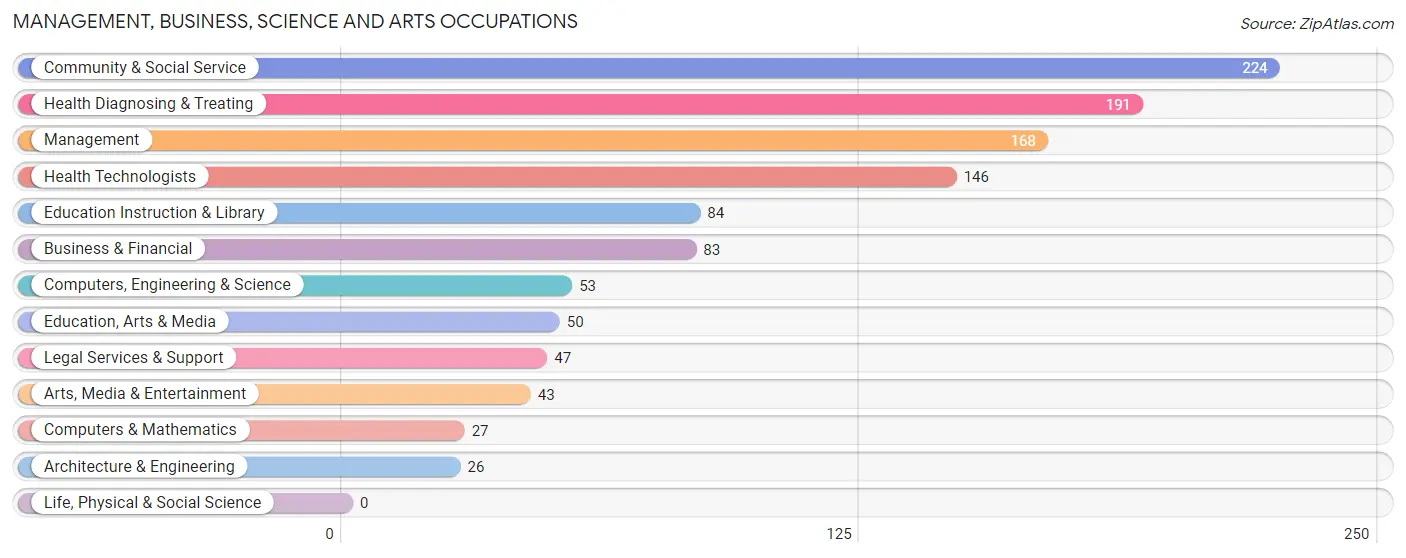
Management, Business, Science and Arts Occupations
The most common Management, Business, Science and Arts occupations in Jessup borough are Community & Social Service (224 | 11.7%), Health Diagnosing & Treating (191 | 10.0%), Management (168 | 8.8%), Health Technologists (146 | 7.6%), and Education Instruction & Library (84 | 4.4%).
Management, Business, Science and Arts Occupations by Sex
Within the Management, Business, Science and Arts occupations in Jessup borough, the most male-oriented occupations are Computers, Engineering & Science (100.0%), Computers & Mathematics (100.0%), and Architecture & Engineering (100.0%), while the most female-oriented occupations are Education, Arts & Media (100.0%), Legal Services & Support (100.0%), and Community & Social Service (78.1%).
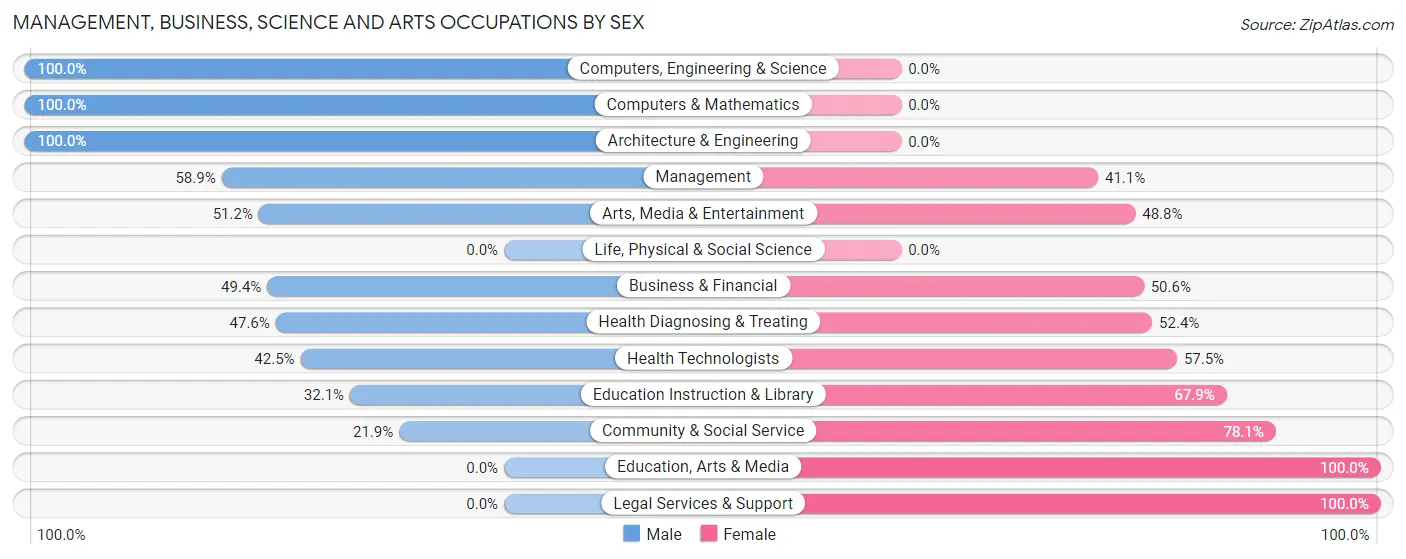
| Occupation | Male | Female |
| Management | 99 (58.9%) | 69 (41.1%) |
| Business & Financial | 41 (49.4%) | 42 (50.6%) |
| Computers, Engineering & Science | 53 (100.0%) | 0 (0.0%) |
| Computers & Mathematics | 27 (100.0%) | 0 (0.0%) |
| Architecture & Engineering | 26 (100.0%) | 0 (0.0%) |
| Life, Physical & Social Science | 0 (0.0%) | 0 (0.0%) |
| Community & Social Service | 49 (21.9%) | 175 (78.1%) |
| Education, Arts & Media | 0 (0.0%) | 50 (100.0%) |
| Legal Services & Support | 0 (0.0%) | 47 (100.0%) |
| Education Instruction & Library | 27 (32.1%) | 57 (67.9%) |
| Arts, Media & Entertainment | 22 (51.2%) | 21 (48.8%) |
| Health Diagnosing & Treating | 91 (47.6%) | 100 (52.4%) |
| Health Technologists | 62 (42.5%) | 84 (57.5%) |
| Total (Category) | 333 (46.3%) | 386 (53.7%) |
| Total (Overall) | 992 (52.0%) | 916 (48.0%) |
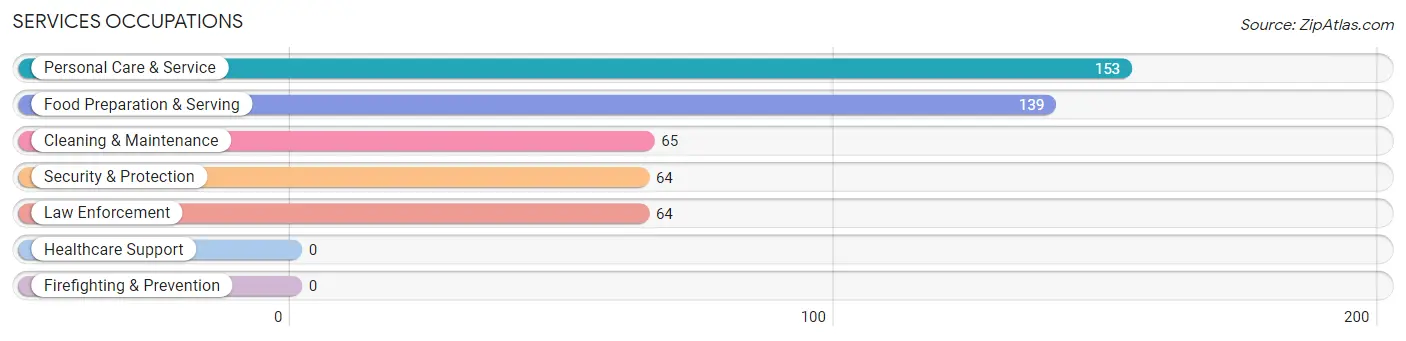
Services Occupations
The most common Services occupations in Jessup borough are Personal Care & Service (153 | 8.0%), Food Preparation & Serving (139 | 7.3%), Cleaning & Maintenance (65 | 3.4%), Security & Protection (64 | 3.4%), and Law Enforcement (64 | 3.4%).
Services Occupations by Sex
Within the Services occupations in Jessup borough, the most male-oriented occupations are Security & Protection (100.0%), Law Enforcement (100.0%), and Cleaning & Maintenance (100.0%), while the most female-oriented occupations are Personal Care & Service (77.8%), and Food Preparation & Serving (68.3%).
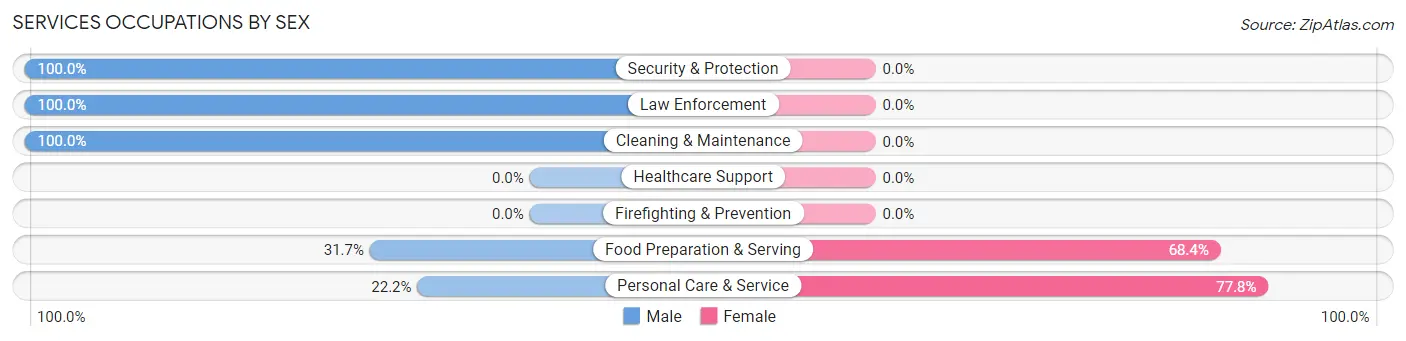
| Occupation | Male | Female |
| Healthcare Support | 0 (0.0%) | 0 (0.0%) |
| Security & Protection | 64 (100.0%) | 0 (0.0%) |
| Firefighting & Prevention | 0 (0.0%) | 0 (0.0%) |
| Law Enforcement | 64 (100.0%) | 0 (0.0%) |
| Food Preparation & Serving | 44 (31.7%) | 95 (68.3%) |
| Cleaning & Maintenance | 65 (100.0%) | 0 (0.0%) |
| Personal Care & Service | 34 (22.2%) | 119 (77.8%) |
| Total (Category) | 207 (49.2%) | 214 (50.8%) |
| Total (Overall) | 992 (52.0%) | 916 (48.0%) |
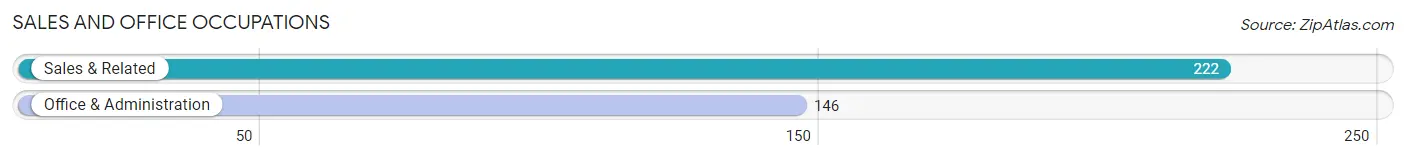
Sales and Office Occupations
The most common Sales and Office occupations in Jessup borough are Sales & Related (222 | 11.6%), and Office & Administration (146 | 7.6%).
Sales and Office Occupations by Sex
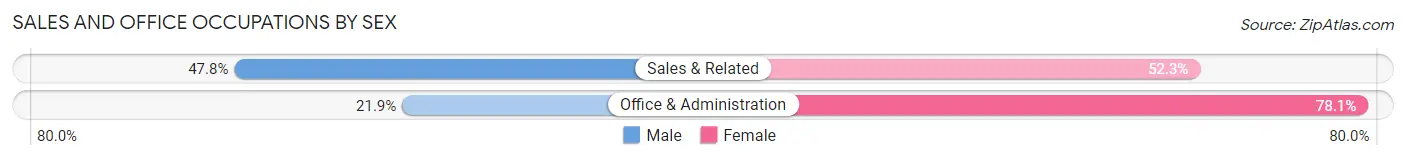
| Occupation | Male | Female |
| Sales & Related | 106 (47.7%) | 116 (52.2%) |
| Office & Administration | 32 (21.9%) | 114 (78.1%) |
| Total (Category) | 138 (37.5%) | 230 (62.5%) |
| Total (Overall) | 992 (52.0%) | 916 (48.0%) |
Natural Resources, Construction and Maintenance Occupations
The most common Natural Resources, Construction and Maintenance occupations in Jessup borough are Construction & Extraction (53 | 2.8%), Installation, Maintenance & Repair (48 | 2.5%), and Farming, Fishing & Forestry (17 | 0.9%).
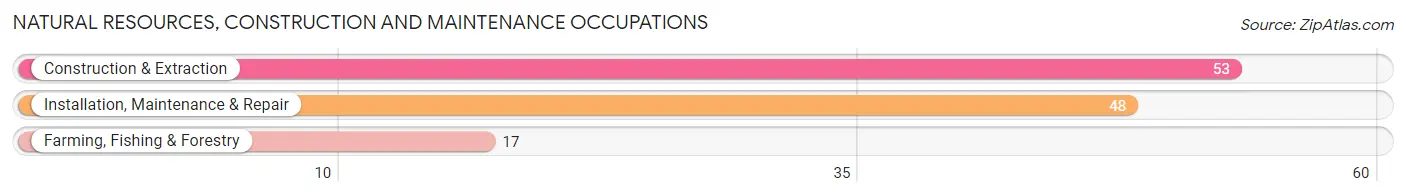
Natural Resources, Construction and Maintenance Occupations by Sex
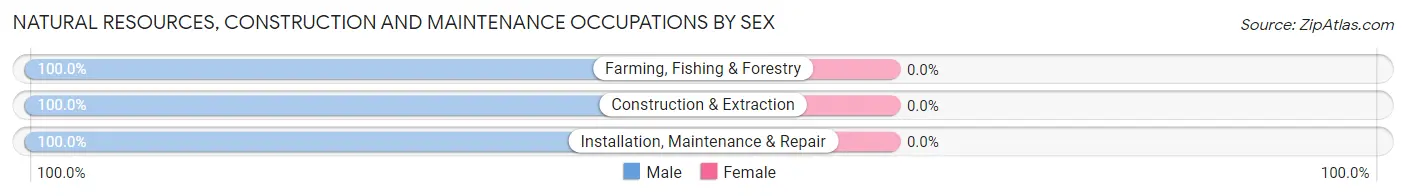
| Occupation | Male | Female |
| Farming, Fishing & Forestry | 17 (100.0%) | 0 (0.0%) |
| Construction & Extraction | 53 (100.0%) | 0 (0.0%) |
| Installation, Maintenance & Repair | 48 (100.0%) | 0 (0.0%) |
| Total (Category) | 118 (100.0%) | 0 (0.0%) |
| Total (Overall) | 992 (52.0%) | 916 (48.0%) |
Production, Transportation and Moving Occupations
The most common Production, Transportation and Moving occupations in Jessup borough are Production (178 | 9.3%), and Transportation (104 | 5.4%).
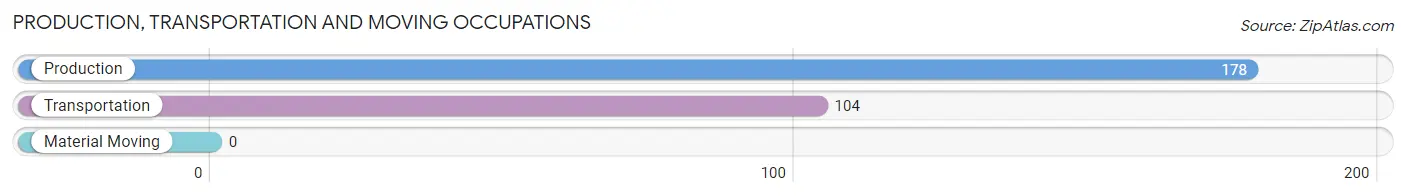
Production, Transportation and Moving Occupations by Sex
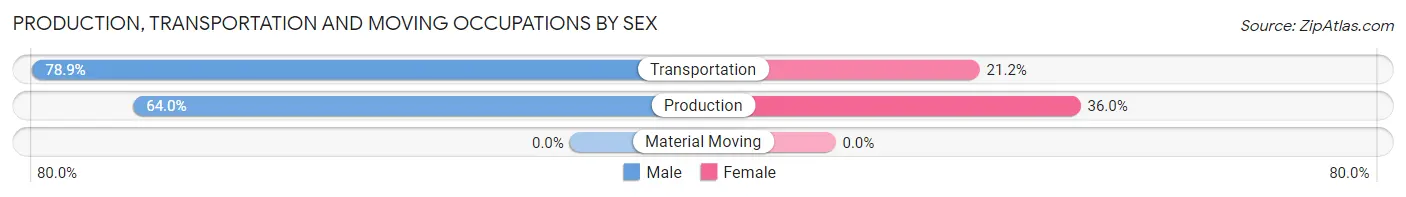
| Occupation | Male | Female |
| Production | 114 (64.0%) | 64 (36.0%) |
| Transportation | 82 (78.8%) | 22 (21.1%) |
| Material Moving | 0 (0.0%) | 0 (0.0%) |
| Total (Category) | 196 (69.5%) | 86 (30.5%) |
| Total (Overall) | 992 (52.0%) | 916 (48.0%) |
Employment Industries by Sex in Jessup borough
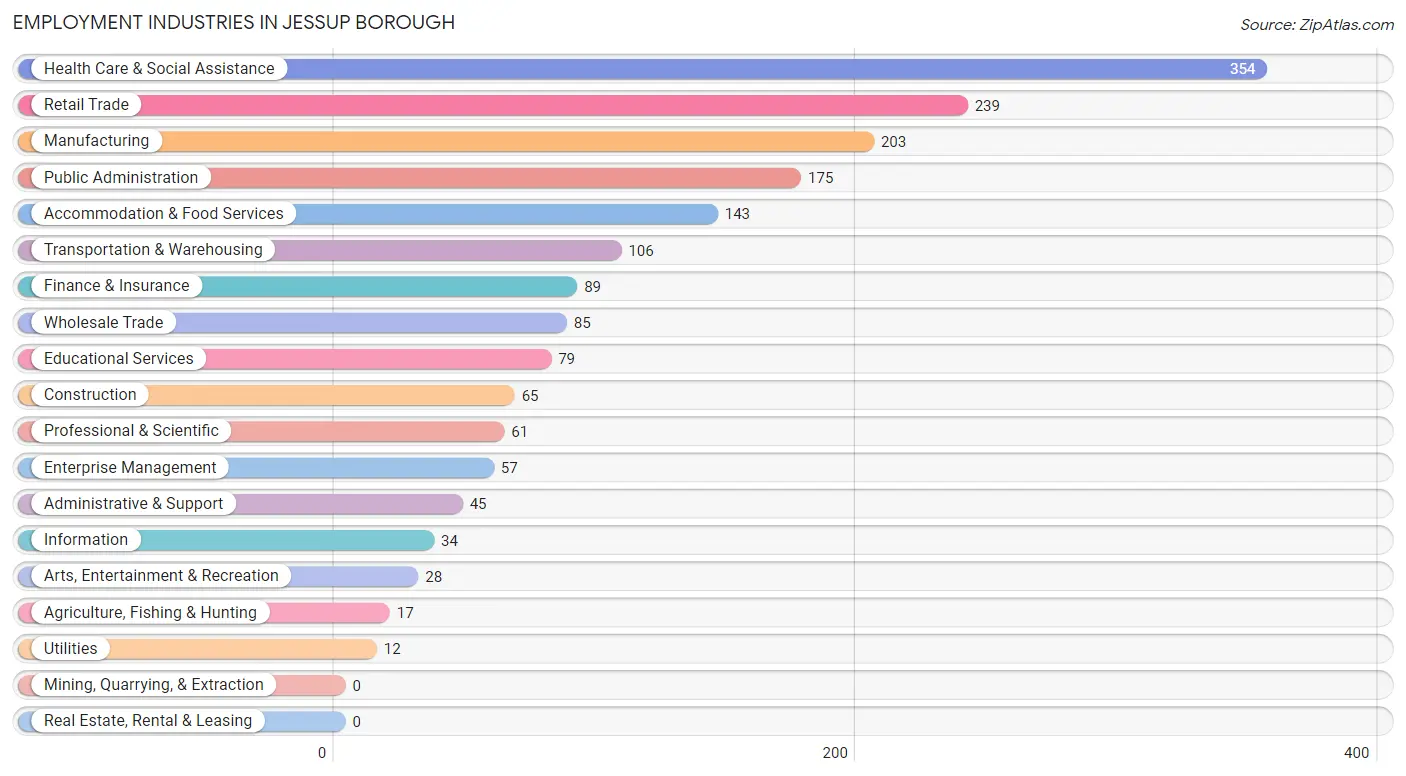
Employment Industries in Jessup borough
The major employment industries in Jessup borough include Health Care & Social Assistance (354 | 18.5%), Retail Trade (239 | 12.5%), Manufacturing (203 | 10.6%), Public Administration (175 | 9.2%), and Accommodation & Food Services (143 | 7.5%).
Employment Industries by Sex in Jessup borough
The Jessup borough industries that see more men than women are Agriculture, Fishing & Hunting (100.0%), Utilities (100.0%), and Information (100.0%), whereas the industries that tend to have a higher number of women are Professional & Scientific (91.8%), Wholesale Trade (78.8%), and Health Care & Social Assistance (67.2%).
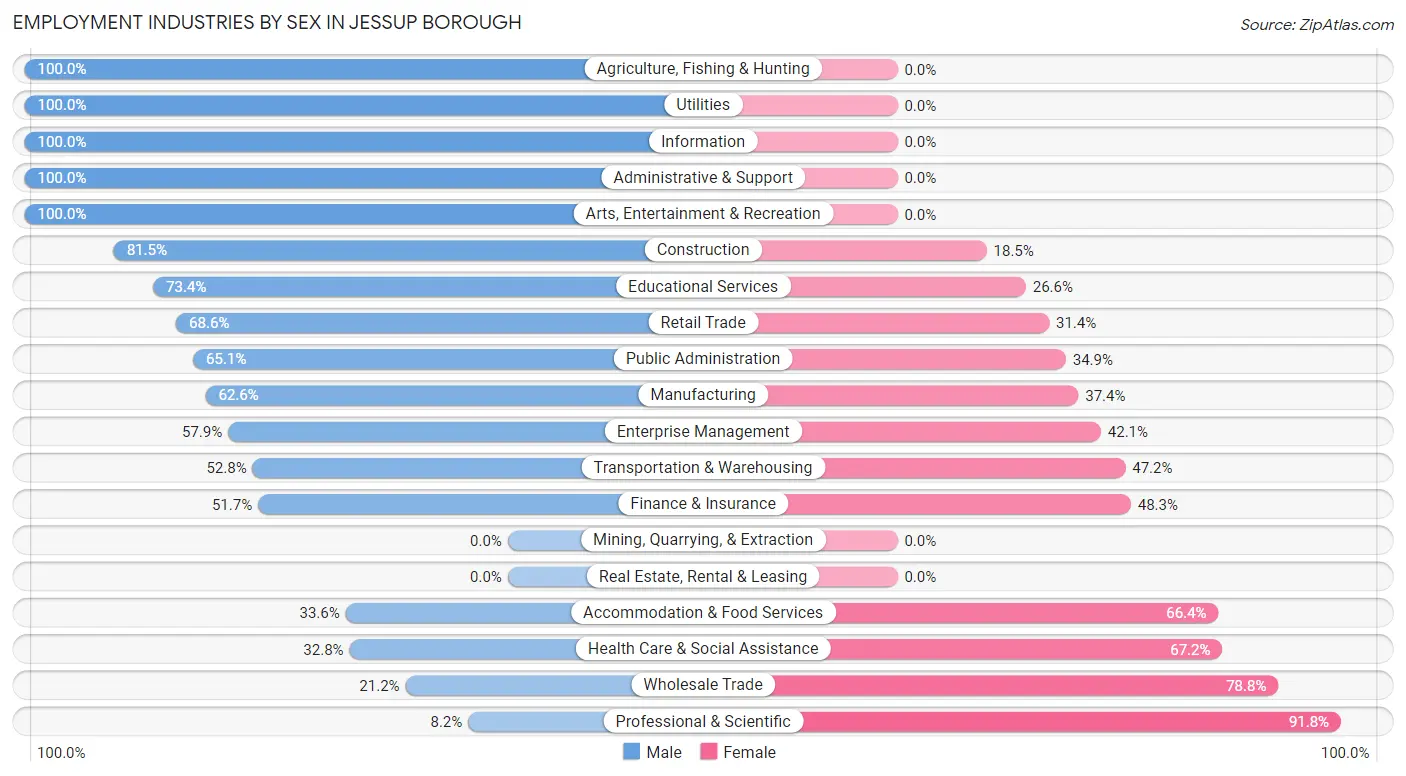
| Industry | Male | Female |
| Agriculture, Fishing & Hunting | 17 (100.0%) | 0 (0.0%) |
| Mining, Quarrying, & Extraction | 0 (0.0%) | 0 (0.0%) |
| Construction | 53 (81.5%) | 12 (18.5%) |
| Manufacturing | 127 (62.6%) | 76 (37.4%) |
| Wholesale Trade | 18 (21.2%) | 67 (78.8%) |
| Retail Trade | 164 (68.6%) | 75 (31.4%) |
| Transportation & Warehousing | 56 (52.8%) | 50 (47.2%) |
| Utilities | 12 (100.0%) | 0 (0.0%) |
| Information | 34 (100.0%) | 0 (0.0%) |
| Finance & Insurance | 46 (51.7%) | 43 (48.3%) |
| Real Estate, Rental & Leasing | 0 (0.0%) | 0 (0.0%) |
| Professional & Scientific | 5 (8.2%) | 56 (91.8%) |
| Enterprise Management | 33 (57.9%) | 24 (42.1%) |
| Administrative & Support | 45 (100.0%) | 0 (0.0%) |
| Educational Services | 58 (73.4%) | 21 (26.6%) |
| Health Care & Social Assistance | 116 (32.8%) | 238 (67.2%) |
| Arts, Entertainment & Recreation | 28 (100.0%) | 0 (0.0%) |
| Accommodation & Food Services | 48 (33.6%) | 95 (66.4%) |
| Public Administration | 114 (65.1%) | 61 (34.9%) |
| Total | 992 (52.0%) | 916 (48.0%) |
Education in Jessup borough
School Enrollment in Jessup borough
The most common levels of schooling among the 997 students in Jessup borough are middle school (326 | 32.7%), high school (208 | 20.9%), and elementary school (190 | 19.1%).
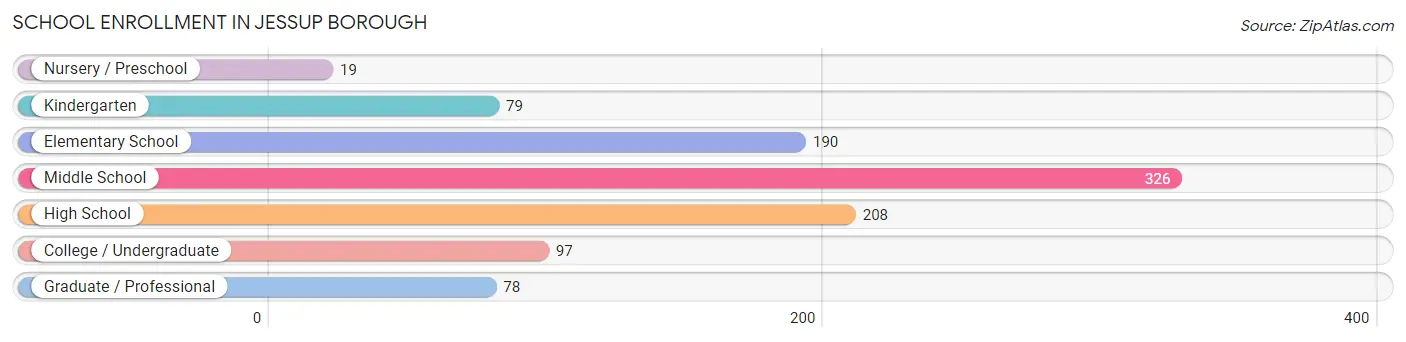
| School Level | # Students | % Students |
| Nursery / Preschool | 19 | 1.9% |
| Kindergarten | 79 | 7.9% |
| Elementary School | 190 | 19.1% |
| Middle School | 326 | 32.7% |
| High School | 208 | 20.9% |
| College / Undergraduate | 97 | 9.7% |
| Graduate / Professional | 78 | 7.8% |
| Total | 997 | 100.0% |
School Enrollment by Age by Funding Source in Jessup borough
Out of a total of 997 students who are enrolled in schools in Jessup borough, 336 (33.7%) attend a private institution, while the remaining 661 (66.3%) are enrolled in public schools. The age group of 3 to 4 year olds has the highest likelihood of being enrolled in private schools, with 19 (100.0% in the age bracket) enrolled. Conversely, the age group of 5 to 9 year old has the lowest likelihood of being enrolled in a private school, with 269 (100.0% in the age bracket) attending a public institution.
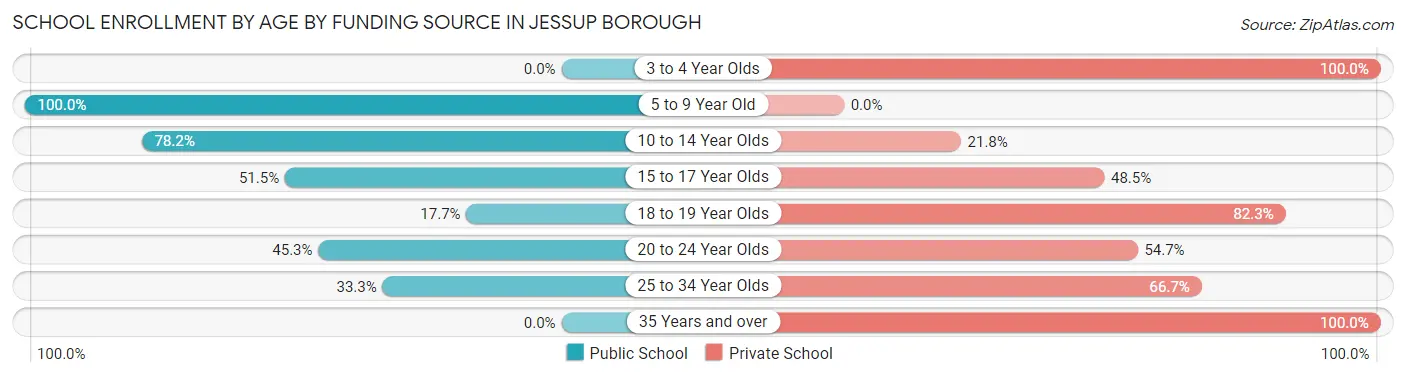
| Age Bracket | Public School | Private School |
| 3 to 4 Year Olds | 0 (0.0%) | 19 (100.0%) |
| 5 to 9 Year Old | 269 (100.0%) | 0 (0.0%) |
| 10 to 14 Year Olds | 255 (78.2%) | 71 (21.8%) |
| 15 to 17 Year Olds | 86 (51.5%) | 81 (48.5%) |
| 18 to 19 Year Olds | 17 (17.7%) | 79 (82.3%) |
| 20 to 24 Year Olds | 24 (45.3%) | 29 (54.7%) |
| 25 to 34 Year Olds | 10 (33.3%) | 20 (66.7%) |
| 35 Years and over | 0 (0.0%) | 37 (100.0%) |
| Total | 661 (66.3%) | 336 (33.7%) |
Educational Attainment by Field of Study in Jessup borough
Science & technology (166 | 18.2%), education (124 | 13.6%), arts & humanities (115 | 12.6%), visual & performing arts (111 | 12.2%), and psychology (92 | 10.1%) are the most common fields of study among 912 individuals in Jessup borough who have obtained a bachelor's degree or higher.
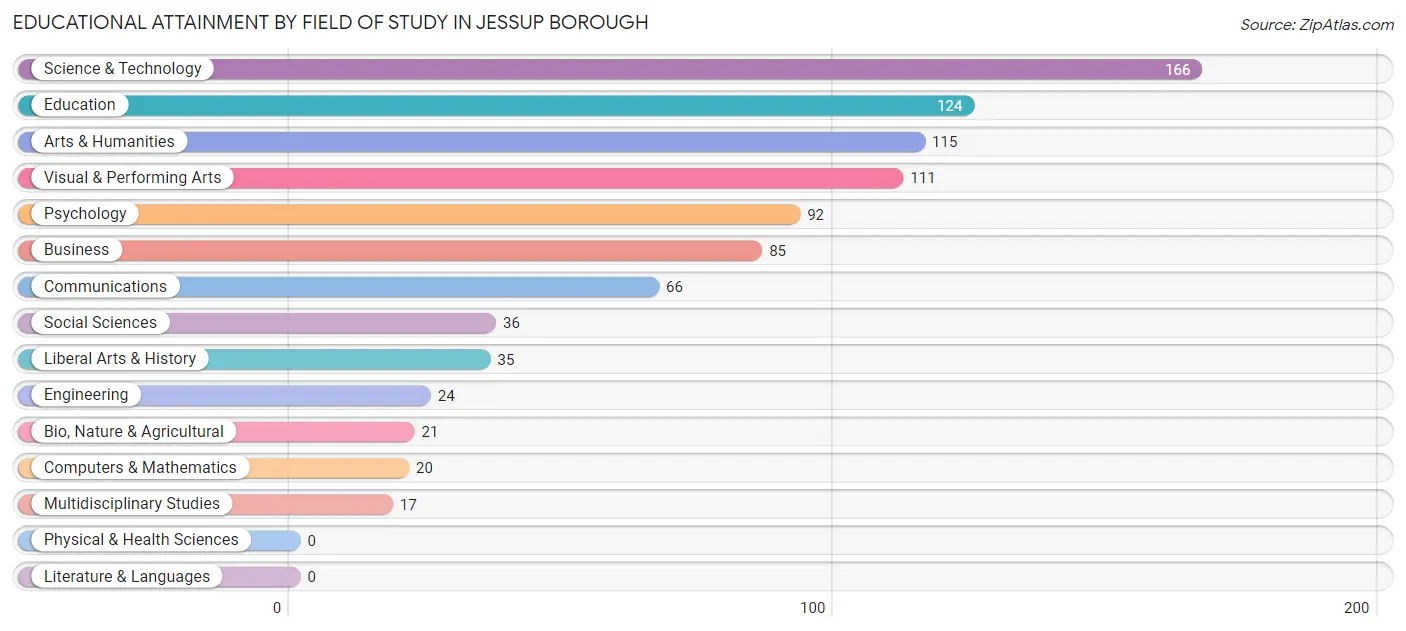
| Field of Study | # Graduates | % Graduates |
| Computers & Mathematics | 20 | 2.2% |
| Bio, Nature & Agricultural | 21 | 2.3% |
| Physical & Health Sciences | 0 | 0.0% |
| Psychology | 92 | 10.1% |
| Social Sciences | 36 | 4.0% |
| Engineering | 24 | 2.6% |
| Multidisciplinary Studies | 17 | 1.9% |
| Science & Technology | 166 | 18.2% |
| Business | 85 | 9.3% |
| Education | 124 | 13.6% |
| Literature & Languages | 0 | 0.0% |
| Liberal Arts & History | 35 | 3.8% |
| Visual & Performing Arts | 111 | 12.2% |
| Communications | 66 | 7.2% |
| Arts & Humanities | 115 | 12.6% |
| Total | 912 | 100.0% |
Transportation & Commute in Jessup borough
Vehicle Availability by Sex in Jessup borough
The most prevalent vehicle ownership categories in Jessup borough are males with 2 vehicles (538, accounting for 55.3%) and females with 2 vehicles (350, making up 58.7%).
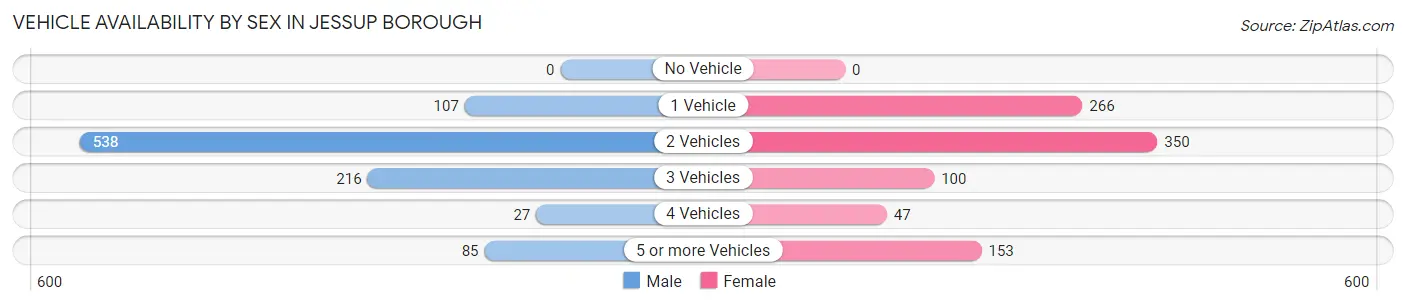
| Vehicles Available | Male | Female |
| No Vehicle | 0 (0.0%) | 0 (0.0%) |
| 1 Vehicle | 107 (11.0%) | 266 (29.0%) |
| 2 Vehicles | 538 (55.3%) | 350 (38.2%) |
| 3 Vehicles | 216 (22.2%) | 100 (10.9%) |
| 4 Vehicles | 27 (2.8%) | 47 (5.1%) |
| 5 or more Vehicles | 85 (8.7%) | 153 (16.7%) |
| Total | 973 (100.0%) | 916 (100.0%) |
Commute Time in Jessup borough
The most frequently occuring commute durations in Jessup borough are 15 to 19 minutes (372 commuters, 20.8%), 20 to 24 minutes (305 commuters, 17.0%), and 30 to 34 minutes (233 commuters, 13.0%).
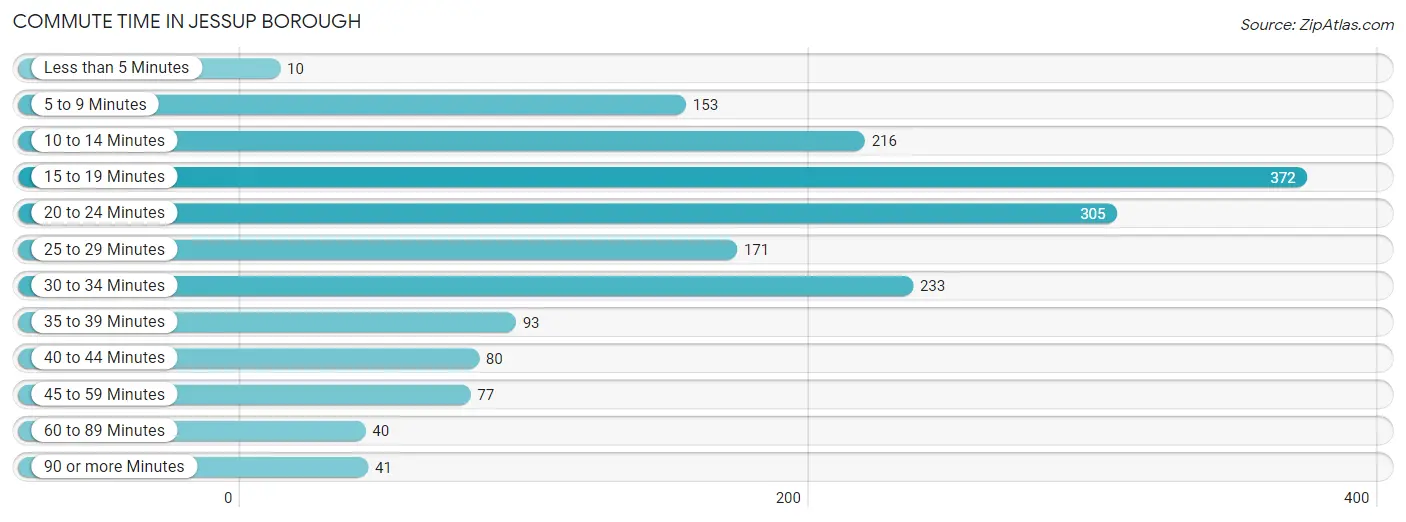
| Commute Time | # Commuters | % Commuters |
| Less than 5 Minutes | 10 | 0.6% |
| 5 to 9 Minutes | 153 | 8.5% |
| 10 to 14 Minutes | 216 | 12.1% |
| 15 to 19 Minutes | 372 | 20.8% |
| 20 to 24 Minutes | 305 | 17.0% |
| 25 to 29 Minutes | 171 | 9.6% |
| 30 to 34 Minutes | 233 | 13.0% |
| 35 to 39 Minutes | 93 | 5.2% |
| 40 to 44 Minutes | 80 | 4.5% |
| 45 to 59 Minutes | 77 | 4.3% |
| 60 to 89 Minutes | 40 | 2.2% |
| 90 or more Minutes | 41 | 2.3% |
Commute Time by Sex in Jessup borough
The most common commute times in Jessup borough are 15 to 19 minutes (201 commuters, 21.3%) for males and 15 to 19 minutes (171 commuters, 20.2%) for females.
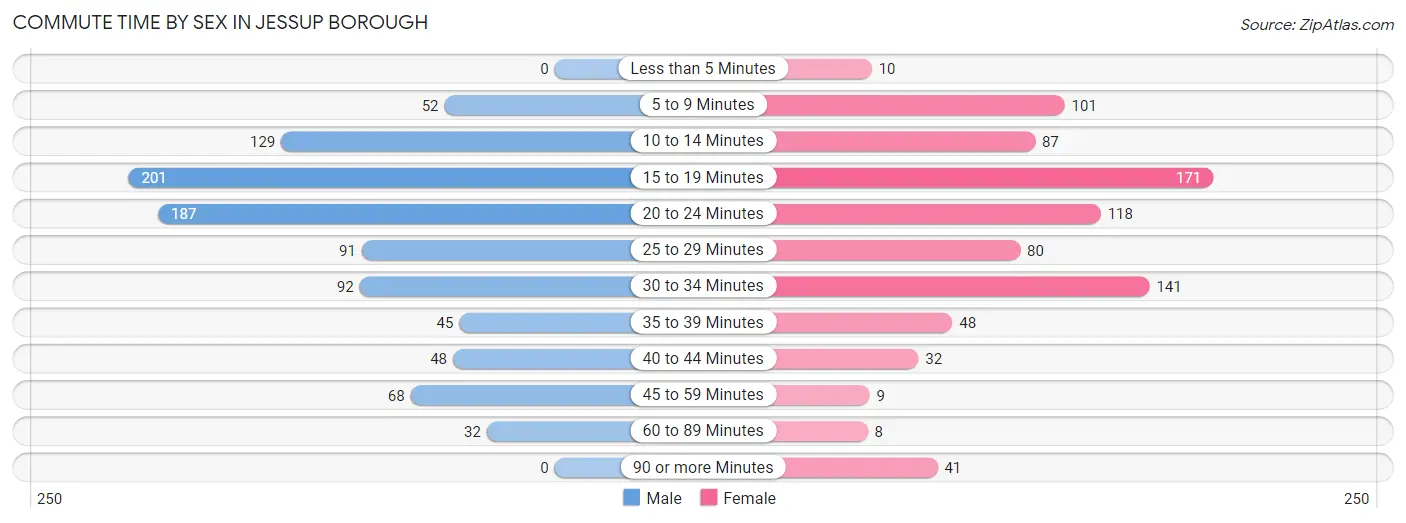
| Commute Time | Male | Female |
| Less than 5 Minutes | 0 (0.0%) | 10 (1.2%) |
| 5 to 9 Minutes | 52 (5.5%) | 101 (11.9%) |
| 10 to 14 Minutes | 129 (13.7%) | 87 (10.3%) |
| 15 to 19 Minutes | 201 (21.3%) | 171 (20.2%) |
| 20 to 24 Minutes | 187 (19.8%) | 118 (14.0%) |
| 25 to 29 Minutes | 91 (9.6%) | 80 (9.5%) |
| 30 to 34 Minutes | 92 (9.7%) | 141 (16.7%) |
| 35 to 39 Minutes | 45 (4.8%) | 48 (5.7%) |
| 40 to 44 Minutes | 48 (5.1%) | 32 (3.8%) |
| 45 to 59 Minutes | 68 (7.2%) | 9 (1.1%) |
| 60 to 89 Minutes | 32 (3.4%) | 8 (0.9%) |
| 90 or more Minutes | 0 (0.0%) | 41 (4.9%) |
Time of Departure to Work by Sex in Jessup borough
The most frequent times of departure to work in Jessup borough are 4:00 PM to 11:59 PM (152, 16.1%) for males and 7:00 AM to 7:29 AM (133, 15.7%) for females.
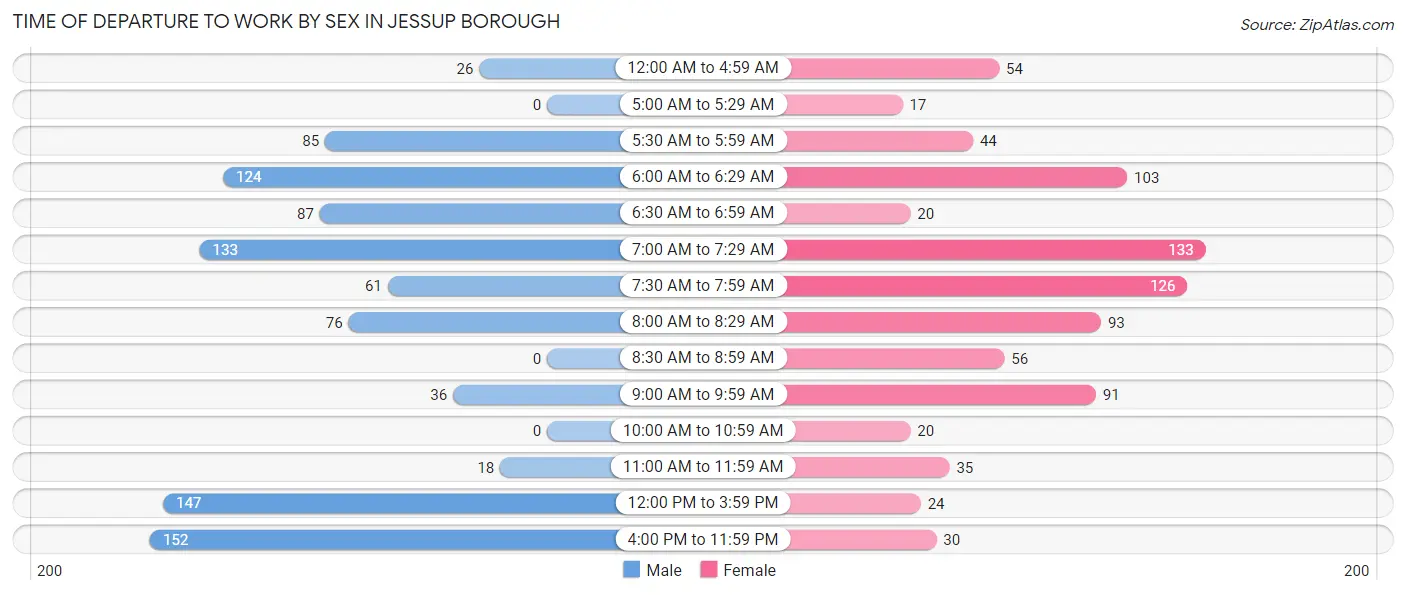
| Time of Departure | Male | Female |
| 12:00 AM to 4:59 AM | 26 (2.8%) | 54 (6.4%) |
| 5:00 AM to 5:29 AM | 0 (0.0%) | 17 (2.0%) |
| 5:30 AM to 5:59 AM | 85 (9.0%) | 44 (5.2%) |
| 6:00 AM to 6:29 AM | 124 (13.1%) | 103 (12.2%) |
| 6:30 AM to 6:59 AM | 87 (9.2%) | 20 (2.4%) |
| 7:00 AM to 7:29 AM | 133 (14.1%) | 133 (15.7%) |
| 7:30 AM to 7:59 AM | 61 (6.5%) | 126 (14.9%) |
| 8:00 AM to 8:29 AM | 76 (8.0%) | 93 (11.0%) |
| 8:30 AM to 8:59 AM | 0 (0.0%) | 56 (6.6%) |
| 9:00 AM to 9:59 AM | 36 (3.8%) | 91 (10.8%) |
| 10:00 AM to 10:59 AM | 0 (0.0%) | 20 (2.4%) |
| 11:00 AM to 11:59 AM | 18 (1.9%) | 35 (4.1%) |
| 12:00 PM to 3:59 PM | 147 (15.6%) | 24 (2.8%) |
| 4:00 PM to 11:59 PM | 152 (16.1%) | 30 (3.5%) |
| Total | 945 (100.0%) | 846 (100.0%) |
Housing Occupancy in Jessup borough
Occupancy by Ownership in Jessup borough
Of the total 1,915 dwellings in Jessup borough, owner-occupied units account for 1,359 (71.0%), while renter-occupied units make up 556 (29.0%).
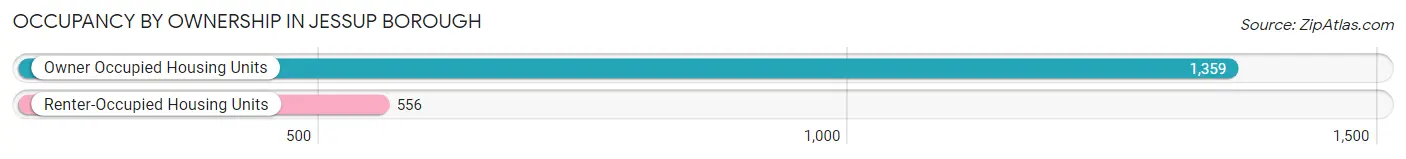
| Occupancy | # Housing Units | % Housing Units |
| Owner Occupied Housing Units | 1,359 | 71.0% |
| Renter-Occupied Housing Units | 556 | 29.0% |
| Total Occupied Housing Units | 1,915 | 100.0% |
Occupancy by Household Size in Jessup borough
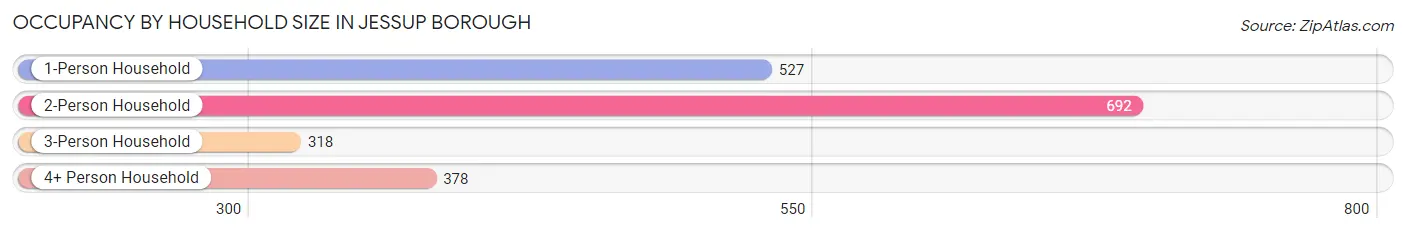
| Household Size | # Housing Units | % Housing Units |
| 1-Person Household | 527 | 27.5% |
| 2-Person Household | 692 | 36.1% |
| 3-Person Household | 318 | 16.6% |
| 4+ Person Household | 378 | 19.7% |
| Total Housing Units | 1,915 | 100.0% |
Occupancy by Ownership by Household Size in Jessup borough
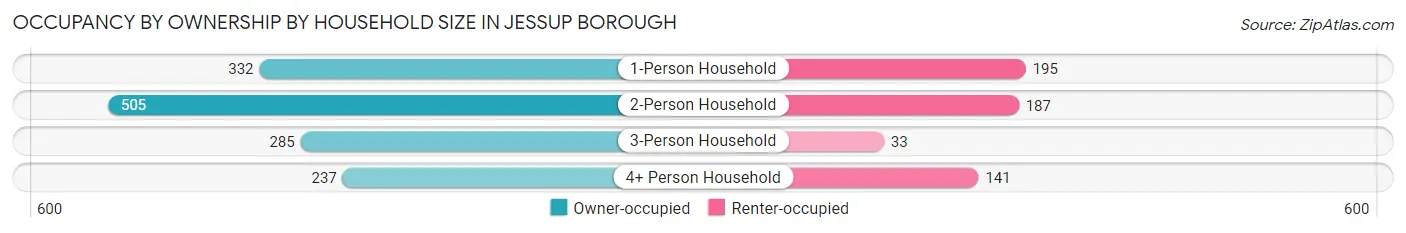
| Household Size | Owner-occupied | Renter-occupied |
| 1-Person Household | 332 (63.0%) | 195 (37.0%) |
| 2-Person Household | 505 (73.0%) | 187 (27.0%) |
| 3-Person Household | 285 (89.6%) | 33 (10.4%) |
| 4+ Person Household | 237 (62.7%) | 141 (37.3%) |
| Total Housing Units | 1,359 (71.0%) | 556 (29.0%) |
Occupancy by Educational Attainment in Jessup borough
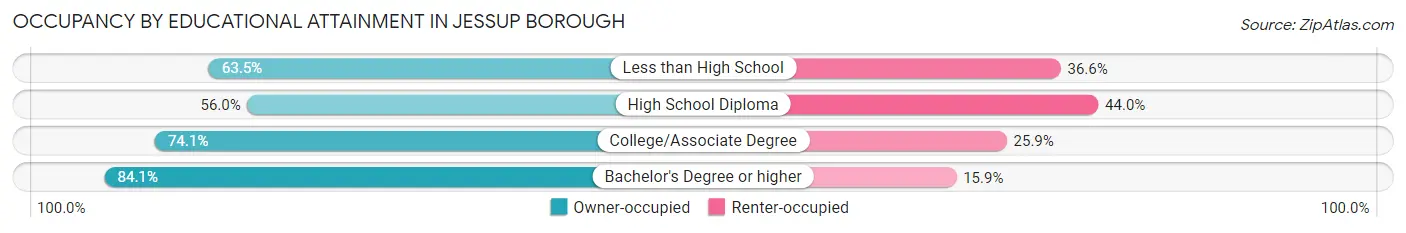
| Household Size | Owner-occupied | Renter-occupied |
| Less than High School | 92 (63.4%) | 53 (36.5%) |
| High School Diploma | 332 (56.0%) | 261 (44.0%) |
| College/Associate Degree | 410 (74.1%) | 143 (25.9%) |
| Bachelor's Degree or higher | 525 (84.1%) | 99 (15.9%) |
Occupancy by Age of Householder in Jessup borough
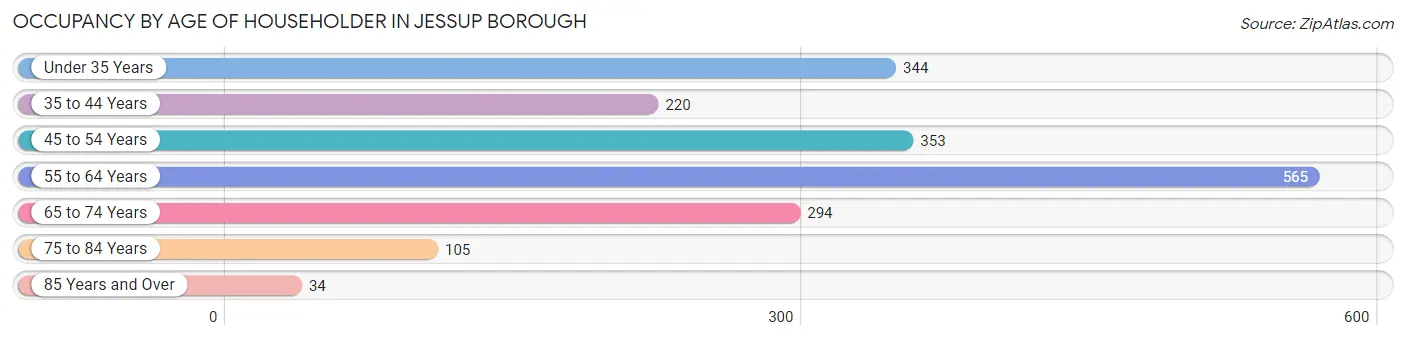
| Age Bracket | # Households | % Households |
| Under 35 Years | 344 | 18.0% |
| 35 to 44 Years | 220 | 11.5% |
| 45 to 54 Years | 353 | 18.4% |
| 55 to 64 Years | 565 | 29.5% |
| 65 to 74 Years | 294 | 15.3% |
| 75 to 84 Years | 105 | 5.5% |
| 85 Years and Over | 34 | 1.8% |
| Total | 1,915 | 100.0% |
Housing Finances in Jessup borough
Median Income by Occupancy in Jessup borough
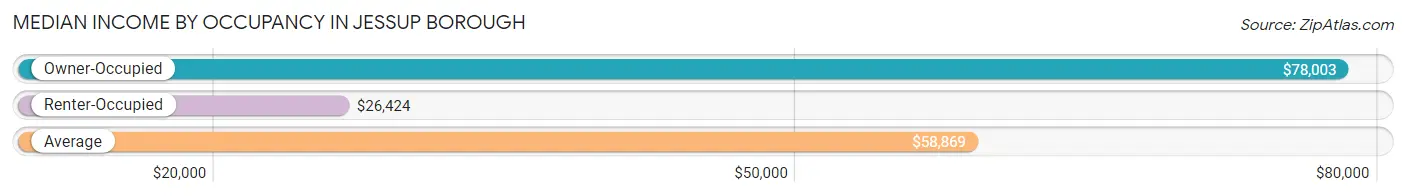
| Occupancy Type | # Households | Median Income |
| Owner-Occupied | 1,359 (71.0%) | $78,003 |
| Renter-Occupied | 556 (29.0%) | $26,424 |
| Average | 1,915 (100.0%) | $58,869 |
Occupancy by Householder Income Bracket in Jessup borough
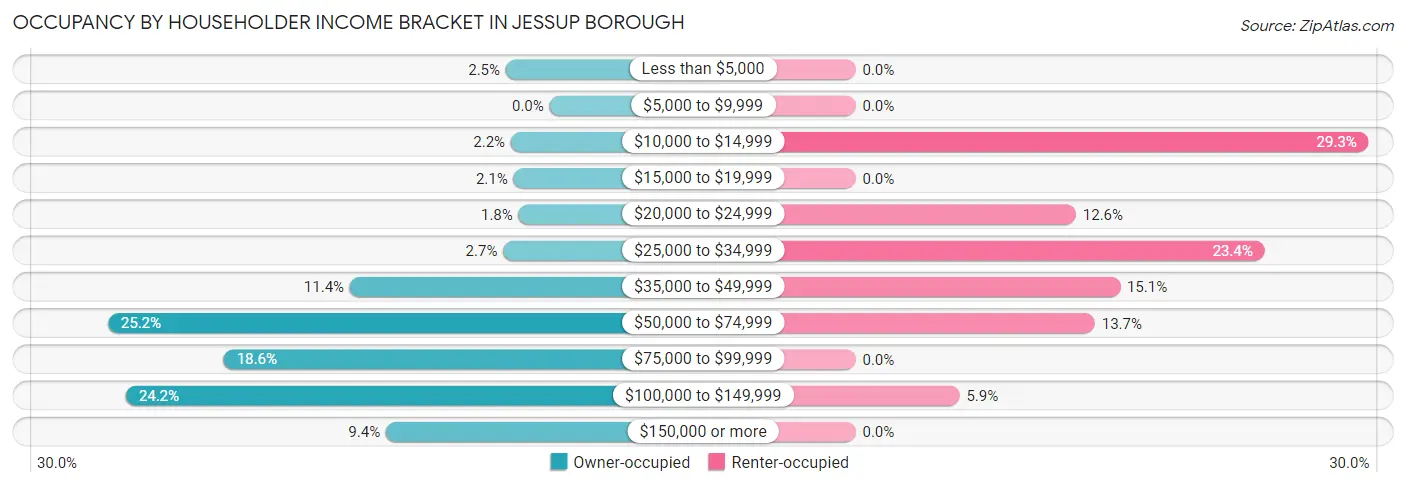
| Income Bracket | Owner-occupied | Renter-occupied |
| Less than $5,000 | 34 (2.5%) | 0 (0.0%) |
| $5,000 to $9,999 | 0 (0.0%) | 0 (0.0%) |
| $10,000 to $14,999 | 30 (2.2%) | 163 (29.3%) |
| $15,000 to $19,999 | 28 (2.1%) | 0 (0.0%) |
| $20,000 to $24,999 | 24 (1.8%) | 70 (12.6%) |
| $25,000 to $34,999 | 36 (2.6%) | 130 (23.4%) |
| $35,000 to $49,999 | 155 (11.4%) | 84 (15.1%) |
| $50,000 to $74,999 | 343 (25.2%) | 76 (13.7%) |
| $75,000 to $99,999 | 253 (18.6%) | 0 (0.0%) |
| $100,000 to $149,999 | 329 (24.2%) | 33 (5.9%) |
| $150,000 or more | 127 (9.3%) | 0 (0.0%) |
| Total | 1,359 (100.0%) | 556 (100.0%) |
Monthly Housing Cost Tiers in Jessup borough
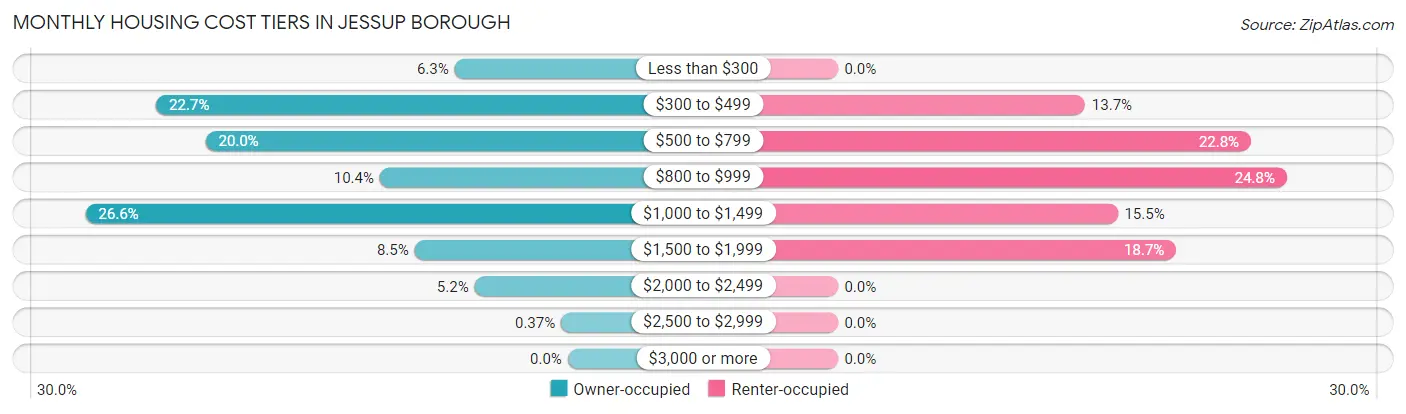
| Monthly Cost | Owner-occupied | Renter-occupied |
| Less than $300 | 85 (6.2%) | 0 (0.0%) |
| $300 to $499 | 309 (22.7%) | 76 (13.7%) |
| $500 to $799 | 272 (20.0%) | 127 (22.8%) |
| $800 to $999 | 141 (10.4%) | 138 (24.8%) |
| $1,000 to $1,499 | 362 (26.6%) | 86 (15.5%) |
| $1,500 to $1,999 | 115 (8.5%) | 104 (18.7%) |
| $2,000 to $2,499 | 70 (5.1%) | 0 (0.0%) |
| $2,500 to $2,999 | 5 (0.4%) | 0 (0.0%) |
| $3,000 or more | 0 (0.0%) | 0 (0.0%) |
| Total | 1,359 (100.0%) | 556 (100.0%) |
Physical Housing Characteristics in Jessup borough
Housing Structures in Jessup borough
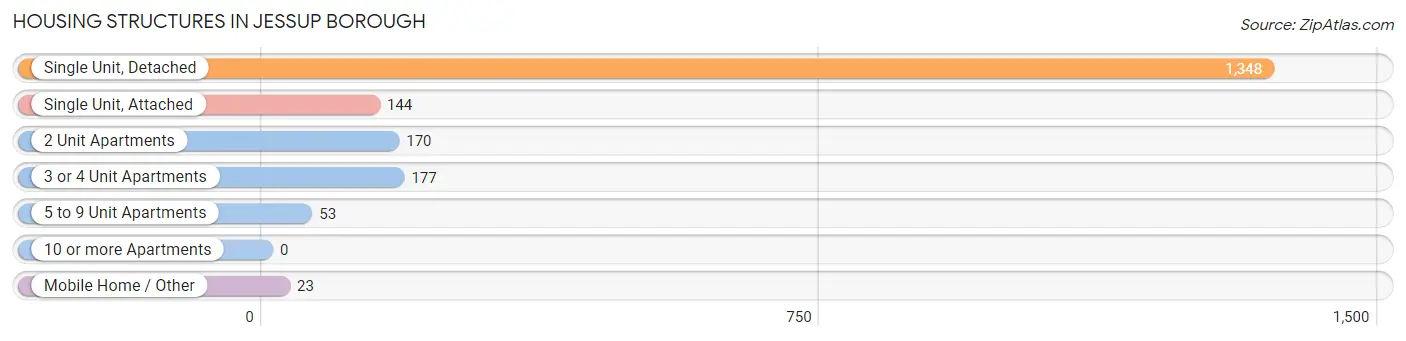
| Structure Type | # Housing Units | % Housing Units |
| Single Unit, Detached | 1,348 | 70.4% |
| Single Unit, Attached | 144 | 7.5% |
| 2 Unit Apartments | 170 | 8.9% |
| 3 or 4 Unit Apartments | 177 | 9.2% |
| 5 to 9 Unit Apartments | 53 | 2.8% |
| 10 or more Apartments | 0 | 0.0% |
| Mobile Home / Other | 23 | 1.2% |
| Total | 1,915 | 100.0% |
Housing Structures by Occupancy in Jessup borough
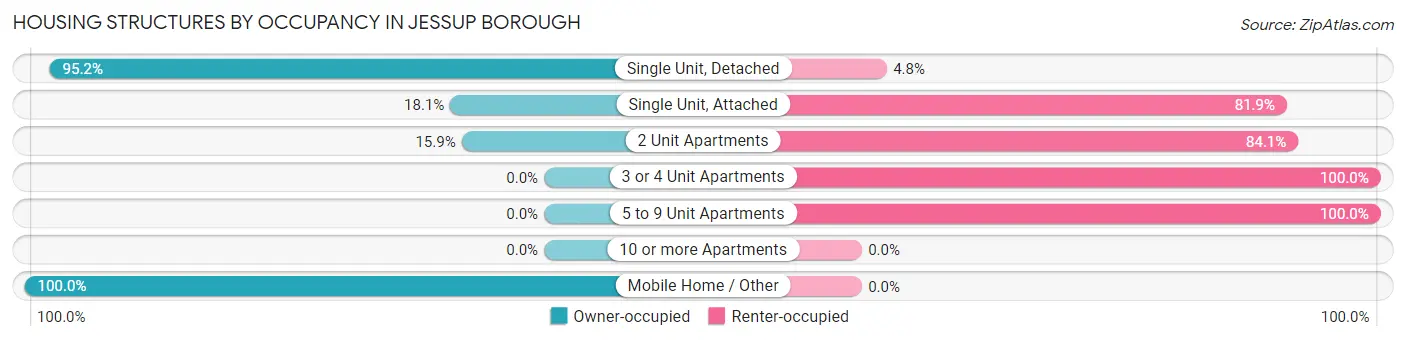
| Structure Type | Owner-occupied | Renter-occupied |
| Single Unit, Detached | 1,283 (95.2%) | 65 (4.8%) |
| Single Unit, Attached | 26 (18.1%) | 118 (81.9%) |
| 2 Unit Apartments | 27 (15.9%) | 143 (84.1%) |
| 3 or 4 Unit Apartments | 0 (0.0%) | 177 (100.0%) |
| 5 to 9 Unit Apartments | 0 (0.0%) | 53 (100.0%) |
| 10 or more Apartments | 0 (0.0%) | 0 (0.0%) |
| Mobile Home / Other | 23 (100.0%) | 0 (0.0%) |
| Total | 1,359 (71.0%) | 556 (29.0%) |
Housing Structures by Number of Rooms in Jessup borough
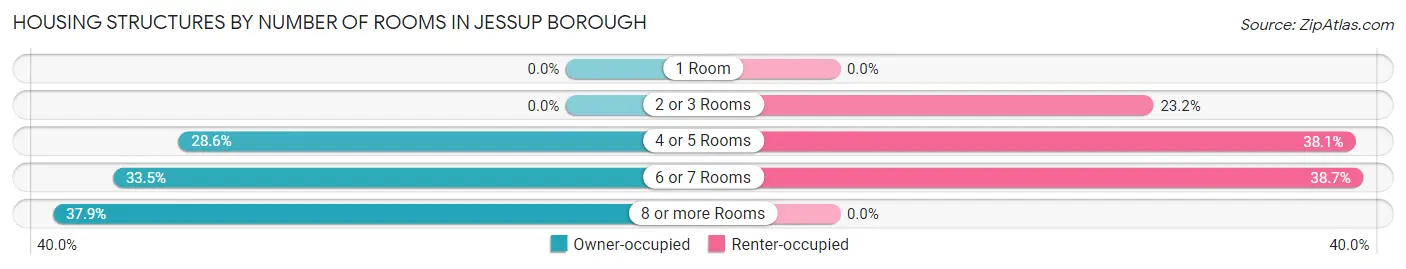
| Number of Rooms | Owner-occupied | Renter-occupied |
| 1 Room | 0 (0.0%) | 0 (0.0%) |
| 2 or 3 Rooms | 0 (0.0%) | 129 (23.2%) |
| 4 or 5 Rooms | 389 (28.6%) | 212 (38.1%) |
| 6 or 7 Rooms | 455 (33.5%) | 215 (38.7%) |
| 8 or more Rooms | 515 (37.9%) | 0 (0.0%) |
| Total | 1,359 (100.0%) | 556 (100.0%) |
Housing Structure by Heating Type in Jessup borough
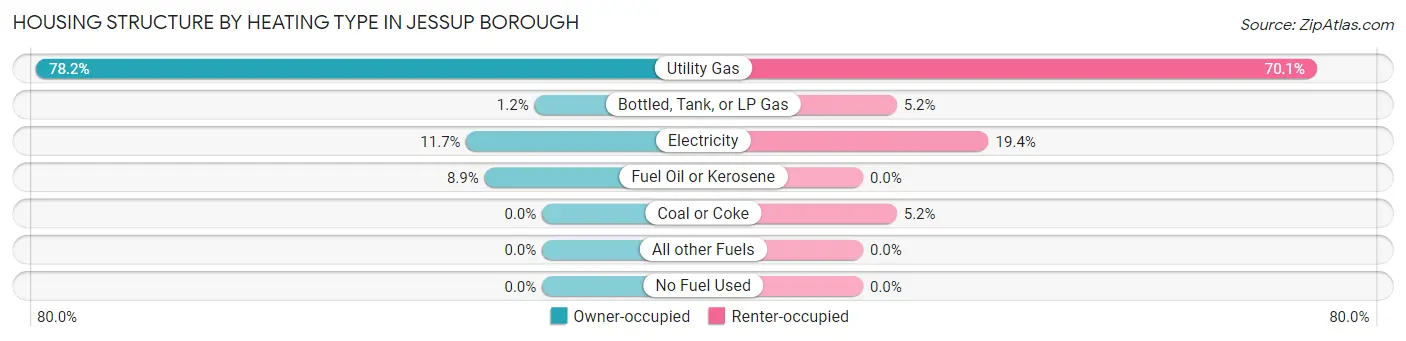
| Heating Type | Owner-occupied | Renter-occupied |
| Utility Gas | 1,063 (78.2%) | 390 (70.1%) |
| Bottled, Tank, or LP Gas | 16 (1.2%) | 29 (5.2%) |
| Electricity | 159 (11.7%) | 108 (19.4%) |
| Fuel Oil or Kerosene | 121 (8.9%) | 0 (0.0%) |
| Coal or Coke | 0 (0.0%) | 29 (5.2%) |
| All other Fuels | 0 (0.0%) | 0 (0.0%) |
| No Fuel Used | 0 (0.0%) | 0 (0.0%) |
| Total | 1,359 (100.0%) | 556 (100.0%) |
Household Vehicle Usage in Jessup borough
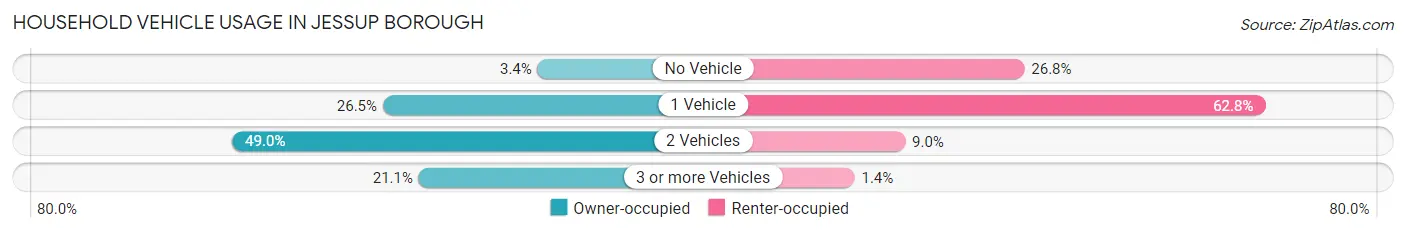
| Vehicles per Household | Owner-occupied | Renter-occupied |
| No Vehicle | 46 (3.4%) | 149 (26.8%) |
| 1 Vehicle | 360 (26.5%) | 349 (62.8%) |
| 2 Vehicles | 666 (49.0%) | 50 (9.0%) |
| 3 or more Vehicles | 287 (21.1%) | 8 (1.4%) |
| Total | 1,359 (100.0%) | 556 (100.0%) |
Real Estate & Mortgages in Jessup borough
Real Estate and Mortgage Overview in Jessup borough
| Characteristic | Without Mortgage | With Mortgage |
| Housing Units | 589 | 770 |
| Median Property Value | $165,400 | $157,600 |
| Median Household Income | $58,892 | $81 |
| Monthly Housing Costs | $443 | $0 |
| Real Estate Taxes | $1,256 | $6 |
Property Value by Mortgage Status in Jessup borough
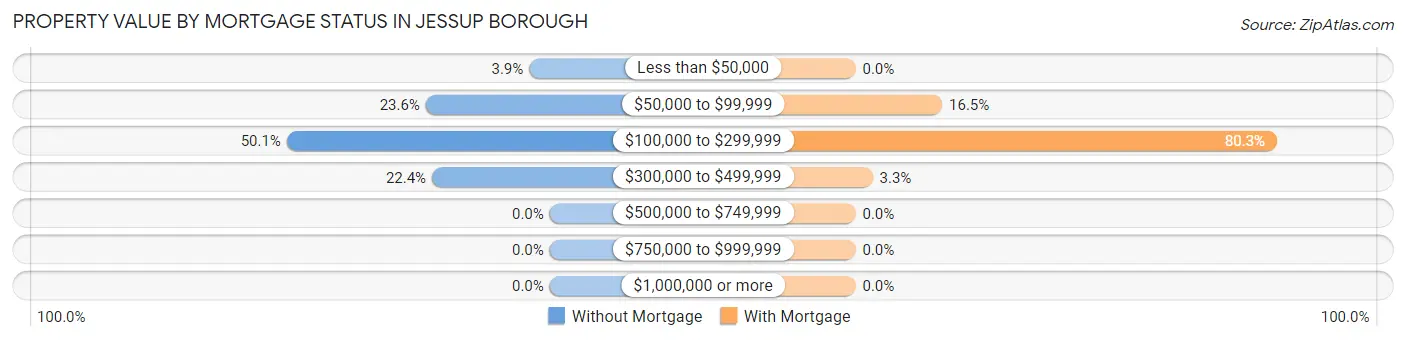
| Property Value | Without Mortgage | With Mortgage |
| Less than $50,000 | 23 (3.9%) | 0 (0.0%) |
| $50,000 to $99,999 | 139 (23.6%) | 127 (16.5%) |
| $100,000 to $299,999 | 295 (50.1%) | 618 (80.3%) |
| $300,000 to $499,999 | 132 (22.4%) | 25 (3.3%) |
| $500,000 to $749,999 | 0 (0.0%) | 0 (0.0%) |
| $750,000 to $999,999 | 0 (0.0%) | 0 (0.0%) |
| $1,000,000 or more | 0 (0.0%) | 0 (0.0%) |
| Total | 589 (100.0%) | 770 (100.0%) |
Household Income by Mortgage Status in Jessup borough
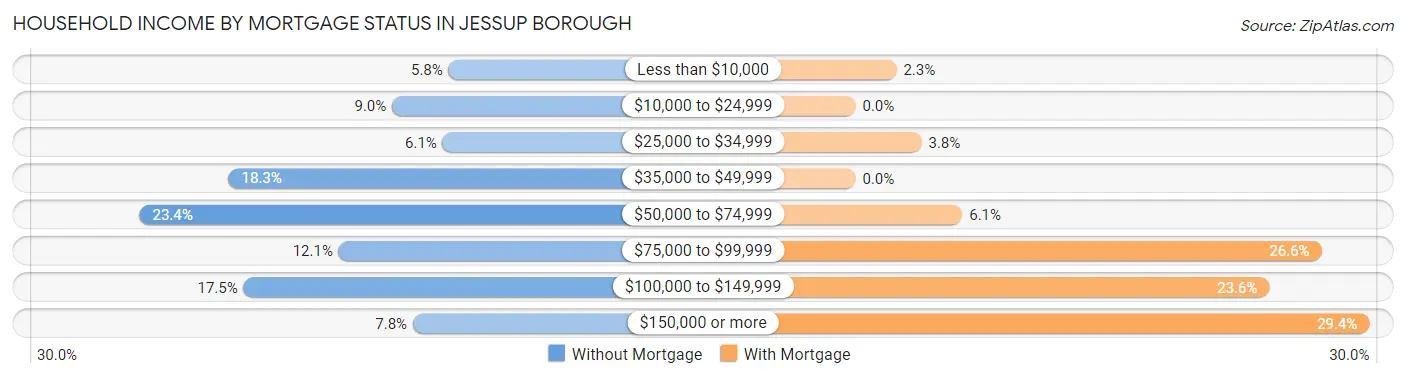
| Household Income | Without Mortgage | With Mortgage |
| Less than $10,000 | 34 (5.8%) | 18 (2.3%) |
| $10,000 to $24,999 | 53 (9.0%) | 0 (0.0%) |
| $25,000 to $34,999 | 36 (6.1%) | 29 (3.8%) |
| $35,000 to $49,999 | 108 (18.3%) | 0 (0.0%) |
| $50,000 to $74,999 | 138 (23.4%) | 47 (6.1%) |
| $75,000 to $99,999 | 71 (12.0%) | 205 (26.6%) |
| $100,000 to $149,999 | 103 (17.5%) | 182 (23.6%) |
| $150,000 or more | 46 (7.8%) | 226 (29.3%) |
| Total | 589 (100.0%) | 770 (100.0%) |
Property Value to Household Income Ratio in Jessup borough
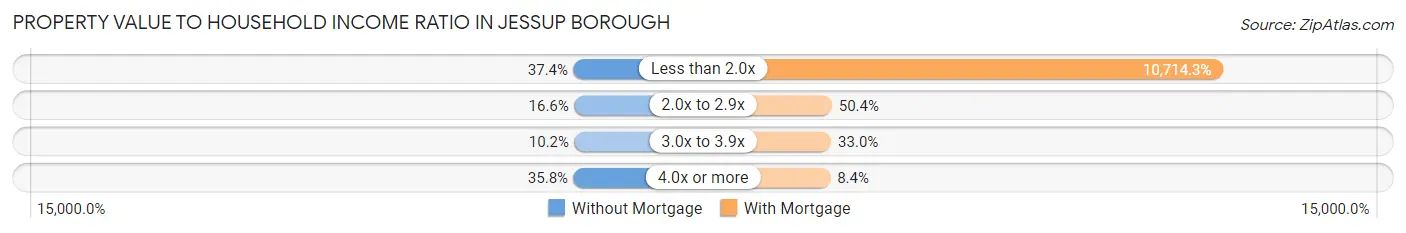
| Value-to-Income Ratio | Without Mortgage | With Mortgage |
| Less than 2.0x | 220 (37.3%) | 82,500 (10,714.3%) |
| 2.0x to 2.9x | 98 (16.6%) | 388 (50.4%) |
| 3.0x to 3.9x | 60 (10.2%) | 254 (33.0%) |
| 4.0x or more | 211 (35.8%) | 65 (8.4%) |
| Total | 589 (100.0%) | 770 (100.0%) |
Real Estate Taxes by Mortgage Status in Jessup borough
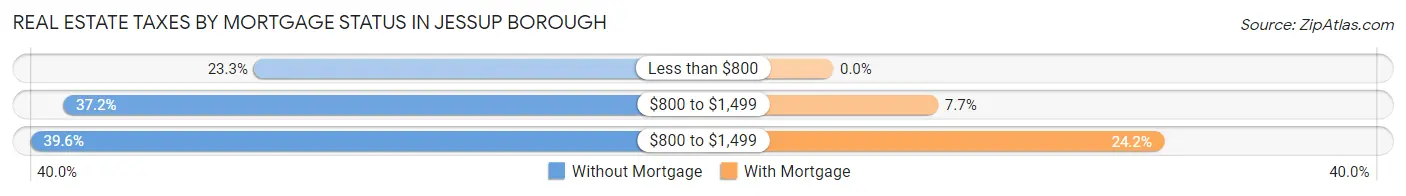
| Property Taxes | Without Mortgage | With Mortgage |
| Less than $800 | 137 (23.3%) | 0 (0.0%) |
| $800 to $1,499 | 219 (37.2%) | 59 (7.7%) |
| $800 to $1,499 | 233 (39.6%) | 186 (24.2%) |
| Total | 589 (100.0%) | 770 (100.0%) |
Health & Disability in Jessup borough
Health Insurance Coverage by Age in Jessup borough
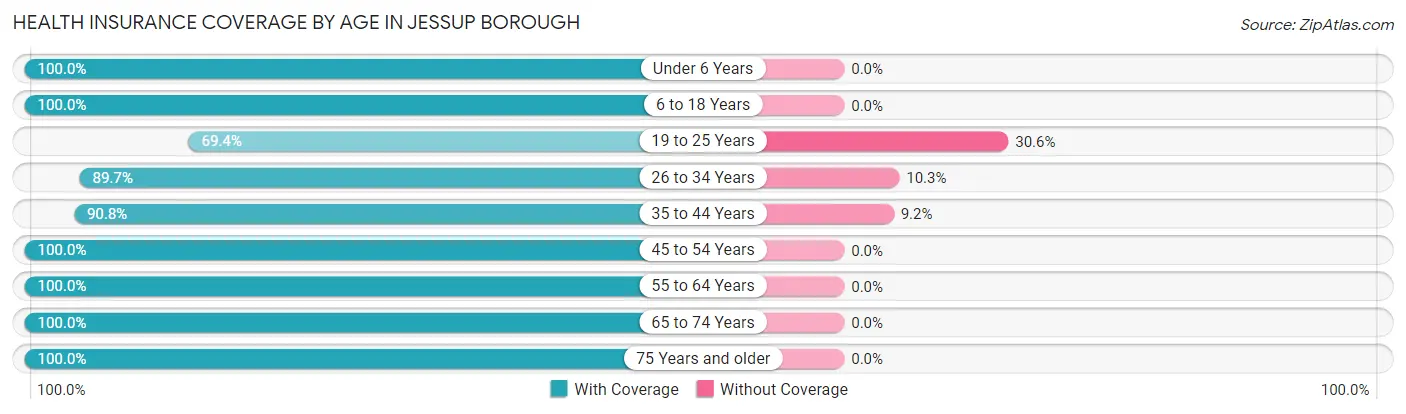
| Age Bracket | With Coverage | Without Coverage |
| Under 6 Years | 201 (100.0%) | 0 (0.0%) |
| 6 to 18 Years | 799 (100.0%) | 0 (0.0%) |
| 19 to 25 Years | 118 (69.4%) | 52 (30.6%) |
| 26 to 34 Years | 551 (89.7%) | 63 (10.3%) |
| 35 to 44 Years | 434 (90.8%) | 44 (9.2%) |
| 45 to 54 Years | 748 (100.0%) | 0 (0.0%) |
| 55 to 64 Years | 822 (100.0%) | 0 (0.0%) |
| 65 to 74 Years | 463 (100.0%) | 0 (0.0%) |
| 75 Years and older | 215 (100.0%) | 0 (0.0%) |
| Total | 4,351 (96.5%) | 159 (3.5%) |
Health Insurance Coverage by Citizenship Status in Jessup borough
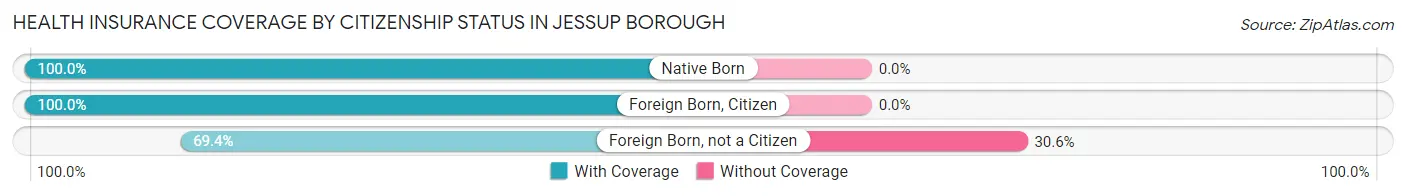
| Citizenship Status | With Coverage | Without Coverage |
| Native Born | 201 (100.0%) | 0 (0.0%) |
| Foreign Born, Citizen | 799 (100.0%) | 0 (0.0%) |
| Foreign Born, not a Citizen | 118 (69.4%) | 52 (30.6%) |
Health Insurance Coverage by Household Income in Jessup borough
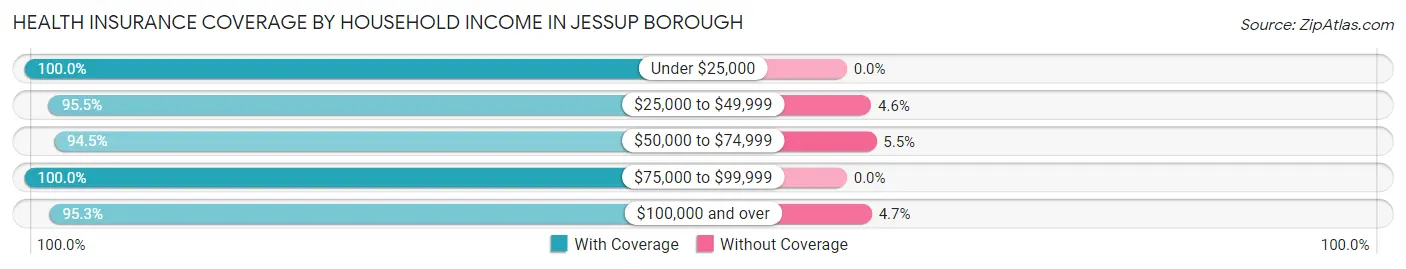
| Household Income | With Coverage | Without Coverage |
| Under $25,000 | 737 (100.0%) | 0 (0.0%) |
| $25,000 to $49,999 | 587 (95.5%) | 28 (4.5%) |
| $50,000 to $74,999 | 888 (94.5%) | 52 (5.5%) |
| $75,000 to $99,999 | 543 (100.0%) | 0 (0.0%) |
| $100,000 and over | 1,593 (95.3%) | 78 (4.7%) |
Public vs Private Health Insurance Coverage by Age in Jessup borough
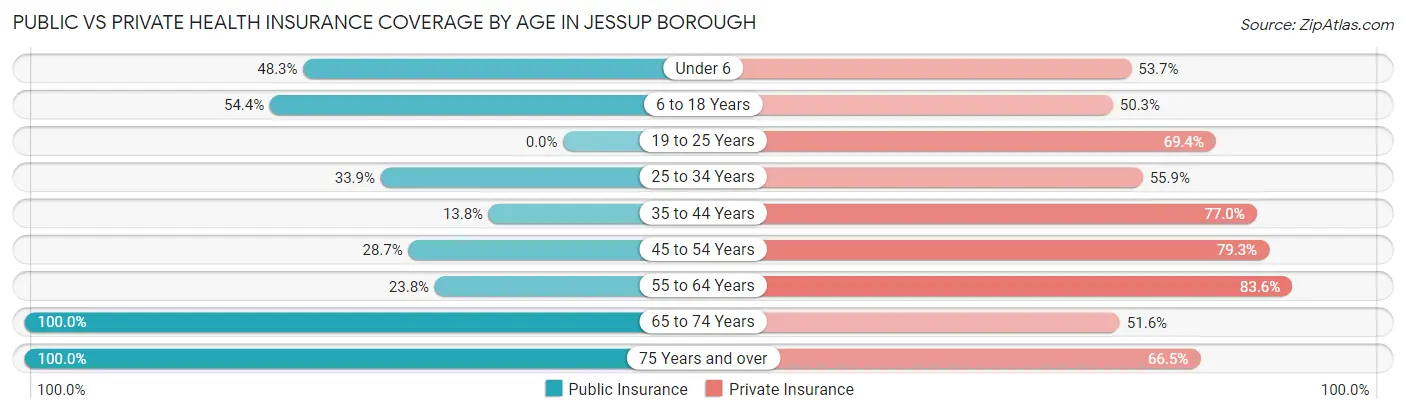
| Age Bracket | Public Insurance | Private Insurance |
| Under 6 | 97 (48.3%) | 108 (53.7%) |
| 6 to 18 Years | 435 (54.4%) | 402 (50.3%) |
| 19 to 25 Years | 0 (0.0%) | 118 (69.4%) |
| 25 to 34 Years | 208 (33.9%) | 343 (55.9%) |
| 35 to 44 Years | 66 (13.8%) | 368 (77.0%) |
| 45 to 54 Years | 215 (28.7%) | 593 (79.3%) |
| 55 to 64 Years | 196 (23.8%) | 687 (83.6%) |
| 65 to 74 Years | 463 (100.0%) | 239 (51.6%) |
| 75 Years and over | 215 (100.0%) | 143 (66.5%) |
| Total | 1,895 (42.0%) | 3,001 (66.5%) |
Disability Status by Sex by Age in Jessup borough
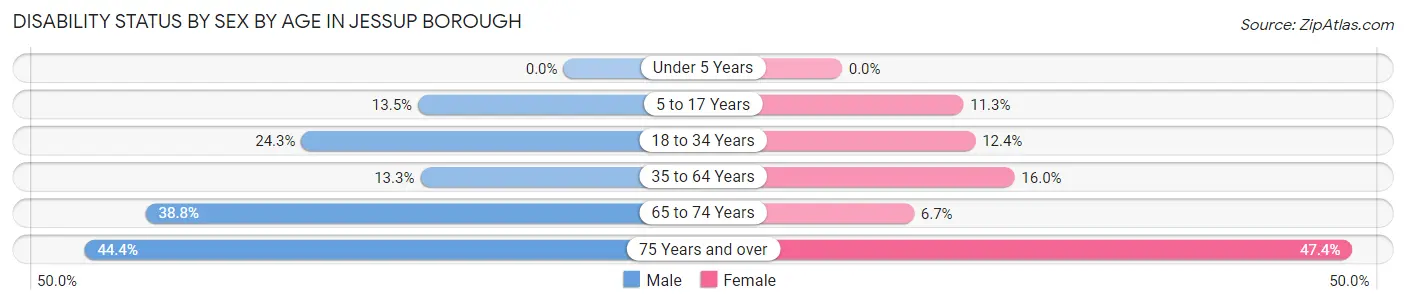
| Age Bracket | Male | Female |
| Under 5 Years | 0 (0.0%) | 0 (0.0%) |
| 5 to 17 Years | 49 (13.5%) | 45 (11.3%) |
| 18 to 34 Years | 71 (24.3%) | 66 (12.4%) |
| 35 to 64 Years | 141 (13.3%) | 158 (16.0%) |
| 65 to 74 Years | 81 (38.8%) | 17 (6.7%) |
| 75 Years and over | 28 (44.4%) | 72 (47.4%) |
Disability Class by Sex by Age in Jessup borough
Disability Class: Hearing Difficulty
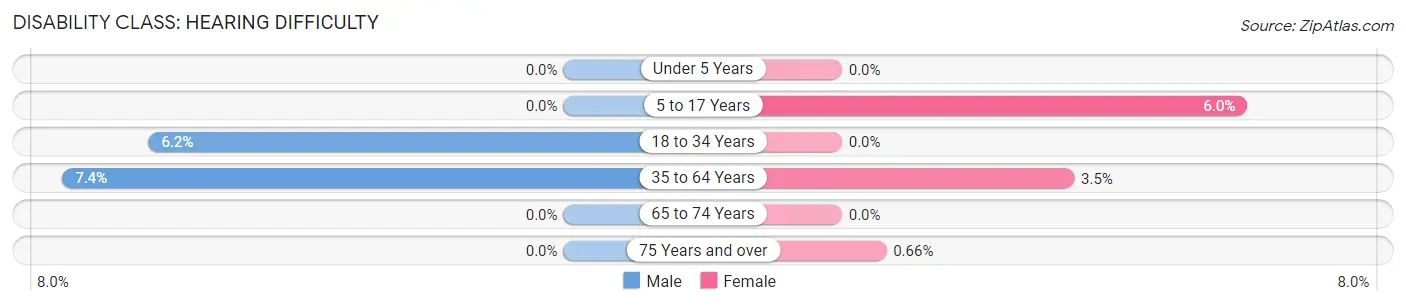
| Age Bracket | Male | Female |
| Under 5 Years | 0 (0.0%) | 0 (0.0%) |
| 5 to 17 Years | 0 (0.0%) | 24 (6.0%) |
| 18 to 34 Years | 18 (6.2%) | 0 (0.0%) |
| 35 to 64 Years | 79 (7.4%) | 34 (3.5%) |
| 65 to 74 Years | 0 (0.0%) | 0 (0.0%) |
| 75 Years and over | 0 (0.0%) | 1 (0.7%) |
Disability Class: Vision Difficulty
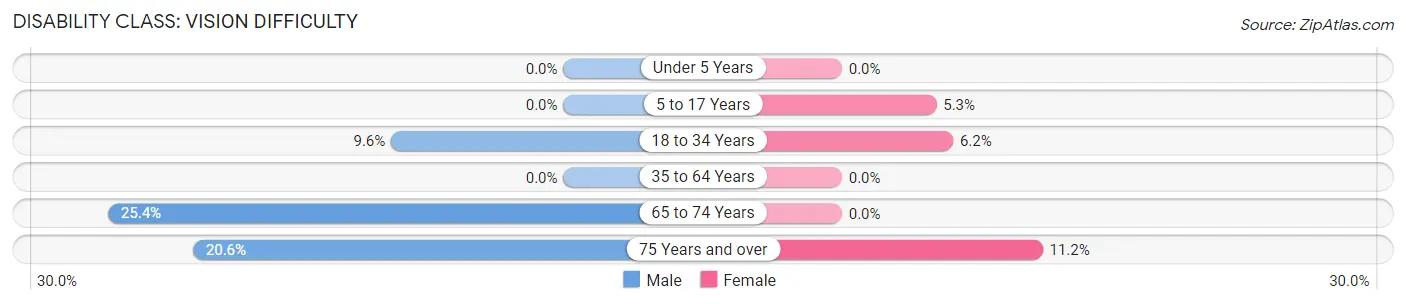
| Age Bracket | Male | Female |
| Under 5 Years | 0 (0.0%) | 0 (0.0%) |
| 5 to 17 Years | 0 (0.0%) | 21 (5.3%) |
| 18 to 34 Years | 28 (9.6%) | 33 (6.2%) |
| 35 to 64 Years | 0 (0.0%) | 0 (0.0%) |
| 65 to 74 Years | 53 (25.4%) | 0 (0.0%) |
| 75 Years and over | 13 (20.6%) | 17 (11.2%) |
Disability Class: Cognitive Difficulty
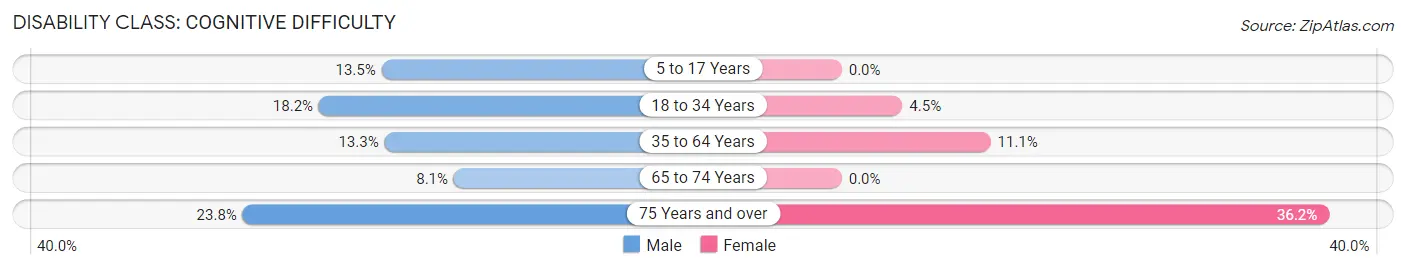
| Age Bracket | Male | Female |
| 5 to 17 Years | 49 (13.5%) | 0 (0.0%) |
| 18 to 34 Years | 53 (18.1%) | 24 (4.5%) |
| 35 to 64 Years | 141 (13.3%) | 109 (11.1%) |
| 65 to 74 Years | 17 (8.1%) | 0 (0.0%) |
| 75 Years and over | 15 (23.8%) | 55 (36.2%) |
Disability Class: Ambulatory Difficulty
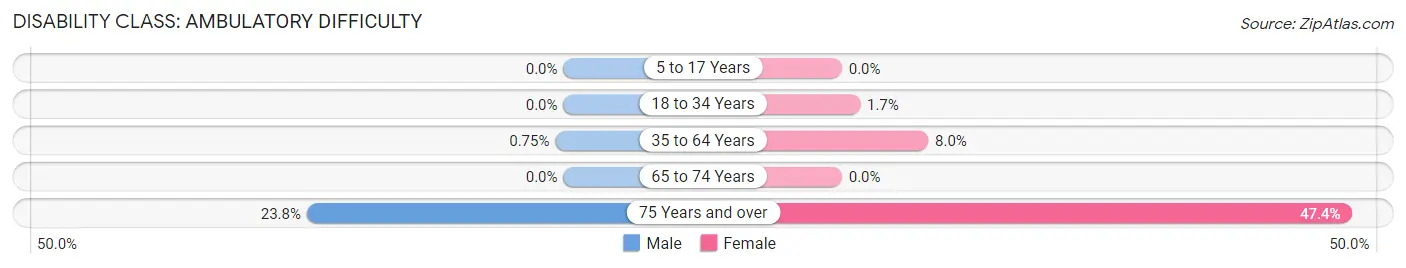
| Age Bracket | Male | Female |
| 5 to 17 Years | 0 (0.0%) | 0 (0.0%) |
| 18 to 34 Years | 0 (0.0%) | 9 (1.7%) |
| 35 to 64 Years | 8 (0.7%) | 79 (8.0%) |
| 65 to 74 Years | 0 (0.0%) | 0 (0.0%) |
| 75 Years and over | 15 (23.8%) | 72 (47.4%) |
Disability Class: Self-Care Difficulty
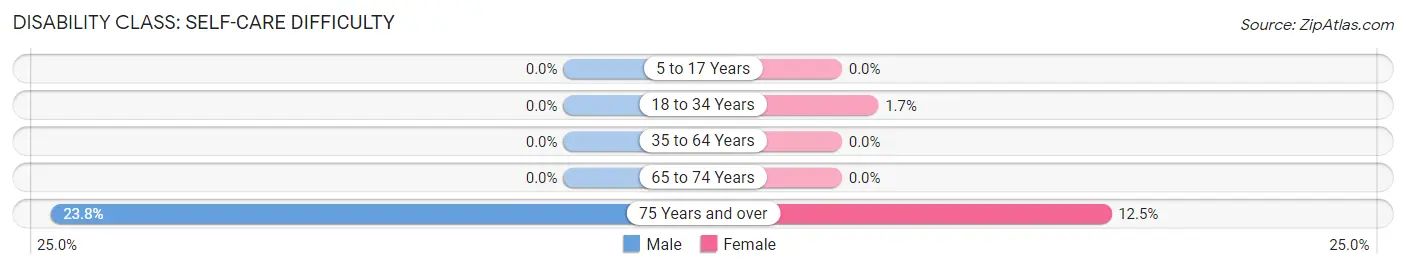
| Age Bracket | Male | Female |
| 5 to 17 Years | 0 (0.0%) | 0 (0.0%) |
| 18 to 34 Years | 0 (0.0%) | 9 (1.7%) |
| 35 to 64 Years | 0 (0.0%) | 0 (0.0%) |
| 65 to 74 Years | 0 (0.0%) | 0 (0.0%) |
| 75 Years and over | 15 (23.8%) | 19 (12.5%) |
Technology Access in Jessup borough
Computing Device Access in Jessup borough
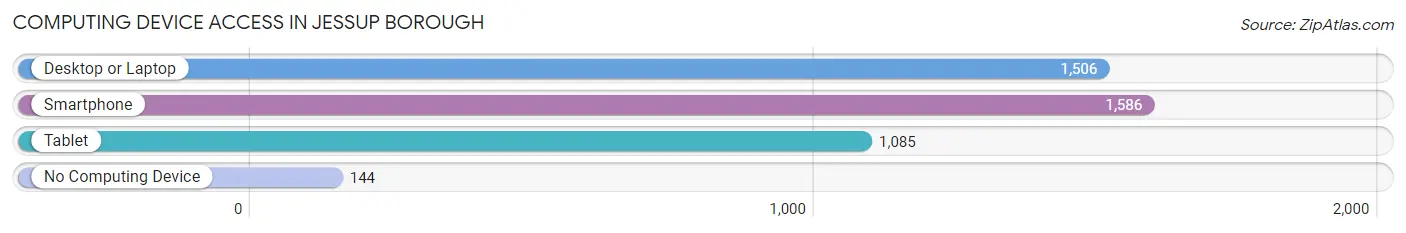
| Device Type | # Households | % Households |
| Desktop or Laptop | 1,506 | 78.6% |
| Smartphone | 1,586 | 82.8% |
| Tablet | 1,085 | 56.7% |
| No Computing Device | 144 | 7.5% |
| Total | 1,915 | 100.0% |
Internet Access in Jessup borough
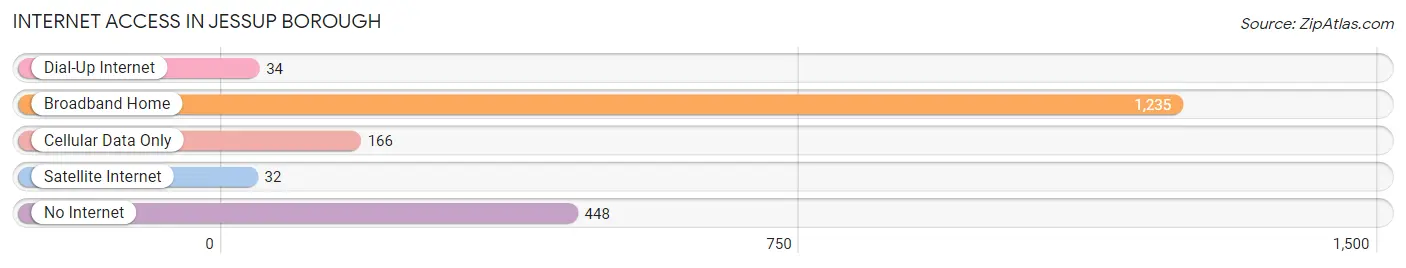
| Internet Type | # Households | % Households |
| Dial-Up Internet | 34 | 1.8% |
| Broadband Home | 1,235 | 64.5% |
| Cellular Data Only | 166 | 8.7% |
| Satellite Internet | 32 | 1.7% |
| No Internet | 448 | 23.4% |
| Total | 1,915 | 100.0% |
Jessup borough Summary
Jessup Borough is a small borough located in Lackawanna County, Pennsylvania. It is situated in the heart of the Pocono Mountains and is home to a population of approximately 2,500 people. The borough is bordered by the townships of Scott, Benton, and Covington.
History
Jessup Borough was founded in 1876 by a group of settlers from the nearby town of Carbondale. The settlers named the borough after their leader, John Jessup, who was a prominent figure in the area. The borough was officially incorporated in 1877.
In the late 19th century, Jessup Borough was a thriving industrial center. The borough was home to several coal mines, a brickyard, and a tannery. The coal mines provided employment for many of the borough’s residents. The tannery was the largest employer in the area and provided leather goods to the surrounding towns.
The borough’s economy began to decline in the early 20th century as the coal industry began to decline. The tannery closed in the 1920s and the brickyard closed in the 1930s. The borough’s population also began to decline as people moved away in search of better economic opportunities.
Geography
Jessup Borough is located in the heart of the Pocono Mountains. The borough is situated in the Lackawanna Valley and is bordered by the townships of Scott, Benton, and Covington. The borough is located approximately 20 miles from Scranton and is accessible via Interstate 81.
The borough is situated at an elevation of 1,400 feet and is surrounded by rolling hills and forests. The borough is home to several small streams and creeks, including the Lackawanna River. The borough is also home to several parks, including the Lackawanna State Park and the Jessup Borough Park.
Economy
The economy of Jessup Borough is largely based on tourism. The borough is home to several small businesses, including restaurants, shops, and hotels. The borough is also home to several small manufacturing companies.
The borough is also home to several educational institutions, including the University of Scranton and Lackawanna College. The borough is also home to several medical facilities, including the Geisinger Medical Center and the Moses Taylor Hospital.
Demographics
As of the 2010 census, the population of Jessup Borough was 2,521. The racial makeup of the borough was 97.3% White, 0.9% African American, 0.3% Native American, 0.3% Asian, 0.1% Pacific Islander, and 0.9% from other races. Hispanic or Latino of any race were 1.2% of the population.
The median household income in Jessup Borough was $41,944 and the median family income was $50,938. The per capita income for the borough was $20,945. About 8.3% of families and 10.2% of the population were below the poverty line, including 14.2% of those under age 18 and 6.2% of those age 65 or over.
Common Questions
What is Per Capita Income in Jessup borough?
Per Capita income in Jessup borough is $31,237.
What is the Median Family Income in Jessup borough?
Median Family Income in Jessup borough is $79,144.
What is the Median Household income in Jessup borough?
Median Household Income in Jessup borough is $58,869.
What is Income or Wage Gap in Jessup borough?
Income or Wage Gap in Jessup borough is 55.8%.
Women in Jessup borough earn 44.2 cents for every dollar earned by a man.
What is Inequality or Gini Index in Jessup borough?
Inequality or Gini Index in Jessup borough is 0.39.
What is the Total Population of Jessup borough?
Total Population of Jessup borough is 4,510.
What is the Total Male Population of Jessup borough?
Total Male Population of Jessup borough is 2,144.
What is the Total Female Population of Jessup borough?
Total Female Population of Jessup borough is 2,366.
What is the Ratio of Males per 100 Females in Jessup borough?
There are 90.62 Males per 100 Females in Jessup borough.
What is the Ratio of Females per 100 Males in Jessup borough?
There are 110.35 Females per 100 Males in Jessup borough.
What is the Median Population Age in Jessup borough?
Median Population Age in Jessup borough is 44.9 Years.
What is the Average Family Size in Jessup borough
Average Family Size in Jessup borough is 2.9 People.
What is the Average Household Size in Jessup borough
Average Household Size in Jessup borough is 2.4 People.
How Large is the Labor Force in Jessup borough?
There are 1,960 People in the Labor Forcein in Jessup borough.
What is the Percentage of People in the Labor Force in Jessup borough?
53.9% of People are in the Labor Force in Jessup borough.
What is the Unemployment Rate in Jessup borough?
Unemployment Rate in Jessup borough is 2.7%.