Fredonia borough, PA Map & Demographics
Fredonia borough Overview
$30,238
PER CAPITA INCOME
$83,750
AVG FAMILY INCOME
$47,292
AVG HOUSEHOLD INCOME
11.9%
WAGE / INCOME GAP [ % ]
88.1¢/ $1
WAGE / INCOME GAP [ $ ]
0.36
INEQUALITY / GINI INDEX
368
TOTAL POPULATION
195
MALE POPULATION
173
FEMALE POPULATION
112.72
MALES / 100 FEMALES
88.72
FEMALES / 100 MALES
51.7
MEDIAN AGE
2.7
AVG FAMILY SIZE
2.0
AVG HOUSEHOLD SIZE
194
LABOR FORCE [ PEOPLE ]
62.2%
PERCENT IN LABOR FORCE
Income in Fredonia borough
Income Overview in Fredonia borough
Per Capita Income in Fredonia borough is $30,238, while median incomes of families and households are $83,750 and $47,292 respectively.
| Characteristic | Number | Measure |
| Per Capita Income | 368 | $30,238 |
| Median Family Income | 98 | $83,750 |
| Mean Family Income | 98 | $74,618 |
| Median Household Income | 184 | $47,292 |
| Mean Household Income | 184 | $59,770 |
| Income Deficit | 98 | $0 |
| Wage / Income Gap (%) | 368 | 11.91% |
| Wage / Income Gap ($) | 368 | 88.09¢ per $1 |
| Gini / Inequality Index | 368 | 0.36 |
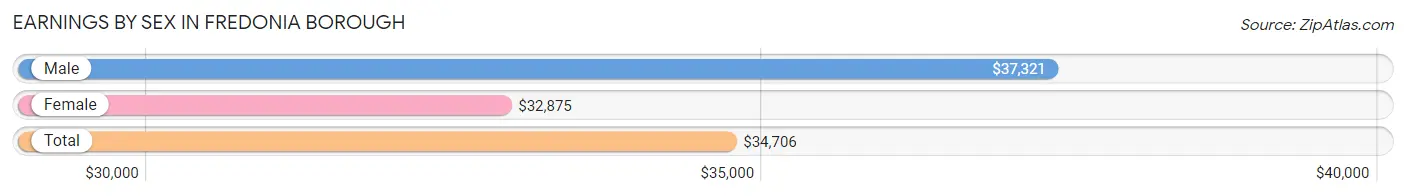
Earnings by Sex in Fredonia borough
Average Earnings in Fredonia borough are $34,706, $37,321 for men and $32,875 for women, a difference of 11.9%.
| Sex | Number | Average Earnings |
| Male | 111 (54.4%) | $37,321 |
| Female | 93 (45.6%) | $32,875 |
| Total | 204 (100.0%) | $34,706 |
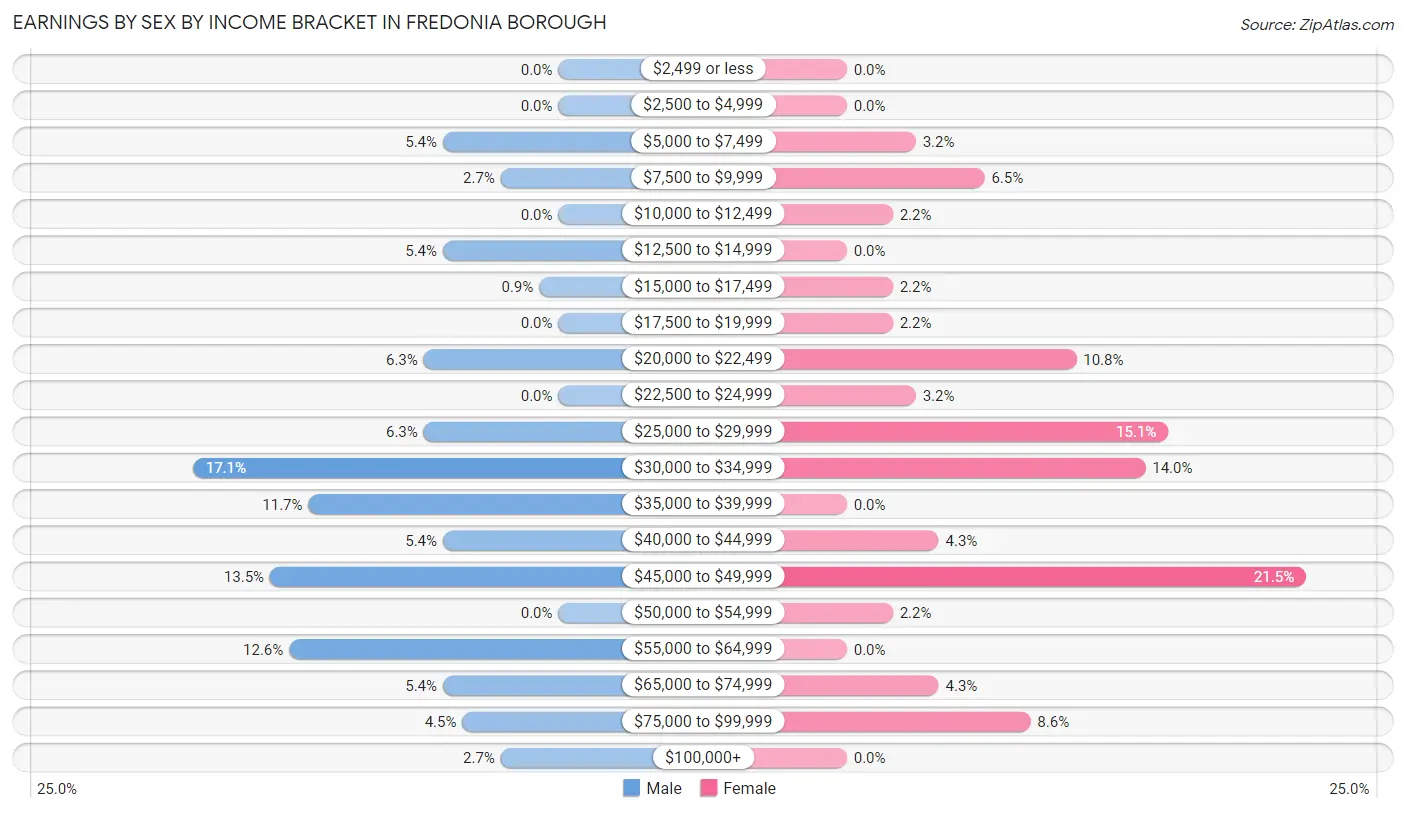
Earnings by Sex by Income Bracket in Fredonia borough
The most common earnings brackets in Fredonia borough are $30,000 to $34,999 for men (19 | 17.1%) and $45,000 to $49,999 for women (20 | 21.5%).
| Income | Male | Female |
| $2,499 or less | 0 (0.0%) | 0 (0.0%) |
| $2,500 to $4,999 | 0 (0.0%) | 0 (0.0%) |
| $5,000 to $7,499 | 6 (5.4%) | 3 (3.2%) |
| $7,500 to $9,999 | 3 (2.7%) | 6 (6.5%) |
| $10,000 to $12,499 | 0 (0.0%) | 2 (2.1%) |
| $12,500 to $14,999 | 6 (5.4%) | 0 (0.0%) |
| $15,000 to $17,499 | 1 (0.9%) | 2 (2.1%) |
| $17,500 to $19,999 | 0 (0.0%) | 2 (2.1%) |
| $20,000 to $22,499 | 7 (6.3%) | 10 (10.7%) |
| $22,500 to $24,999 | 0 (0.0%) | 3 (3.2%) |
| $25,000 to $29,999 | 7 (6.3%) | 14 (15.0%) |
| $30,000 to $34,999 | 19 (17.1%) | 13 (14.0%) |
| $35,000 to $39,999 | 13 (11.7%) | 0 (0.0%) |
| $40,000 to $44,999 | 6 (5.4%) | 4 (4.3%) |
| $45,000 to $49,999 | 15 (13.5%) | 20 (21.5%) |
| $50,000 to $54,999 | 0 (0.0%) | 2 (2.1%) |
| $55,000 to $64,999 | 14 (12.6%) | 0 (0.0%) |
| $65,000 to $74,999 | 6 (5.4%) | 4 (4.3%) |
| $75,000 to $99,999 | 5 (4.5%) | 8 (8.6%) |
| $100,000+ | 3 (2.7%) | 0 (0.0%) |
| Total | 111 (100.0%) | 93 (100.0%) |
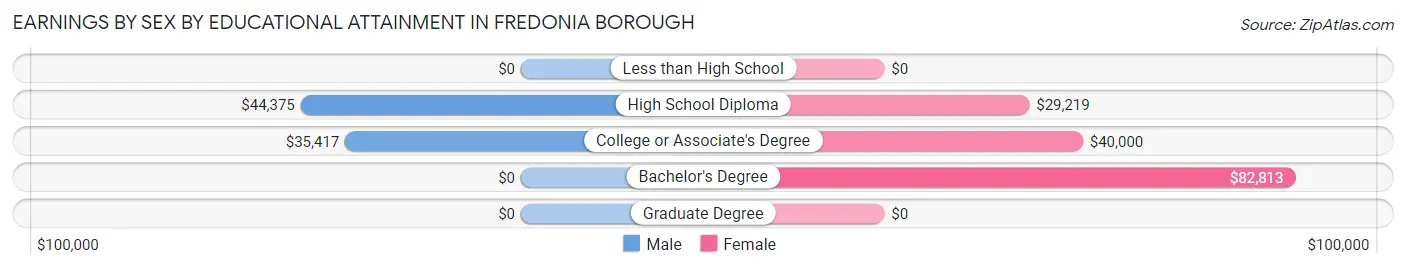
Earnings by Sex by Educational Attainment in Fredonia borough
Average earnings in Fredonia borough are $37,321 for men and $33,625 for women, a difference of 9.9%. Men with an educational attainment of high school diploma enjoy the highest average annual earnings of $44,375, while those with college or associate's degree education earn the least with $35,417. Women with an educational attainment of bachelor's degree earn the most with the average annual earnings of $82,813, while those with high school diploma education have the smallest earnings of $29,219.
| Educational Attainment | Male Income | Female Income |
| Less than High School | - | - |
| High School Diploma | $44,375 | $29,219 |
| College or Associate's Degree | $35,417 | $40,000 |
| Bachelor's Degree | - | - |
| Graduate Degree | - | - |
| Total | $37,321 | $33,625 |
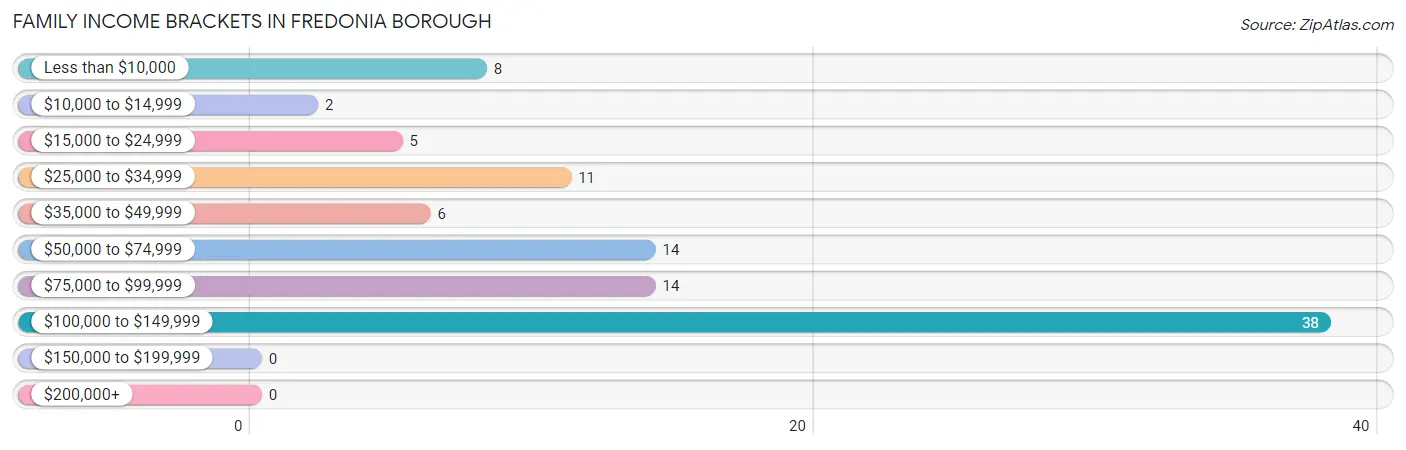
Family Income in Fredonia borough
Family Income Brackets in Fredonia borough
According to the Fredonia borough family income data, there are 38 families falling into the $100,000 to $149,999 income range, which is the most common income bracket and makes up 38.8% of all families.
| Income Bracket | # Families | % Families |
| Less than $10,000 | 8 | 8.2% |
| $10,000 to $14,999 | 2 | 2.0% |
| $15,000 to $24,999 | 5 | 5.1% |
| $25,000 to $34,999 | 11 | 11.2% |
| $35,000 to $49,999 | 6 | 6.1% |
| $50,000 to $74,999 | 14 | 14.3% |
| $75,000 to $99,999 | 14 | 14.3% |
| $100,000 to $149,999 | 38 | 38.8% |
| $150,000 to $199,999 | 0 | 0.0% |
| $200,000+ | 0 | 0.0% |
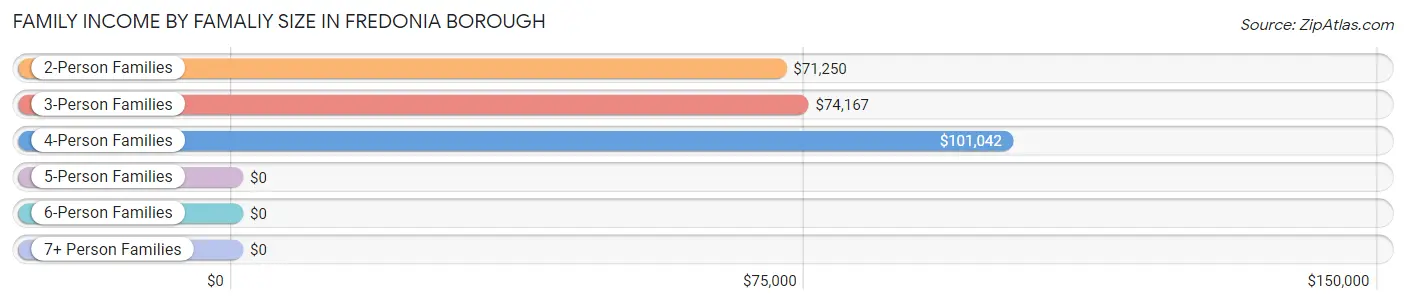
Family Income by Famaliy Size in Fredonia borough
4-person families (11 | 11.2%) account for the highest median family income in Fredonia borough with $101,042 per family, while 2-person families (59 | 60.2%) have the highest median income of $35,625 per family member.
| Income Bracket | # Families | Median Income |
| 2-Person Families | 59 (60.2%) | $71,250 |
| 3-Person Families | 24 (24.5%) | $74,167 |
| 4-Person Families | 11 (11.2%) | $101,042 |
| 5-Person Families | 4 (4.1%) | $0 |
| 6-Person Families | 0 (0.0%) | $0 |
| 7+ Person Families | 0 (0.0%) | $0 |
| Total | 98 (100.0%) | $83,750 |
Family Income by Number of Earners in Fredonia borough
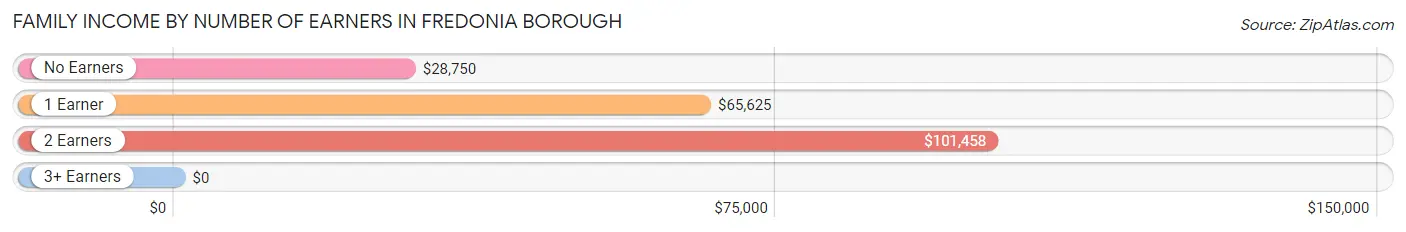
| Number of Earners | # Families | Median Income |
| No Earners | 27 (27.6%) | $28,750 |
| 1 Earner | 22 (22.5%) | $65,625 |
| 2 Earners | 46 (46.9%) | $101,458 |
| 3+ Earners | 3 (3.1%) | $0 |
| Total | 98 (100.0%) | $83,750 |
Household Income in Fredonia borough
Household Income Brackets in Fredonia borough
With 41 households falling in the category, the $25,000 to $34,999 income range is the most frequent in Fredonia borough, accounting for 22.3% of all households.
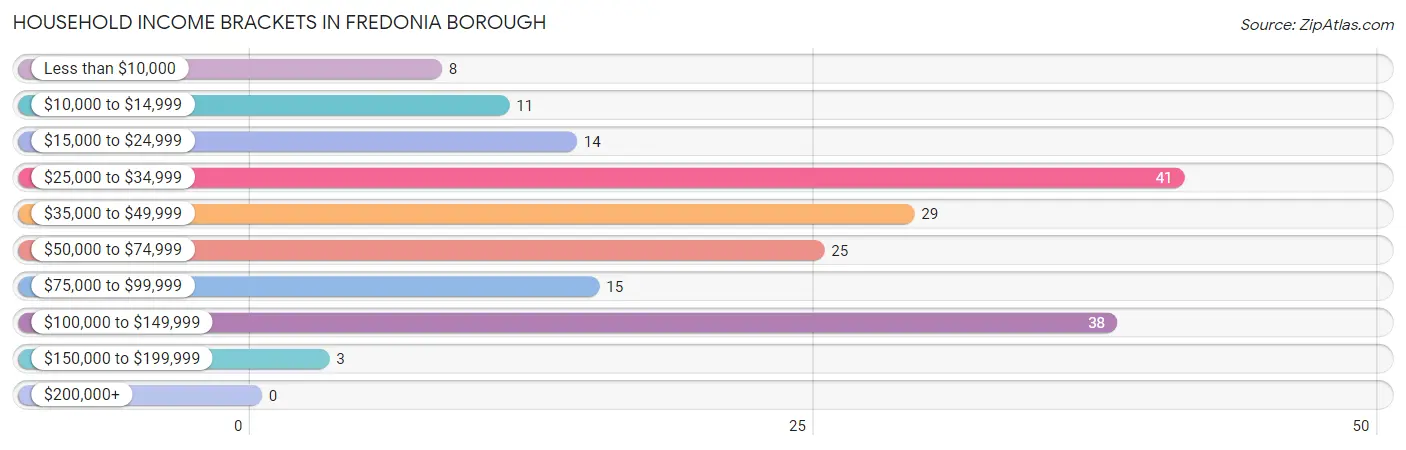
| Income Bracket | # Households | % Households |
| Less than $10,000 | 8 | 4.3% |
| $10,000 to $14,999 | 11 | 6.0% |
| $15,000 to $24,999 | 14 | 7.6% |
| $25,000 to $34,999 | 41 | 22.3% |
| $35,000 to $49,999 | 29 | 15.8% |
| $50,000 to $74,999 | 25 | 13.6% |
| $75,000 to $99,999 | 15 | 8.2% |
| $100,000 to $149,999 | 38 | 20.7% |
| $150,000 to $199,999 | 3 | 1.6% |
| $200,000+ | 0 | 0.0% |
Household Income by Householder Age in Fredonia borough
The median household income in Fredonia borough is $47,292, with the highest median household income of $70,833 found in the 65+ years age bracket for the primary householder. A total of 48 households (26.1%) fall into this category.
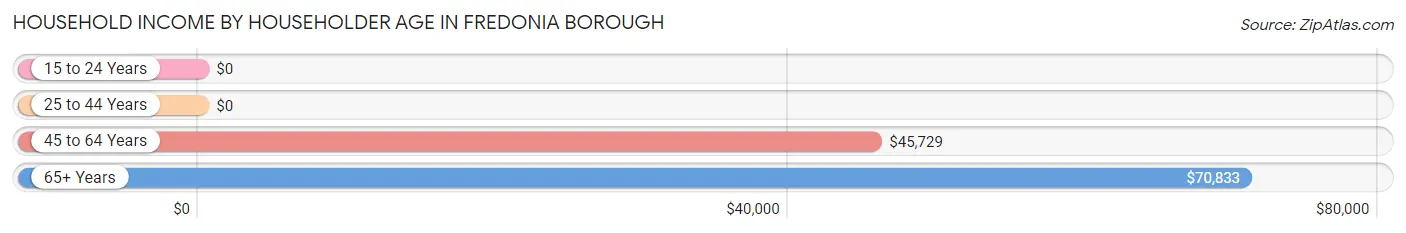
| Income Bracket | # Households | Median Income |
| 15 to 24 Years | 0 (0.0%) | $0 |
| 25 to 44 Years | 55 (29.9%) | $0 |
| 45 to 64 Years | 81 (44.0%) | $45,729 |
| 65+ Years | 48 (26.1%) | $70,833 |
| Total | 184 (100.0%) | $47,292 |
Poverty in Fredonia borough
Income Below Poverty by Sex and Age in Fredonia borough
With 11.3% poverty level for males and 14.4% for females among the residents of Fredonia borough, 6 to 11 year old males and under 5 year old females are the most vulnerable to poverty, with 5 males (71.4%) and 2 females (100.0%) in their respective age groups living below the poverty level.
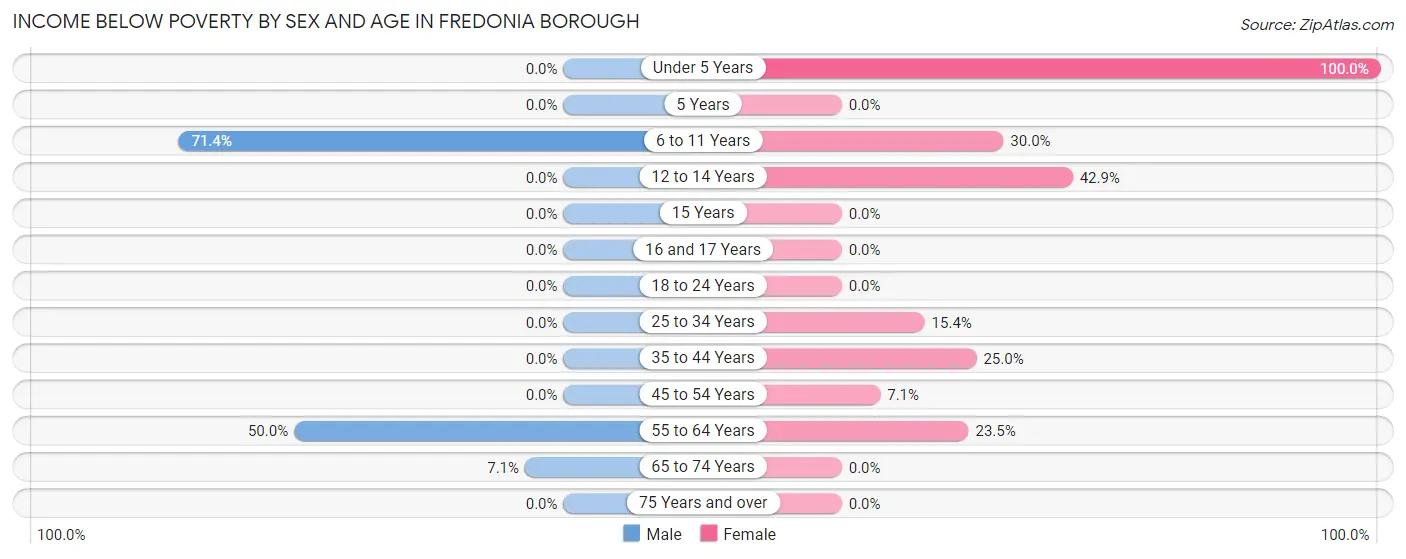
| Age Bracket | Male | Female |
| Under 5 Years | 0 (0.0%) | 2 (100.0%) |
| 5 Years | 0 (0.0%) | 0 (0.0%) |
| 6 to 11 Years | 5 (71.4%) | 3 (30.0%) |
| 12 to 14 Years | 0 (0.0%) | 3 (42.9%) |
| 15 Years | 0 (0.0%) | 0 (0.0%) |
| 16 and 17 Years | 0 (0.0%) | 0 (0.0%) |
| 18 to 24 Years | 0 (0.0%) | 0 (0.0%) |
| 25 to 34 Years | 0 (0.0%) | 4 (15.4%) |
| 35 to 44 Years | 0 (0.0%) | 3 (25.0%) |
| 45 to 54 Years | 0 (0.0%) | 2 (7.1%) |
| 55 to 64 Years | 15 (50.0%) | 8 (23.5%) |
| 65 to 74 Years | 2 (7.1%) | 0 (0.0%) |
| 75 Years and over | 0 (0.0%) | 0 (0.0%) |
| Total | 22 (11.3%) | 25 (14.4%) |
Income Above Poverty by Sex and Age in Fredonia borough
According to the poverty statistics in Fredonia borough, males aged under 5 years and females aged 5 years are the age groups that are most secure financially, with 100.0% of males and 100.0% of females in these age groups living above the poverty line.
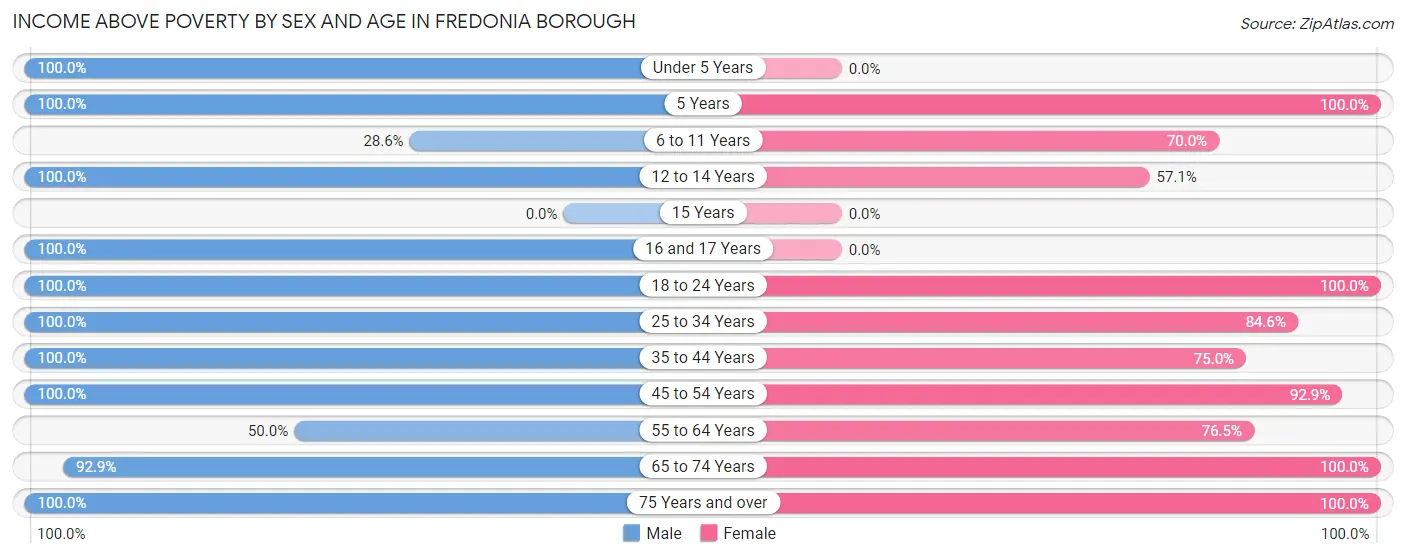
| Age Bracket | Male | Female |
| Under 5 Years | 7 (100.0%) | 0 (0.0%) |
| 5 Years | 10 (100.0%) | 2 (100.0%) |
| 6 to 11 Years | 2 (28.6%) | 7 (70.0%) |
| 12 to 14 Years | 11 (100.0%) | 4 (57.1%) |
| 15 Years | 0 (0.0%) | 0 (0.0%) |
| 16 and 17 Years | 3 (100.0%) | 0 (0.0%) |
| 18 to 24 Years | 7 (100.0%) | 8 (100.0%) |
| 25 to 34 Years | 16 (100.0%) | 22 (84.6%) |
| 35 to 44 Years | 26 (100.0%) | 9 (75.0%) |
| 45 to 54 Years | 40 (100.0%) | 26 (92.9%) |
| 55 to 64 Years | 15 (50.0%) | 26 (76.5%) |
| 65 to 74 Years | 26 (92.9%) | 29 (100.0%) |
| 75 Years and over | 10 (100.0%) | 15 (100.0%) |
| Total | 173 (88.7%) | 148 (85.6%) |
Income Below Poverty Among Married-Couple Families in Fredonia borough
The poverty statistics for married-couple families in Fredonia borough show that 2.8% or 2 of the total 71 families live below the poverty line. Families with no children have the highest poverty rate of 3.8%, comprising of 2 families. On the other hand, families with 1 or 2 children have the lowest poverty rate of 0.0%, which includes 0 families.
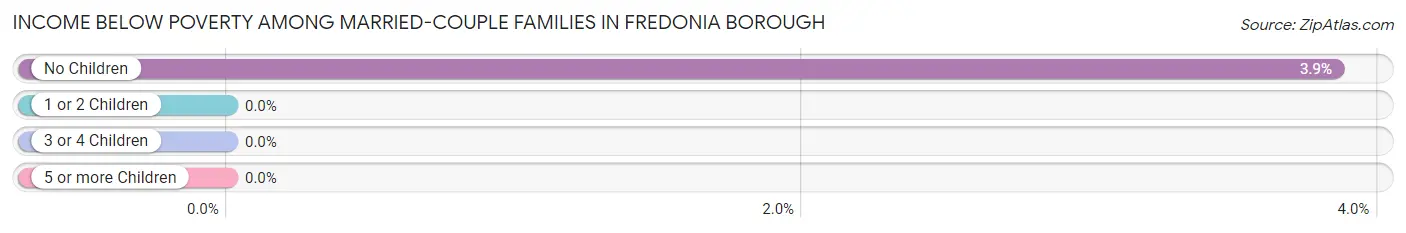
| Children | Above Poverty | Below Poverty |
| No Children | 50 (96.2%) | 2 (3.8%) |
| 1 or 2 Children | 16 (100.0%) | 0 (0.0%) |
| 3 or 4 Children | 3 (100.0%) | 0 (0.0%) |
| 5 or more Children | 0 (0.0%) | 0 (0.0%) |
| Total | 69 (97.2%) | 2 (2.8%) |
Income Below Poverty Among Single-Parent Households in Fredonia borough
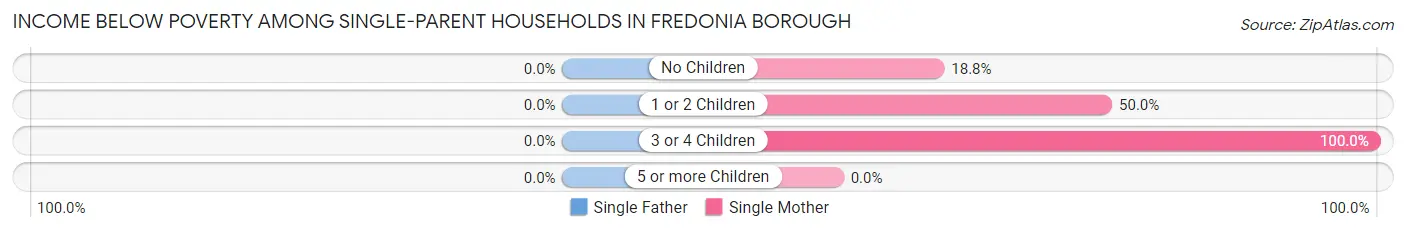
| Children | Single Father | Single Mother |
| No Children | 0 (0.0%) | 3 (18.8%) |
| 1 or 2 Children | 0 (0.0%) | 5 (50.0%) |
| 3 or 4 Children | 0 (0.0%) | 1 (100.0%) |
| 5 or more Children | 0 (0.0%) | 0 (0.0%) |
| Total | 0 (0.0%) | 9 (33.3%) |
Income Below Poverty Among Married-Couple vs Single-Parent Households in Fredonia borough
The poverty data for Fredonia borough shows that 2 of the married-couple family households (2.8%) and 9 of the single-parent households (33.3%) are living below the poverty level. Within the married-couple family households, those with no children have the highest poverty rate, with 2 households (3.8%) falling below the poverty line. Among the single-parent households, those with 3 or 4 children have the highest poverty rate, with 1 household (100.0%) living below poverty.
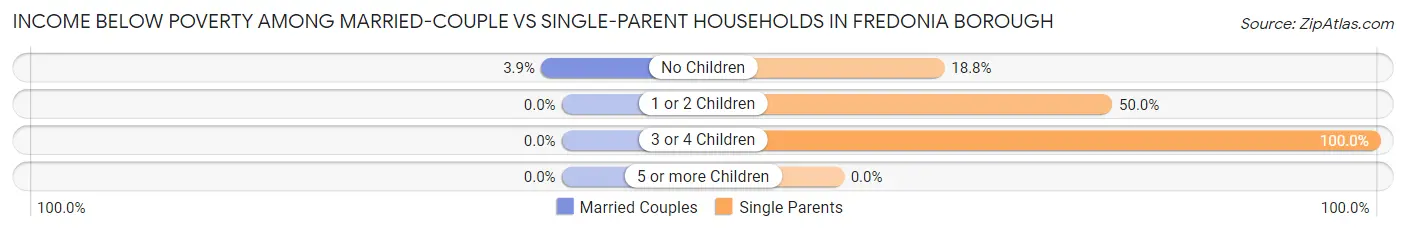
| Children | Married-Couple Families | Single-Parent Households |
| No Children | 2 (3.8%) | 3 (18.8%) |
| 1 or 2 Children | 0 (0.0%) | 5 (50.0%) |
| 3 or 4 Children | 0 (0.0%) | 1 (100.0%) |
| 5 or more Children | 0 (0.0%) | 0 (0.0%) |
| Total | 2 (2.8%) | 9 (33.3%) |
Race in Fredonia borough
The most populous races in Fredonia borough are White / Caucasian (351 | 95.4%), Two or more Races (17 | 4.6%), and Hispanic or Latino (12 | 3.3%).
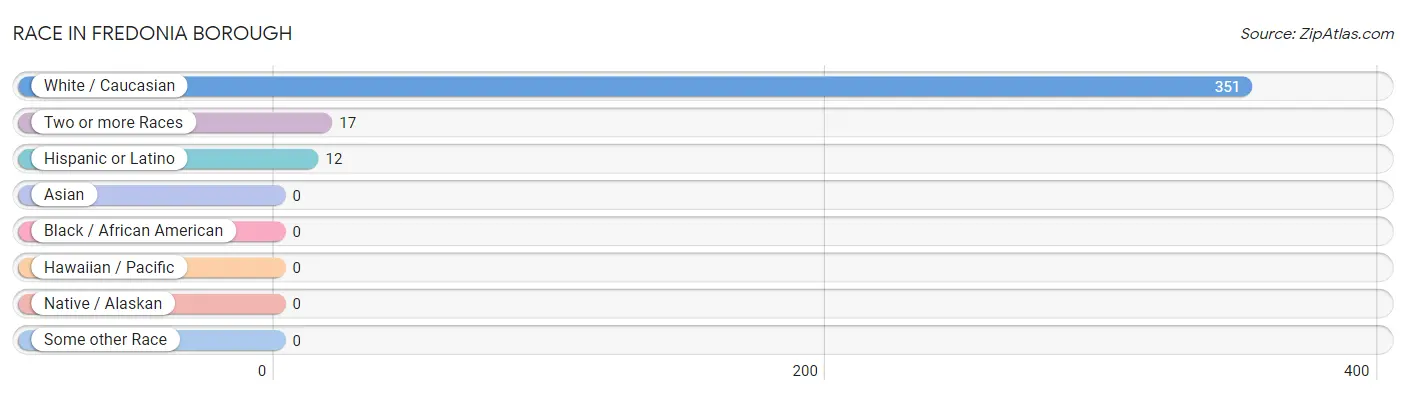
| Race | # Population | % Population |
| Asian | 0 | 0.0% |
| Black / African American | 0 | 0.0% |
| Hawaiian / Pacific | 0 | 0.0% |
| Hispanic or Latino | 12 | 3.3% |
| Native / Alaskan | 0 | 0.0% |
| White / Caucasian | 351 | 95.4% |
| Two or more Races | 17 | 4.6% |
| Some other Race | 0 | 0.0% |
| Total | 368 | 100.0% |
Ancestry in Fredonia borough
The most populous ancestries reported in Fredonia borough are German (105 | 28.5%), Irish (58 | 15.8%), English (45 | 12.2%), Scottish (19 | 5.2%), and American (18 | 4.9%), together accounting for 66.6% of all Fredonia borough residents.
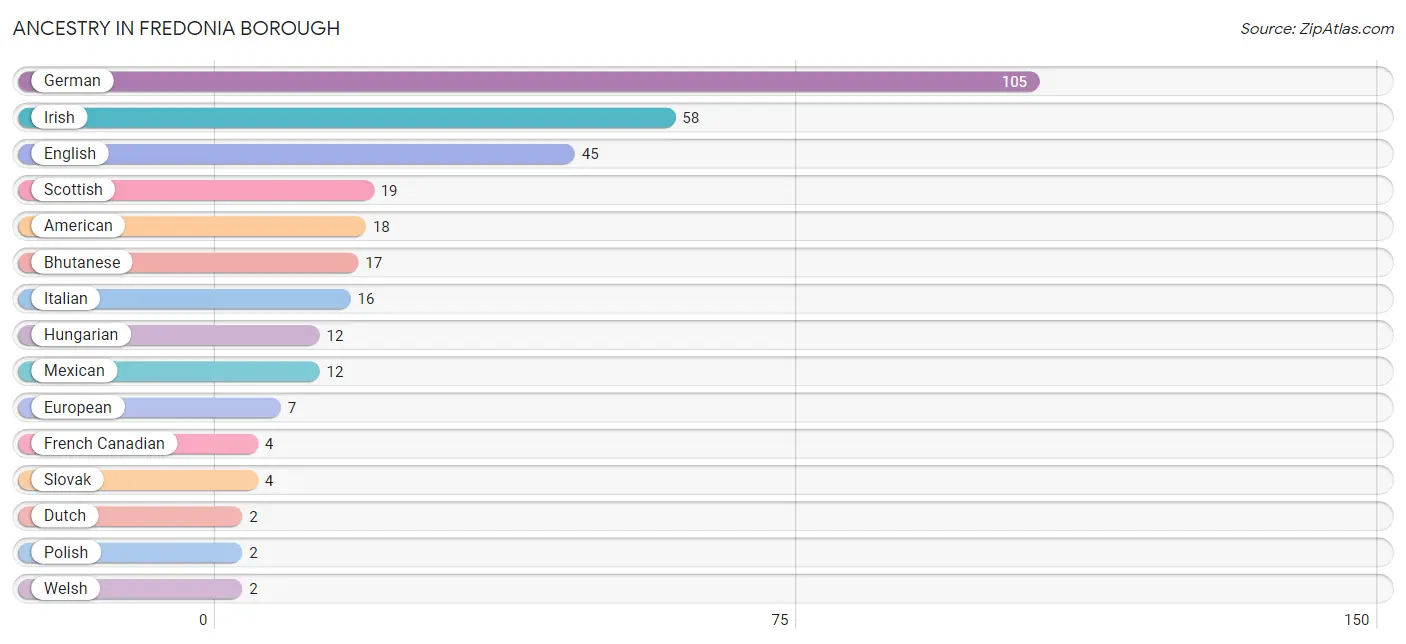
| Ancestry | # Population | % Population |
| American | 18 | 4.9% |
| Bhutanese | 17 | 4.6% |
| Dutch | 2 | 0.5% |
| English | 45 | 12.2% |
| European | 7 | 1.9% |
| French Canadian | 4 | 1.1% |
| German | 105 | 28.5% |
| Hungarian | 12 | 3.3% |
| Irish | 58 | 15.8% |
| Italian | 16 | 4.3% |
| Mexican | 12 | 3.3% |
| Polish | 2 | 0.5% |
| Scottish | 19 | 5.2% |
| Slovak | 4 | 1.1% |
| Welsh | 2 | 0.5% | View All 15 Rows |
Immigrants in Fredonia borough
The most numerous immigrant groups reported in Fredonia borough came from Asia (8 | 2.2%), Eastern Asia (8 | 2.2%), and Japan (8 | 2.2%), together accounting for 6.5% of all Fredonia borough residents.
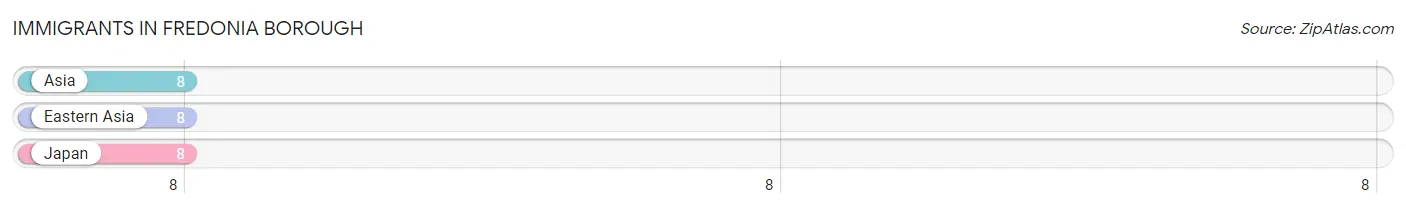
| Immigration Origin | # Population | % Population |
| Asia | 8 | 2.2% |
| Eastern Asia | 8 | 2.2% |
| Japan | 8 | 2.2% | View All 3 Rows |
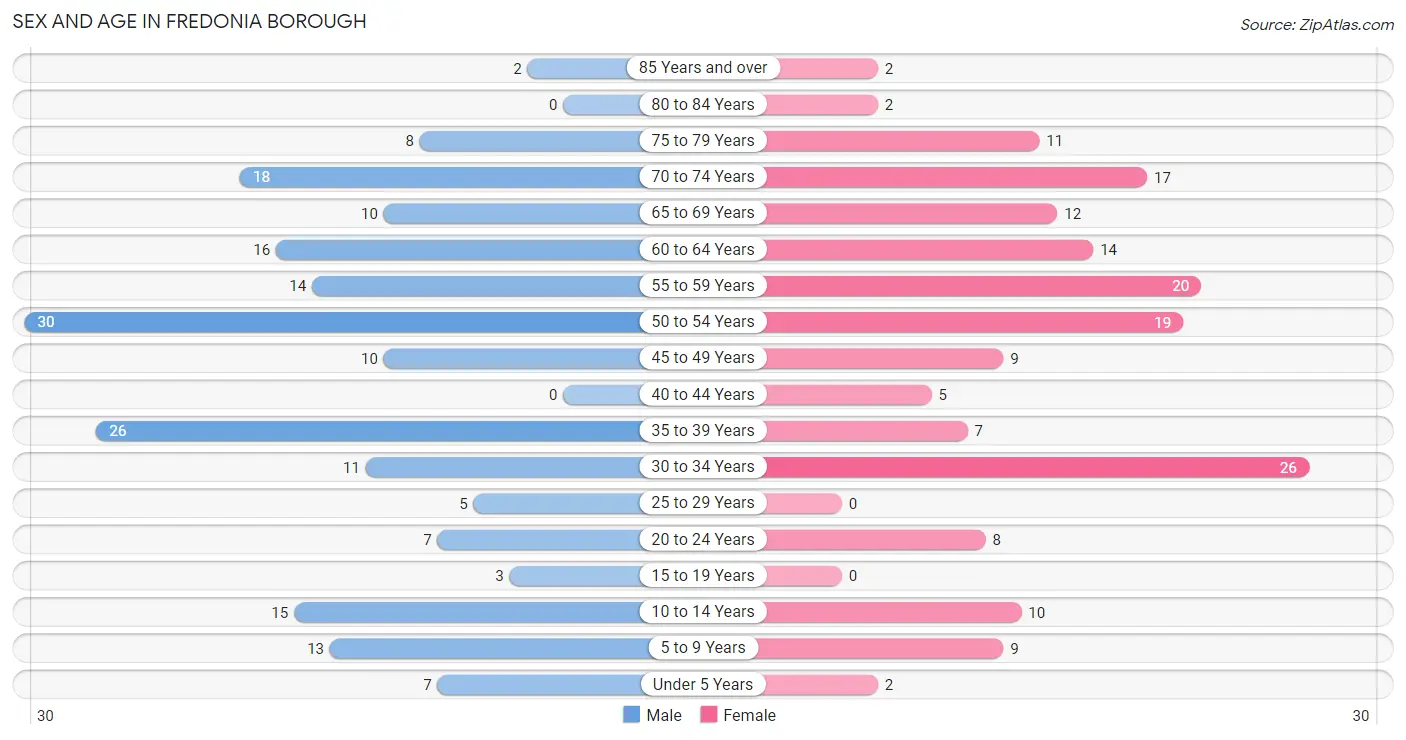
Sex and Age in Fredonia borough
Sex and Age in Fredonia borough
The most populous age groups in Fredonia borough are 50 to 54 Years (30 | 15.4%) for men and 30 to 34 Years (26 | 15.0%) for women.
| Age Bracket | Male | Female |
| Under 5 Years | 7 (3.6%) | 2 (1.2%) |
| 5 to 9 Years | 13 (6.7%) | 9 (5.2%) |
| 10 to 14 Years | 15 (7.7%) | 10 (5.8%) |
| 15 to 19 Years | 3 (1.5%) | 0 (0.0%) |
| 20 to 24 Years | 7 (3.6%) | 8 (4.6%) |
| 25 to 29 Years | 5 (2.6%) | 0 (0.0%) |
| 30 to 34 Years | 11 (5.6%) | 26 (15.0%) |
| 35 to 39 Years | 26 (13.3%) | 7 (4.1%) |
| 40 to 44 Years | 0 (0.0%) | 5 (2.9%) |
| 45 to 49 Years | 10 (5.1%) | 9 (5.2%) |
| 50 to 54 Years | 30 (15.4%) | 19 (11.0%) |
| 55 to 59 Years | 14 (7.2%) | 20 (11.6%) |
| 60 to 64 Years | 16 (8.2%) | 14 (8.1%) |
| 65 to 69 Years | 10 (5.1%) | 12 (6.9%) |
| 70 to 74 Years | 18 (9.2%) | 17 (9.8%) |
| 75 to 79 Years | 8 (4.1%) | 11 (6.4%) |
| 80 to 84 Years | 0 (0.0%) | 2 (1.2%) |
| 85 Years and over | 2 (1.0%) | 2 (1.2%) |
| Total | 195 (100.0%) | 173 (100.0%) |
Families and Households in Fredonia borough
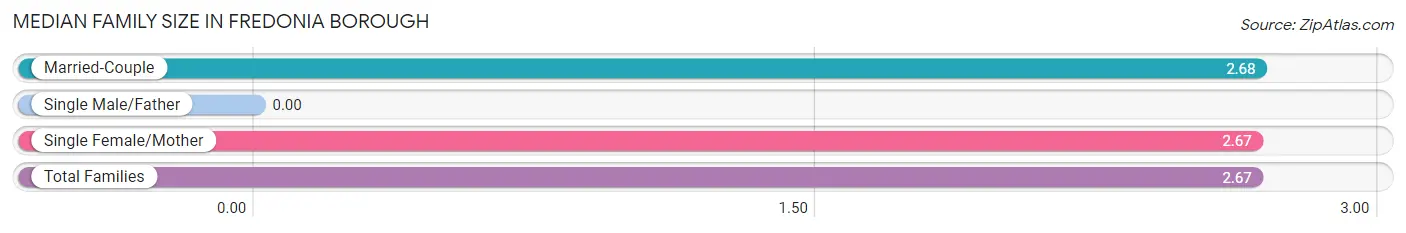
Median Family Size in Fredonia borough
| Family Type | # Families | Family Size |
| Married-Couple | 71 (72.5%) | 2.68 |
| Single Male/Father | 0 (0.0%) | - |
| Single Female/Mother | 27 (27.6%) | 2.67 |
| Total Families | 98 (100.0%) | 2.67 |
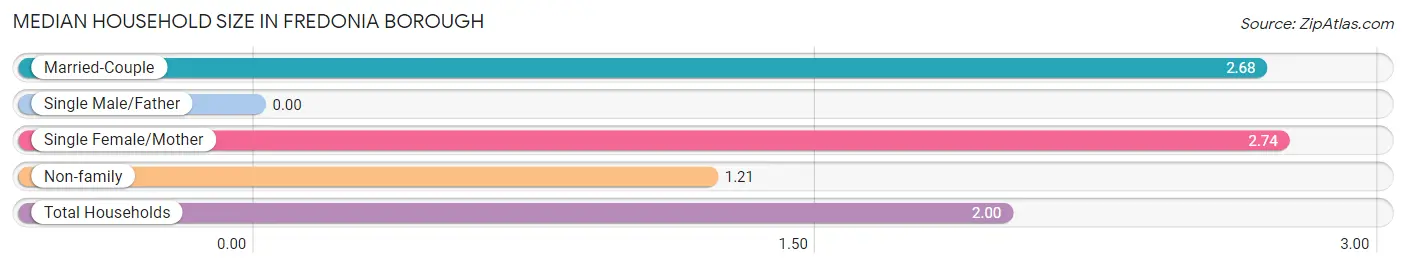
Median Household Size in Fredonia borough
| Household Type | # Households | Household Size |
| Married-Couple | 71 (38.6%) | 2.68 |
| Single Male/Father | 0 (0.0%) | - |
| Single Female/Mother | 27 (14.7%) | 2.74 |
| Non-family | 86 (46.7%) | 1.21 |
| Total Households | 184 (100.0%) | 2.00 |
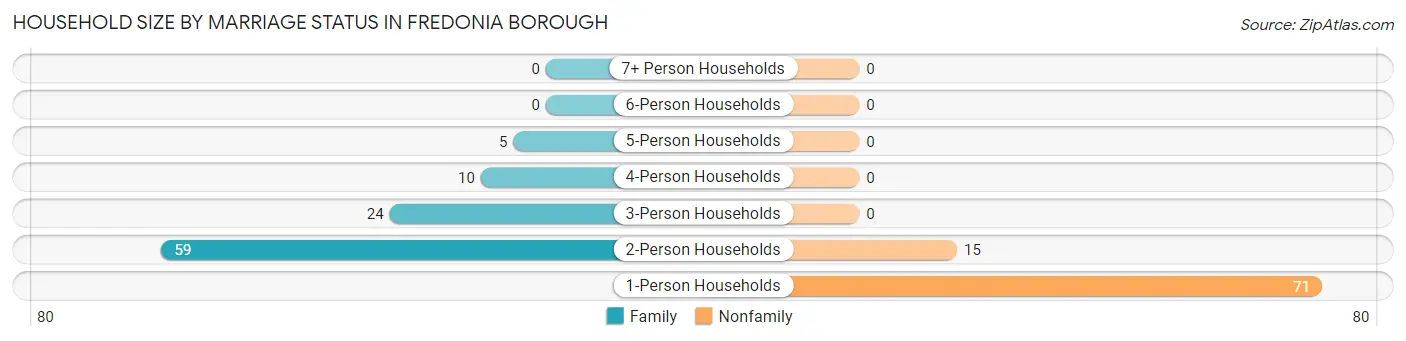
Household Size by Marriage Status in Fredonia borough
Out of a total of 184 households in Fredonia borough, 98 (53.3%) are family households, while 86 (46.7%) are nonfamily households. The most numerous type of family households are 2-person households, comprising 59, and the most common type of nonfamily households are 1-person households, comprising 71.
| Household Size | Family Households | Nonfamily Households |
| 1-Person Households | - | 71 (38.6%) |
| 2-Person Households | 59 (32.1%) | 15 (8.2%) |
| 3-Person Households | 24 (13.0%) | 0 (0.0%) |
| 4-Person Households | 10 (5.4%) | 0 (0.0%) |
| 5-Person Households | 5 (2.7%) | 0 (0.0%) |
| 6-Person Households | 0 (0.0%) | 0 (0.0%) |
| 7+ Person Households | 0 (0.0%) | 0 (0.0%) |
| Total | 98 (53.3%) | 86 (46.7%) |
Female Fertility in Fredonia borough
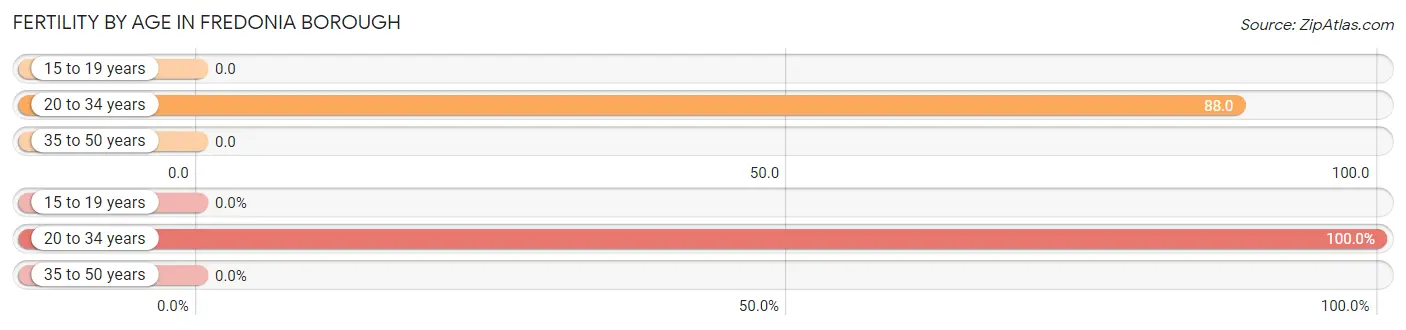
Fertility by Age in Fredonia borough
Average fertility rate in Fredonia borough is 49.0 births per 1,000 women. Women in the age bracket of 20 to 34 years have the highest fertility rate with 88.0 births per 1,000 women. Women in the age bracket of 20 to 34 years acount for 100.0% of all women with births.
| Age Bracket | Women with Births | Births / 1,000 Women |
| 15 to 19 years | 0 (0.0%) | 0.0 |
| 20 to 34 years | 3 (100.0%) | 88.0 |
| 35 to 50 years | 0 (0.0%) | 0.0 |
| Total | 3 (100.0%) | 49.0 |
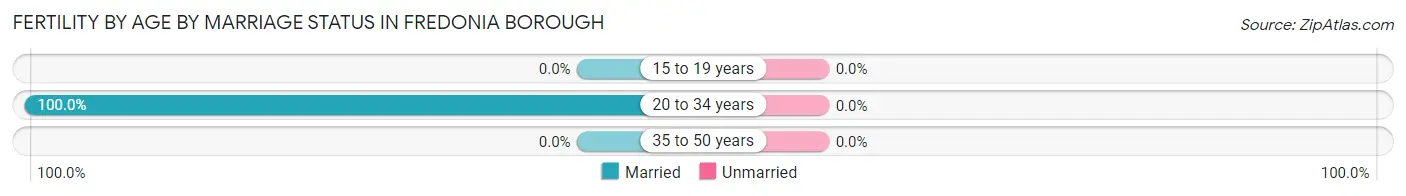
Fertility by Age by Marriage Status in Fredonia borough
| Age Bracket | Married | Unmarried |
| 15 to 19 years | 0 (0.0%) | 0 (0.0%) |
| 20 to 34 years | 3 (100.0%) | 0 (0.0%) |
| 35 to 50 years | 0 (0.0%) | 0 (0.0%) |
| Total | 3 (100.0%) | 0 (0.0%) |
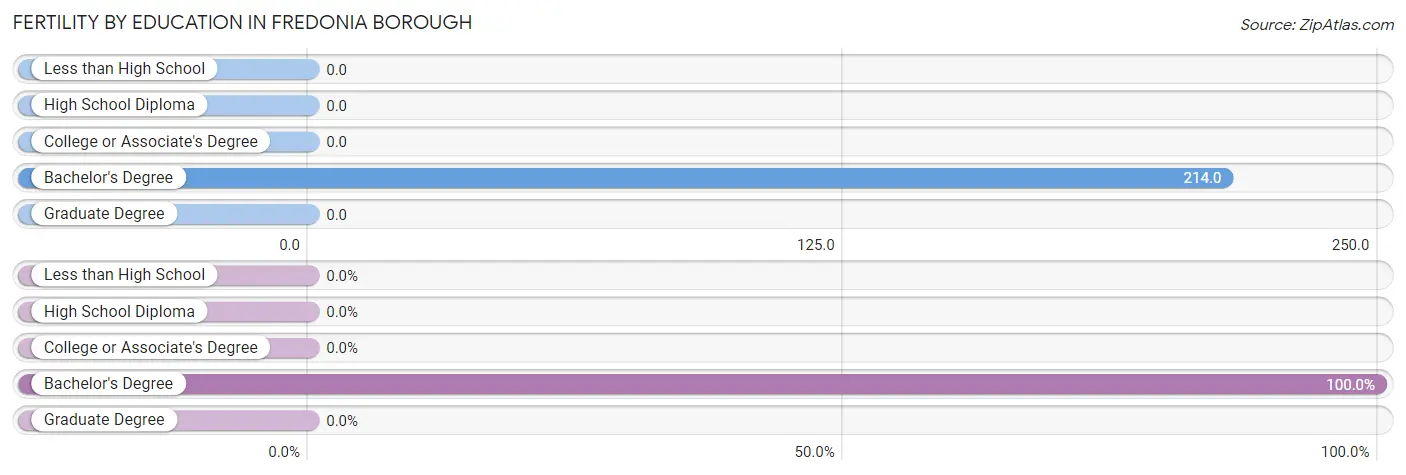
Fertility by Education in Fredonia borough
| Educational Attainment | Women with Births | Births / 1,000 Women |
| Less than High School | 0 (0.0%) | 0.0 |
| High School Diploma | 0 (0.0%) | 0.0 |
| College or Associate's Degree | 0 (0.0%) | 0.0 |
| Bachelor's Degree | 3 (100.0%) | 214.0 |
| Graduate Degree | 0 (0.0%) | 0.0 |
| Total | 3 (100.0%) | 49.0 |
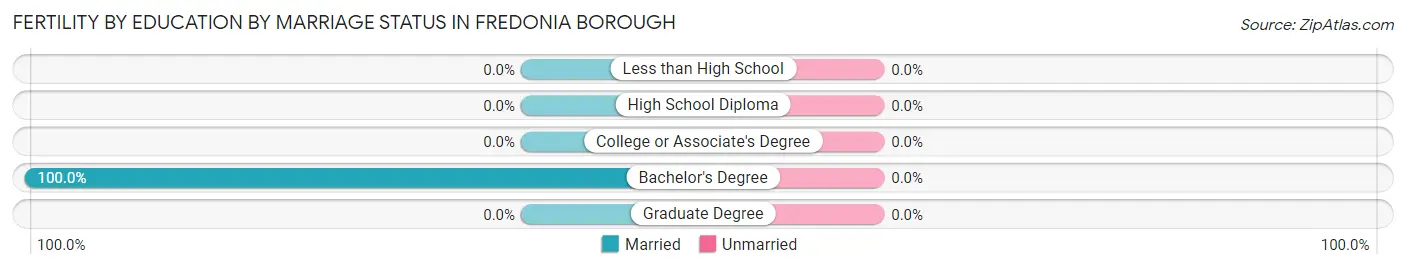
Fertility by Education by Marriage Status in Fredonia borough
| Educational Attainment | Married | Unmarried |
| Less than High School | 0 (0.0%) | 0 (0.0%) |
| High School Diploma | 0 (0.0%) | 0 (0.0%) |
| College or Associate's Degree | 0 (0.0%) | 0 (0.0%) |
| Bachelor's Degree | 3 (100.0%) | 0 (0.0%) |
| Graduate Degree | 0 (0.0%) | 0 (0.0%) |
| Total | 3 (100.0%) | 0 (0.0%) |
Employment Characteristics in Fredonia borough
Employment by Class of Employer in Fredonia borough
Among the 190 employed individuals in Fredonia borough, private company employees (119 | 62.6%), not-for-profit organizations (24 | 12.6%), and local government employees (24 | 12.6%) make up the most common classes of employment.
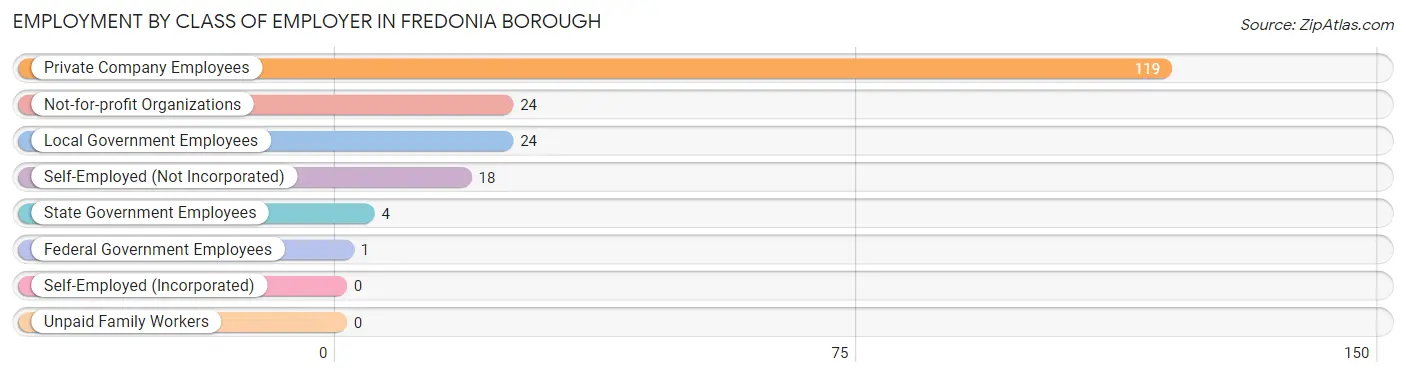
| Employer Class | # Employees | % Employees |
| Private Company Employees | 119 | 62.6% |
| Self-Employed (Incorporated) | 0 | 0.0% |
| Self-Employed (Not Incorporated) | 18 | 9.5% |
| Not-for-profit Organizations | 24 | 12.6% |
| Local Government Employees | 24 | 12.6% |
| State Government Employees | 4 | 2.1% |
| Federal Government Employees | 1 | 0.5% |
| Unpaid Family Workers | 0 | 0.0% |
| Total | 190 | 100.0% |
Employment Status by Age in Fredonia borough
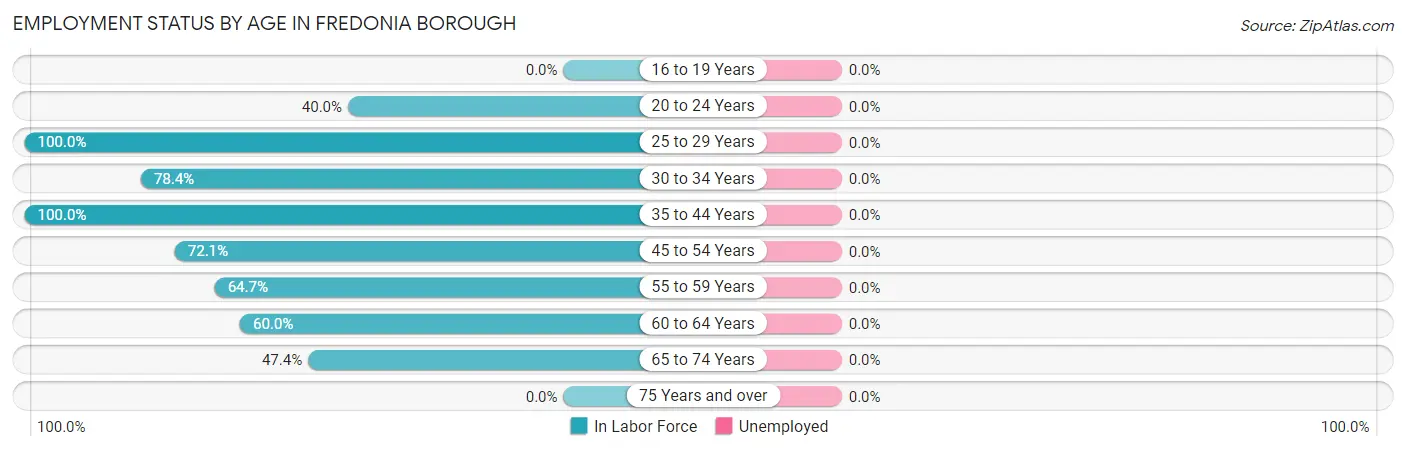
| Age Bracket | In Labor Force | Unemployed |
| 16 to 19 Years | 0 (0.0%) | 0 (0.0%) |
| 20 to 24 Years | 6 (40.0%) | 0 (0.0%) |
| 25 to 29 Years | 5 (100.0%) | 0 (0.0%) |
| 30 to 34 Years | 29 (78.4%) | 0 (0.0%) |
| 35 to 44 Years | 38 (100.0%) | 0 (0.0%) |
| 45 to 54 Years | 49 (72.1%) | 0 (0.0%) |
| 55 to 59 Years | 22 (64.7%) | 0 (0.0%) |
| 60 to 64 Years | 18 (60.0%) | 0 (0.0%) |
| 65 to 74 Years | 27 (47.4%) | 0 (0.0%) |
| 75 Years and over | 0 (0.0%) | 0 (0.0%) |
| Total | 194 (62.2%) | 0 (0.0%) |
Employment Status by Educational Attainment in Fredonia borough
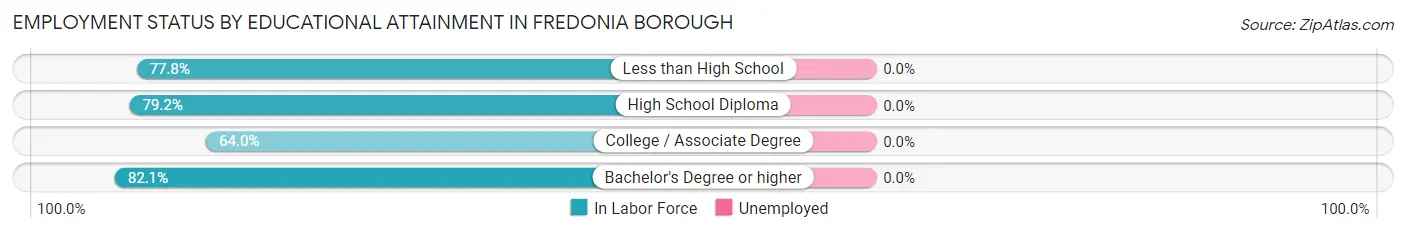
| Educational Attainment | In Labor Force | Unemployed |
| Less than High School | 7 (77.8%) | 0 (0.0%) |
| High School Diploma | 99 (79.2%) | 0 (0.0%) |
| College / Associate Degree | 32 (64.0%) | 0 (0.0%) |
| Bachelor's Degree or higher | 23 (82.1%) | 0 (0.0%) |
| Total | 161 (75.9%) | 0 (0.0%) |
Employment Occupations by Sex in Fredonia borough
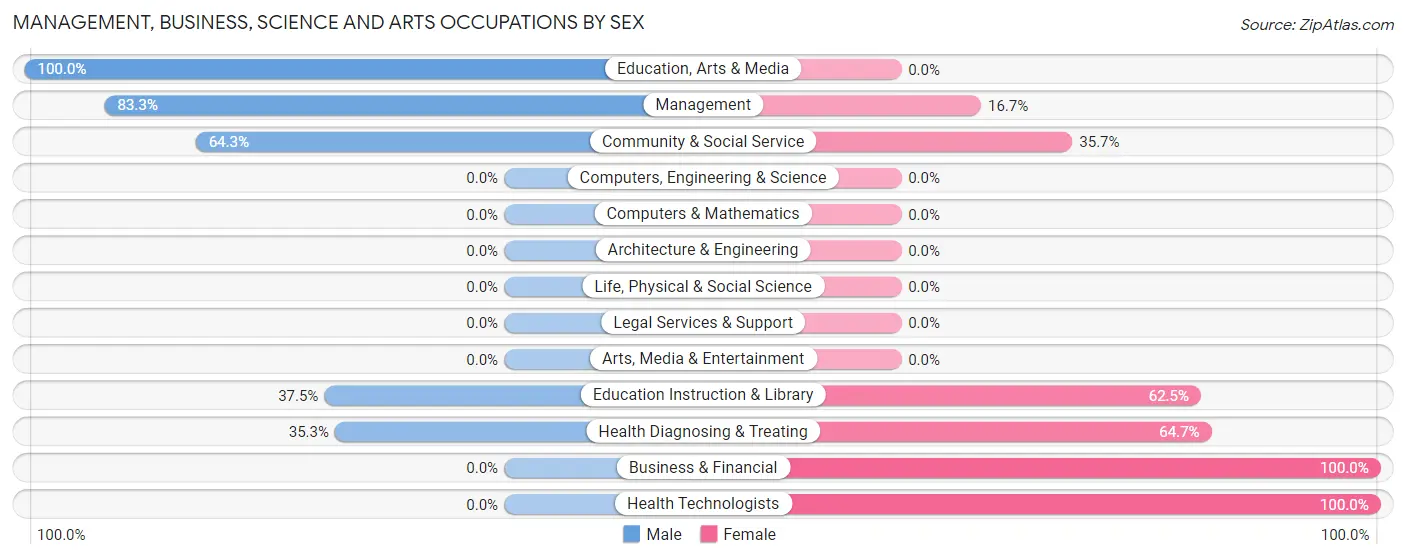
Management, Business, Science and Arts Occupations
The most common Management, Business, Science and Arts occupations in Fredonia borough are Health Diagnosing & Treating (17 | 8.8%), Community & Social Service (14 | 7.2%), Management (12 | 6.2%), Education Instruction & Library (8 | 4.1%), and Business & Financial (7 | 3.6%).
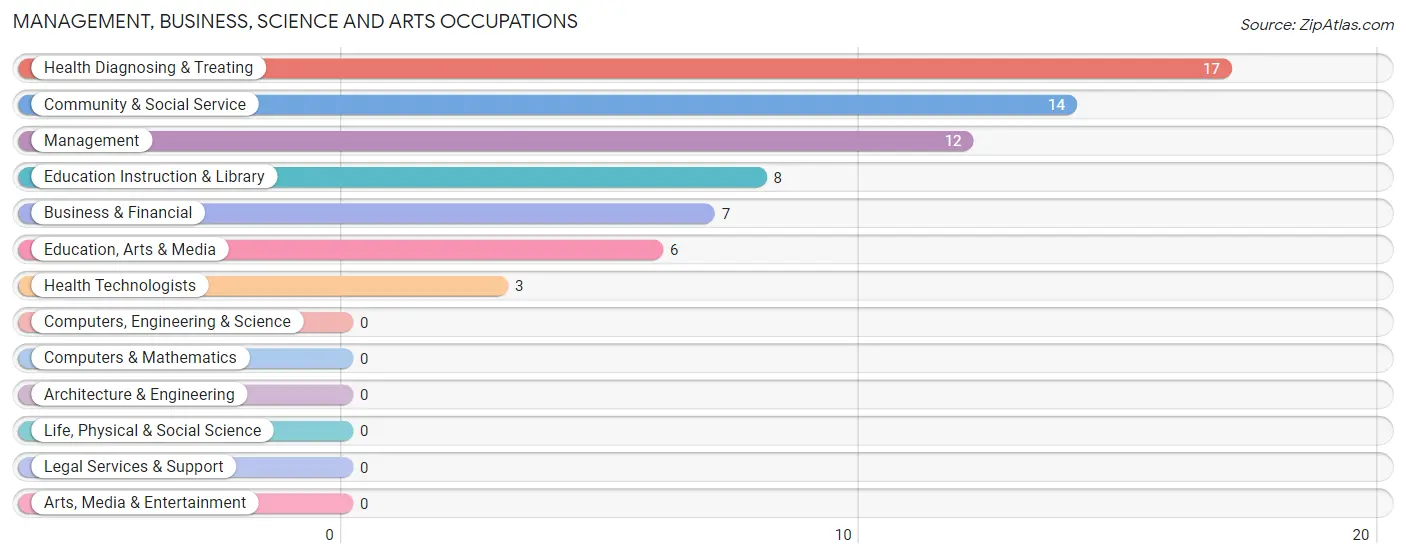
Management, Business, Science and Arts Occupations by Sex
Within the Management, Business, Science and Arts occupations in Fredonia borough, the most male-oriented occupations are Education, Arts & Media (100.0%), Management (83.3%), and Community & Social Service (64.3%), while the most female-oriented occupations are Business & Financial (100.0%), Health Technologists (100.0%), and Health Diagnosing & Treating (64.7%).
| Occupation | Male | Female |
| Management | 10 (83.3%) | 2 (16.7%) |
| Business & Financial | 0 (0.0%) | 7 (100.0%) |
| Computers, Engineering & Science | 0 (0.0%) | 0 (0.0%) |
| Computers & Mathematics | 0 (0.0%) | 0 (0.0%) |
| Architecture & Engineering | 0 (0.0%) | 0 (0.0%) |
| Life, Physical & Social Science | 0 (0.0%) | 0 (0.0%) |
| Community & Social Service | 9 (64.3%) | 5 (35.7%) |
| Education, Arts & Media | 6 (100.0%) | 0 (0.0%) |
| Legal Services & Support | 0 (0.0%) | 0 (0.0%) |
| Education Instruction & Library | 3 (37.5%) | 5 (62.5%) |
| Arts, Media & Entertainment | 0 (0.0%) | 0 (0.0%) |
| Health Diagnosing & Treating | 6 (35.3%) | 11 (64.7%) |
| Health Technologists | 0 (0.0%) | 3 (100.0%) |
| Total (Category) | 25 (50.0%) | 25 (50.0%) |
| Total (Overall) | 109 (56.2%) | 85 (43.8%) |
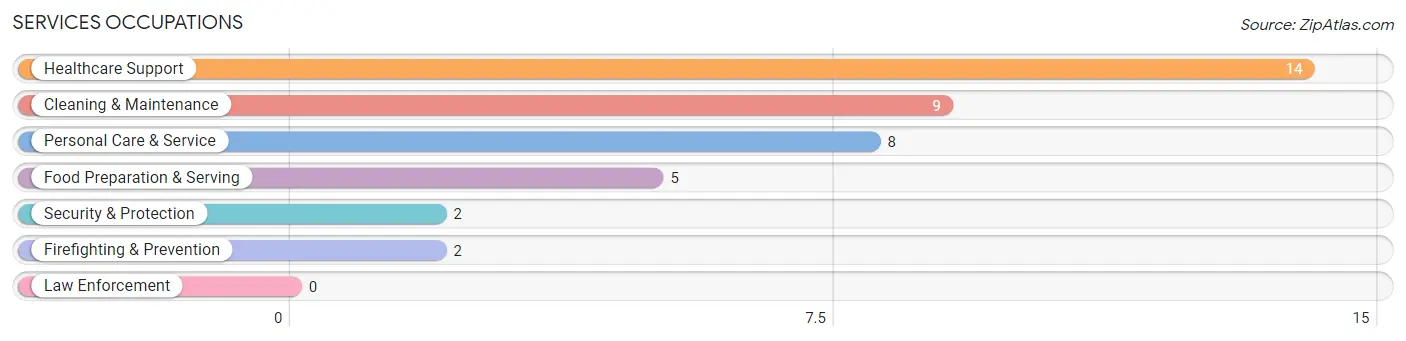
Services Occupations
The most common Services occupations in Fredonia borough are Healthcare Support (14 | 7.2%), Cleaning & Maintenance (9 | 4.6%), Personal Care & Service (8 | 4.1%), Food Preparation & Serving (5 | 2.6%), and Security & Protection (2 | 1.0%).
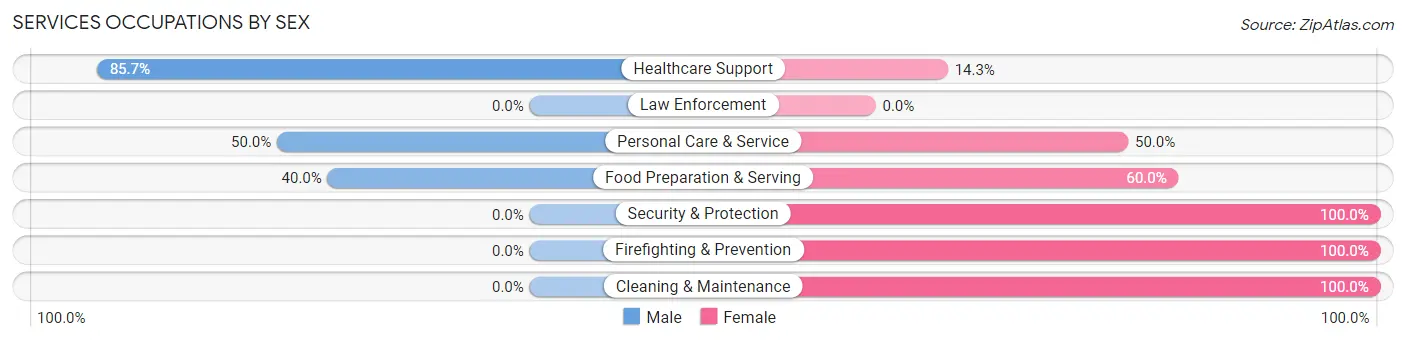
Services Occupations by Sex
Within the Services occupations in Fredonia borough, the most male-oriented occupations are Healthcare Support (85.7%), Personal Care & Service (50.0%), and Food Preparation & Serving (40.0%), while the most female-oriented occupations are Security & Protection (100.0%), Firefighting & Prevention (100.0%), and Cleaning & Maintenance (100.0%).
| Occupation | Male | Female |
| Healthcare Support | 12 (85.7%) | 2 (14.3%) |
| Security & Protection | 0 (0.0%) | 2 (100.0%) |
| Firefighting & Prevention | 0 (0.0%) | 2 (100.0%) |
| Law Enforcement | 0 (0.0%) | 0 (0.0%) |
| Food Preparation & Serving | 2 (40.0%) | 3 (60.0%) |
| Cleaning & Maintenance | 0 (0.0%) | 9 (100.0%) |
| Personal Care & Service | 4 (50.0%) | 4 (50.0%) |
| Total (Category) | 18 (47.4%) | 20 (52.6%) |
| Total (Overall) | 109 (56.2%) | 85 (43.8%) |
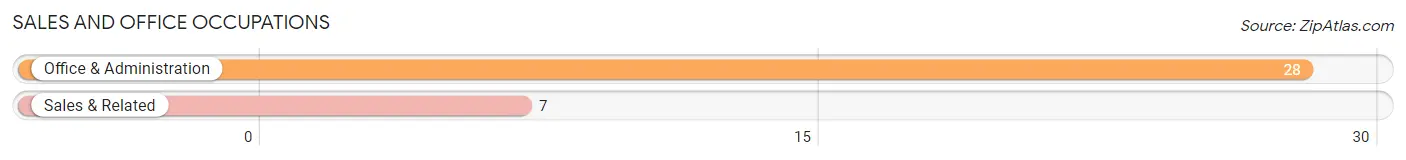
Sales and Office Occupations
The most common Sales and Office occupations in Fredonia borough are Office & Administration (28 | 14.4%), and Sales & Related (7 | 3.6%).
Sales and Office Occupations by Sex
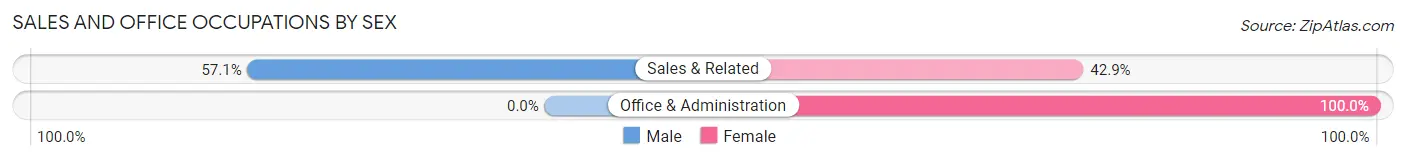
| Occupation | Male | Female |
| Sales & Related | 4 (57.1%) | 3 (42.9%) |
| Office & Administration | 0 (0.0%) | 28 (100.0%) |
| Total (Category) | 4 (11.4%) | 31 (88.6%) |
| Total (Overall) | 109 (56.2%) | 85 (43.8%) |
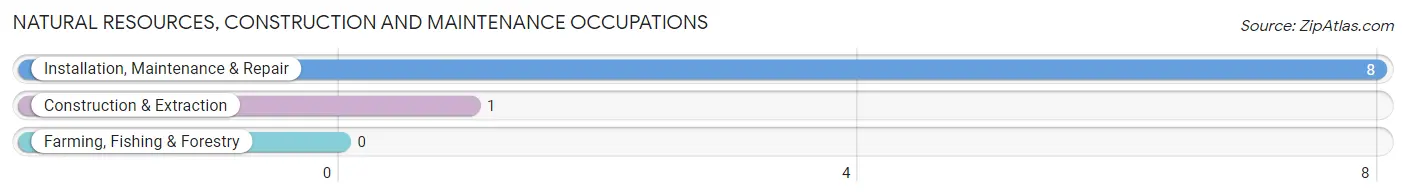
Natural Resources, Construction and Maintenance Occupations
The most common Natural Resources, Construction and Maintenance occupations in Fredonia borough are Installation, Maintenance & Repair (8 | 4.1%), and Construction & Extraction (1 | 0.5%).
Natural Resources, Construction and Maintenance Occupations by Sex
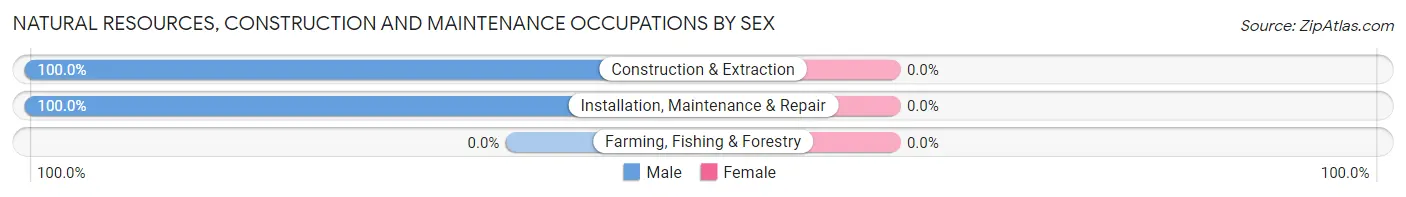
| Occupation | Male | Female |
| Farming, Fishing & Forestry | 0 (0.0%) | 0 (0.0%) |
| Construction & Extraction | 1 (100.0%) | 0 (0.0%) |
| Installation, Maintenance & Repair | 8 (100.0%) | 0 (0.0%) |
| Total (Category) | 9 (100.0%) | 0 (0.0%) |
| Total (Overall) | 109 (56.2%) | 85 (43.8%) |
Production, Transportation and Moving Occupations
The most common Production, Transportation and Moving occupations in Fredonia borough are Production (41 | 21.1%), Transportation (17 | 8.8%), and Material Moving (4 | 2.1%).
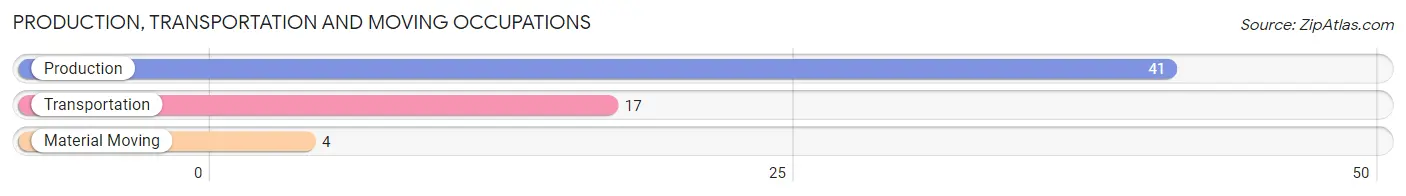
Production, Transportation and Moving Occupations by Sex
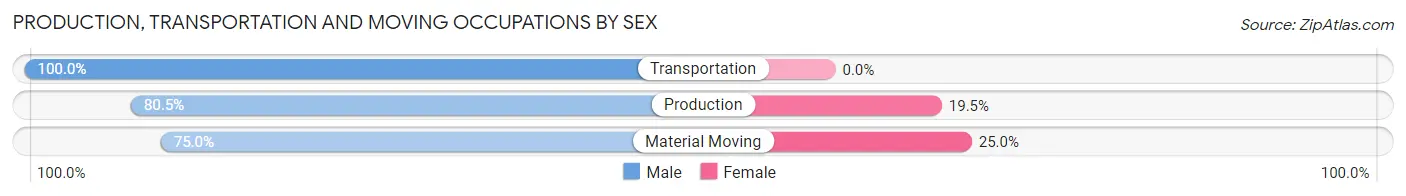
| Occupation | Male | Female |
| Production | 33 (80.5%) | 8 (19.5%) |
| Transportation | 17 (100.0%) | 0 (0.0%) |
| Material Moving | 3 (75.0%) | 1 (25.0%) |
| Total (Category) | 53 (85.5%) | 9 (14.5%) |
| Total (Overall) | 109 (56.2%) | 85 (43.8%) |
Employment Industries by Sex in Fredonia borough
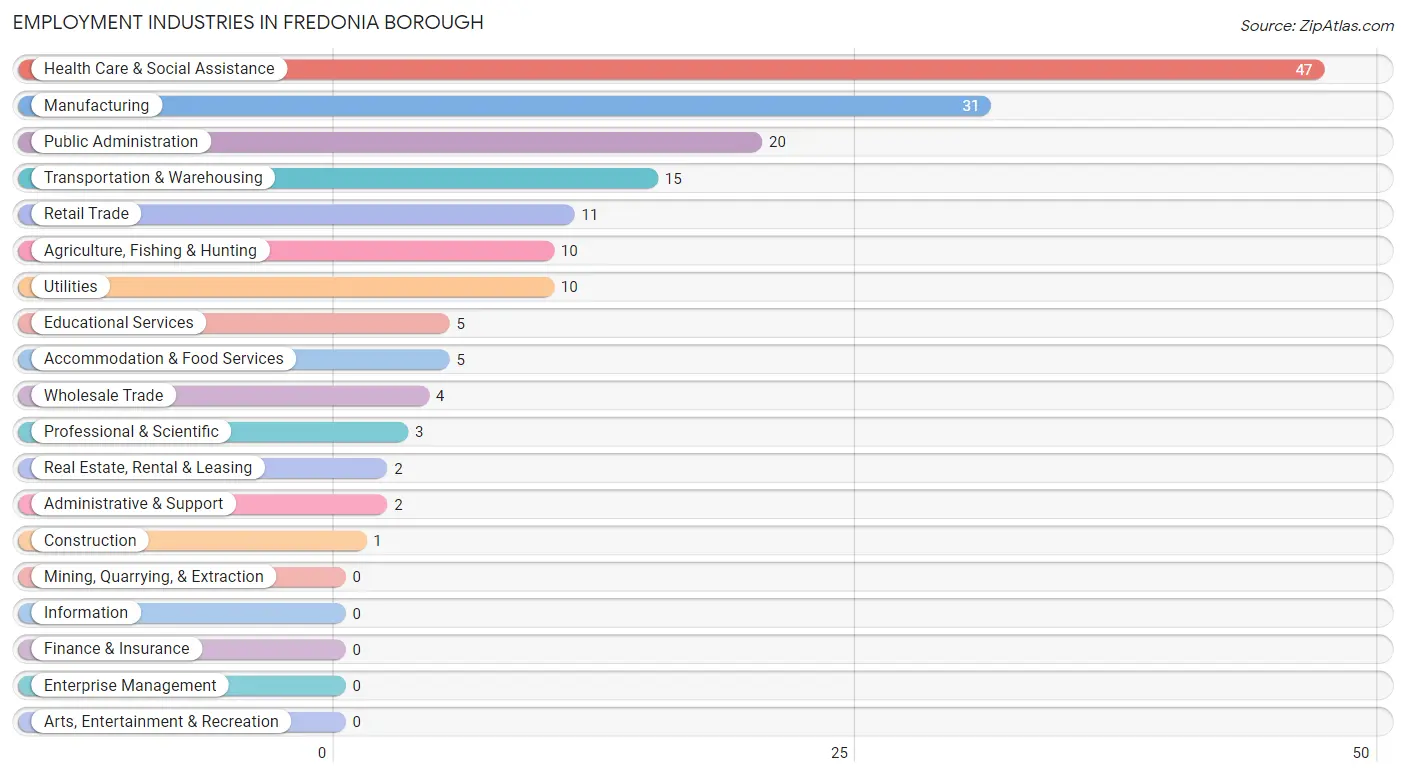
Employment Industries in Fredonia borough
The major employment industries in Fredonia borough include Health Care & Social Assistance (47 | 24.2%), Manufacturing (31 | 16.0%), Public Administration (20 | 10.3%), Transportation & Warehousing (15 | 7.7%), and Retail Trade (11 | 5.7%).
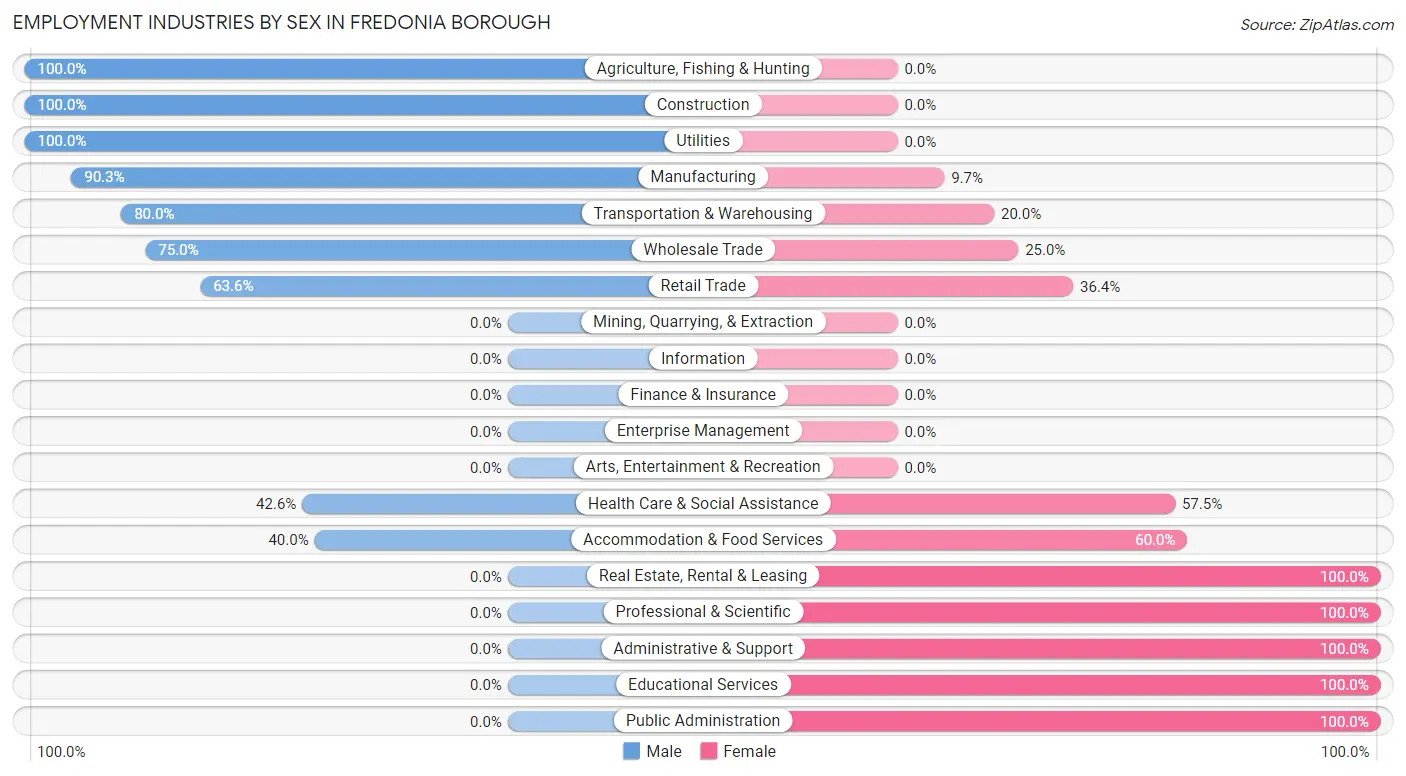
Employment Industries by Sex in Fredonia borough
The Fredonia borough industries that see more men than women are Agriculture, Fishing & Hunting (100.0%), Construction (100.0%), and Utilities (100.0%), whereas the industries that tend to have a higher number of women are Real Estate, Rental & Leasing (100.0%), Professional & Scientific (100.0%), and Administrative & Support (100.0%).
| Industry | Male | Female |
| Agriculture, Fishing & Hunting | 10 (100.0%) | 0 (0.0%) |
| Mining, Quarrying, & Extraction | 0 (0.0%) | 0 (0.0%) |
| Construction | 1 (100.0%) | 0 (0.0%) |
| Manufacturing | 28 (90.3%) | 3 (9.7%) |
| Wholesale Trade | 3 (75.0%) | 1 (25.0%) |
| Retail Trade | 7 (63.6%) | 4 (36.4%) |
| Transportation & Warehousing | 12 (80.0%) | 3 (20.0%) |
| Utilities | 10 (100.0%) | 0 (0.0%) |
| Information | 0 (0.0%) | 0 (0.0%) |
| Finance & Insurance | 0 (0.0%) | 0 (0.0%) |
| Real Estate, Rental & Leasing | 0 (0.0%) | 2 (100.0%) |
| Professional & Scientific | 0 (0.0%) | 3 (100.0%) |
| Enterprise Management | 0 (0.0%) | 0 (0.0%) |
| Administrative & Support | 0 (0.0%) | 2 (100.0%) |
| Educational Services | 0 (0.0%) | 5 (100.0%) |
| Health Care & Social Assistance | 20 (42.5%) | 27 (57.5%) |
| Arts, Entertainment & Recreation | 0 (0.0%) | 0 (0.0%) |
| Accommodation & Food Services | 2 (40.0%) | 3 (60.0%) |
| Public Administration | 0 (0.0%) | 20 (100.0%) |
| Total | 109 (56.2%) | 85 (43.8%) |
Education in Fredonia borough
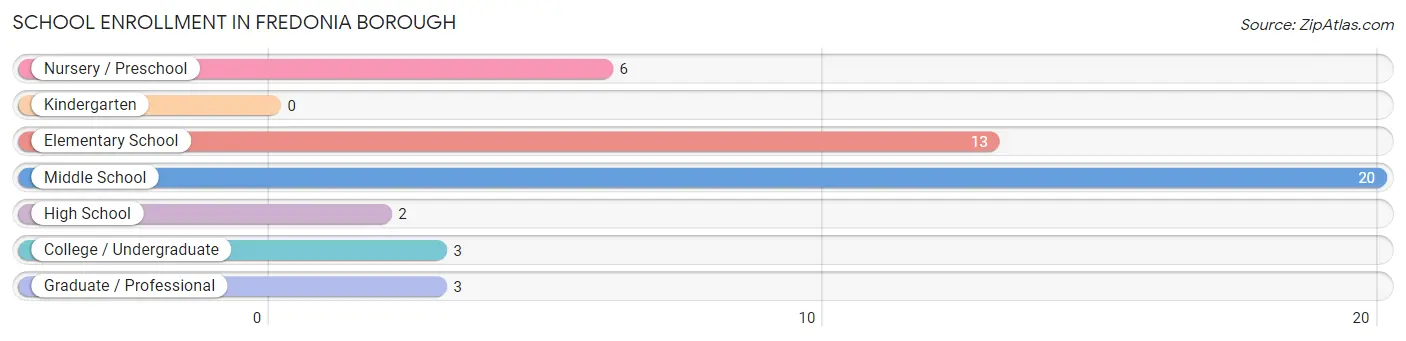
School Enrollment in Fredonia borough
The most common levels of schooling among the 47 students in Fredonia borough are middle school (20 | 42.5%), elementary school (13 | 27.7%), and nursery / preschool (6 | 12.8%).
| School Level | # Students | % Students |
| Nursery / Preschool | 6 | 12.8% |
| Kindergarten | 0 | 0.0% |
| Elementary School | 13 | 27.7% |
| Middle School | 20 | 42.5% |
| High School | 2 | 4.3% |
| College / Undergraduate | 3 | 6.4% |
| Graduate / Professional | 3 | 6.4% |
| Total | 47 | 100.0% |
School Enrollment by Age by Funding Source in Fredonia borough
Out of a total of 47 students who are enrolled in schools in Fredonia borough, 6 (12.8%) attend a private institution, while the remaining 41 (87.2%) are enrolled in public schools. The age group of 3 to 4 year olds has the highest likelihood of being enrolled in private schools, with 3 (100.0% in the age bracket) enrolled. Conversely, the age group of 5 to 9 year old has the lowest likelihood of being enrolled in a private school, with 13 (100.0% in the age bracket) attending a public institution.
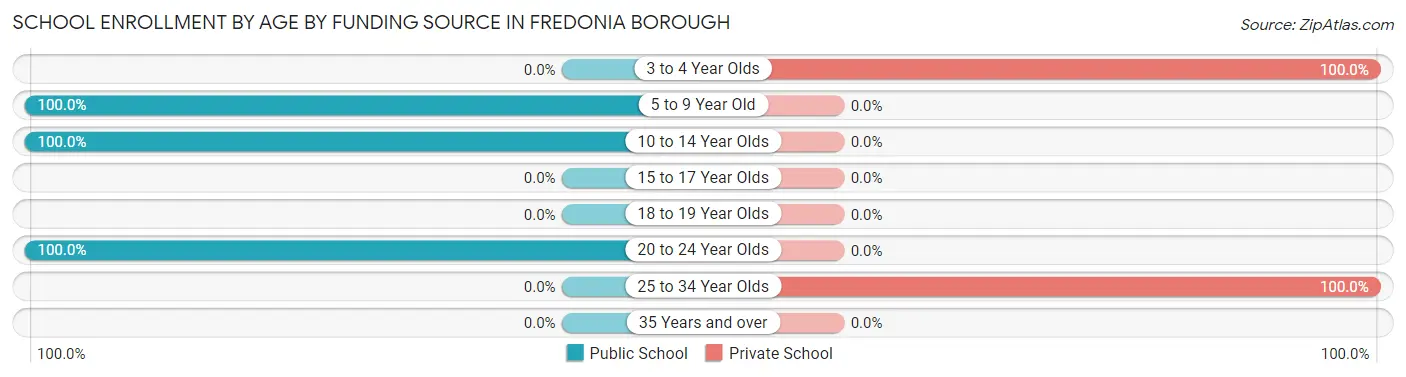
| Age Bracket | Public School | Private School |
| 3 to 4 Year Olds | 0 (0.0%) | 3 (100.0%) |
| 5 to 9 Year Old | 13 (100.0%) | 0 (0.0%) |
| 10 to 14 Year Olds | 25 (100.0%) | 0 (0.0%) |
| 15 to 17 Year Olds | 0 (0.0%) | 0 (0.0%) |
| 18 to 19 Year Olds | 0 (0.0%) | 0 (0.0%) |
| 20 to 24 Year Olds | 3 (100.0%) | 0 (0.0%) |
| 25 to 34 Year Olds | 0 (0.0%) | 3 (100.0%) |
| 35 Years and over | 0 (0.0%) | 0 (0.0%) |
| Total | 41 (87.2%) | 6 (12.8%) |
Educational Attainment by Field of Study in Fredonia borough
Education (14 | 32.6%), business (10 | 23.3%), visual & performing arts (5 | 11.6%), bio, nature & agricultural (4 | 9.3%), and physical & health sciences (4 | 9.3%) are the most common fields of study among 43 individuals in Fredonia borough who have obtained a bachelor's degree or higher.
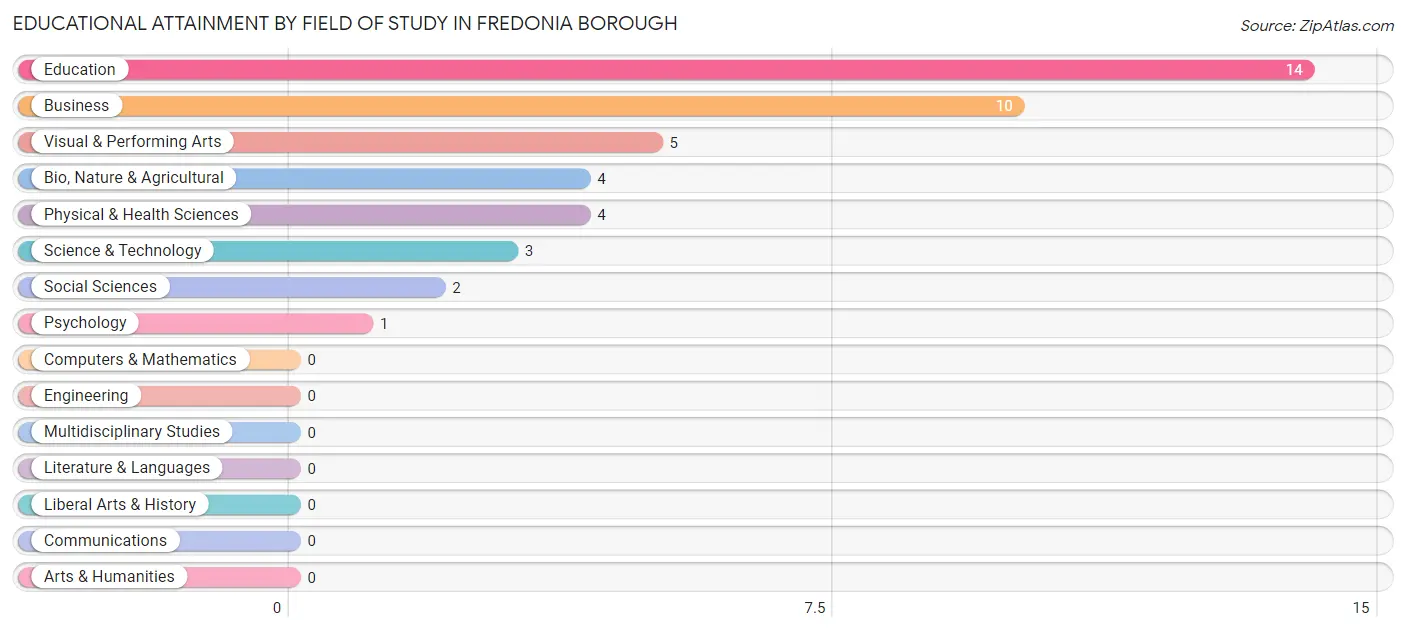
| Field of Study | # Graduates | % Graduates |
| Computers & Mathematics | 0 | 0.0% |
| Bio, Nature & Agricultural | 4 | 9.3% |
| Physical & Health Sciences | 4 | 9.3% |
| Psychology | 1 | 2.3% |
| Social Sciences | 2 | 4.6% |
| Engineering | 0 | 0.0% |
| Multidisciplinary Studies | 0 | 0.0% |
| Science & Technology | 3 | 7.0% |
| Business | 10 | 23.3% |
| Education | 14 | 32.6% |
| Literature & Languages | 0 | 0.0% |
| Liberal Arts & History | 0 | 0.0% |
| Visual & Performing Arts | 5 | 11.6% |
| Communications | 0 | 0.0% |
| Arts & Humanities | 0 | 0.0% |
| Total | 43 | 100.0% |
Transportation & Commute in Fredonia borough
Vehicle Availability by Sex in Fredonia borough
The most prevalent vehicle ownership categories in Fredonia borough are males with 2 vehicles (43, accounting for 40.2%) and females with 2 vehicles (38, making up 51.8%).
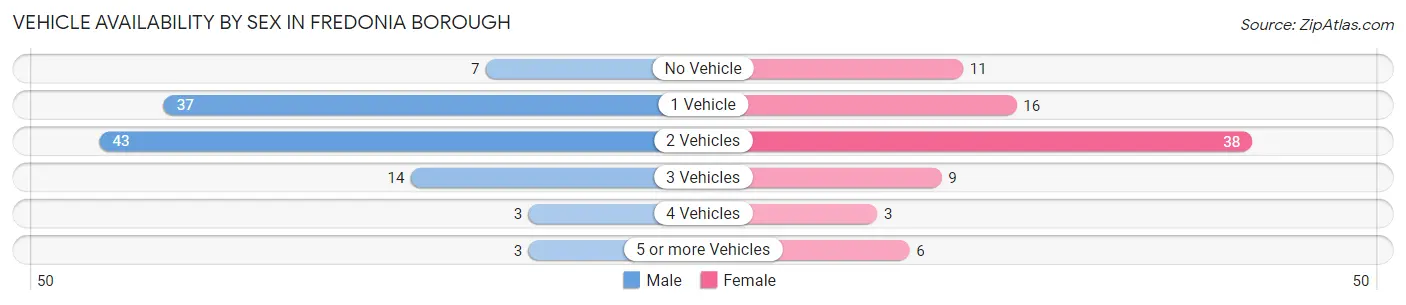
| Vehicles Available | Male | Female |
| No Vehicle | 7 (6.5%) | 11 (13.3%) |
| 1 Vehicle | 37 (34.6%) | 16 (19.3%) |
| 2 Vehicles | 43 (40.2%) | 38 (45.8%) |
| 3 Vehicles | 14 (13.1%) | 9 (10.8%) |
| 4 Vehicles | 3 (2.8%) | 3 (3.6%) |
| 5 or more Vehicles | 3 (2.8%) | 6 (7.2%) |
| Total | 107 (100.0%) | 83 (100.0%) |
Commute Time in Fredonia borough
The most frequently occuring commute durations in Fredonia borough are 35 to 39 minutes (35 commuters, 19.6%), 15 to 19 minutes (34 commuters, 19.0%), and 30 to 34 minutes (28 commuters, 15.6%).
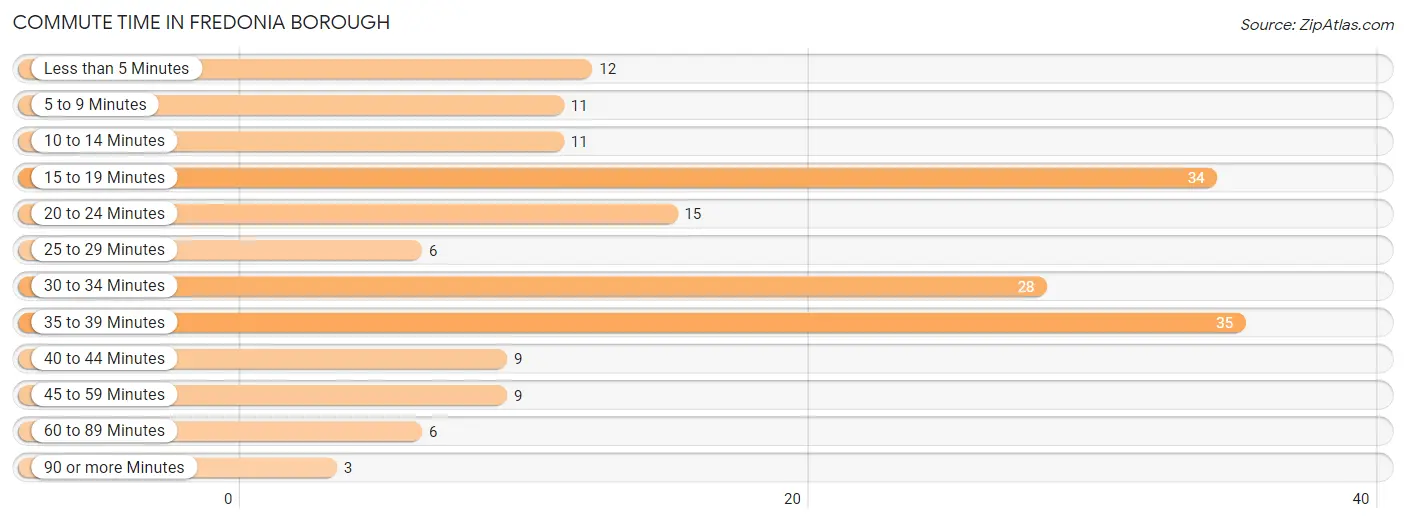
| Commute Time | # Commuters | % Commuters |
| Less than 5 Minutes | 12 | 6.7% |
| 5 to 9 Minutes | 11 | 6.1% |
| 10 to 14 Minutes | 11 | 6.1% |
| 15 to 19 Minutes | 34 | 19.0% |
| 20 to 24 Minutes | 15 | 8.4% |
| 25 to 29 Minutes | 6 | 3.4% |
| 30 to 34 Minutes | 28 | 15.6% |
| 35 to 39 Minutes | 35 | 19.6% |
| 40 to 44 Minutes | 9 | 5.0% |
| 45 to 59 Minutes | 9 | 5.0% |
| 60 to 89 Minutes | 6 | 3.4% |
| 90 or more Minutes | 3 | 1.7% |
Commute Time by Sex in Fredonia borough
The most common commute times in Fredonia borough are 30 to 34 minutes (26 commuters, 25.7%) for males and 15 to 19 minutes (21 commuters, 26.9%) for females.
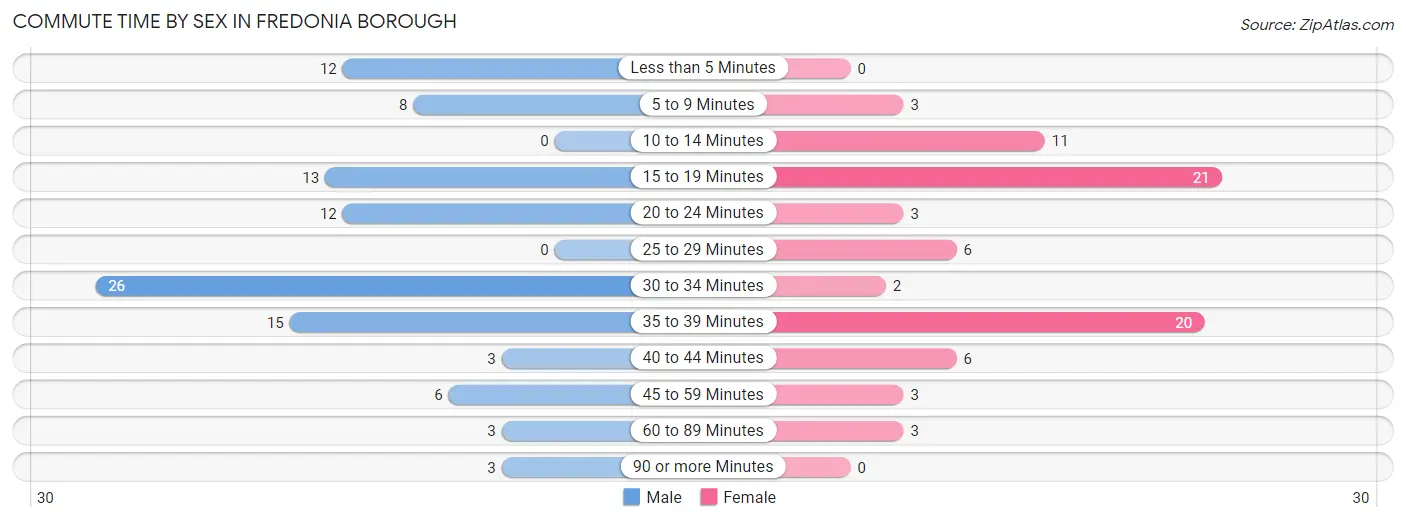
| Commute Time | Male | Female |
| Less than 5 Minutes | 12 (11.9%) | 0 (0.0%) |
| 5 to 9 Minutes | 8 (7.9%) | 3 (3.8%) |
| 10 to 14 Minutes | 0 (0.0%) | 11 (14.1%) |
| 15 to 19 Minutes | 13 (12.9%) | 21 (26.9%) |
| 20 to 24 Minutes | 12 (11.9%) | 3 (3.8%) |
| 25 to 29 Minutes | 0 (0.0%) | 6 (7.7%) |
| 30 to 34 Minutes | 26 (25.7%) | 2 (2.6%) |
| 35 to 39 Minutes | 15 (14.8%) | 20 (25.6%) |
| 40 to 44 Minutes | 3 (3.0%) | 6 (7.7%) |
| 45 to 59 Minutes | 6 (5.9%) | 3 (3.8%) |
| 60 to 89 Minutes | 3 (3.0%) | 3 (3.8%) |
| 90 or more Minutes | 3 (3.0%) | 0 (0.0%) |
Time of Departure to Work by Sex in Fredonia borough
The most frequent times of departure to work in Fredonia borough are 9:00 AM to 9:59 AM (18, 17.8%) for males and 8:00 AM to 8:29 AM (35, 44.9%) for females.
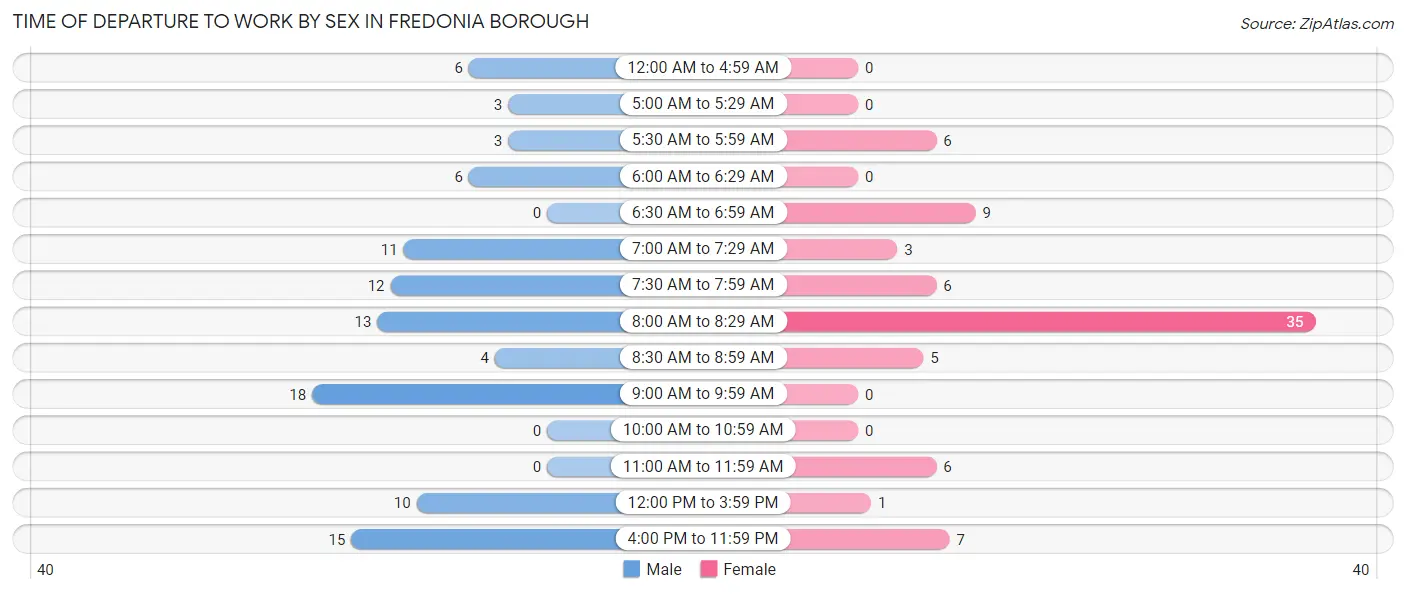
| Time of Departure | Male | Female |
| 12:00 AM to 4:59 AM | 6 (5.9%) | 0 (0.0%) |
| 5:00 AM to 5:29 AM | 3 (3.0%) | 0 (0.0%) |
| 5:30 AM to 5:59 AM | 3 (3.0%) | 6 (7.7%) |
| 6:00 AM to 6:29 AM | 6 (5.9%) | 0 (0.0%) |
| 6:30 AM to 6:59 AM | 0 (0.0%) | 9 (11.5%) |
| 7:00 AM to 7:29 AM | 11 (10.9%) | 3 (3.8%) |
| 7:30 AM to 7:59 AM | 12 (11.9%) | 6 (7.7%) |
| 8:00 AM to 8:29 AM | 13 (12.9%) | 35 (44.9%) |
| 8:30 AM to 8:59 AM | 4 (4.0%) | 5 (6.4%) |
| 9:00 AM to 9:59 AM | 18 (17.8%) | 0 (0.0%) |
| 10:00 AM to 10:59 AM | 0 (0.0%) | 0 (0.0%) |
| 11:00 AM to 11:59 AM | 0 (0.0%) | 6 (7.7%) |
| 12:00 PM to 3:59 PM | 10 (9.9%) | 1 (1.3%) |
| 4:00 PM to 11:59 PM | 15 (14.8%) | 7 (9.0%) |
| Total | 101 (100.0%) | 78 (100.0%) |
Housing Occupancy in Fredonia borough
Occupancy by Ownership in Fredonia borough
Of the total 184 dwellings in Fredonia borough, owner-occupied units account for 140 (76.1%), while renter-occupied units make up 44 (23.9%).
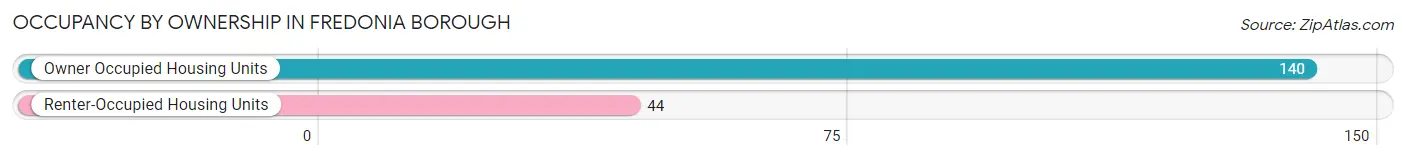
| Occupancy | # Housing Units | % Housing Units |
| Owner Occupied Housing Units | 140 | 76.1% |
| Renter-Occupied Housing Units | 44 | 23.9% |
| Total Occupied Housing Units | 184 | 100.0% |
Occupancy by Household Size in Fredonia borough
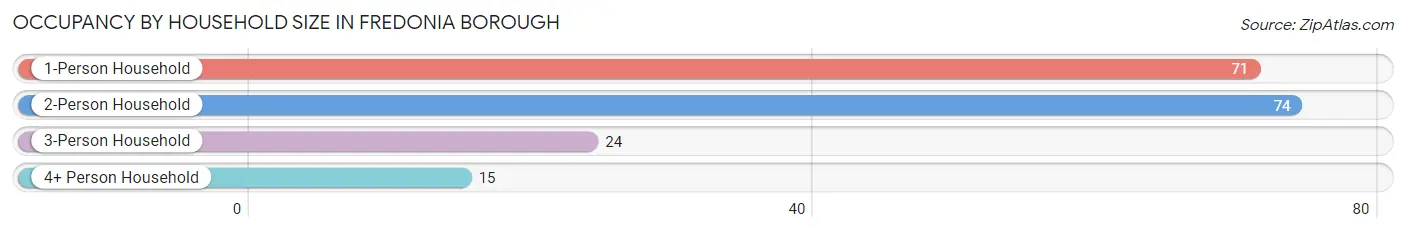
| Household Size | # Housing Units | % Housing Units |
| 1-Person Household | 71 | 38.6% |
| 2-Person Household | 74 | 40.2% |
| 3-Person Household | 24 | 13.0% |
| 4+ Person Household | 15 | 8.2% |
| Total Housing Units | 184 | 100.0% |
Occupancy by Ownership by Household Size in Fredonia borough
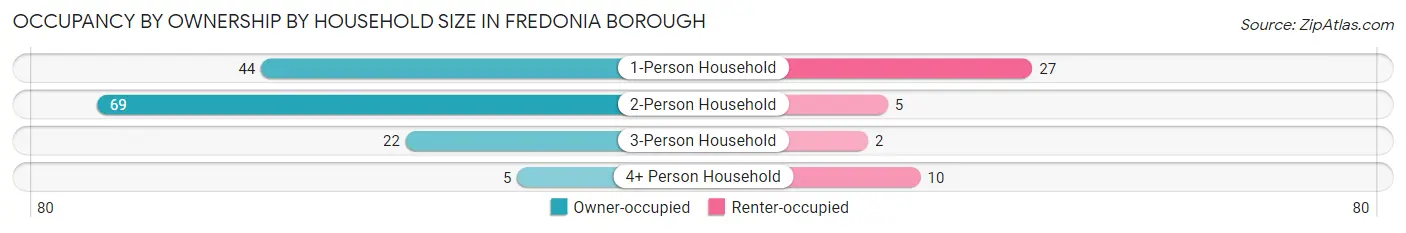
| Household Size | Owner-occupied | Renter-occupied |
| 1-Person Household | 44 (62.0%) | 27 (38.0%) |
| 2-Person Household | 69 (93.2%) | 5 (6.8%) |
| 3-Person Household | 22 (91.7%) | 2 (8.3%) |
| 4+ Person Household | 5 (33.3%) | 10 (66.7%) |
| Total Housing Units | 140 (76.1%) | 44 (23.9%) |
Occupancy by Educational Attainment in Fredonia borough
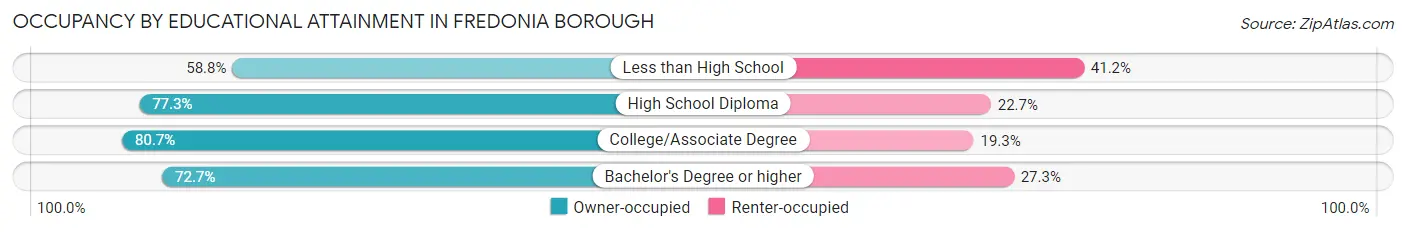
| Household Size | Owner-occupied | Renter-occupied |
| Less than High School | 10 (58.8%) | 7 (41.2%) |
| High School Diploma | 68 (77.3%) | 20 (22.7%) |
| College/Associate Degree | 46 (80.7%) | 11 (19.3%) |
| Bachelor's Degree or higher | 16 (72.7%) | 6 (27.3%) |
Occupancy by Age of Householder in Fredonia borough
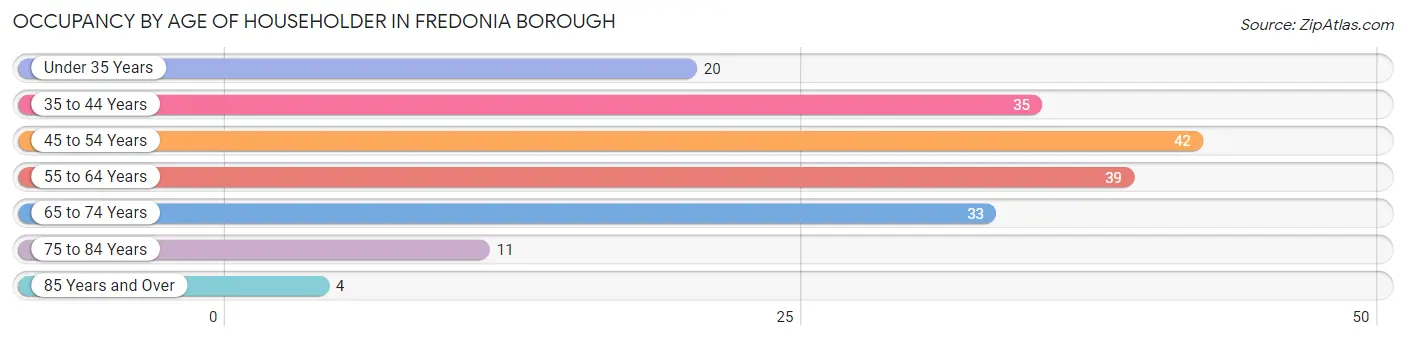
| Age Bracket | # Households | % Households |
| Under 35 Years | 20 | 10.9% |
| 35 to 44 Years | 35 | 19.0% |
| 45 to 54 Years | 42 | 22.8% |
| 55 to 64 Years | 39 | 21.2% |
| 65 to 74 Years | 33 | 17.9% |
| 75 to 84 Years | 11 | 6.0% |
| 85 Years and Over | 4 | 2.2% |
| Total | 184 | 100.0% |
Housing Finances in Fredonia borough
Median Income by Occupancy in Fredonia borough
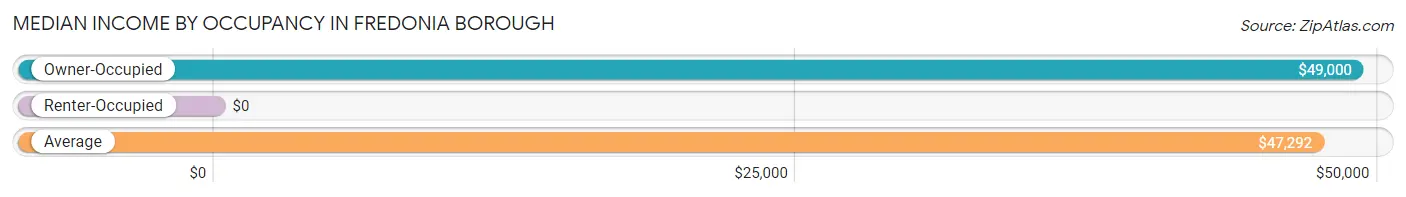
| Occupancy Type | # Households | Median Income |
| Owner-Occupied | 140 (76.1%) | $49,000 |
| Renter-Occupied | 44 (23.9%) | $0 |
| Average | 184 (100.0%) | $47,292 |
Occupancy by Householder Income Bracket in Fredonia borough
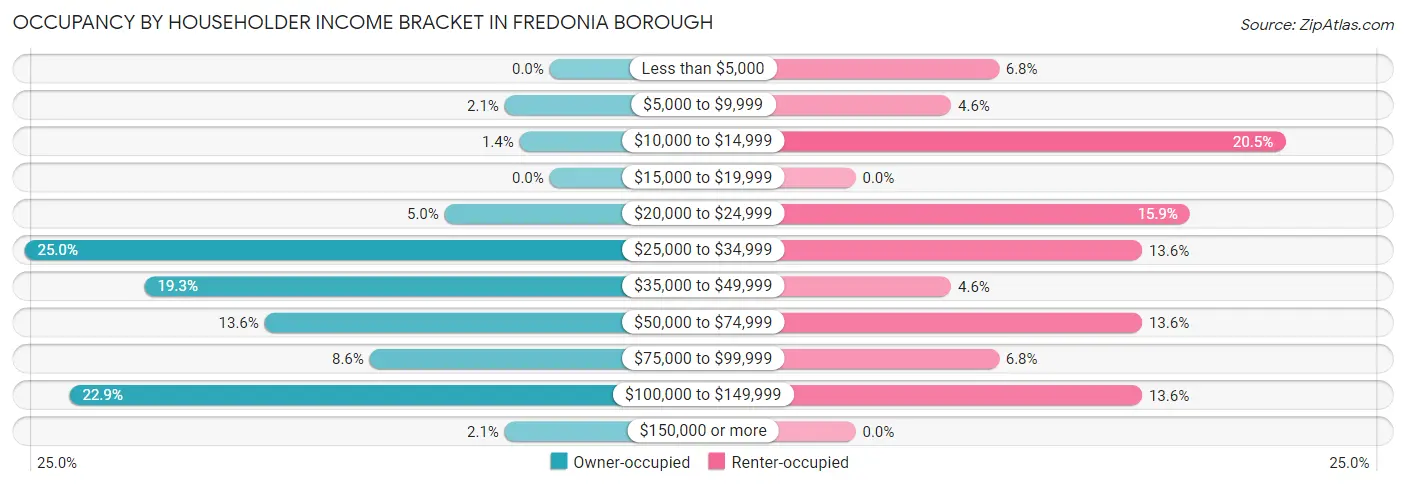
| Income Bracket | Owner-occupied | Renter-occupied |
| Less than $5,000 | 0 (0.0%) | 3 (6.8%) |
| $5,000 to $9,999 | 3 (2.1%) | 2 (4.5%) |
| $10,000 to $14,999 | 2 (1.4%) | 9 (20.4%) |
| $15,000 to $19,999 | 0 (0.0%) | 0 (0.0%) |
| $20,000 to $24,999 | 7 (5.0%) | 7 (15.9%) |
| $25,000 to $34,999 | 35 (25.0%) | 6 (13.6%) |
| $35,000 to $49,999 | 27 (19.3%) | 2 (4.5%) |
| $50,000 to $74,999 | 19 (13.6%) | 6 (13.6%) |
| $75,000 to $99,999 | 12 (8.6%) | 3 (6.8%) |
| $100,000 to $149,999 | 32 (22.9%) | 6 (13.6%) |
| $150,000 or more | 3 (2.1%) | 0 (0.0%) |
| Total | 140 (100.0%) | 44 (100.0%) |
Monthly Housing Cost Tiers in Fredonia borough
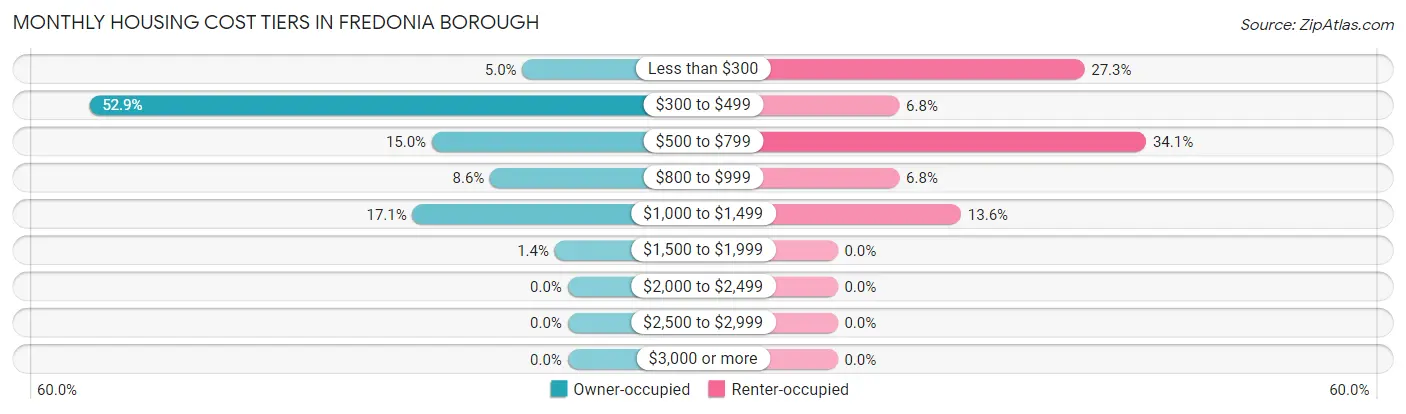
| Monthly Cost | Owner-occupied | Renter-occupied |
| Less than $300 | 7 (5.0%) | 12 (27.3%) |
| $300 to $499 | 74 (52.9%) | 3 (6.8%) |
| $500 to $799 | 21 (15.0%) | 15 (34.1%) |
| $800 to $999 | 12 (8.6%) | 3 (6.8%) |
| $1,000 to $1,499 | 24 (17.1%) | 6 (13.6%) |
| $1,500 to $1,999 | 2 (1.4%) | 0 (0.0%) |
| $2,000 to $2,499 | 0 (0.0%) | 0 (0.0%) |
| $2,500 to $2,999 | 0 (0.0%) | 0 (0.0%) |
| $3,000 or more | 0 (0.0%) | 0 (0.0%) |
| Total | 140 (100.0%) | 44 (100.0%) |
Physical Housing Characteristics in Fredonia borough
Housing Structures in Fredonia borough
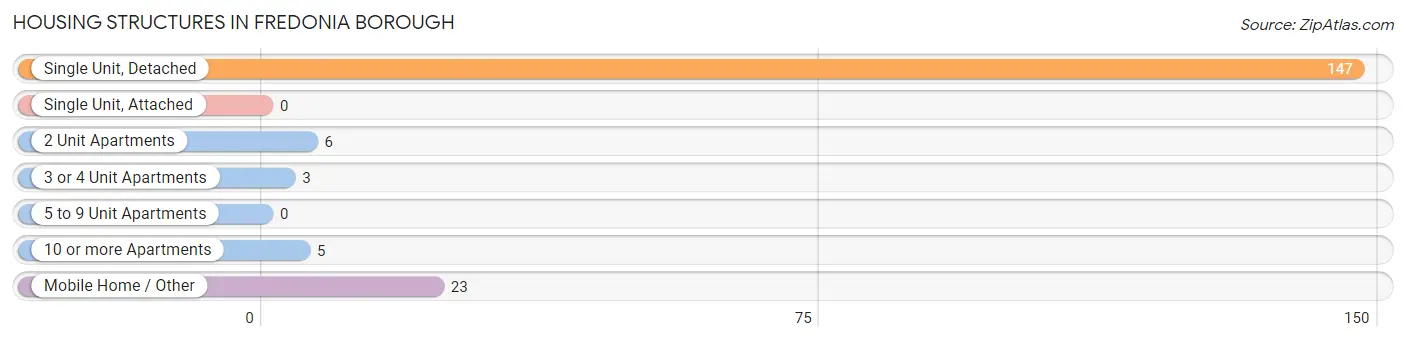
| Structure Type | # Housing Units | % Housing Units |
| Single Unit, Detached | 147 | 79.9% |
| Single Unit, Attached | 0 | 0.0% |
| 2 Unit Apartments | 6 | 3.3% |
| 3 or 4 Unit Apartments | 3 | 1.6% |
| 5 to 9 Unit Apartments | 0 | 0.0% |
| 10 or more Apartments | 5 | 2.7% |
| Mobile Home / Other | 23 | 12.5% |
| Total | 184 | 100.0% |
Housing Structures by Occupancy in Fredonia borough

| Structure Type | Owner-occupied | Renter-occupied |
| Single Unit, Detached | 127 (86.4%) | 20 (13.6%) |
| Single Unit, Attached | 0 (0.0%) | 0 (0.0%) |
| 2 Unit Apartments | 0 (0.0%) | 6 (100.0%) |
| 3 or 4 Unit Apartments | 0 (0.0%) | 3 (100.0%) |
| 5 to 9 Unit Apartments | 0 (0.0%) | 0 (0.0%) |
| 10 or more Apartments | 0 (0.0%) | 5 (100.0%) |
| Mobile Home / Other | 13 (56.5%) | 10 (43.5%) |
| Total | 140 (76.1%) | 44 (23.9%) |
Housing Structures by Number of Rooms in Fredonia borough
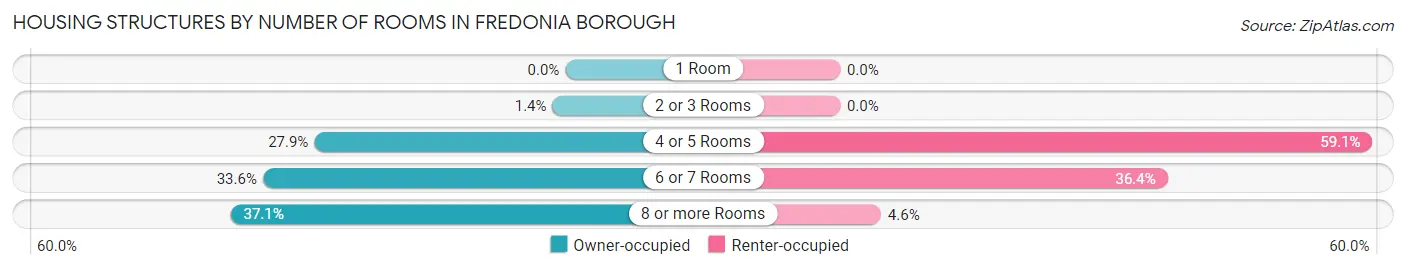
| Number of Rooms | Owner-occupied | Renter-occupied |
| 1 Room | 0 (0.0%) | 0 (0.0%) |
| 2 or 3 Rooms | 2 (1.4%) | 0 (0.0%) |
| 4 or 5 Rooms | 39 (27.9%) | 26 (59.1%) |
| 6 or 7 Rooms | 47 (33.6%) | 16 (36.4%) |
| 8 or more Rooms | 52 (37.1%) | 2 (4.5%) |
| Total | 140 (100.0%) | 44 (100.0%) |
Housing Structure by Heating Type in Fredonia borough
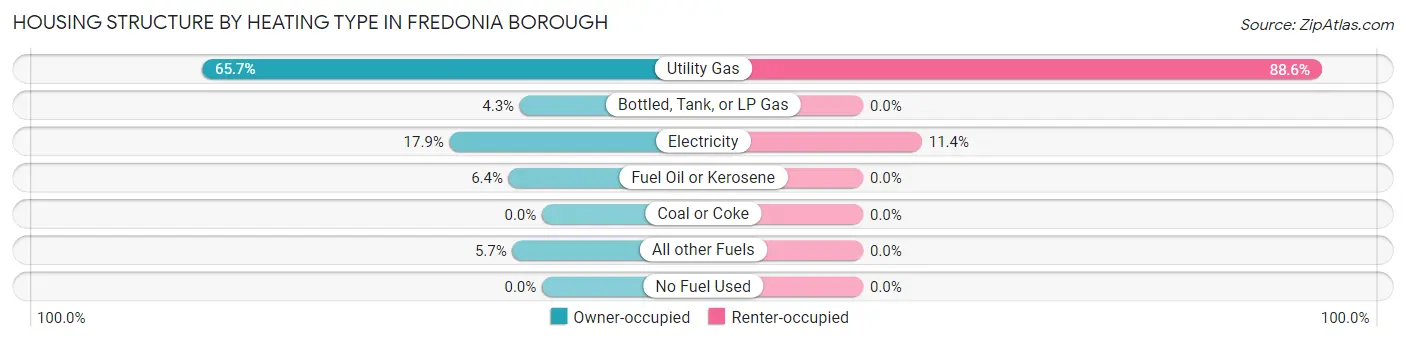
| Heating Type | Owner-occupied | Renter-occupied |
| Utility Gas | 92 (65.7%) | 39 (88.6%) |
| Bottled, Tank, or LP Gas | 6 (4.3%) | 0 (0.0%) |
| Electricity | 25 (17.9%) | 5 (11.4%) |
| Fuel Oil or Kerosene | 9 (6.4%) | 0 (0.0%) |
| Coal or Coke | 0 (0.0%) | 0 (0.0%) |
| All other Fuels | 8 (5.7%) | 0 (0.0%) |
| No Fuel Used | 0 (0.0%) | 0 (0.0%) |
| Total | 140 (100.0%) | 44 (100.0%) |
Household Vehicle Usage in Fredonia borough
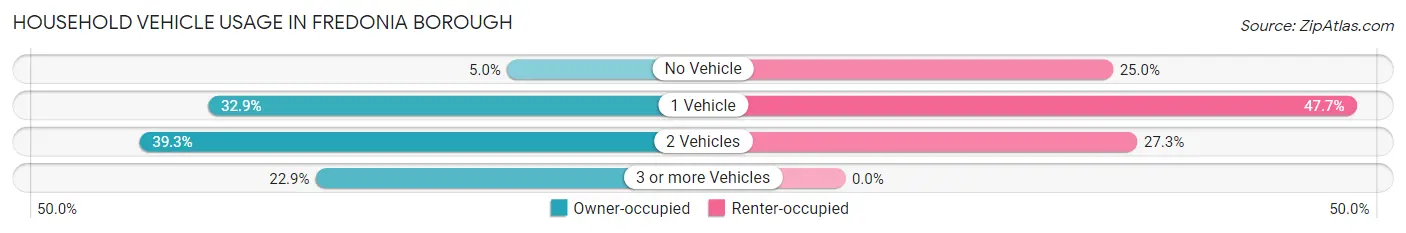
| Vehicles per Household | Owner-occupied | Renter-occupied |
| No Vehicle | 7 (5.0%) | 11 (25.0%) |
| 1 Vehicle | 46 (32.9%) | 21 (47.7%) |
| 2 Vehicles | 55 (39.3%) | 12 (27.3%) |
| 3 or more Vehicles | 32 (22.9%) | 0 (0.0%) |
| Total | 140 (100.0%) | 44 (100.0%) |
Real Estate & Mortgages in Fredonia borough
Real Estate and Mortgage Overview in Fredonia borough
| Characteristic | Without Mortgage | With Mortgage |
| Housing Units | 97 | 43 |
| Median Property Value | $93,200 | $104,800 |
| Median Household Income | $48,875 | $0 |
| Monthly Housing Costs | $405 | $0 |
| Real Estate Taxes | $1,345 | $0 |
Property Value by Mortgage Status in Fredonia borough
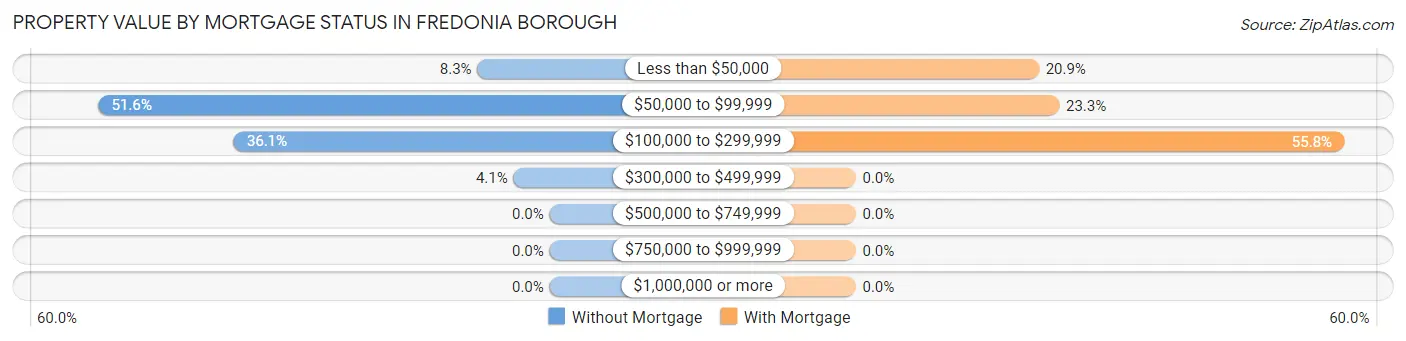
| Property Value | Without Mortgage | With Mortgage |
| Less than $50,000 | 8 (8.3%) | 9 (20.9%) |
| $50,000 to $99,999 | 50 (51.5%) | 10 (23.3%) |
| $100,000 to $299,999 | 35 (36.1%) | 24 (55.8%) |
| $300,000 to $499,999 | 4 (4.1%) | 0 (0.0%) |
| $500,000 to $749,999 | 0 (0.0%) | 0 (0.0%) |
| $750,000 to $999,999 | 0 (0.0%) | 0 (0.0%) |
| $1,000,000 or more | 0 (0.0%) | 0 (0.0%) |
| Total | 97 (100.0%) | 43 (100.0%) |
Household Income by Mortgage Status in Fredonia borough
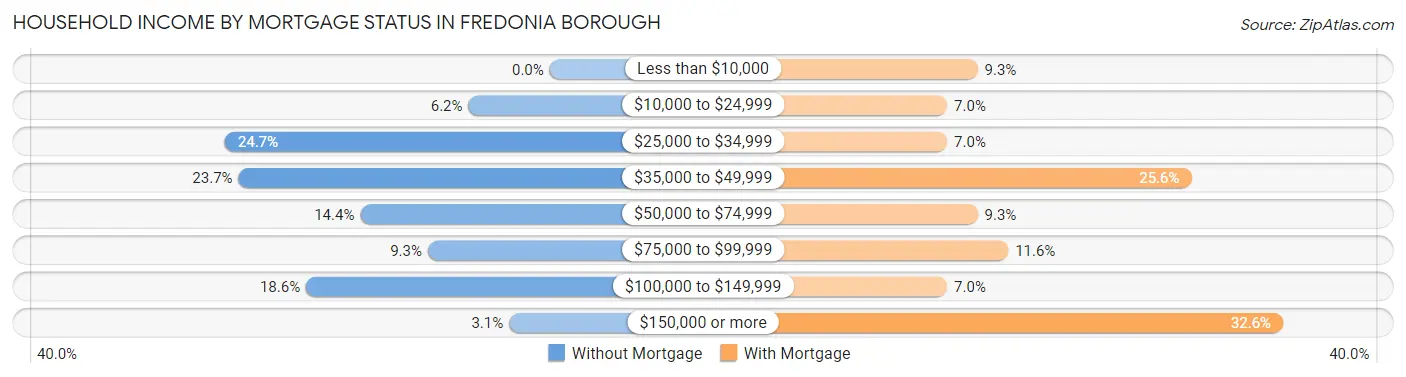
| Household Income | Without Mortgage | With Mortgage |
| Less than $10,000 | 0 (0.0%) | 4 (9.3%) |
| $10,000 to $24,999 | 6 (6.2%) | 3 (7.0%) |
| $25,000 to $34,999 | 24 (24.7%) | 3 (7.0%) |
| $35,000 to $49,999 | 23 (23.7%) | 11 (25.6%) |
| $50,000 to $74,999 | 14 (14.4%) | 4 (9.3%) |
| $75,000 to $99,999 | 9 (9.3%) | 5 (11.6%) |
| $100,000 to $149,999 | 18 (18.6%) | 3 (7.0%) |
| $150,000 or more | 3 (3.1%) | 14 (32.6%) |
| Total | 97 (100.0%) | 43 (100.0%) |
Property Value to Household Income Ratio in Fredonia borough
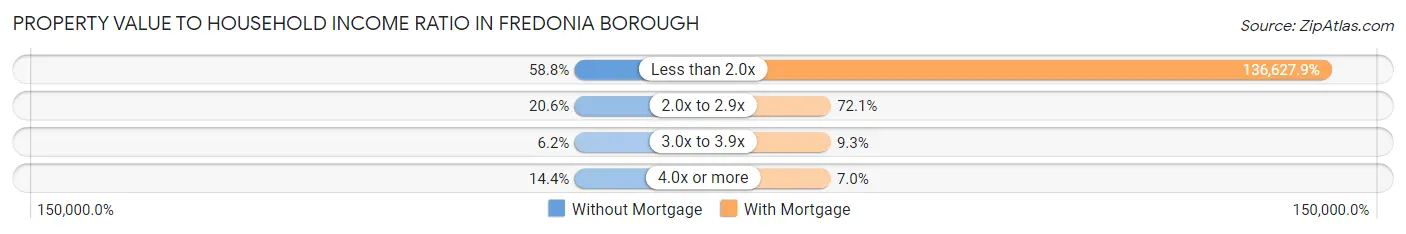
| Value-to-Income Ratio | Without Mortgage | With Mortgage |
| Less than 2.0x | 57 (58.8%) | 58,750 (136,627.9%) |
| 2.0x to 2.9x | 20 (20.6%) | 31 (72.1%) |
| 3.0x to 3.9x | 6 (6.2%) | 4 (9.3%) |
| 4.0x or more | 14 (14.4%) | 3 (7.0%) |
| Total | 97 (100.0%) | 43 (100.0%) |
Real Estate Taxes by Mortgage Status in Fredonia borough
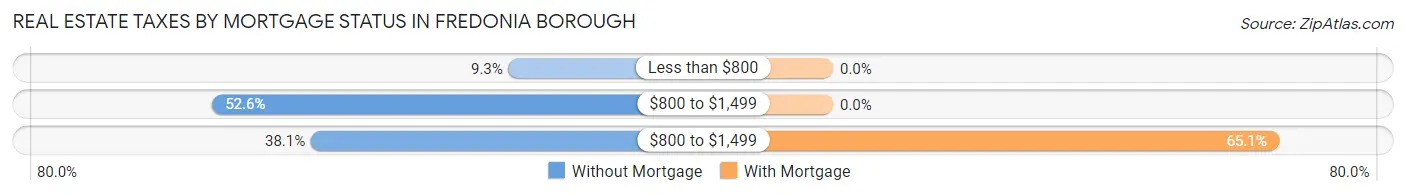
| Property Taxes | Without Mortgage | With Mortgage |
| Less than $800 | 9 (9.3%) | 0 (0.0%) |
| $800 to $1,499 | 51 (52.6%) | 0 (0.0%) |
| $800 to $1,499 | 37 (38.1%) | 28 (65.1%) |
| Total | 97 (100.0%) | 43 (100.0%) |
Health & Disability in Fredonia borough
Health Insurance Coverage by Age in Fredonia borough
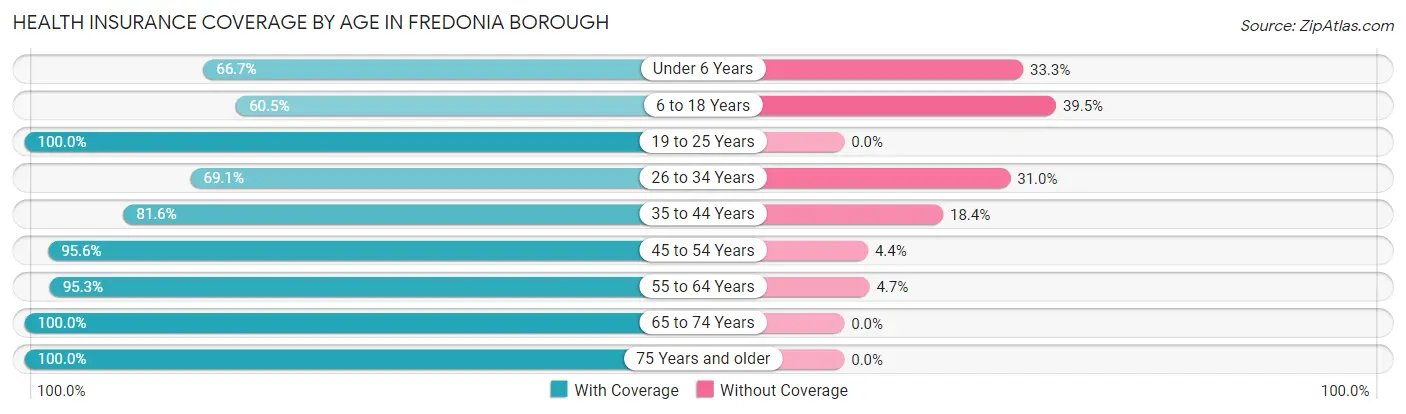
| Age Bracket | With Coverage | Without Coverage |
| Under 6 Years | 14 (66.7%) | 7 (33.3%) |
| 6 to 18 Years | 23 (60.5%) | 15 (39.5%) |
| 19 to 25 Years | 15 (100.0%) | 0 (0.0%) |
| 26 to 34 Years | 29 (69.1%) | 13 (30.9%) |
| 35 to 44 Years | 31 (81.6%) | 7 (18.4%) |
| 45 to 54 Years | 65 (95.6%) | 3 (4.4%) |
| 55 to 64 Years | 61 (95.3%) | 3 (4.7%) |
| 65 to 74 Years | 57 (100.0%) | 0 (0.0%) |
| 75 Years and older | 25 (100.0%) | 0 (0.0%) |
| Total | 320 (87.0%) | 48 (13.0%) |
Health Insurance Coverage by Citizenship Status in Fredonia borough
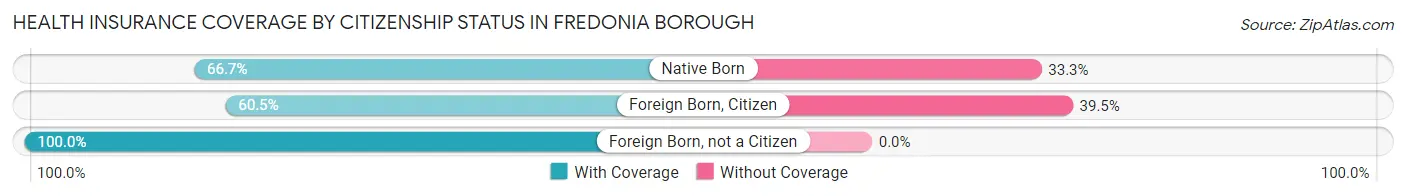
| Citizenship Status | With Coverage | Without Coverage |
| Native Born | 14 (66.7%) | 7 (33.3%) |
| Foreign Born, Citizen | 23 (60.5%) | 15 (39.5%) |
| Foreign Born, not a Citizen | 15 (100.0%) | 0 (0.0%) |
Health Insurance Coverage by Household Income in Fredonia borough
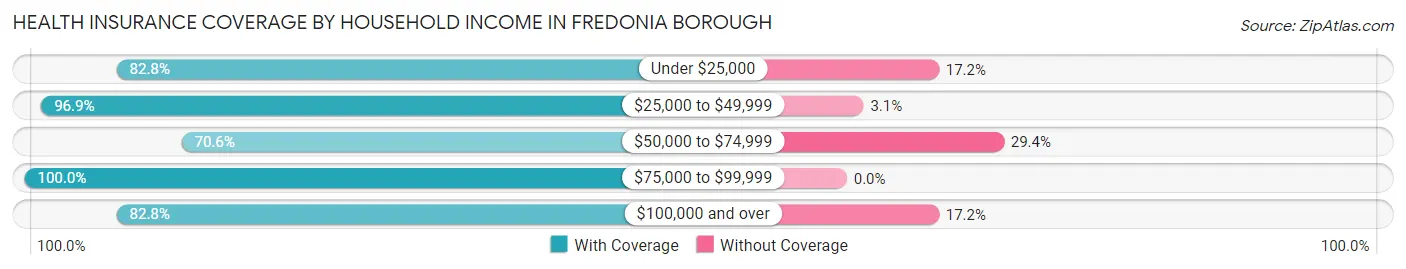
| Household Income | With Coverage | Without Coverage |
| Under $25,000 | 48 (82.8%) | 10 (17.2%) |
| $25,000 to $49,999 | 93 (96.9%) | 3 (3.1%) |
| $50,000 to $74,999 | 36 (70.6%) | 15 (29.4%) |
| $75,000 to $99,999 | 47 (100.0%) | 0 (0.0%) |
| $100,000 and over | 96 (82.8%) | 20 (17.2%) |
Public vs Private Health Insurance Coverage by Age in Fredonia borough
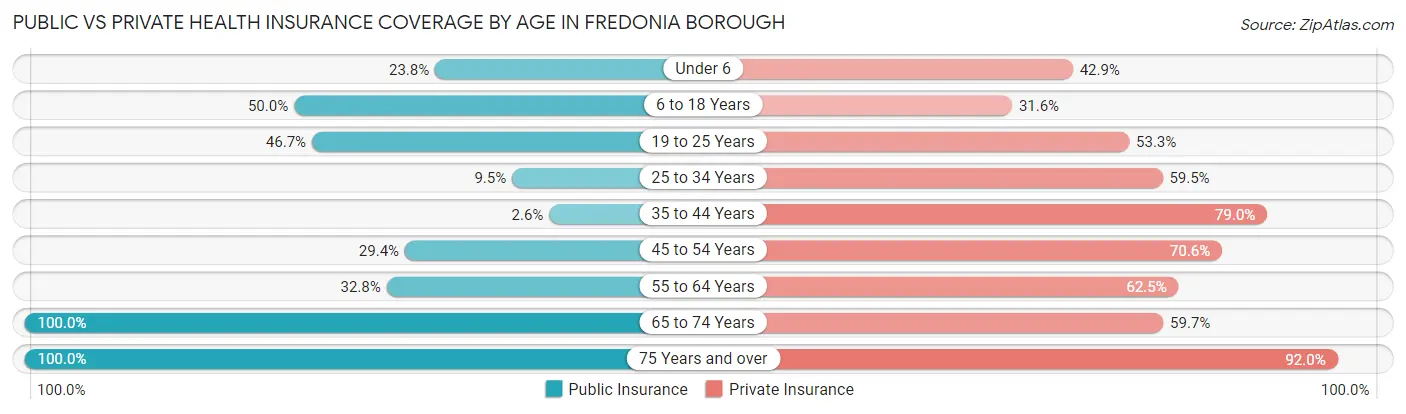
| Age Bracket | Public Insurance | Private Insurance |
| Under 6 | 5 (23.8%) | 9 (42.9%) |
| 6 to 18 Years | 19 (50.0%) | 12 (31.6%) |
| 19 to 25 Years | 7 (46.7%) | 8 (53.3%) |
| 25 to 34 Years | 4 (9.5%) | 25 (59.5%) |
| 35 to 44 Years | 1 (2.6%) | 30 (78.9%) |
| 45 to 54 Years | 20 (29.4%) | 48 (70.6%) |
| 55 to 64 Years | 21 (32.8%) | 40 (62.5%) |
| 65 to 74 Years | 57 (100.0%) | 34 (59.7%) |
| 75 Years and over | 25 (100.0%) | 23 (92.0%) |
| Total | 159 (43.2%) | 229 (62.2%) |
Disability Status by Sex by Age in Fredonia borough
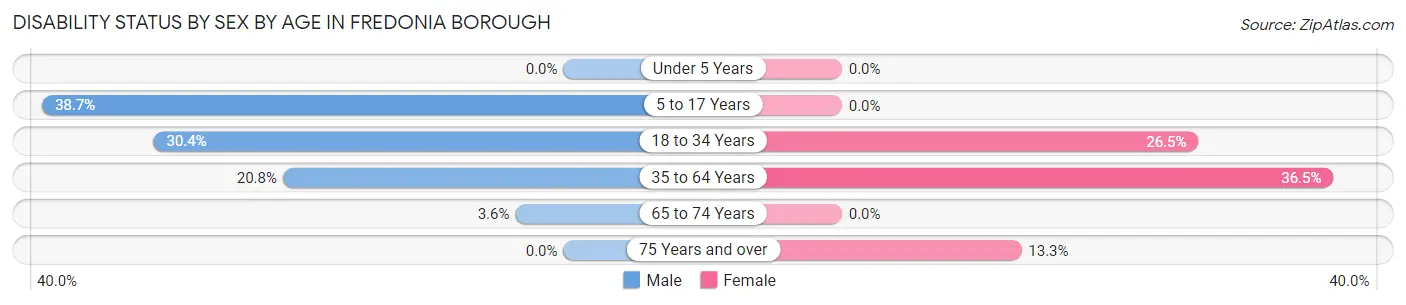
| Age Bracket | Male | Female |
| Under 5 Years | 0 (0.0%) | 0 (0.0%) |
| 5 to 17 Years | 12 (38.7%) | 0 (0.0%) |
| 18 to 34 Years | 7 (30.4%) | 9 (26.5%) |
| 35 to 64 Years | 20 (20.8%) | 27 (36.5%) |
| 65 to 74 Years | 1 (3.6%) | 0 (0.0%) |
| 75 Years and over | 0 (0.0%) | 2 (13.3%) |
Disability Class by Sex by Age in Fredonia borough
Disability Class: Hearing Difficulty
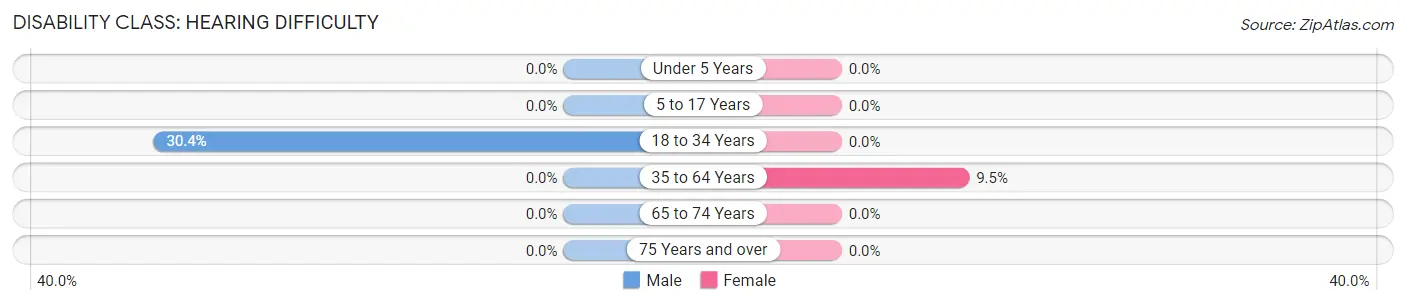
| Age Bracket | Male | Female |
| Under 5 Years | 0 (0.0%) | 0 (0.0%) |
| 5 to 17 Years | 0 (0.0%) | 0 (0.0%) |
| 18 to 34 Years | 7 (30.4%) | 0 (0.0%) |
| 35 to 64 Years | 0 (0.0%) | 7 (9.5%) |
| 65 to 74 Years | 0 (0.0%) | 0 (0.0%) |
| 75 Years and over | 0 (0.0%) | 0 (0.0%) |
Disability Class: Vision Difficulty
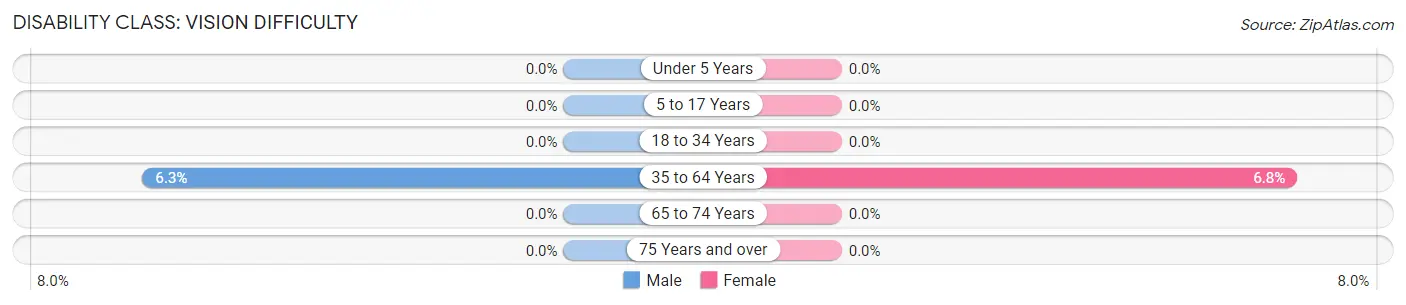
| Age Bracket | Male | Female |
| Under 5 Years | 0 (0.0%) | 0 (0.0%) |
| 5 to 17 Years | 0 (0.0%) | 0 (0.0%) |
| 18 to 34 Years | 0 (0.0%) | 0 (0.0%) |
| 35 to 64 Years | 6 (6.2%) | 5 (6.8%) |
| 65 to 74 Years | 0 (0.0%) | 0 (0.0%) |
| 75 Years and over | 0 (0.0%) | 0 (0.0%) |
Disability Class: Cognitive Difficulty
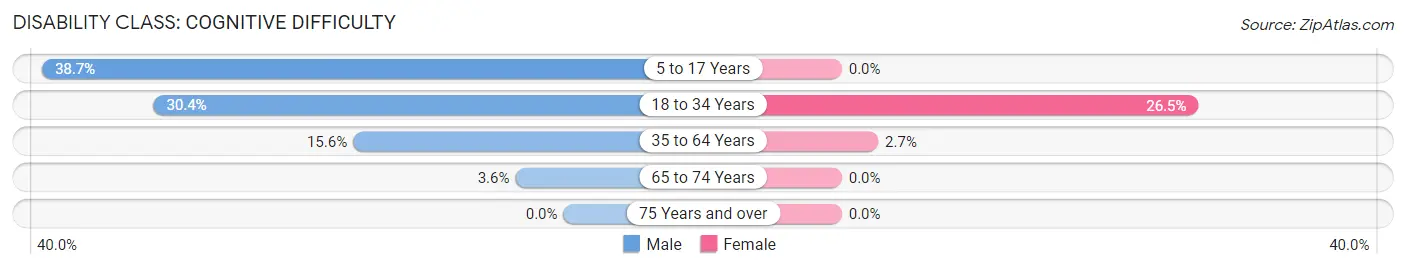
| Age Bracket | Male | Female |
| 5 to 17 Years | 12 (38.7%) | 0 (0.0%) |
| 18 to 34 Years | 7 (30.4%) | 9 (26.5%) |
| 35 to 64 Years | 15 (15.6%) | 2 (2.7%) |
| 65 to 74 Years | 1 (3.6%) | 0 (0.0%) |
| 75 Years and over | 0 (0.0%) | 0 (0.0%) |
Disability Class: Ambulatory Difficulty
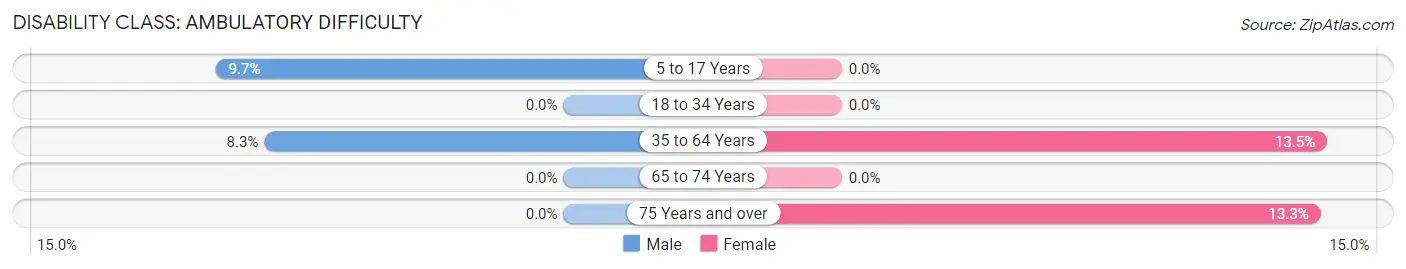
| Age Bracket | Male | Female |
| 5 to 17 Years | 3 (9.7%) | 0 (0.0%) |
| 18 to 34 Years | 0 (0.0%) | 0 (0.0%) |
| 35 to 64 Years | 8 (8.3%) | 10 (13.5%) |
| 65 to 74 Years | 0 (0.0%) | 0 (0.0%) |
| 75 Years and over | 0 (0.0%) | 2 (13.3%) |
Disability Class: Self-Care Difficulty
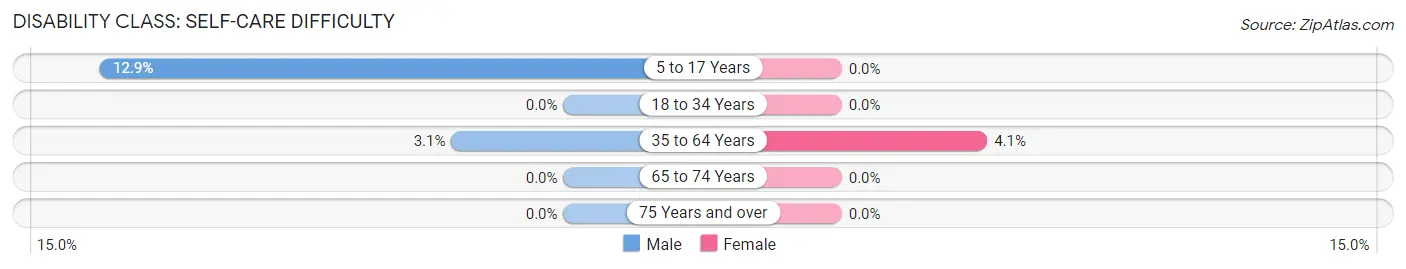
| Age Bracket | Male | Female |
| 5 to 17 Years | 4 (12.9%) | 0 (0.0%) |
| 18 to 34 Years | 0 (0.0%) | 0 (0.0%) |
| 35 to 64 Years | 3 (3.1%) | 3 (4.1%) |
| 65 to 74 Years | 0 (0.0%) | 0 (0.0%) |
| 75 Years and over | 0 (0.0%) | 0 (0.0%) |
Technology Access in Fredonia borough
Computing Device Access in Fredonia borough
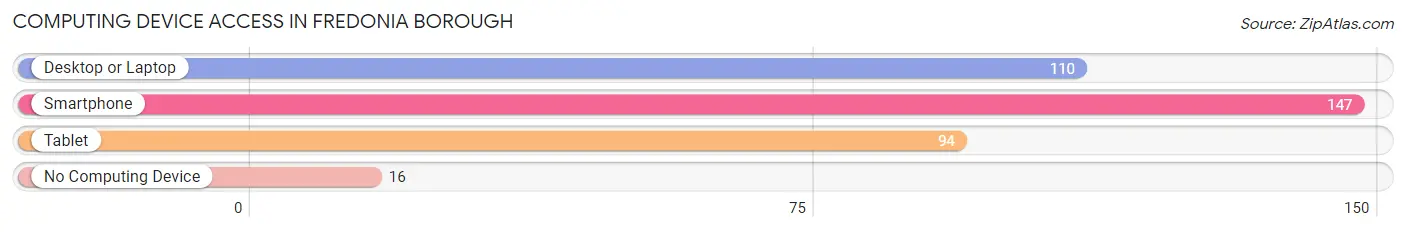
| Device Type | # Households | % Households |
| Desktop or Laptop | 110 | 59.8% |
| Smartphone | 147 | 79.9% |
| Tablet | 94 | 51.1% |
| No Computing Device | 16 | 8.7% |
| Total | 184 | 100.0% |
Internet Access in Fredonia borough
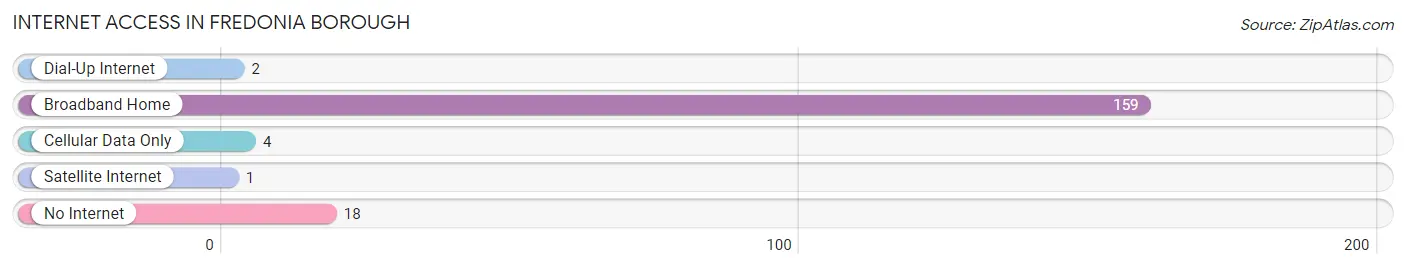
| Internet Type | # Households | % Households |
| Dial-Up Internet | 2 | 1.1% |
| Broadband Home | 159 | 86.4% |
| Cellular Data Only | 4 | 2.2% |
| Satellite Internet | 1 | 0.5% |
| No Internet | 18 | 9.8% |
| Total | 184 | 100.0% |
Fredonia borough Summary
Fredonia Borough is a small borough located in Butler County, Pennsylvania. It is situated in the western part of the state, approximately 30 miles north of Pittsburgh. The borough is home to a population of approximately 1,400 people, and is part of the larger Butler Metropolitan Statistical Area.
History
Fredonia Borough was founded in 1832 by a group of settlers from Fredonia, New York. The settlers were attracted to the area due to its fertile soil and abundant natural resources. The borough was officially incorporated in 1845, and was named after the town in New York from which the settlers had come.
In the late 19th century, Fredonia Borough experienced a period of rapid growth and development. The borough was home to a number of industries, including a brickyard, a sawmill, and a flour mill. The borough also had a number of stores, churches, and schools.
Geography
Fredonia Borough is located in western Pennsylvania, approximately 30 miles north of Pittsburgh. The borough is situated in the Allegheny Plateau region of the state, and is surrounded by rolling hills and forests. The borough is located on the banks of the Connoquenessing Creek, which flows through the center of the borough.
The borough has a total area of 1.2 square miles, all of which is land. The borough is located in the Eastern Time Zone, and observes Daylight Saving Time.
Economy
Fredonia Borough has a diverse economy, with a number of industries and businesses located in the borough. The borough is home to a number of manufacturing companies, including a plastics manufacturer, a metal fabricator, and a machine shop. The borough also has a number of retail stores, restaurants, and other businesses.
The borough is also home to a number of educational institutions, including a public school district and a community college. The borough is also home to a number of churches, and is served by a number of public transportation services.
Demographics
As of the 2010 census, Fredonia Borough had a population of 1,400 people. The racial makeup of the borough was 97.4% White, 0.7% African American, 0.1% Native American, 0.3% Asian, and 1.5% from other races. The median household income in the borough was $41,250, and the median family income was $50,000.
The borough is served by a number of public transportation services, including bus and rail. The borough is also served by a number of highways, including Interstate 79 and Pennsylvania Route 8. The borough is served by the Butler County Airport, which is located approximately 10 miles away.
Common Questions
What is Per Capita Income in Fredonia borough?
Per Capita income in Fredonia borough is $30,238.
What is the Median Family Income in Fredonia borough?
Median Family Income in Fredonia borough is $83,750.
What is the Median Household income in Fredonia borough?
Median Household Income in Fredonia borough is $47,292.
What is Income or Wage Gap in Fredonia borough?
Income or Wage Gap in Fredonia borough is 11.9%.
Women in Fredonia borough earn 88.1 cents for every dollar earned by a man.
What is Inequality or Gini Index in Fredonia borough?
Inequality or Gini Index in Fredonia borough is 0.36.
What is the Total Population of Fredonia borough?
Total Population of Fredonia borough is 368.
What is the Total Male Population of Fredonia borough?
Total Male Population of Fredonia borough is 195.
What is the Total Female Population of Fredonia borough?
Total Female Population of Fredonia borough is 173.
What is the Ratio of Males per 100 Females in Fredonia borough?
There are 112.72 Males per 100 Females in Fredonia borough.
What is the Ratio of Females per 100 Males in Fredonia borough?
There are 88.72 Females per 100 Males in Fredonia borough.
What is the Median Population Age in Fredonia borough?
Median Population Age in Fredonia borough is 51.7 Years.
What is the Average Family Size in Fredonia borough
Average Family Size in Fredonia borough is 2.7 People.
What is the Average Household Size in Fredonia borough
Average Household Size in Fredonia borough is 2.0 People.
How Large is the Labor Force in Fredonia borough?
There are 194 People in the Labor Forcein in Fredonia borough.
What is the Percentage of People in the Labor Force in Fredonia borough?
62.2% of People are in the Labor Force in Fredonia borough.