Arnot, PA Map & Demographics
Arnot Map
Arnot Overview
$36,096
PER CAPITA INCOME
$93,958
AVG FAMILY INCOME
$86,250
AVG HOUSEHOLD INCOME
73.5%
WAGE / INCOME GAP [ % ]
26.5¢/ $1
WAGE / INCOME GAP [ $ ]
$13,671
FAMILY INCOME DEFICIT
0.34
INEQUALITY / GINI INDEX
476
TOTAL POPULATION
229
MALE POPULATION
247
FEMALE POPULATION
92.71
MALES / 100 FEMALES
107.86
FEMALES / 100 MALES
55.5
MEDIAN AGE
3.2
AVG FAMILY SIZE
2.7
AVG HOUSEHOLD SIZE
249
LABOR FORCE [ PEOPLE ]
58.7%
PERCENT IN LABOR FORCE
4.8%
UNEMPLOYMENT RATE
Arnot Zip Codes
Arnot Area Codes
Income in Arnot
Income Overview in Arnot
Per Capita Income in Arnot is $36,096, while median incomes of families and households are $93,958 and $86,250 respectively.
| Characteristic | Number | Measure |
| Per Capita Income | 476 | $36,096 |
| Median Family Income | 130 | $93,958 |
| Mean Family Income | 130 | $100,153 |
| Median Household Income | 175 | $86,250 |
| Mean Household Income | 175 | $86,473 |
| Income Deficit | 130 | $13,671 |
| Wage / Income Gap (%) | 476 | 73.51% |
| Wage / Income Gap ($) | 476 | 26.49¢ per $1 |
| Gini / Inequality Index | 476 | 0.34 |
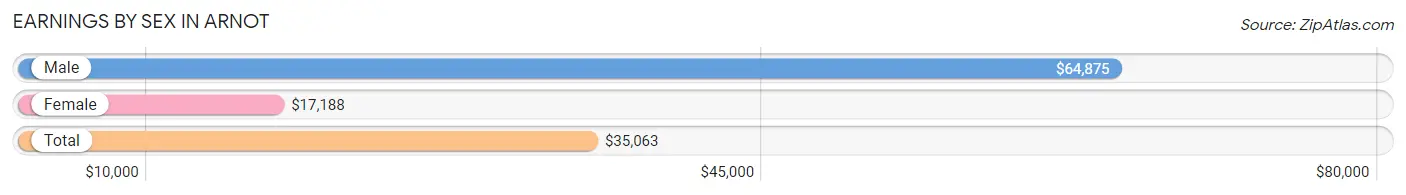
Earnings by Sex in Arnot
Average Earnings in Arnot are $35,063, $64,875 for men and $17,188 for women, a difference of 73.5%.
| Sex | Number | Average Earnings |
| Male | 111 (43.9%) | $64,875 |
| Female | 142 (56.1%) | $17,188 |
| Total | 253 (100.0%) | $35,063 |
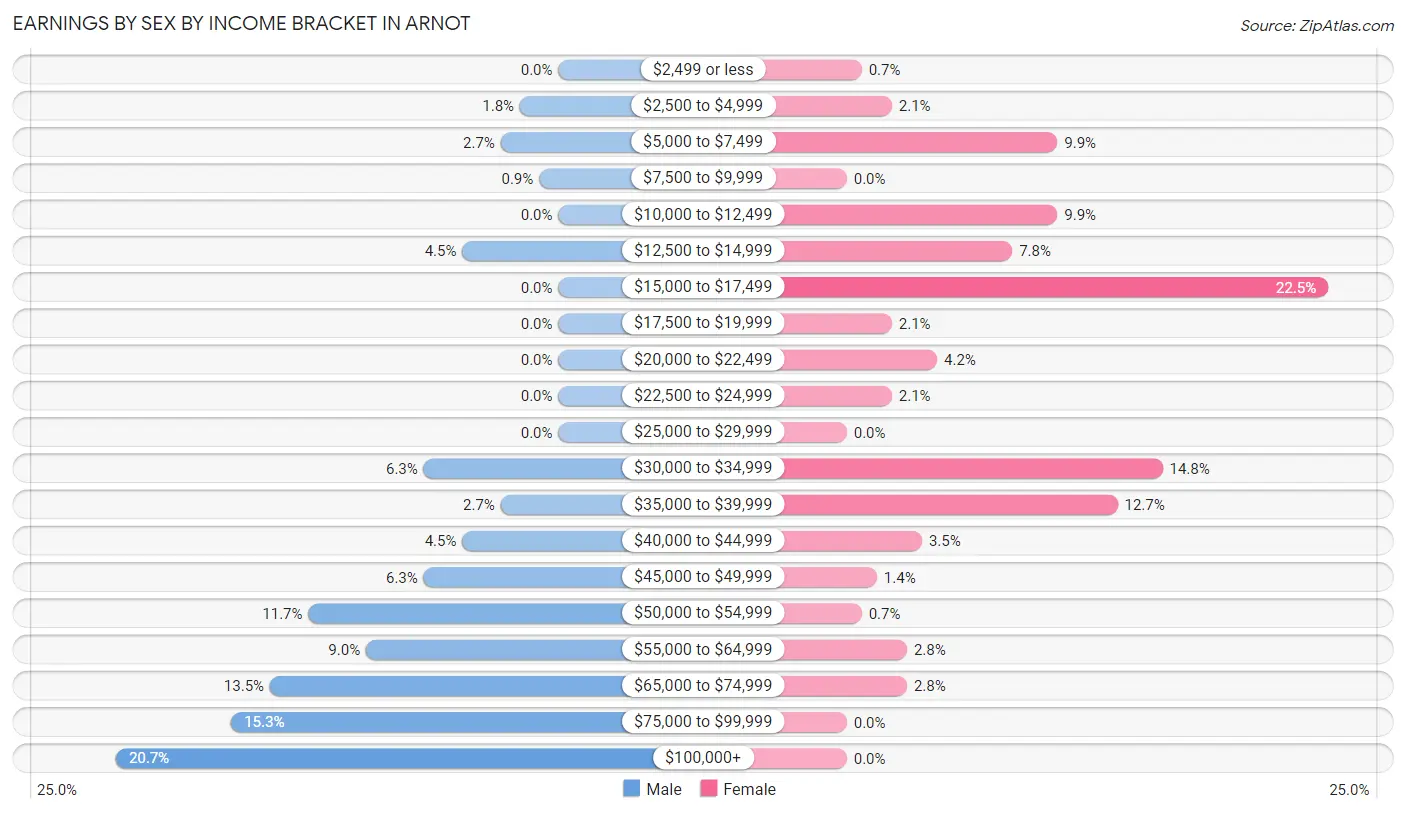
Earnings by Sex by Income Bracket in Arnot
The most common earnings brackets in Arnot are $100,000+ for men (23 | 20.7%) and $15,000 to $17,499 for women (32 | 22.5%).
| Income | Male | Female |
| $2,499 or less | 0 (0.0%) | 1 (0.7%) |
| $2,500 to $4,999 | 2 (1.8%) | 3 (2.1%) |
| $5,000 to $7,499 | 3 (2.7%) | 14 (9.9%) |
| $7,500 to $9,999 | 1 (0.9%) | 0 (0.0%) |
| $10,000 to $12,499 | 0 (0.0%) | 14 (9.9%) |
| $12,500 to $14,999 | 5 (4.5%) | 11 (7.7%) |
| $15,000 to $17,499 | 0 (0.0%) | 32 (22.5%) |
| $17,500 to $19,999 | 0 (0.0%) | 3 (2.1%) |
| $20,000 to $22,499 | 0 (0.0%) | 6 (4.2%) |
| $22,500 to $24,999 | 0 (0.0%) | 3 (2.1%) |
| $25,000 to $29,999 | 0 (0.0%) | 0 (0.0%) |
| $30,000 to $34,999 | 7 (6.3%) | 21 (14.8%) |
| $35,000 to $39,999 | 3 (2.7%) | 18 (12.7%) |
| $40,000 to $44,999 | 5 (4.5%) | 5 (3.5%) |
| $45,000 to $49,999 | 7 (6.3%) | 2 (1.4%) |
| $50,000 to $54,999 | 13 (11.7%) | 1 (0.7%) |
| $55,000 to $64,999 | 10 (9.0%) | 4 (2.8%) |
| $65,000 to $74,999 | 15 (13.5%) | 4 (2.8%) |
| $75,000 to $99,999 | 17 (15.3%) | 0 (0.0%) |
| $100,000+ | 23 (20.7%) | 0 (0.0%) |
| Total | 111 (100.0%) | 142 (100.0%) |
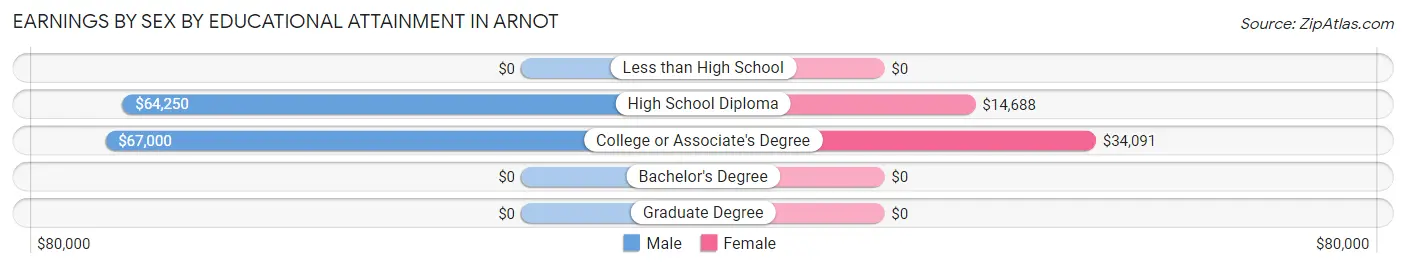
Earnings by Sex by Educational Attainment in Arnot
Average earnings in Arnot are $65,288 for men and $31,250 for women, a difference of 52.1%. Men with an educational attainment of college or associate's degree enjoy the highest average annual earnings of $67,000, while those with high school diploma education earn the least with $64,250. Women with an educational attainment of college or associate's degree earn the most with the average annual earnings of $34,091, while those with high school diploma education have the smallest earnings of $14,688.
| Educational Attainment | Male Income | Female Income |
| Less than High School | - | - |
| High School Diploma | $64,250 | $14,688 |
| College or Associate's Degree | $67,000 | $34,091 |
| Bachelor's Degree | - | - |
| Graduate Degree | - | - |
| Total | $65,288 | $31,250 |
Family Income in Arnot
Family Income Brackets in Arnot
According to the Arnot family income data, there are 46 families falling into the $100,000 to $149,999 income range, which is the most common income bracket and makes up 35.4% of all families. Conversely, the less than $10,000 income bracket is the least frequent group with only 2 families (1.5%) belonging to this category.
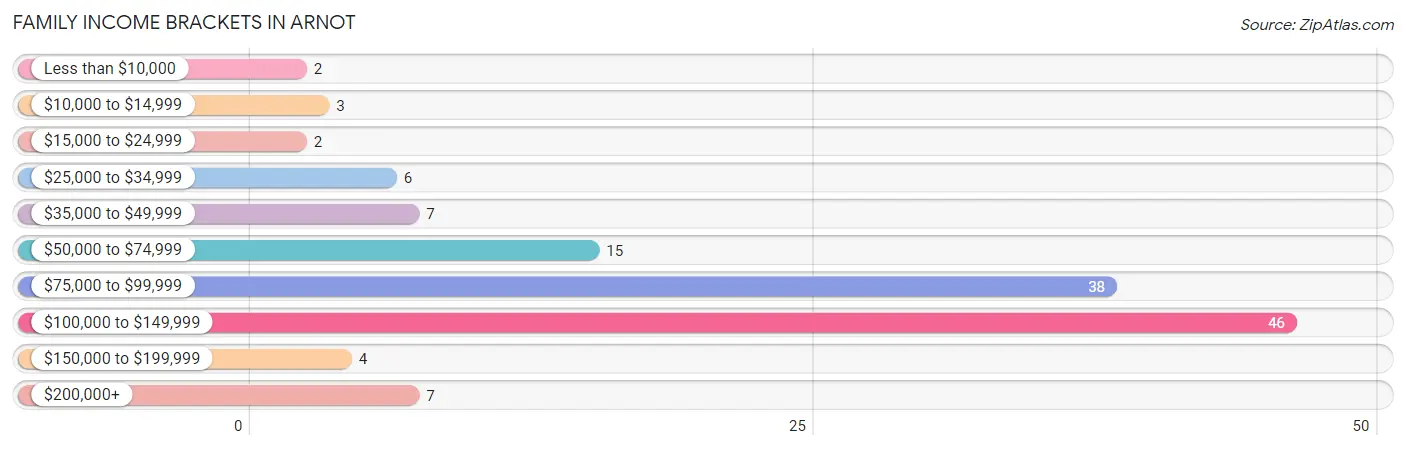
| Income Bracket | # Families | % Families |
| Less than $10,000 | 2 | 1.5% |
| $10,000 to $14,999 | 3 | 2.3% |
| $15,000 to $24,999 | 2 | 1.5% |
| $25,000 to $34,999 | 6 | 4.6% |
| $35,000 to $49,999 | 7 | 5.4% |
| $50,000 to $74,999 | 15 | 11.5% |
| $75,000 to $99,999 | 38 | 29.2% |
| $100,000 to $149,999 | 46 | 35.4% |
| $150,000 to $199,999 | 4 | 3.1% |
| $200,000+ | 7 | 5.4% |
Family Income by Famaliy Size in Arnot
3-person families (53 | 40.8%) account for the highest median family income in Arnot with $94,688 per family, while 2-person families (48 | 36.9%) have the highest median income of $45,000 per family member.
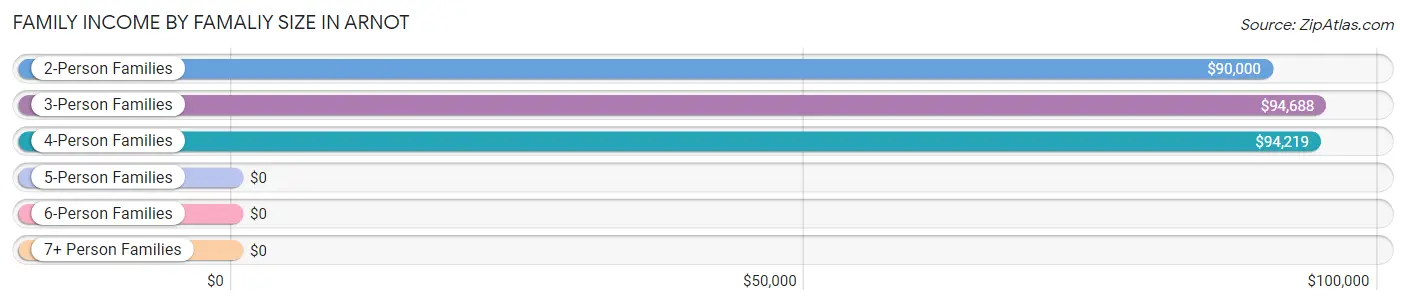
| Income Bracket | # Families | Median Income |
| 2-Person Families | 48 (36.9%) | $90,000 |
| 3-Person Families | 53 (40.8%) | $94,688 |
| 4-Person Families | 25 (19.2%) | $94,219 |
| 5-Person Families | 4 (3.1%) | $0 |
| 6-Person Families | 0 (0.0%) | $0 |
| 7+ Person Families | 0 (0.0%) | $0 |
| Total | 130 (100.0%) | $93,958 |
Family Income by Number of Earners in Arnot
The median family income in Arnot is $93,958, with families comprising no earners (37) having the highest median family income of $103,472, while families with 1 earner (21) have the lowest median family income of $44,375, accounting for 28.5% and 16.2% of families, respectively.
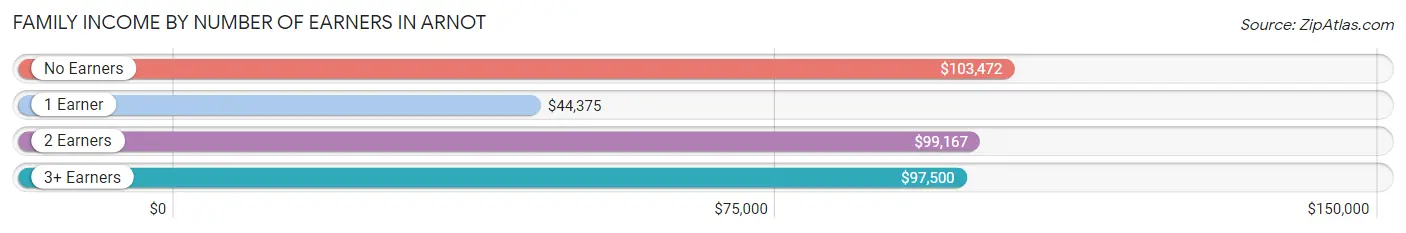
| Number of Earners | # Families | Median Income |
| No Earners | 37 (28.5%) | $103,472 |
| 1 Earner | 21 (16.2%) | $44,375 |
| 2 Earners | 50 (38.5%) | $99,167 |
| 3+ Earners | 22 (16.9%) | $97,500 |
| Total | 130 (100.0%) | $93,958 |
Household Income in Arnot
Household Income Brackets in Arnot
With 48 households falling in the category, the $100,000 to $149,999 income range is the most frequent in Arnot, accounting for 27.4% of all households. In contrast, only 2 households (1.1%) fall into the $25,000 to $34,999 income bracket, making it the least populous group.
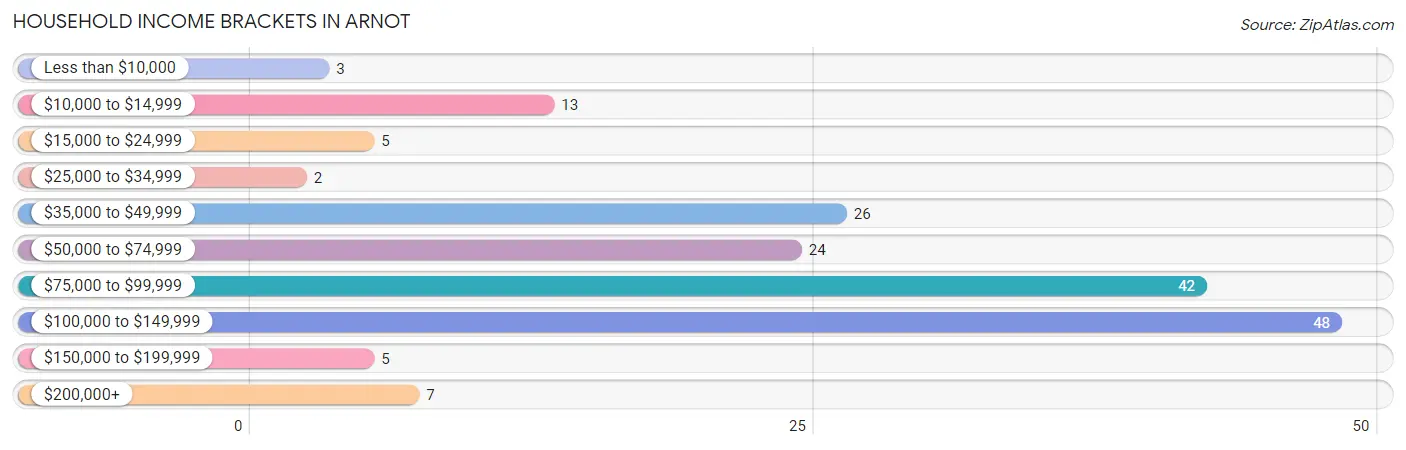
| Income Bracket | # Households | % Households |
| Less than $10,000 | 3 | 1.7% |
| $10,000 to $14,999 | 13 | 7.4% |
| $15,000 to $24,999 | 5 | 2.9% |
| $25,000 to $34,999 | 2 | 1.1% |
| $35,000 to $49,999 | 26 | 14.9% |
| $50,000 to $74,999 | 24 | 13.7% |
| $75,000 to $99,999 | 42 | 24.0% |
| $100,000 to $149,999 | 48 | 27.4% |
| $150,000 to $199,999 | 5 | 2.9% |
| $200,000+ | 7 | 4.0% |
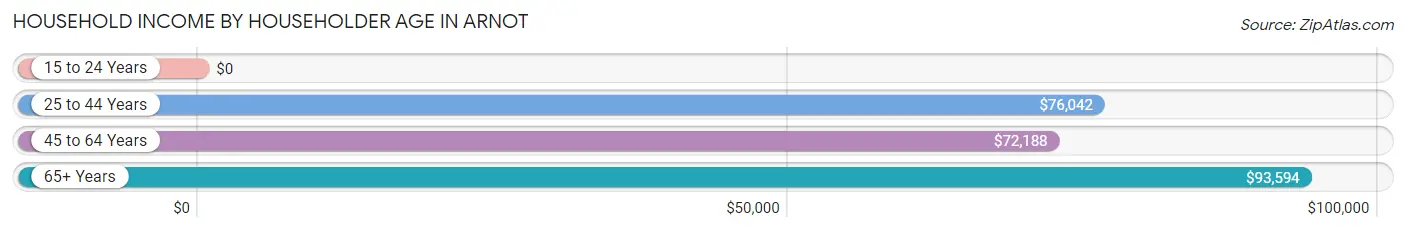
Household Income by Householder Age in Arnot
The median household income in Arnot is $86,250, with the highest median household income of $93,594 found in the 65+ years age bracket for the primary householder. A total of 77 households (44.0%) fall into this category.
| Income Bracket | # Households | Median Income |
| 15 to 24 Years | 0 (0.0%) | $0 |
| 25 to 44 Years | 37 (21.1%) | $76,042 |
| 45 to 64 Years | 61 (34.9%) | $72,188 |
| 65+ Years | 77 (44.0%) | $93,594 |
| Total | 175 (100.0%) | $86,250 |
Poverty in Arnot
Income Below Poverty by Sex and Age in Arnot
With 7.0% poverty level for males and 9.3% for females among the residents of Arnot, 15 year old males and under 5 year old females are the most vulnerable to poverty, with 3 males (60.0%) and 6 females (54.5%) in their respective age groups living below the poverty level.
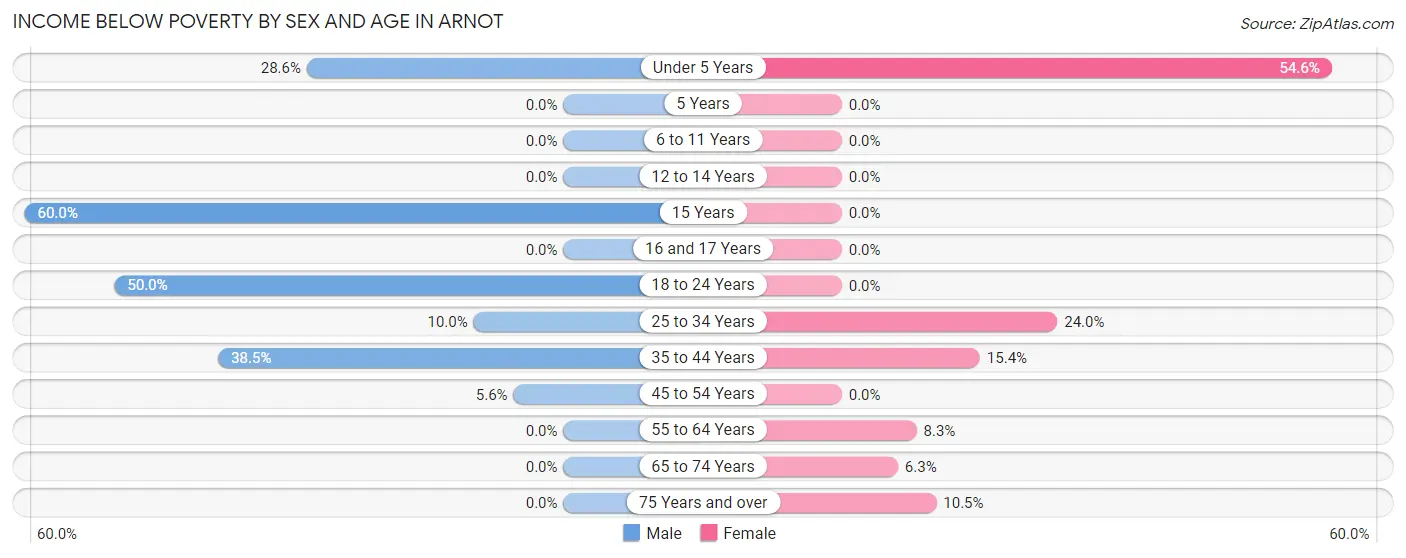
| Age Bracket | Male | Female |
| Under 5 Years | 2 (28.6%) | 6 (54.5%) |
| 5 Years | 0 (0.0%) | 0 (0.0%) |
| 6 to 11 Years | 0 (0.0%) | 0 (0.0%) |
| 12 to 14 Years | 0 (0.0%) | 0 (0.0%) |
| 15 Years | 3 (60.0%) | 0 (0.0%) |
| 16 and 17 Years | 0 (0.0%) | 0 (0.0%) |
| 18 to 24 Years | 2 (50.0%) | 0 (0.0%) |
| 25 to 34 Years | 2 (10.0%) | 6 (24.0%) |
| 35 to 44 Years | 5 (38.5%) | 2 (15.4%) |
| 45 to 54 Years | 2 (5.6%) | 0 (0.0%) |
| 55 to 64 Years | 0 (0.0%) | 3 (8.3%) |
| 65 to 74 Years | 0 (0.0%) | 4 (6.2%) |
| 75 Years and over | 0 (0.0%) | 2 (10.5%) |
| Total | 16 (7.0%) | 23 (9.3%) |
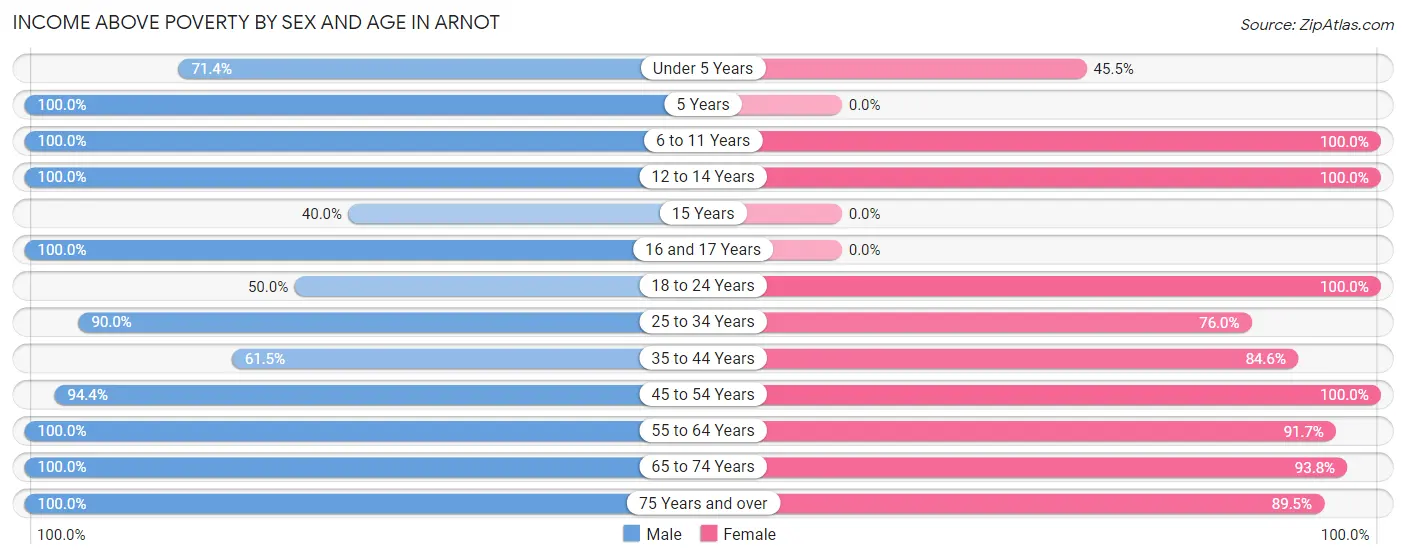
Income Above Poverty by Sex and Age in Arnot
According to the poverty statistics in Arnot, males aged 5 years and females aged 6 to 11 years are the age groups that are most secure financially, with 100.0% of males and 100.0% of females in these age groups living above the poverty line.
| Age Bracket | Male | Female |
| Under 5 Years | 5 (71.4%) | 5 (45.5%) |
| 5 Years | 2 (100.0%) | 0 (0.0%) |
| 6 to 11 Years | 3 (100.0%) | 5 (100.0%) |
| 12 to 14 Years | 2 (100.0%) | 17 (100.0%) |
| 15 Years | 2 (40.0%) | 0 (0.0%) |
| 16 and 17 Years | 13 (100.0%) | 0 (0.0%) |
| 18 to 24 Years | 2 (50.0%) | 45 (100.0%) |
| 25 to 34 Years | 18 (90.0%) | 19 (76.0%) |
| 35 to 44 Years | 8 (61.5%) | 11 (84.6%) |
| 45 to 54 Years | 34 (94.4%) | 12 (100.0%) |
| 55 to 64 Years | 30 (100.0%) | 33 (91.7%) |
| 65 to 74 Years | 60 (100.0%) | 60 (93.8%) |
| 75 Years and over | 34 (100.0%) | 17 (89.5%) |
| Total | 213 (93.0%) | 224 (90.7%) |
Income Below Poverty Among Married-Couple Families in Arnot
The poverty statistics for married-couple families in Arnot show that 6.4% or 7 of the total 109 families live below the poverty line. Families with 1 or 2 children have the highest poverty rate of 17.9%, comprising of 7 families. On the other hand, families with no children have the lowest poverty rate of 0.0%, which includes 0 families.
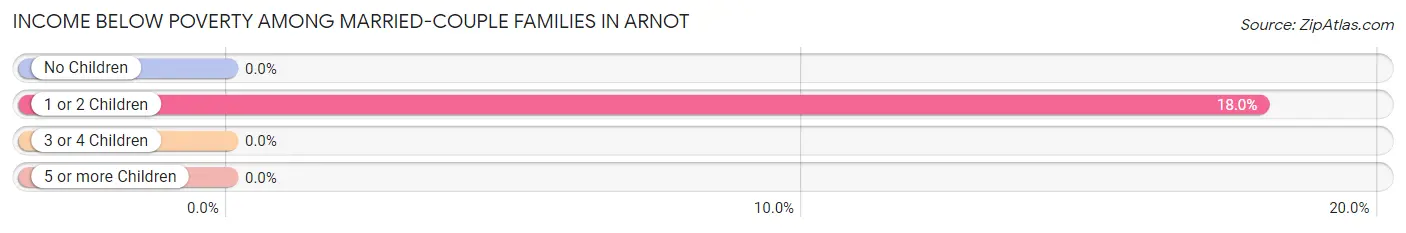
| Children | Above Poverty | Below Poverty |
| No Children | 69 (100.0%) | 0 (0.0%) |
| 1 or 2 Children | 32 (82.1%) | 7 (17.9%) |
| 3 or 4 Children | 1 (100.0%) | 0 (0.0%) |
| 5 or more Children | 0 (0.0%) | 0 (0.0%) |
| Total | 102 (93.6%) | 7 (6.4%) |
Income Below Poverty Among Single-Parent Households in Arnot
| Children | Single Father | Single Mother |
| No Children | 0 (0.0%) | 0 (0.0%) |
| 1 or 2 Children | 0 (0.0%) | 0 (0.0%) |
| 3 or 4 Children | 0 (0.0%) | 0 (0.0%) |
| 5 or more Children | 0 (0.0%) | 0 (0.0%) |
| Total | 0 (0.0%) | 0 (0.0%) |
Income Below Poverty Among Married-Couple vs Single-Parent Households in Arnot
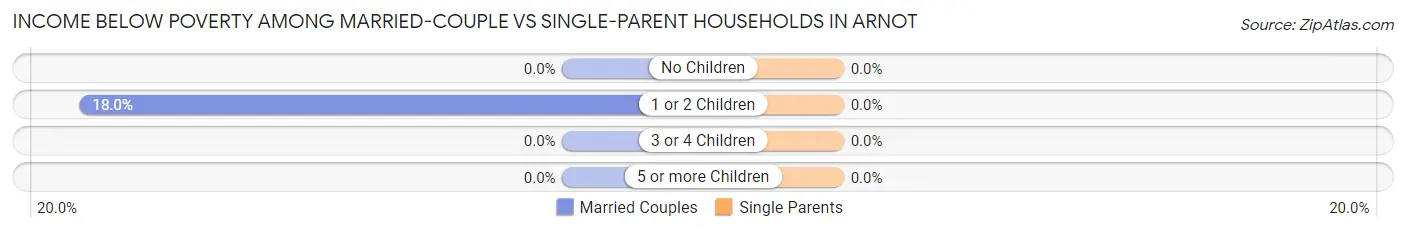
| Children | Married-Couple Families | Single-Parent Households |
| No Children | 0 (0.0%) | 0 (0.0%) |
| 1 or 2 Children | 7 (17.9%) | 0 (0.0%) |
| 3 or 4 Children | 0 (0.0%) | 0 (0.0%) |
| 5 or more Children | 0 (0.0%) | 0 (0.0%) |
| Total | 7 (6.4%) | 0 (0.0%) |
Race in Arnot
The most populous races in Arnot are White / Caucasian (470 | 98.7%), Two or more Races (6 | 1.3%), and Hispanic or Latino (2 | 0.4%).
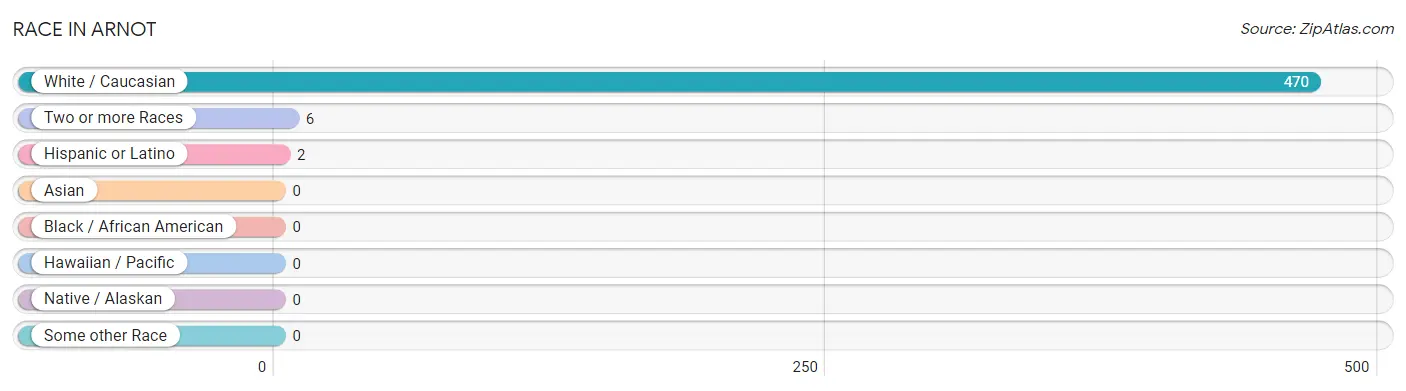
| Race | # Population | % Population |
| Asian | 0 | 0.0% |
| Black / African American | 0 | 0.0% |
| Hawaiian / Pacific | 0 | 0.0% |
| Hispanic or Latino | 2 | 0.4% |
| Native / Alaskan | 0 | 0.0% |
| White / Caucasian | 470 | 98.7% |
| Two or more Races | 6 | 1.3% |
| Some other Race | 0 | 0.0% |
| Total | 476 | 100.0% |
Ancestry in Arnot
The most populous ancestries reported in Arnot are German (134 | 28.1%), Polish (103 | 21.6%), American (67 | 14.1%), Irish (62 | 13.0%), and English (38 | 8.0%), together accounting for 84.9% of all Arnot residents.
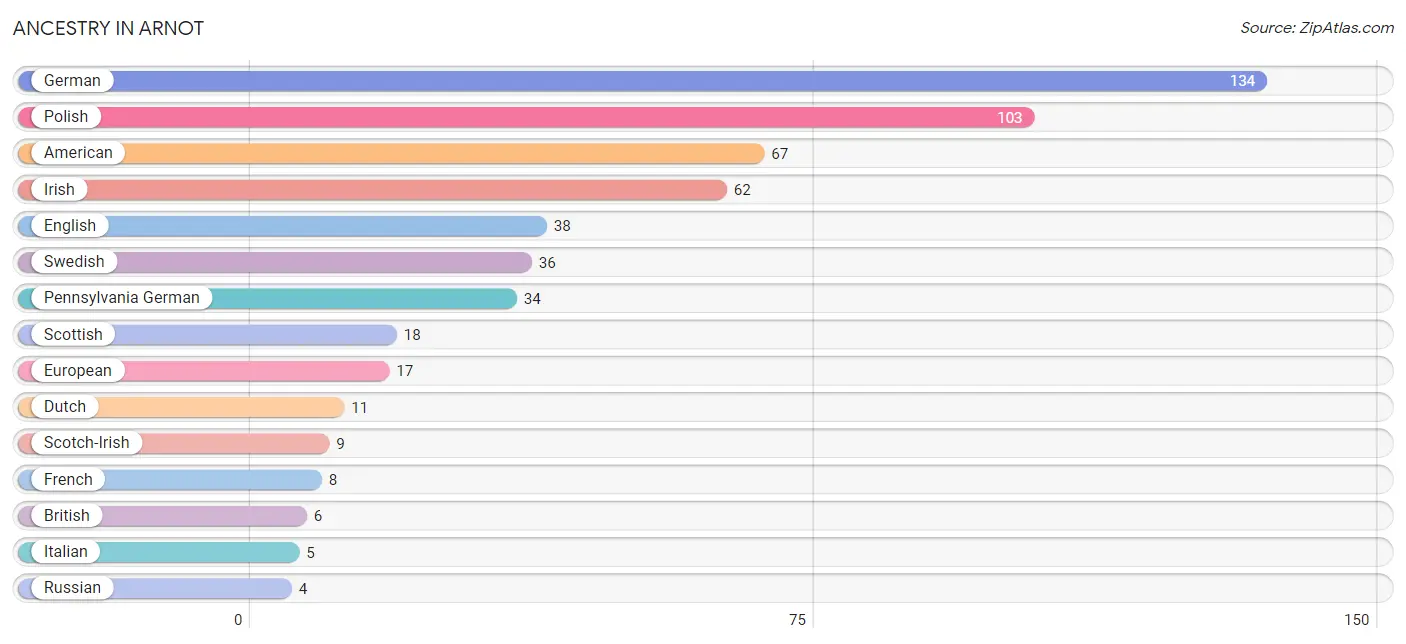
| Ancestry | # Population | % Population |
| American | 67 | 14.1% |
| British | 6 | 1.3% |
| Czech | 1 | 0.2% |
| Dutch | 11 | 2.3% |
| English | 38 | 8.0% |
| European | 17 | 3.6% |
| Finnish | 1 | 0.2% |
| French | 8 | 1.7% |
| French Canadian | 2 | 0.4% |
| German | 134 | 28.1% |
| Hungarian | 1 | 0.2% |
| Irish | 62 | 13.0% |
| Italian | 5 | 1.1% |
| Mexican | 2 | 0.4% |
| Pennsylvania German | 34 | 7.1% |
| Polish | 103 | 21.6% |
| Russian | 4 | 0.8% |
| Scotch-Irish | 9 | 1.9% |
| Scottish | 18 | 3.8% |
| Swedish | 36 | 7.6% |
| Welsh | 1 | 0.2% | View All 21 Rows |
Immigrants in Arnot
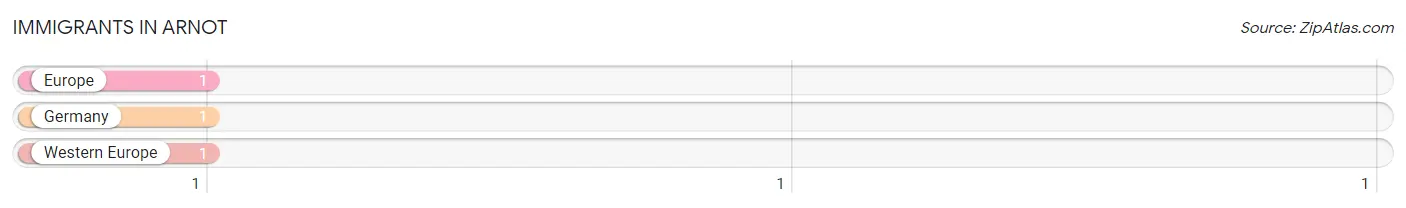
The most numerous immigrant groups reported in Arnot came from Europe (1 | 0.2%), Germany (1 | 0.2%), and Western Europe (1 | 0.2%), together accounting for 0.6% of all Arnot residents.
| Immigration Origin | # Population | % Population |
| Europe | 1 | 0.2% |
| Germany | 1 | 0.2% |
| Western Europe | 1 | 0.2% | View All 3 Rows |
Sex and Age in Arnot
Sex and Age in Arnot
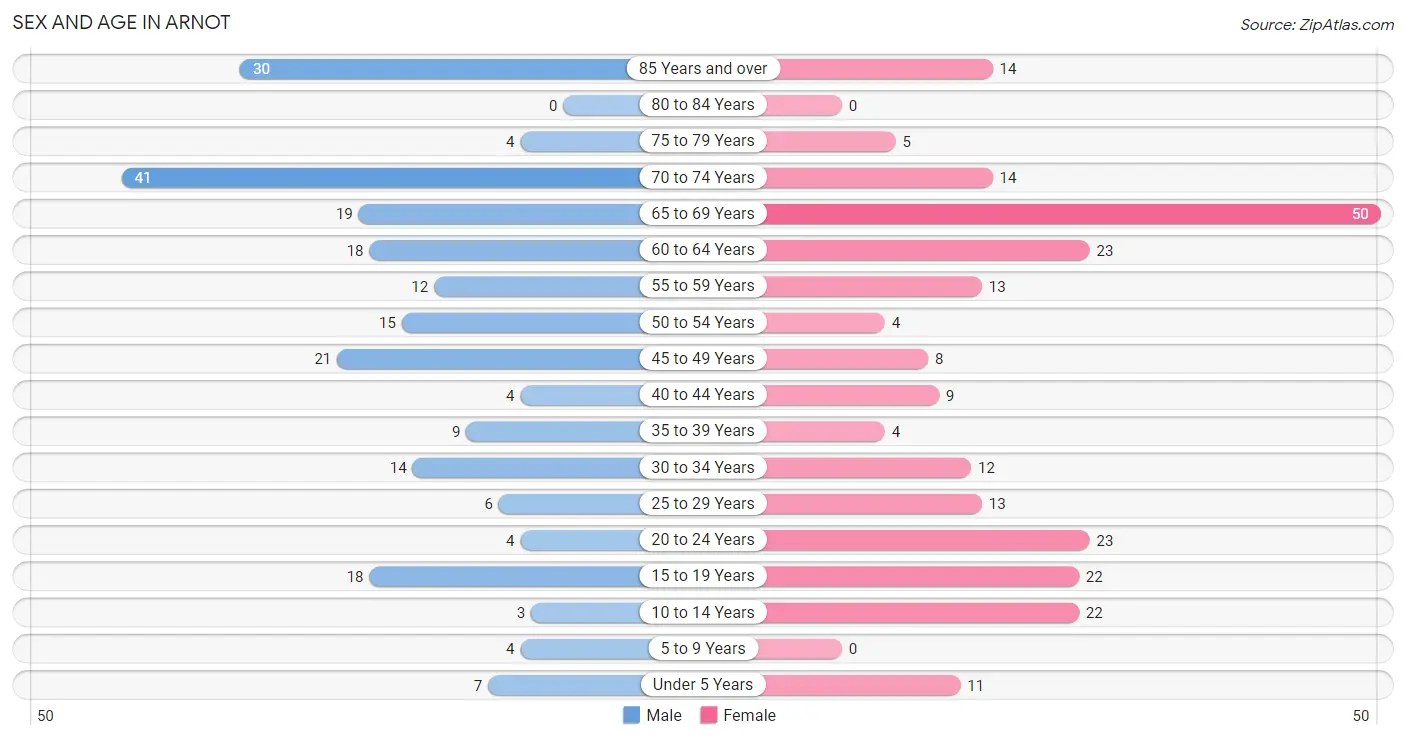
The most populous age groups in Arnot are 70 to 74 Years (41 | 17.9%) for men and 65 to 69 Years (50 | 20.2%) for women.
| Age Bracket | Male | Female |
| Under 5 Years | 7 (3.1%) | 11 (4.4%) |
| 5 to 9 Years | 4 (1.8%) | 0 (0.0%) |
| 10 to 14 Years | 3 (1.3%) | 22 (8.9%) |
| 15 to 19 Years | 18 (7.9%) | 22 (8.9%) |
| 20 to 24 Years | 4 (1.8%) | 23 (9.3%) |
| 25 to 29 Years | 6 (2.6%) | 13 (5.3%) |
| 30 to 34 Years | 14 (6.1%) | 12 (4.9%) |
| 35 to 39 Years | 9 (3.9%) | 4 (1.6%) |
| 40 to 44 Years | 4 (1.8%) | 9 (3.6%) |
| 45 to 49 Years | 21 (9.2%) | 8 (3.2%) |
| 50 to 54 Years | 15 (6.6%) | 4 (1.6%) |
| 55 to 59 Years | 12 (5.2%) | 13 (5.3%) |
| 60 to 64 Years | 18 (7.9%) | 23 (9.3%) |
| 65 to 69 Years | 19 (8.3%) | 50 (20.2%) |
| 70 to 74 Years | 41 (17.9%) | 14 (5.7%) |
| 75 to 79 Years | 4 (1.8%) | 5 (2.0%) |
| 80 to 84 Years | 0 (0.0%) | 0 (0.0%) |
| 85 Years and over | 30 (13.1%) | 14 (5.7%) |
| Total | 229 (100.0%) | 247 (100.0%) |
Families and Households in Arnot
Median Family Size in Arnot
The median family size in Arnot is 3.19 persons per family, with single male/father families (17 | 13.1%) accounting for the largest median family size of 3.41 persons per family. On the other hand, single female/mother families (4 | 3.1%) represent the smallest median family size with 2.25 persons per family.
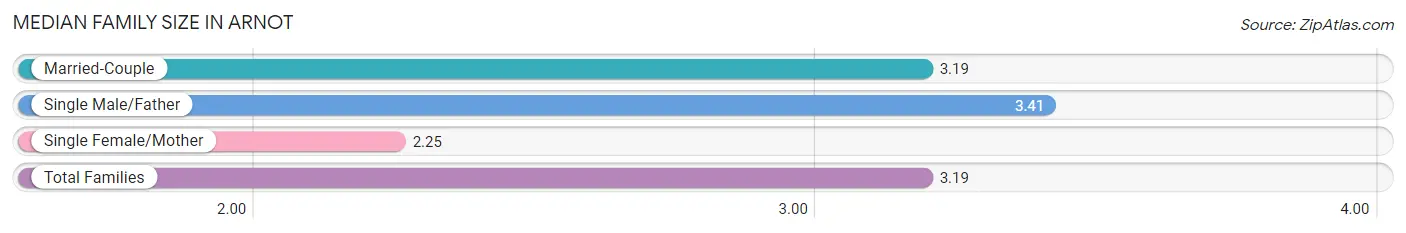
| Family Type | # Families | Family Size |
| Married-Couple | 109 (83.9%) | 3.19 |
| Single Male/Father | 17 (13.1%) | 3.41 |
| Single Female/Mother | 4 (3.1%) | 2.25 |
| Total Families | 130 (100.0%) | 3.19 |
Median Household Size in Arnot
The median household size in Arnot is 2.72 persons per household, with single male/father households (17 | 9.7%) accounting for the largest median household size of 3.82 persons per household. non-family households (45 | 25.7%) represent the smallest median household size with 1.20 persons per household.
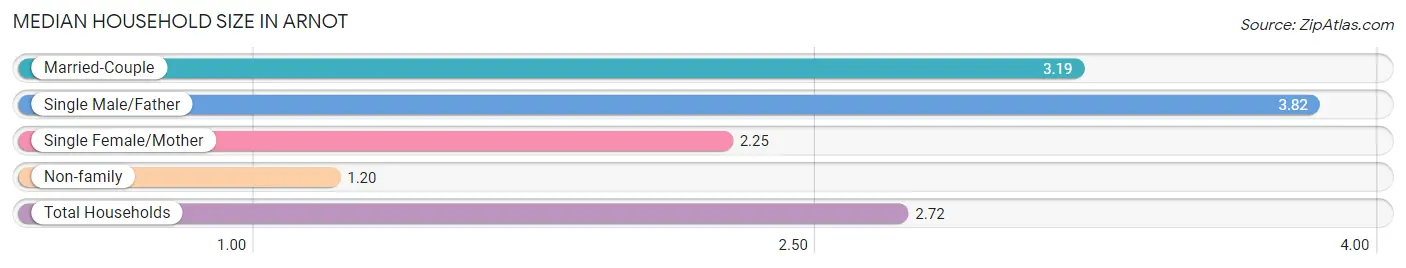
| Household Type | # Households | Household Size |
| Married-Couple | 109 (62.3%) | 3.19 |
| Single Male/Father | 17 (9.7%) | 3.82 |
| Single Female/Mother | 4 (2.3%) | 2.25 |
| Non-family | 45 (25.7%) | 1.20 |
| Total Households | 175 (100.0%) | 2.72 |
Household Size by Marriage Status in Arnot
Out of a total of 175 households in Arnot, 130 (74.3%) are family households, while 45 (25.7%) are nonfamily households. The most numerous type of family households are 2-person households, comprising 48, and the most common type of nonfamily households are 1-person households, comprising 38.
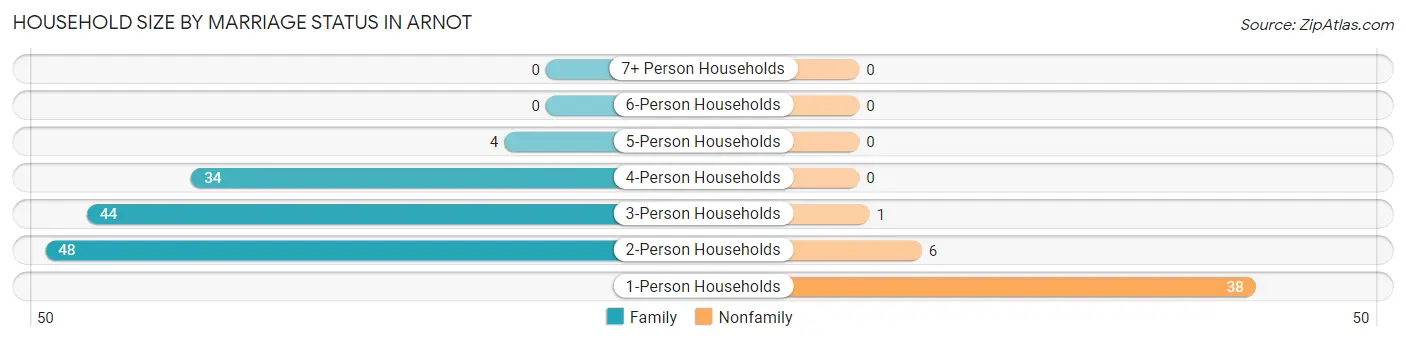
| Household Size | Family Households | Nonfamily Households |
| 1-Person Households | - | 38 (21.7%) |
| 2-Person Households | 48 (27.4%) | 6 (3.4%) |
| 3-Person Households | 44 (25.1%) | 1 (0.6%) |
| 4-Person Households | 34 (19.4%) | 0 (0.0%) |
| 5-Person Households | 4 (2.3%) | 0 (0.0%) |
| 6-Person Households | 0 (0.0%) | 0 (0.0%) |
| 7+ Person Households | 0 (0.0%) | 0 (0.0%) |
| Total | 130 (74.3%) | 45 (25.7%) |
Female Fertility in Arnot
Fertility by Age in Arnot
| Age Bracket | Women with Births | Births / 1,000 Women |
| 15 to 19 years | 0 (0.0%) | 0.0 |
| 20 to 34 years | 0 (0.0%) | 0.0 |
| 35 to 50 years | 0 (0.0%) | 0.0 |
| Total | 0 (0.0%) | 0.0 |
Fertility by Age by Marriage Status in Arnot
| Age Bracket | Married | Unmarried |
| 15 to 19 years | 0 (0.0%) | 0 (0.0%) |
| 20 to 34 years | 0 (0.0%) | 0 (0.0%) |
| 35 to 50 years | 0 (0.0%) | 0 (0.0%) |
| Total | 0 (0.0%) | 0 (0.0%) |
Fertility by Education in Arnot
| Educational Attainment | Women with Births | Births / 1,000 Women |
| Less than High School | 0 (0.0%) | 0.0 |
| High School Diploma | 0 (0.0%) | 0.0 |
| College or Associate's Degree | 0 (0.0%) | 0.0 |
| Bachelor's Degree | 0 (0.0%) | 0.0 |
| Graduate Degree | 0 (0.0%) | 0.0 |
| Total | 0 (0.0%) | 0.0 |
Fertility by Education by Marriage Status in Arnot
| Educational Attainment | Married | Unmarried |
| Less than High School | 0 (0.0%) | 0 (0.0%) |
| High School Diploma | 0 (0.0%) | 0 (0.0%) |
| College or Associate's Degree | 0 (0.0%) | 0 (0.0%) |
| Bachelor's Degree | 0 (0.0%) | 0 (0.0%) |
| Graduate Degree | 0 (0.0%) | 0 (0.0%) |
| Total | 0 (0.0%) | 0 (0.0%) |
Employment Characteristics in Arnot
Employment by Class of Employer in Arnot
Among the 233 employed individuals in Arnot, private company employees (146 | 62.7%), local government employees (33 | 14.2%), and not-for-profit organizations (25 | 10.7%) make up the most common classes of employment.
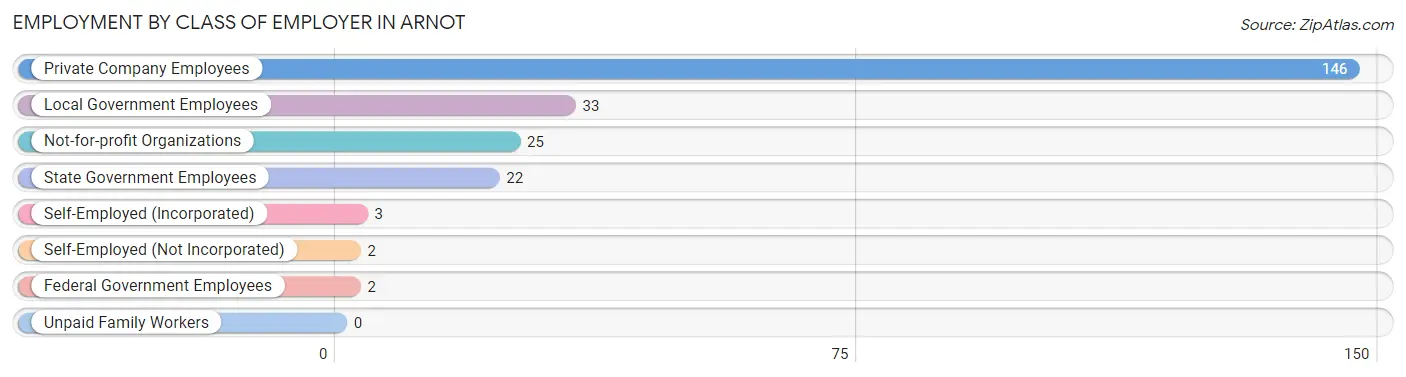
| Employer Class | # Employees | % Employees |
| Private Company Employees | 146 | 62.7% |
| Self-Employed (Incorporated) | 3 | 1.3% |
| Self-Employed (Not Incorporated) | 2 | 0.9% |
| Not-for-profit Organizations | 25 | 10.7% |
| Local Government Employees | 33 | 14.2% |
| State Government Employees | 22 | 9.4% |
| Federal Government Employees | 2 | 0.9% |
| Unpaid Family Workers | 0 | 0.0% |
| Total | 233 | 100.0% |
Employment Status by Age in Arnot
According to the labor force statistics for Arnot, out of the total population over 16 years of age (424), 58.7% or 249 individuals are in the labor force, with 4.8% or 12 of them unemployed. The age group with the highest labor force participation rate is 30 to 34 years, with 100.0% or 26 individuals in the labor force. Within the labor force, the 35 to 44 years age range has the highest percentage of unemployed individuals, with 21.1% or 4 of them being unemployed.
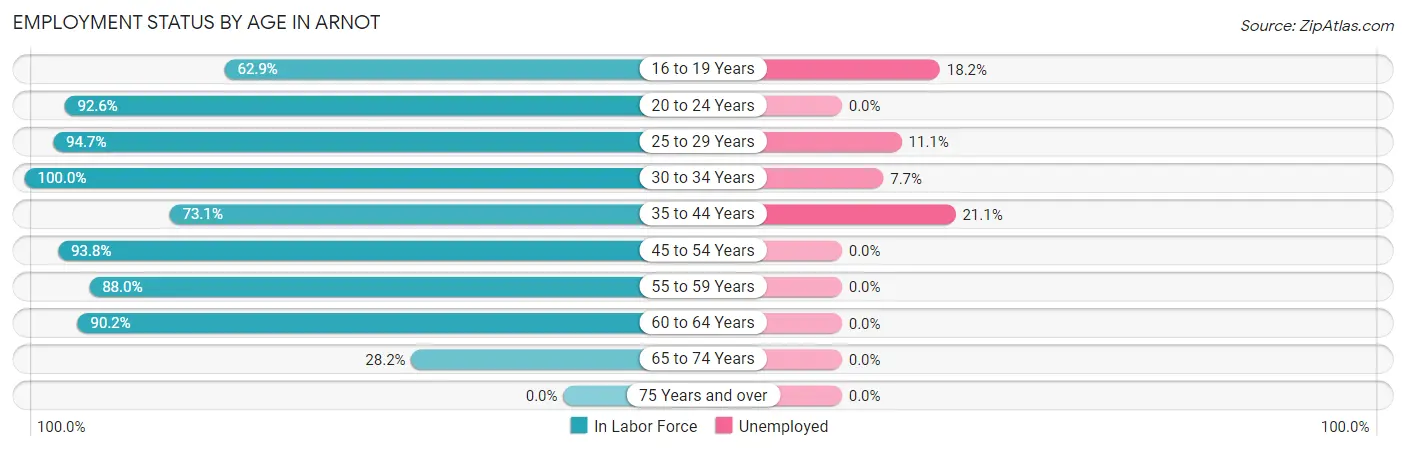
| Age Bracket | In Labor Force | Unemployed |
| 16 to 19 Years | 22 (62.9%) | 4 (18.2%) |
| 20 to 24 Years | 25 (92.6%) | 0 (0.0%) |
| 25 to 29 Years | 18 (94.7%) | 2 (11.1%) |
| 30 to 34 Years | 26 (100.0%) | 2 (7.7%) |
| 35 to 44 Years | 19 (73.1%) | 4 (21.1%) |
| 45 to 54 Years | 45 (93.8%) | 0 (0.0%) |
| 55 to 59 Years | 22 (88.0%) | 0 (0.0%) |
| 60 to 64 Years | 37 (90.2%) | 0 (0.0%) |
| 65 to 74 Years | 35 (28.2%) | 0 (0.0%) |
| 75 Years and over | 0 (0.0%) | 0 (0.0%) |
| Total | 249 (58.7%) | 12 (4.8%) |
Employment Status by Educational Attainment in Arnot
According to labor force statistics for Arnot, 90.3% of individuals (167) out of the total population between 25 and 64 years of age (185) are in the labor force, with 4.8% or 8 of them being unemployed. The group with the highest labor force participation rate are those with the educational attainment of less than high school, with 100.0% or 8 individuals in the labor force. Within the labor force, individuals with less than high school education have the highest percentage of unemployment, with 25.0% or 2 of them being unemployed.
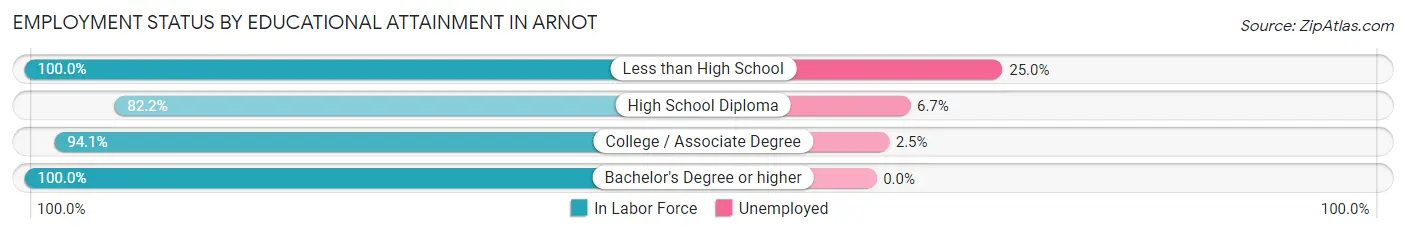
| Educational Attainment | In Labor Force | Unemployed |
| Less than High School | 8 (100.0%) | 2 (25.0%) |
| High School Diploma | 60 (82.2%) | 5 (6.7%) |
| College / Associate Degree | 80 (94.1%) | 2 (2.5%) |
| Bachelor's Degree or higher | 19 (100.0%) | 0 (0.0%) |
| Total | 167 (90.3%) | 9 (4.8%) |
Employment Occupations by Sex in Arnot
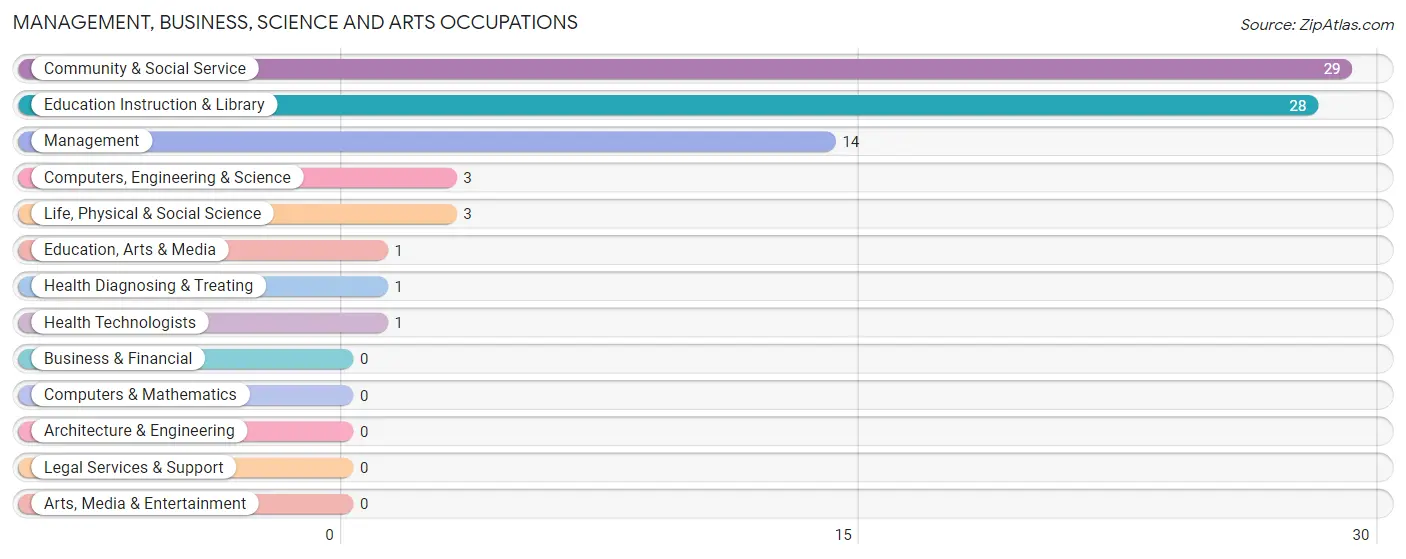
Management, Business, Science and Arts Occupations
The most common Management, Business, Science and Arts occupations in Arnot are Community & Social Service (29 | 12.2%), Education Instruction & Library (28 | 11.8%), Management (14 | 5.9%), Computers, Engineering & Science (3 | 1.3%), and Life, Physical & Social Science (3 | 1.3%).
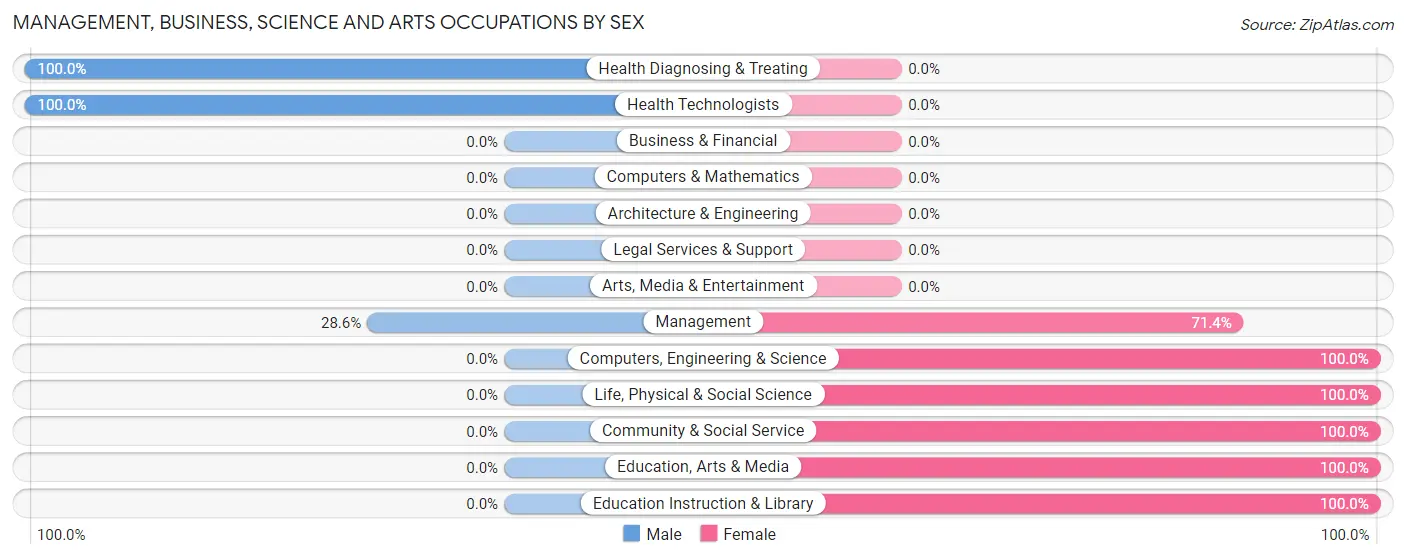
Management, Business, Science and Arts Occupations by Sex
Within the Management, Business, Science and Arts occupations in Arnot, the most male-oriented occupations are Health Diagnosing & Treating (100.0%), Health Technologists (100.0%), and Management (28.6%), while the most female-oriented occupations are Computers, Engineering & Science (100.0%), Life, Physical & Social Science (100.0%), and Community & Social Service (100.0%).
| Occupation | Male | Female |
| Management | 4 (28.6%) | 10 (71.4%) |
| Business & Financial | 0 (0.0%) | 0 (0.0%) |
| Computers, Engineering & Science | 0 (0.0%) | 3 (100.0%) |
| Computers & Mathematics | 0 (0.0%) | 0 (0.0%) |
| Architecture & Engineering | 0 (0.0%) | 0 (0.0%) |
| Life, Physical & Social Science | 0 (0.0%) | 3 (100.0%) |
| Community & Social Service | 0 (0.0%) | 29 (100.0%) |
| Education, Arts & Media | 0 (0.0%) | 1 (100.0%) |
| Legal Services & Support | 0 (0.0%) | 0 (0.0%) |
| Education Instruction & Library | 0 (0.0%) | 28 (100.0%) |
| Arts, Media & Entertainment | 0 (0.0%) | 0 (0.0%) |
| Health Diagnosing & Treating | 1 (100.0%) | 0 (0.0%) |
| Health Technologists | 1 (100.0%) | 0 (0.0%) |
| Total (Category) | 5 (10.6%) | 42 (89.4%) |
| Total (Overall) | 108 (45.6%) | 129 (54.4%) |
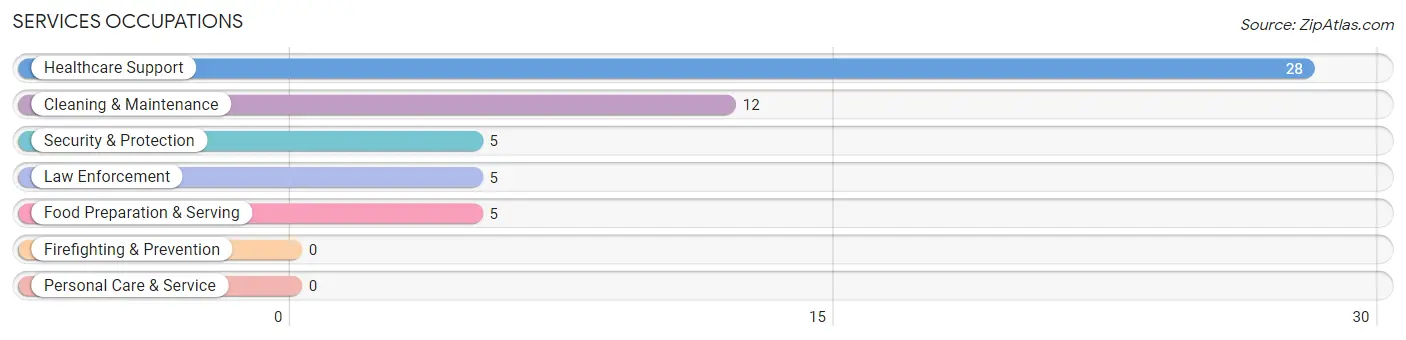
Services Occupations
The most common Services occupations in Arnot are Healthcare Support (28 | 11.8%), Cleaning & Maintenance (12 | 5.1%), Security & Protection (5 | 2.1%), Law Enforcement (5 | 2.1%), and Food Preparation & Serving (5 | 2.1%).
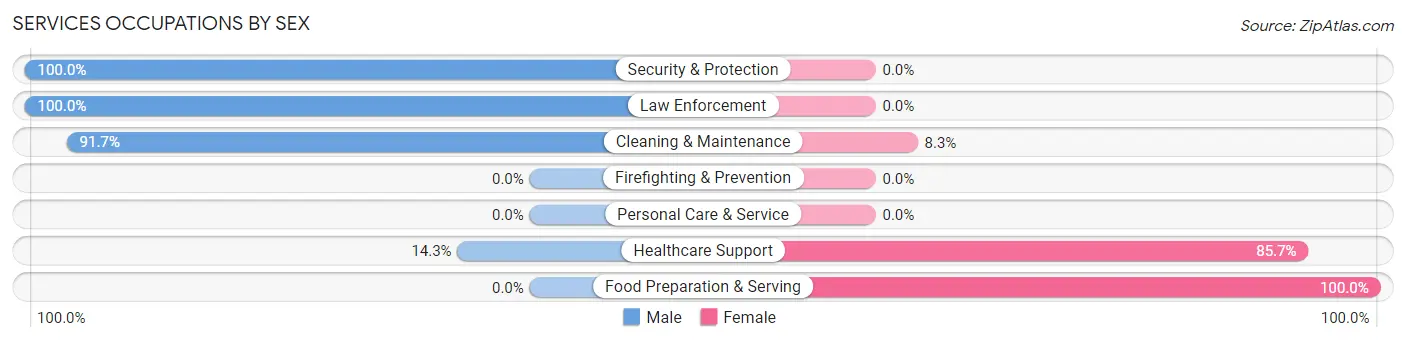
Services Occupations by Sex
Within the Services occupations in Arnot, the most male-oriented occupations are Security & Protection (100.0%), Law Enforcement (100.0%), and Cleaning & Maintenance (91.7%), while the most female-oriented occupations are Food Preparation & Serving (100.0%), Healthcare Support (85.7%), and Cleaning & Maintenance (8.3%).
| Occupation | Male | Female |
| Healthcare Support | 4 (14.3%) | 24 (85.7%) |
| Security & Protection | 5 (100.0%) | 0 (0.0%) |
| Firefighting & Prevention | 0 (0.0%) | 0 (0.0%) |
| Law Enforcement | 5 (100.0%) | 0 (0.0%) |
| Food Preparation & Serving | 0 (0.0%) | 5 (100.0%) |
| Cleaning & Maintenance | 11 (91.7%) | 1 (8.3%) |
| Personal Care & Service | 0 (0.0%) | 0 (0.0%) |
| Total (Category) | 20 (40.0%) | 30 (60.0%) |
| Total (Overall) | 108 (45.6%) | 129 (54.4%) |
Sales and Office Occupations
The most common Sales and Office occupations in Arnot are Sales & Related (33 | 13.9%), and Office & Administration (26 | 11.0%).
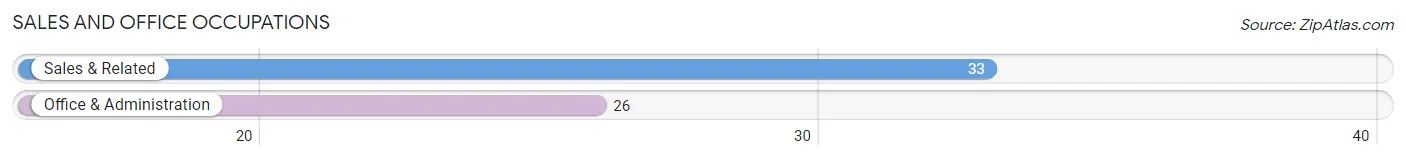
Sales and Office Occupations by Sex
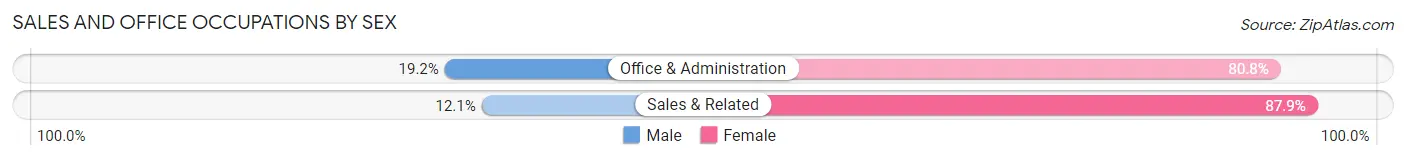
| Occupation | Male | Female |
| Sales & Related | 4 (12.1%) | 29 (87.9%) |
| Office & Administration | 5 (19.2%) | 21 (80.8%) |
| Total (Category) | 9 (15.2%) | 50 (84.8%) |
| Total (Overall) | 108 (45.6%) | 129 (54.4%) |
Natural Resources, Construction and Maintenance Occupations
The most common Natural Resources, Construction and Maintenance occupations in Arnot are Installation, Maintenance & Repair (12 | 5.1%), Construction & Extraction (5 | 2.1%), and Farming, Fishing & Forestry (2 | 0.8%).
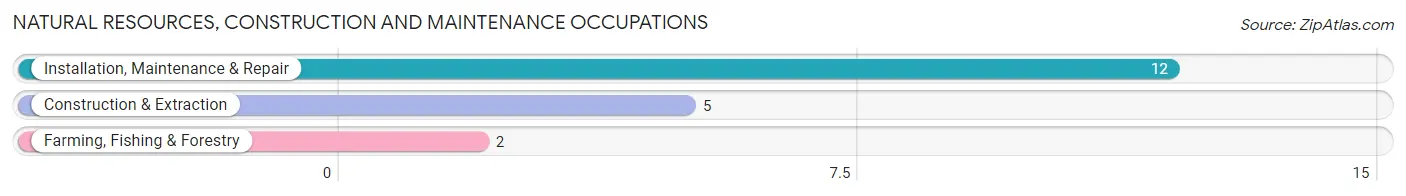
Natural Resources, Construction and Maintenance Occupations by Sex
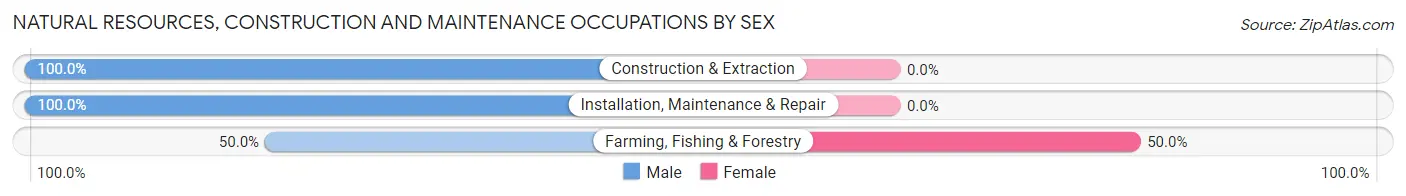
| Occupation | Male | Female |
| Farming, Fishing & Forestry | 1 (50.0%) | 1 (50.0%) |
| Construction & Extraction | 5 (100.0%) | 0 (0.0%) |
| Installation, Maintenance & Repair | 12 (100.0%) | 0 (0.0%) |
| Total (Category) | 18 (94.7%) | 1 (5.3%) |
| Total (Overall) | 108 (45.6%) | 129 (54.4%) |
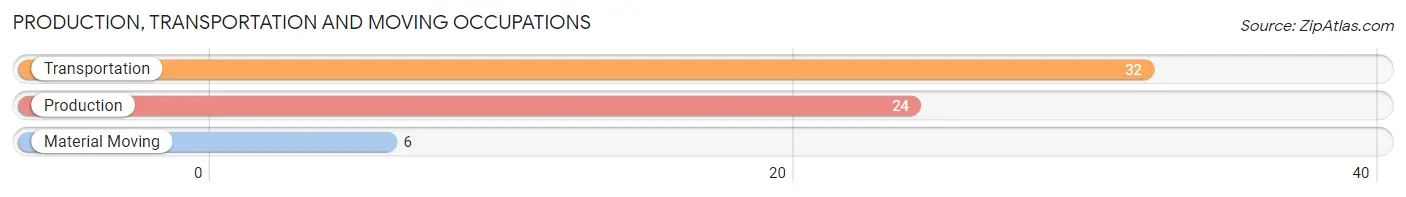
Production, Transportation and Moving Occupations
The most common Production, Transportation and Moving occupations in Arnot are Transportation (32 | 13.5%), Production (24 | 10.1%), and Material Moving (6 | 2.5%).
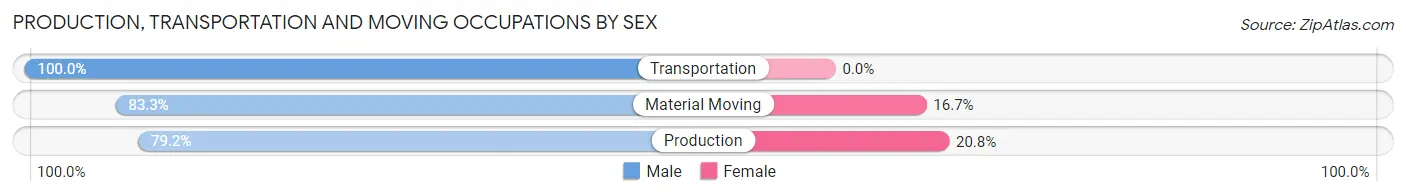
Production, Transportation and Moving Occupations by Sex
| Occupation | Male | Female |
| Production | 19 (79.2%) | 5 (20.8%) |
| Transportation | 32 (100.0%) | 0 (0.0%) |
| Material Moving | 5 (83.3%) | 1 (16.7%) |
| Total (Category) | 56 (90.3%) | 6 (9.7%) |
| Total (Overall) | 108 (45.6%) | 129 (54.4%) |
Employment Industries by Sex in Arnot
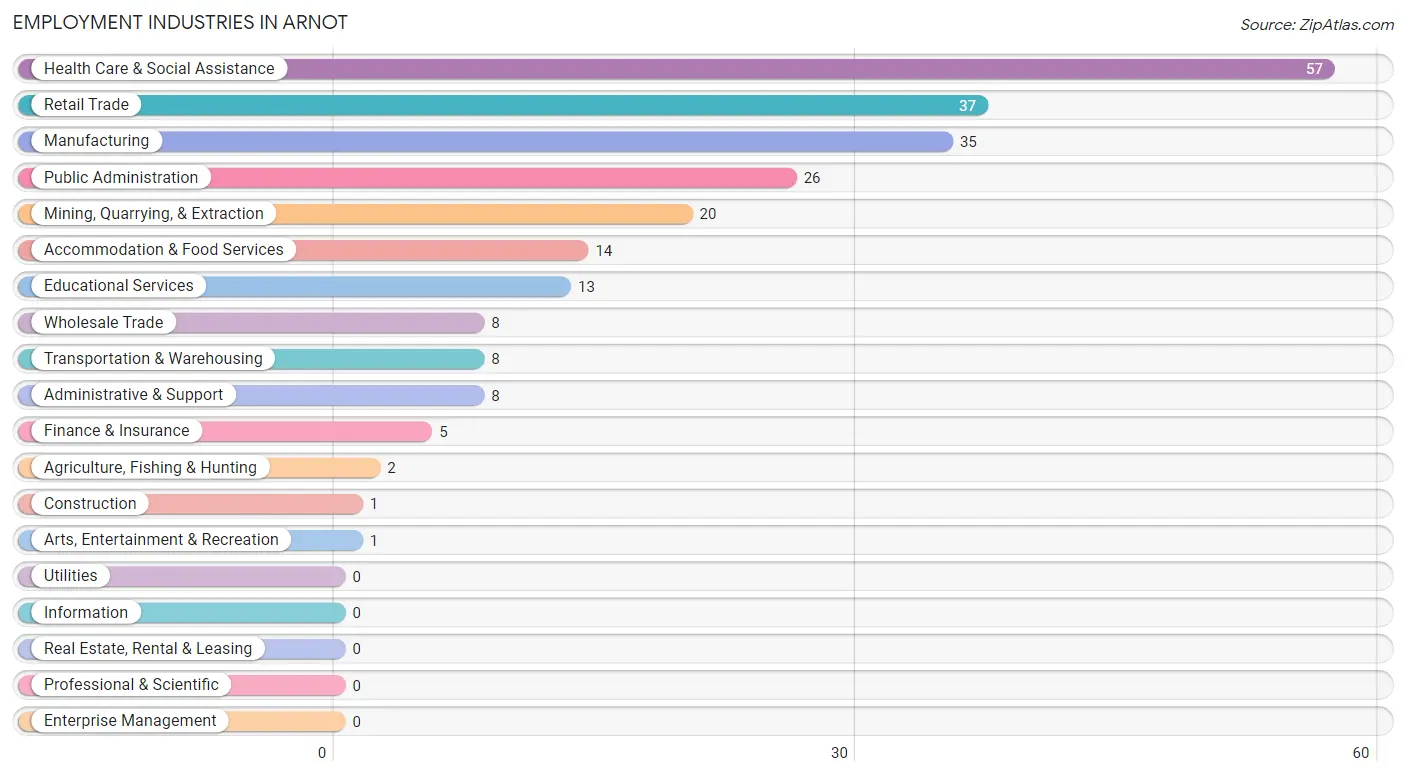
Employment Industries in Arnot
The major employment industries in Arnot include Health Care & Social Assistance (57 | 24.0%), Retail Trade (37 | 15.6%), Manufacturing (35 | 14.8%), Public Administration (26 | 11.0%), and Mining, Quarrying, & Extraction (20 | 8.4%).
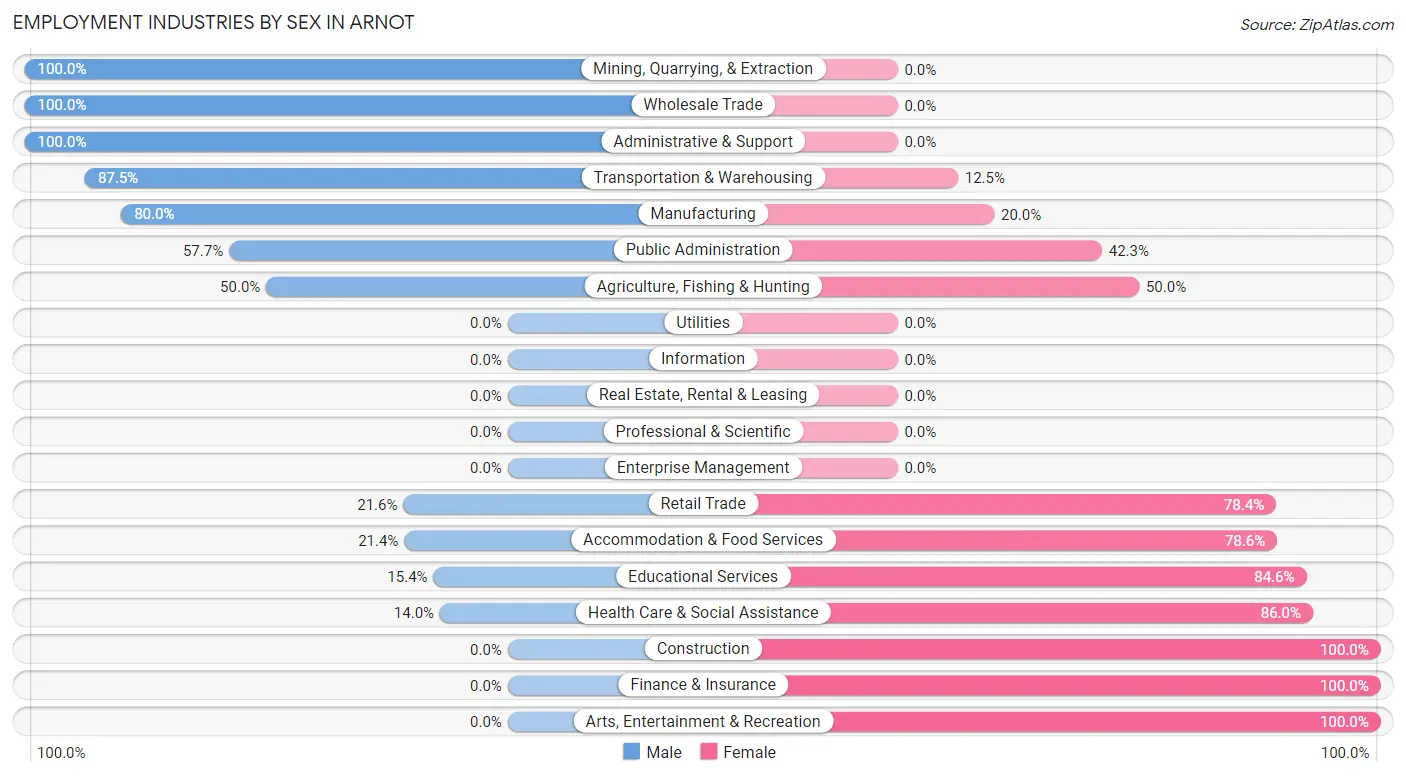
Employment Industries by Sex in Arnot
The Arnot industries that see more men than women are Mining, Quarrying, & Extraction (100.0%), Wholesale Trade (100.0%), and Administrative & Support (100.0%), whereas the industries that tend to have a higher number of women are Construction (100.0%), Finance & Insurance (100.0%), and Arts, Entertainment & Recreation (100.0%).
| Industry | Male | Female |
| Agriculture, Fishing & Hunting | 1 (50.0%) | 1 (50.0%) |
| Mining, Quarrying, & Extraction | 20 (100.0%) | 0 (0.0%) |
| Construction | 0 (0.0%) | 1 (100.0%) |
| Manufacturing | 28 (80.0%) | 7 (20.0%) |
| Wholesale Trade | 8 (100.0%) | 0 (0.0%) |
| Retail Trade | 8 (21.6%) | 29 (78.4%) |
| Transportation & Warehousing | 7 (87.5%) | 1 (12.5%) |
| Utilities | 0 (0.0%) | 0 (0.0%) |
| Information | 0 (0.0%) | 0 (0.0%) |
| Finance & Insurance | 0 (0.0%) | 5 (100.0%) |
| Real Estate, Rental & Leasing | 0 (0.0%) | 0 (0.0%) |
| Professional & Scientific | 0 (0.0%) | 0 (0.0%) |
| Enterprise Management | 0 (0.0%) | 0 (0.0%) |
| Administrative & Support | 8 (100.0%) | 0 (0.0%) |
| Educational Services | 2 (15.4%) | 11 (84.6%) |
| Health Care & Social Assistance | 8 (14.0%) | 49 (86.0%) |
| Arts, Entertainment & Recreation | 0 (0.0%) | 1 (100.0%) |
| Accommodation & Food Services | 3 (21.4%) | 11 (78.6%) |
| Public Administration | 15 (57.7%) | 11 (42.3%) |
| Total | 108 (45.6%) | 129 (54.4%) |
Education in Arnot
School Enrollment in Arnot
The most common levels of schooling among the 64 students in Arnot are middle school (25 | 39.1%), high school (22 | 34.4%), and college / undergraduate (11 | 17.2%).
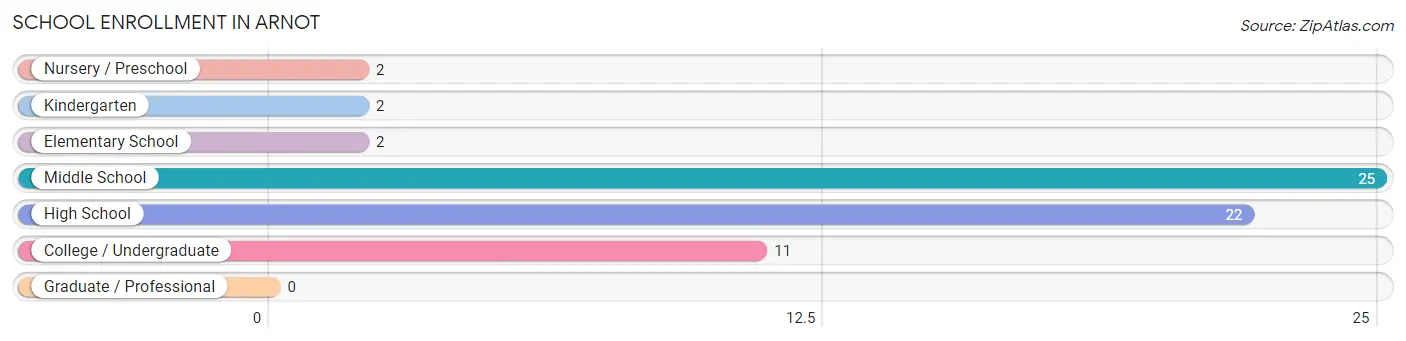
| School Level | # Students | % Students |
| Nursery / Preschool | 2 | 3.1% |
| Kindergarten | 2 | 3.1% |
| Elementary School | 2 | 3.1% |
| Middle School | 25 | 39.1% |
| High School | 22 | 34.4% |
| College / Undergraduate | 11 | 17.2% |
| Graduate / Professional | 0 | 0.0% |
| Total | 64 | 100.0% |
School Enrollment by Age by Funding Source in Arnot
Out of a total of 64 students who are enrolled in schools in Arnot, 4 (6.3%) attend a private institution, while the remaining 60 (93.7%) are enrolled in public schools. The age group of 10 to 14 year olds has the highest likelihood of being enrolled in private schools, with 4 (16.0% in the age bracket) enrolled. Conversely, the age group of 3 to 4 year olds has the lowest likelihood of being enrolled in a private school, with 2 (100.0% in the age bracket) attending a public institution.
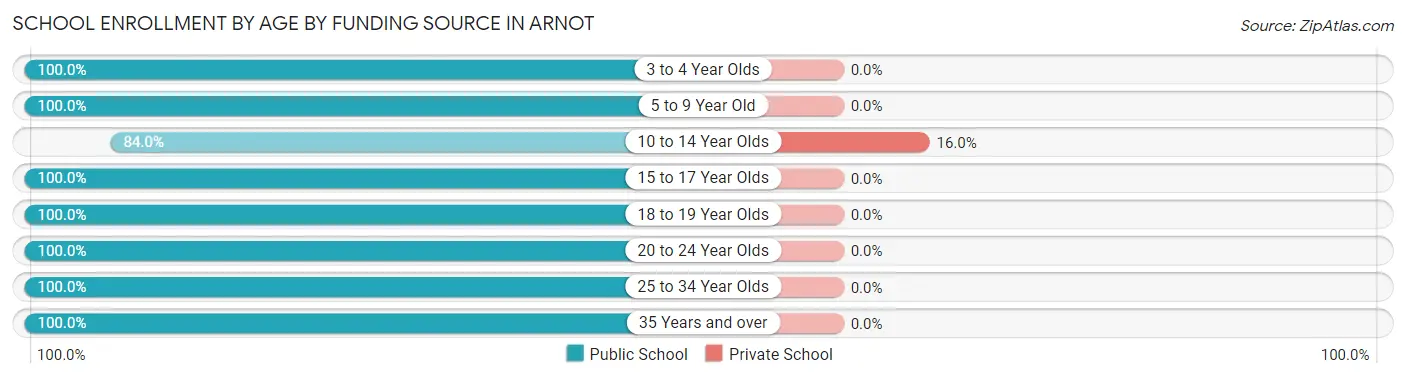
| Age Bracket | Public School | Private School |
| 3 to 4 Year Olds | 2 (100.0%) | 0 (0.0%) |
| 5 to 9 Year Old | 4 (100.0%) | 0 (0.0%) |
| 10 to 14 Year Olds | 21 (84.0%) | 4 (16.0%) |
| 15 to 17 Year Olds | 18 (100.0%) | 0 (0.0%) |
| 18 to 19 Year Olds | 7 (100.0%) | 0 (0.0%) |
| 20 to 24 Year Olds | 2 (100.0%) | 0 (0.0%) |
| 25 to 34 Year Olds | 1 (100.0%) | 0 (0.0%) |
| 35 Years and over | 5 (100.0%) | 0 (0.0%) |
| Total | 60 (93.8%) | 4 (6.3%) |
Educational Attainment by Field of Study in Arnot
Education (7 | 21.9%), engineering (5 | 15.6%), science & technology (5 | 15.6%), business (4 | 12.5%), and visual & performing arts (4 | 12.5%) are the most common fields of study among 32 individuals in Arnot who have obtained a bachelor's degree or higher.
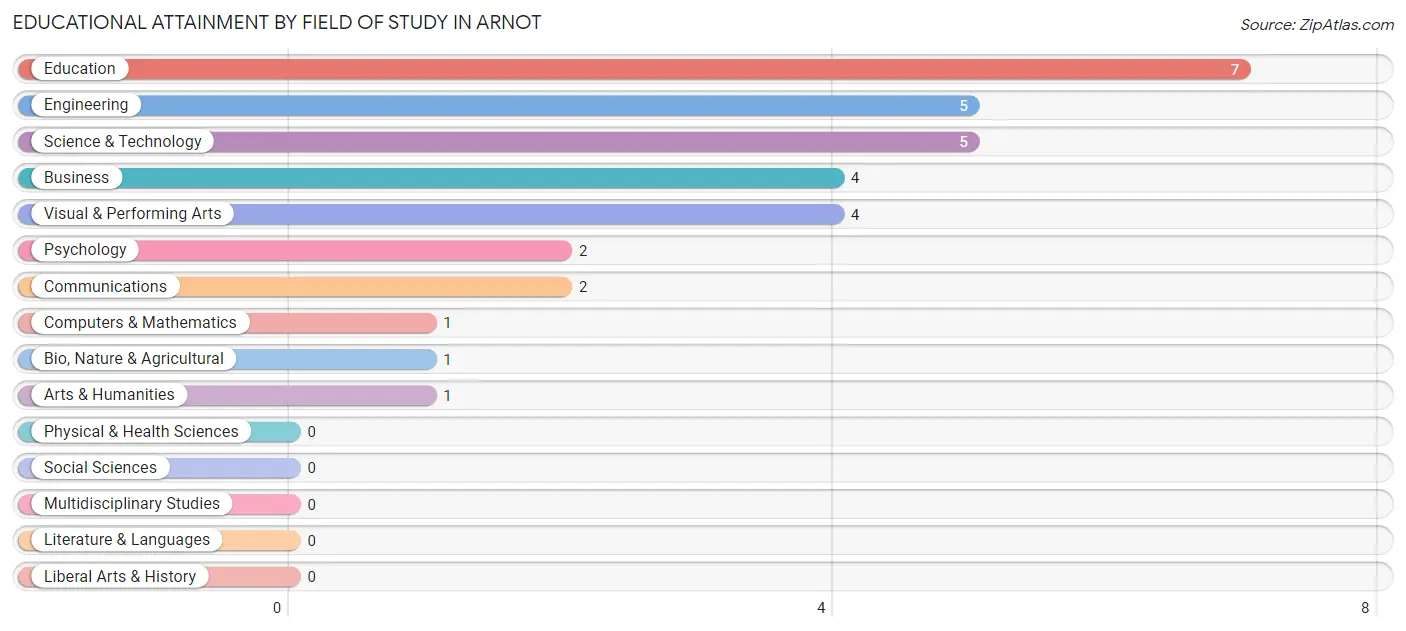
| Field of Study | # Graduates | % Graduates |
| Computers & Mathematics | 1 | 3.1% |
| Bio, Nature & Agricultural | 1 | 3.1% |
| Physical & Health Sciences | 0 | 0.0% |
| Psychology | 2 | 6.2% |
| Social Sciences | 0 | 0.0% |
| Engineering | 5 | 15.6% |
| Multidisciplinary Studies | 0 | 0.0% |
| Science & Technology | 5 | 15.6% |
| Business | 4 | 12.5% |
| Education | 7 | 21.9% |
| Literature & Languages | 0 | 0.0% |
| Liberal Arts & History | 0 | 0.0% |
| Visual & Performing Arts | 4 | 12.5% |
| Communications | 2 | 6.2% |
| Arts & Humanities | 1 | 3.1% |
| Total | 32 | 100.0% |
Transportation & Commute in Arnot
Vehicle Availability by Sex in Arnot
The most prevalent vehicle ownership categories in Arnot are males with 3 vehicles (53, accounting for 51.0%) and females with 3 vehicles (80, making up 41.1%).
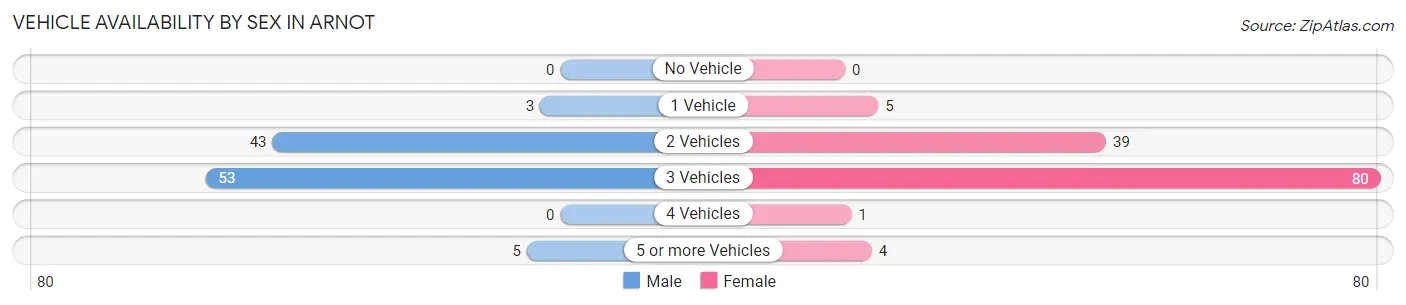
| Vehicles Available | Male | Female |
| No Vehicle | 0 (0.0%) | 0 (0.0%) |
| 1 Vehicle | 3 (2.9%) | 5 (3.9%) |
| 2 Vehicles | 43 (41.3%) | 39 (30.2%) |
| 3 Vehicles | 53 (51.0%) | 80 (62.0%) |
| 4 Vehicles | 0 (0.0%) | 1 (0.8%) |
| 5 or more Vehicles | 5 (4.8%) | 4 (3.1%) |
| Total | 104 (100.0%) | 129 (100.0%) |
Commute Time in Arnot
The most frequently occuring commute durations in Arnot are 20 to 24 minutes (63 commuters, 29.0%), 15 to 19 minutes (41 commuters, 18.9%), and 5 to 9 minutes (36 commuters, 16.6%).
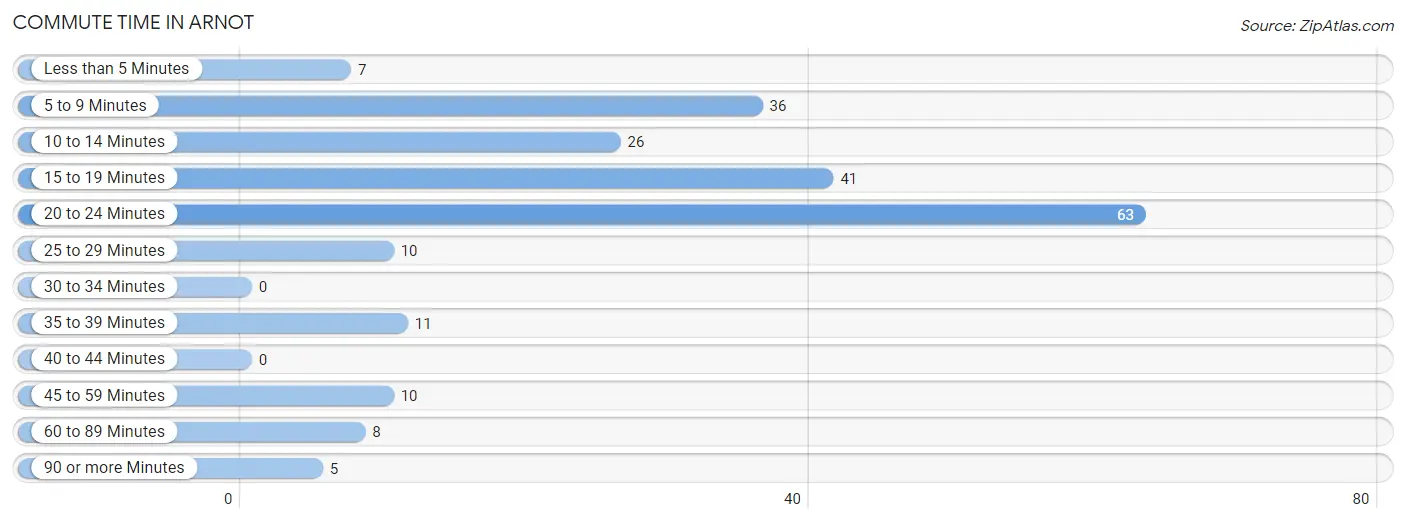
| Commute Time | # Commuters | % Commuters |
| Less than 5 Minutes | 7 | 3.2% |
| 5 to 9 Minutes | 36 | 16.6% |
| 10 to 14 Minutes | 26 | 12.0% |
| 15 to 19 Minutes | 41 | 18.9% |
| 20 to 24 Minutes | 63 | 29.0% |
| 25 to 29 Minutes | 10 | 4.6% |
| 30 to 34 Minutes | 0 | 0.0% |
| 35 to 39 Minutes | 11 | 5.1% |
| 40 to 44 Minutes | 0 | 0.0% |
| 45 to 59 Minutes | 10 | 4.6% |
| 60 to 89 Minutes | 8 | 3.7% |
| 90 or more Minutes | 5 | 2.3% |
Commute Time by Sex in Arnot
The most common commute times in Arnot are 5 to 9 minutes (23 commuters, 23.0%) for males and 20 to 24 minutes (57 commuters, 48.7%) for females.
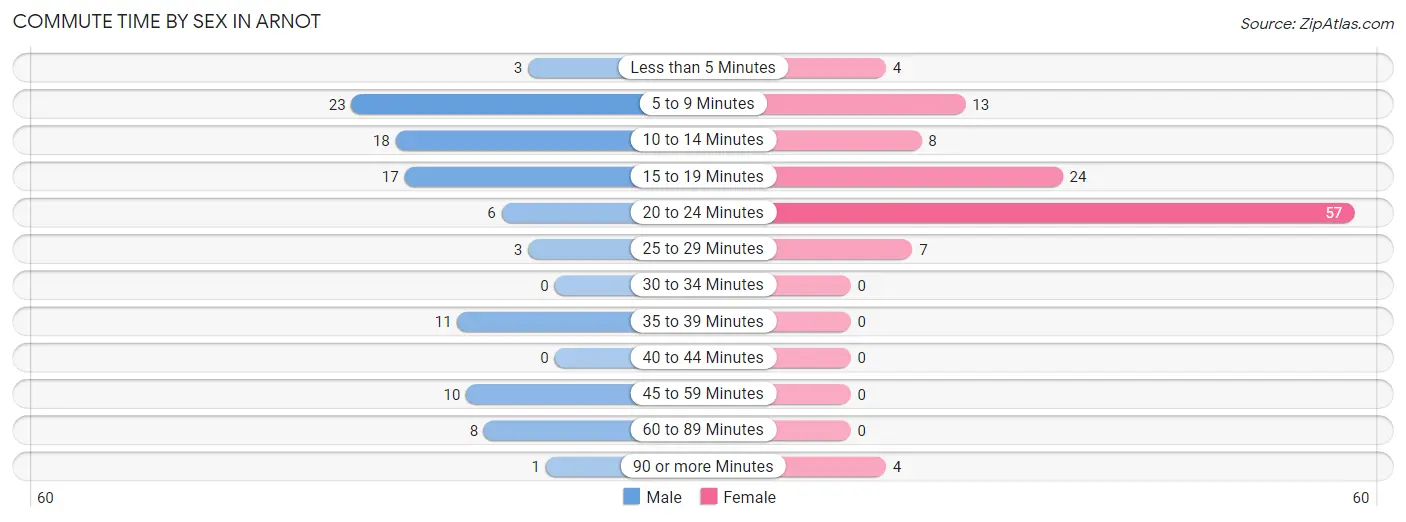
| Commute Time | Male | Female |
| Less than 5 Minutes | 3 (3.0%) | 4 (3.4%) |
| 5 to 9 Minutes | 23 (23.0%) | 13 (11.1%) |
| 10 to 14 Minutes | 18 (18.0%) | 8 (6.8%) |
| 15 to 19 Minutes | 17 (17.0%) | 24 (20.5%) |
| 20 to 24 Minutes | 6 (6.0%) | 57 (48.7%) |
| 25 to 29 Minutes | 3 (3.0%) | 7 (6.0%) |
| 30 to 34 Minutes | 0 (0.0%) | 0 (0.0%) |
| 35 to 39 Minutes | 11 (11.0%) | 0 (0.0%) |
| 40 to 44 Minutes | 0 (0.0%) | 0 (0.0%) |
| 45 to 59 Minutes | 10 (10.0%) | 0 (0.0%) |
| 60 to 89 Minutes | 8 (8.0%) | 0 (0.0%) |
| 90 or more Minutes | 1 (1.0%) | 4 (3.4%) |
Time of Departure to Work by Sex in Arnot
The most frequent times of departure to work in Arnot are 6:30 AM to 6:59 AM (21, 21.0%) for males and 6:30 AM to 6:59 AM (23, 19.7%) for females.
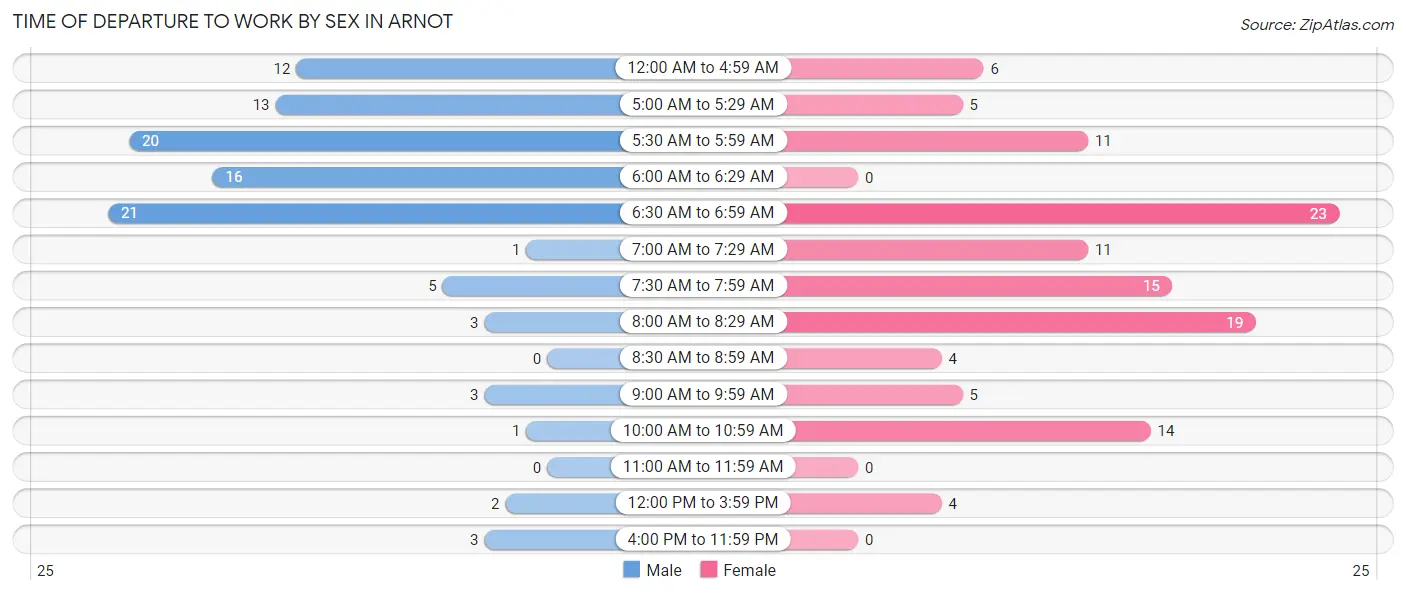
| Time of Departure | Male | Female |
| 12:00 AM to 4:59 AM | 12 (12.0%) | 6 (5.1%) |
| 5:00 AM to 5:29 AM | 13 (13.0%) | 5 (4.3%) |
| 5:30 AM to 5:59 AM | 20 (20.0%) | 11 (9.4%) |
| 6:00 AM to 6:29 AM | 16 (16.0%) | 0 (0.0%) |
| 6:30 AM to 6:59 AM | 21 (21.0%) | 23 (19.7%) |
| 7:00 AM to 7:29 AM | 1 (1.0%) | 11 (9.4%) |
| 7:30 AM to 7:59 AM | 5 (5.0%) | 15 (12.8%) |
| 8:00 AM to 8:29 AM | 3 (3.0%) | 19 (16.2%) |
| 8:30 AM to 8:59 AM | 0 (0.0%) | 4 (3.4%) |
| 9:00 AM to 9:59 AM | 3 (3.0%) | 5 (4.3%) |
| 10:00 AM to 10:59 AM | 1 (1.0%) | 14 (12.0%) |
| 11:00 AM to 11:59 AM | 0 (0.0%) | 0 (0.0%) |
| 12:00 PM to 3:59 PM | 2 (2.0%) | 4 (3.4%) |
| 4:00 PM to 11:59 PM | 3 (3.0%) | 0 (0.0%) |
| Total | 100 (100.0%) | 117 (100.0%) |
Housing Occupancy in Arnot
Occupancy by Ownership in Arnot
Of the total 175 dwellings in Arnot, owner-occupied units account for 164 (93.7%), while renter-occupied units make up 11 (6.3%).
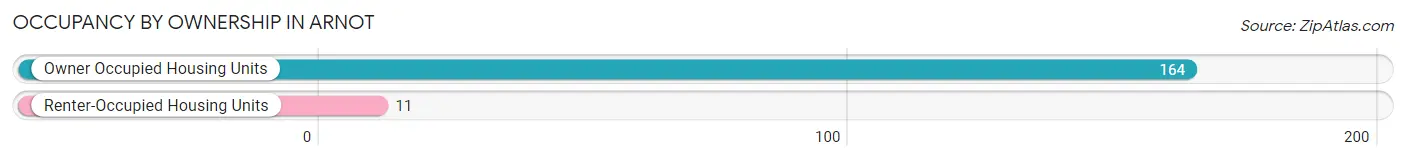
| Occupancy | # Housing Units | % Housing Units |
| Owner Occupied Housing Units | 164 | 93.7% |
| Renter-Occupied Housing Units | 11 | 6.3% |
| Total Occupied Housing Units | 175 | 100.0% |
Occupancy by Household Size in Arnot
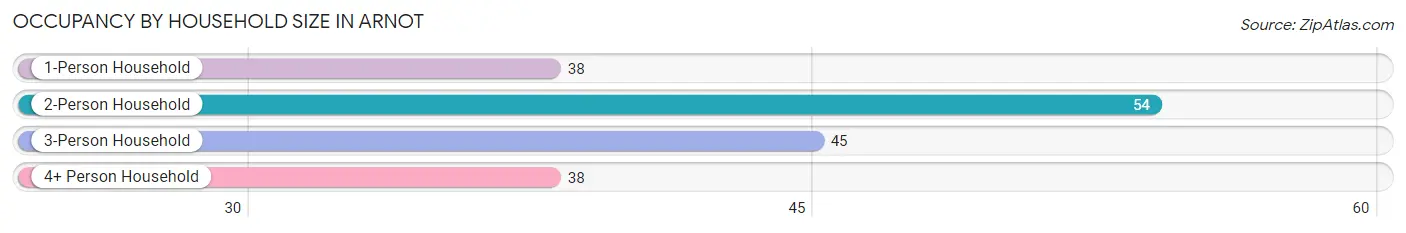
| Household Size | # Housing Units | % Housing Units |
| 1-Person Household | 38 | 21.7% |
| 2-Person Household | 54 | 30.9% |
| 3-Person Household | 45 | 25.7% |
| 4+ Person Household | 38 | 21.7% |
| Total Housing Units | 175 | 100.0% |
Occupancy by Ownership by Household Size in Arnot
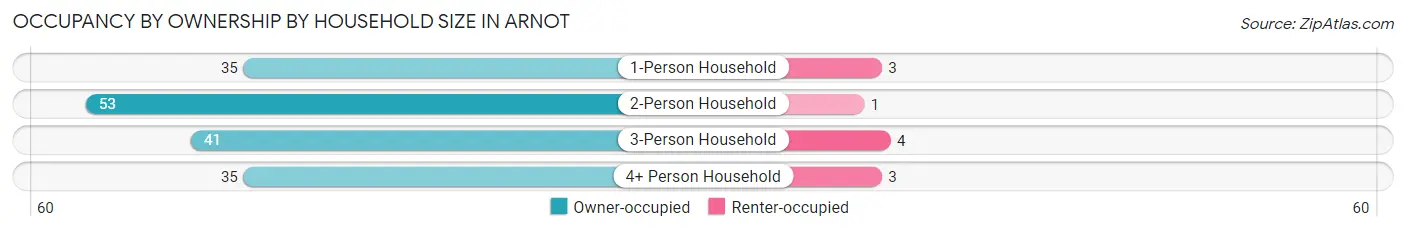
| Household Size | Owner-occupied | Renter-occupied |
| 1-Person Household | 35 (92.1%) | 3 (7.9%) |
| 2-Person Household | 53 (98.2%) | 1 (1.8%) |
| 3-Person Household | 41 (91.1%) | 4 (8.9%) |
| 4+ Person Household | 35 (92.1%) | 3 (7.9%) |
| Total Housing Units | 164 (93.7%) | 11 (6.3%) |
Occupancy by Educational Attainment in Arnot
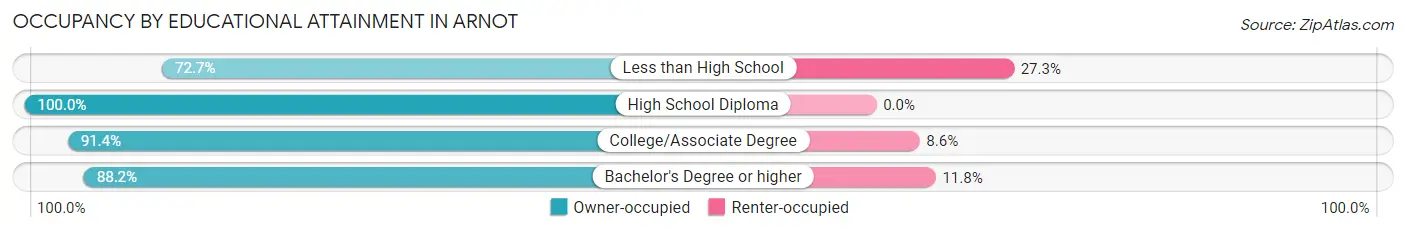
| Household Size | Owner-occupied | Renter-occupied |
| Less than High School | 8 (72.7%) | 3 (27.3%) |
| High School Diploma | 77 (100.0%) | 0 (0.0%) |
| College/Associate Degree | 64 (91.4%) | 6 (8.6%) |
| Bachelor's Degree or higher | 15 (88.2%) | 2 (11.8%) |
Occupancy by Age of Householder in Arnot
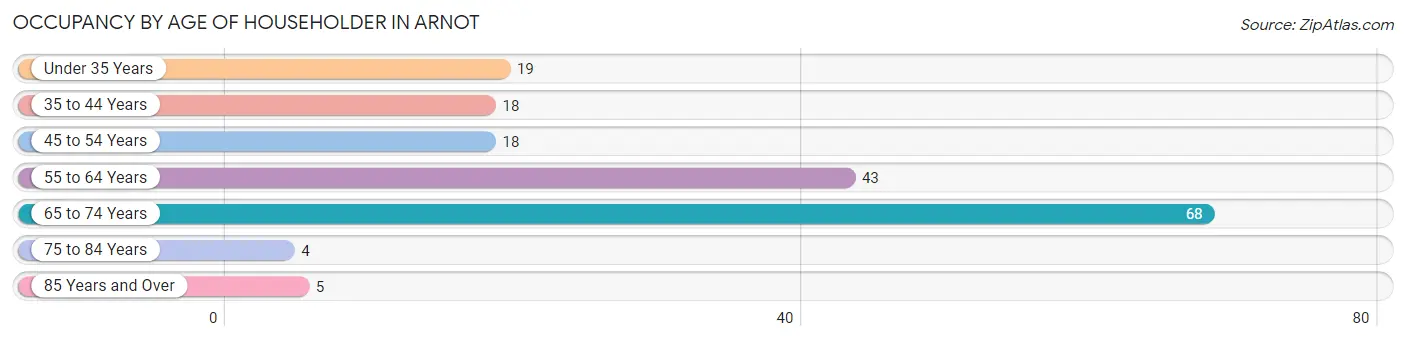
| Age Bracket | # Households | % Households |
| Under 35 Years | 19 | 10.9% |
| 35 to 44 Years | 18 | 10.3% |
| 45 to 54 Years | 18 | 10.3% |
| 55 to 64 Years | 43 | 24.6% |
| 65 to 74 Years | 68 | 38.9% |
| 75 to 84 Years | 4 | 2.3% |
| 85 Years and Over | 5 | 2.9% |
| Total | 175 | 100.0% |
Housing Finances in Arnot
Median Income by Occupancy in Arnot

| Occupancy Type | # Households | Median Income |
| Owner-Occupied | 164 (93.7%) | $89,500 |
| Renter-Occupied | 11 (6.3%) | $12,917 |
| Average | 175 (100.0%) | $86,250 |
Occupancy by Householder Income Bracket in Arnot
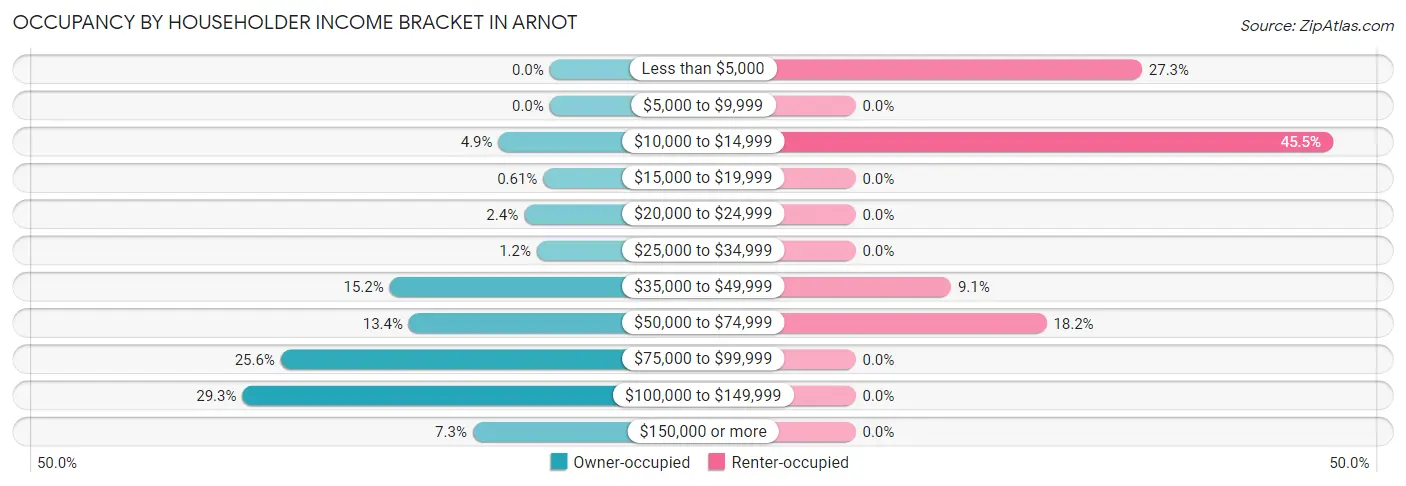
| Income Bracket | Owner-occupied | Renter-occupied |
| Less than $5,000 | 0 (0.0%) | 3 (27.3%) |
| $5,000 to $9,999 | 0 (0.0%) | 0 (0.0%) |
| $10,000 to $14,999 | 8 (4.9%) | 5 (45.5%) |
| $15,000 to $19,999 | 1 (0.6%) | 0 (0.0%) |
| $20,000 to $24,999 | 4 (2.4%) | 0 (0.0%) |
| $25,000 to $34,999 | 2 (1.2%) | 0 (0.0%) |
| $35,000 to $49,999 | 25 (15.2%) | 1 (9.1%) |
| $50,000 to $74,999 | 22 (13.4%) | 2 (18.2%) |
| $75,000 to $99,999 | 42 (25.6%) | 0 (0.0%) |
| $100,000 to $149,999 | 48 (29.3%) | 0 (0.0%) |
| $150,000 or more | 12 (7.3%) | 0 (0.0%) |
| Total | 164 (100.0%) | 11 (100.0%) |
Monthly Housing Cost Tiers in Arnot
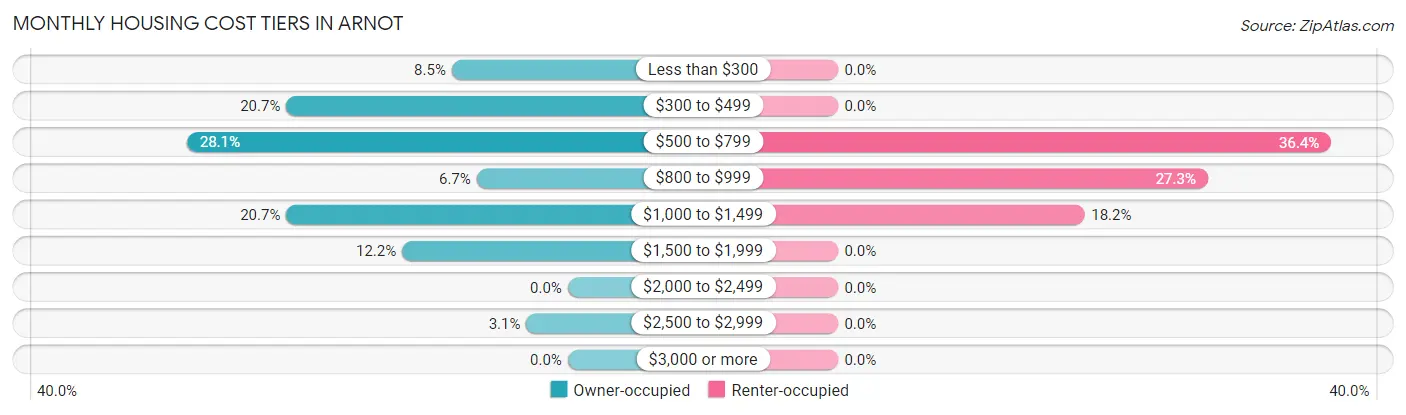
| Monthly Cost | Owner-occupied | Renter-occupied |
| Less than $300 | 14 (8.5%) | 0 (0.0%) |
| $300 to $499 | 34 (20.7%) | 0 (0.0%) |
| $500 to $799 | 46 (28.1%) | 4 (36.4%) |
| $800 to $999 | 11 (6.7%) | 3 (27.3%) |
| $1,000 to $1,499 | 34 (20.7%) | 2 (18.2%) |
| $1,500 to $1,999 | 20 (12.2%) | 0 (0.0%) |
| $2,000 to $2,499 | 0 (0.0%) | 0 (0.0%) |
| $2,500 to $2,999 | 5 (3.0%) | 0 (0.0%) |
| $3,000 or more | 0 (0.0%) | 0 (0.0%) |
| Total | 164 (100.0%) | 11 (100.0%) |
Physical Housing Characteristics in Arnot
Housing Structures in Arnot
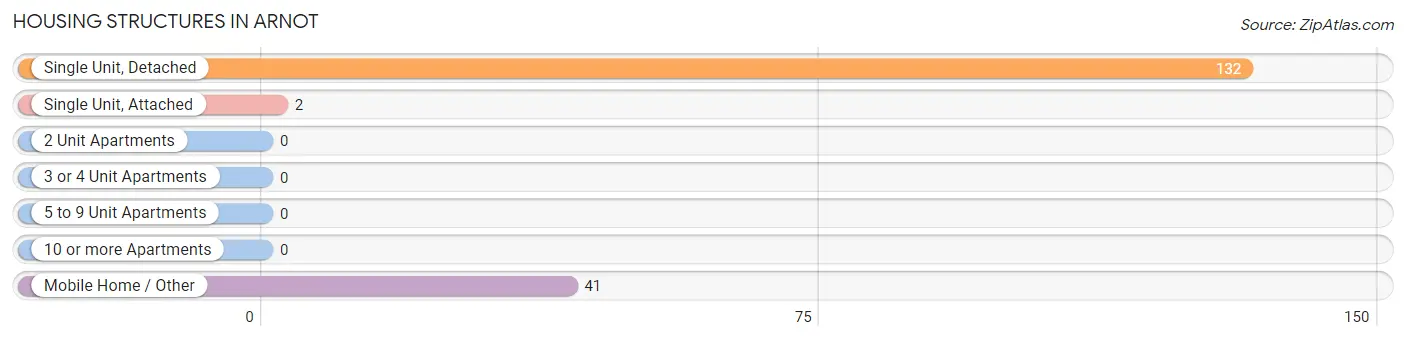
| Structure Type | # Housing Units | % Housing Units |
| Single Unit, Detached | 132 | 75.4% |
| Single Unit, Attached | 2 | 1.1% |
| 2 Unit Apartments | 0 | 0.0% |
| 3 or 4 Unit Apartments | 0 | 0.0% |
| 5 to 9 Unit Apartments | 0 | 0.0% |
| 10 or more Apartments | 0 | 0.0% |
| Mobile Home / Other | 41 | 23.4% |
| Total | 175 | 100.0% |
Housing Structures by Occupancy in Arnot
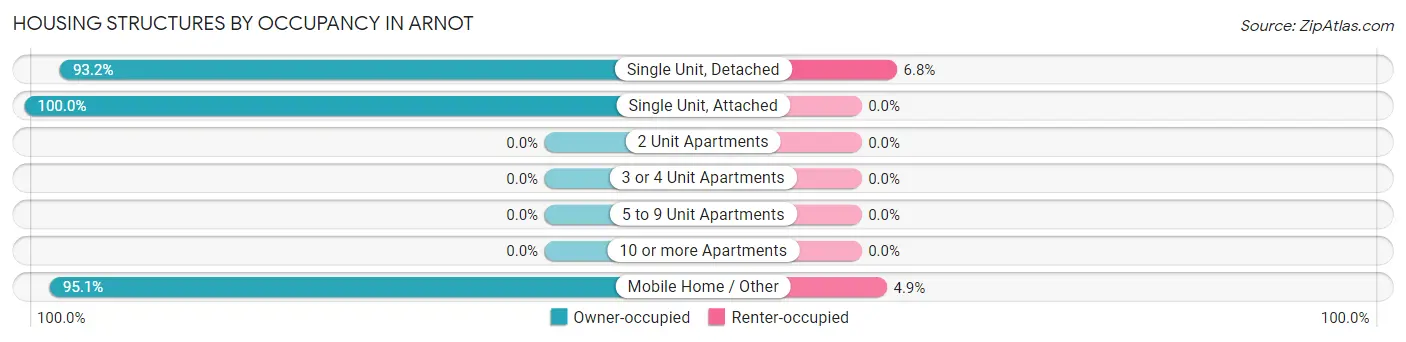
| Structure Type | Owner-occupied | Renter-occupied |
| Single Unit, Detached | 123 (93.2%) | 9 (6.8%) |
| Single Unit, Attached | 2 (100.0%) | 0 (0.0%) |
| 2 Unit Apartments | 0 (0.0%) | 0 (0.0%) |
| 3 or 4 Unit Apartments | 0 (0.0%) | 0 (0.0%) |
| 5 to 9 Unit Apartments | 0 (0.0%) | 0 (0.0%) |
| 10 or more Apartments | 0 (0.0%) | 0 (0.0%) |
| Mobile Home / Other | 39 (95.1%) | 2 (4.9%) |
| Total | 164 (93.7%) | 11 (6.3%) |
Housing Structures by Number of Rooms in Arnot
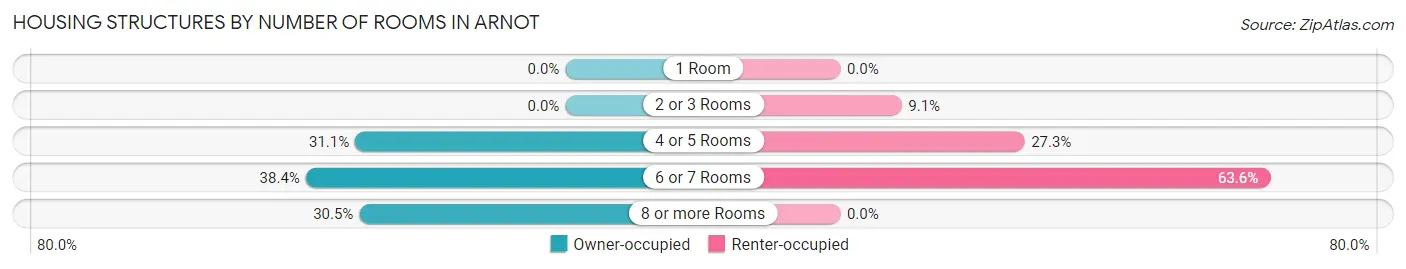
| Number of Rooms | Owner-occupied | Renter-occupied |
| 1 Room | 0 (0.0%) | 0 (0.0%) |
| 2 or 3 Rooms | 0 (0.0%) | 1 (9.1%) |
| 4 or 5 Rooms | 51 (31.1%) | 3 (27.3%) |
| 6 or 7 Rooms | 63 (38.4%) | 7 (63.6%) |
| 8 or more Rooms | 50 (30.5%) | 0 (0.0%) |
| Total | 164 (100.0%) | 11 (100.0%) |
Housing Structure by Heating Type in Arnot
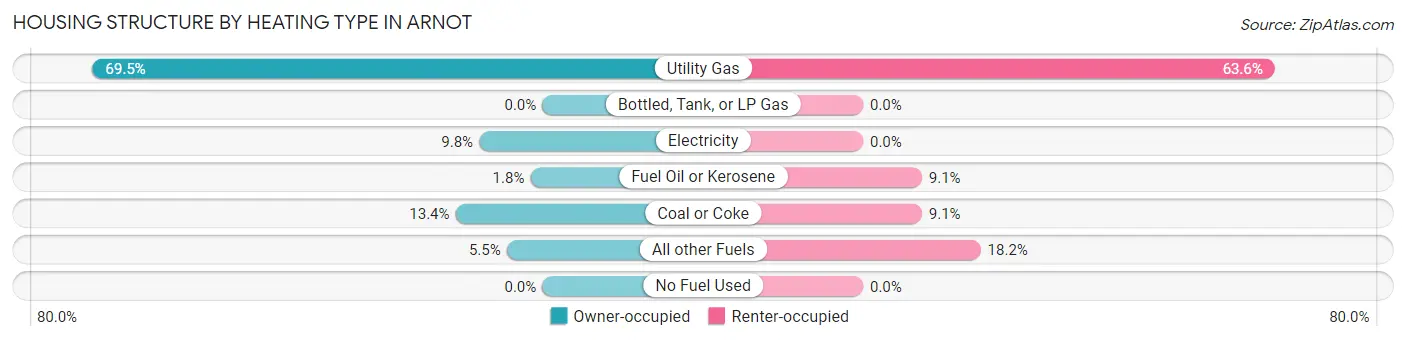
| Heating Type | Owner-occupied | Renter-occupied |
| Utility Gas | 114 (69.5%) | 7 (63.6%) |
| Bottled, Tank, or LP Gas | 0 (0.0%) | 0 (0.0%) |
| Electricity | 16 (9.8%) | 0 (0.0%) |
| Fuel Oil or Kerosene | 3 (1.8%) | 1 (9.1%) |
| Coal or Coke | 22 (13.4%) | 1 (9.1%) |
| All other Fuels | 9 (5.5%) | 2 (18.2%) |
| No Fuel Used | 0 (0.0%) | 0 (0.0%) |
| Total | 164 (100.0%) | 11 (100.0%) |
Household Vehicle Usage in Arnot
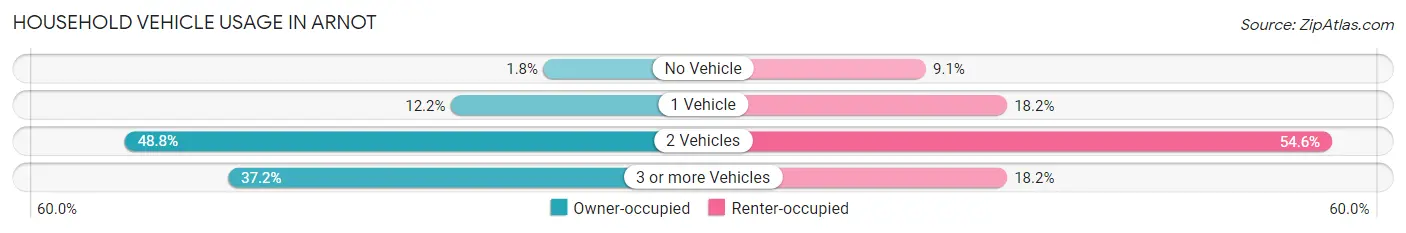
| Vehicles per Household | Owner-occupied | Renter-occupied |
| No Vehicle | 3 (1.8%) | 1 (9.1%) |
| 1 Vehicle | 20 (12.2%) | 2 (18.2%) |
| 2 Vehicles | 80 (48.8%) | 6 (54.5%) |
| 3 or more Vehicles | 61 (37.2%) | 2 (18.2%) |
| Total | 164 (100.0%) | 11 (100.0%) |
Real Estate & Mortgages in Arnot
Real Estate and Mortgage Overview in Arnot
| Characteristic | Without Mortgage | With Mortgage |
| Housing Units | 89 | 75 |
| Median Property Value | - | - |
| Median Household Income | $79,583 | $11 |
| Monthly Housing Costs | $461 | $0 |
| Real Estate Taxes | $1,425 | $0 |
Property Value by Mortgage Status in Arnot
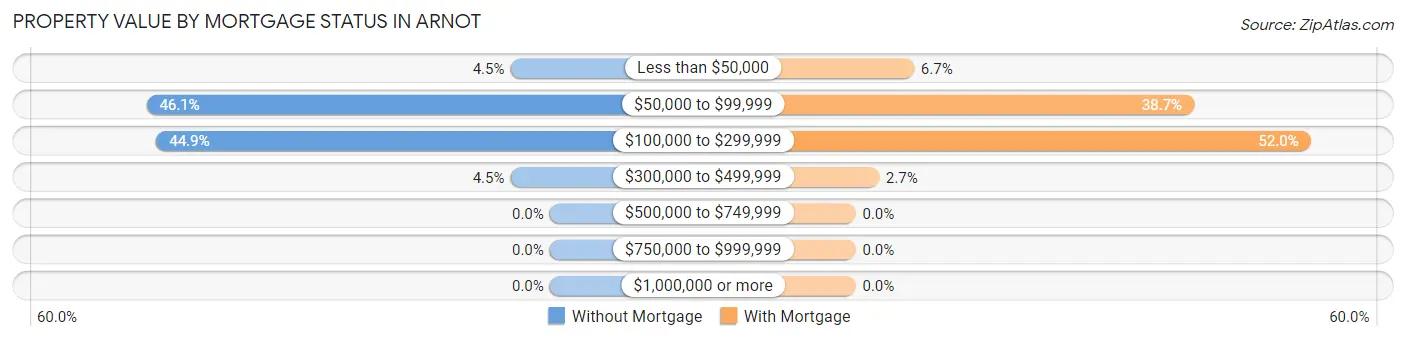
| Property Value | Without Mortgage | With Mortgage |
| Less than $50,000 | 4 (4.5%) | 5 (6.7%) |
| $50,000 to $99,999 | 41 (46.1%) | 29 (38.7%) |
| $100,000 to $299,999 | 40 (44.9%) | 39 (52.0%) |
| $300,000 to $499,999 | 4 (4.5%) | 2 (2.7%) |
| $500,000 to $749,999 | 0 (0.0%) | 0 (0.0%) |
| $750,000 to $999,999 | 0 (0.0%) | 0 (0.0%) |
| $1,000,000 or more | 0 (0.0%) | 0 (0.0%) |
| Total | 89 (100.0%) | 75 (100.0%) |
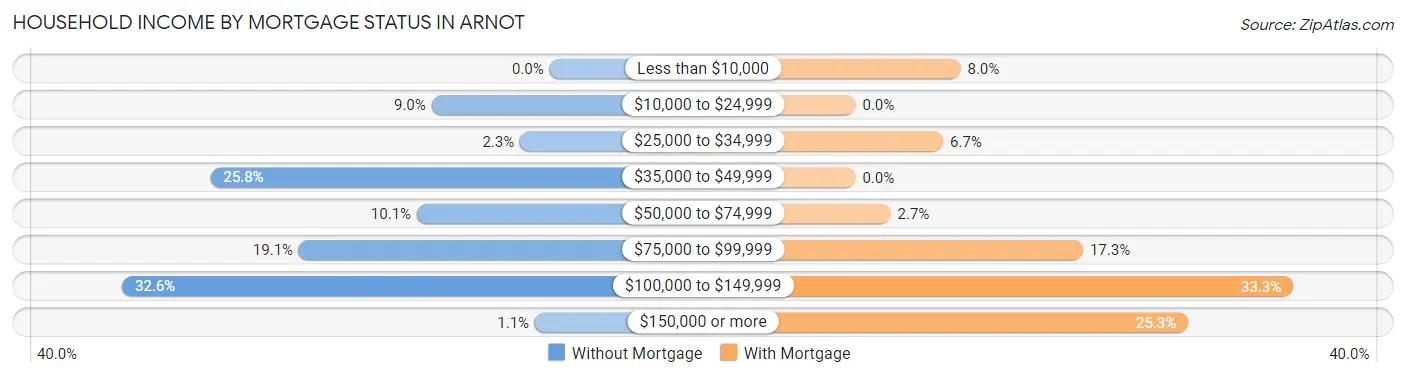
Household Income by Mortgage Status in Arnot
| Household Income | Without Mortgage | With Mortgage |
| Less than $10,000 | 0 (0.0%) | 6 (8.0%) |
| $10,000 to $24,999 | 8 (9.0%) | 0 (0.0%) |
| $25,000 to $34,999 | 2 (2.2%) | 5 (6.7%) |
| $35,000 to $49,999 | 23 (25.8%) | 0 (0.0%) |
| $50,000 to $74,999 | 9 (10.1%) | 2 (2.7%) |
| $75,000 to $99,999 | 17 (19.1%) | 13 (17.3%) |
| $100,000 to $149,999 | 29 (32.6%) | 25 (33.3%) |
| $150,000 or more | 1 (1.1%) | 19 (25.3%) |
| Total | 89 (100.0%) | 75 (100.0%) |
Property Value to Household Income Ratio in Arnot
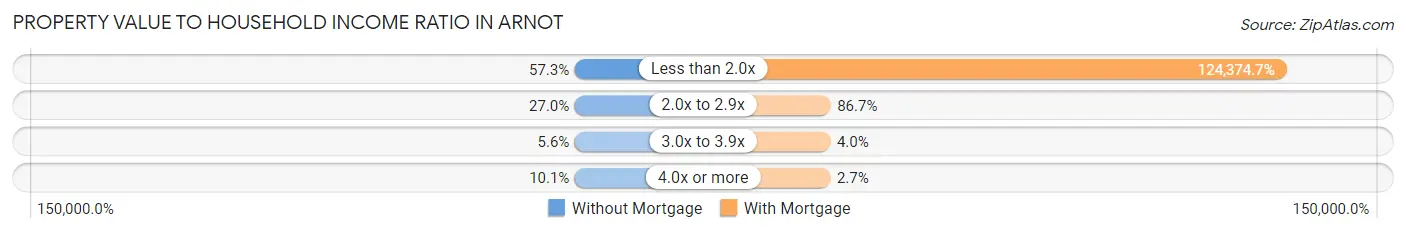
| Value-to-Income Ratio | Without Mortgage | With Mortgage |
| Less than 2.0x | 51 (57.3%) | 93,281 (124,374.7%) |
| 2.0x to 2.9x | 24 (27.0%) | 65 (86.7%) |
| 3.0x to 3.9x | 5 (5.6%) | 3 (4.0%) |
| 4.0x or more | 9 (10.1%) | 2 (2.7%) |
| Total | 89 (100.0%) | 75 (100.0%) |
Real Estate Taxes by Mortgage Status in Arnot
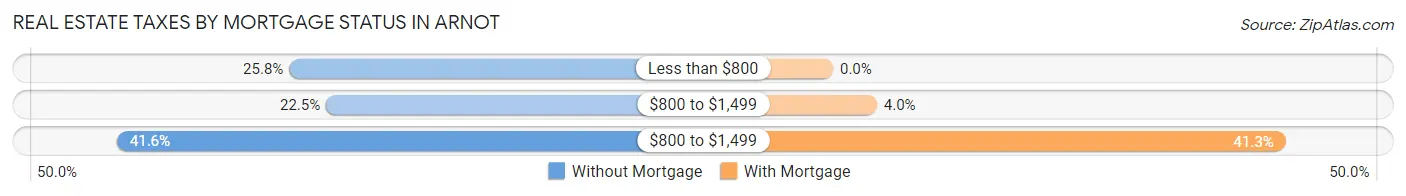
| Property Taxes | Without Mortgage | With Mortgage |
| Less than $800 | 23 (25.8%) | 0 (0.0%) |
| $800 to $1,499 | 20 (22.5%) | 3 (4.0%) |
| $800 to $1,499 | 37 (41.6%) | 31 (41.3%) |
| Total | 89 (100.0%) | 75 (100.0%) |
Health & Disability in Arnot
Health Insurance Coverage by Age in Arnot
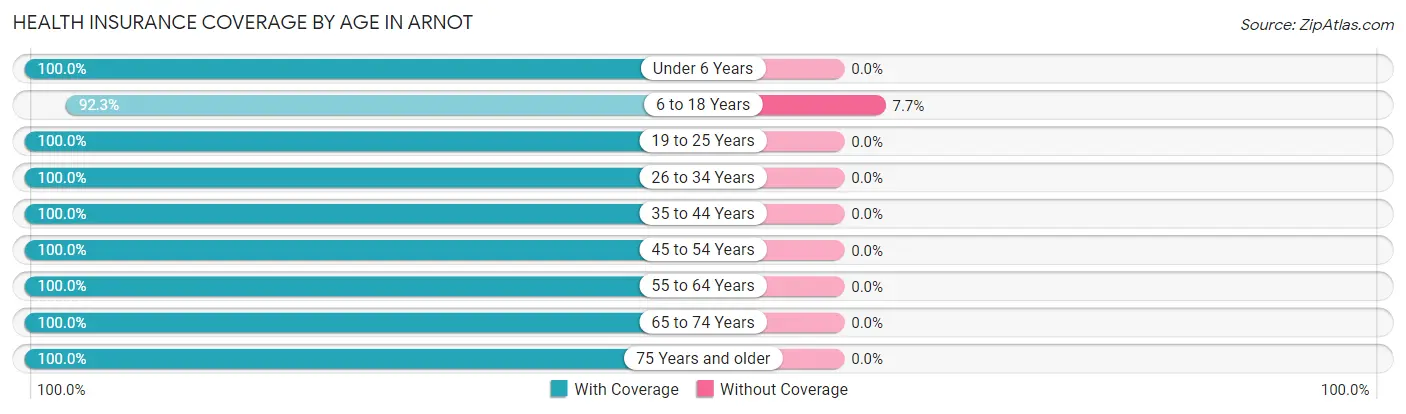
| Age Bracket | With Coverage | Without Coverage |
| Under 6 Years | 20 (100.0%) | 0 (0.0%) |
| 6 to 18 Years | 48 (92.3%) | 4 (7.7%) |
| 19 to 25 Years | 48 (100.0%) | 0 (0.0%) |
| 26 to 34 Years | 39 (100.0%) | 0 (0.0%) |
| 35 to 44 Years | 26 (100.0%) | 0 (0.0%) |
| 45 to 54 Years | 48 (100.0%) | 0 (0.0%) |
| 55 to 64 Years | 66 (100.0%) | 0 (0.0%) |
| 65 to 74 Years | 124 (100.0%) | 0 (0.0%) |
| 75 Years and older | 53 (100.0%) | 0 (0.0%) |
| Total | 472 (99.2%) | 4 (0.8%) |
Health Insurance Coverage by Citizenship Status in Arnot
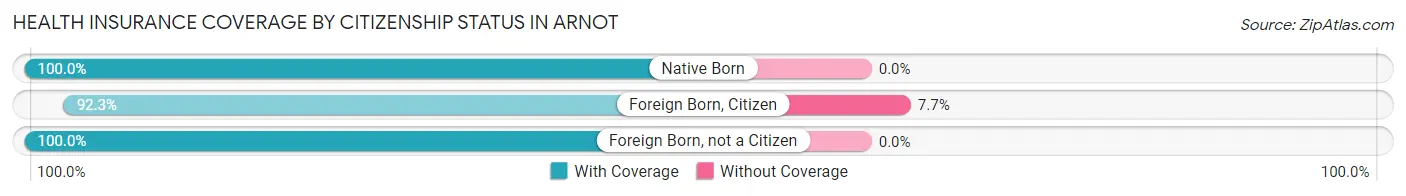
| Citizenship Status | With Coverage | Without Coverage |
| Native Born | 20 (100.0%) | 0 (0.0%) |
| Foreign Born, Citizen | 48 (92.3%) | 4 (7.7%) |
| Foreign Born, not a Citizen | 48 (100.0%) | 0 (0.0%) |
Health Insurance Coverage by Household Income in Arnot
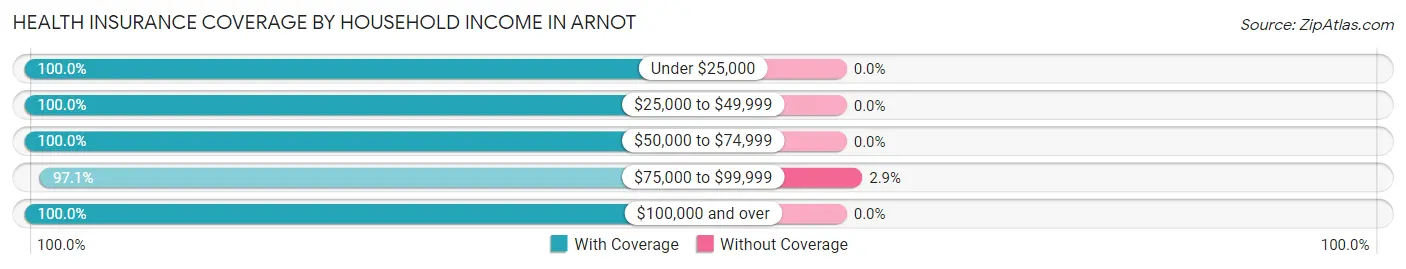
| Household Income | With Coverage | Without Coverage |
| Under $25,000 | 41 (100.0%) | 0 (0.0%) |
| $25,000 to $49,999 | 37 (100.0%) | 0 (0.0%) |
| $50,000 to $74,999 | 60 (100.0%) | 0 (0.0%) |
| $75,000 to $99,999 | 134 (97.1%) | 4 (2.9%) |
| $100,000 and over | 200 (100.0%) | 0 (0.0%) |
Public vs Private Health Insurance Coverage by Age in Arnot
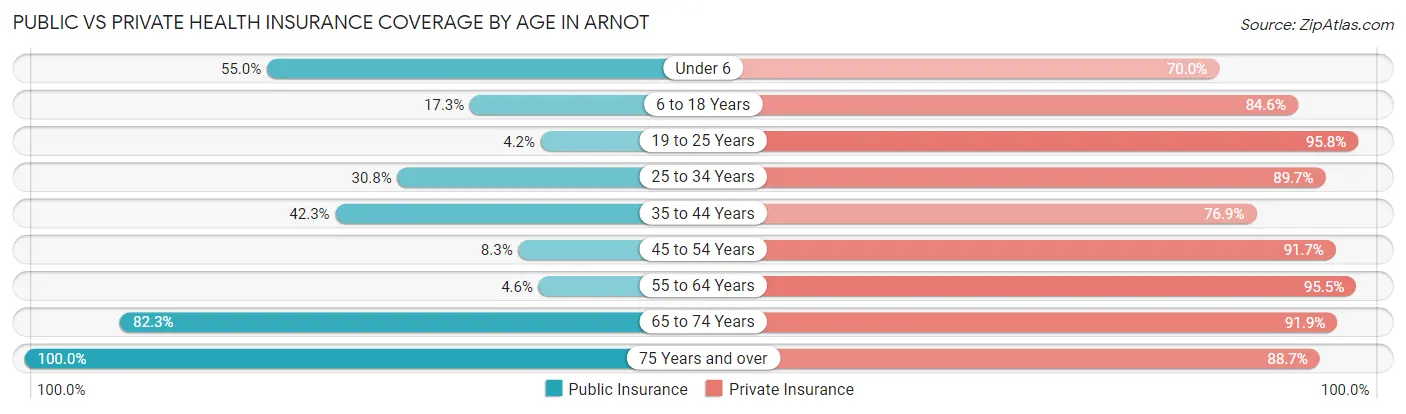
| Age Bracket | Public Insurance | Private Insurance |
| Under 6 | 11 (55.0%) | 14 (70.0%) |
| 6 to 18 Years | 9 (17.3%) | 44 (84.6%) |
| 19 to 25 Years | 2 (4.2%) | 46 (95.8%) |
| 25 to 34 Years | 12 (30.8%) | 35 (89.7%) |
| 35 to 44 Years | 11 (42.3%) | 20 (76.9%) |
| 45 to 54 Years | 4 (8.3%) | 44 (91.7%) |
| 55 to 64 Years | 3 (4.5%) | 63 (95.5%) |
| 65 to 74 Years | 102 (82.3%) | 114 (91.9%) |
| 75 Years and over | 53 (100.0%) | 47 (88.7%) |
| Total | 207 (43.5%) | 427 (89.7%) |
Disability Status by Sex by Age in Arnot
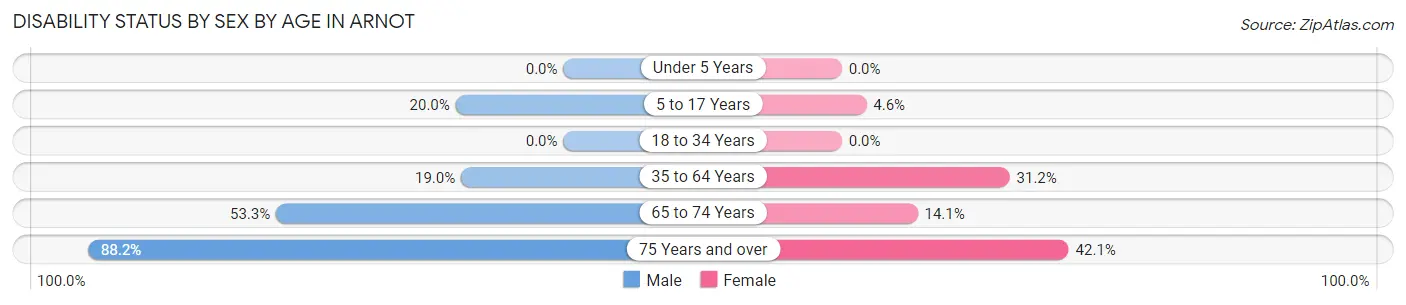
| Age Bracket | Male | Female |
| Under 5 Years | 0 (0.0%) | 0 (0.0%) |
| 5 to 17 Years | 5 (20.0%) | 1 (4.5%) |
| 18 to 34 Years | 0 (0.0%) | 0 (0.0%) |
| 35 to 64 Years | 15 (19.0%) | 19 (31.1%) |
| 65 to 74 Years | 32 (53.3%) | 9 (14.1%) |
| 75 Years and over | 30 (88.2%) | 8 (42.1%) |
Disability Class by Sex by Age in Arnot
Disability Class: Hearing Difficulty
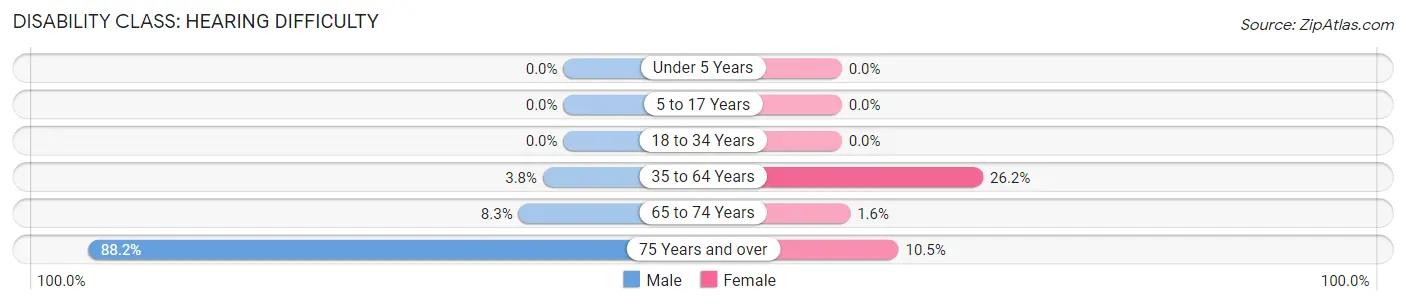
| Age Bracket | Male | Female |
| Under 5 Years | 0 (0.0%) | 0 (0.0%) |
| 5 to 17 Years | 0 (0.0%) | 0 (0.0%) |
| 18 to 34 Years | 0 (0.0%) | 0 (0.0%) |
| 35 to 64 Years | 3 (3.8%) | 16 (26.2%) |
| 65 to 74 Years | 5 (8.3%) | 1 (1.6%) |
| 75 Years and over | 30 (88.2%) | 2 (10.5%) |
Disability Class: Vision Difficulty
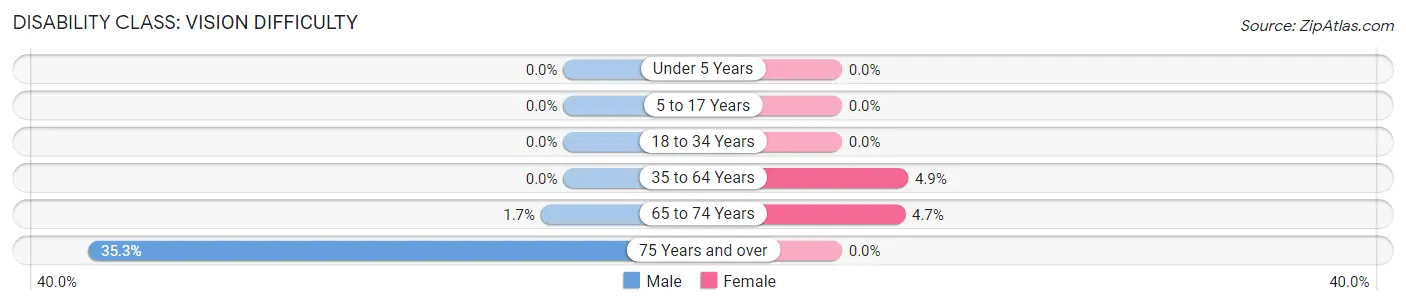
| Age Bracket | Male | Female |
| Under 5 Years | 0 (0.0%) | 0 (0.0%) |
| 5 to 17 Years | 0 (0.0%) | 0 (0.0%) |
| 18 to 34 Years | 0 (0.0%) | 0 (0.0%) |
| 35 to 64 Years | 0 (0.0%) | 3 (4.9%) |
| 65 to 74 Years | 1 (1.7%) | 3 (4.7%) |
| 75 Years and over | 12 (35.3%) | 0 (0.0%) |
Disability Class: Cognitive Difficulty
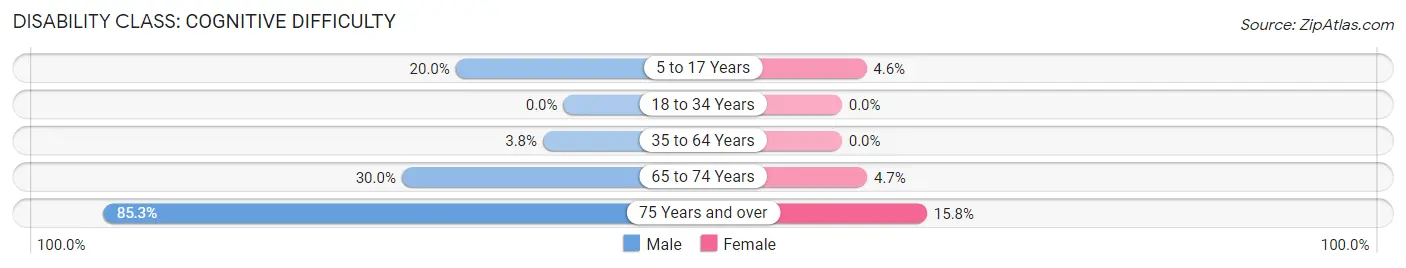
| Age Bracket | Male | Female |
| 5 to 17 Years | 5 (20.0%) | 1 (4.5%) |
| 18 to 34 Years | 0 (0.0%) | 0 (0.0%) |
| 35 to 64 Years | 3 (3.8%) | 0 (0.0%) |
| 65 to 74 Years | 18 (30.0%) | 3 (4.7%) |
| 75 Years and over | 29 (85.3%) | 3 (15.8%) |
Disability Class: Ambulatory Difficulty
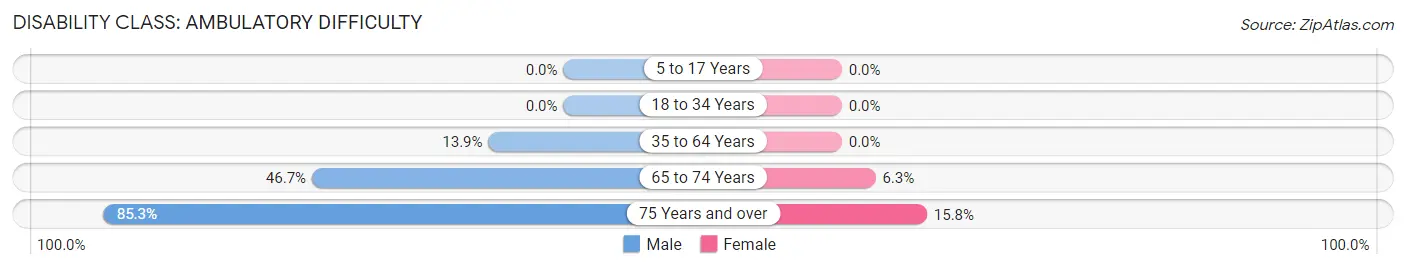
| Age Bracket | Male | Female |
| 5 to 17 Years | 0 (0.0%) | 0 (0.0%) |
| 18 to 34 Years | 0 (0.0%) | 0 (0.0%) |
| 35 to 64 Years | 11 (13.9%) | 0 (0.0%) |
| 65 to 74 Years | 28 (46.7%) | 4 (6.2%) |
| 75 Years and over | 29 (85.3%) | 3 (15.8%) |
Disability Class: Self-Care Difficulty
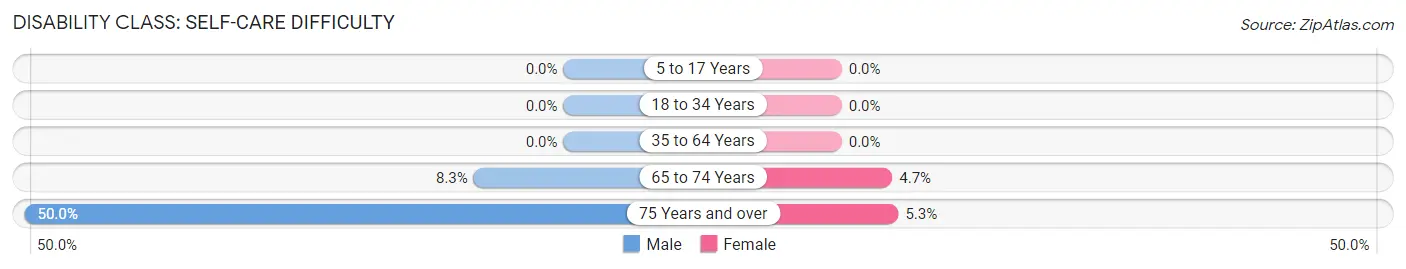
| Age Bracket | Male | Female |
| 5 to 17 Years | 0 (0.0%) | 0 (0.0%) |
| 18 to 34 Years | 0 (0.0%) | 0 (0.0%) |
| 35 to 64 Years | 0 (0.0%) | 0 (0.0%) |
| 65 to 74 Years | 5 (8.3%) | 3 (4.7%) |
| 75 Years and over | 17 (50.0%) | 1 (5.3%) |
Technology Access in Arnot
Computing Device Access in Arnot
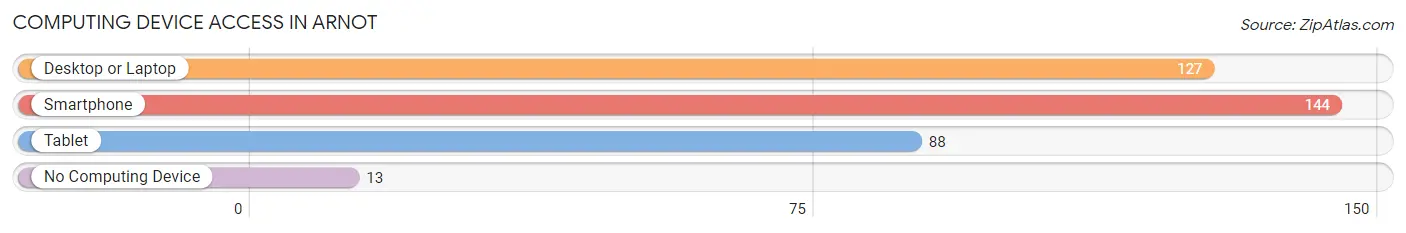
| Device Type | # Households | % Households |
| Desktop or Laptop | 127 | 72.6% |
| Smartphone | 144 | 82.3% |
| Tablet | 88 | 50.3% |
| No Computing Device | 13 | 7.4% |
| Total | 175 | 100.0% |
Internet Access in Arnot
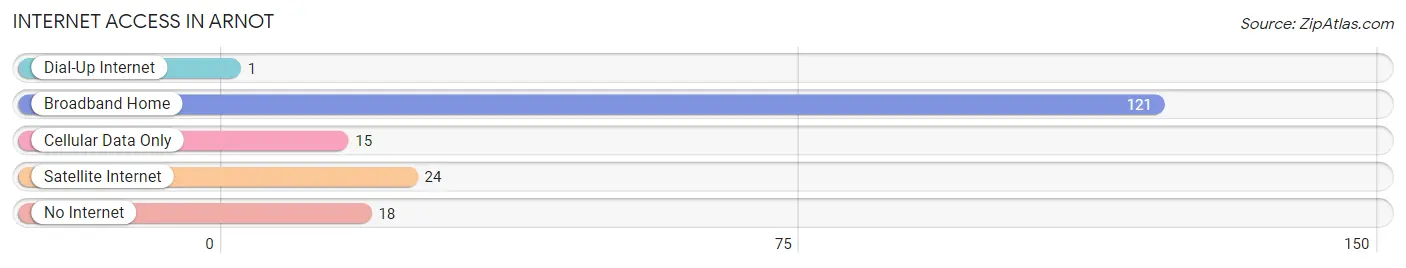
| Internet Type | # Households | % Households |
| Dial-Up Internet | 1 | 0.6% |
| Broadband Home | 121 | 69.1% |
| Cellular Data Only | 15 | 8.6% |
| Satellite Internet | 24 | 13.7% |
| No Internet | 18 | 10.3% |
| Total | 175 | 100.0% |
Arnot Summary
Arnot, Pennsylvania is a small borough located in Tioga County, Pennsylvania. It is situated in the northern part of the state, approximately 20 miles south of the New York border. The population of Arnot was 1,093 as of the 2010 census.
History
Arnot was founded in 1876 by the Arnot family, who had moved to the area from New York. The family purchased a large tract of land and began to develop the area. The town was named after the family, and the first post office was established in 1877.
The town grew slowly, but steadily, and by the early 1900s, it had become a thriving community. The town was home to a variety of businesses, including a sawmill, a grist mill, a tannery, a blacksmith shop, and a general store.
In the early 1900s, the town was also home to a number of churches, including the Methodist Episcopal Church, the Presbyterian Church, and the Baptist Church. The town also had a school, which was built in 1891.
Geography
Arnot is located in northern Tioga County, Pennsylvania. It is situated in the Appalachian Mountains, and is surrounded by rolling hills and forests. The town is located approximately 20 miles south of the New York border.
The town is situated along the Tioga River, which flows through the town. The river is a popular destination for fishing and canoeing.
Economy
The economy of Arnot is largely based on agriculture and tourism. The town is home to a number of farms, which produce a variety of crops, including corn, soybeans, and hay.
The town is also home to a number of tourist attractions, including the Tioga River, which is a popular destination for fishing and canoeing. The town is also home to a number of historic sites, including the Arnot Historic District, which is listed on the National Register of Historic Places.
Demographics
As of the 2010 census, the population of Arnot was 1,093. The racial makeup of the town was 97.3% White, 0.7% African American, 0.2% Native American, 0.2% Asian, 0.1% from other races, and 1.5% from two or more races. Hispanic or Latino of any race were 0.7% of the population.
The median income for a household in the town was $37,500, and the median income for a family was $45,000. The per capita income for the town was $17,845. About 11.2% of families and 14.2% of the population were below the poverty line, including 18.2% of those under age 18 and 8.3% of those age 65 or over.
Common Questions
What is Per Capita Income in Arnot?
Per Capita income in Arnot is $36,096.
What is the Median Family Income in Arnot?
Median Family Income in Arnot is $93,958.
What is the Median Household income in Arnot?
Median Household Income in Arnot is $86,250.
What is Income or Wage Gap in Arnot?
Income or Wage Gap in Arnot is 73.5%.
Women in Arnot earn 26.5 cents for every dollar earned by a man.
What is Family Income Deficit in Arnot?
Family Income Deficit in Arnot is $13,671.
Families that are below poverty line in Arnot earn $13,671 less on average than the poverty threshold level.
What is Inequality or Gini Index in Arnot?
Inequality or Gini Index in Arnot is 0.34.
What is the Total Population of Arnot?
Total Population of Arnot is 476.
What is the Total Male Population of Arnot?
Total Male Population of Arnot is 229.
What is the Total Female Population of Arnot?
Total Female Population of Arnot is 247.
What is the Ratio of Males per 100 Females in Arnot?
There are 92.71 Males per 100 Females in Arnot.
What is the Ratio of Females per 100 Males in Arnot?
There are 107.86 Females per 100 Males in Arnot.
What is the Median Population Age in Arnot?
Median Population Age in Arnot is 55.5 Years.
What is the Average Family Size in Arnot
Average Family Size in Arnot is 3.2 People.
What is the Average Household Size in Arnot
Average Household Size in Arnot is 2.7 People.
How Large is the Labor Force in Arnot?
There are 249 People in the Labor Forcein in Arnot.
What is the Percentage of People in the Labor Force in Arnot?
58.7% of People are in the Labor Force in Arnot.
What is the Unemployment Rate in Arnot?
Unemployment Rate in Arnot is 4.8%.