Zip Codes with the Highest Percentage of Population with a Degree in Visual and Performing Arts in Allentown, PA
RELATED REPORTS & OPTIONS
Visual and Performing Arts
Allentown
Compare Zip Codes
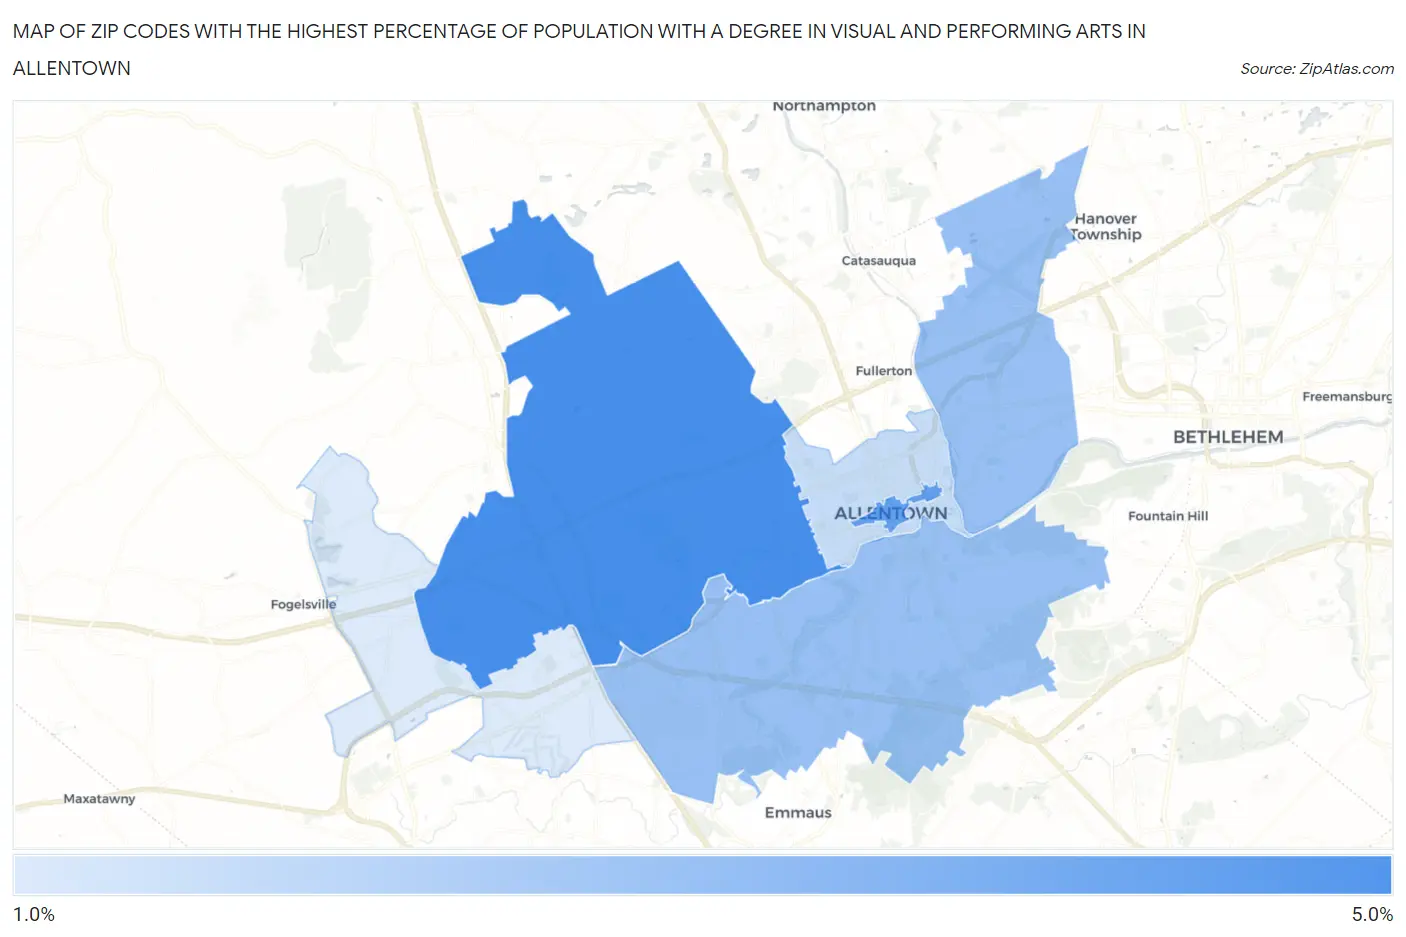
Map of Zip Codes with the Highest Percentage of Population with a Degree in Visual and Performing Arts in Allentown
1.3%
5.0%
Zip Codes with the Highest Percentage of Population with a Degree in Visual and Performing Arts in Allentown, PA
| Zip Code | % Graduates | vs State | vs National | |
| 1. | 18104 | 5.0% | 3.8%(+1.15)#320 | 4.3%(+0.724)#6,703 |
| 2. | 18101 | 4.3% | 3.8%(+0.476)#388 | 4.3%(+0.047)#8,354 |
| 3. | 18103 | 3.0% | 3.8%(-0.820)#616 | 4.3%(-1.25)#12,718 |
| 4. | 18109 | 3.0% | 3.8%(-0.859)#624 | 4.3%(-1.29)#12,866 |
| 5. | 18102 | 1.8% | 3.8%(-1.98)#862 | 4.3%(-2.41)#16,990 |
| 6. | 18106 | 1.3% | 3.8%(-2.52)#973 | 4.3%(-2.95)#18,767 |
1
Common Questions
What are the Top 5 Zip Codes with the Highest Percentage of Population with a Degree in Visual and Performing Arts in Allentown, PA?
Top 5 Zip Codes with the Highest Percentage of Population with a Degree in Visual and Performing Arts in Allentown, PA are:
What zip code has the Highest Percentage of Population with a Degree in Visual and Performing Arts in Allentown, PA?
18104 has the Highest Percentage of Population with a Degree in Visual and Performing Arts in Allentown, PA with 5.0%.
What is the Percentage of Population with a Degree in Visual and Performing Arts in Allentown, PA?
Percentage of Population with a Degree in Visual and Performing Arts in Allentown is 5.8%.
What is the Percentage of Population with a Degree in Visual and Performing Arts in Pennsylvania?
Percentage of Population with a Degree in Visual and Performing Arts in Pennsylvania is 3.8%.
What is the Percentage of Population with a Degree in Visual and Performing Arts in the United States?
Percentage of Population with a Degree in Visual and Performing Arts in the United States is 4.3%.