Calumet, PA Map & Demographics
Calumet Map
Calumet Overview
$39,021
PER CAPITA INCOME
$79,016
AVG FAMILY INCOME
$77,432
AVG HOUSEHOLD INCOME
18.1%
WAGE / INCOME GAP [ % ]
81.9¢/ $1
WAGE / INCOME GAP [ $ ]
0.27
INEQUALITY / GINI INDEX
1,101
TOTAL POPULATION
589
MALE POPULATION
512
FEMALE POPULATION
115.04
MALES / 100 FEMALES
86.93
FEMALES / 100 MALES
44.5
MEDIAN AGE
2.6
AVG FAMILY SIZE
2.0
AVG HOUSEHOLD SIZE
632
LABOR FORCE [ PEOPLE ]
67.2%
PERCENT IN LABOR FORCE
Calumet Area Codes
Income in Calumet
Income Overview in Calumet
Per Capita Income in Calumet is $39,021, while median incomes of families and households are $79,016 and $77,432 respectively.
| Characteristic | Number | Measure |
| Per Capita Income | 1,101 | $39,021 |
| Median Family Income | 307 | $79,016 |
| Mean Family Income | 307 | $82,973 |
| Median Household Income | 554 | $77,432 |
| Mean Household Income | 554 | $75,284 |
| Income Deficit | 307 | $0 |
| Wage / Income Gap (%) | 1,101 | 18.07% |
| Wage / Income Gap ($) | 1,101 | 81.93¢ per $1 |
| Gini / Inequality Index | 1,101 | 0.27 |
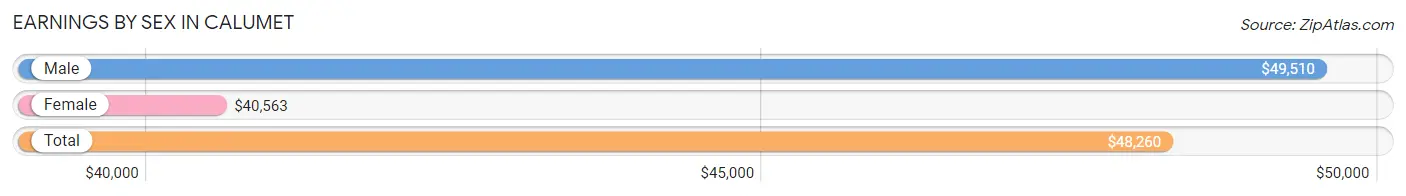
Earnings by Sex in Calumet
Average Earnings in Calumet are $48,260, $49,510 for men and $40,563 for women, a difference of 18.1%.
| Sex | Number | Average Earnings |
| Male | 400 (60.0%) | $49,510 |
| Female | 267 (40.0%) | $40,563 |
| Total | 667 (100.0%) | $48,260 |
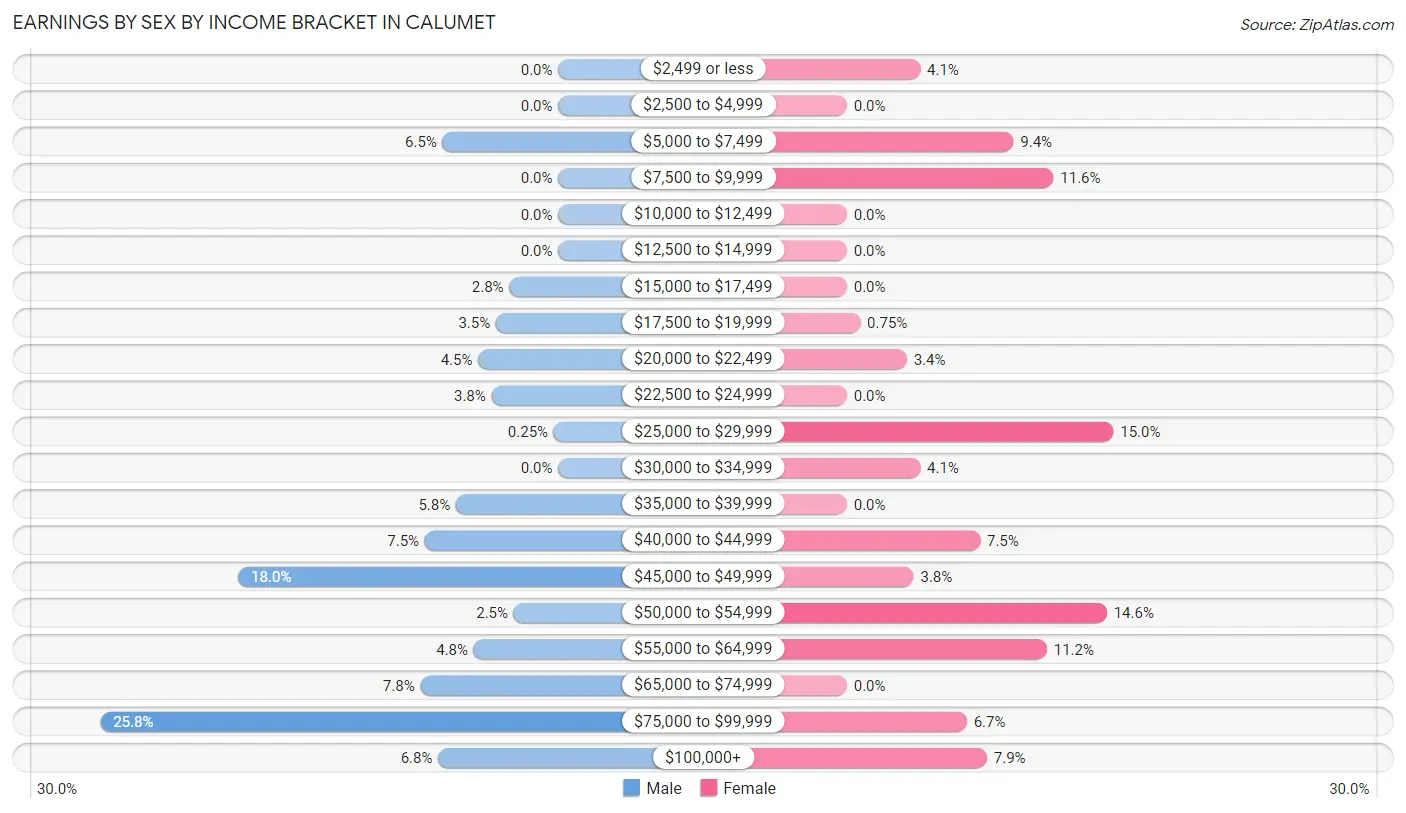
Earnings by Sex by Income Bracket in Calumet
The most common earnings brackets in Calumet are $75,000 to $99,999 for men (103 | 25.8%) and $25,000 to $29,999 for women (40 | 15.0%).
| Income | Male | Female |
| $2,499 or less | 0 (0.0%) | 11 (4.1%) |
| $2,500 to $4,999 | 0 (0.0%) | 0 (0.0%) |
| $5,000 to $7,499 | 26 (6.5%) | 25 (9.4%) |
| $7,500 to $9,999 | 0 (0.0%) | 31 (11.6%) |
| $10,000 to $12,499 | 0 (0.0%) | 0 (0.0%) |
| $12,500 to $14,999 | 0 (0.0%) | 0 (0.0%) |
| $15,000 to $17,499 | 11 (2.8%) | 0 (0.0%) |
| $17,500 to $19,999 | 14 (3.5%) | 2 (0.7%) |
| $20,000 to $22,499 | 18 (4.5%) | 9 (3.4%) |
| $22,500 to $24,999 | 15 (3.7%) | 0 (0.0%) |
| $25,000 to $29,999 | 1 (0.3%) | 40 (15.0%) |
| $30,000 to $34,999 | 0 (0.0%) | 11 (4.1%) |
| $35,000 to $39,999 | 23 (5.8%) | 0 (0.0%) |
| $40,000 to $44,999 | 30 (7.5%) | 20 (7.5%) |
| $45,000 to $49,999 | 72 (18.0%) | 10 (3.7%) |
| $50,000 to $54,999 | 10 (2.5%) | 39 (14.6%) |
| $55,000 to $64,999 | 19 (4.8%) | 30 (11.2%) |
| $65,000 to $74,999 | 31 (7.7%) | 0 (0.0%) |
| $75,000 to $99,999 | 103 (25.8%) | 18 (6.7%) |
| $100,000+ | 27 (6.8%) | 21 (7.9%) |
| Total | 400 (100.0%) | 267 (100.0%) |
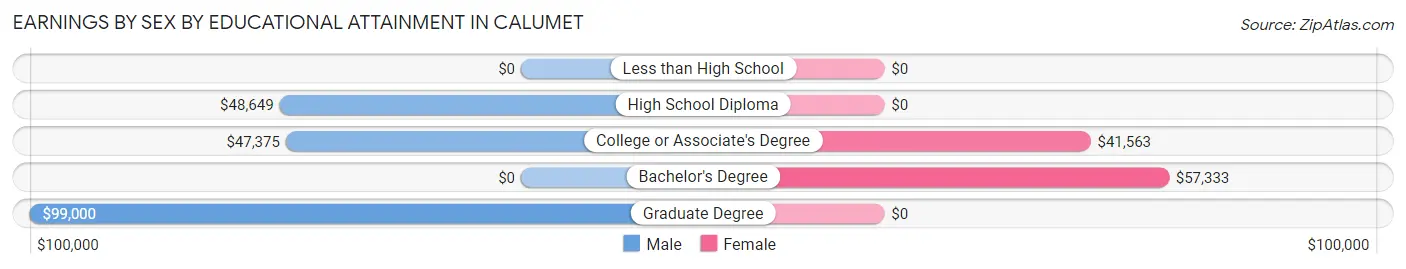
Earnings by Sex by Educational Attainment in Calumet
Average earnings in Calumet are $49,853 for men and $48,750 for women, a difference of 2.2%. Men with an educational attainment of graduate degree enjoy the highest average annual earnings of $99,000, while those with college or associate's degree education earn the least with $47,375. Women with an educational attainment of bachelor's degree earn the most with the average annual earnings of $57,333, while those with college or associate's degree education have the smallest earnings of $41,563.
| Educational Attainment | Male Income | Female Income |
| Less than High School | - | - |
| High School Diploma | $48,649 | $0 |
| College or Associate's Degree | $47,375 | $41,563 |
| Bachelor's Degree | - | - |
| Graduate Degree | $99,000 | $0 |
| Total | $49,853 | $48,750 |
Family Income in Calumet
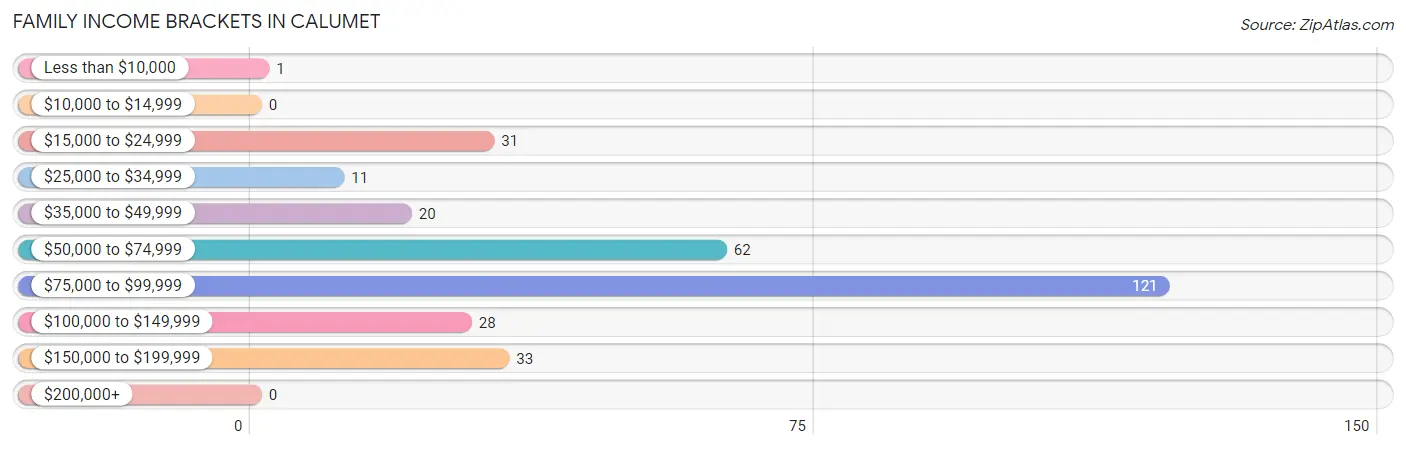
Family Income Brackets in Calumet
According to the Calumet family income data, there are 121 families falling into the $75,000 to $99,999 income range, which is the most common income bracket and makes up 39.4% of all families.
| Income Bracket | # Families | % Families |
| Less than $10,000 | 1 | 0.3% |
| $10,000 to $14,999 | 0 | 0.0% |
| $15,000 to $24,999 | 31 | 10.1% |
| $25,000 to $34,999 | 11 | 3.6% |
| $35,000 to $49,999 | 20 | 6.5% |
| $50,000 to $74,999 | 62 | 20.2% |
| $75,000 to $99,999 | 121 | 39.4% |
| $100,000 to $149,999 | 28 | 9.1% |
| $150,000 to $199,999 | 33 | 10.7% |
| $200,000+ | 0 | 0.0% |
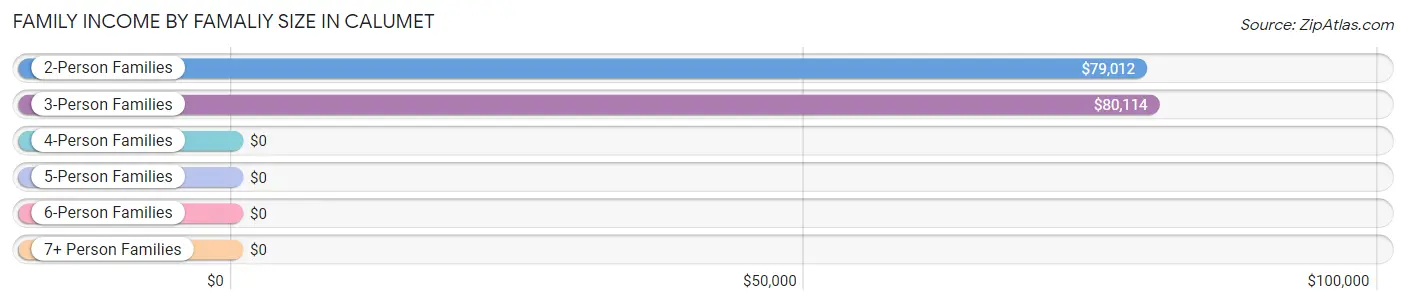
Family Income by Famaliy Size in Calumet
3-person families (41 | 13.4%) account for the highest median family income in Calumet with $80,114 per family, while 2-person families (222 | 72.3%) have the highest median income of $39,506 per family member.
| Income Bracket | # Families | Median Income |
| 2-Person Families | 222 (72.3%) | $79,012 |
| 3-Person Families | 41 (13.4%) | $80,114 |
| 4-Person Families | 24 (7.8%) | $0 |
| 5-Person Families | 20 (6.5%) | $0 |
| 6-Person Families | 0 (0.0%) | $0 |
| 7+ Person Families | 0 (0.0%) | $0 |
| Total | 307 (100.0%) | $79,016 |
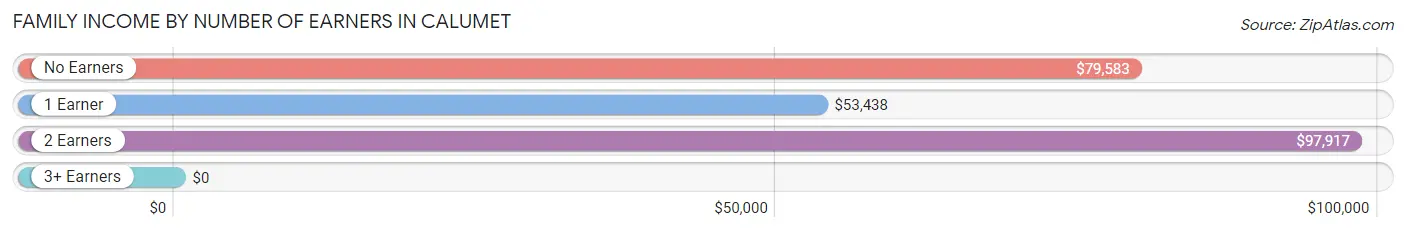
Family Income by Number of Earners in Calumet
| Number of Earners | # Families | Median Income |
| No Earners | 48 (15.6%) | $79,583 |
| 1 Earner | 126 (41.0%) | $53,438 |
| 2 Earners | 123 (40.1%) | $97,917 |
| 3+ Earners | 10 (3.3%) | $0 |
| Total | 307 (100.0%) | $79,016 |
Household Income in Calumet
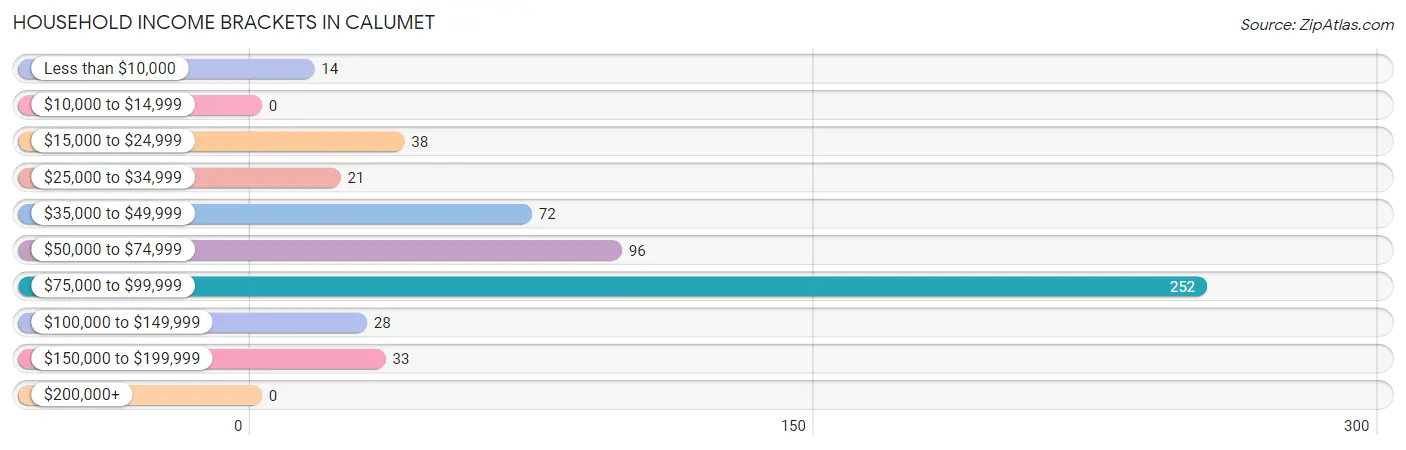
Household Income Brackets in Calumet
With 252 households falling in the category, the $75,000 to $99,999 income range is the most frequent in Calumet, accounting for 45.5% of all households.
| Income Bracket | # Households | % Households |
| Less than $10,000 | 14 | 2.5% |
| $10,000 to $14,999 | 0 | 0.0% |
| $15,000 to $24,999 | 38 | 6.9% |
| $25,000 to $34,999 | 21 | 3.8% |
| $35,000 to $49,999 | 72 | 13.0% |
| $50,000 to $74,999 | 96 | 17.3% |
| $75,000 to $99,999 | 252 | 45.5% |
| $100,000 to $149,999 | 28 | 5.1% |
| $150,000 to $199,999 | 33 | 6.0% |
| $200,000+ | 0 | 0.0% |
Household Income by Householder Age in Calumet
The median household income in Calumet is $77,432, with the highest median household income of $97,550 found in the 45 to 64 years age bracket for the primary householder. A total of 180 households (32.5%) fall into this category.
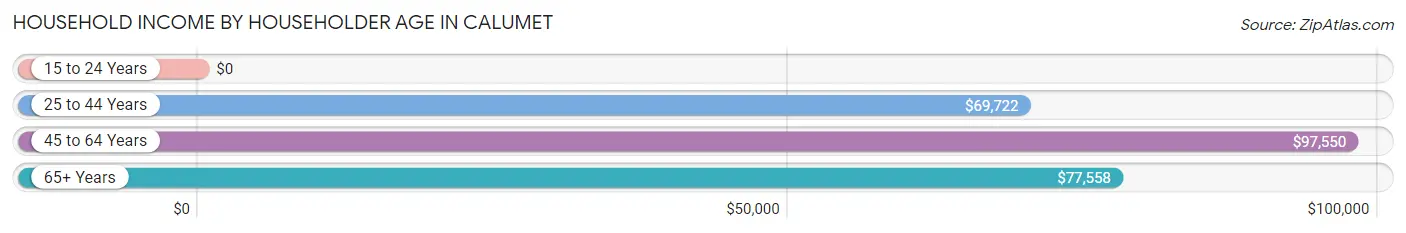
| Income Bracket | # Households | Median Income |
| 15 to 24 Years | 0 (0.0%) | $0 |
| 25 to 44 Years | 232 (41.9%) | $69,722 |
| 45 to 64 Years | 180 (32.5%) | $97,550 |
| 65+ Years | 142 (25.6%) | $77,558 |
| Total | 554 (100.0%) | $77,432 |
Poverty in Calumet
Income Below Poverty by Sex and Age in Calumet
With 3.2% poverty level for males and 7.8% for females among the residents of Calumet, 12 to 14 year old males and under 5 year old females are the most vulnerable to poverty, with 3 males (100.0%) and 1 females (100.0%) in their respective age groups living below the poverty level.
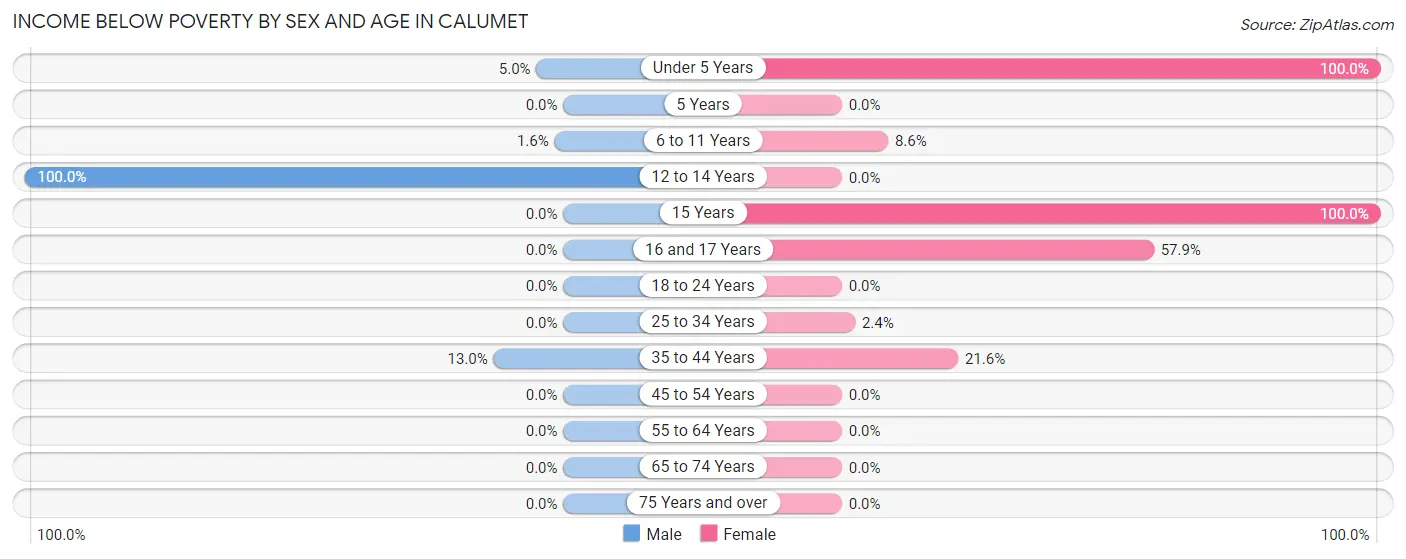
| Age Bracket | Male | Female |
| Under 5 Years | 1 (5.0%) | 1 (100.0%) |
| 5 Years | 0 (0.0%) | 0 (0.0%) |
| 6 to 11 Years | 1 (1.6%) | 3 (8.6%) |
| 12 to 14 Years | 3 (100.0%) | 0 (0.0%) |
| 15 Years | 0 (0.0%) | 2 (100.0%) |
| 16 and 17 Years | 0 (0.0%) | 11 (57.9%) |
| 18 to 24 Years | 0 (0.0%) | 0 (0.0%) |
| 25 to 34 Years | 0 (0.0%) | 1 (2.4%) |
| 35 to 44 Years | 14 (13.0%) | 22 (21.6%) |
| 45 to 54 Years | 0 (0.0%) | 0 (0.0%) |
| 55 to 64 Years | 0 (0.0%) | 0 (0.0%) |
| 65 to 74 Years | 0 (0.0%) | 0 (0.0%) |
| 75 Years and over | 0 (0.0%) | 0 (0.0%) |
| Total | 19 (3.2%) | 40 (7.8%) |
Income Above Poverty by Sex and Age in Calumet
According to the poverty statistics in Calumet, males aged 18 to 24 years and females aged 5 years are the age groups that are most secure financially, with 100.0% of males and 100.0% of females in these age groups living above the poverty line.
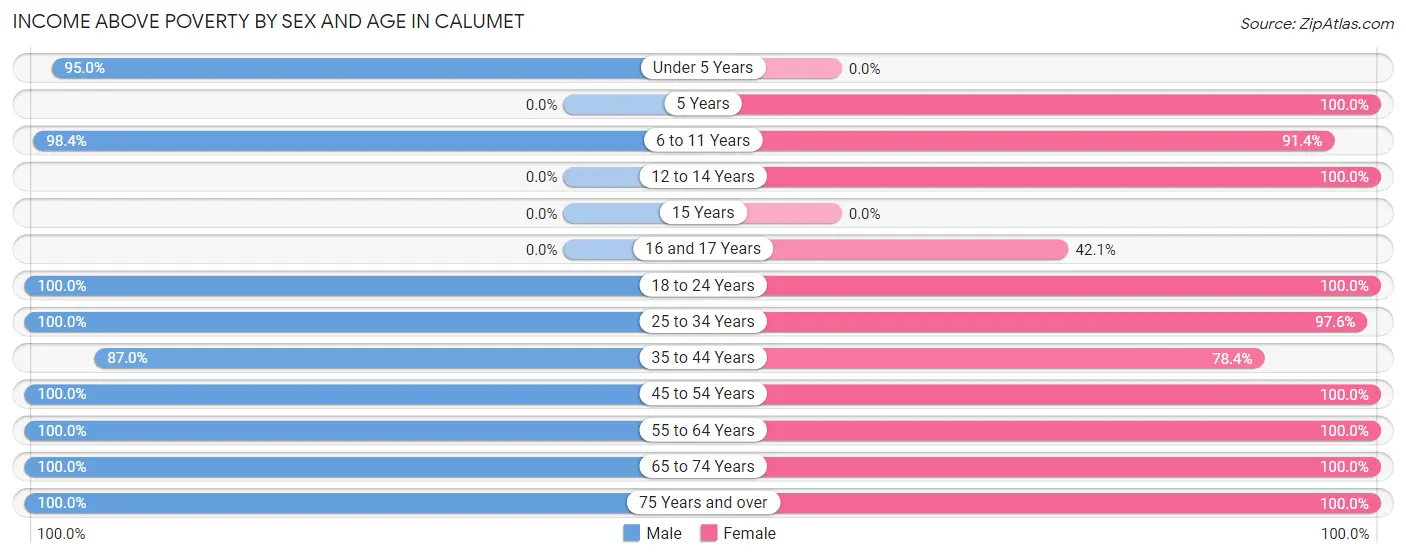
| Age Bracket | Male | Female |
| Under 5 Years | 19 (95.0%) | 0 (0.0%) |
| 5 Years | 0 (0.0%) | 5 (100.0%) |
| 6 to 11 Years | 60 (98.4%) | 32 (91.4%) |
| 12 to 14 Years | 0 (0.0%) | 33 (100.0%) |
| 15 Years | 0 (0.0%) | 0 (0.0%) |
| 16 and 17 Years | 0 (0.0%) | 8 (42.1%) |
| 18 to 24 Years | 14 (100.0%) | 58 (100.0%) |
| 25 to 34 Years | 58 (100.0%) | 40 (97.6%) |
| 35 to 44 Years | 94 (87.0%) | 80 (78.4%) |
| 45 to 54 Years | 126 (100.0%) | 45 (100.0%) |
| 55 to 64 Years | 108 (100.0%) | 73 (100.0%) |
| 65 to 74 Years | 33 (100.0%) | 44 (100.0%) |
| 75 Years and over | 58 (100.0%) | 54 (100.0%) |
| Total | 570 (96.8%) | 472 (92.2%) |
Income Below Poverty Among Married-Couple Families in Calumet
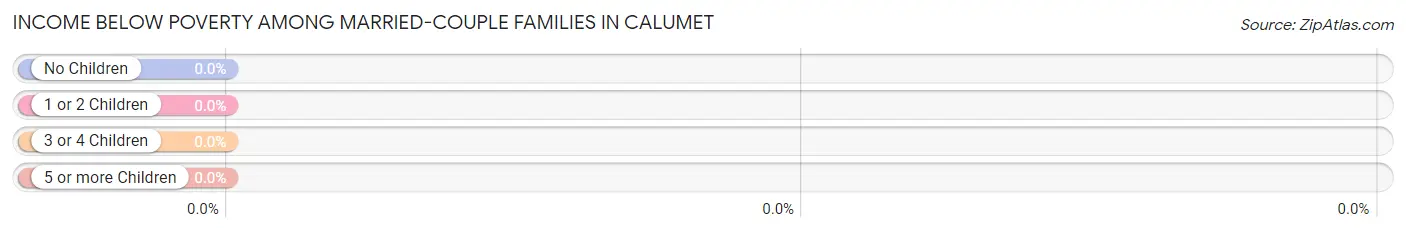
| Children | Above Poverty | Below Poverty |
| No Children | 141 (100.0%) | 0 (0.0%) |
| 1 or 2 Children | 30 (100.0%) | 0 (0.0%) |
| 3 or 4 Children | 20 (100.0%) | 0 (0.0%) |
| 5 or more Children | 0 (0.0%) | 0 (0.0%) |
| Total | 191 (100.0%) | 0 (0.0%) |
Income Below Poverty Among Single-Parent Households in Calumet
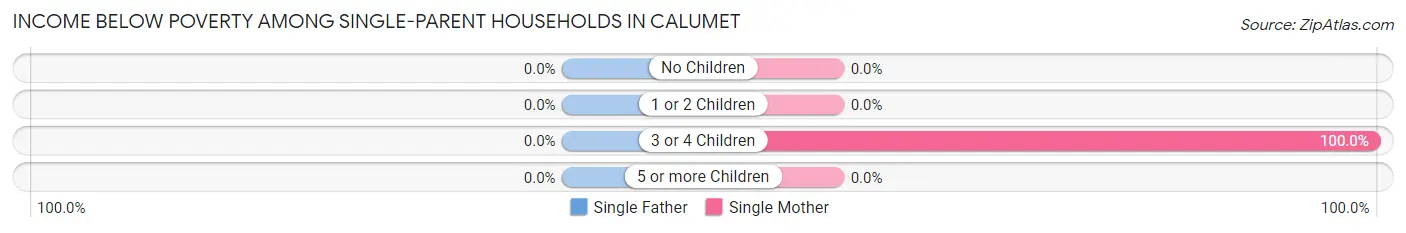
| Children | Single Father | Single Mother |
| No Children | 0 (0.0%) | 0 (0.0%) |
| 1 or 2 Children | 0 (0.0%) | 0 (0.0%) |
| 3 or 4 Children | 0 (0.0%) | 3 (100.0%) |
| 5 or more Children | 0 (0.0%) | 0 (0.0%) |
| Total | 0 (0.0%) | 3 (4.5%) |
Income Below Poverty Among Married-Couple vs Single-Parent Households in Calumet
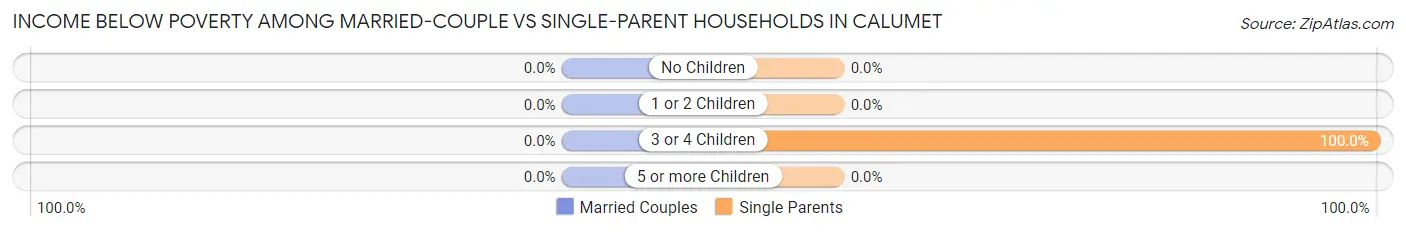
| Children | Married-Couple Families | Single-Parent Households |
| No Children | 0 (0.0%) | 0 (0.0%) |
| 1 or 2 Children | 0 (0.0%) | 0 (0.0%) |
| 3 or 4 Children | 0 (0.0%) | 3 (100.0%) |
| 5 or more Children | 0 (0.0%) | 0 (0.0%) |
| Total | 0 (0.0%) | 3 (2.6%) |
Race in Calumet
The most populous races in Calumet are , and White / Caucasian (1,101 | 100.0%).
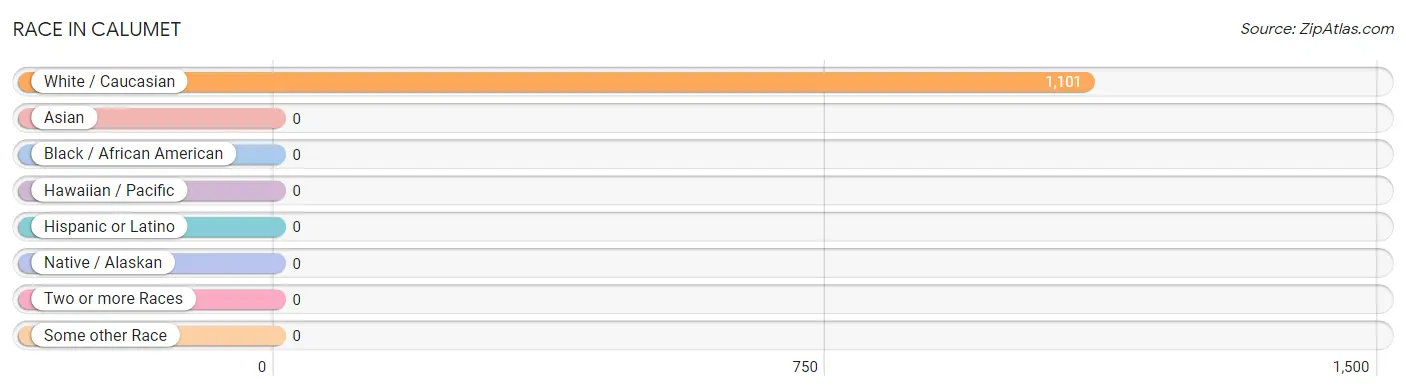
| Race | # Population | % Population |
| Asian | 0 | 0.0% |
| Black / African American | 0 | 0.0% |
| Hawaiian / Pacific | 0 | 0.0% |
| Hispanic or Latino | 0 | 0.0% |
| Native / Alaskan | 0 | 0.0% |
| White / Caucasian | 1,101 | 100.0% |
| Two or more Races | 0 | 0.0% |
| Some other Race | 0 | 0.0% |
| Total | 1,101 | 100.0% |
Ancestry in Calumet
The most populous ancestries reported in Calumet are German (340 | 30.9%), Irish (167 | 15.2%), Polish (153 | 13.9%), Italian (142 | 12.9%), and Slovak (99 | 9.0%), together accounting for 81.8% of all Calumet residents.
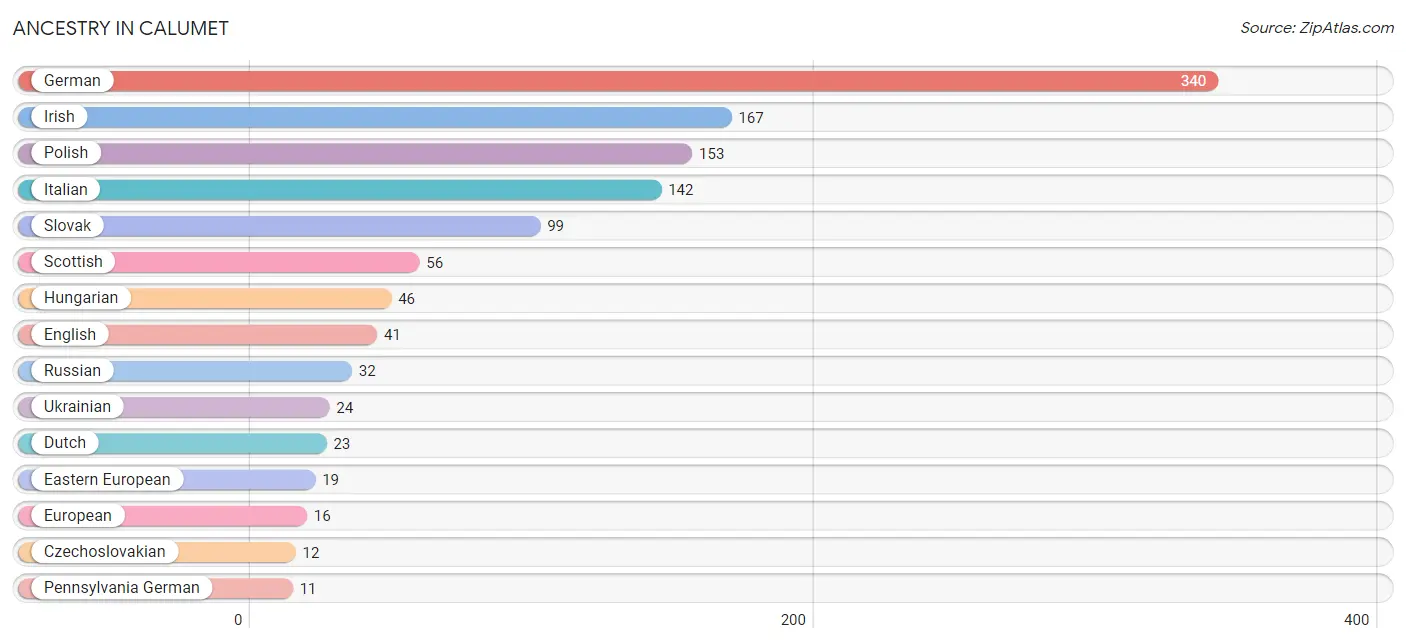
| Ancestry | # Population | % Population |
| Arab | 7 | 0.6% |
| Czechoslovakian | 12 | 1.1% |
| Dutch | 23 | 2.1% |
| Eastern European | 19 | 1.7% |
| English | 41 | 3.7% |
| European | 16 | 1.5% |
| French | 9 | 0.8% |
| German | 340 | 30.9% |
| Hungarian | 46 | 4.2% |
| Irish | 167 | 15.2% |
| Italian | 142 | 12.9% |
| Pennsylvania German | 11 | 1.0% |
| Polish | 153 | 13.9% |
| Russian | 32 | 2.9% |
| Scottish | 56 | 5.1% |
| Slavic | 8 | 0.7% |
| Slovak | 99 | 9.0% |
| Syrian | 7 | 0.6% |
| Ukrainian | 24 | 2.2% |
| Yugoslavian | 10 | 0.9% | View All 20 Rows |
Immigrants in Calumet

| Immigration Origin | # Population | % Population | View All 0 Rows |
Sex and Age in Calumet
Sex and Age in Calumet
The most populous age groups in Calumet are 55 to 59 Years (85 | 14.4%) for men and 10 to 14 Years (54 | 10.5%) for women.
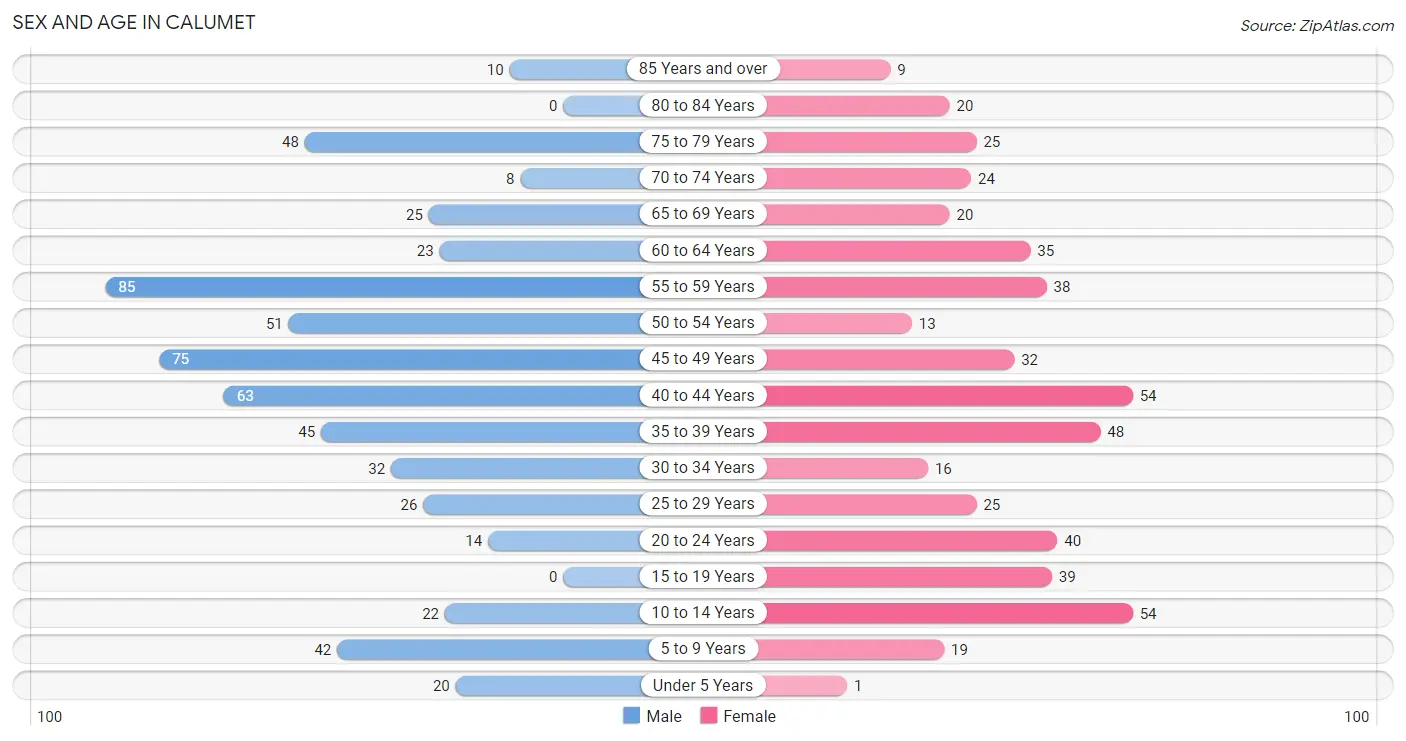
| Age Bracket | Male | Female |
| Under 5 Years | 20 (3.4%) | 1 (0.2%) |
| 5 to 9 Years | 42 (7.1%) | 19 (3.7%) |
| 10 to 14 Years | 22 (3.7%) | 54 (10.5%) |
| 15 to 19 Years | 0 (0.0%) | 39 (7.6%) |
| 20 to 24 Years | 14 (2.4%) | 40 (7.8%) |
| 25 to 29 Years | 26 (4.4%) | 25 (4.9%) |
| 30 to 34 Years | 32 (5.4%) | 16 (3.1%) |
| 35 to 39 Years | 45 (7.6%) | 48 (9.4%) |
| 40 to 44 Years | 63 (10.7%) | 54 (10.5%) |
| 45 to 49 Years | 75 (12.7%) | 32 (6.2%) |
| 50 to 54 Years | 51 (8.7%) | 13 (2.5%) |
| 55 to 59 Years | 85 (14.4%) | 38 (7.4%) |
| 60 to 64 Years | 23 (3.9%) | 35 (6.8%) |
| 65 to 69 Years | 25 (4.2%) | 20 (3.9%) |
| 70 to 74 Years | 8 (1.4%) | 24 (4.7%) |
| 75 to 79 Years | 48 (8.2%) | 25 (4.9%) |
| 80 to 84 Years | 0 (0.0%) | 20 (3.9%) |
| 85 Years and over | 10 (1.7%) | 9 (1.8%) |
| Total | 589 (100.0%) | 512 (100.0%) |
Families and Households in Calumet
Median Family Size in Calumet
The median family size in Calumet is 2.58 persons per family, with married-couple families (191 | 62.2%) accounting for the largest median family size of 2.68 persons per family. On the other hand, single male/father families (49 | 16.0%) represent the smallest median family size with 2.14 persons per family.
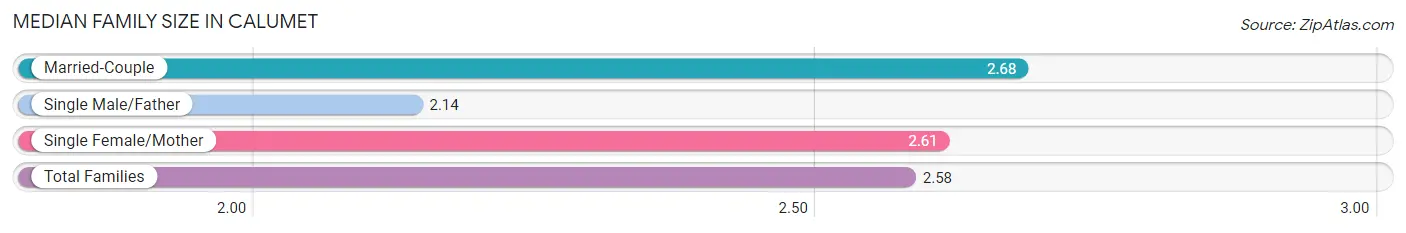
| Family Type | # Families | Family Size |
| Married-Couple | 191 (62.2%) | 2.68 |
| Single Male/Father | 49 (16.0%) | 2.14 |
| Single Female/Mother | 67 (21.8%) | 2.61 |
| Total Families | 307 (100.0%) | 2.58 |
Median Household Size in Calumet
The median household size in Calumet is 1.99 persons per household, with single female/mother households (67 | 12.1%) accounting for the largest median household size of 2.85 persons per household. non-family households (247 | 44.6%) represent the smallest median household size with 1.15 persons per household.
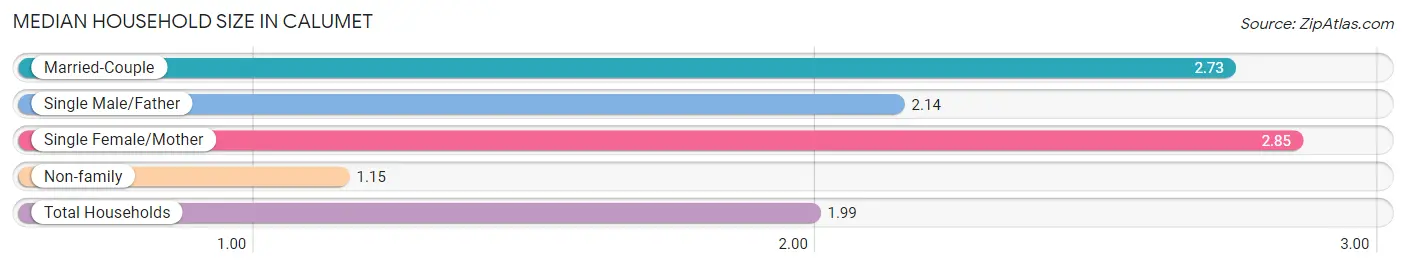
| Household Type | # Households | Household Size |
| Married-Couple | 191 (34.5%) | 2.73 |
| Single Male/Father | 49 (8.8%) | 2.14 |
| Single Female/Mother | 67 (12.1%) | 2.85 |
| Non-family | 247 (44.6%) | 1.15 |
| Total Households | 554 (100.0%) | 1.99 |
Household Size by Marriage Status in Calumet
Out of a total of 554 households in Calumet, 307 (55.4%) are family households, while 247 (44.6%) are nonfamily households. The most numerous type of family households are 2-person households, comprising 207, and the most common type of nonfamily households are 1-person households, comprising 211.
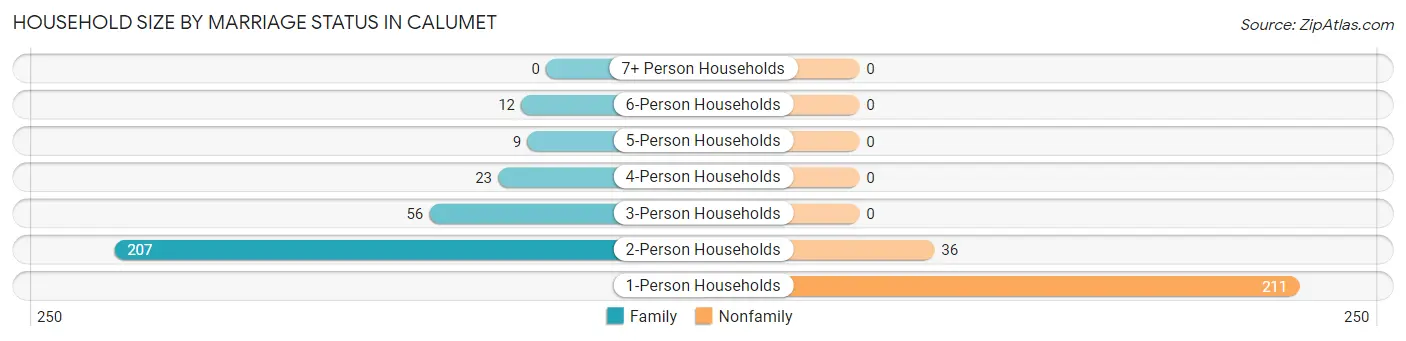
| Household Size | Family Households | Nonfamily Households |
| 1-Person Households | - | 211 (38.1%) |
| 2-Person Households | 207 (37.4%) | 36 (6.5%) |
| 3-Person Households | 56 (10.1%) | 0 (0.0%) |
| 4-Person Households | 23 (4.2%) | 0 (0.0%) |
| 5-Person Households | 9 (1.6%) | 0 (0.0%) |
| 6-Person Households | 12 (2.2%) | 0 (0.0%) |
| 7+ Person Households | 0 (0.0%) | 0 (0.0%) |
| Total | 307 (55.4%) | 247 (44.6%) |
Female Fertility in Calumet
Fertility by Age in Calumet
| Age Bracket | Women with Births | Births / 1,000 Women |
| 15 to 19 years | 0 (0.0%) | 0.0 |
| 20 to 34 years | 0 (0.0%) | 0.0 |
| 35 to 50 years | 0 (0.0%) | 0.0 |
| Total | 0 (0.0%) | 0.0 |
Fertility by Age by Marriage Status in Calumet
| Age Bracket | Married | Unmarried |
| 15 to 19 years | 0 (0.0%) | 0 (0.0%) |
| 20 to 34 years | 0 (0.0%) | 0 (0.0%) |
| 35 to 50 years | 0 (0.0%) | 0 (0.0%) |
| Total | 0 (0.0%) | 0 (0.0%) |
Fertility by Education in Calumet
| Educational Attainment | Women with Births | Births / 1,000 Women |
| Less than High School | 0 (0.0%) | 0.0 |
| High School Diploma | 0 (0.0%) | 0.0 |
| College or Associate's Degree | 0 (0.0%) | 0.0 |
| Bachelor's Degree | 0 (0.0%) | 0.0 |
| Graduate Degree | 0 (0.0%) | 0.0 |
| Total | 0 (0.0%) | 0.0 |
Fertility by Education by Marriage Status in Calumet
| Educational Attainment | Married | Unmarried |
| Less than High School | 0 (0.0%) | 0 (0.0%) |
| High School Diploma | 0 (0.0%) | 0 (0.0%) |
| College or Associate's Degree | 0 (0.0%) | 0 (0.0%) |
| Bachelor's Degree | 0 (0.0%) | 0 (0.0%) |
| Graduate Degree | 0 (0.0%) | 0 (0.0%) |
| Total | 0 (0.0%) | 0 (0.0%) |
Employment Characteristics in Calumet
Employment by Class of Employer in Calumet
Among the 632 employed individuals in Calumet, private company employees (468 | 74.1%), state government employees (65 | 10.3%), and local government employees (39 | 6.2%) make up the most common classes of employment.
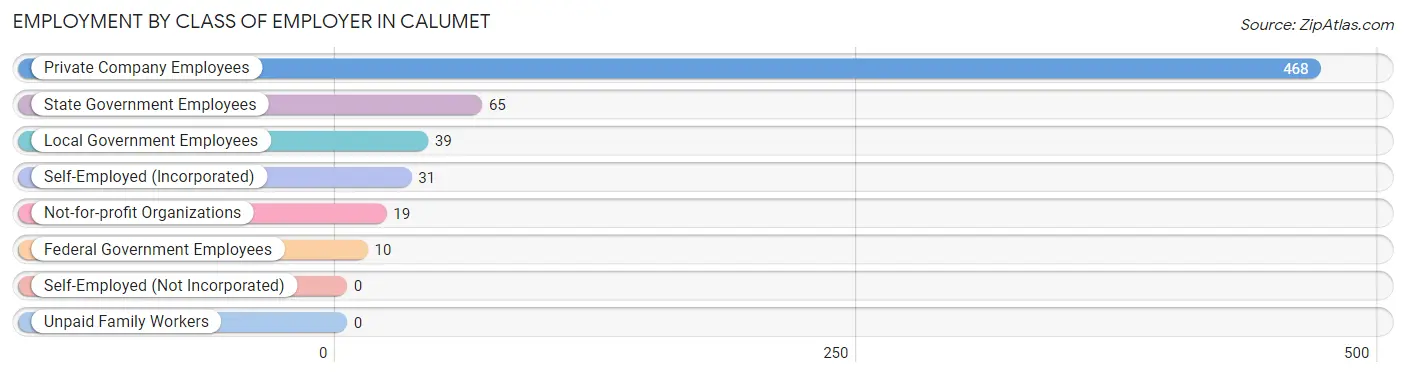
| Employer Class | # Employees | % Employees |
| Private Company Employees | 468 | 74.1% |
| Self-Employed (Incorporated) | 31 | 4.9% |
| Self-Employed (Not Incorporated) | 0 | 0.0% |
| Not-for-profit Organizations | 19 | 3.0% |
| Local Government Employees | 39 | 6.2% |
| State Government Employees | 65 | 10.3% |
| Federal Government Employees | 10 | 1.6% |
| Unpaid Family Workers | 0 | 0.0% |
| Total | 632 | 100.0% |
Employment Status by Age in Calumet
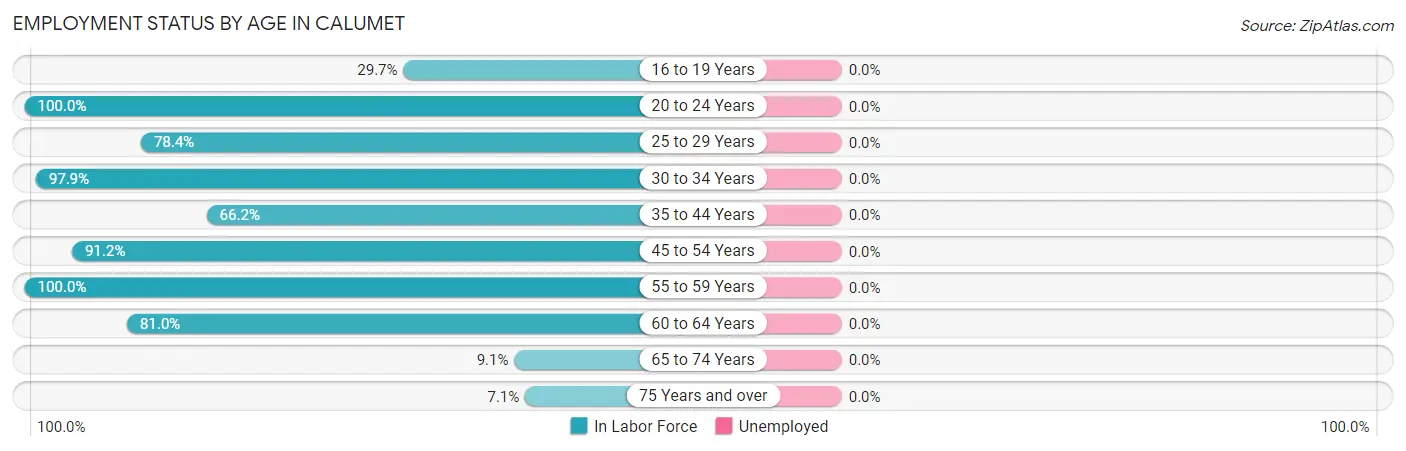
| Age Bracket | In Labor Force | Unemployed |
| 16 to 19 Years | 11 (29.7%) | 0 (0.0%) |
| 20 to 24 Years | 54 (100.0%) | 0 (0.0%) |
| 25 to 29 Years | 40 (78.4%) | 0 (0.0%) |
| 30 to 34 Years | 47 (97.9%) | 0 (0.0%) |
| 35 to 44 Years | 139 (66.2%) | 0 (0.0%) |
| 45 to 54 Years | 156 (91.2%) | 0 (0.0%) |
| 55 to 59 Years | 123 (100.0%) | 0 (0.0%) |
| 60 to 64 Years | 47 (81.0%) | 0 (0.0%) |
| 65 to 74 Years | 7 (9.1%) | 0 (0.0%) |
| 75 Years and over | 8 (7.1%) | 0 (0.0%) |
| Total | 632 (67.2%) | 0 (0.0%) |
Employment Status by Educational Attainment in Calumet
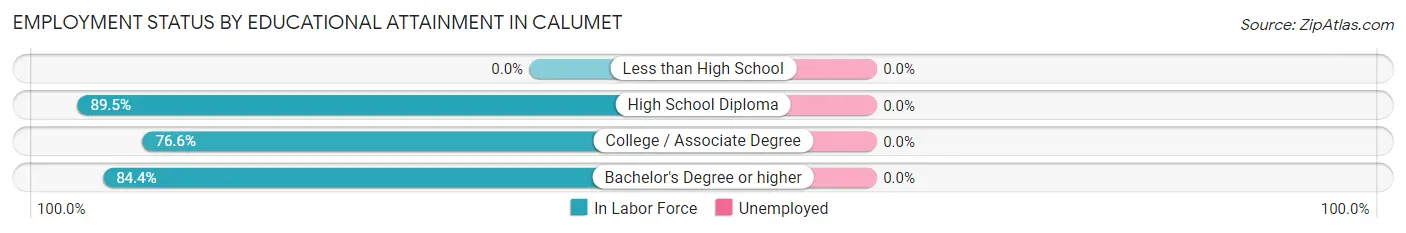
| Educational Attainment | In Labor Force | Unemployed |
| Less than High School | 0 (0.0%) | 0 (0.0%) |
| High School Diploma | 221 (89.5%) | 0 (0.0%) |
| College / Associate Degree | 180 (76.6%) | 0 (0.0%) |
| Bachelor's Degree or higher | 151 (84.4%) | 0 (0.0%) |
| Total | 552 (83.5%) | 0 (0.0%) |
Employment Occupations by Sex in Calumet
Management, Business, Science and Arts Occupations
The most common Management, Business, Science and Arts occupations in Calumet are Health Diagnosing & Treating (75 | 11.9%), Community & Social Service (73 | 11.6%), Education Instruction & Library (65 | 10.3%), Computers, Engineering & Science (18 | 2.9%), and Management (17 | 2.7%).
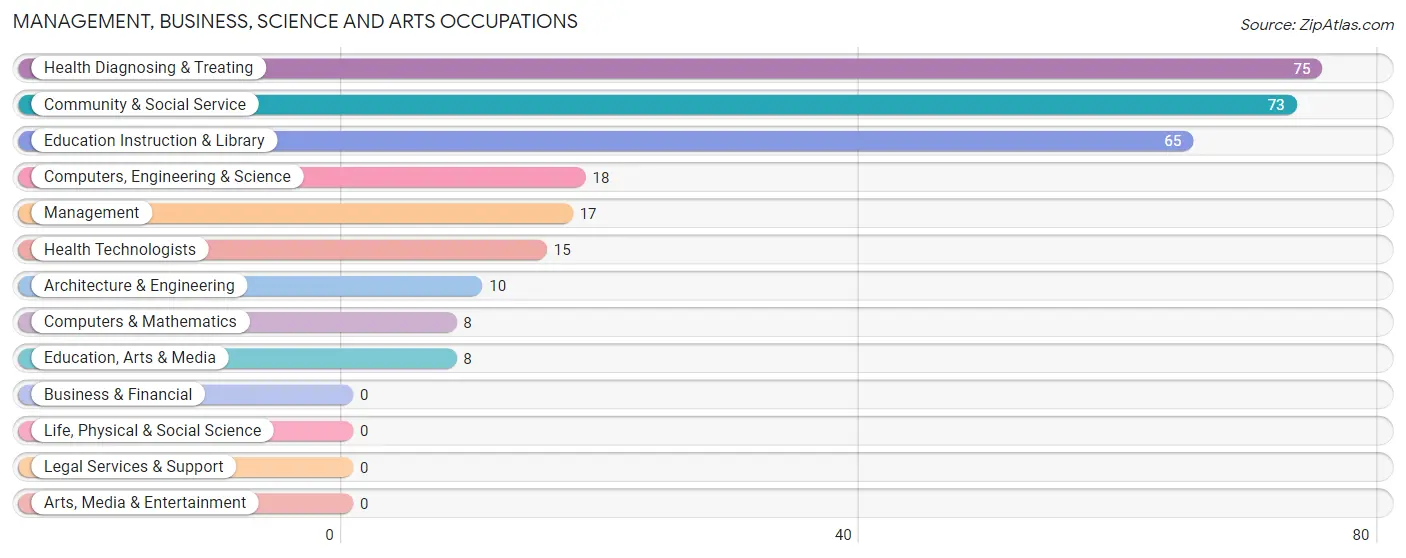
Management, Business, Science and Arts Occupations by Sex
Within the Management, Business, Science and Arts occupations in Calumet, the most male-oriented occupations are Computers & Mathematics (100.0%), Education Instruction & Library (76.9%), and Health Diagnosing & Treating (70.7%), while the most female-oriented occupations are Management (100.0%), Architecture & Engineering (100.0%), and Education, Arts & Media (100.0%).
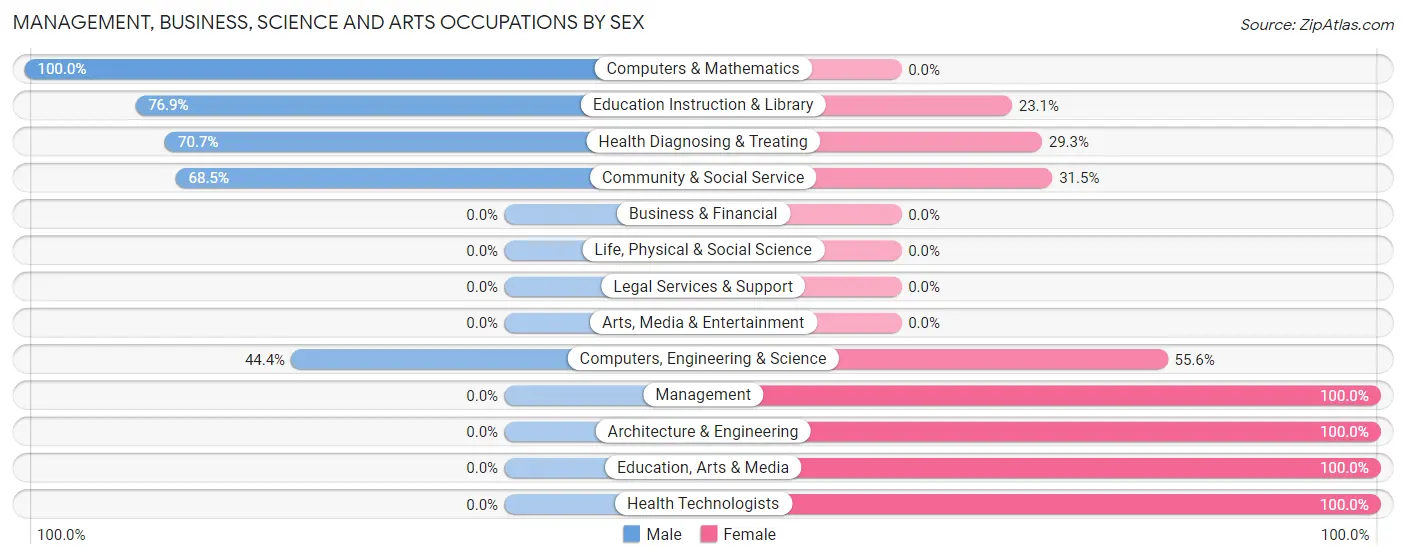
| Occupation | Male | Female |
| Management | 0 (0.0%) | 17 (100.0%) |
| Business & Financial | 0 (0.0%) | 0 (0.0%) |
| Computers, Engineering & Science | 8 (44.4%) | 10 (55.6%) |
| Computers & Mathematics | 8 (100.0%) | 0 (0.0%) |
| Architecture & Engineering | 0 (0.0%) | 10 (100.0%) |
| Life, Physical & Social Science | 0 (0.0%) | 0 (0.0%) |
| Community & Social Service | 50 (68.5%) | 23 (31.5%) |
| Education, Arts & Media | 0 (0.0%) | 8 (100.0%) |
| Legal Services & Support | 0 (0.0%) | 0 (0.0%) |
| Education Instruction & Library | 50 (76.9%) | 15 (23.1%) |
| Arts, Media & Entertainment | 0 (0.0%) | 0 (0.0%) |
| Health Diagnosing & Treating | 53 (70.7%) | 22 (29.3%) |
| Health Technologists | 0 (0.0%) | 15 (100.0%) |
| Total (Category) | 111 (60.7%) | 72 (39.3%) |
| Total (Overall) | 374 (59.2%) | 258 (40.8%) |
Services Occupations
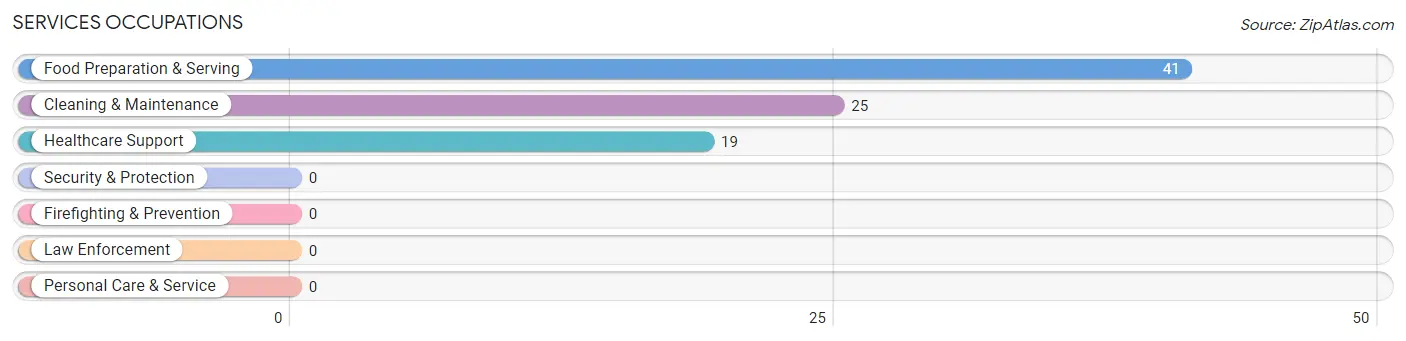
The most common Services occupations in Calumet are Food Preparation & Serving (41 | 6.5%), Cleaning & Maintenance (25 | 4.0%), and Healthcare Support (19 | 3.0%).
Services Occupations by Sex
Within the Services occupations in Calumet, the most male-oriented occupations are Food Preparation & Serving (68.3%), and Cleaning & Maintenance (44.0%), while the most female-oriented occupations are Healthcare Support (100.0%), Cleaning & Maintenance (56.0%), and Food Preparation & Serving (31.7%).
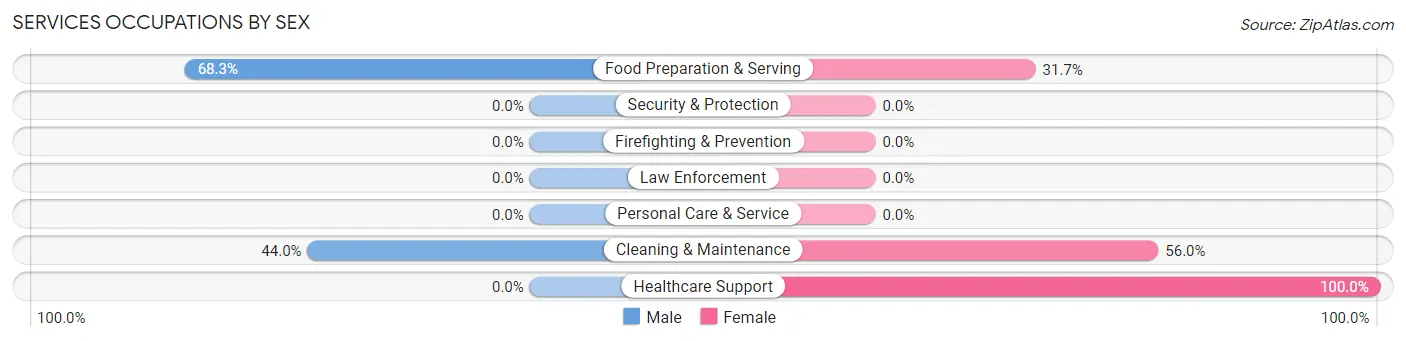
| Occupation | Male | Female |
| Healthcare Support | 0 (0.0%) | 19 (100.0%) |
| Security & Protection | 0 (0.0%) | 0 (0.0%) |
| Firefighting & Prevention | 0 (0.0%) | 0 (0.0%) |
| Law Enforcement | 0 (0.0%) | 0 (0.0%) |
| Food Preparation & Serving | 28 (68.3%) | 13 (31.7%) |
| Cleaning & Maintenance | 11 (44.0%) | 14 (56.0%) |
| Personal Care & Service | 0 (0.0%) | 0 (0.0%) |
| Total (Category) | 39 (45.9%) | 46 (54.1%) |
| Total (Overall) | 374 (59.2%) | 258 (40.8%) |
Sales and Office Occupations
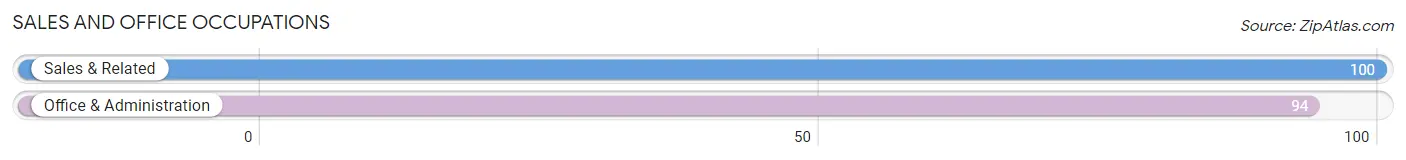
The most common Sales and Office occupations in Calumet are Sales & Related (100 | 15.8%), and Office & Administration (94 | 14.9%).
Sales and Office Occupations by Sex
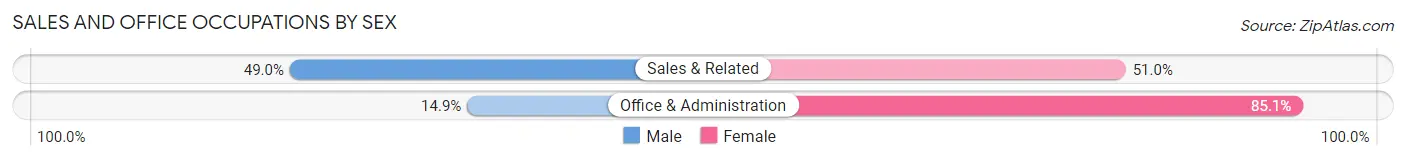
| Occupation | Male | Female |
| Sales & Related | 49 (49.0%) | 51 (51.0%) |
| Office & Administration | 14 (14.9%) | 80 (85.1%) |
| Total (Category) | 63 (32.5%) | 131 (67.5%) |
| Total (Overall) | 374 (59.2%) | 258 (40.8%) |
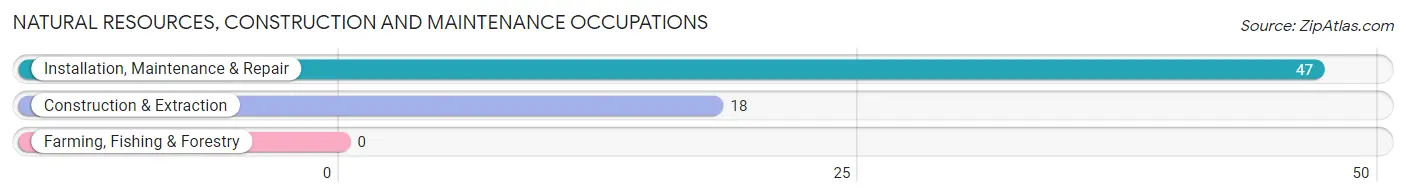
Natural Resources, Construction and Maintenance Occupations
The most common Natural Resources, Construction and Maintenance occupations in Calumet are Installation, Maintenance & Repair (47 | 7.4%), and Construction & Extraction (18 | 2.9%).
Natural Resources, Construction and Maintenance Occupations by Sex
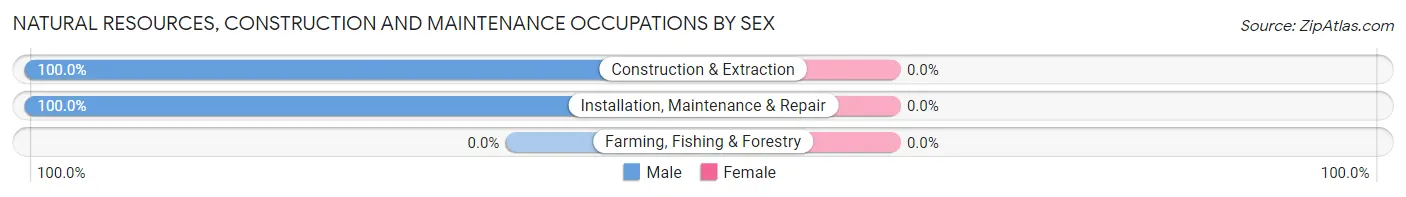
| Occupation | Male | Female |
| Farming, Fishing & Forestry | 0 (0.0%) | 0 (0.0%) |
| Construction & Extraction | 18 (100.0%) | 0 (0.0%) |
| Installation, Maintenance & Repair | 47 (100.0%) | 0 (0.0%) |
| Total (Category) | 65 (100.0%) | 0 (0.0%) |
| Total (Overall) | 374 (59.2%) | 258 (40.8%) |
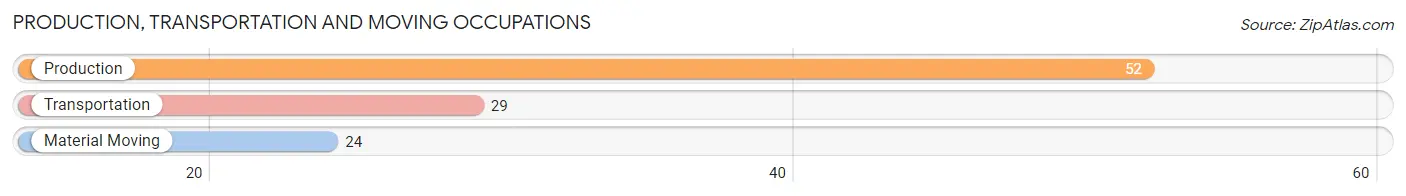
Production, Transportation and Moving Occupations
The most common Production, Transportation and Moving occupations in Calumet are Production (52 | 8.2%), Transportation (29 | 4.6%), and Material Moving (24 | 3.8%).
Production, Transportation and Moving Occupations by Sex
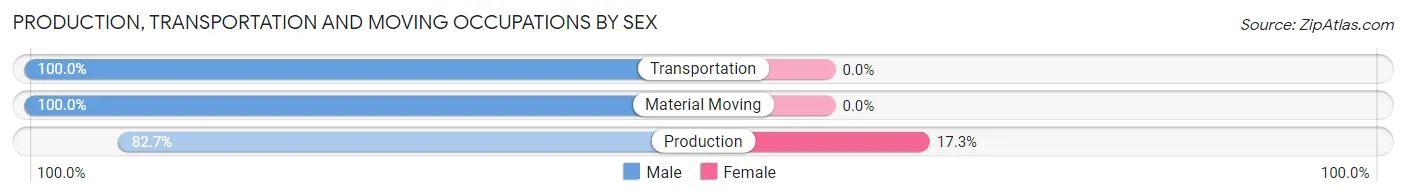
| Occupation | Male | Female |
| Production | 43 (82.7%) | 9 (17.3%) |
| Transportation | 29 (100.0%) | 0 (0.0%) |
| Material Moving | 24 (100.0%) | 0 (0.0%) |
| Total (Category) | 96 (91.4%) | 9 (8.6%) |
| Total (Overall) | 374 (59.2%) | 258 (40.8%) |
Employment Industries by Sex in Calumet
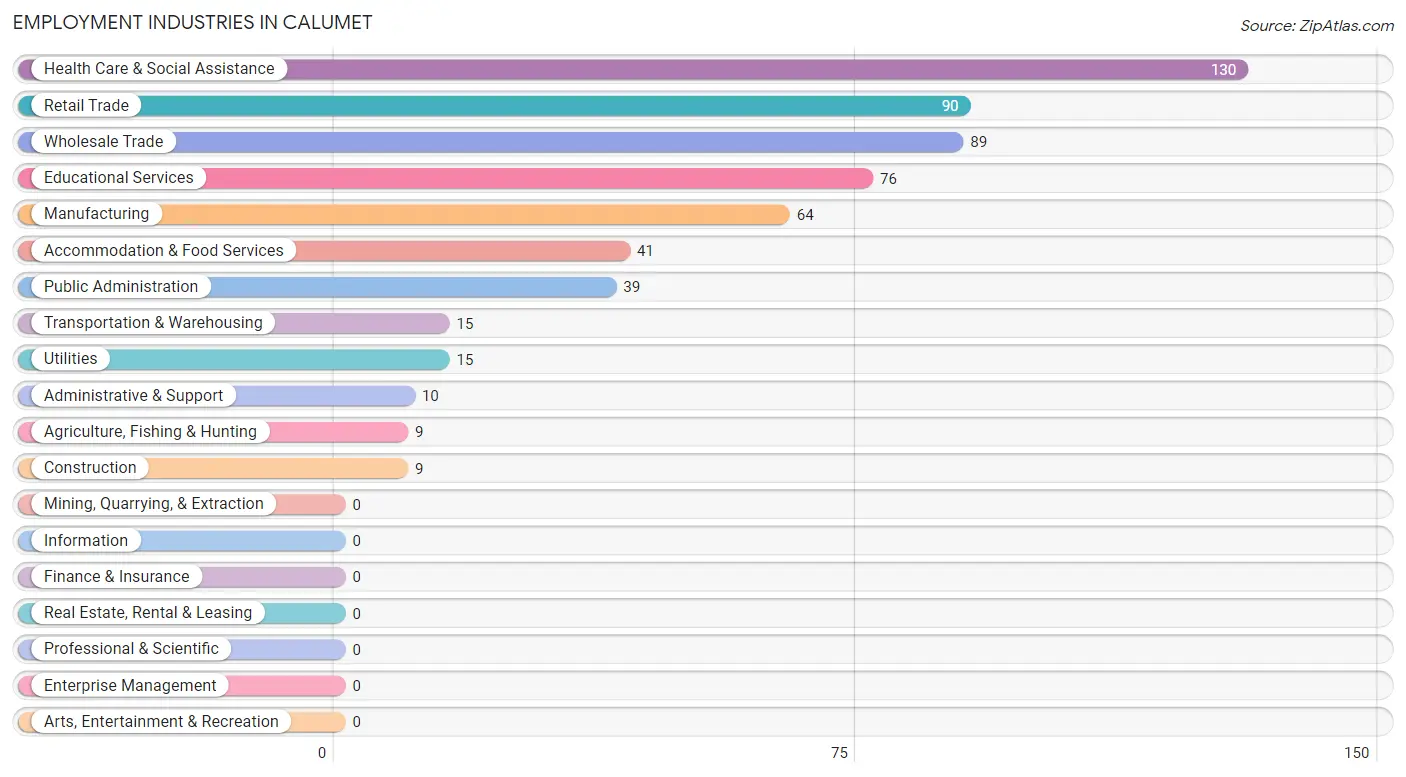
Employment Industries in Calumet
The major employment industries in Calumet include Health Care & Social Assistance (130 | 20.6%), Retail Trade (90 | 14.2%), Wholesale Trade (89 | 14.1%), Educational Services (76 | 12.0%), and Manufacturing (64 | 10.1%).
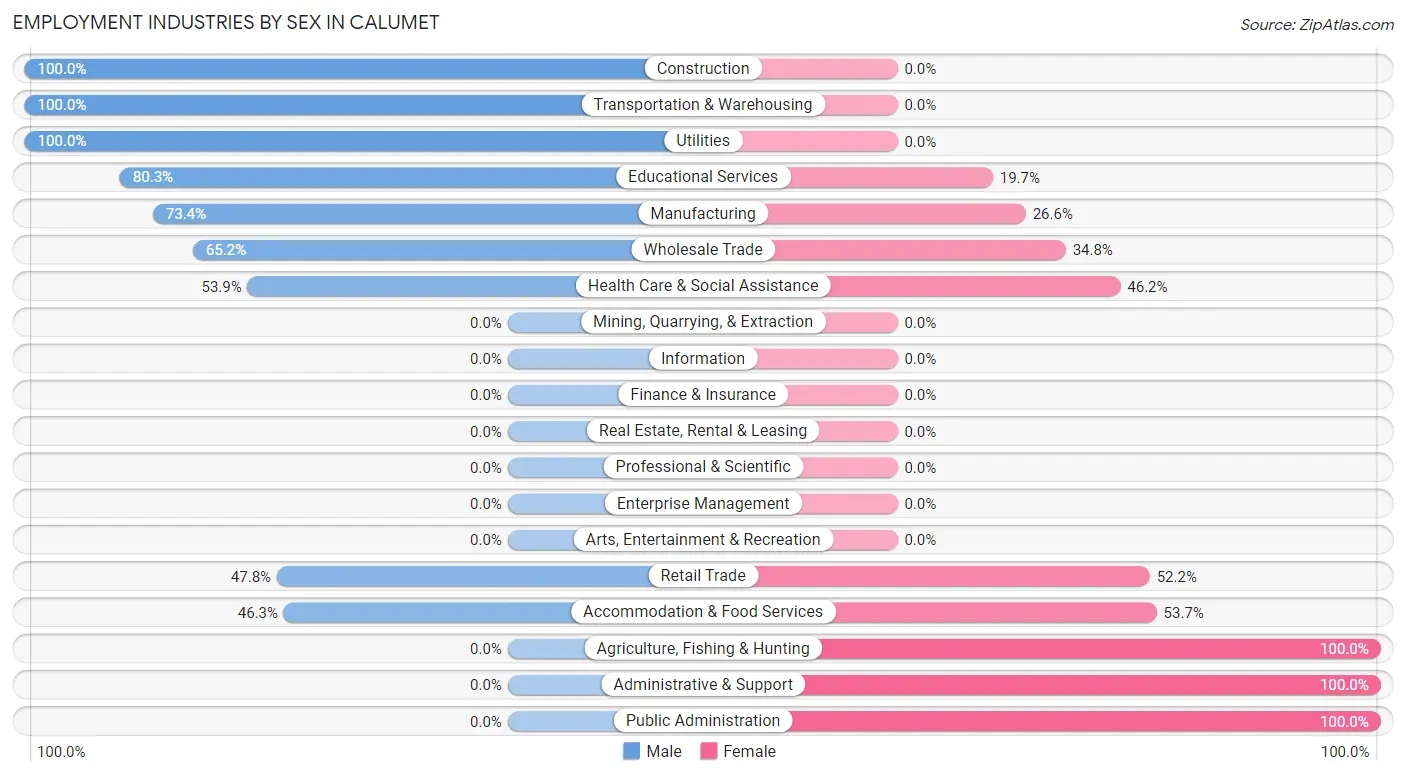
Employment Industries by Sex in Calumet
The Calumet industries that see more men than women are Construction (100.0%), Transportation & Warehousing (100.0%), and Utilities (100.0%), whereas the industries that tend to have a higher number of women are Agriculture, Fishing & Hunting (100.0%), Administrative & Support (100.0%), and Public Administration (100.0%).
| Industry | Male | Female |
| Agriculture, Fishing & Hunting | 0 (0.0%) | 9 (100.0%) |
| Mining, Quarrying, & Extraction | 0 (0.0%) | 0 (0.0%) |
| Construction | 9 (100.0%) | 0 (0.0%) |
| Manufacturing | 47 (73.4%) | 17 (26.6%) |
| Wholesale Trade | 58 (65.2%) | 31 (34.8%) |
| Retail Trade | 43 (47.8%) | 47 (52.2%) |
| Transportation & Warehousing | 15 (100.0%) | 0 (0.0%) |
| Utilities | 15 (100.0%) | 0 (0.0%) |
| Information | 0 (0.0%) | 0 (0.0%) |
| Finance & Insurance | 0 (0.0%) | 0 (0.0%) |
| Real Estate, Rental & Leasing | 0 (0.0%) | 0 (0.0%) |
| Professional & Scientific | 0 (0.0%) | 0 (0.0%) |
| Enterprise Management | 0 (0.0%) | 0 (0.0%) |
| Administrative & Support | 0 (0.0%) | 10 (100.0%) |
| Educational Services | 61 (80.3%) | 15 (19.7%) |
| Health Care & Social Assistance | 70 (53.8%) | 60 (46.2%) |
| Arts, Entertainment & Recreation | 0 (0.0%) | 0 (0.0%) |
| Accommodation & Food Services | 19 (46.3%) | 22 (53.7%) |
| Public Administration | 0 (0.0%) | 39 (100.0%) |
| Total | 374 (59.2%) | 258 (40.8%) |
Education in Calumet
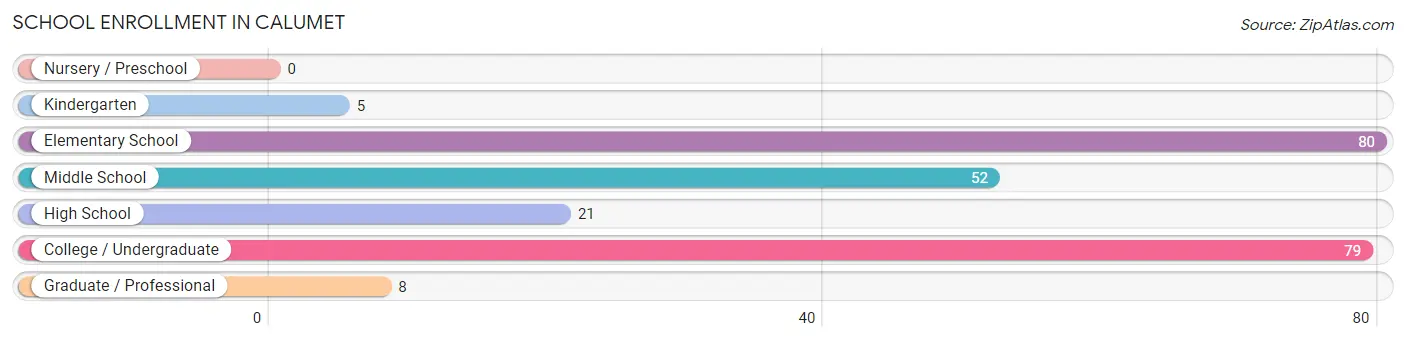
School Enrollment in Calumet
The most common levels of schooling among the 245 students in Calumet are elementary school (80 | 32.7%), college / undergraduate (79 | 32.2%), and middle school (52 | 21.2%).
| School Level | # Students | % Students |
| Nursery / Preschool | 0 | 0.0% |
| Kindergarten | 5 | 2.0% |
| Elementary School | 80 | 32.7% |
| Middle School | 52 | 21.2% |
| High School | 21 | 8.6% |
| College / Undergraduate | 79 | 32.2% |
| Graduate / Professional | 8 | 3.3% |
| Total | 245 | 100.0% |
School Enrollment by Age by Funding Source in Calumet
Out of a total of 245 students who are enrolled in schools in Calumet, 41 (16.7%) attend a private institution, while the remaining 204 (83.3%) are enrolled in public schools. The age group of 20 to 24 year olds has the highest likelihood of being enrolled in private schools, with 17 (54.8% in the age bracket) enrolled. Conversely, the age group of 10 to 14 year olds has the lowest likelihood of being enrolled in a private school, with 76 (100.0% in the age bracket) attending a public institution.
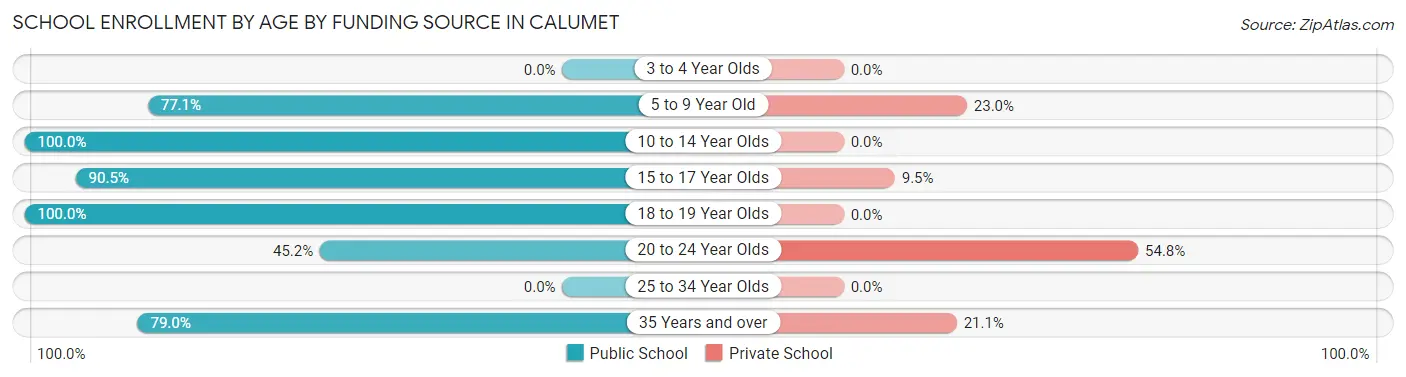
| Age Bracket | Public School | Private School |
| 3 to 4 Year Olds | 0 (0.0%) | 0 (0.0%) |
| 5 to 9 Year Old | 47 (77.0%) | 14 (23.0%) |
| 10 to 14 Year Olds | 76 (100.0%) | 0 (0.0%) |
| 15 to 17 Year Olds | 19 (90.5%) | 2 (9.5%) |
| 18 to 19 Year Olds | 18 (100.0%) | 0 (0.0%) |
| 20 to 24 Year Olds | 14 (45.2%) | 17 (54.8%) |
| 25 to 34 Year Olds | 0 (0.0%) | 0 (0.0%) |
| 35 Years and over | 30 (78.9%) | 8 (21.0%) |
| Total | 204 (83.3%) | 41 (16.7%) |
Educational Attainment by Field of Study in Calumet
Education (82 | 35.0%), psychology (41 | 17.5%), science & technology (28 | 12.0%), visual & performing arts (26 | 11.1%), and business (15 | 6.4%) are the most common fields of study among 234 individuals in Calumet who have obtained a bachelor's degree or higher.
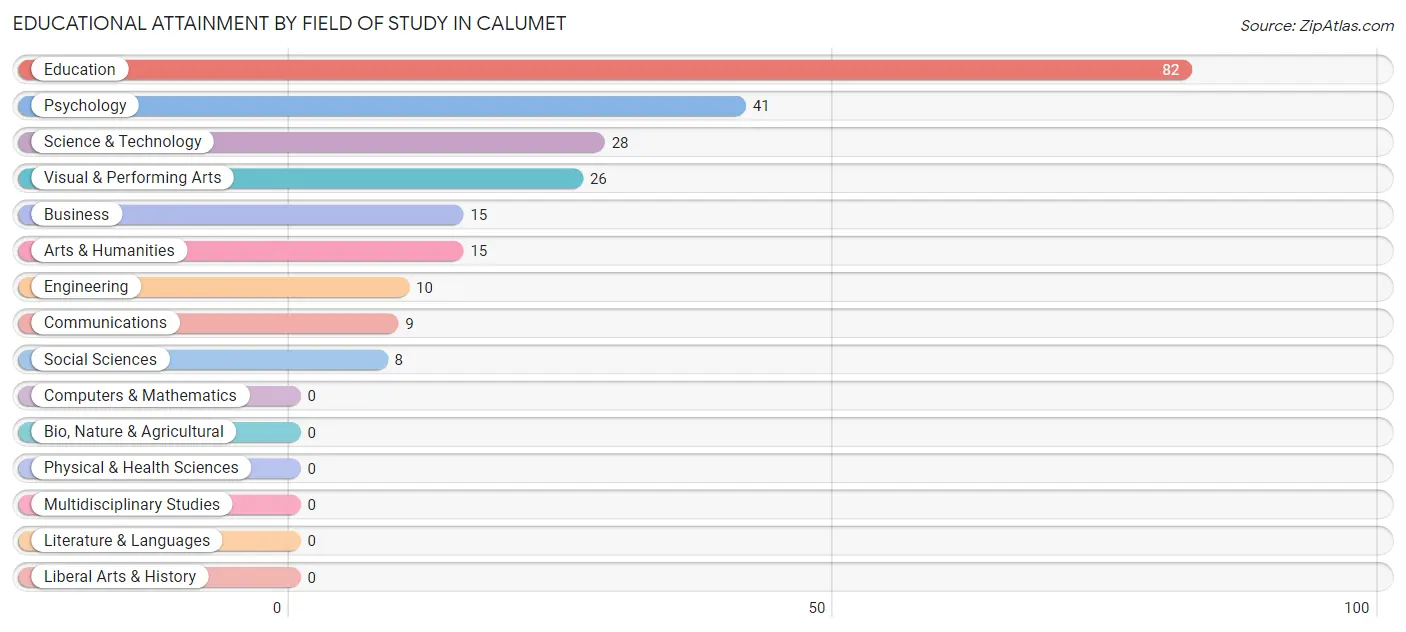
| Field of Study | # Graduates | % Graduates |
| Computers & Mathematics | 0 | 0.0% |
| Bio, Nature & Agricultural | 0 | 0.0% |
| Physical & Health Sciences | 0 | 0.0% |
| Psychology | 41 | 17.5% |
| Social Sciences | 8 | 3.4% |
| Engineering | 10 | 4.3% |
| Multidisciplinary Studies | 0 | 0.0% |
| Science & Technology | 28 | 12.0% |
| Business | 15 | 6.4% |
| Education | 82 | 35.0% |
| Literature & Languages | 0 | 0.0% |
| Liberal Arts & History | 0 | 0.0% |
| Visual & Performing Arts | 26 | 11.1% |
| Communications | 9 | 3.8% |
| Arts & Humanities | 15 | 6.4% |
| Total | 234 | 100.0% |
Transportation & Commute in Calumet
Vehicle Availability by Sex in Calumet
The most prevalent vehicle ownership categories in Calumet are males with 2 vehicles (241, accounting for 64.4%) and females with 2 vehicles (108, making up 93.4%).
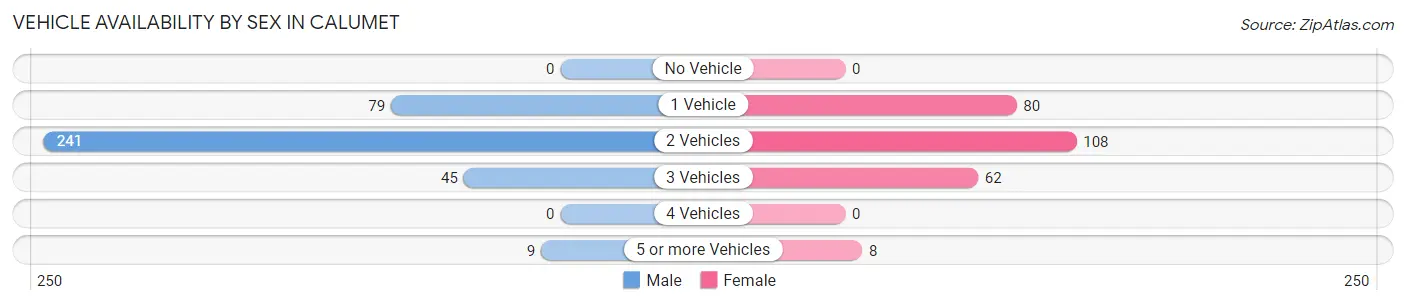
| Vehicles Available | Male | Female |
| No Vehicle | 0 (0.0%) | 0 (0.0%) |
| 1 Vehicle | 79 (21.1%) | 80 (31.0%) |
| 2 Vehicles | 241 (64.4%) | 108 (41.9%) |
| 3 Vehicles | 45 (12.0%) | 62 (24.0%) |
| 4 Vehicles | 0 (0.0%) | 0 (0.0%) |
| 5 or more Vehicles | 9 (2.4%) | 8 (3.1%) |
| Total | 374 (100.0%) | 258 (100.0%) |
Commute Time in Calumet
The most frequently occuring commute durations in Calumet are 15 to 19 minutes (242 commuters, 39.7%), 20 to 24 minutes (86 commuters, 14.1%), and 30 to 34 minutes (64 commuters, 10.5%).
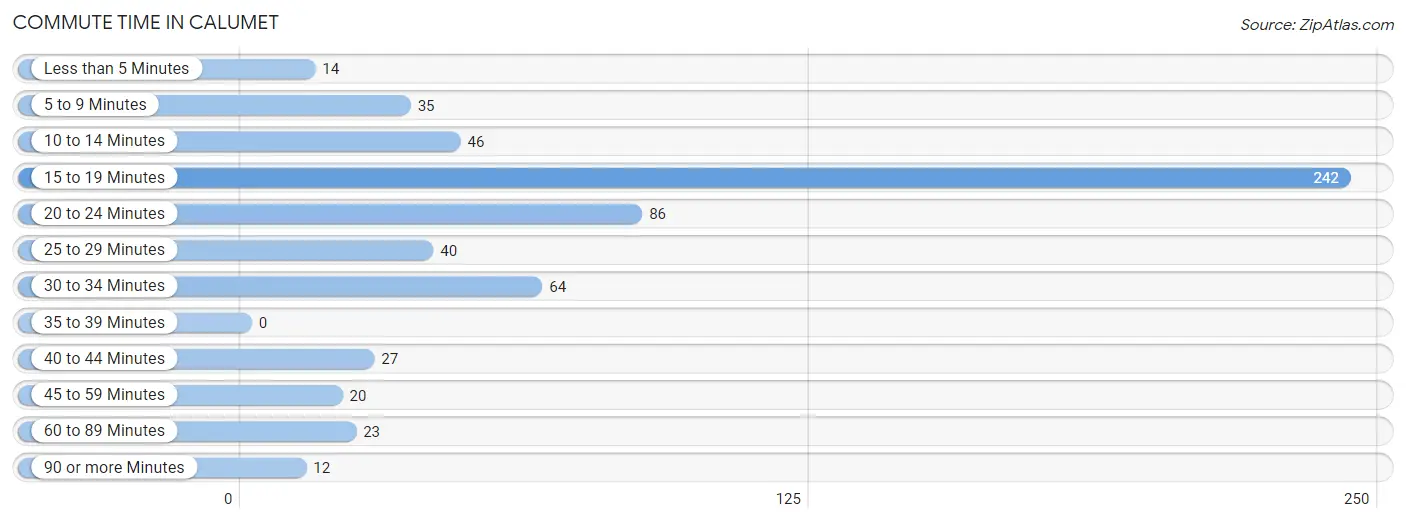
| Commute Time | # Commuters | % Commuters |
| Less than 5 Minutes | 14 | 2.3% |
| 5 to 9 Minutes | 35 | 5.8% |
| 10 to 14 Minutes | 46 | 7.5% |
| 15 to 19 Minutes | 242 | 39.7% |
| 20 to 24 Minutes | 86 | 14.1% |
| 25 to 29 Minutes | 40 | 6.6% |
| 30 to 34 Minutes | 64 | 10.5% |
| 35 to 39 Minutes | 0 | 0.0% |
| 40 to 44 Minutes | 27 | 4.4% |
| 45 to 59 Minutes | 20 | 3.3% |
| 60 to 89 Minutes | 23 | 3.8% |
| 90 or more Minutes | 12 | 2.0% |
Commute Time by Sex in Calumet
The most common commute times in Calumet are 15 to 19 minutes (185 commuters, 49.5%) for males and 15 to 19 minutes (57 commuters, 24.3%) for females.
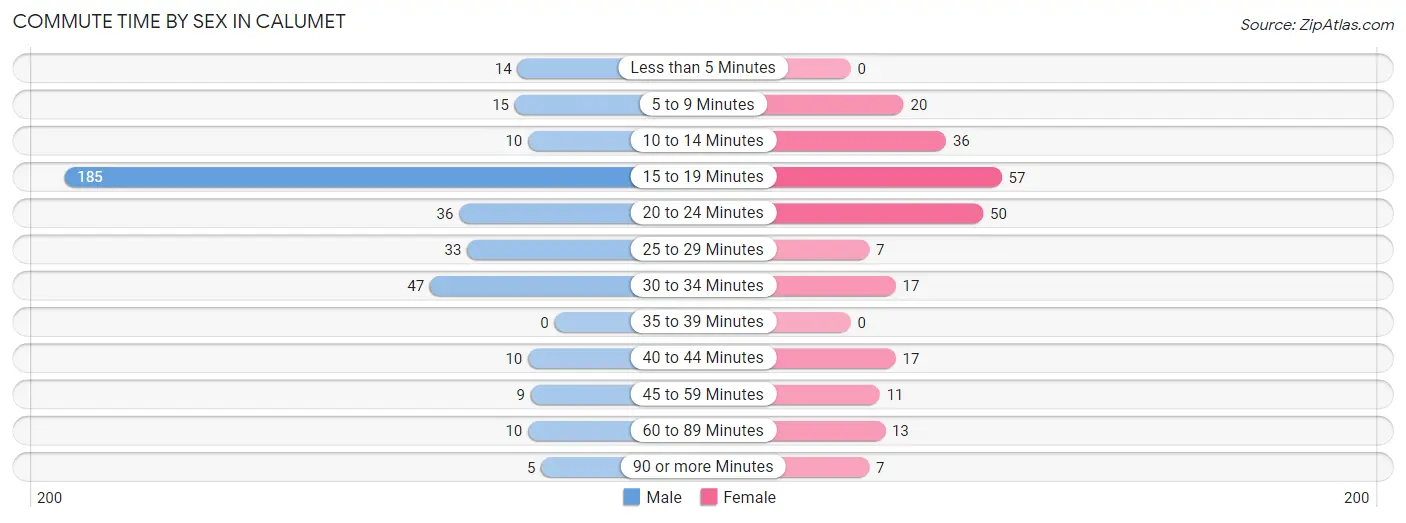
| Commute Time | Male | Female |
| Less than 5 Minutes | 14 (3.7%) | 0 (0.0%) |
| 5 to 9 Minutes | 15 (4.0%) | 20 (8.5%) |
| 10 to 14 Minutes | 10 (2.7%) | 36 (15.3%) |
| 15 to 19 Minutes | 185 (49.5%) | 57 (24.3%) |
| 20 to 24 Minutes | 36 (9.6%) | 50 (21.3%) |
| 25 to 29 Minutes | 33 (8.8%) | 7 (3.0%) |
| 30 to 34 Minutes | 47 (12.6%) | 17 (7.2%) |
| 35 to 39 Minutes | 0 (0.0%) | 0 (0.0%) |
| 40 to 44 Minutes | 10 (2.7%) | 17 (7.2%) |
| 45 to 59 Minutes | 9 (2.4%) | 11 (4.7%) |
| 60 to 89 Minutes | 10 (2.7%) | 13 (5.5%) |
| 90 or more Minutes | 5 (1.3%) | 7 (3.0%) |
Time of Departure to Work by Sex in Calumet
The most frequent times of departure to work in Calumet are 7:00 AM to 7:29 AM (101, 27.0%) for males and 7:30 AM to 7:59 AM (89, 37.9%) for females.
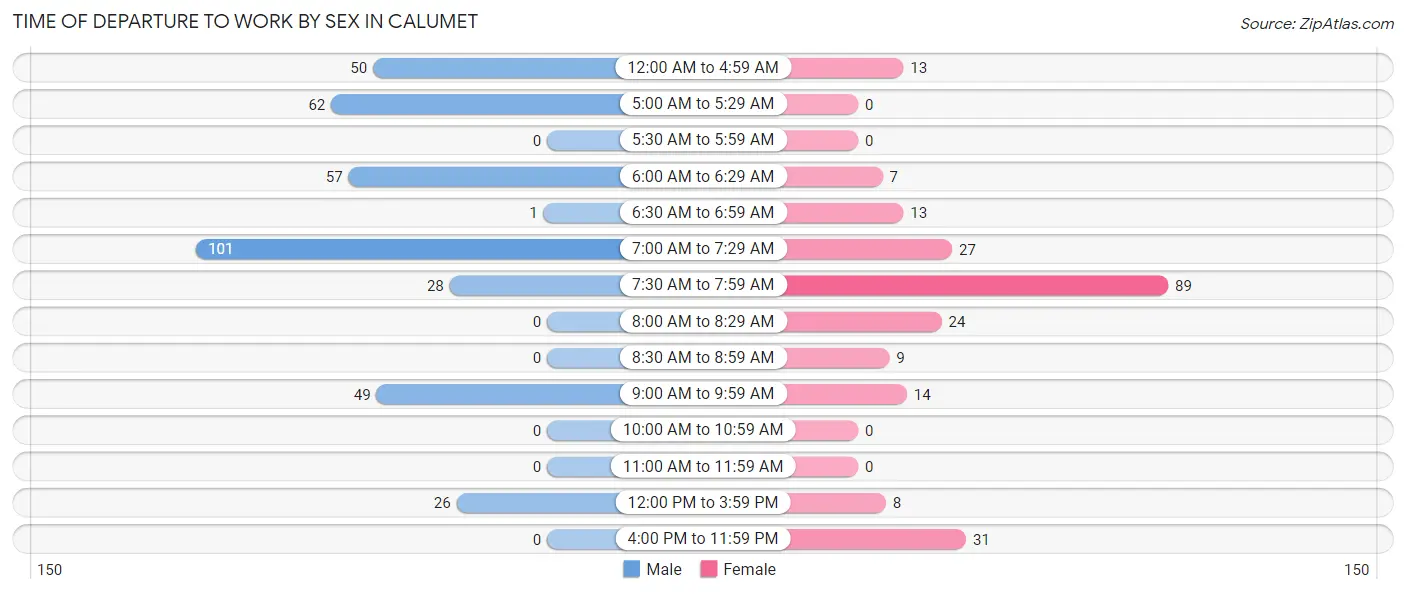
| Time of Departure | Male | Female |
| 12:00 AM to 4:59 AM | 50 (13.4%) | 13 (5.5%) |
| 5:00 AM to 5:29 AM | 62 (16.6%) | 0 (0.0%) |
| 5:30 AM to 5:59 AM | 0 (0.0%) | 0 (0.0%) |
| 6:00 AM to 6:29 AM | 57 (15.2%) | 7 (3.0%) |
| 6:30 AM to 6:59 AM | 1 (0.3%) | 13 (5.5%) |
| 7:00 AM to 7:29 AM | 101 (27.0%) | 27 (11.5%) |
| 7:30 AM to 7:59 AM | 28 (7.5%) | 89 (37.9%) |
| 8:00 AM to 8:29 AM | 0 (0.0%) | 24 (10.2%) |
| 8:30 AM to 8:59 AM | 0 (0.0%) | 9 (3.8%) |
| 9:00 AM to 9:59 AM | 49 (13.1%) | 14 (6.0%) |
| 10:00 AM to 10:59 AM | 0 (0.0%) | 0 (0.0%) |
| 11:00 AM to 11:59 AM | 0 (0.0%) | 0 (0.0%) |
| 12:00 PM to 3:59 PM | 26 (7.0%) | 8 (3.4%) |
| 4:00 PM to 11:59 PM | 0 (0.0%) | 31 (13.2%) |
| Total | 374 (100.0%) | 235 (100.0%) |
Housing Occupancy in Calumet
Occupancy by Ownership in Calumet
Of the total 554 dwellings in Calumet, owner-occupied units account for 447 (80.7%), while renter-occupied units make up 107 (19.3%).
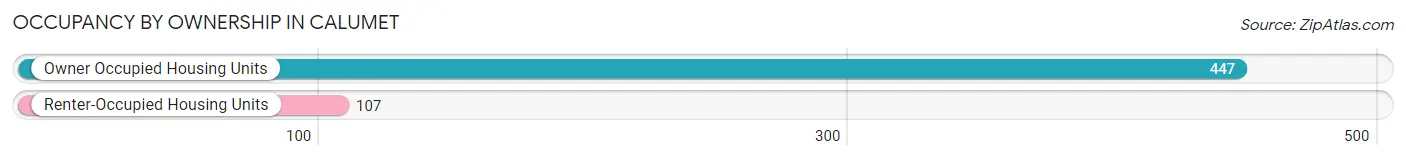
| Occupancy | # Housing Units | % Housing Units |
| Owner Occupied Housing Units | 447 | 80.7% |
| Renter-Occupied Housing Units | 107 | 19.3% |
| Total Occupied Housing Units | 554 | 100.0% |
Occupancy by Household Size in Calumet
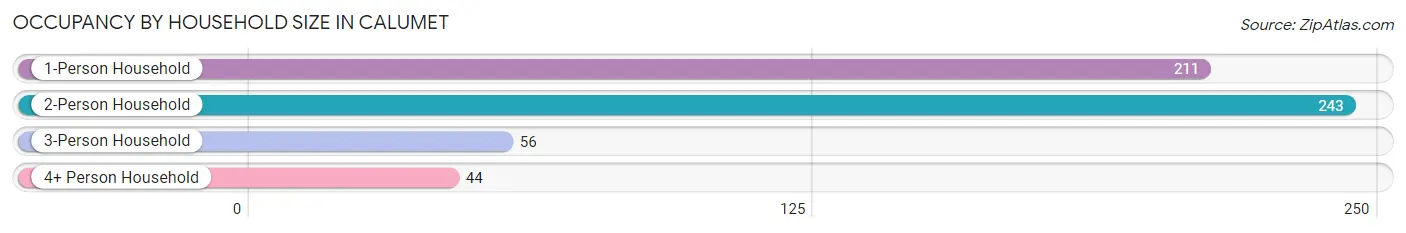
| Household Size | # Housing Units | % Housing Units |
| 1-Person Household | 211 | 38.1% |
| 2-Person Household | 243 | 43.9% |
| 3-Person Household | 56 | 10.1% |
| 4+ Person Household | 44 | 7.9% |
| Total Housing Units | 554 | 100.0% |
Occupancy by Ownership by Household Size in Calumet
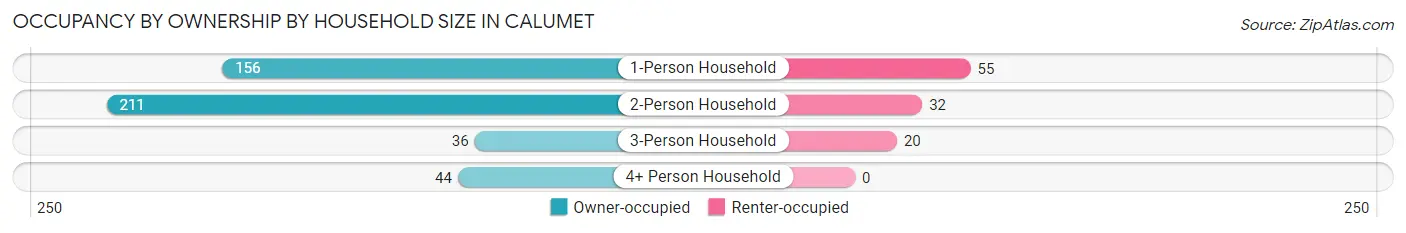
| Household Size | Owner-occupied | Renter-occupied |
| 1-Person Household | 156 (73.9%) | 55 (26.1%) |
| 2-Person Household | 211 (86.8%) | 32 (13.2%) |
| 3-Person Household | 36 (64.3%) | 20 (35.7%) |
| 4+ Person Household | 44 (100.0%) | 0 (0.0%) |
| Total Housing Units | 447 (80.7%) | 107 (19.3%) |
Occupancy by Educational Attainment in Calumet
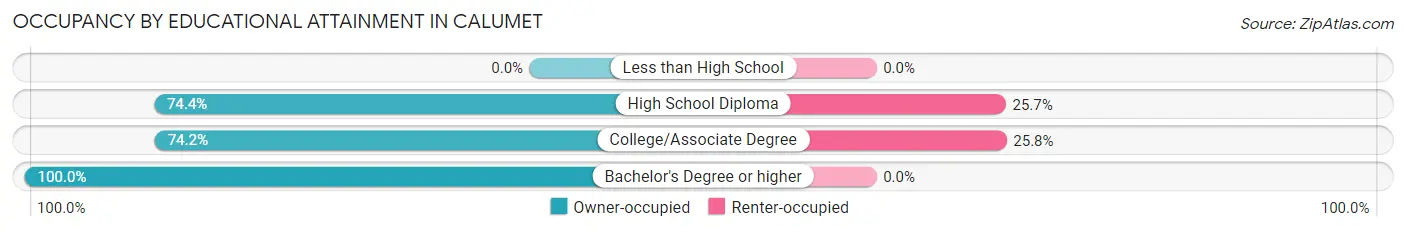
| Household Size | Owner-occupied | Renter-occupied |
| Less than High School | 0 (0.0%) | 0 (0.0%) |
| High School Diploma | 171 (74.4%) | 59 (25.7%) |
| College/Associate Degree | 138 (74.2%) | 48 (25.8%) |
| Bachelor's Degree or higher | 138 (100.0%) | 0 (0.0%) |
Occupancy by Age of Householder in Calumet
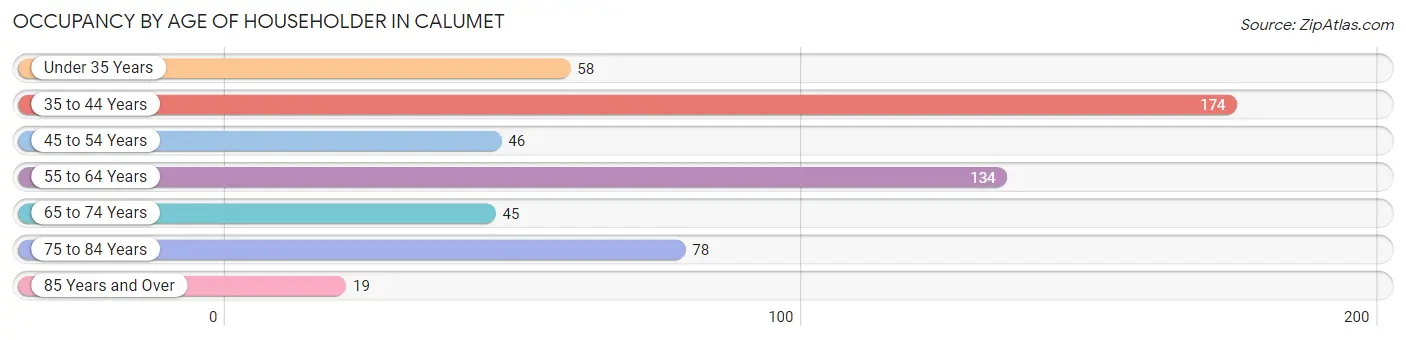
| Age Bracket | # Households | % Households |
| Under 35 Years | 58 | 10.5% |
| 35 to 44 Years | 174 | 31.4% |
| 45 to 54 Years | 46 | 8.3% |
| 55 to 64 Years | 134 | 24.2% |
| 65 to 74 Years | 45 | 8.1% |
| 75 to 84 Years | 78 | 14.1% |
| 85 Years and Over | 19 | 3.4% |
| Total | 554 | 100.0% |
Housing Finances in Calumet
Median Income by Occupancy in Calumet
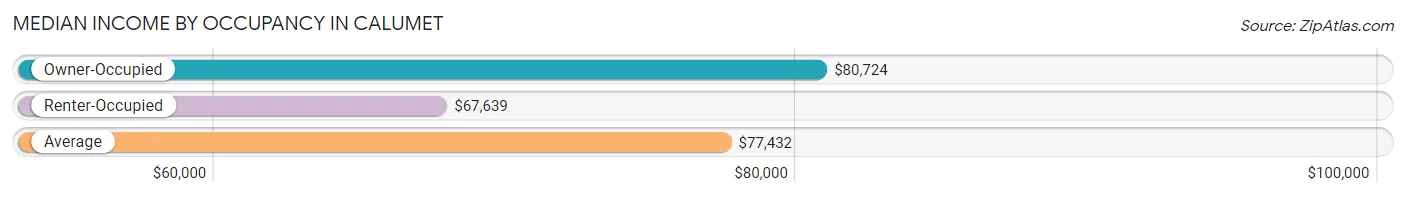
| Occupancy Type | # Households | Median Income |
| Owner-Occupied | 447 (80.7%) | $80,724 |
| Renter-Occupied | 107 (19.3%) | $67,639 |
| Average | 554 (100.0%) | $77,432 |
Occupancy by Householder Income Bracket in Calumet
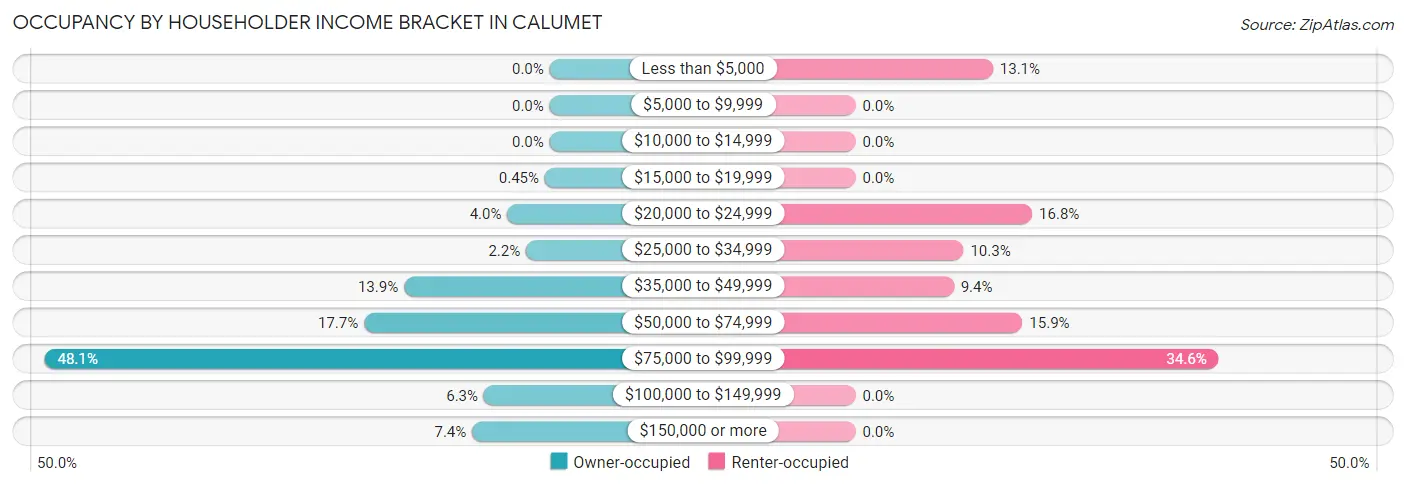
| Income Bracket | Owner-occupied | Renter-occupied |
| Less than $5,000 | 0 (0.0%) | 14 (13.1%) |
| $5,000 to $9,999 | 0 (0.0%) | 0 (0.0%) |
| $10,000 to $14,999 | 0 (0.0%) | 0 (0.0%) |
| $15,000 to $19,999 | 2 (0.4%) | 0 (0.0%) |
| $20,000 to $24,999 | 18 (4.0%) | 18 (16.8%) |
| $25,000 to $34,999 | 10 (2.2%) | 11 (10.3%) |
| $35,000 to $49,999 | 62 (13.9%) | 10 (9.3%) |
| $50,000 to $74,999 | 79 (17.7%) | 17 (15.9%) |
| $75,000 to $99,999 | 215 (48.1%) | 37 (34.6%) |
| $100,000 to $149,999 | 28 (6.3%) | 0 (0.0%) |
| $150,000 or more | 33 (7.4%) | 0 (0.0%) |
| Total | 447 (100.0%) | 107 (100.0%) |
Monthly Housing Cost Tiers in Calumet
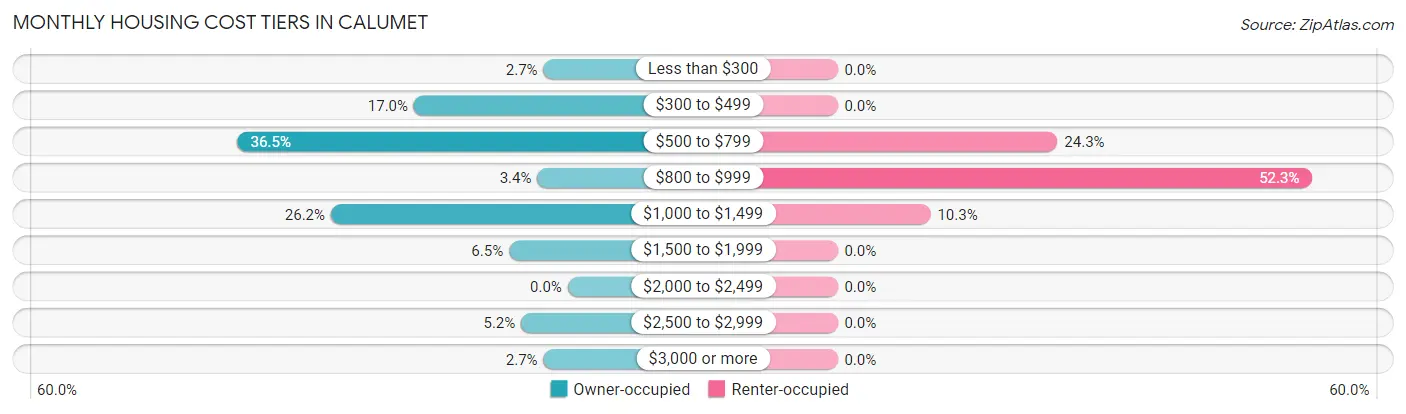
| Monthly Cost | Owner-occupied | Renter-occupied |
| Less than $300 | 12 (2.7%) | 0 (0.0%) |
| $300 to $499 | 76 (17.0%) | 0 (0.0%) |
| $500 to $799 | 163 (36.5%) | 26 (24.3%) |
| $800 to $999 | 15 (3.4%) | 56 (52.3%) |
| $1,000 to $1,499 | 117 (26.2%) | 11 (10.3%) |
| $1,500 to $1,999 | 29 (6.5%) | 0 (0.0%) |
| $2,000 to $2,499 | 0 (0.0%) | 0 (0.0%) |
| $2,500 to $2,999 | 23 (5.1%) | 0 (0.0%) |
| $3,000 or more | 12 (2.7%) | 0 (0.0%) |
| Total | 447 (100.0%) | 107 (100.0%) |
Physical Housing Characteristics in Calumet
Housing Structures in Calumet
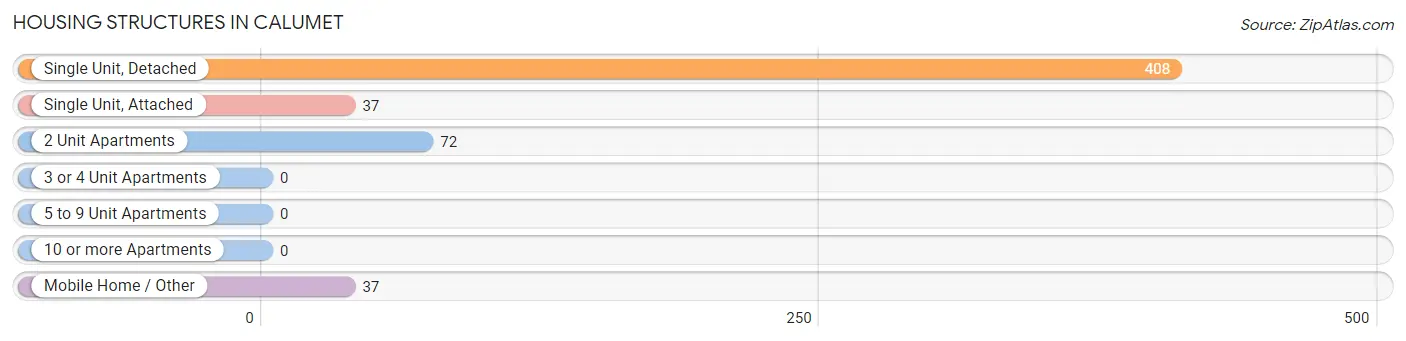
| Structure Type | # Housing Units | % Housing Units |
| Single Unit, Detached | 408 | 73.7% |
| Single Unit, Attached | 37 | 6.7% |
| 2 Unit Apartments | 72 | 13.0% |
| 3 or 4 Unit Apartments | 0 | 0.0% |
| 5 to 9 Unit Apartments | 0 | 0.0% |
| 10 or more Apartments | 0 | 0.0% |
| Mobile Home / Other | 37 | 6.7% |
| Total | 554 | 100.0% |
Housing Structures by Occupancy in Calumet
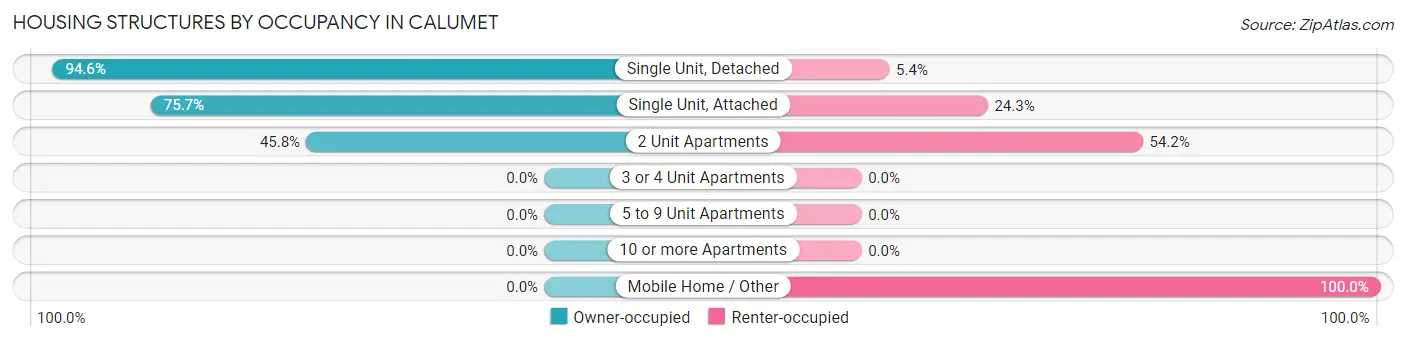
| Structure Type | Owner-occupied | Renter-occupied |
| Single Unit, Detached | 386 (94.6%) | 22 (5.4%) |
| Single Unit, Attached | 28 (75.7%) | 9 (24.3%) |
| 2 Unit Apartments | 33 (45.8%) | 39 (54.2%) |
| 3 or 4 Unit Apartments | 0 (0.0%) | 0 (0.0%) |
| 5 to 9 Unit Apartments | 0 (0.0%) | 0 (0.0%) |
| 10 or more Apartments | 0 (0.0%) | 0 (0.0%) |
| Mobile Home / Other | 0 (0.0%) | 37 (100.0%) |
| Total | 447 (80.7%) | 107 (19.3%) |
Housing Structures by Number of Rooms in Calumet
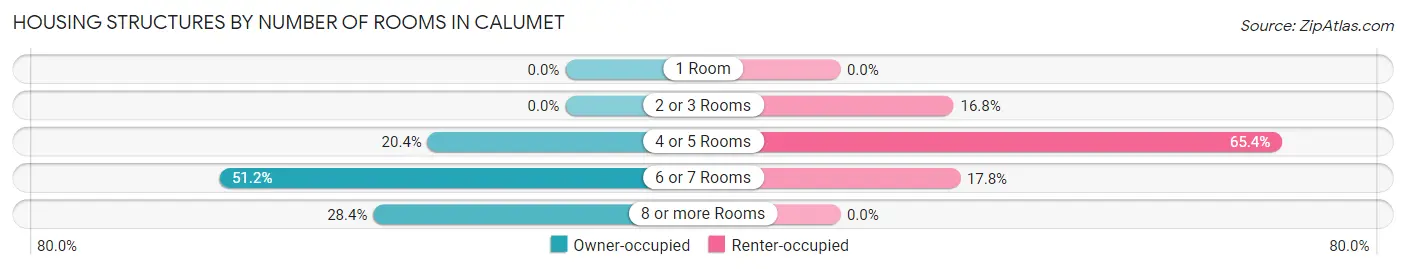
| Number of Rooms | Owner-occupied | Renter-occupied |
| 1 Room | 0 (0.0%) | 0 (0.0%) |
| 2 or 3 Rooms | 0 (0.0%) | 18 (16.8%) |
| 4 or 5 Rooms | 91 (20.4%) | 70 (65.4%) |
| 6 or 7 Rooms | 229 (51.2%) | 19 (17.8%) |
| 8 or more Rooms | 127 (28.4%) | 0 (0.0%) |
| Total | 447 (100.0%) | 107 (100.0%) |
Housing Structure by Heating Type in Calumet
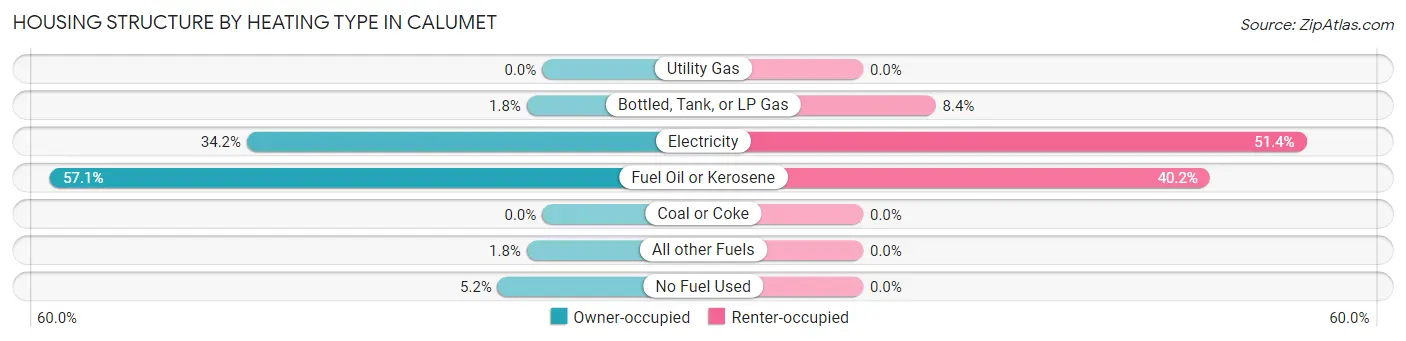
| Heating Type | Owner-occupied | Renter-occupied |
| Utility Gas | 0 (0.0%) | 0 (0.0%) |
| Bottled, Tank, or LP Gas | 8 (1.8%) | 9 (8.4%) |
| Electricity | 153 (34.2%) | 55 (51.4%) |
| Fuel Oil or Kerosene | 255 (57.1%) | 43 (40.2%) |
| Coal or Coke | 0 (0.0%) | 0 (0.0%) |
| All other Fuels | 8 (1.8%) | 0 (0.0%) |
| No Fuel Used | 23 (5.1%) | 0 (0.0%) |
| Total | 447 (100.0%) | 107 (100.0%) |
Household Vehicle Usage in Calumet
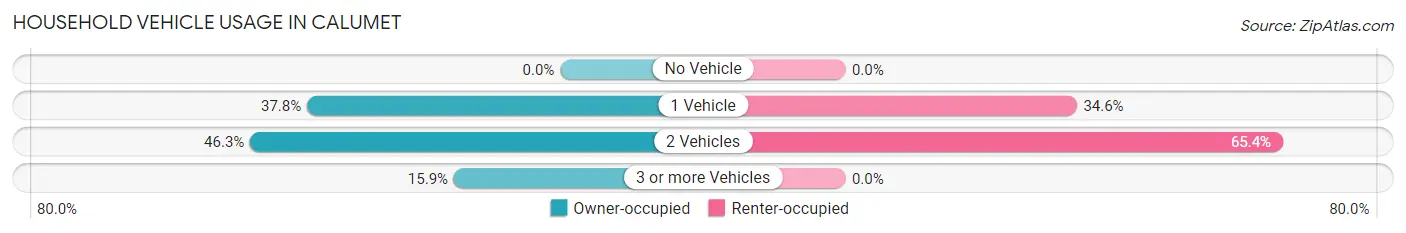
| Vehicles per Household | Owner-occupied | Renter-occupied |
| No Vehicle | 0 (0.0%) | 0 (0.0%) |
| 1 Vehicle | 169 (37.8%) | 37 (34.6%) |
| 2 Vehicles | 207 (46.3%) | 70 (65.4%) |
| 3 or more Vehicles | 71 (15.9%) | 0 (0.0%) |
| Total | 447 (100.0%) | 107 (100.0%) |
Real Estate & Mortgages in Calumet
Real Estate and Mortgage Overview in Calumet
| Characteristic | Without Mortgage | With Mortgage |
| Housing Units | 142 | 305 |
| Median Property Value | $105,800 | $144,800 |
| Median Household Income | $69,306 | $21 |
| Monthly Housing Costs | $465 | $12 |
| Real Estate Taxes | $1,404 | $9 |
Property Value by Mortgage Status in Calumet
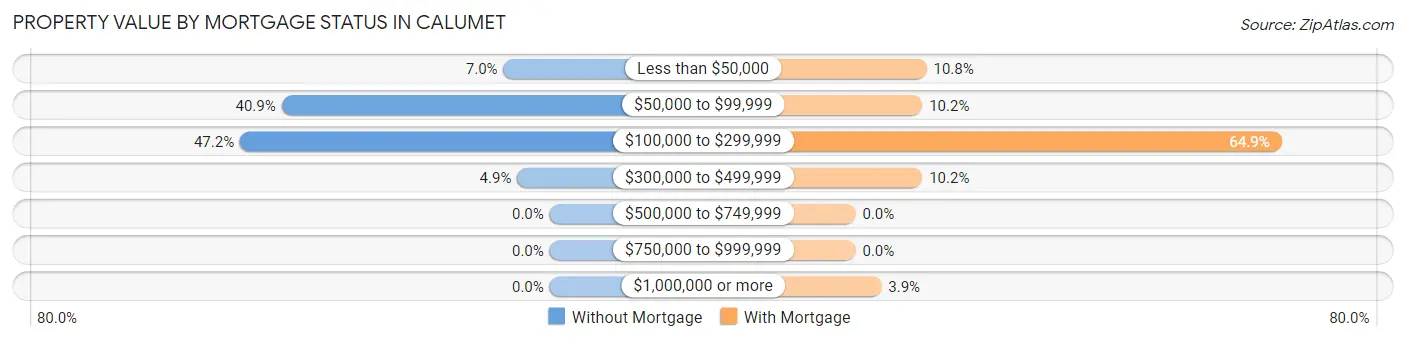
| Property Value | Without Mortgage | With Mortgage |
| Less than $50,000 | 10 (7.0%) | 33 (10.8%) |
| $50,000 to $99,999 | 58 (40.8%) | 31 (10.2%) |
| $100,000 to $299,999 | 67 (47.2%) | 198 (64.9%) |
| $300,000 to $499,999 | 7 (4.9%) | 31 (10.2%) |
| $500,000 to $749,999 | 0 (0.0%) | 0 (0.0%) |
| $750,000 to $999,999 | 0 (0.0%) | 0 (0.0%) |
| $1,000,000 or more | 0 (0.0%) | 12 (3.9%) |
| Total | 142 (100.0%) | 305 (100.0%) |
Household Income by Mortgage Status in Calumet
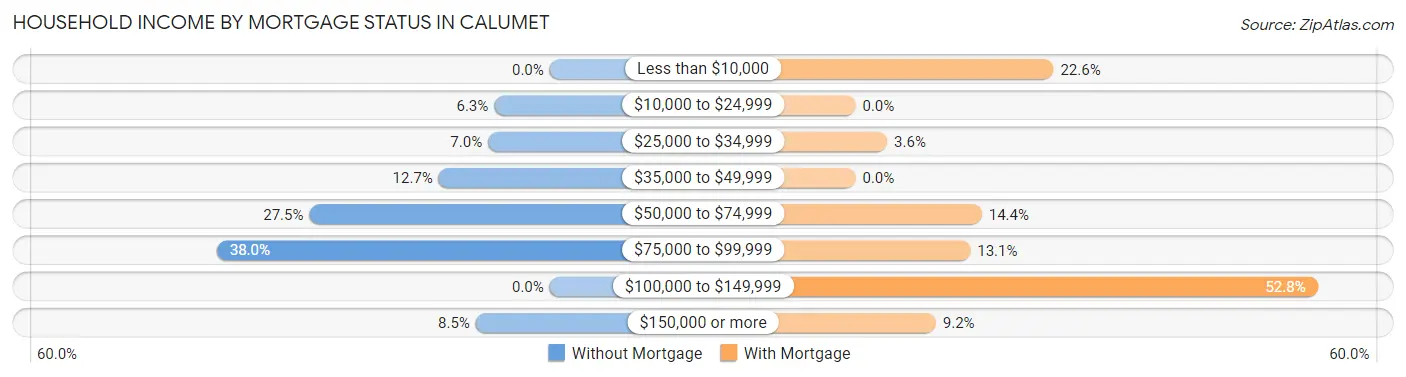
| Household Income | Without Mortgage | With Mortgage |
| Less than $10,000 | 0 (0.0%) | 69 (22.6%) |
| $10,000 to $24,999 | 9 (6.3%) | 0 (0.0%) |
| $25,000 to $34,999 | 10 (7.0%) | 11 (3.6%) |
| $35,000 to $49,999 | 18 (12.7%) | 0 (0.0%) |
| $50,000 to $74,999 | 39 (27.5%) | 44 (14.4%) |
| $75,000 to $99,999 | 54 (38.0%) | 40 (13.1%) |
| $100,000 to $149,999 | 0 (0.0%) | 161 (52.8%) |
| $150,000 or more | 12 (8.5%) | 28 (9.2%) |
| Total | 142 (100.0%) | 305 (100.0%) |
Property Value to Household Income Ratio in Calumet
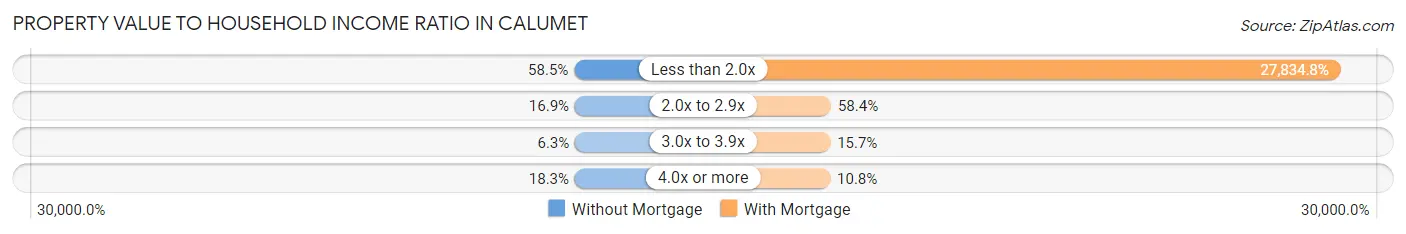
| Value-to-Income Ratio | Without Mortgage | With Mortgage |
| Less than 2.0x | 83 (58.5%) | 84,896 (27,834.8%) |
| 2.0x to 2.9x | 24 (16.9%) | 178 (58.4%) |
| 3.0x to 3.9x | 9 (6.3%) | 48 (15.7%) |
| 4.0x or more | 26 (18.3%) | 33 (10.8%) |
| Total | 142 (100.0%) | 305 (100.0%) |
Real Estate Taxes by Mortgage Status in Calumet
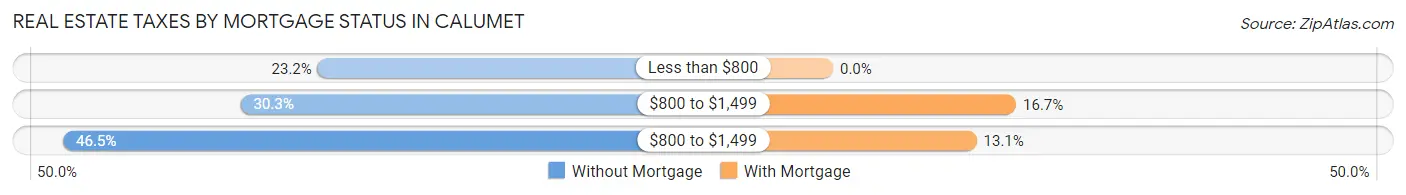
| Property Taxes | Without Mortgage | With Mortgage |
| Less than $800 | 33 (23.2%) | 0 (0.0%) |
| $800 to $1,499 | 43 (30.3%) | 51 (16.7%) |
| $800 to $1,499 | 66 (46.5%) | 40 (13.1%) |
| Total | 142 (100.0%) | 305 (100.0%) |
Health & Disability in Calumet
Health Insurance Coverage by Age in Calumet
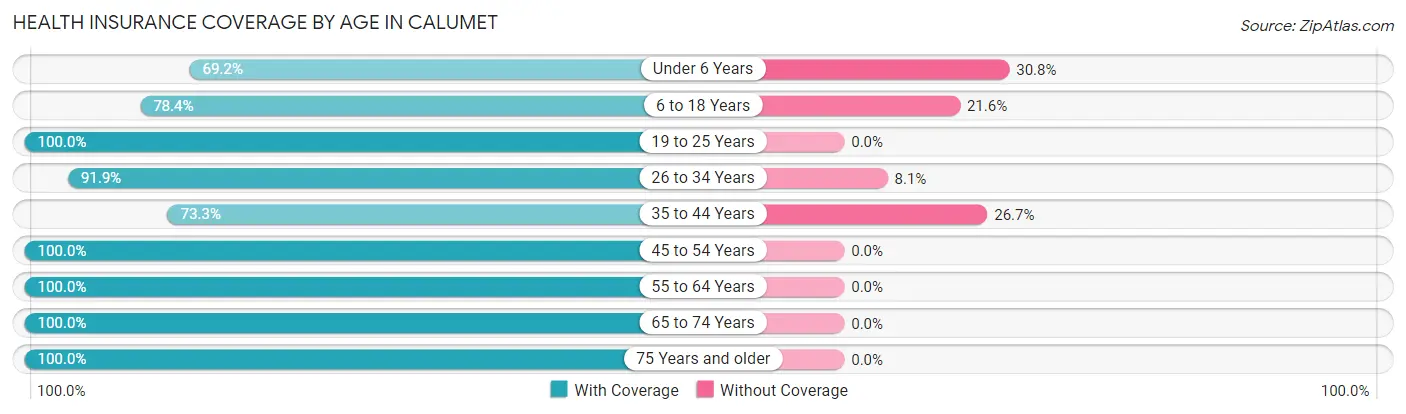
| Age Bracket | With Coverage | Without Coverage |
| Under 6 Years | 18 (69.2%) | 8 (30.8%) |
| 6 to 18 Years | 120 (78.4%) | 33 (21.6%) |
| 19 to 25 Years | 72 (100.0%) | 0 (0.0%) |
| 26 to 34 Years | 91 (91.9%) | 8 (8.1%) |
| 35 to 44 Years | 154 (73.3%) | 56 (26.7%) |
| 45 to 54 Years | 171 (100.0%) | 0 (0.0%) |
| 55 to 64 Years | 181 (100.0%) | 0 (0.0%) |
| 65 to 74 Years | 77 (100.0%) | 0 (0.0%) |
| 75 Years and older | 112 (100.0%) | 0 (0.0%) |
| Total | 996 (90.5%) | 105 (9.5%) |
Health Insurance Coverage by Citizenship Status in Calumet
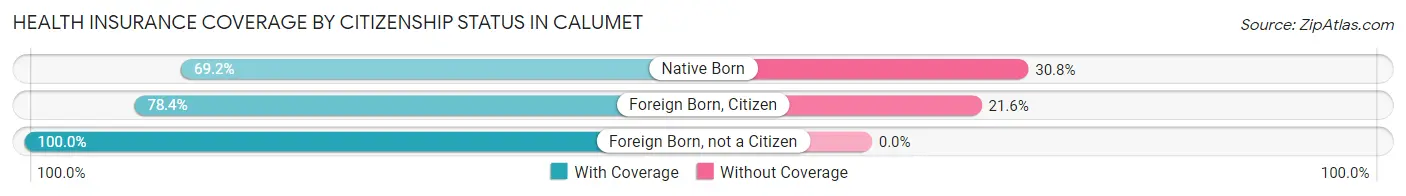
| Citizenship Status | With Coverage | Without Coverage |
| Native Born | 18 (69.2%) | 8 (30.8%) |
| Foreign Born, Citizen | 120 (78.4%) | 33 (21.6%) |
| Foreign Born, not a Citizen | 72 (100.0%) | 0 (0.0%) |
Health Insurance Coverage by Household Income in Calumet
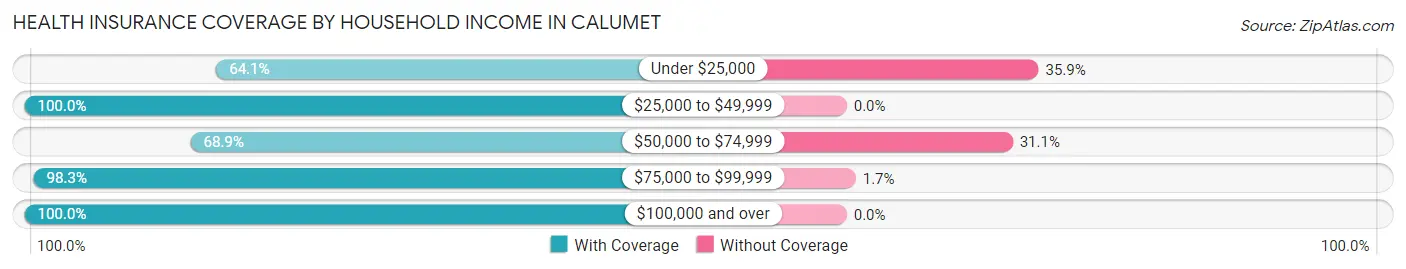
| Household Income | With Coverage | Without Coverage |
| Under $25,000 | 66 (64.1%) | 37 (35.9%) |
| $25,000 to $49,999 | 134 (100.0%) | 0 (0.0%) |
| $50,000 to $74,999 | 133 (68.9%) | 60 (31.1%) |
| $75,000 to $99,999 | 466 (98.3%) | 8 (1.7%) |
| $100,000 and over | 197 (100.0%) | 0 (0.0%) |
Public vs Private Health Insurance Coverage by Age in Calumet
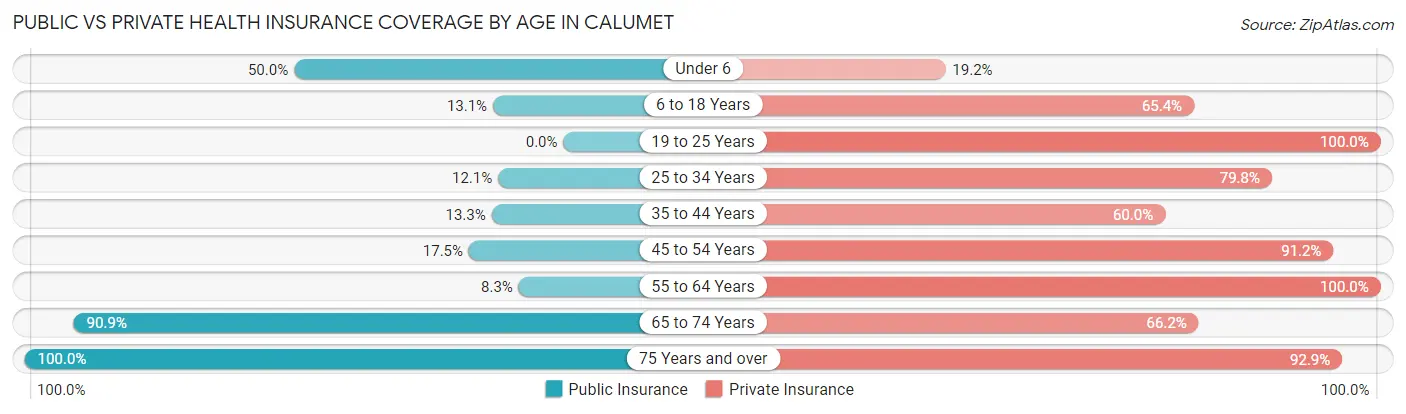
| Age Bracket | Public Insurance | Private Insurance |
| Under 6 | 13 (50.0%) | 5 (19.2%) |
| 6 to 18 Years | 20 (13.1%) | 100 (65.4%) |
| 19 to 25 Years | 0 (0.0%) | 72 (100.0%) |
| 25 to 34 Years | 12 (12.1%) | 79 (79.8%) |
| 35 to 44 Years | 28 (13.3%) | 126 (60.0%) |
| 45 to 54 Years | 30 (17.5%) | 156 (91.2%) |
| 55 to 64 Years | 15 (8.3%) | 181 (100.0%) |
| 65 to 74 Years | 70 (90.9%) | 51 (66.2%) |
| 75 Years and over | 112 (100.0%) | 104 (92.9%) |
| Total | 300 (27.3%) | 874 (79.4%) |
Disability Status by Sex by Age in Calumet
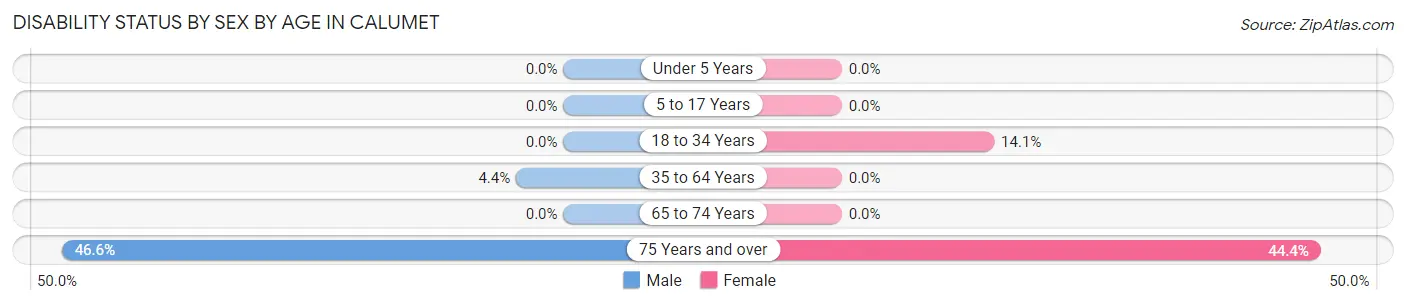
| Age Bracket | Male | Female |
| Under 5 Years | 0 (0.0%) | 0 (0.0%) |
| 5 to 17 Years | 0 (0.0%) | 0 (0.0%) |
| 18 to 34 Years | 0 (0.0%) | 14 (14.1%) |
| 35 to 64 Years | 15 (4.4%) | 0 (0.0%) |
| 65 to 74 Years | 0 (0.0%) | 0 (0.0%) |
| 75 Years and over | 27 (46.6%) | 24 (44.4%) |
Disability Class by Sex by Age in Calumet
Disability Class: Hearing Difficulty
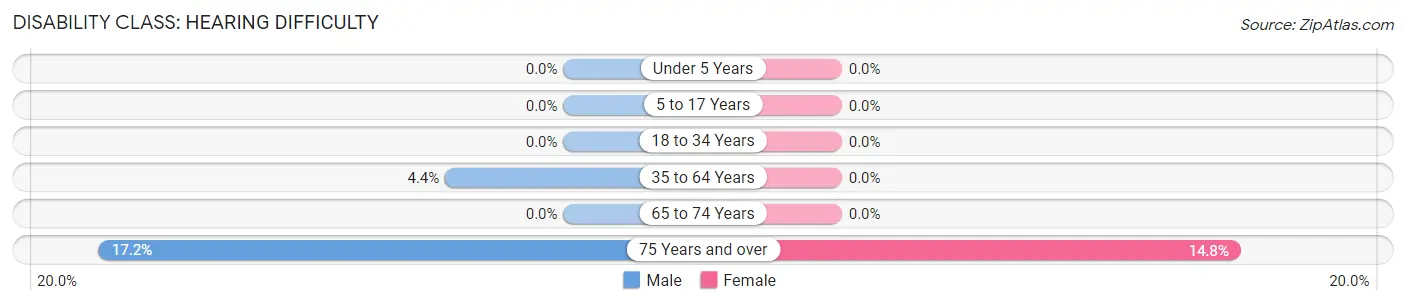
| Age Bracket | Male | Female |
| Under 5 Years | 0 (0.0%) | 0 (0.0%) |
| 5 to 17 Years | 0 (0.0%) | 0 (0.0%) |
| 18 to 34 Years | 0 (0.0%) | 0 (0.0%) |
| 35 to 64 Years | 15 (4.4%) | 0 (0.0%) |
| 65 to 74 Years | 0 (0.0%) | 0 (0.0%) |
| 75 Years and over | 10 (17.2%) | 8 (14.8%) |
Disability Class: Vision Difficulty
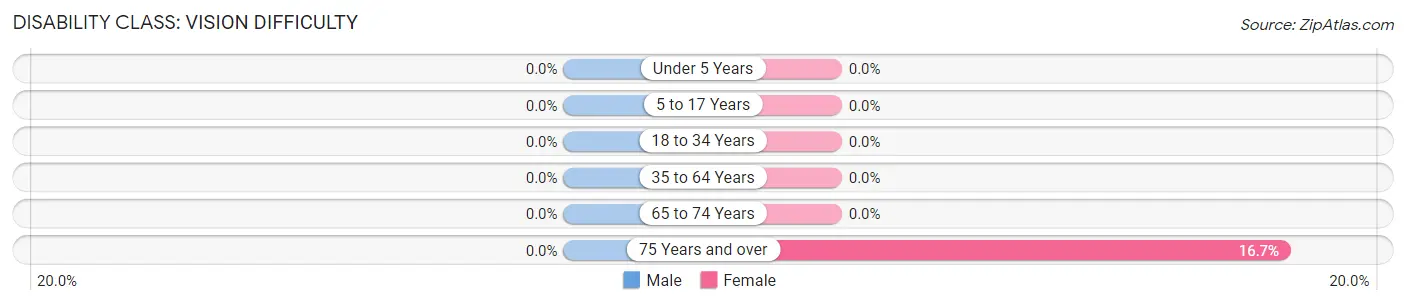
| Age Bracket | Male | Female |
| Under 5 Years | 0 (0.0%) | 0 (0.0%) |
| 5 to 17 Years | 0 (0.0%) | 0 (0.0%) |
| 18 to 34 Years | 0 (0.0%) | 0 (0.0%) |
| 35 to 64 Years | 0 (0.0%) | 0 (0.0%) |
| 65 to 74 Years | 0 (0.0%) | 0 (0.0%) |
| 75 Years and over | 0 (0.0%) | 9 (16.7%) |
Disability Class: Cognitive Difficulty
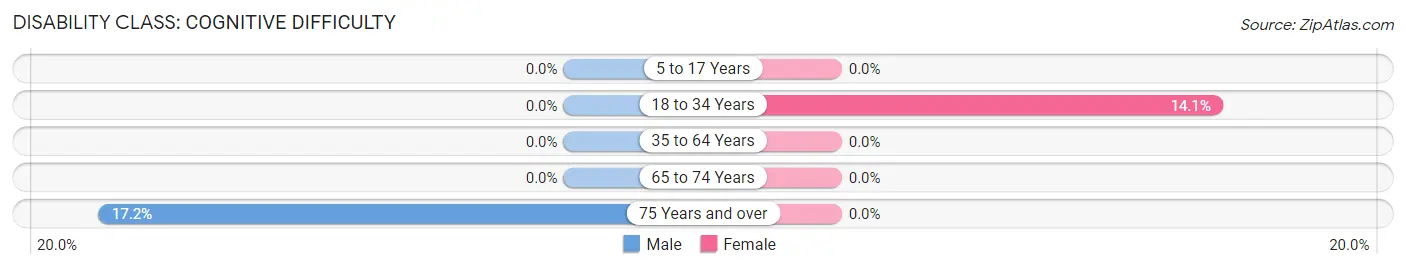
| Age Bracket | Male | Female |
| 5 to 17 Years | 0 (0.0%) | 0 (0.0%) |
| 18 to 34 Years | 0 (0.0%) | 14 (14.1%) |
| 35 to 64 Years | 0 (0.0%) | 0 (0.0%) |
| 65 to 74 Years | 0 (0.0%) | 0 (0.0%) |
| 75 Years and over | 10 (17.2%) | 0 (0.0%) |
Disability Class: Ambulatory Difficulty
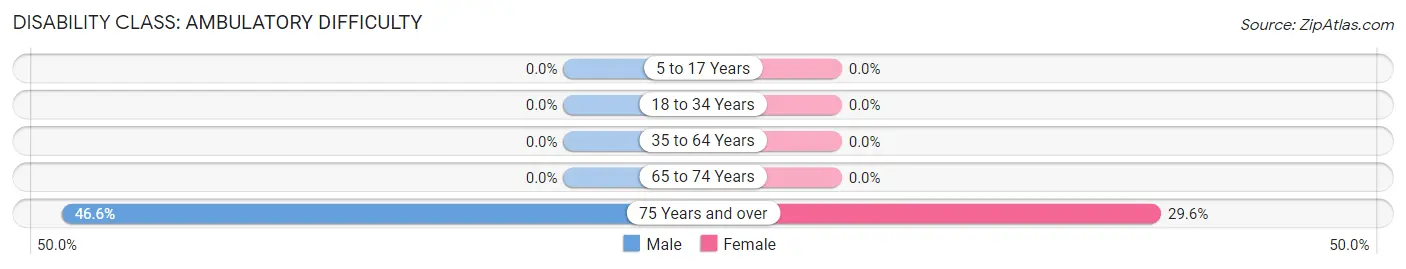
| Age Bracket | Male | Female |
| 5 to 17 Years | 0 (0.0%) | 0 (0.0%) |
| 18 to 34 Years | 0 (0.0%) | 0 (0.0%) |
| 35 to 64 Years | 0 (0.0%) | 0 (0.0%) |
| 65 to 74 Years | 0 (0.0%) | 0 (0.0%) |
| 75 Years and over | 27 (46.6%) | 16 (29.6%) |
Disability Class: Self-Care Difficulty
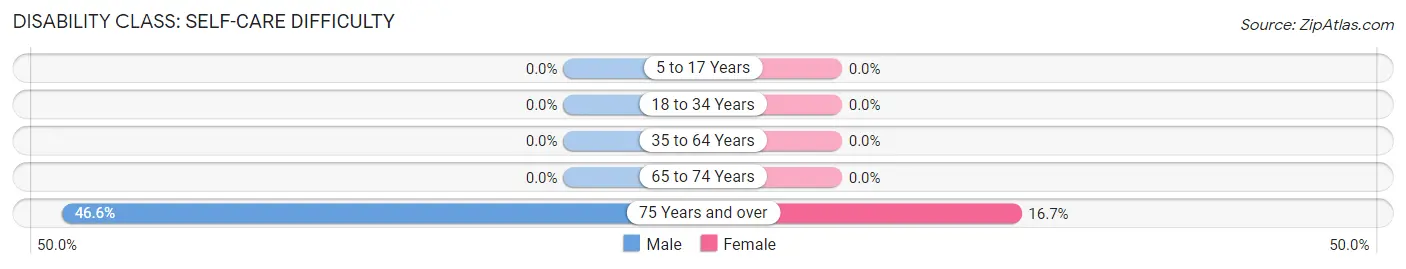
| Age Bracket | Male | Female |
| 5 to 17 Years | 0 (0.0%) | 0 (0.0%) |
| 18 to 34 Years | 0 (0.0%) | 0 (0.0%) |
| 35 to 64 Years | 0 (0.0%) | 0 (0.0%) |
| 65 to 74 Years | 0 (0.0%) | 0 (0.0%) |
| 75 Years and over | 27 (46.6%) | 9 (16.7%) |
Technology Access in Calumet
Computing Device Access in Calumet
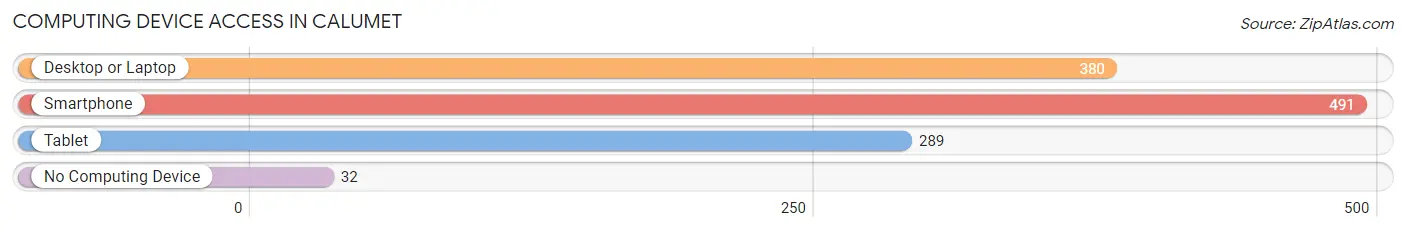
| Device Type | # Households | % Households |
| Desktop or Laptop | 380 | 68.6% |
| Smartphone | 491 | 88.6% |
| Tablet | 289 | 52.2% |
| No Computing Device | 32 | 5.8% |
| Total | 554 | 100.0% |
Internet Access in Calumet
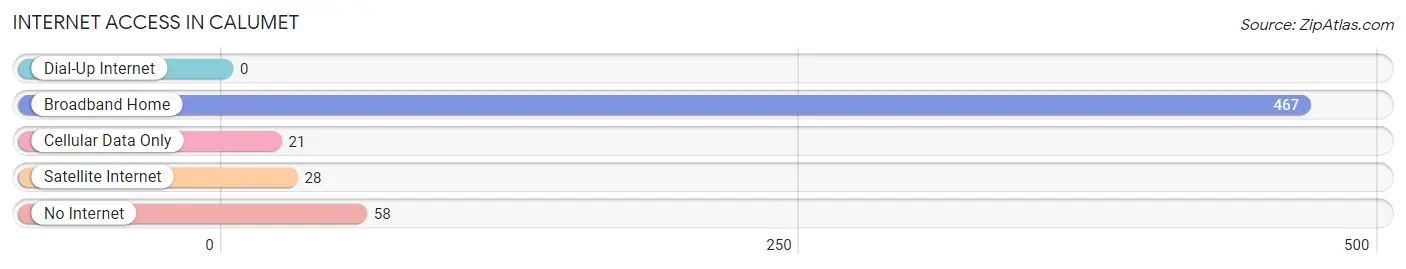
| Internet Type | # Households | % Households |
| Dial-Up Internet | 0 | 0.0% |
| Broadband Home | 467 | 84.3% |
| Cellular Data Only | 21 | 3.8% |
| Satellite Internet | 28 | 5.1% |
| No Internet | 58 | 10.5% |
| Total | 554 | 100.0% |
Calumet Summary
Calumet, Pennsylvania is a small borough located in Westmoreland County, Pennsylvania. It is situated in the foothills of the Allegheny Mountains, approximately 30 miles southeast of Pittsburgh. The population of Calumet was 1,845 as of the 2010 census.
History
Calumet was founded in 1872 by a group of coal miners from Scotland. The miners named the town after the Calumet Mining Company, which had been established in the area in 1871. The company was named after the Calumet River in Michigan, which was a major source of copper for the Native Americans.
The town grew rapidly in the late 19th century, as the coal industry flourished in the area. The Calumet Mining Company was the largest employer in the area, and the town was home to several other coal mines. The town also had a number of stores, churches, and other businesses.
In the early 20th century, the coal industry began to decline, and the town's population began to decline as well. The last coal mine in Calumet closed in the 1950s, and the town's population dropped to just over 1,000 by the 1970s.
Geography
Calumet is located in Westmoreland County, Pennsylvania, in the foothills of the Allegheny Mountains. The town is situated on the banks of the Loyalhanna Creek, which flows through the town and into the nearby Youghiogheny River.
The town is located approximately 30 miles southeast of Pittsburgh, and is accessible via Interstate 70 and U.S. Route 30. The nearest major airport is the Pittsburgh International Airport, which is located approximately 40 miles away.
Economy
Calumet's economy is largely based on tourism and retail. The town is home to several small businesses, including restaurants, antique stores, and gift shops. The town also has a number of bed and breakfasts, which attract visitors from all over the region.
The town is also home to a number of small manufacturing companies, including a furniture manufacturer and a metal fabrication company. The town is also home to a number of small farms, which produce a variety of fruits and vegetables.
Demographics
As of the 2010 census, the population of Calumet was 1,845. The racial makeup of the town was 97.3% White, 0.7% African American, 0.2% Native American, 0.2% Asian, 0.2% from other races, and 1.6% from two or more races. Hispanic or Latino of any race were 0.7% of the population.
The median income for a household in Calumet was $37,500, and the median income for a family was $45,000. The per capita income for the town was $19,000. About 10.3% of families and 12.2% of the population were below the poverty line, including 16.2% of those under age 18 and 8.3% of those age 65 or over.
Common Questions
What is Per Capita Income in Calumet?
Per Capita income in Calumet is $39,021.
What is the Median Family Income in Calumet?
Median Family Income in Calumet is $79,016.
What is the Median Household income in Calumet?
Median Household Income in Calumet is $77,432.
What is Income or Wage Gap in Calumet?
Income or Wage Gap in Calumet is 18.1%.
Women in Calumet earn 81.9 cents for every dollar earned by a man.
What is Inequality or Gini Index in Calumet?
Inequality or Gini Index in Calumet is 0.27.
What is the Total Population of Calumet?
Total Population of Calumet is 1,101.
What is the Total Male Population of Calumet?
Total Male Population of Calumet is 589.
What is the Total Female Population of Calumet?
Total Female Population of Calumet is 512.
What is the Ratio of Males per 100 Females in Calumet?
There are 115.04 Males per 100 Females in Calumet.
What is the Ratio of Females per 100 Males in Calumet?
There are 86.93 Females per 100 Males in Calumet.
What is the Median Population Age in Calumet?
Median Population Age in Calumet is 44.5 Years.
What is the Average Family Size in Calumet
Average Family Size in Calumet is 2.6 People.
What is the Average Household Size in Calumet
Average Household Size in Calumet is 2.0 People.
How Large is the Labor Force in Calumet?
There are 632 People in the Labor Forcein in Calumet.
What is the Percentage of People in the Labor Force in Calumet?
67.2% of People are in the Labor Force in Calumet.