Slabtown, PA Map & Demographics
Slabtown Map
Slabtown Overview
$34,795
PER CAPITA INCOME
$86,406
AVG FAMILY INCOME
$85,313
AVG HOUSEHOLD INCOME
39.3%
WAGE / INCOME GAP [ % ]
60.7¢/ $1
WAGE / INCOME GAP [ $ ]
0.27
INEQUALITY / GINI INDEX
128
TOTAL POPULATION
62
MALE POPULATION
66
FEMALE POPULATION
93.94
MALES / 100 FEMALES
106.45
FEMALES / 100 MALES
27.5
MEDIAN AGE
3.3
AVG FAMILY SIZE
2.9
AVG HOUSEHOLD SIZE
97
LABOR FORCE [ PEOPLE ]
94.2%
PERCENT IN LABOR FORCE
Income in Slabtown
Income Overview in Slabtown
Per Capita Income in Slabtown is $34,795, while median incomes of families and households are $86,406 and $85,313 respectively.
| Characteristic | Number | Measure |
| Per Capita Income | 128 | $34,795 |
| Median Family Income | 37 | $86,406 |
| Mean Family Income | 37 | $112,962 |
| Median Household Income | 44 | $85,313 |
| Mean Household Income | 44 | $98,893 |
| Income Deficit | 37 | $0 |
| Wage / Income Gap (%) | 128 | 39.27% |
| Wage / Income Gap ($) | 128 | 60.73¢ per $1 |
| Gini / Inequality Index | 128 | 0.27 |
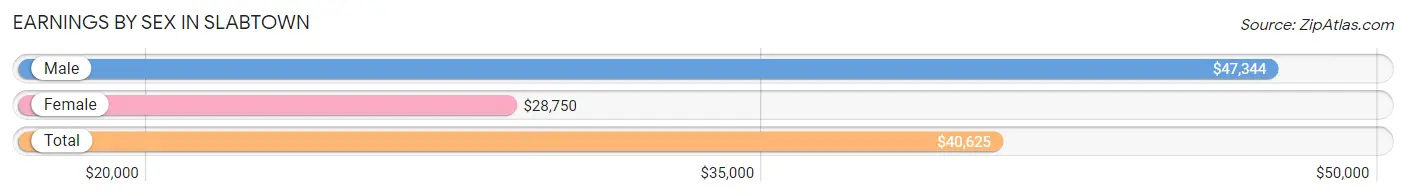
Earnings by Sex in Slabtown
Average Earnings in Slabtown are $40,625, $47,344 for men and $28,750 for women, a difference of 39.3%.
| Sex | Number | Average Earnings |
| Male | 53 (54.6%) | $47,344 |
| Female | 44 (45.4%) | $28,750 |
| Total | 97 (100.0%) | $40,625 |
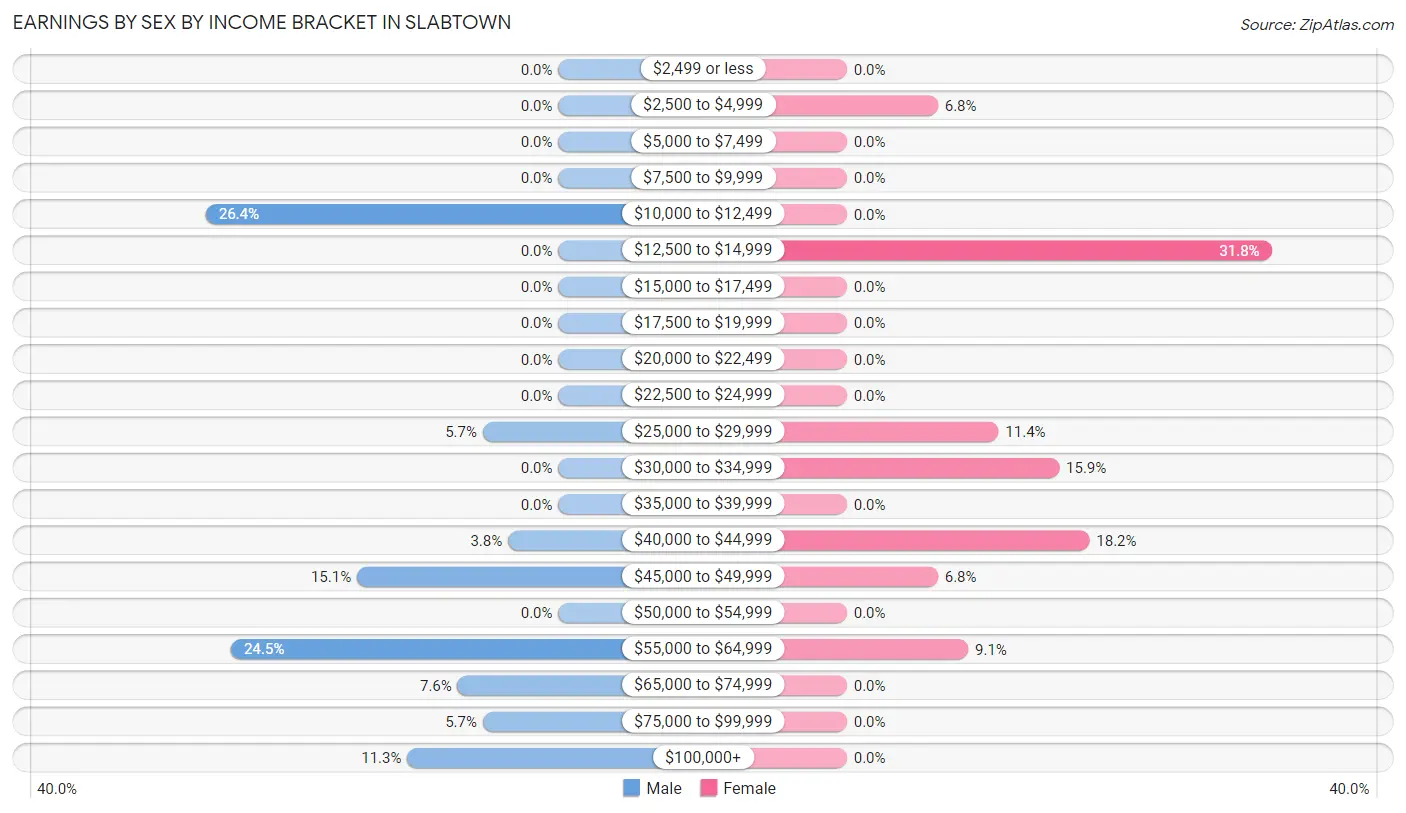
Earnings by Sex by Income Bracket in Slabtown
The most common earnings brackets in Slabtown are $10,000 to $12,499 for men (14 | 26.4%) and $12,500 to $14,999 for women (14 | 31.8%).
| Income | Male | Female |
| $2,499 or less | 0 (0.0%) | 0 (0.0%) |
| $2,500 to $4,999 | 0 (0.0%) | 3 (6.8%) |
| $5,000 to $7,499 | 0 (0.0%) | 0 (0.0%) |
| $7,500 to $9,999 | 0 (0.0%) | 0 (0.0%) |
| $10,000 to $12,499 | 14 (26.4%) | 0 (0.0%) |
| $12,500 to $14,999 | 0 (0.0%) | 14 (31.8%) |
| $15,000 to $17,499 | 0 (0.0%) | 0 (0.0%) |
| $17,500 to $19,999 | 0 (0.0%) | 0 (0.0%) |
| $20,000 to $22,499 | 0 (0.0%) | 0 (0.0%) |
| $22,500 to $24,999 | 0 (0.0%) | 0 (0.0%) |
| $25,000 to $29,999 | 3 (5.7%) | 5 (11.4%) |
| $30,000 to $34,999 | 0 (0.0%) | 7 (15.9%) |
| $35,000 to $39,999 | 0 (0.0%) | 0 (0.0%) |
| $40,000 to $44,999 | 2 (3.8%) | 8 (18.2%) |
| $45,000 to $49,999 | 8 (15.1%) | 3 (6.8%) |
| $50,000 to $54,999 | 0 (0.0%) | 0 (0.0%) |
| $55,000 to $64,999 | 13 (24.5%) | 4 (9.1%) |
| $65,000 to $74,999 | 4 (7.5%) | 0 (0.0%) |
| $75,000 to $99,999 | 3 (5.7%) | 0 (0.0%) |
| $100,000+ | 6 (11.3%) | 0 (0.0%) |
| Total | 53 (100.0%) | 44 (100.0%) |
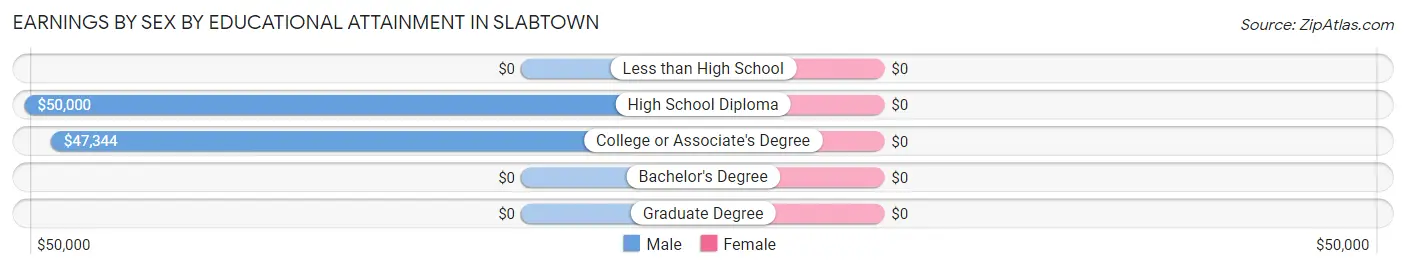
Earnings by Sex by Educational Attainment in Slabtown
| Educational Attainment | Male Income | Female Income |
| Less than High School | - | - |
| High School Diploma | $50,000 | $0 |
| College or Associate's Degree | $47,344 | $0 |
| Bachelor's Degree | - | - |
| Graduate Degree | - | - |
| Total | $57,692 | $41,406 |
Family Income in Slabtown
Family Income Brackets in Slabtown
According to the Slabtown family income data, there are 22 families falling into the $75,000 to $99,999 income range, which is the most common income bracket and makes up 59.5% of all families.
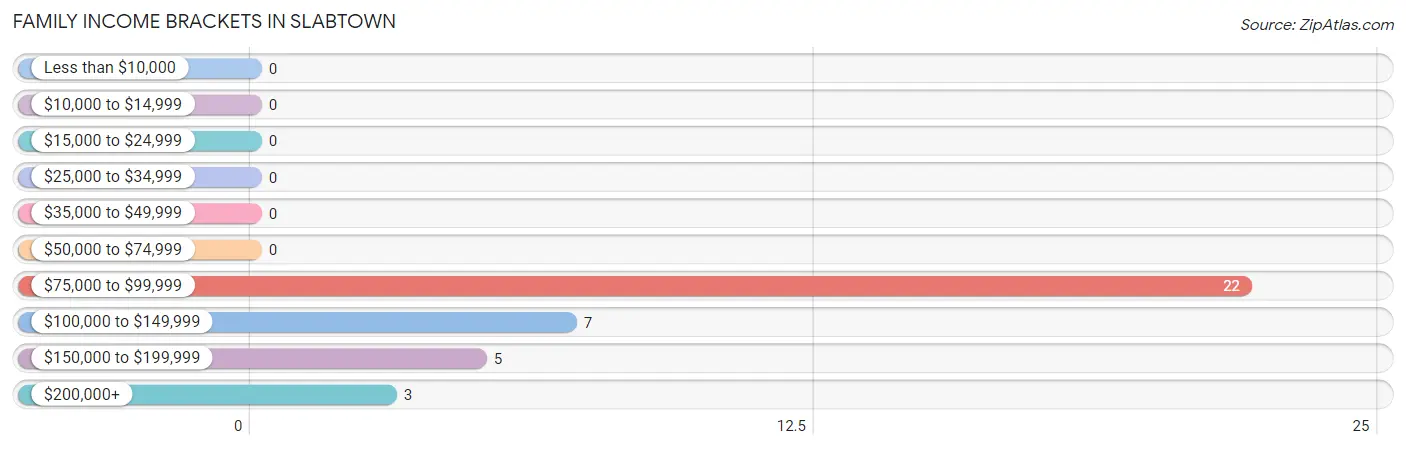
| Income Bracket | # Families | % Families |
| Less than $10,000 | 0 | 0.0% |
| $10,000 to $14,999 | 0 | 0.0% |
| $15,000 to $24,999 | 0 | 0.0% |
| $25,000 to $34,999 | 0 | 0.0% |
| $35,000 to $49,999 | 0 | 0.0% |
| $50,000 to $74,999 | 0 | 0.0% |
| $75,000 to $99,999 | 22 | 59.5% |
| $100,000 to $149,999 | 7 | 18.9% |
| $150,000 to $199,999 | 5 | 13.5% |
| $200,000+ | 3 | 8.1% |
Family Income by Famaliy Size in Slabtown
2-person families (15 | 40.5%) account for the highest median family income in Slabtown with $87,344 per family, while 2-person families (15 | 40.5%) have the highest median income of $43,672 per family member.
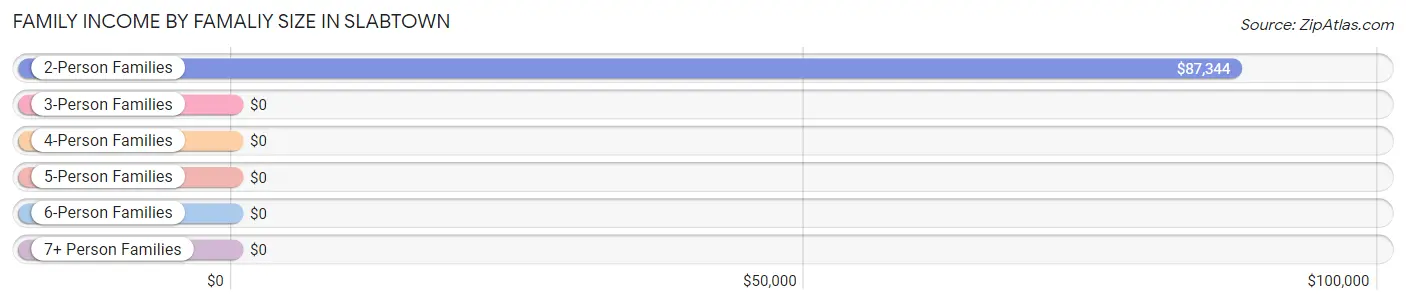
| Income Bracket | # Families | Median Income |
| 2-Person Families | 15 (40.5%) | $87,344 |
| 3-Person Families | 0 (0.0%) | $0 |
| 4-Person Families | 17 (46.0%) | $0 |
| 5-Person Families | 5 (13.5%) | $0 |
| 6-Person Families | 0 (0.0%) | $0 |
| 7+ Person Families | 0 (0.0%) | $0 |
| Total | 37 (100.0%) | $86,406 |
Family Income by Number of Earners in Slabtown
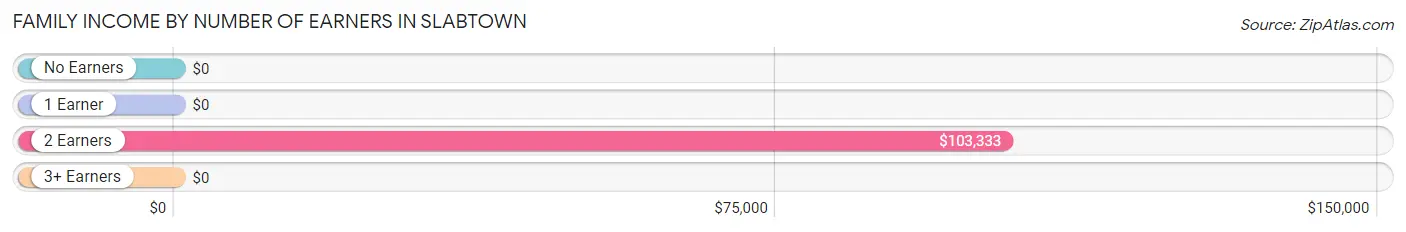
| Number of Earners | # Families | Median Income |
| No Earners | 0 (0.0%) | $0 |
| 1 Earner | 3 (8.1%) | $0 |
| 2 Earners | 18 (48.6%) | $103,333 |
| 3+ Earners | 16 (43.2%) | $0 |
| Total | 37 (100.0%) | $86,406 |
Household Income in Slabtown
Household Income Brackets in Slabtown
With 22 households falling in the category, the $75,000 to $99,999 income range is the most frequent in Slabtown, accounting for 50.0% of all households.
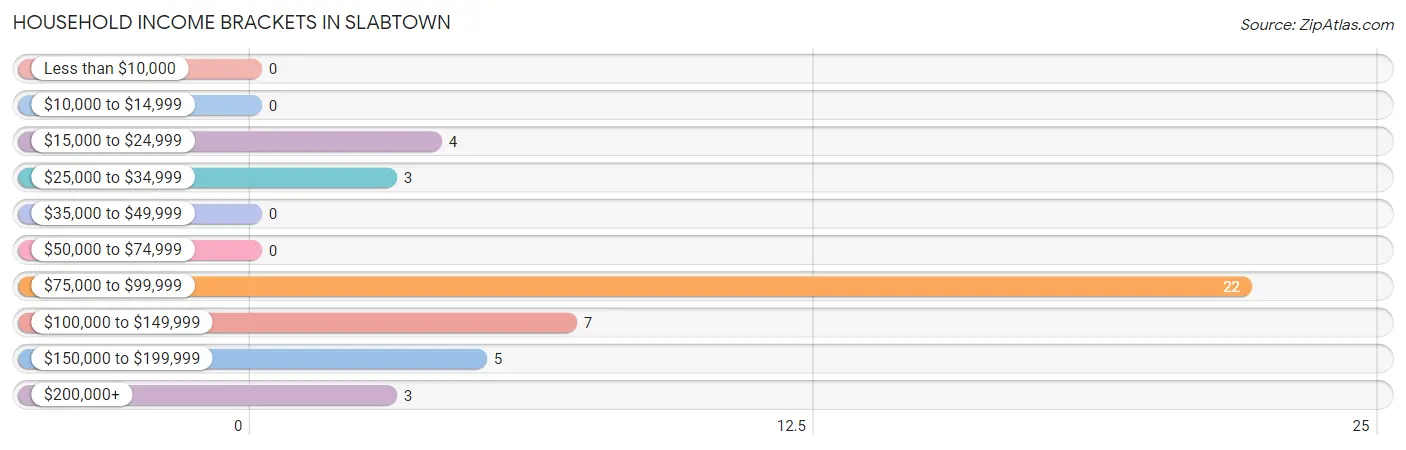
| Income Bracket | # Households | % Households |
| Less than $10,000 | 0 | 0.0% |
| $10,000 to $14,999 | 0 | 0.0% |
| $15,000 to $24,999 | 4 | 9.1% |
| $25,000 to $34,999 | 3 | 6.8% |
| $35,000 to $49,999 | 0 | 0.0% |
| $50,000 to $74,999 | 0 | 0.0% |
| $75,000 to $99,999 | 22 | 50.0% |
| $100,000 to $149,999 | 7 | 15.9% |
| $150,000 to $199,999 | 5 | 11.4% |
| $200,000+ | 3 | 6.8% |
Household Income by Householder Age in Slabtown
The median household income in Slabtown is $85,313, with the highest median household income of $103,333 found in the 25 to 44 years age bracket for the primary householder. A total of 18 households (40.9%) fall into this category. Meanwhile, the 15 to 24 years age bracket for the primary householder has the lowest median household income of $0, with 14 households (31.8%) in this group.
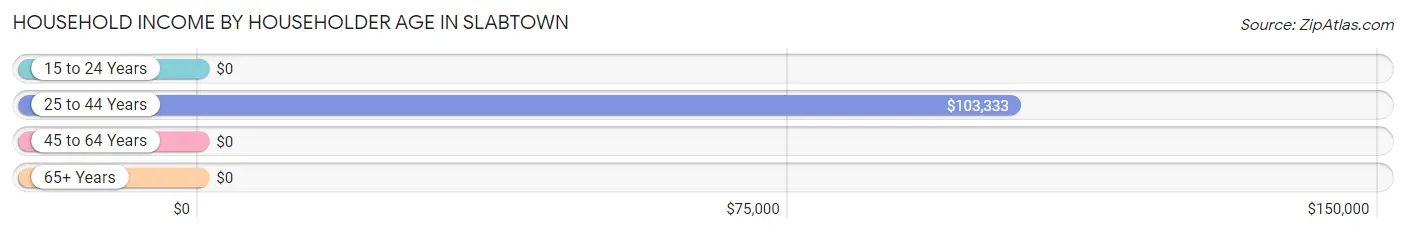
| Income Bracket | # Households | Median Income |
| 15 to 24 Years | 14 (31.8%) | $0 |
| 25 to 44 Years | 18 (40.9%) | $103,333 |
| 45 to 64 Years | 5 (11.4%) | $0 |
| 65+ Years | 7 (15.9%) | $0 |
| Total | 44 (100.0%) | $85,313 |
Poverty in Slabtown
Income Below Poverty by Sex and Age in Slabtown
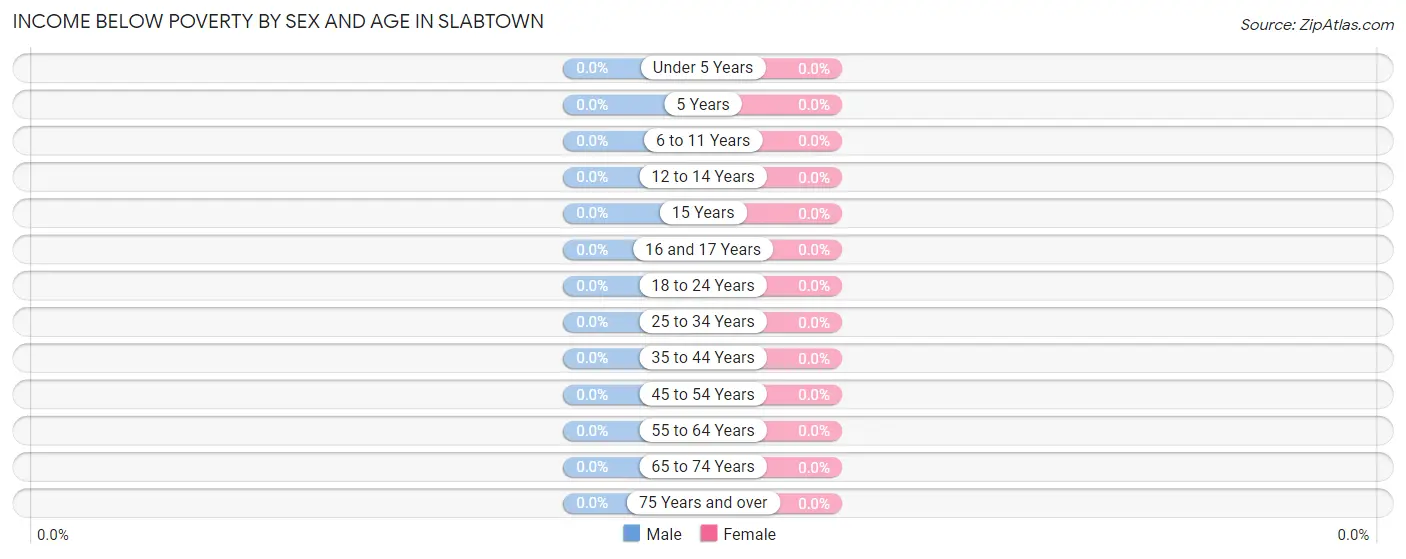
| Age Bracket | Male | Female |
| Under 5 Years | 0 (0.0%) | 0 (0.0%) |
| 5 Years | 0 (0.0%) | 0 (0.0%) |
| 6 to 11 Years | 0 (0.0%) | 0 (0.0%) |
| 12 to 14 Years | 0 (0.0%) | 0 (0.0%) |
| 15 Years | 0 (0.0%) | 0 (0.0%) |
| 16 and 17 Years | 0 (0.0%) | 0 (0.0%) |
| 18 to 24 Years | 0 (0.0%) | 0 (0.0%) |
| 25 to 34 Years | 0 (0.0%) | 0 (0.0%) |
| 35 to 44 Years | 0 (0.0%) | 0 (0.0%) |
| 45 to 54 Years | 0 (0.0%) | 0 (0.0%) |
| 55 to 64 Years | 0 (0.0%) | 0 (0.0%) |
| 65 to 74 Years | 0 (0.0%) | 0 (0.0%) |
| 75 Years and over | 0 (0.0%) | 0 (0.0%) |
| Total | 0 (0.0%) | 0 (0.0%) |
Income Above Poverty by Sex and Age in Slabtown
According to the poverty statistics in Slabtown, males aged 6 to 11 years and females aged under 5 years are the age groups that are most secure financially, with 100.0% of males and 100.0% of females in these age groups living above the poverty line.
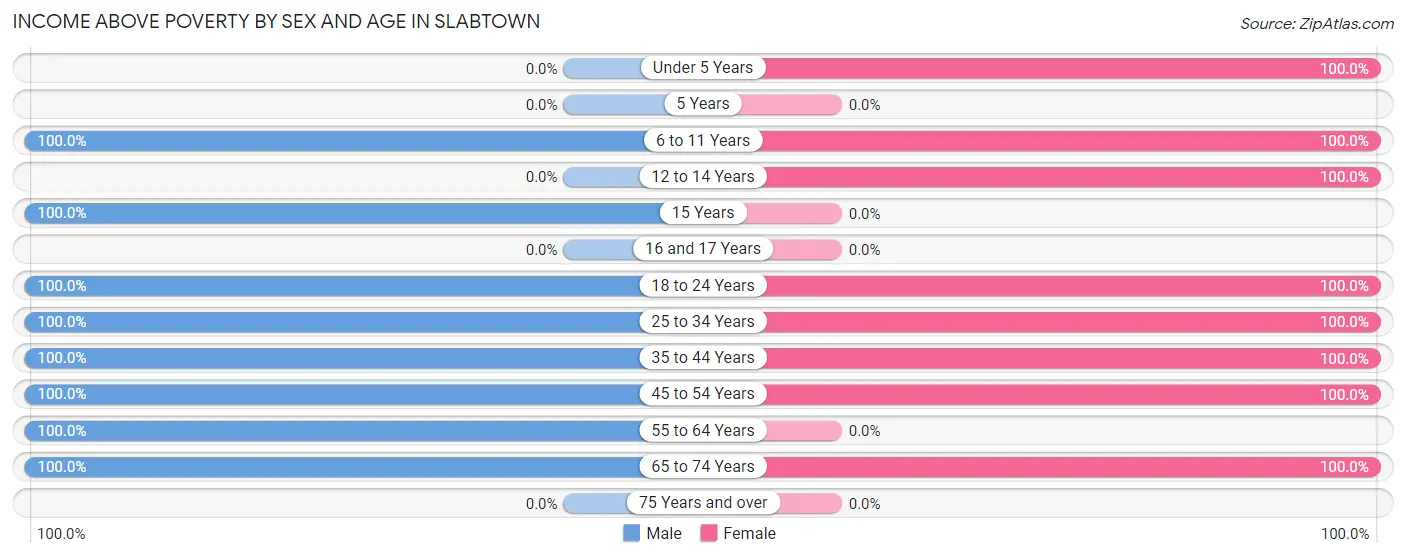
| Age Bracket | Male | Female |
| Under 5 Years | 0 (0.0%) | 10 (100.0%) |
| 5 Years | 0 (0.0%) | 0 (0.0%) |
| 6 to 11 Years | 6 (100.0%) | 3 (100.0%) |
| 12 to 14 Years | 0 (0.0%) | 3 (100.0%) |
| 15 Years | 3 (100.0%) | 0 (0.0%) |
| 16 and 17 Years | 0 (0.0%) | 0 (0.0%) |
| 18 to 24 Years | 3 (100.0%) | 23 (100.0%) |
| 25 to 34 Years | 25 (100.0%) | 12 (100.0%) |
| 35 to 44 Years | 6 (100.0%) | 6 (100.0%) |
| 45 to 54 Years | 13 (100.0%) | 3 (100.0%) |
| 55 to 64 Years | 3 (100.0%) | 0 (0.0%) |
| 65 to 74 Years | 3 (100.0%) | 6 (100.0%) |
| 75 Years and over | 0 (0.0%) | 0 (0.0%) |
| Total | 62 (100.0%) | 66 (100.0%) |
Income Below Poverty Among Married-Couple Families in Slabtown
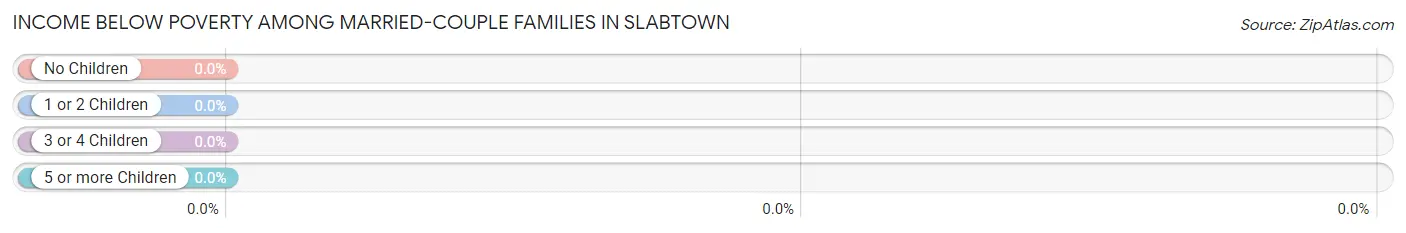
| Children | Above Poverty | Below Poverty |
| No Children | 17 (100.0%) | 0 (0.0%) |
| 1 or 2 Children | 17 (100.0%) | 0 (0.0%) |
| 3 or 4 Children | 3 (100.0%) | 0 (0.0%) |
| 5 or more Children | 0 (0.0%) | 0 (0.0%) |
| Total | 37 (100.0%) | 0 (0.0%) |
Income Below Poverty Among Single-Parent Households in Slabtown
| Children | Single Father | Single Mother |
| No Children | 0 (0.0%) | 0 (0.0%) |
| 1 or 2 Children | 0 (0.0%) | 0 (0.0%) |
| 3 or 4 Children | 0 (0.0%) | 0 (0.0%) |
| 5 or more Children | 0 (0.0%) | 0 (0.0%) |
| Total | 0 (0.0%) | 0 (0.0%) |
Income Below Poverty Among Married-Couple vs Single-Parent Households in Slabtown
| Children | Married-Couple Families | Single-Parent Households |
| No Children | 0 (0.0%) | 0 (0.0%) |
| 1 or 2 Children | 0 (0.0%) | 0 (0.0%) |
| 3 or 4 Children | 0 (0.0%) | 0 (0.0%) |
| 5 or more Children | 0 (0.0%) | 0 (0.0%) |
| Total | 0 (0.0%) | 0 (0.0%) |
Race in Slabtown
The most populous races in Slabtown are , and White / Caucasian (128 | 100.0%).
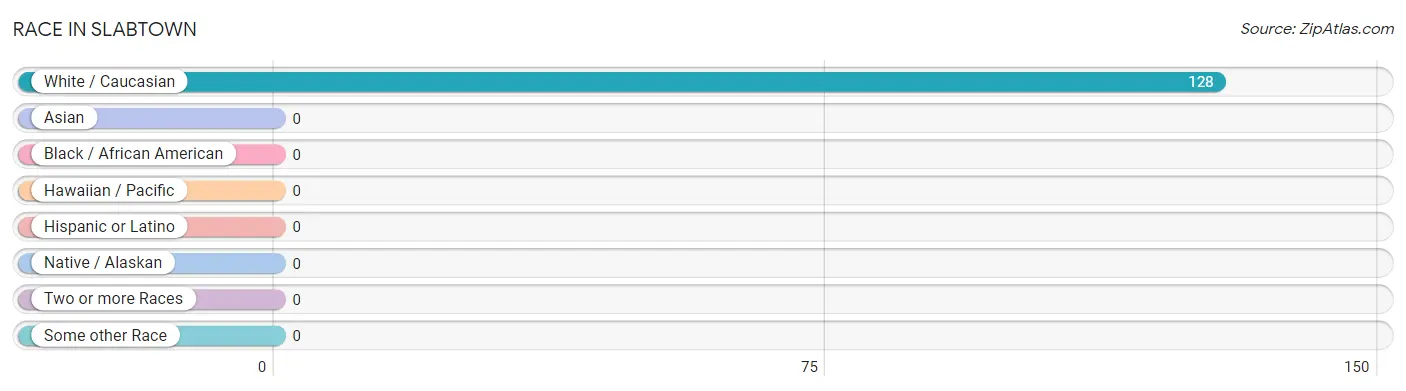
| Race | # Population | % Population |
| Asian | 0 | 0.0% |
| Black / African American | 0 | 0.0% |
| Hawaiian / Pacific | 0 | 0.0% |
| Hispanic or Latino | 0 | 0.0% |
| Native / Alaskan | 0 | 0.0% |
| White / Caucasian | 128 | 100.0% |
| Two or more Races | 0 | 0.0% |
| Some other Race | 0 | 0.0% |
| Total | 128 | 100.0% |
Ancestry in Slabtown
The most populous ancestries reported in Slabtown are Polish (35 | 27.3%), Italian (30 | 23.4%), German (15 | 11.7%), Pennsylvania German (12 | 9.4%), and Slovak (6 | 4.7%), together accounting for 76.6% of all Slabtown residents.
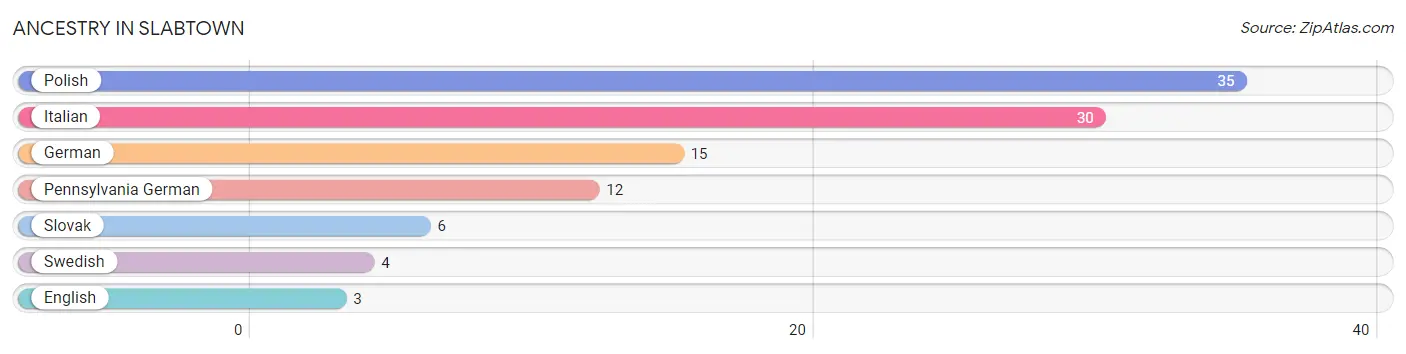
| Ancestry | # Population | % Population |
| English | 3 | 2.3% |
| German | 15 | 11.7% |
| Italian | 30 | 23.4% |
| Pennsylvania German | 12 | 9.4% |
| Polish | 35 | 27.3% |
| Slovak | 6 | 4.7% |
| Swedish | 4 | 3.1% | View All 7 Rows |
Immigrants in Slabtown

| Immigration Origin | # Population | % Population | View All 0 Rows |
Sex and Age in Slabtown
Sex and Age in Slabtown
The most populous age groups in Slabtown are 25 to 29 Years (13 | 21.0%) for men and 20 to 24 Years (23 | 34.8%) for women.
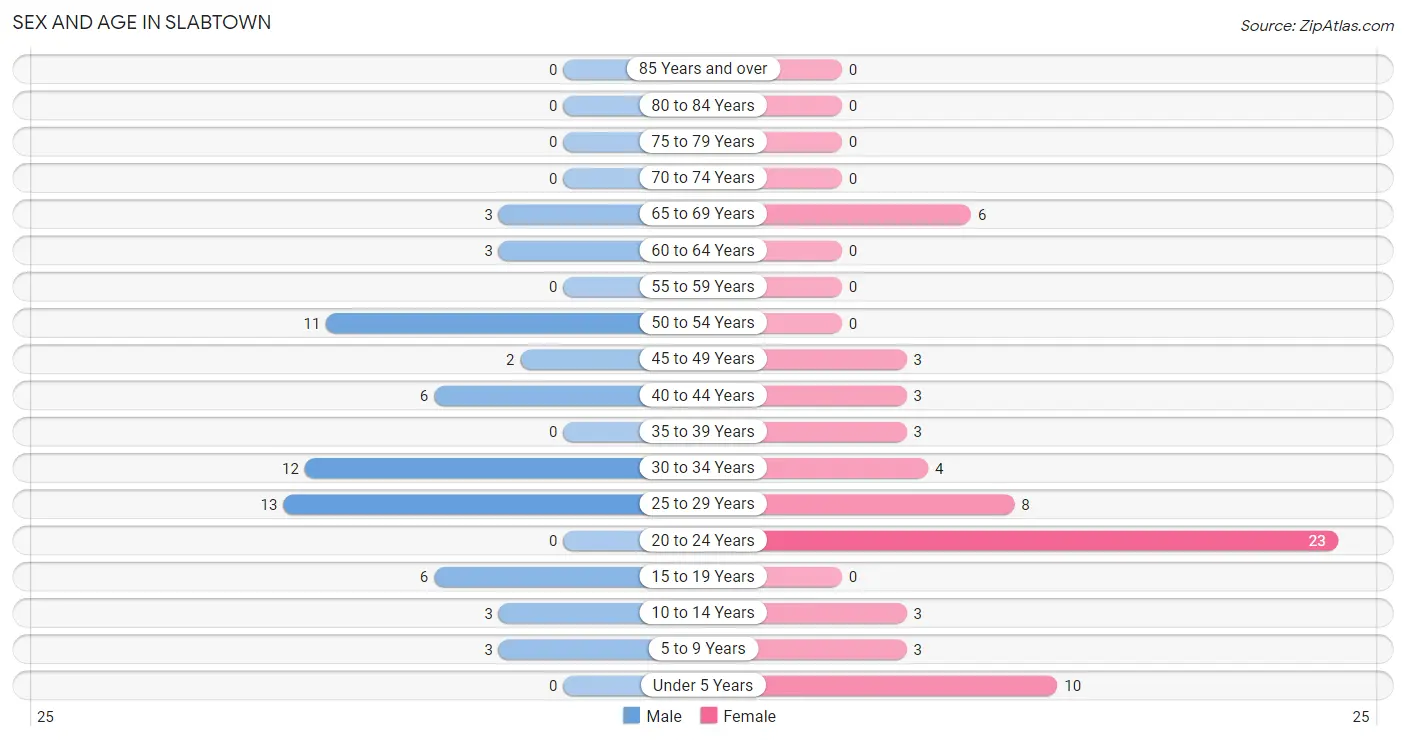
| Age Bracket | Male | Female |
| Under 5 Years | 0 (0.0%) | 10 (15.1%) |
| 5 to 9 Years | 3 (4.8%) | 3 (4.5%) |
| 10 to 14 Years | 3 (4.8%) | 3 (4.5%) |
| 15 to 19 Years | 6 (9.7%) | 0 (0.0%) |
| 20 to 24 Years | 0 (0.0%) | 23 (34.8%) |
| 25 to 29 Years | 13 (21.0%) | 8 (12.1%) |
| 30 to 34 Years | 12 (19.4%) | 4 (6.1%) |
| 35 to 39 Years | 0 (0.0%) | 3 (4.5%) |
| 40 to 44 Years | 6 (9.7%) | 3 (4.5%) |
| 45 to 49 Years | 2 (3.2%) | 3 (4.5%) |
| 50 to 54 Years | 11 (17.7%) | 0 (0.0%) |
| 55 to 59 Years | 0 (0.0%) | 0 (0.0%) |
| 60 to 64 Years | 3 (4.8%) | 0 (0.0%) |
| 65 to 69 Years | 3 (4.8%) | 6 (9.1%) |
| 70 to 74 Years | 0 (0.0%) | 0 (0.0%) |
| 75 to 79 Years | 0 (0.0%) | 0 (0.0%) |
| 80 to 84 Years | 0 (0.0%) | 0 (0.0%) |
| 85 Years and over | 0 (0.0%) | 0 (0.0%) |
| Total | 62 (100.0%) | 66 (100.0%) |
Families and Households in Slabtown
Median Family Size in Slabtown
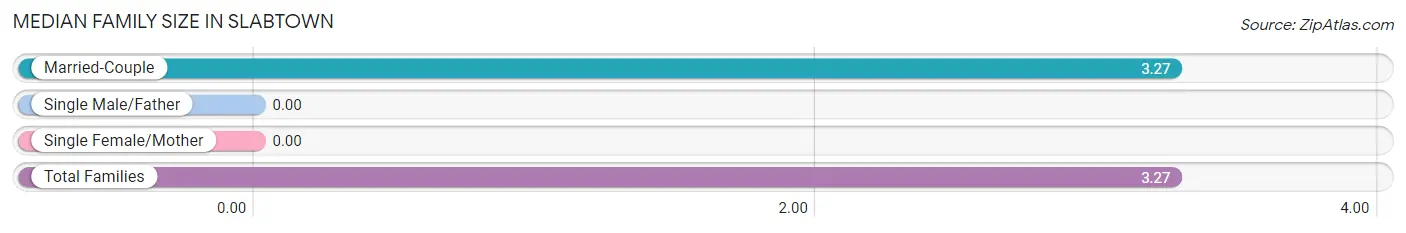
| Family Type | # Families | Family Size |
| Married-Couple | 37 (100.0%) | 3.27 |
| Single Male/Father | 0 (0.0%) | - |
| Single Female/Mother | 0 (0.0%) | - |
| Total Families | 37 (100.0%) | 3.27 |
Median Household Size in Slabtown
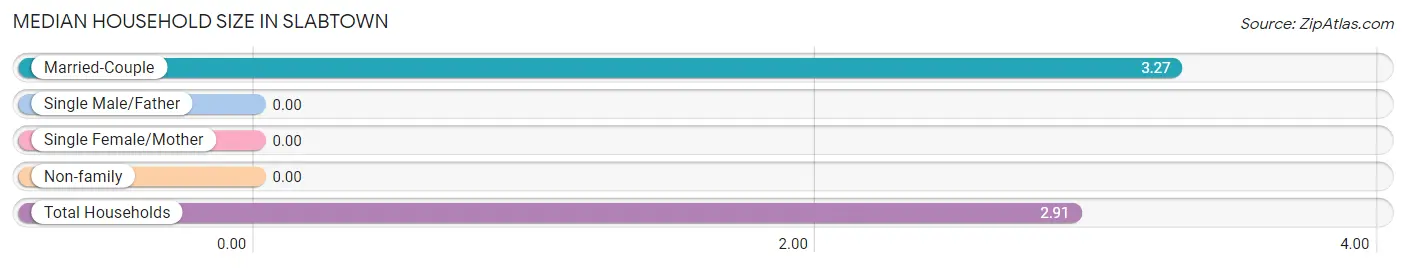
| Household Type | # Households | Household Size |
| Married-Couple | 37 (84.1%) | 3.27 |
| Single Male/Father | 0 (0.0%) | - |
| Single Female/Mother | 0 (0.0%) | - |
| Non-family | 7 (15.9%) | - |
| Total Households | 44 (100.0%) | 2.91 |
Household Size by Marriage Status in Slabtown
Out of a total of 44 households in Slabtown, 37 (84.1%) are family households, while 7 (15.9%) are nonfamily households. The most numerous type of family households are 4-person households, comprising 17, and the most common type of nonfamily households are 1-person households, comprising 7.
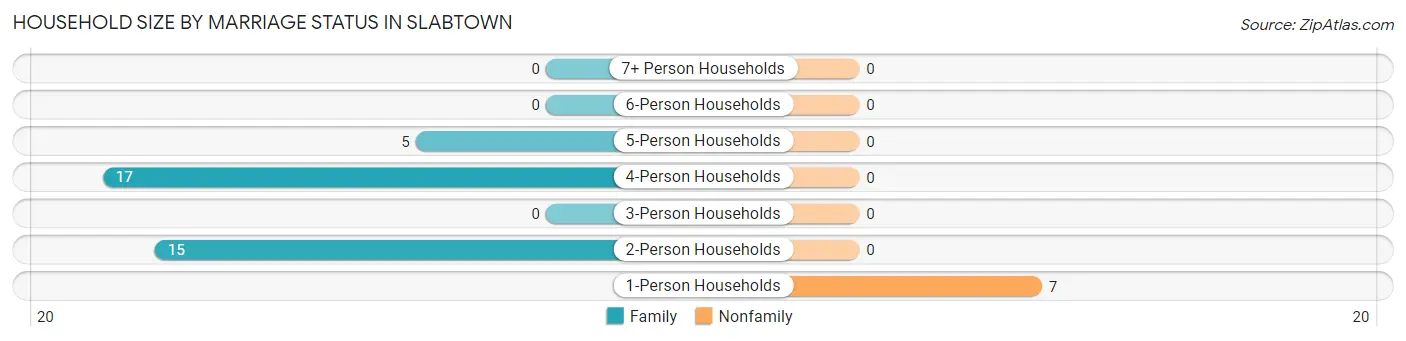
| Household Size | Family Households | Nonfamily Households |
| 1-Person Households | - | 7 (15.9%) |
| 2-Person Households | 15 (34.1%) | 0 (0.0%) |
| 3-Person Households | 0 (0.0%) | 0 (0.0%) |
| 4-Person Households | 17 (38.6%) | 0 (0.0%) |
| 5-Person Households | 5 (11.4%) | 0 (0.0%) |
| 6-Person Households | 0 (0.0%) | 0 (0.0%) |
| 7+ Person Households | 0 (0.0%) | 0 (0.0%) |
| Total | 37 (84.1%) | 7 (15.9%) |
Female Fertility in Slabtown
Fertility by Age in Slabtown
| Age Bracket | Women with Births | Births / 1,000 Women |
| 15 to 19 years | 0 (0.0%) | 0.0 |
| 20 to 34 years | 0 (0.0%) | 0.0 |
| 35 to 50 years | 0 (0.0%) | 0.0 |
| Total | 0 (0.0%) | 0.0 |
Fertility by Age by Marriage Status in Slabtown
| Age Bracket | Married | Unmarried |
| 15 to 19 years | 0 (0.0%) | 0 (0.0%) |
| 20 to 34 years | 0 (0.0%) | 0 (0.0%) |
| 35 to 50 years | 0 (0.0%) | 0 (0.0%) |
| Total | 0 (0.0%) | 0 (0.0%) |
Fertility by Education in Slabtown
| Educational Attainment | Women with Births | Births / 1,000 Women |
| Less than High School | 0 (0.0%) | 0.0 |
| High School Diploma | 0 (0.0%) | 0.0 |
| College or Associate's Degree | 0 (0.0%) | 0.0 |
| Bachelor's Degree | 0 (0.0%) | 0.0 |
| Graduate Degree | 0 (0.0%) | 0.0 |
| Total | 0 (0.0%) | 0.0 |
Fertility by Education by Marriage Status in Slabtown
| Educational Attainment | Married | Unmarried |
| Less than High School | 0 (0.0%) | 0 (0.0%) |
| High School Diploma | 0 (0.0%) | 0 (0.0%) |
| College or Associate's Degree | 0 (0.0%) | 0 (0.0%) |
| Bachelor's Degree | 0 (0.0%) | 0 (0.0%) |
| Graduate Degree | 0 (0.0%) | 0 (0.0%) |
| Total | 0 (0.0%) | 0 (0.0%) |
Employment Characteristics in Slabtown
Employment by Class of Employer in Slabtown
Among the 97 employed individuals in Slabtown, private company employees (55 | 56.7%), local government employees (19 | 19.6%), and self-employed (incorporated) (13 | 13.4%) make up the most common classes of employment.
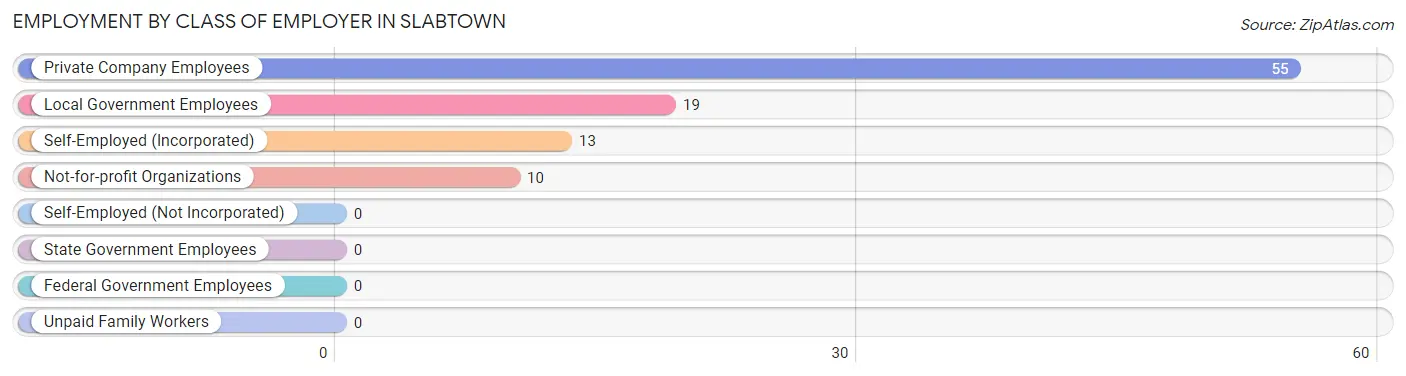
| Employer Class | # Employees | % Employees |
| Private Company Employees | 55 | 56.7% |
| Self-Employed (Incorporated) | 13 | 13.4% |
| Self-Employed (Not Incorporated) | 0 | 0.0% |
| Not-for-profit Organizations | 10 | 10.3% |
| Local Government Employees | 19 | 19.6% |
| State Government Employees | 0 | 0.0% |
| Federal Government Employees | 0 | 0.0% |
| Unpaid Family Workers | 0 | 0.0% |
| Total | 97 | 100.0% |
Employment Status by Age in Slabtown
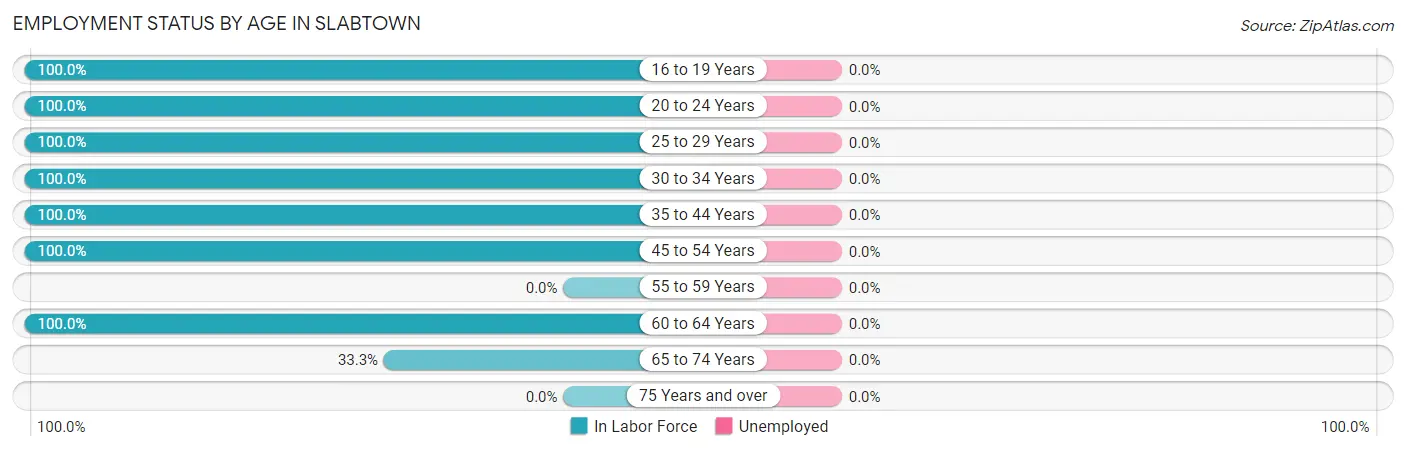
| Age Bracket | In Labor Force | Unemployed |
| 16 to 19 Years | 3 (100.0%) | 0 (0.0%) |
| 20 to 24 Years | 23 (100.0%) | 0 (0.0%) |
| 25 to 29 Years | 21 (100.0%) | 0 (0.0%) |
| 30 to 34 Years | 16 (100.0%) | 0 (0.0%) |
| 35 to 44 Years | 12 (100.0%) | 0 (0.0%) |
| 45 to 54 Years | 16 (100.0%) | 0 (0.0%) |
| 55 to 59 Years | 0 (0.0%) | 0 (0.0%) |
| 60 to 64 Years | 3 (100.0%) | 0 (0.0%) |
| 65 to 74 Years | 3 (33.3%) | 0 (0.0%) |
| 75 Years and over | 0 (0.0%) | 0 (0.0%) |
| Total | 97 (94.2%) | 0 (0.0%) |
Employment Status by Educational Attainment in Slabtown
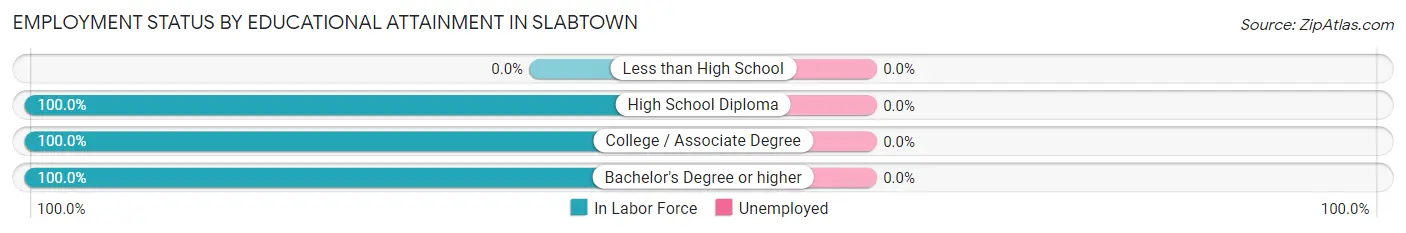
| Educational Attainment | In Labor Force | Unemployed |
| Less than High School | 0 (0.0%) | 0 (0.0%) |
| High School Diploma | 26 (100.0%) | 0 (0.0%) |
| College / Associate Degree | 21 (100.0%) | 0 (0.0%) |
| Bachelor's Degree or higher | 21 (100.0%) | 0 (0.0%) |
| Total | 68 (100.0%) | 0 (0.0%) |
Employment Occupations by Sex in Slabtown
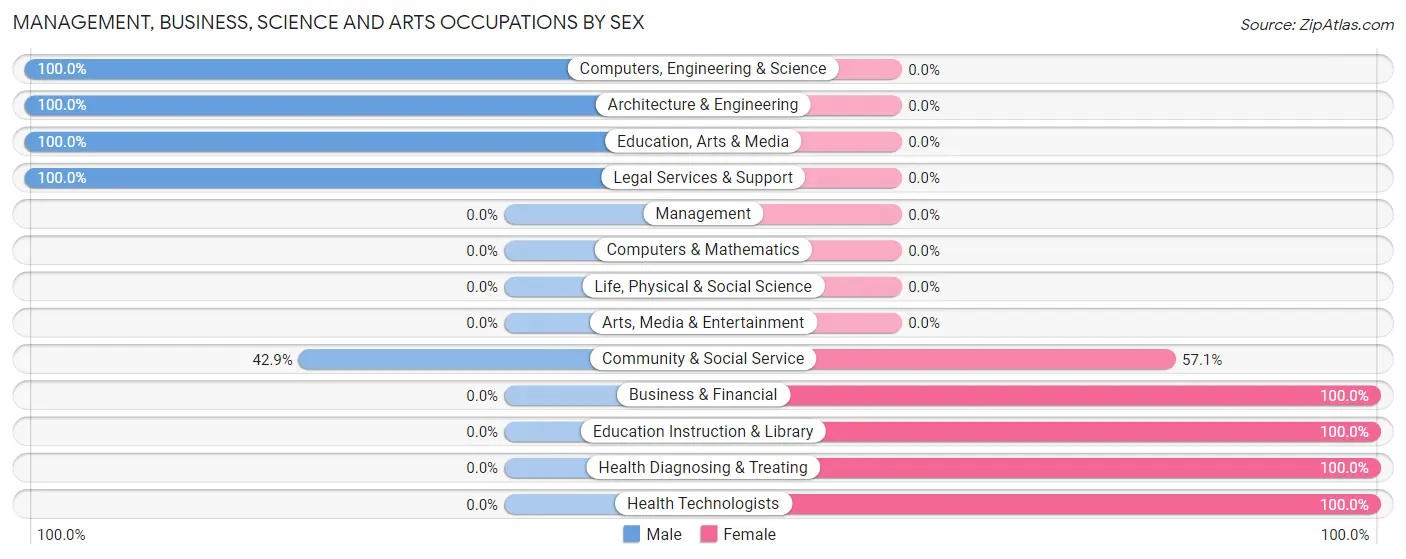
Management, Business, Science and Arts Occupations
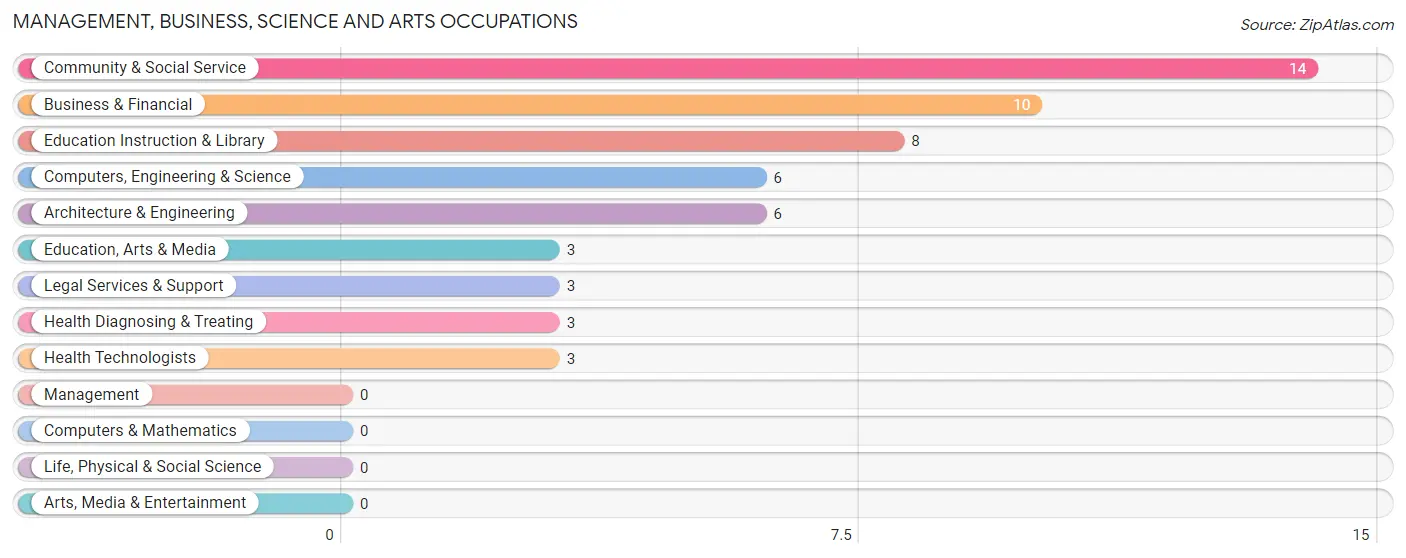
The most common Management, Business, Science and Arts occupations in Slabtown are Community & Social Service (14 | 14.4%), Business & Financial (10 | 10.3%), Education Instruction & Library (8 | 8.3%), Computers, Engineering & Science (6 | 6.2%), and Architecture & Engineering (6 | 6.2%).
Management, Business, Science and Arts Occupations by Sex
Within the Management, Business, Science and Arts occupations in Slabtown, the most male-oriented occupations are Computers, Engineering & Science (100.0%), Architecture & Engineering (100.0%), and Education, Arts & Media (100.0%), while the most female-oriented occupations are Business & Financial (100.0%), Education Instruction & Library (100.0%), and Health Diagnosing & Treating (100.0%).
| Occupation | Male | Female |
| Management | 0 (0.0%) | 0 (0.0%) |
| Business & Financial | 0 (0.0%) | 10 (100.0%) |
| Computers, Engineering & Science | 6 (100.0%) | 0 (0.0%) |
| Computers & Mathematics | 0 (0.0%) | 0 (0.0%) |
| Architecture & Engineering | 6 (100.0%) | 0 (0.0%) |
| Life, Physical & Social Science | 0 (0.0%) | 0 (0.0%) |
| Community & Social Service | 6 (42.9%) | 8 (57.1%) |
| Education, Arts & Media | 3 (100.0%) | 0 (0.0%) |
| Legal Services & Support | 3 (100.0%) | 0 (0.0%) |
| Education Instruction & Library | 0 (0.0%) | 8 (100.0%) |
| Arts, Media & Entertainment | 0 (0.0%) | 0 (0.0%) |
| Health Diagnosing & Treating | 0 (0.0%) | 3 (100.0%) |
| Health Technologists | 0 (0.0%) | 3 (100.0%) |
| Total (Category) | 12 (36.4%) | 21 (63.6%) |
| Total (Overall) | 53 (54.6%) | 44 (45.4%) |
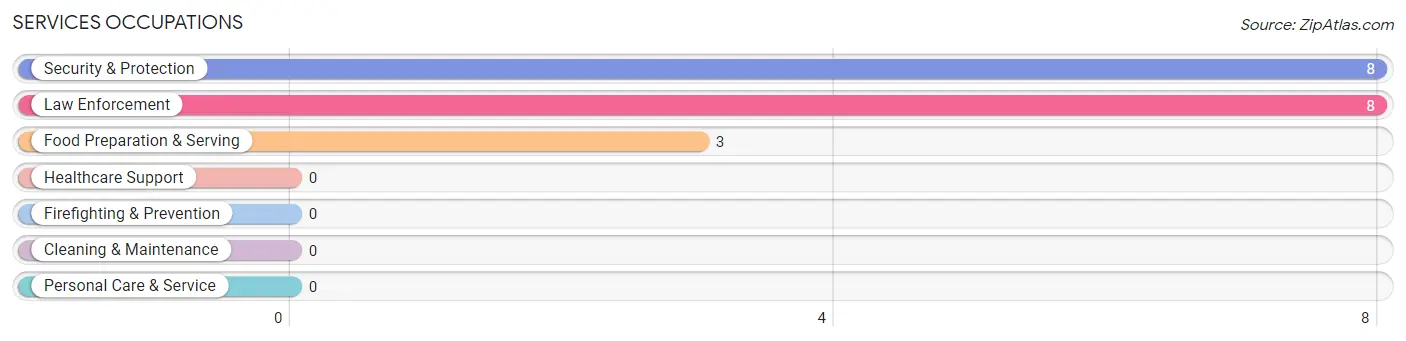
Services Occupations
The most common Services occupations in Slabtown are Security & Protection (8 | 8.3%), Law Enforcement (8 | 8.3%), and Food Preparation & Serving (3 | 3.1%).
Services Occupations by Sex
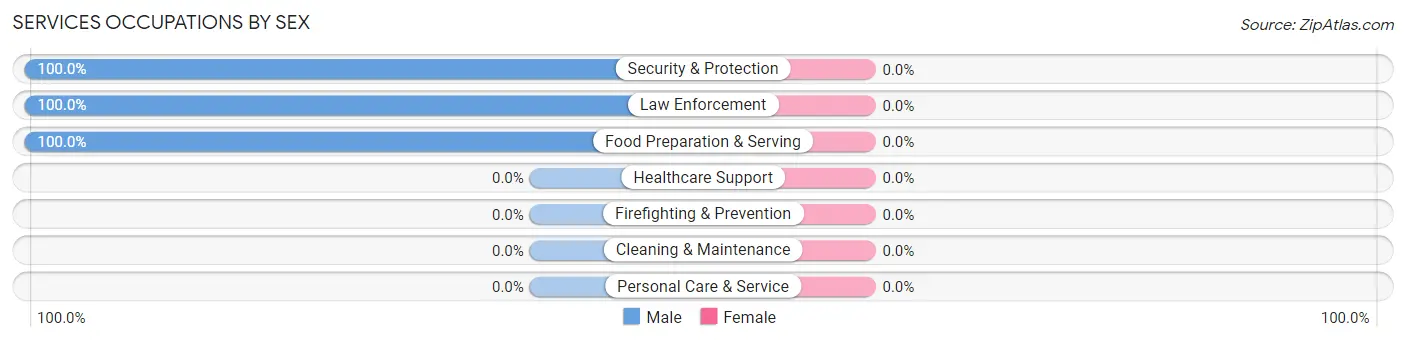
| Occupation | Male | Female |
| Healthcare Support | 0 (0.0%) | 0 (0.0%) |
| Security & Protection | 8 (100.0%) | 0 (0.0%) |
| Firefighting & Prevention | 0 (0.0%) | 0 (0.0%) |
| Law Enforcement | 8 (100.0%) | 0 (0.0%) |
| Food Preparation & Serving | 3 (100.0%) | 0 (0.0%) |
| Cleaning & Maintenance | 0 (0.0%) | 0 (0.0%) |
| Personal Care & Service | 0 (0.0%) | 0 (0.0%) |
| Total (Category) | 11 (100.0%) | 0 (0.0%) |
| Total (Overall) | 53 (54.6%) | 44 (45.4%) |
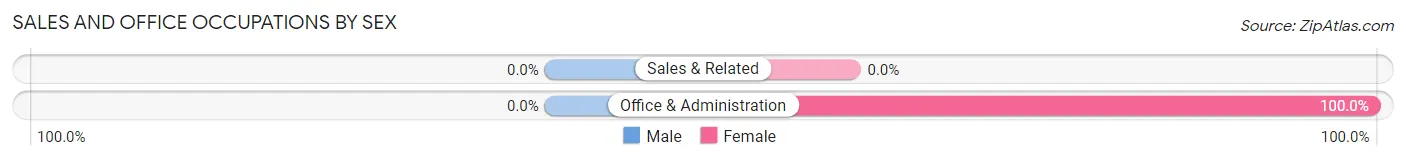
Sales and Office Occupations
The most common Sales and Office occupations in Slabtown are , and Office & Administration (14 | 14.4%).
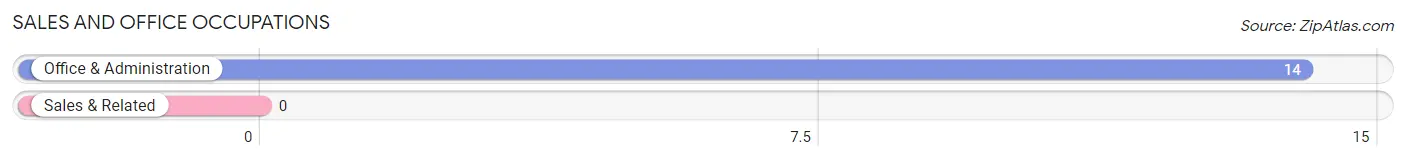
Sales and Office Occupations by Sex
| Occupation | Male | Female |
| Sales & Related | 0 (0.0%) | 0 (0.0%) |
| Office & Administration | 0 (0.0%) | 14 (100.0%) |
| Total (Category) | 0 (0.0%) | 14 (100.0%) |
| Total (Overall) | 53 (54.6%) | 44 (45.4%) |
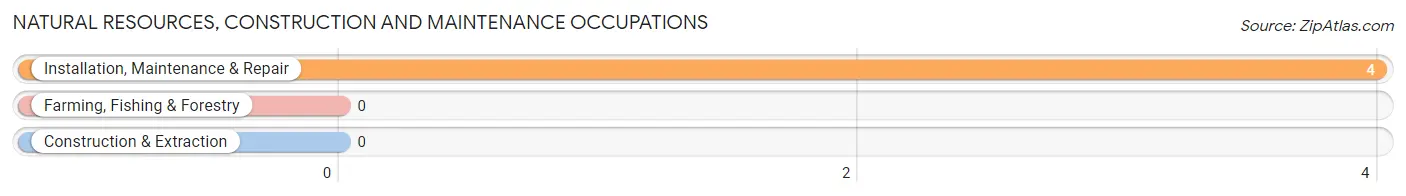
Natural Resources, Construction and Maintenance Occupations
The most common Natural Resources, Construction and Maintenance occupations in Slabtown are , and Installation, Maintenance & Repair (4 | 4.1%).
Natural Resources, Construction and Maintenance Occupations by Sex
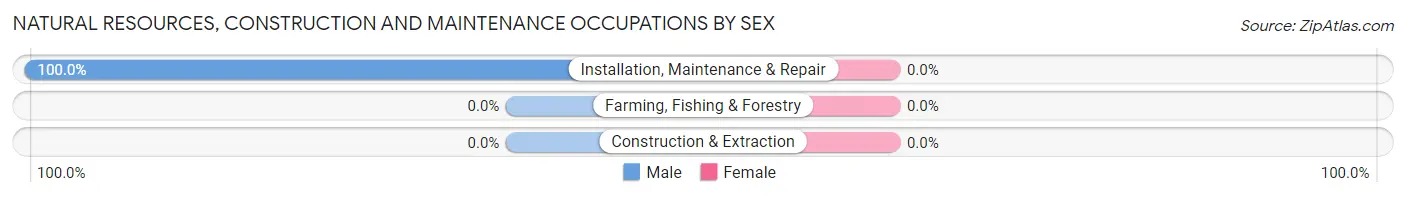
| Occupation | Male | Female |
| Farming, Fishing & Forestry | 0 (0.0%) | 0 (0.0%) |
| Construction & Extraction | 0 (0.0%) | 0 (0.0%) |
| Installation, Maintenance & Repair | 4 (100.0%) | 0 (0.0%) |
| Total (Category) | 4 (100.0%) | 0 (0.0%) |
| Total (Overall) | 53 (54.6%) | 44 (45.4%) |
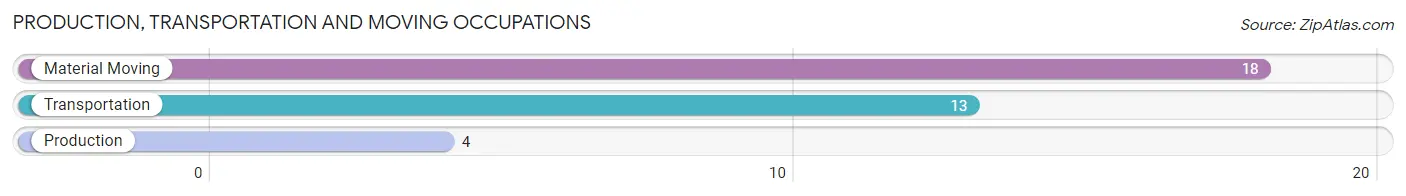
Production, Transportation and Moving Occupations
The most common Production, Transportation and Moving occupations in Slabtown are Material Moving (18 | 18.6%), Transportation (13 | 13.4%), and Production (4 | 4.1%).
Production, Transportation and Moving Occupations by Sex

| Occupation | Male | Female |
| Production | 0 (0.0%) | 4 (100.0%) |
| Transportation | 13 (100.0%) | 0 (0.0%) |
| Material Moving | 13 (72.2%) | 5 (27.8%) |
| Total (Category) | 26 (74.3%) | 9 (25.7%) |
| Total (Overall) | 53 (54.6%) | 44 (45.4%) |
Employment Industries by Sex in Slabtown
Employment Industries in Slabtown
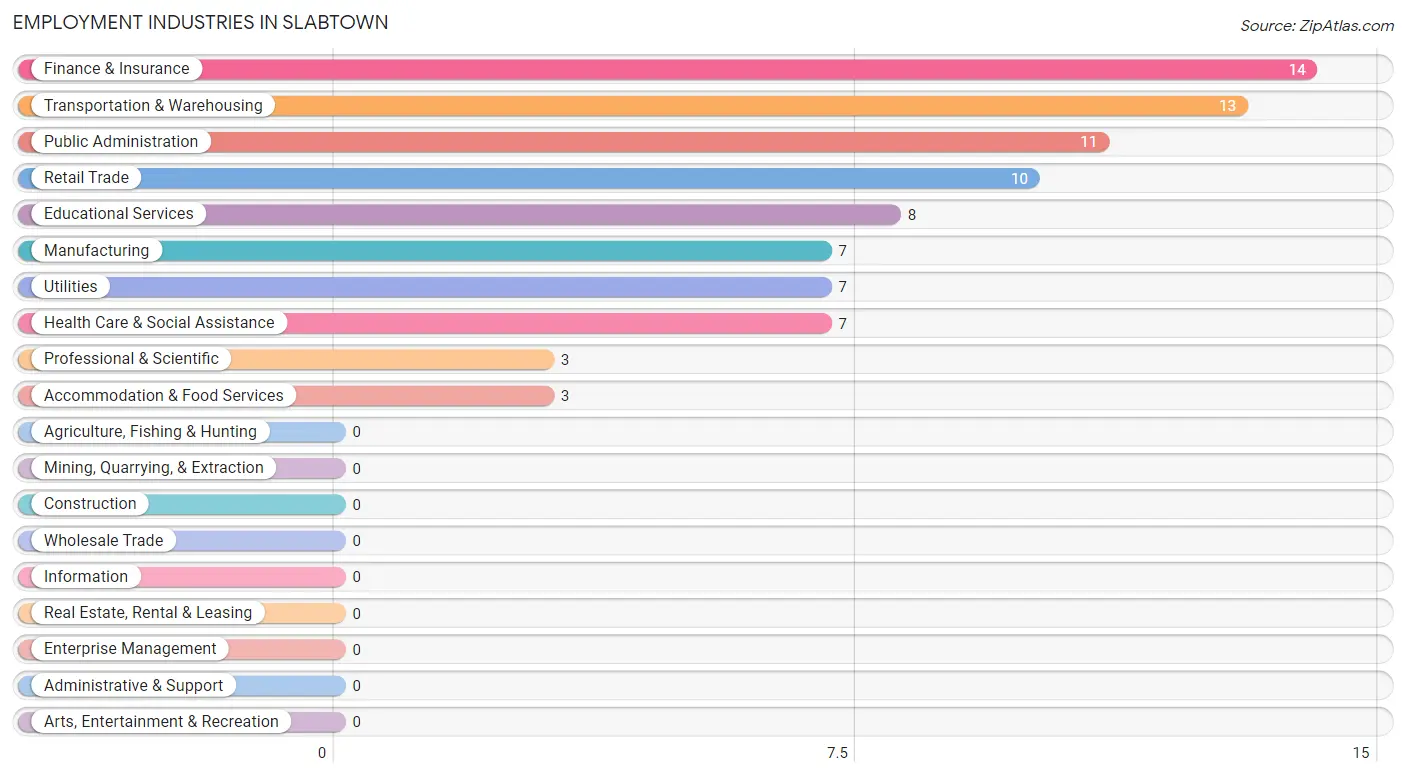
The major employment industries in Slabtown include Finance & Insurance (14 | 14.4%), Transportation & Warehousing (13 | 13.4%), Public Administration (11 | 11.3%), Retail Trade (10 | 10.3%), and Educational Services (8 | 8.3%).
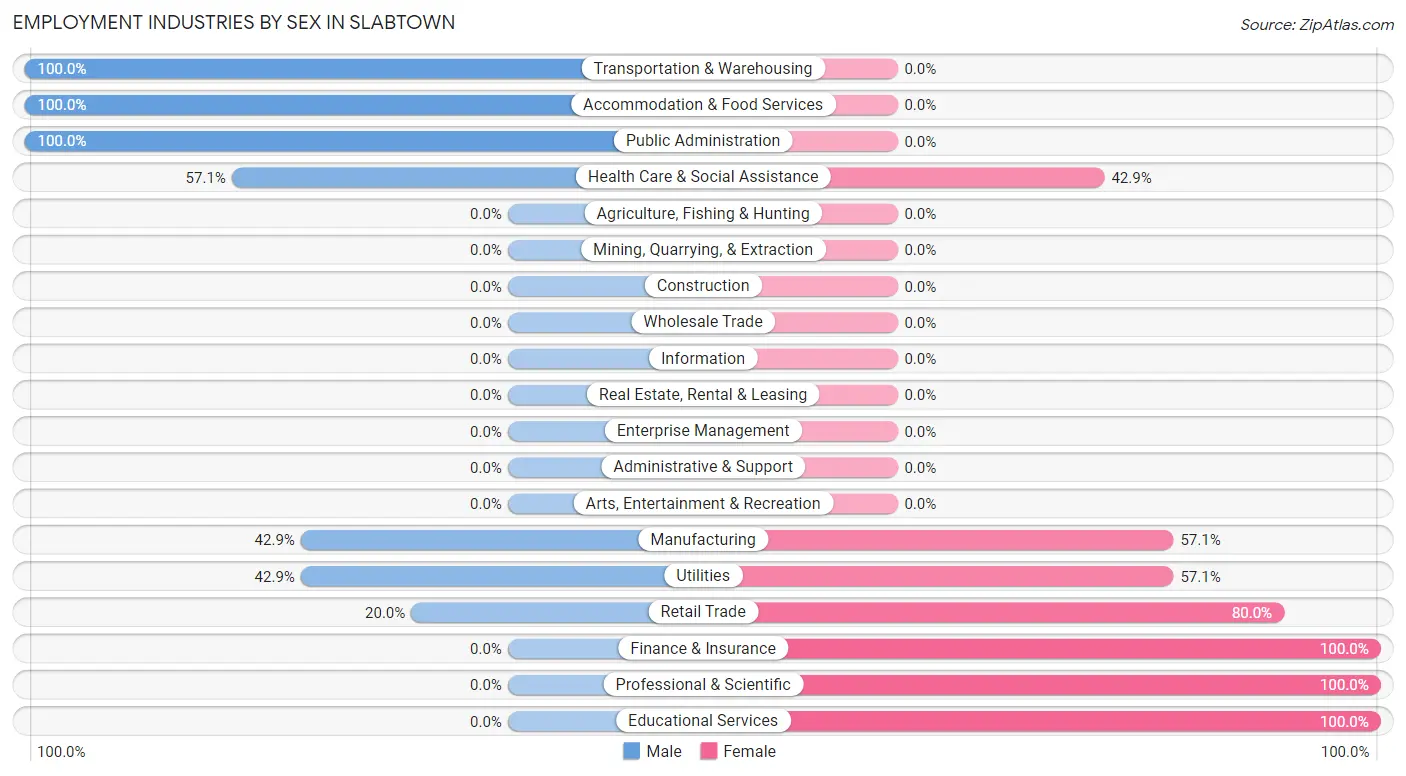
Employment Industries by Sex in Slabtown
The Slabtown industries that see more men than women are Transportation & Warehousing (100.0%), Accommodation & Food Services (100.0%), and Public Administration (100.0%), whereas the industries that tend to have a higher number of women are Finance & Insurance (100.0%), Professional & Scientific (100.0%), and Educational Services (100.0%).
| Industry | Male | Female |
| Agriculture, Fishing & Hunting | 0 (0.0%) | 0 (0.0%) |
| Mining, Quarrying, & Extraction | 0 (0.0%) | 0 (0.0%) |
| Construction | 0 (0.0%) | 0 (0.0%) |
| Manufacturing | 3 (42.9%) | 4 (57.1%) |
| Wholesale Trade | 0 (0.0%) | 0 (0.0%) |
| Retail Trade | 2 (20.0%) | 8 (80.0%) |
| Transportation & Warehousing | 13 (100.0%) | 0 (0.0%) |
| Utilities | 3 (42.9%) | 4 (57.1%) |
| Information | 0 (0.0%) | 0 (0.0%) |
| Finance & Insurance | 0 (0.0%) | 14 (100.0%) |
| Real Estate, Rental & Leasing | 0 (0.0%) | 0 (0.0%) |
| Professional & Scientific | 0 (0.0%) | 3 (100.0%) |
| Enterprise Management | 0 (0.0%) | 0 (0.0%) |
| Administrative & Support | 0 (0.0%) | 0 (0.0%) |
| Educational Services | 0 (0.0%) | 8 (100.0%) |
| Health Care & Social Assistance | 4 (57.1%) | 3 (42.9%) |
| Arts, Entertainment & Recreation | 0 (0.0%) | 0 (0.0%) |
| Accommodation & Food Services | 3 (100.0%) | 0 (0.0%) |
| Public Administration | 11 (100.0%) | 0 (0.0%) |
| Total | 53 (54.6%) | 44 (45.4%) |
Education in Slabtown
School Enrollment in Slabtown
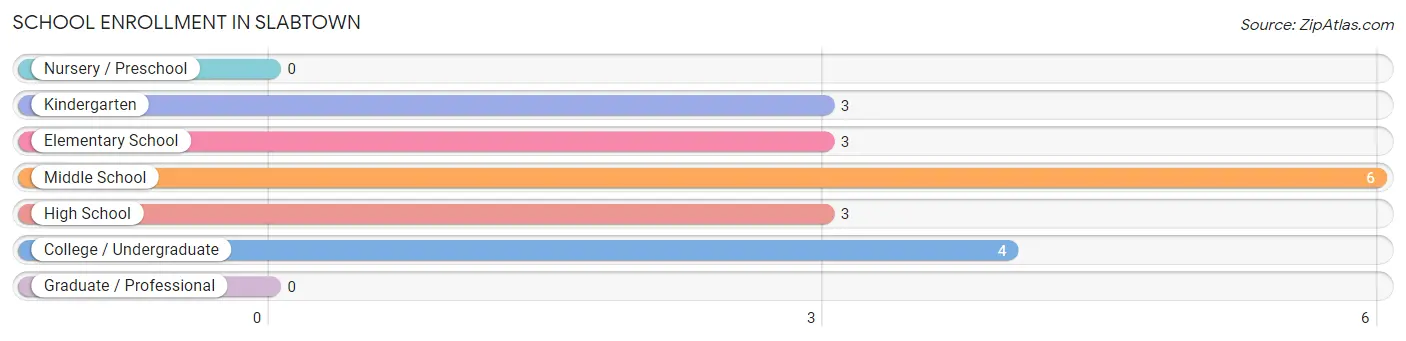
The most common levels of schooling among the 19 students in Slabtown are middle school (6 | 31.6%), college / undergraduate (4 | 21.0%), and kindergarten (3 | 15.8%).
| School Level | # Students | % Students |
| Nursery / Preschool | 0 | 0.0% |
| Kindergarten | 3 | 15.8% |
| Elementary School | 3 | 15.8% |
| Middle School | 6 | 31.6% |
| High School | 3 | 15.8% |
| College / Undergraduate | 4 | 21.0% |
| Graduate / Professional | 0 | 0.0% |
| Total | 19 | 100.0% |
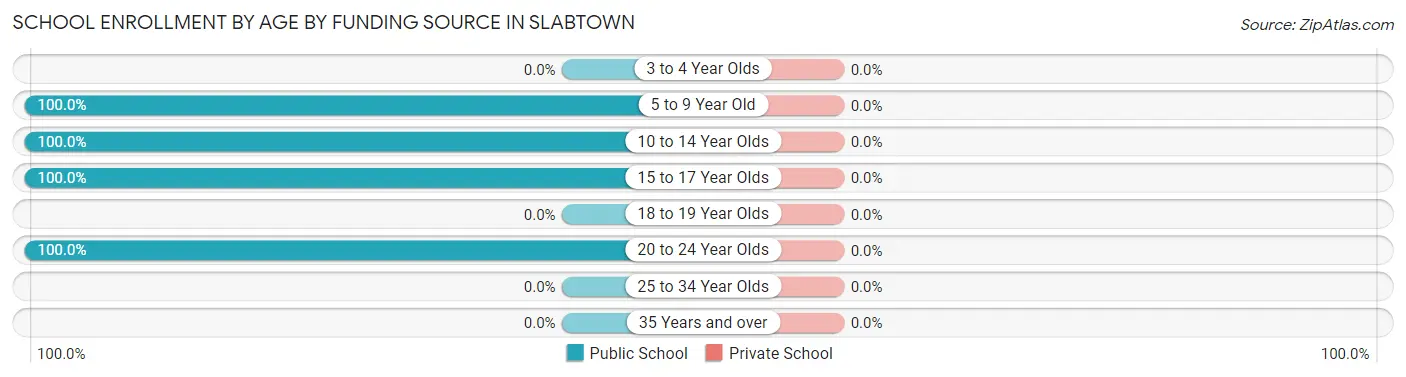
School Enrollment by Age by Funding Source in Slabtown
| Age Bracket | Public School | Private School |
| 3 to 4 Year Olds | 0 (0.0%) | 0 (0.0%) |
| 5 to 9 Year Old | 6 (100.0%) | 0 (0.0%) |
| 10 to 14 Year Olds | 6 (100.0%) | 0 (0.0%) |
| 15 to 17 Year Olds | 3 (100.0%) | 0 (0.0%) |
| 18 to 19 Year Olds | 0 (0.0%) | 0 (0.0%) |
| 20 to 24 Year Olds | 4 (100.0%) | 0 (0.0%) |
| 25 to 34 Year Olds | 0 (0.0%) | 0 (0.0%) |
| 35 Years and over | 0 (0.0%) | 0 (0.0%) |
| Total | 19 (100.0%) | 0 (0.0%) |
Educational Attainment by Field of Study in Slabtown
Education (11 | 45.8%), science & technology (4 | 16.7%), engineering (3 | 12.5%), liberal arts & history (3 | 12.5%), and visual & performing arts (3 | 12.5%) are the most common fields of study among 24 individuals in Slabtown who have obtained a bachelor's degree or higher.
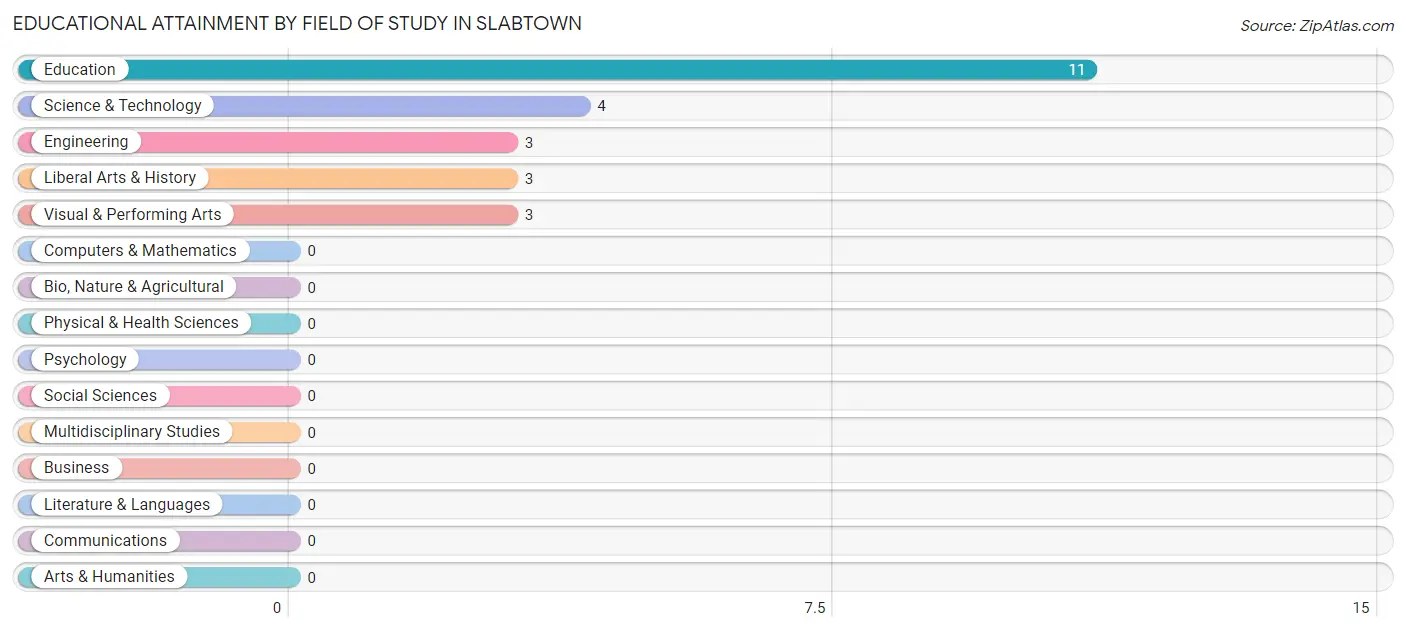
| Field of Study | # Graduates | % Graduates |
| Computers & Mathematics | 0 | 0.0% |
| Bio, Nature & Agricultural | 0 | 0.0% |
| Physical & Health Sciences | 0 | 0.0% |
| Psychology | 0 | 0.0% |
| Social Sciences | 0 | 0.0% |
| Engineering | 3 | 12.5% |
| Multidisciplinary Studies | 0 | 0.0% |
| Science & Technology | 4 | 16.7% |
| Business | 0 | 0.0% |
| Education | 11 | 45.8% |
| Literature & Languages | 0 | 0.0% |
| Liberal Arts & History | 3 | 12.5% |
| Visual & Performing Arts | 3 | 12.5% |
| Communications | 0 | 0.0% |
| Arts & Humanities | 0 | 0.0% |
| Total | 24 | 100.0% |
Transportation & Commute in Slabtown
Vehicle Availability by Sex in Slabtown
The most prevalent vehicle ownership categories in Slabtown are males with 3 vehicles (30, accounting for 56.6%) and females with 3 vehicles (17, making up 68.2%).
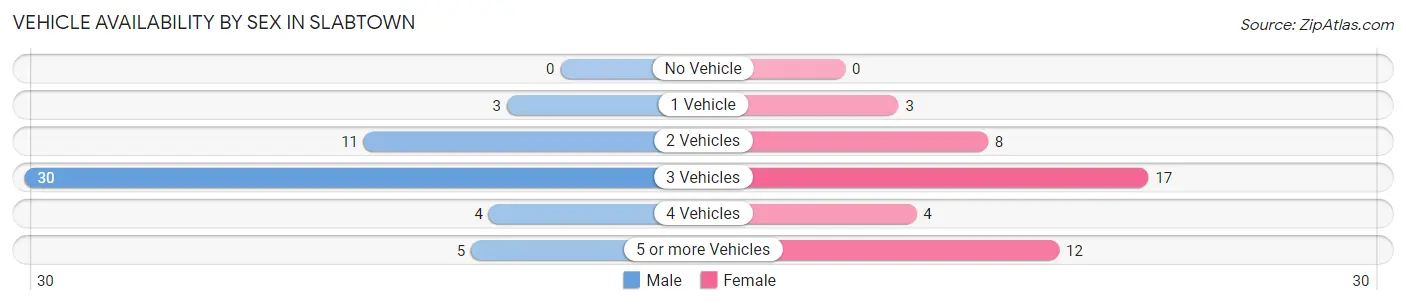
| Vehicles Available | Male | Female |
| No Vehicle | 0 (0.0%) | 0 (0.0%) |
| 1 Vehicle | 3 (5.7%) | 3 (6.8%) |
| 2 Vehicles | 11 (20.7%) | 8 (18.2%) |
| 3 Vehicles | 30 (56.6%) | 17 (38.6%) |
| 4 Vehicles | 4 (7.5%) | 4 (9.1%) |
| 5 or more Vehicles | 5 (9.4%) | 12 (27.3%) |
| Total | 53 (100.0%) | 44 (100.0%) |
Commute Time in Slabtown
The most frequently occuring commute durations in Slabtown are 20 to 24 minutes (53 commuters, 56.4%), 30 to 34 minutes (15 commuters, 16.0%), and 25 to 29 minutes (10 commuters, 10.6%).
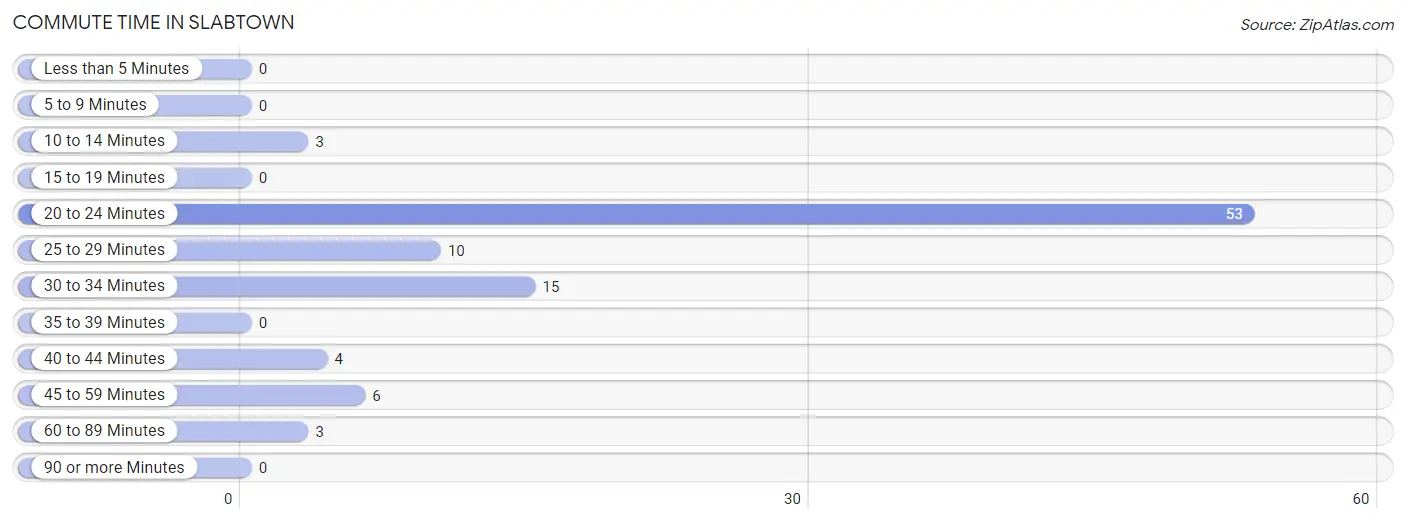
| Commute Time | # Commuters | % Commuters |
| Less than 5 Minutes | 0 | 0.0% |
| 5 to 9 Minutes | 0 | 0.0% |
| 10 to 14 Minutes | 3 | 3.2% |
| 15 to 19 Minutes | 0 | 0.0% |
| 20 to 24 Minutes | 53 | 56.4% |
| 25 to 29 Minutes | 10 | 10.6% |
| 30 to 34 Minutes | 15 | 16.0% |
| 35 to 39 Minutes | 0 | 0.0% |
| 40 to 44 Minutes | 4 | 4.3% |
| 45 to 59 Minutes | 6 | 6.4% |
| 60 to 89 Minutes | 3 | 3.2% |
| 90 or more Minutes | 0 | 0.0% |
Commute Time by Sex in Slabtown
The most common commute times in Slabtown are 20 to 24 minutes (31 commuters, 62.0%) for males and 20 to 24 minutes (22 commuters, 50.0%) for females.
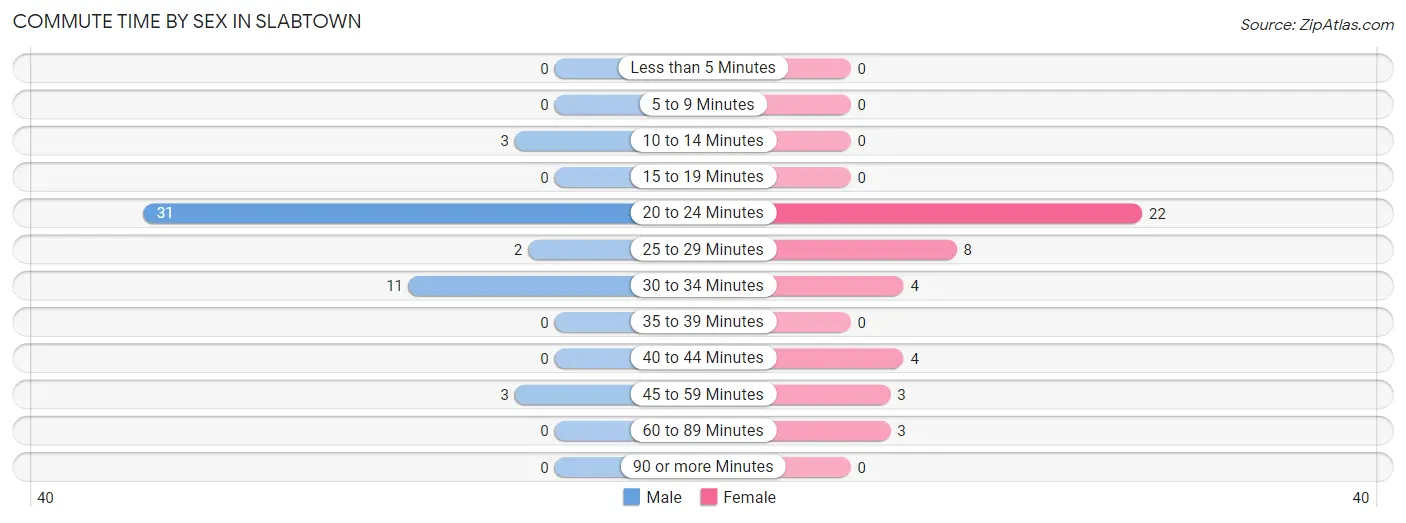
| Commute Time | Male | Female |
| Less than 5 Minutes | 0 (0.0%) | 0 (0.0%) |
| 5 to 9 Minutes | 0 (0.0%) | 0 (0.0%) |
| 10 to 14 Minutes | 3 (6.0%) | 0 (0.0%) |
| 15 to 19 Minutes | 0 (0.0%) | 0 (0.0%) |
| 20 to 24 Minutes | 31 (62.0%) | 22 (50.0%) |
| 25 to 29 Minutes | 2 (4.0%) | 8 (18.2%) |
| 30 to 34 Minutes | 11 (22.0%) | 4 (9.1%) |
| 35 to 39 Minutes | 0 (0.0%) | 0 (0.0%) |
| 40 to 44 Minutes | 0 (0.0%) | 4 (9.1%) |
| 45 to 59 Minutes | 3 (6.0%) | 3 (6.8%) |
| 60 to 89 Minutes | 0 (0.0%) | 3 (6.8%) |
| 90 or more Minutes | 0 (0.0%) | 0 (0.0%) |
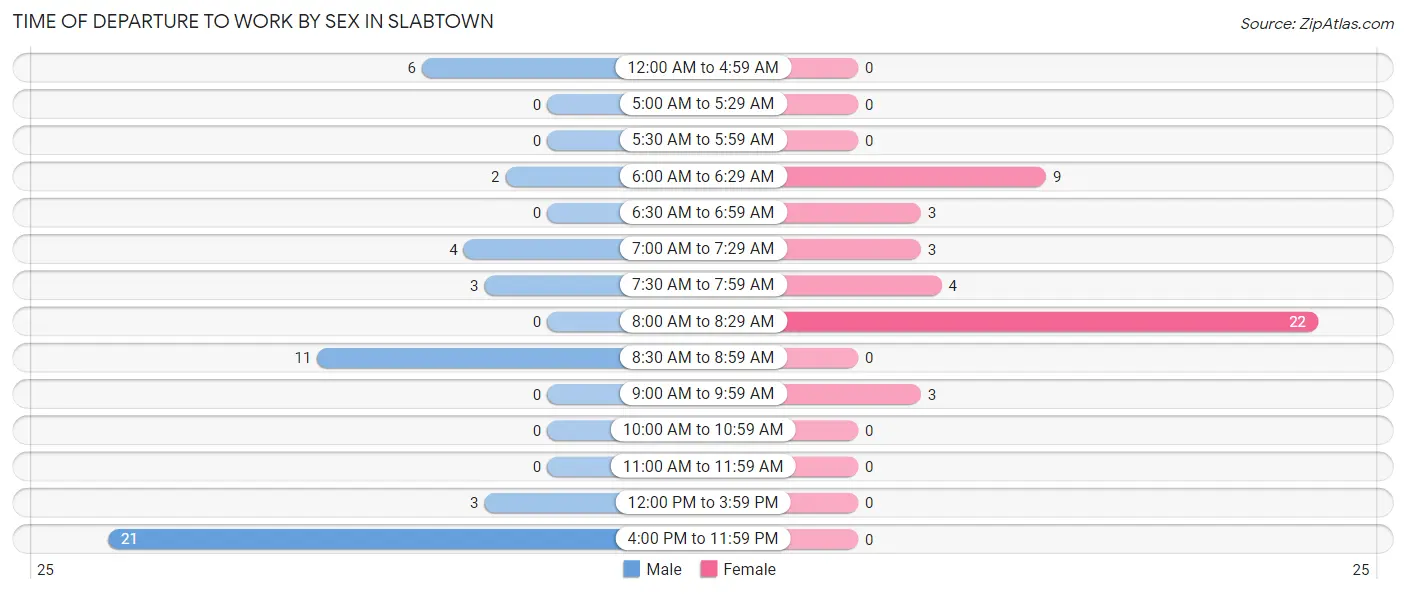
Time of Departure to Work by Sex in Slabtown
The most frequent times of departure to work in Slabtown are 4:00 PM to 11:59 PM (21, 42.0%) for males and 8:00 AM to 8:29 AM (22, 50.0%) for females.
| Time of Departure | Male | Female |
| 12:00 AM to 4:59 AM | 6 (12.0%) | 0 (0.0%) |
| 5:00 AM to 5:29 AM | 0 (0.0%) | 0 (0.0%) |
| 5:30 AM to 5:59 AM | 0 (0.0%) | 0 (0.0%) |
| 6:00 AM to 6:29 AM | 2 (4.0%) | 9 (20.4%) |
| 6:30 AM to 6:59 AM | 0 (0.0%) | 3 (6.8%) |
| 7:00 AM to 7:29 AM | 4 (8.0%) | 3 (6.8%) |
| 7:30 AM to 7:59 AM | 3 (6.0%) | 4 (9.1%) |
| 8:00 AM to 8:29 AM | 0 (0.0%) | 22 (50.0%) |
| 8:30 AM to 8:59 AM | 11 (22.0%) | 0 (0.0%) |
| 9:00 AM to 9:59 AM | 0 (0.0%) | 3 (6.8%) |
| 10:00 AM to 10:59 AM | 0 (0.0%) | 0 (0.0%) |
| 11:00 AM to 11:59 AM | 0 (0.0%) | 0 (0.0%) |
| 12:00 PM to 3:59 PM | 3 (6.0%) | 0 (0.0%) |
| 4:00 PM to 11:59 PM | 21 (42.0%) | 0 (0.0%) |
| Total | 50 (100.0%) | 44 (100.0%) |
Housing Occupancy in Slabtown
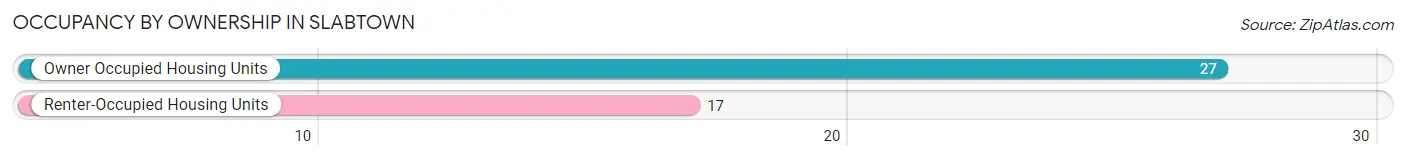
Occupancy by Ownership in Slabtown
Of the total 44 dwellings in Slabtown, owner-occupied units account for 27 (61.4%), while renter-occupied units make up 17 (38.6%).
| Occupancy | # Housing Units | % Housing Units |
| Owner Occupied Housing Units | 27 | 61.4% |
| Renter-Occupied Housing Units | 17 | 38.6% |
| Total Occupied Housing Units | 44 | 100.0% |
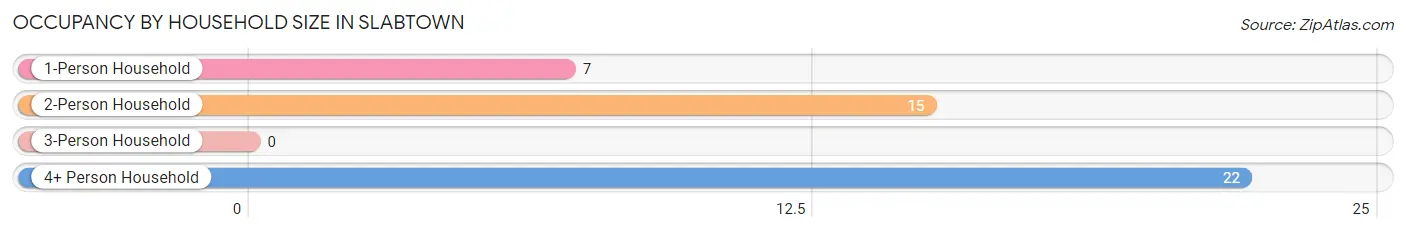
Occupancy by Household Size in Slabtown
| Household Size | # Housing Units | % Housing Units |
| 1-Person Household | 7 | 15.9% |
| 2-Person Household | 15 | 34.1% |
| 3-Person Household | 0 | 0.0% |
| 4+ Person Household | 22 | 50.0% |
| Total Housing Units | 44 | 100.0% |
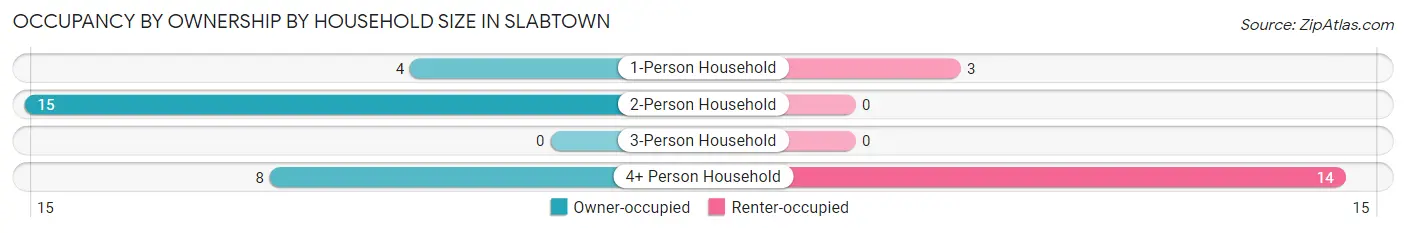
Occupancy by Ownership by Household Size in Slabtown
| Household Size | Owner-occupied | Renter-occupied |
| 1-Person Household | 4 (57.1%) | 3 (42.9%) |
| 2-Person Household | 15 (100.0%) | 0 (0.0%) |
| 3-Person Household | 0 (0.0%) | 0 (0.0%) |
| 4+ Person Household | 8 (36.4%) | 14 (63.6%) |
| Total Housing Units | 27 (61.4%) | 17 (38.6%) |
Occupancy by Educational Attainment in Slabtown
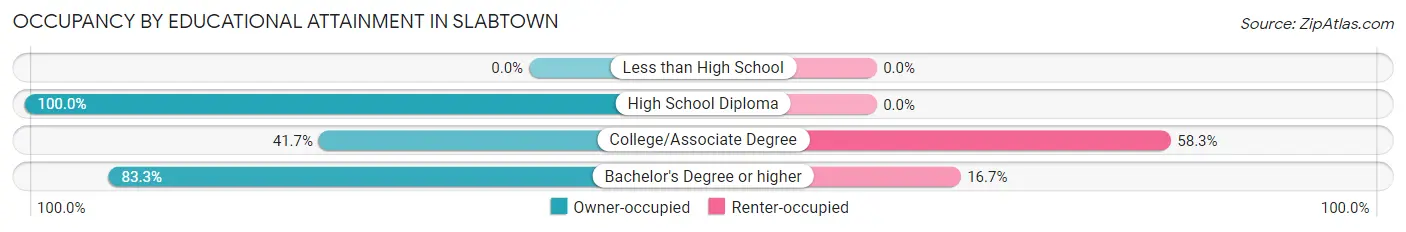
| Household Size | Owner-occupied | Renter-occupied |
| Less than High School | 0 (0.0%) | 0 (0.0%) |
| High School Diploma | 2 (100.0%) | 0 (0.0%) |
| College/Associate Degree | 10 (41.7%) | 14 (58.3%) |
| Bachelor's Degree or higher | 15 (83.3%) | 3 (16.7%) |
Occupancy by Age of Householder in Slabtown
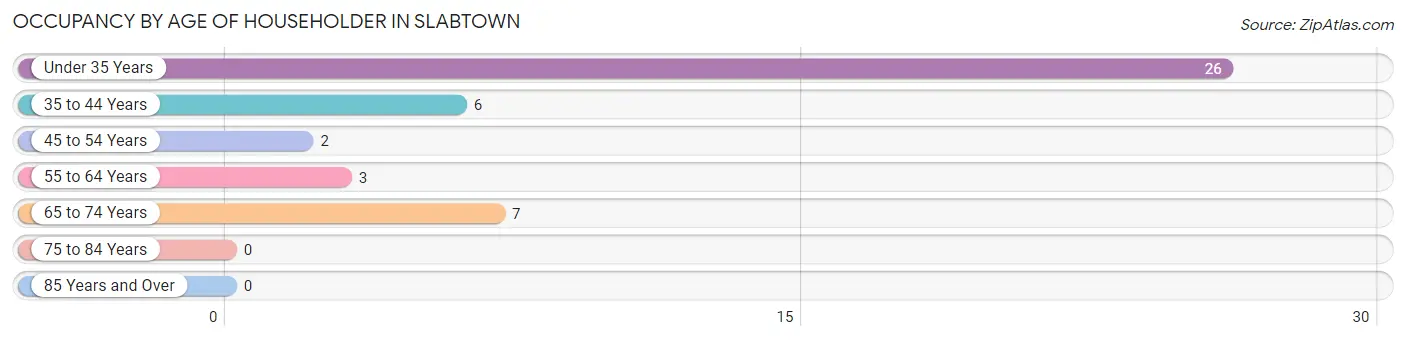
| Age Bracket | # Households | % Households |
| Under 35 Years | 26 | 59.1% |
| 35 to 44 Years | 6 | 13.6% |
| 45 to 54 Years | 2 | 4.5% |
| 55 to 64 Years | 3 | 6.8% |
| 65 to 74 Years | 7 | 15.9% |
| 75 to 84 Years | 0 | 0.0% |
| 85 Years and Over | 0 | 0.0% |
| Total | 44 | 100.0% |
Housing Finances in Slabtown
Median Income by Occupancy in Slabtown
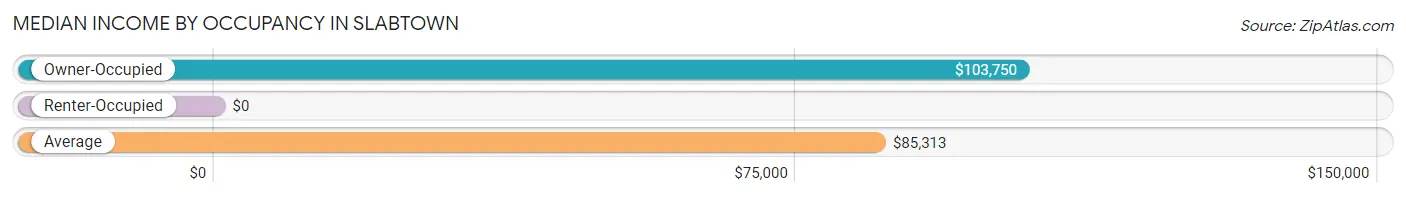
| Occupancy Type | # Households | Median Income |
| Owner-Occupied | 27 (61.4%) | $103,750 |
| Renter-Occupied | 17 (38.6%) | $0 |
| Average | 44 (100.0%) | $85,313 |
Occupancy by Householder Income Bracket in Slabtown
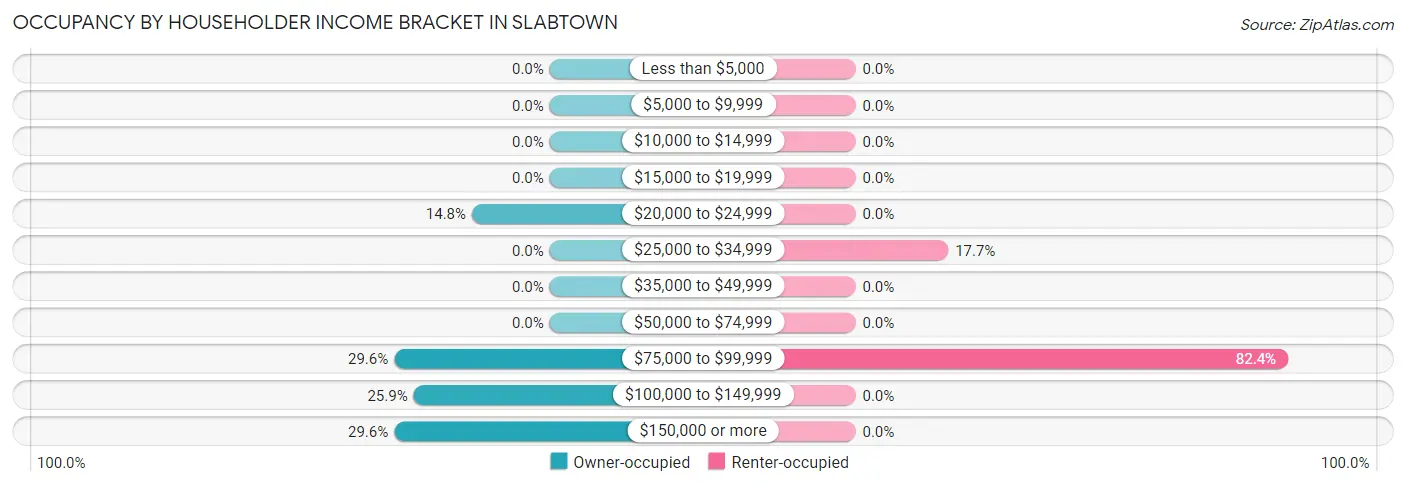
| Income Bracket | Owner-occupied | Renter-occupied |
| Less than $5,000 | 0 (0.0%) | 0 (0.0%) |
| $5,000 to $9,999 | 0 (0.0%) | 0 (0.0%) |
| $10,000 to $14,999 | 0 (0.0%) | 0 (0.0%) |
| $15,000 to $19,999 | 0 (0.0%) | 0 (0.0%) |
| $20,000 to $24,999 | 4 (14.8%) | 0 (0.0%) |
| $25,000 to $34,999 | 0 (0.0%) | 3 (17.6%) |
| $35,000 to $49,999 | 0 (0.0%) | 0 (0.0%) |
| $50,000 to $74,999 | 0 (0.0%) | 0 (0.0%) |
| $75,000 to $99,999 | 8 (29.6%) | 14 (82.4%) |
| $100,000 to $149,999 | 7 (25.9%) | 0 (0.0%) |
| $150,000 or more | 8 (29.6%) | 0 (0.0%) |
| Total | 27 (100.0%) | 17 (100.0%) |
Monthly Housing Cost Tiers in Slabtown
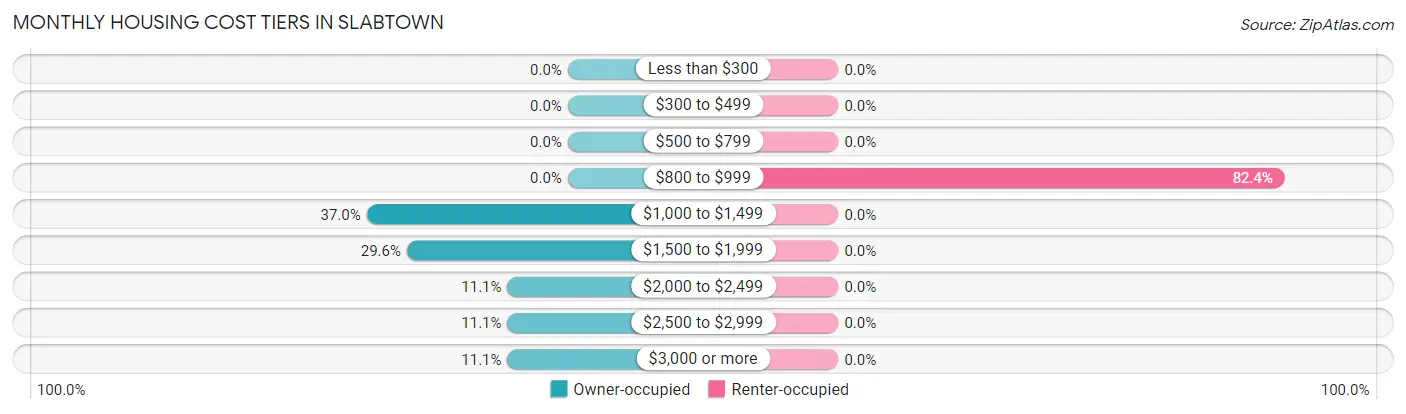
| Monthly Cost | Owner-occupied | Renter-occupied |
| Less than $300 | 0 (0.0%) | 0 (0.0%) |
| $300 to $499 | 0 (0.0%) | 0 (0.0%) |
| $500 to $799 | 0 (0.0%) | 0 (0.0%) |
| $800 to $999 | 0 (0.0%) | 14 (82.4%) |
| $1,000 to $1,499 | 10 (37.0%) | 0 (0.0%) |
| $1,500 to $1,999 | 8 (29.6%) | 0 (0.0%) |
| $2,000 to $2,499 | 3 (11.1%) | 0 (0.0%) |
| $2,500 to $2,999 | 3 (11.1%) | 0 (0.0%) |
| $3,000 or more | 3 (11.1%) | 0 (0.0%) |
| Total | 27 (100.0%) | 17 (100.0%) |
Physical Housing Characteristics in Slabtown
Housing Structures in Slabtown
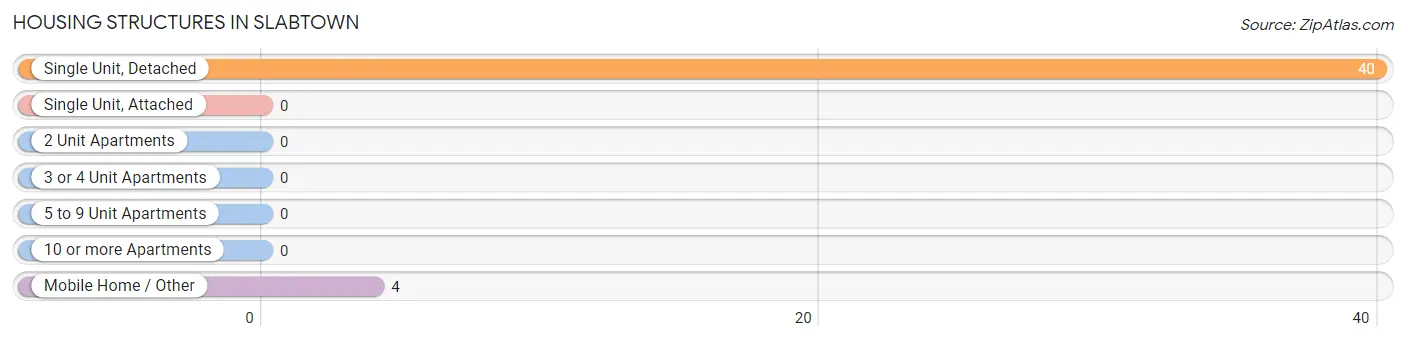
| Structure Type | # Housing Units | % Housing Units |
| Single Unit, Detached | 40 | 90.9% |
| Single Unit, Attached | 0 | 0.0% |
| 2 Unit Apartments | 0 | 0.0% |
| 3 or 4 Unit Apartments | 0 | 0.0% |
| 5 to 9 Unit Apartments | 0 | 0.0% |
| 10 or more Apartments | 0 | 0.0% |
| Mobile Home / Other | 4 | 9.1% |
| Total | 44 | 100.0% |
Housing Structures by Occupancy in Slabtown
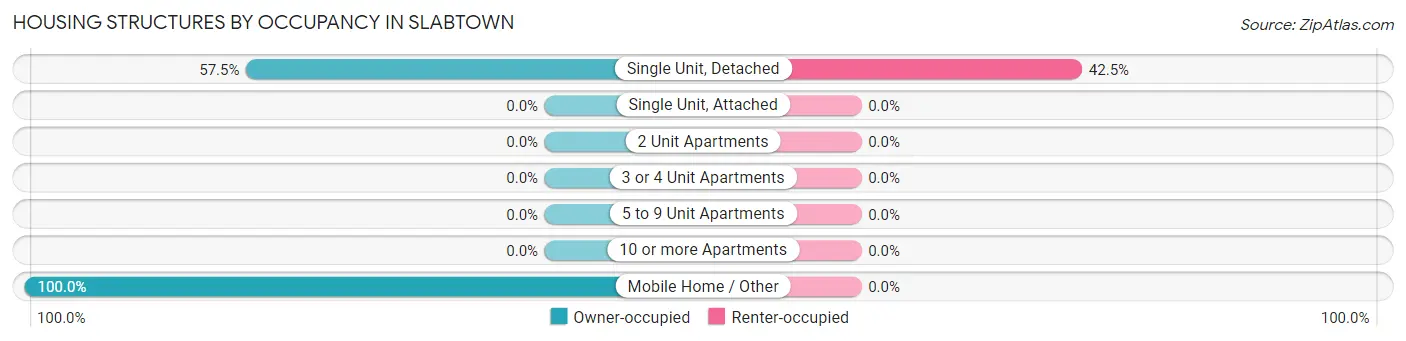
| Structure Type | Owner-occupied | Renter-occupied |
| Single Unit, Detached | 23 (57.5%) | 17 (42.5%) |
| Single Unit, Attached | 0 (0.0%) | 0 (0.0%) |
| 2 Unit Apartments | 0 (0.0%) | 0 (0.0%) |
| 3 or 4 Unit Apartments | 0 (0.0%) | 0 (0.0%) |
| 5 to 9 Unit Apartments | 0 (0.0%) | 0 (0.0%) |
| 10 or more Apartments | 0 (0.0%) | 0 (0.0%) |
| Mobile Home / Other | 4 (100.0%) | 0 (0.0%) |
| Total | 27 (61.4%) | 17 (38.6%) |
Housing Structures by Number of Rooms in Slabtown
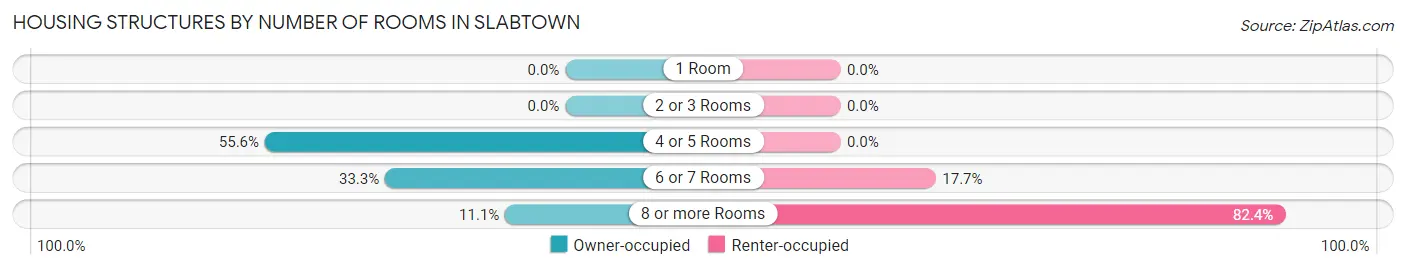
| Number of Rooms | Owner-occupied | Renter-occupied |
| 1 Room | 0 (0.0%) | 0 (0.0%) |
| 2 or 3 Rooms | 0 (0.0%) | 0 (0.0%) |
| 4 or 5 Rooms | 15 (55.6%) | 0 (0.0%) |
| 6 or 7 Rooms | 9 (33.3%) | 3 (17.6%) |
| 8 or more Rooms | 3 (11.1%) | 14 (82.4%) |
| Total | 27 (100.0%) | 17 (100.0%) |
Housing Structure by Heating Type in Slabtown
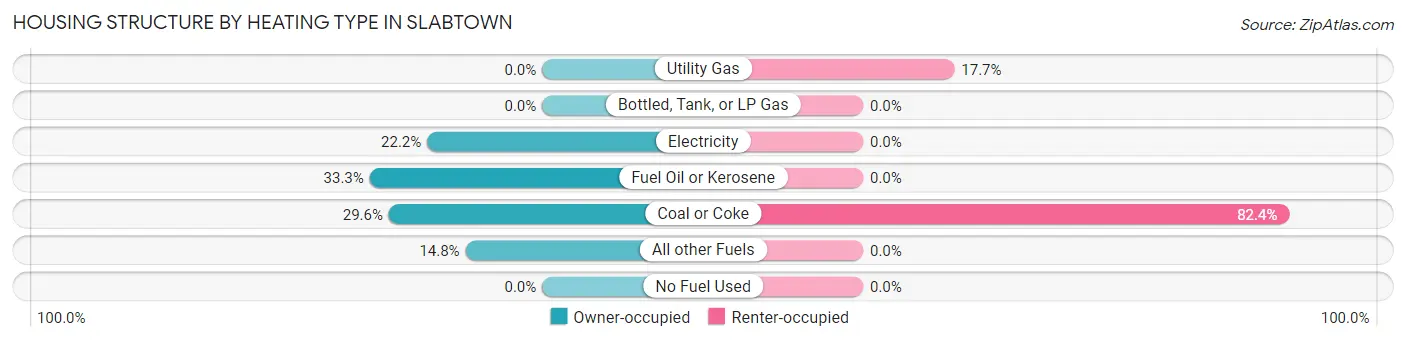
| Heating Type | Owner-occupied | Renter-occupied |
| Utility Gas | 0 (0.0%) | 3 (17.6%) |
| Bottled, Tank, or LP Gas | 0 (0.0%) | 0 (0.0%) |
| Electricity | 6 (22.2%) | 0 (0.0%) |
| Fuel Oil or Kerosene | 9 (33.3%) | 0 (0.0%) |
| Coal or Coke | 8 (29.6%) | 14 (82.4%) |
| All other Fuels | 4 (14.8%) | 0 (0.0%) |
| No Fuel Used | 0 (0.0%) | 0 (0.0%) |
| Total | 27 (100.0%) | 17 (100.0%) |
Household Vehicle Usage in Slabtown
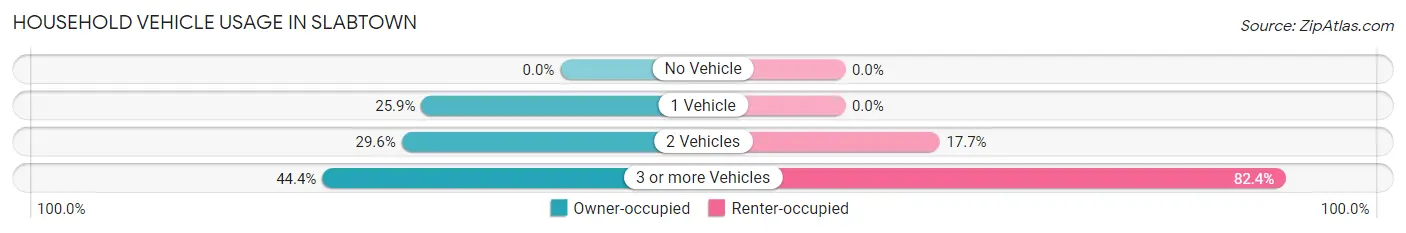
| Vehicles per Household | Owner-occupied | Renter-occupied |
| No Vehicle | 0 (0.0%) | 0 (0.0%) |
| 1 Vehicle | 7 (25.9%) | 0 (0.0%) |
| 2 Vehicles | 8 (29.6%) | 3 (17.6%) |
| 3 or more Vehicles | 12 (44.4%) | 14 (82.4%) |
| Total | 27 (100.0%) | 17 (100.0%) |
Real Estate & Mortgages in Slabtown
Real Estate and Mortgage Overview in Slabtown
| Characteristic | Without Mortgage | With Mortgage |
| Housing Units | 0 | 27 |
| Median Property Value | - | - |
| Median Household Income | - | - |
| Monthly Housing Costs | - | - |
| Real Estate Taxes | - | - |
Property Value by Mortgage Status in Slabtown
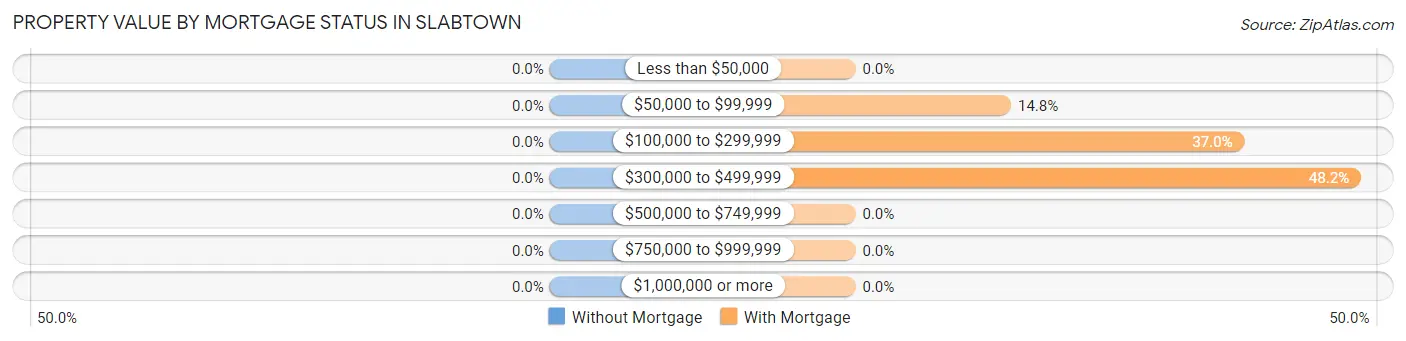
| Property Value | Without Mortgage | With Mortgage |
| Less than $50,000 | 0 (0.0%) | 0 (0.0%) |
| $50,000 to $99,999 | 0 (0.0%) | 4 (14.8%) |
| $100,000 to $299,999 | 0 (0.0%) | 10 (37.0%) |
| $300,000 to $499,999 | 0 (0.0%) | 13 (48.1%) |
| $500,000 to $749,999 | 0 (0.0%) | 0 (0.0%) |
| $750,000 to $999,999 | 0 (0.0%) | 0 (0.0%) |
| $1,000,000 or more | 0 (0.0%) | 0 (0.0%) |
| Total | 0 (0.0%) | 27 (100.0%) |
Household Income by Mortgage Status in Slabtown
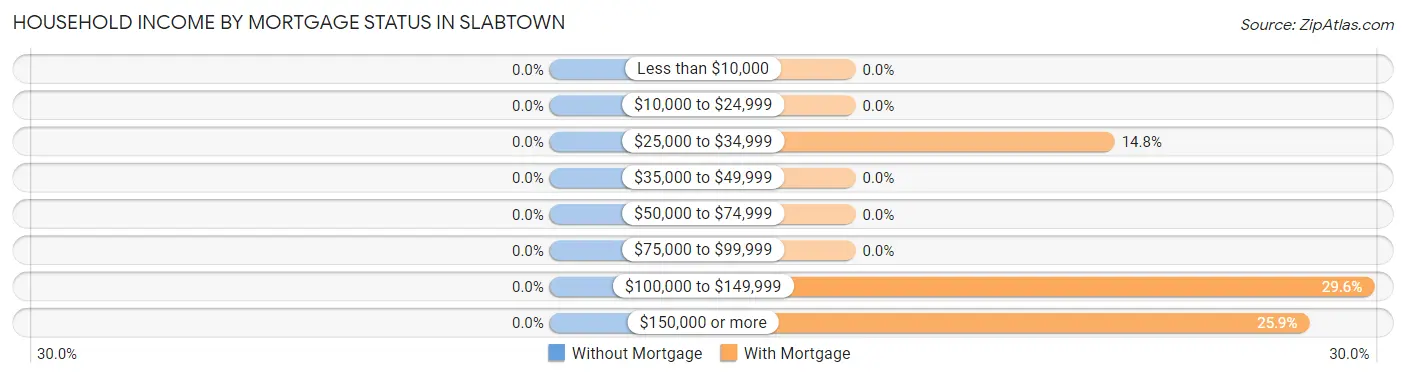
| Household Income | Without Mortgage | With Mortgage |
| Less than $10,000 | 0 (0.0%) | 0 (0.0%) |
| $10,000 to $24,999 | 0 (0.0%) | 0 (0.0%) |
| $25,000 to $34,999 | 0 (0.0%) | 4 (14.8%) |
| $35,000 to $49,999 | 0 (0.0%) | 0 (0.0%) |
| $50,000 to $74,999 | 0 (0.0%) | 0 (0.0%) |
| $75,000 to $99,999 | 0 (0.0%) | 0 (0.0%) |
| $100,000 to $149,999 | 0 (0.0%) | 8 (29.6%) |
| $150,000 or more | 0 (0.0%) | 7 (25.9%) |
| Total | 0 (0.0%) | 27 (100.0%) |
Property Value to Household Income Ratio in Slabtown
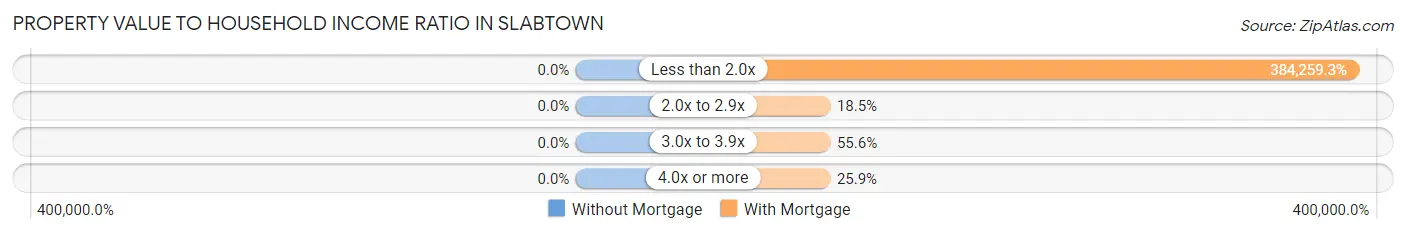
| Value-to-Income Ratio | Without Mortgage | With Mortgage |
| Less than 2.0x | 0 (0.0%) | 103,750 (384,259.3%) |
| 2.0x to 2.9x | 0 (0.0%) | 5 (18.5%) |
| 3.0x to 3.9x | 0 (0.0%) | 15 (55.6%) |
| 4.0x or more | 0 (0.0%) | 7 (25.9%) |
| Total | 0 (0.0%) | 27 (100.0%) |
Real Estate Taxes by Mortgage Status in Slabtown
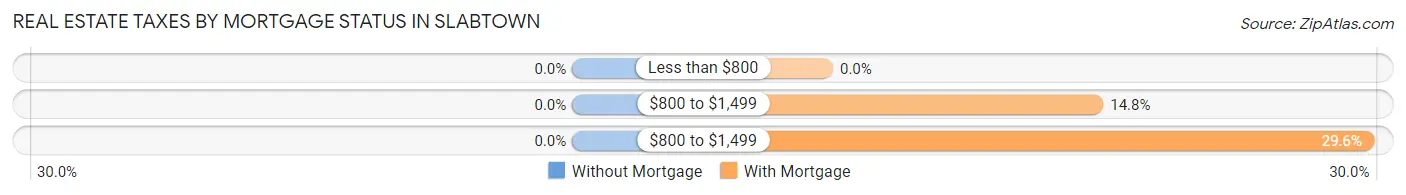
| Property Taxes | Without Mortgage | With Mortgage |
| Less than $800 | 0 (0.0%) | 0 (0.0%) |
| $800 to $1,499 | 0 (0.0%) | 4 (14.8%) |
| $800 to $1,499 | 0 (0.0%) | 8 (29.6%) |
| Total | 0 (0.0%) | 27 (100.0%) |
Health & Disability in Slabtown
Health Insurance Coverage by Age in Slabtown
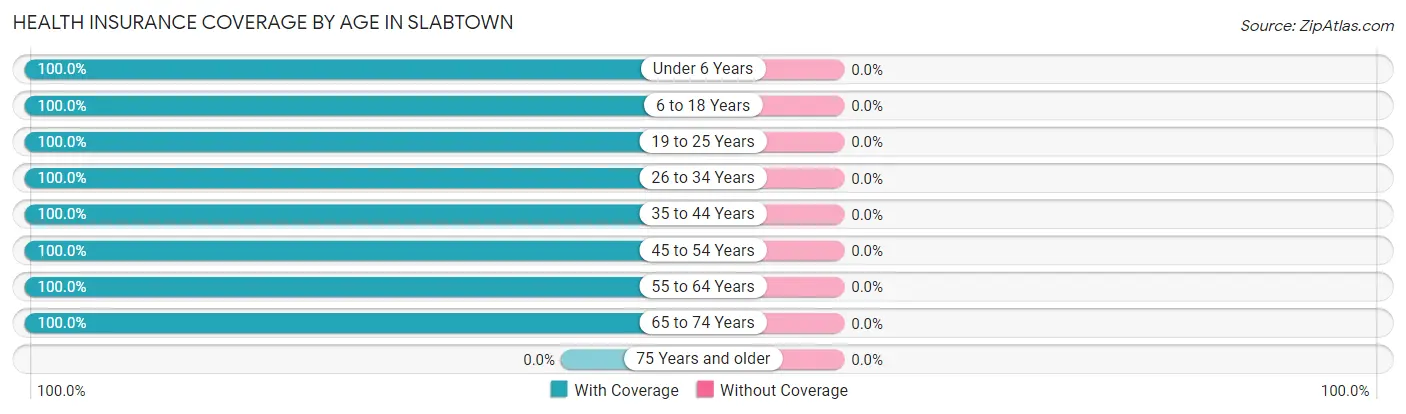
| Age Bracket | With Coverage | Without Coverage |
| Under 6 Years | 10 (100.0%) | 0 (0.0%) |
| 6 to 18 Years | 15 (100.0%) | 0 (0.0%) |
| 19 to 25 Years | 39 (100.0%) | 0 (0.0%) |
| 26 to 34 Years | 24 (100.0%) | 0 (0.0%) |
| 35 to 44 Years | 12 (100.0%) | 0 (0.0%) |
| 45 to 54 Years | 16 (100.0%) | 0 (0.0%) |
| 55 to 64 Years | 3 (100.0%) | 0 (0.0%) |
| 65 to 74 Years | 9 (100.0%) | 0 (0.0%) |
| 75 Years and older | 0 (0.0%) | 0 (0.0%) |
| Total | 128 (100.0%) | 0 (0.0%) |
Health Insurance Coverage by Citizenship Status in Slabtown
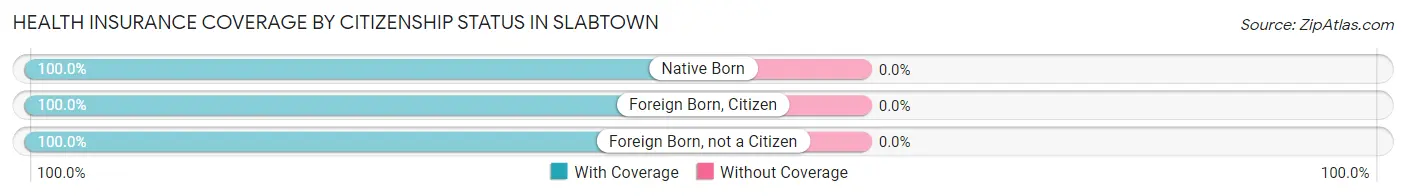
| Citizenship Status | With Coverage | Without Coverage |
| Native Born | 10 (100.0%) | 0 (0.0%) |
| Foreign Born, Citizen | 15 (100.0%) | 0 (0.0%) |
| Foreign Born, not a Citizen | 39 (100.0%) | 0 (0.0%) |
Health Insurance Coverage by Household Income in Slabtown
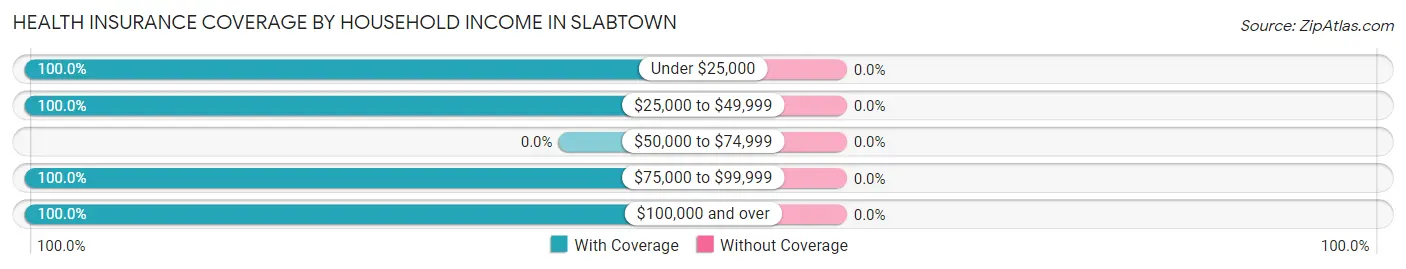
| Household Income | With Coverage | Without Coverage |
| Under $25,000 | 4 (100.0%) | 0 (0.0%) |
| $25,000 to $49,999 | 3 (100.0%) | 0 (0.0%) |
| $50,000 to $74,999 | 0 (0.0%) | 0 (0.0%) |
| $75,000 to $99,999 | 64 (100.0%) | 0 (0.0%) |
| $100,000 and over | 57 (100.0%) | 0 (0.0%) |
Public vs Private Health Insurance Coverage by Age in Slabtown
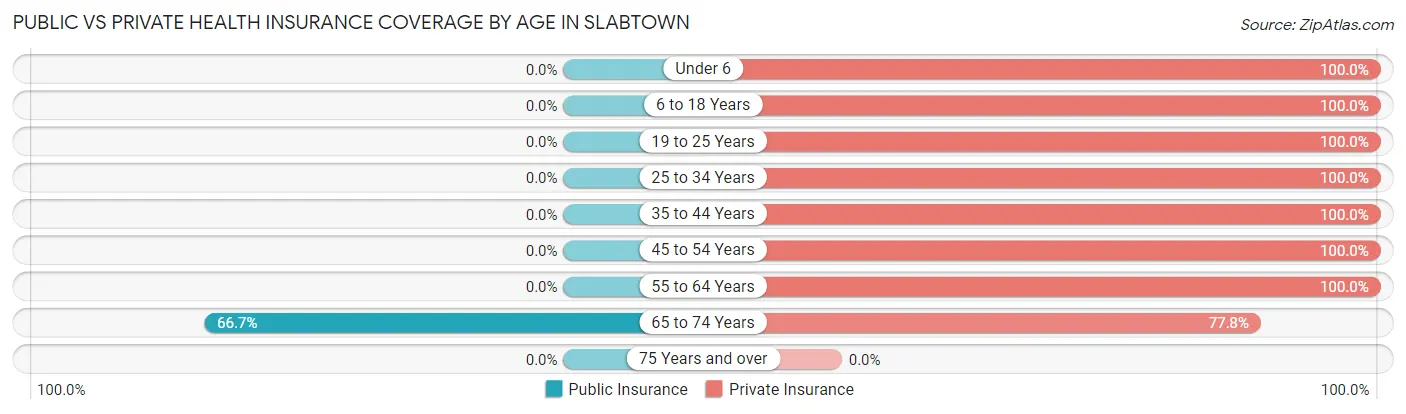
| Age Bracket | Public Insurance | Private Insurance |
| Under 6 | 0 (0.0%) | 10 (100.0%) |
| 6 to 18 Years | 0 (0.0%) | 15 (100.0%) |
| 19 to 25 Years | 0 (0.0%) | 39 (100.0%) |
| 25 to 34 Years | 0 (0.0%) | 24 (100.0%) |
| 35 to 44 Years | 0 (0.0%) | 12 (100.0%) |
| 45 to 54 Years | 0 (0.0%) | 16 (100.0%) |
| 55 to 64 Years | 0 (0.0%) | 3 (100.0%) |
| 65 to 74 Years | 6 (66.7%) | 7 (77.8%) |
| 75 Years and over | 0 (0.0%) | 0 (0.0%) |
| Total | 6 (4.7%) | 126 (98.4%) |
Disability Status by Sex by Age in Slabtown
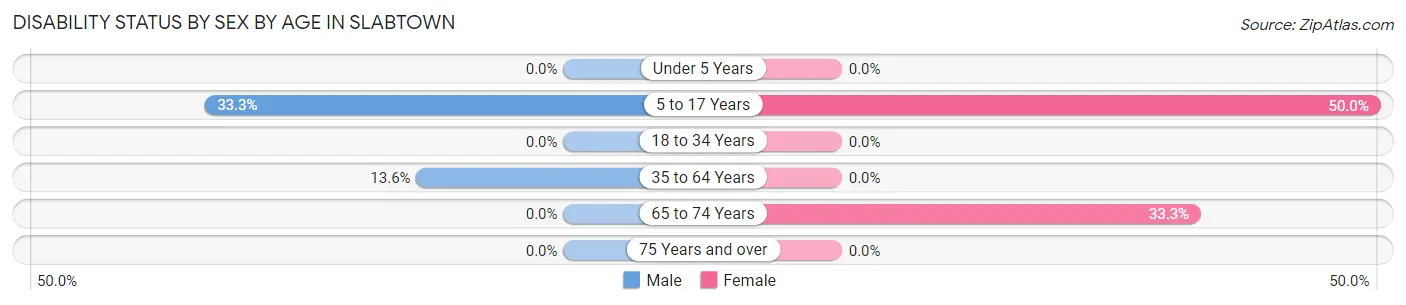
| Age Bracket | Male | Female |
| Under 5 Years | 0 (0.0%) | 0 (0.0%) |
| 5 to 17 Years | 3 (33.3%) | 3 (50.0%) |
| 18 to 34 Years | 0 (0.0%) | 0 (0.0%) |
| 35 to 64 Years | 3 (13.6%) | 0 (0.0%) |
| 65 to 74 Years | 0 (0.0%) | 2 (33.3%) |
| 75 Years and over | 0 (0.0%) | 0 (0.0%) |
Disability Class by Sex by Age in Slabtown
Disability Class: Hearing Difficulty
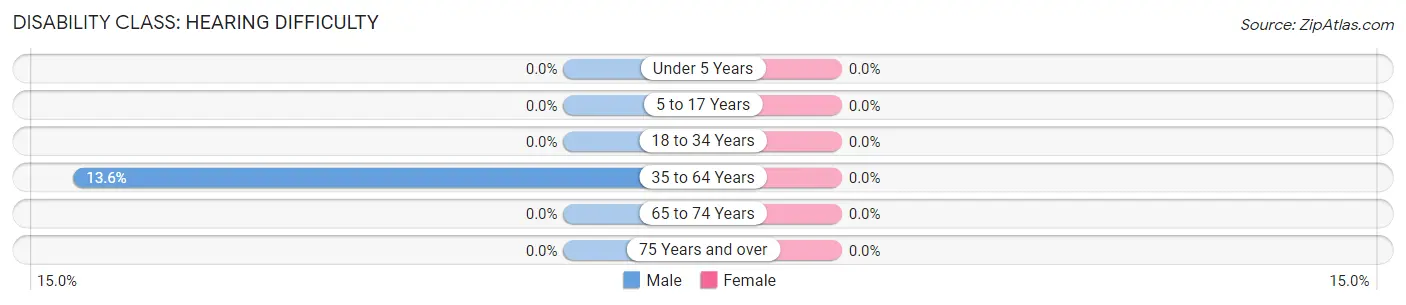
| Age Bracket | Male | Female |
| Under 5 Years | 0 (0.0%) | 0 (0.0%) |
| 5 to 17 Years | 0 (0.0%) | 0 (0.0%) |
| 18 to 34 Years | 0 (0.0%) | 0 (0.0%) |
| 35 to 64 Years | 3 (13.6%) | 0 (0.0%) |
| 65 to 74 Years | 0 (0.0%) | 0 (0.0%) |
| 75 Years and over | 0 (0.0%) | 0 (0.0%) |
Disability Class: Vision Difficulty
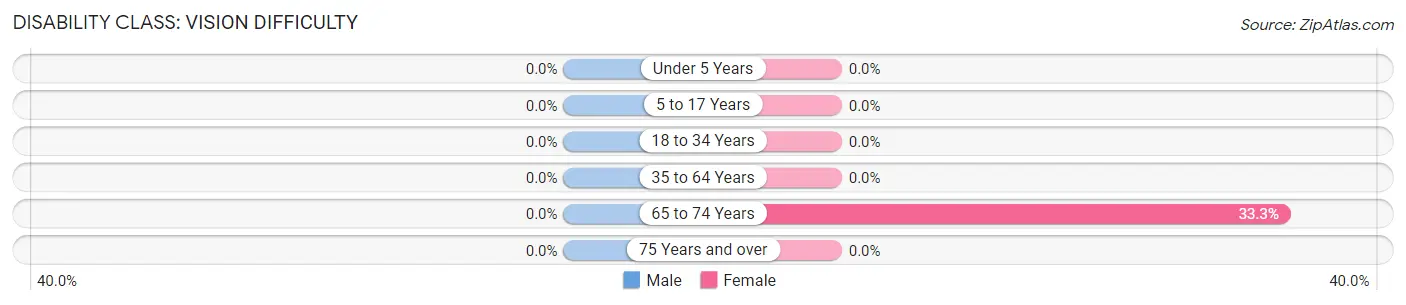
| Age Bracket | Male | Female |
| Under 5 Years | 0 (0.0%) | 0 (0.0%) |
| 5 to 17 Years | 0 (0.0%) | 0 (0.0%) |
| 18 to 34 Years | 0 (0.0%) | 0 (0.0%) |
| 35 to 64 Years | 0 (0.0%) | 0 (0.0%) |
| 65 to 74 Years | 0 (0.0%) | 2 (33.3%) |
| 75 Years and over | 0 (0.0%) | 0 (0.0%) |
Disability Class: Cognitive Difficulty
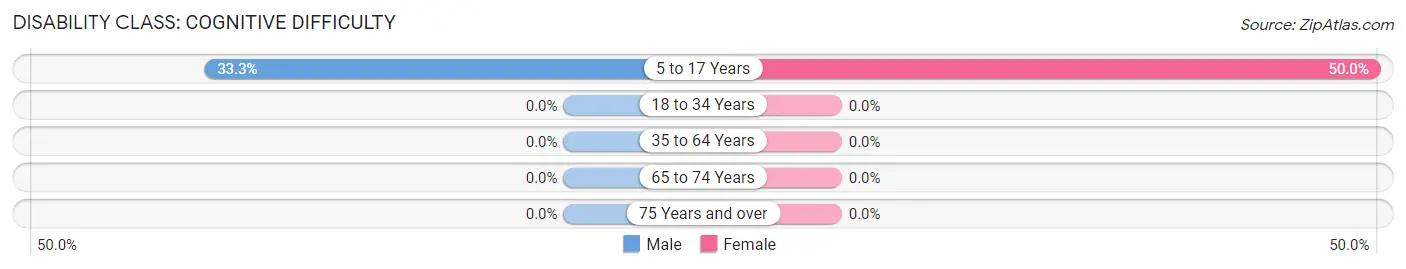
| Age Bracket | Male | Female |
| 5 to 17 Years | 3 (33.3%) | 3 (50.0%) |
| 18 to 34 Years | 0 (0.0%) | 0 (0.0%) |
| 35 to 64 Years | 0 (0.0%) | 0 (0.0%) |
| 65 to 74 Years | 0 (0.0%) | 0 (0.0%) |
| 75 Years and over | 0 (0.0%) | 0 (0.0%) |
Disability Class: Ambulatory Difficulty
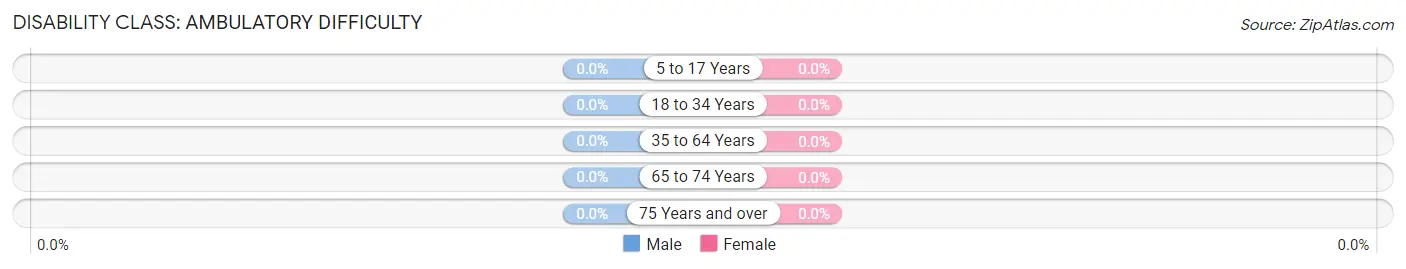
| Age Bracket | Male | Female |
| 5 to 17 Years | 0 (0.0%) | 0 (0.0%) |
| 18 to 34 Years | 0 (0.0%) | 0 (0.0%) |
| 35 to 64 Years | 0 (0.0%) | 0 (0.0%) |
| 65 to 74 Years | 0 (0.0%) | 0 (0.0%) |
| 75 Years and over | 0 (0.0%) | 0 (0.0%) |
Disability Class: Self-Care Difficulty
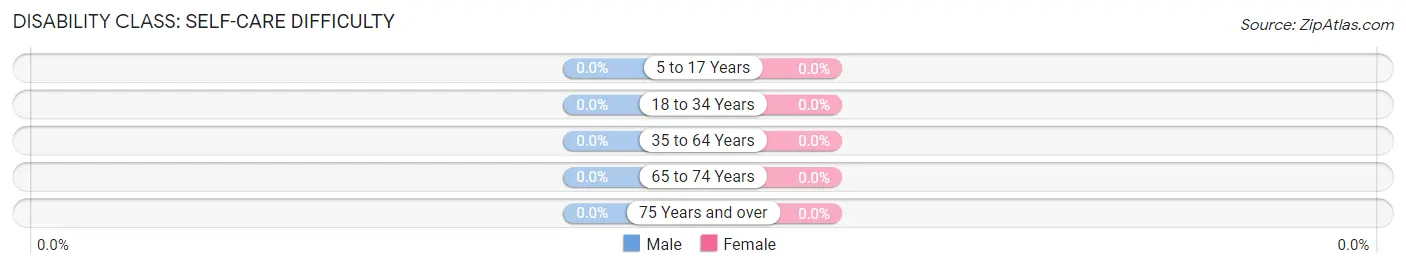
| Age Bracket | Male | Female |
| 5 to 17 Years | 0 (0.0%) | 0 (0.0%) |
| 18 to 34 Years | 0 (0.0%) | 0 (0.0%) |
| 35 to 64 Years | 0 (0.0%) | 0 (0.0%) |
| 65 to 74 Years | 0 (0.0%) | 0 (0.0%) |
| 75 Years and over | 0 (0.0%) | 0 (0.0%) |
Technology Access in Slabtown
Computing Device Access in Slabtown
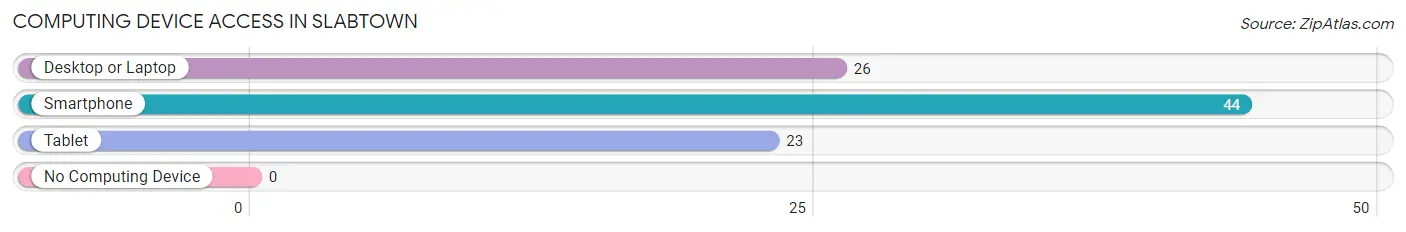
| Device Type | # Households | % Households |
| Desktop or Laptop | 26 | 59.1% |
| Smartphone | 44 | 100.0% |
| Tablet | 23 | 52.3% |
| No Computing Device | 0 | 0.0% |
| Total | 44 | 100.0% |
Internet Access in Slabtown
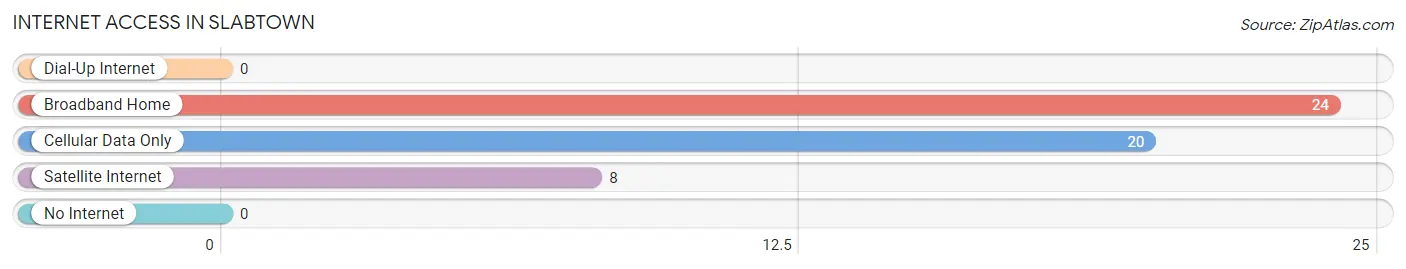
| Internet Type | # Households | % Households |
| Dial-Up Internet | 0 | 0.0% |
| Broadband Home | 24 | 54.5% |
| Cellular Data Only | 20 | 45.5% |
| Satellite Internet | 8 | 18.2% |
| No Internet | 0 | 0.0% |
| Total | 44 | 100.0% |
Slabtown Summary
Slabtown, Pennsylvania is a small borough located in the southwestern corner of the state. It is situated in the foothills of the Allegheny Mountains, and is bordered by the towns of New Alexandria, Donegal, and Ligonier. The population of Slabtown was 1,845 as of the 2010 census.
History
Slabtown was founded in 1820 by a group of settlers from the nearby town of Donegal. The settlers were looking for a place to build a new community, and they chose the area around Slabtown because of its proximity to the Allegheny Mountains and its abundance of natural resources. The settlers named the town after the large slabs of limestone that were found in the area.
The town quickly grew and prospered, and by the mid-1800s it had become a thriving community. The town was home to several businesses, including a sawmill, a gristmill, and a tannery. The town also had a school, a post office, and a church.
In the late 1800s, the town began to decline. The sawmill and gristmill closed, and the tannery moved away. The population of Slabtown began to dwindle, and by the early 1900s the town was nearly abandoned.
In the 1950s, the town began to experience a resurgence. The population began to grow again, and new businesses opened in the area. Today, Slabtown is a small but vibrant community.
Geography
Slabtown is located in the southwestern corner of Pennsylvania, in the foothills of the Allegheny Mountains. The town is bordered by the towns of New Alexandria, Donegal, and Ligonier. The town is situated on the banks of the Conemaugh River, and is surrounded by rolling hills and lush forests.
The climate in Slabtown is temperate, with warm summers and cold winters. The average temperature in the summer is around 75 degrees Fahrenheit, and the average temperature in the winter is around 30 degrees Fahrenheit.
Economy
The economy of Slabtown is largely based on tourism. The town is home to several small businesses, including restaurants, shops, and bed and breakfasts. The town also has a small manufacturing sector, with several small factories located in the area.
The town is also home to several farms, which produce a variety of crops, including corn, wheat, and hay. The town also has a thriving lumber industry, with several sawmills located in the area.
Demographics
As of the 2010 census, the population of Slabtown was 1,845. The population is largely white (94.3%), with small percentages of African American (2.2%), Hispanic (1.7%), and Asian (1.2%) residents. The median household income in Slabtown is $41,944, and the median age is 43.
Conclusion
Slabtown, Pennsylvania is a small borough located in the southwestern corner of the state. It is situated in the foothills of the Allegheny Mountains, and is bordered by the towns of New Alexandria, Donegal, and Ligonier. The town was founded in 1820 by a group of settlers from the nearby town of Donegal, and has since grown into a small but vibrant community. The economy of Slabtown is largely based on tourism, with several small businesses, farms, and sawmills located in the area. The population of Slabtown was 1,845 as of the 2010 census, and is largely white (94.3%), with small percentages of African American (2.2%), Hispanic (1.7%), and Asian (1.2%) residents.
Common Questions
What is Per Capita Income in Slabtown?
Per Capita income in Slabtown is $34,795.
What is the Median Family Income in Slabtown?
Median Family Income in Slabtown is $86,406.
What is the Median Household income in Slabtown?
Median Household Income in Slabtown is $85,313.
What is Income or Wage Gap in Slabtown?
Income or Wage Gap in Slabtown is 39.3%.
Women in Slabtown earn 60.7 cents for every dollar earned by a man.
What is Inequality or Gini Index in Slabtown?
Inequality or Gini Index in Slabtown is 0.27.
What is the Total Population of Slabtown?
Total Population of Slabtown is 128.
What is the Total Male Population of Slabtown?
Total Male Population of Slabtown is 62.
What is the Total Female Population of Slabtown?
Total Female Population of Slabtown is 66.
What is the Ratio of Males per 100 Females in Slabtown?
There are 93.94 Males per 100 Females in Slabtown.
What is the Ratio of Females per 100 Males in Slabtown?
There are 106.45 Females per 100 Males in Slabtown.
What is the Median Population Age in Slabtown?
Median Population Age in Slabtown is 27.5 Years.
What is the Average Family Size in Slabtown
Average Family Size in Slabtown is 3.3 People.
What is the Average Household Size in Slabtown
Average Household Size in Slabtown is 2.9 People.
How Large is the Labor Force in Slabtown?
There are 97 People in the Labor Forcein in Slabtown.
What is the Percentage of People in the Labor Force in Slabtown?
94.2% of People are in the Labor Force in Slabtown.