Idaville, PA Map & Demographics
Idaville Map
Idaville Overview
$44,636
PER CAPITA INCOME
$77,083
AVG HOUSEHOLD INCOME
61.8%
WAGE / INCOME GAP [ % ]
38.2¢/ $1
WAGE / INCOME GAP [ $ ]
0.39
INEQUALITY / GINI INDEX
162
TOTAL POPULATION
72
MALE POPULATION
90
FEMALE POPULATION
80.00
MALES / 100 FEMALES
125.00
FEMALES / 100 MALES
38.1
MEDIAN AGE
3.0
AVG FAMILY SIZE
2.4
AVG HOUSEHOLD SIZE
84
LABOR FORCE [ PEOPLE ]
62.2%
PERCENT IN LABOR FORCE
4.8%
UNEMPLOYMENT RATE
Idaville Area Codes
Income in Idaville
Income Overview in Idaville
| Characteristic | Number | Measure |
| Per Capita Income | 162 | $44,636 |
| Median Family Income | 40 | $0 |
| Mean Family Income | 40 | $148,088 |
| Median Household Income | 67 | $77,083 |
| Mean Household Income | 67 | $106,872 |
| Income Deficit | 40 | $0 |
| Wage / Income Gap (%) | 162 | 61.76% |
| Wage / Income Gap ($) | 162 | 38.24¢ per $1 |
| Gini / Inequality Index | 162 | 0.39 |
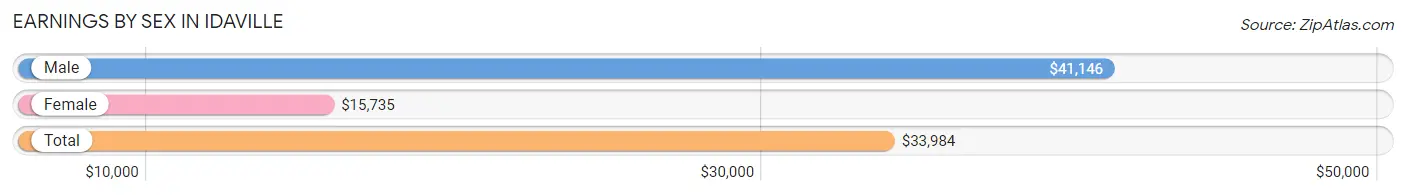
Earnings by Sex in Idaville
Average Earnings in Idaville are $33,984, $41,146 for men and $15,735 for women, a difference of 61.8%.
| Sex | Number | Average Earnings |
| Male | 43 (44.3%) | $41,146 |
| Female | 54 (55.7%) | $15,735 |
| Total | 97 (100.0%) | $33,984 |
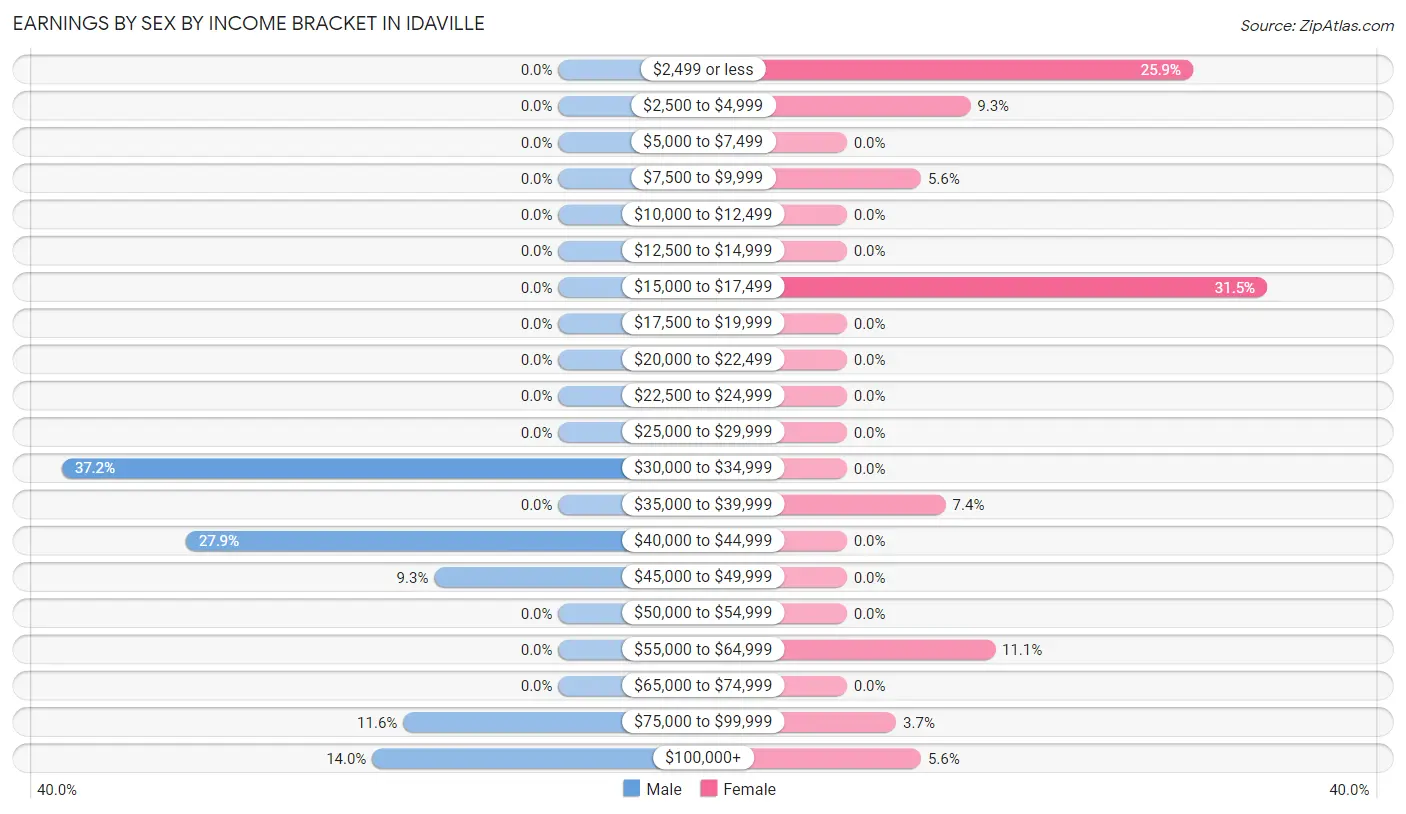
Earnings by Sex by Income Bracket in Idaville
The most common earnings brackets in Idaville are $30,000 to $34,999 for men (16 | 37.2%) and $15,000 to $17,499 for women (17 | 31.5%).
| Income | Male | Female |
| $2,499 or less | 0 (0.0%) | 14 (25.9%) |
| $2,500 to $4,999 | 0 (0.0%) | 5 (9.3%) |
| $5,000 to $7,499 | 0 (0.0%) | 0 (0.0%) |
| $7,500 to $9,999 | 0 (0.0%) | 3 (5.6%) |
| $10,000 to $12,499 | 0 (0.0%) | 0 (0.0%) |
| $12,500 to $14,999 | 0 (0.0%) | 0 (0.0%) |
| $15,000 to $17,499 | 0 (0.0%) | 17 (31.5%) |
| $17,500 to $19,999 | 0 (0.0%) | 0 (0.0%) |
| $20,000 to $22,499 | 0 (0.0%) | 0 (0.0%) |
| $22,500 to $24,999 | 0 (0.0%) | 0 (0.0%) |
| $25,000 to $29,999 | 0 (0.0%) | 0 (0.0%) |
| $30,000 to $34,999 | 16 (37.2%) | 0 (0.0%) |
| $35,000 to $39,999 | 0 (0.0%) | 4 (7.4%) |
| $40,000 to $44,999 | 12 (27.9%) | 0 (0.0%) |
| $45,000 to $49,999 | 4 (9.3%) | 0 (0.0%) |
| $50,000 to $54,999 | 0 (0.0%) | 0 (0.0%) |
| $55,000 to $64,999 | 0 (0.0%) | 6 (11.1%) |
| $65,000 to $74,999 | 0 (0.0%) | 0 (0.0%) |
| $75,000 to $99,999 | 5 (11.6%) | 2 (3.7%) |
| $100,000+ | 6 (14.0%) | 3 (5.6%) |
| Total | 43 (100.0%) | 54 (100.0%) |
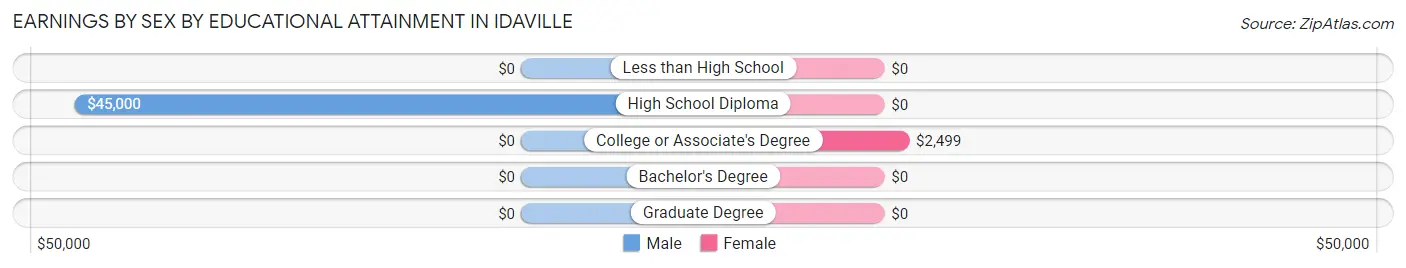
Earnings by Sex by Educational Attainment in Idaville
| Educational Attainment | Male Income | Female Income |
| Less than High School | - | - |
| High School Diploma | $45,000 | $0 |
| College or Associate's Degree | - | - |
| Bachelor's Degree | - | - |
| Graduate Degree | - | - |
| Total | $41,146 | $0 |
Family Income in Idaville
Family Income Brackets in Idaville
According to the Idaville family income data, there are 16 families falling into the $75,000 to $99,999 income range, which is the most common income bracket and makes up 40.0% of all families.
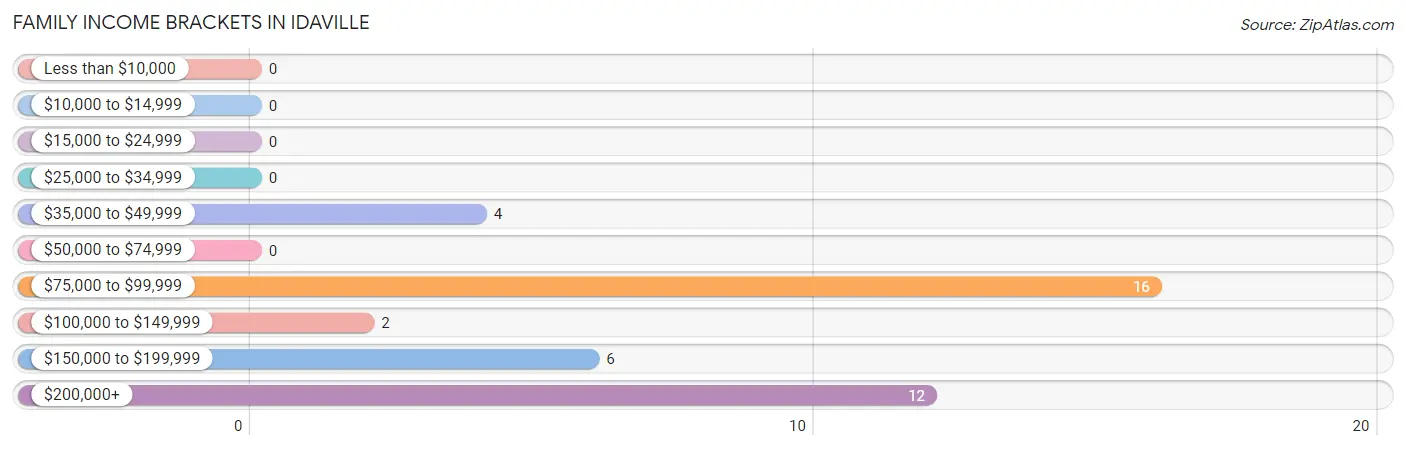
| Income Bracket | # Families | % Families |
| Less than $10,000 | 0 | 0.0% |
| $10,000 to $14,999 | 0 | 0.0% |
| $15,000 to $24,999 | 0 | 0.0% |
| $25,000 to $34,999 | 0 | 0.0% |
| $35,000 to $49,999 | 4 | 10.0% |
| $50,000 to $74,999 | 0 | 0.0% |
| $75,000 to $99,999 | 16 | 40.0% |
| $100,000 to $149,999 | 2 | 5.0% |
| $150,000 to $199,999 | 6 | 15.0% |
| $200,000+ | 12 | 30.0% |
Family Income by Famaliy Size in Idaville
2-person families (18 | 45.0%) account for the highest median family income in Idaville with $93,000 per family, while 2-person families (18 | 45.0%) have the highest median income of $46,500 per family member.
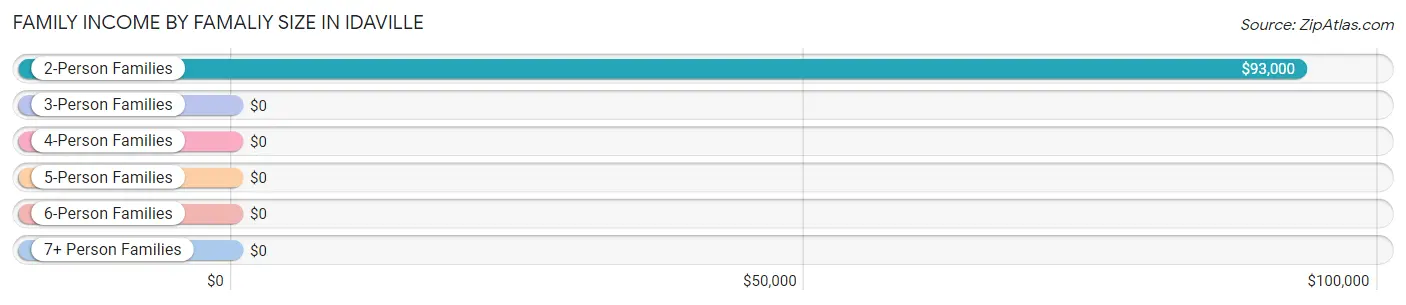
| Income Bracket | # Families | Median Income |
| 2-Person Families | 18 (45.0%) | $93,000 |
| 3-Person Families | 13 (32.5%) | $0 |
| 4-Person Families | 0 (0.0%) | $0 |
| 5-Person Families | 9 (22.5%) | $0 |
| 6-Person Families | 0 (0.0%) | $0 |
| 7+ Person Families | 0 (0.0%) | $0 |
| Total | 40 (100.0%) | $0 |
Family Income by Number of Earners in Idaville
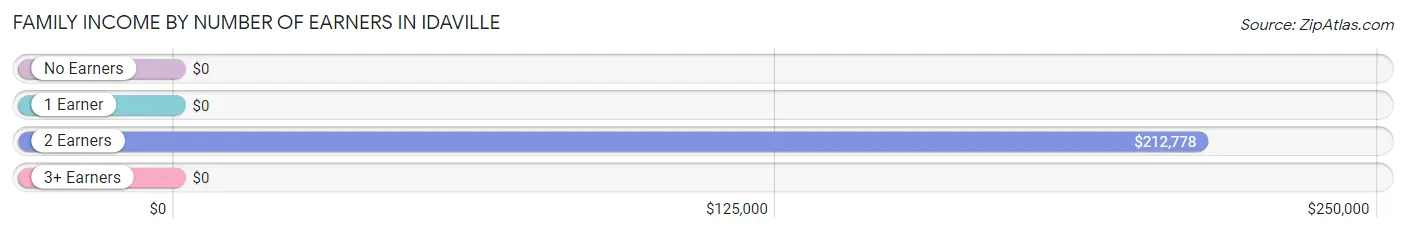
| Number of Earners | # Families | Median Income |
| No Earners | 7 (17.5%) | $0 |
| 1 Earner | 7 (17.5%) | $0 |
| 2 Earners | 16 (40.0%) | $212,778 |
| 3+ Earners | 10 (25.0%) | $0 |
| Total | 40 (100.0%) | $0 |
Household Income in Idaville
Household Income Brackets in Idaville
With 16 households falling in the category, the $75,000 to $99,999 income range is the most frequent in Idaville, accounting for 23.9% of all households.
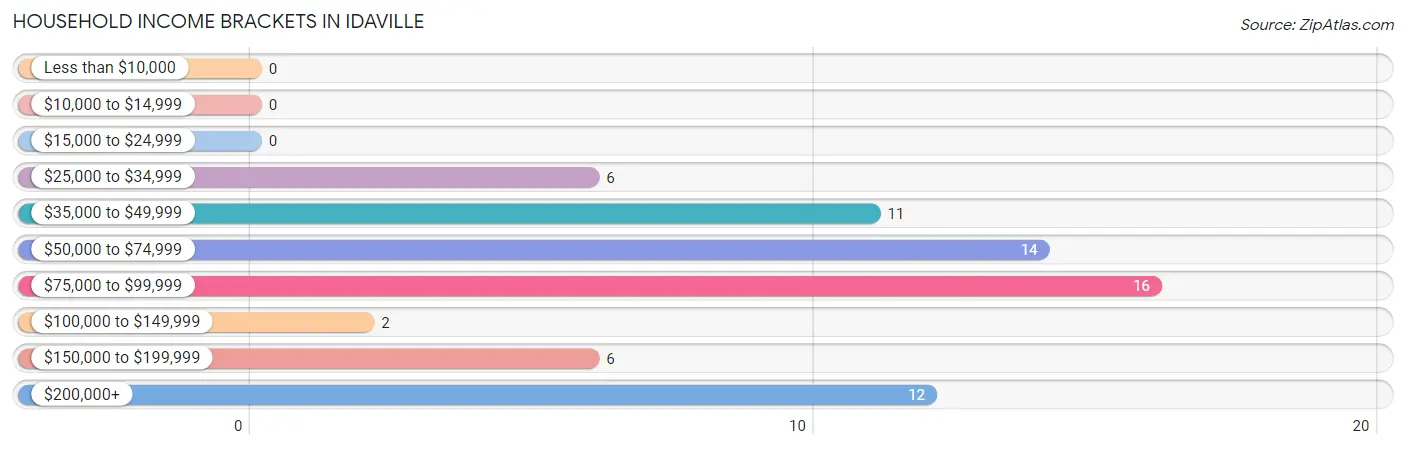
| Income Bracket | # Households | % Households |
| Less than $10,000 | 0 | 0.0% |
| $10,000 to $14,999 | 0 | 0.0% |
| $15,000 to $24,999 | 0 | 0.0% |
| $25,000 to $34,999 | 6 | 9.0% |
| $35,000 to $49,999 | 11 | 16.4% |
| $50,000 to $74,999 | 14 | 20.9% |
| $75,000 to $99,999 | 16 | 23.9% |
| $100,000 to $149,999 | 2 | 3.0% |
| $150,000 to $199,999 | 6 | 9.0% |
| $200,000+ | 12 | 17.9% |
Household Income by Householder Age in Idaville
The median household income in Idaville is $77,083, with the highest median household income of $46,250 found in the 65+ years age bracket for the primary householder. A total of 27 households (40.3%) fall into this category.
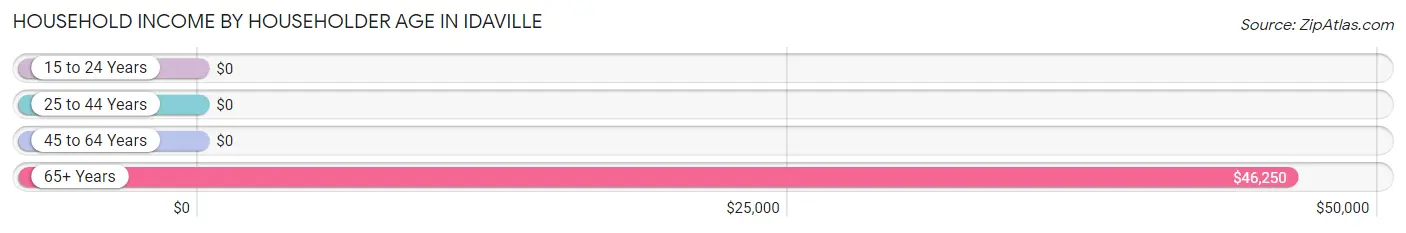
| Income Bracket | # Households | Median Income |
| 15 to 24 Years | 0 (0.0%) | $0 |
| 25 to 44 Years | 31 (46.3%) | $0 |
| 45 to 64 Years | 9 (13.4%) | $0 |
| 65+ Years | 27 (40.3%) | $46,250 |
| Total | 67 (100.0%) | $77,083 |
Poverty in Idaville
Income Below Poverty by Sex and Age in Idaville
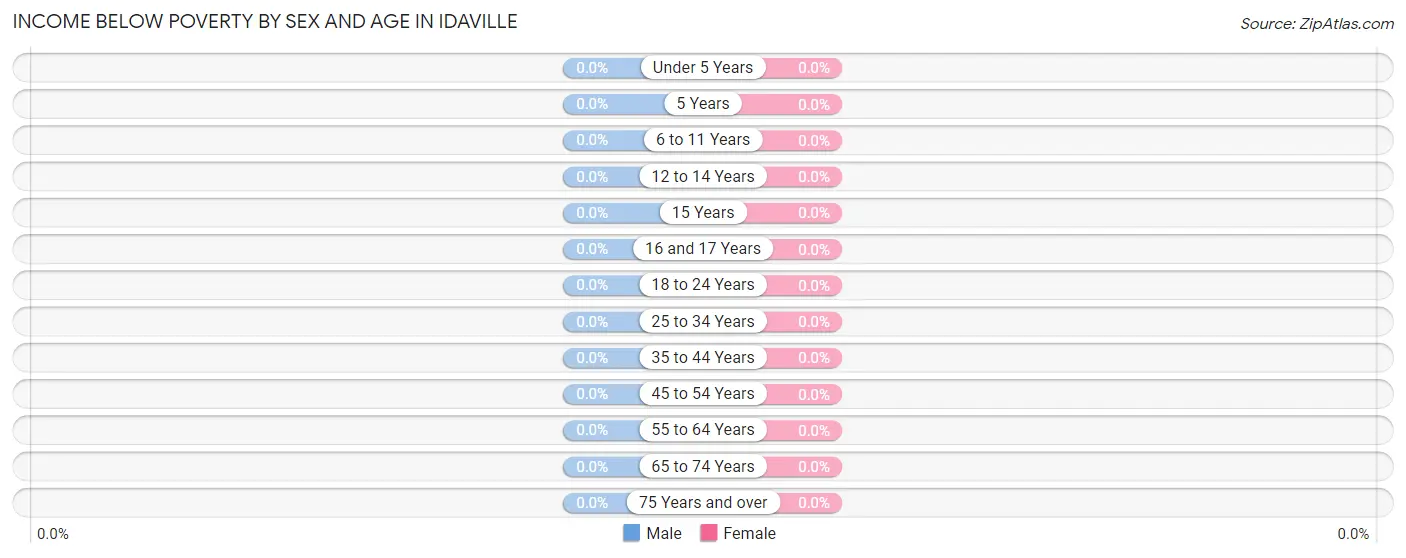
| Age Bracket | Male | Female |
| Under 5 Years | 0 (0.0%) | 0 (0.0%) |
| 5 Years | 0 (0.0%) | 0 (0.0%) |
| 6 to 11 Years | 0 (0.0%) | 0 (0.0%) |
| 12 to 14 Years | 0 (0.0%) | 0 (0.0%) |
| 15 Years | 0 (0.0%) | 0 (0.0%) |
| 16 and 17 Years | 0 (0.0%) | 0 (0.0%) |
| 18 to 24 Years | 0 (0.0%) | 0 (0.0%) |
| 25 to 34 Years | 0 (0.0%) | 0 (0.0%) |
| 35 to 44 Years | 0 (0.0%) | 0 (0.0%) |
| 45 to 54 Years | 0 (0.0%) | 0 (0.0%) |
| 55 to 64 Years | 0 (0.0%) | 0 (0.0%) |
| 65 to 74 Years | 0 (0.0%) | 0 (0.0%) |
| 75 Years and over | 0 (0.0%) | 0 (0.0%) |
| Total | 0 (0.0%) | 0 (0.0%) |
Income Above Poverty by Sex and Age in Idaville
According to the poverty statistics in Idaville, males aged under 5 years and females aged 6 to 11 years are the age groups that are most secure financially, with 100.0% of males and 100.0% of females in these age groups living above the poverty line.
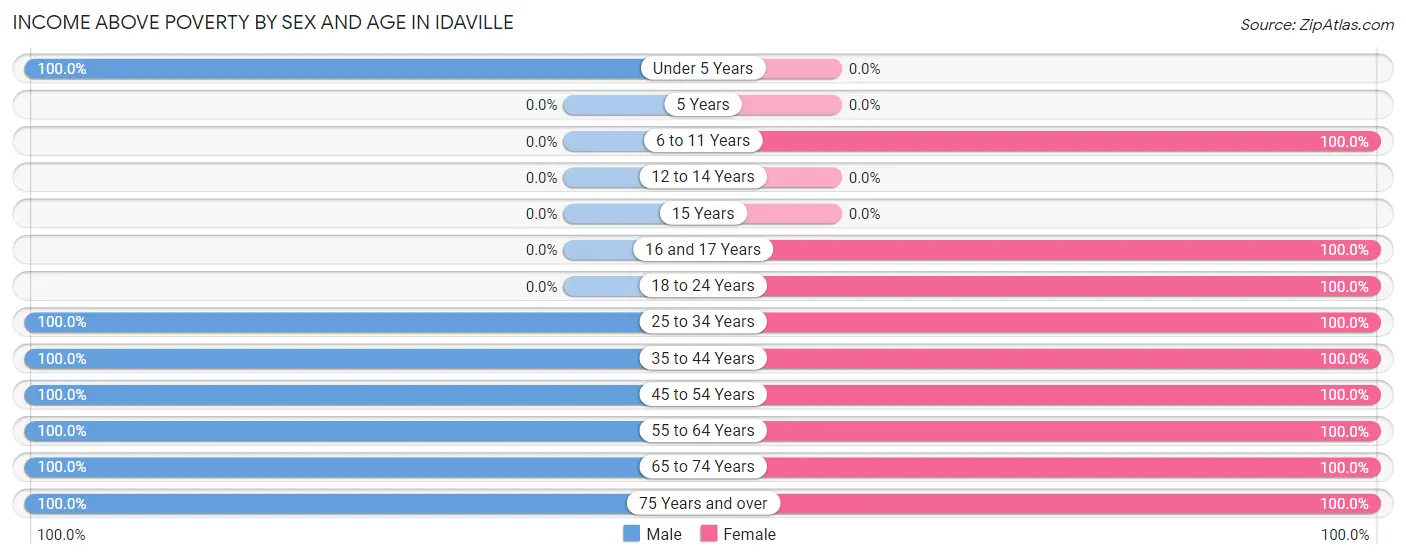
| Age Bracket | Male | Female |
| Under 5 Years | 8 (100.0%) | 0 (0.0%) |
| 5 Years | 0 (0.0%) | 0 (0.0%) |
| 6 to 11 Years | 0 (0.0%) | 19 (100.0%) |
| 12 to 14 Years | 0 (0.0%) | 0 (0.0%) |
| 15 Years | 0 (0.0%) | 0 (0.0%) |
| 16 and 17 Years | 0 (0.0%) | 5 (100.0%) |
| 18 to 24 Years | 0 (0.0%) | 5 (100.0%) |
| 25 to 34 Years | 16 (100.0%) | 23 (100.0%) |
| 35 to 44 Years | 18 (100.0%) | 6 (100.0%) |
| 45 to 54 Years | 4 (100.0%) | 10 (100.0%) |
| 55 to 64 Years | 5 (100.0%) | 9 (100.0%) |
| 65 to 74 Years | 17 (100.0%) | 9 (100.0%) |
| 75 Years and over | 4 (100.0%) | 4 (100.0%) |
| Total | 72 (100.0%) | 90 (100.0%) |
Income Below Poverty Among Married-Couple Families in Idaville
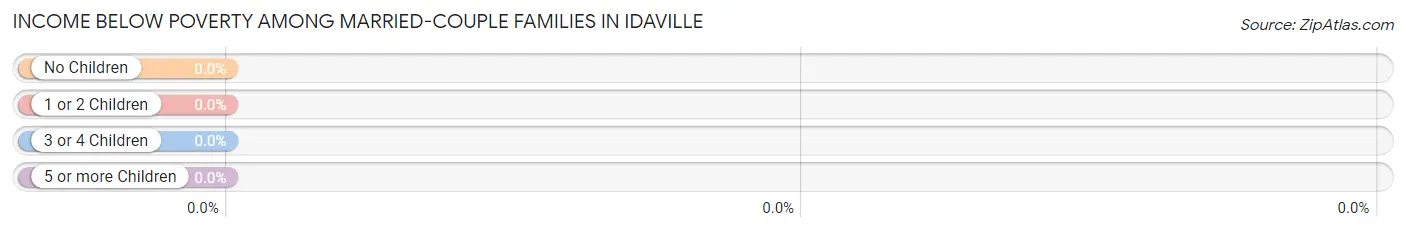
| Children | Above Poverty | Below Poverty |
| No Children | 25 (100.0%) | 0 (0.0%) |
| 1 or 2 Children | 6 (100.0%) | 0 (0.0%) |
| 3 or 4 Children | 9 (100.0%) | 0 (0.0%) |
| 5 or more Children | 0 (0.0%) | 0 (0.0%) |
| Total | 40 (100.0%) | 0 (0.0%) |
Income Below Poverty Among Single-Parent Households in Idaville
| Children | Single Father | Single Mother |
| No Children | 0 (0.0%) | 0 (0.0%) |
| 1 or 2 Children | 0 (0.0%) | 0 (0.0%) |
| 3 or 4 Children | 0 (0.0%) | 0 (0.0%) |
| 5 or more Children | 0 (0.0%) | 0 (0.0%) |
| Total | 0 (0.0%) | 0 (0.0%) |
Income Below Poverty Among Married-Couple vs Single-Parent Households in Idaville
| Children | Married-Couple Families | Single-Parent Households |
| No Children | 0 (0.0%) | 0 (0.0%) |
| 1 or 2 Children | 0 (0.0%) | 0 (0.0%) |
| 3 or 4 Children | 0 (0.0%) | 0 (0.0%) |
| 5 or more Children | 0 (0.0%) | 0 (0.0%) |
| Total | 0 (0.0%) | 0 (0.0%) |
Race in Idaville
The most populous races in Idaville are White / Caucasian (160 | 98.8%), and Two or more Races (2 | 1.2%).
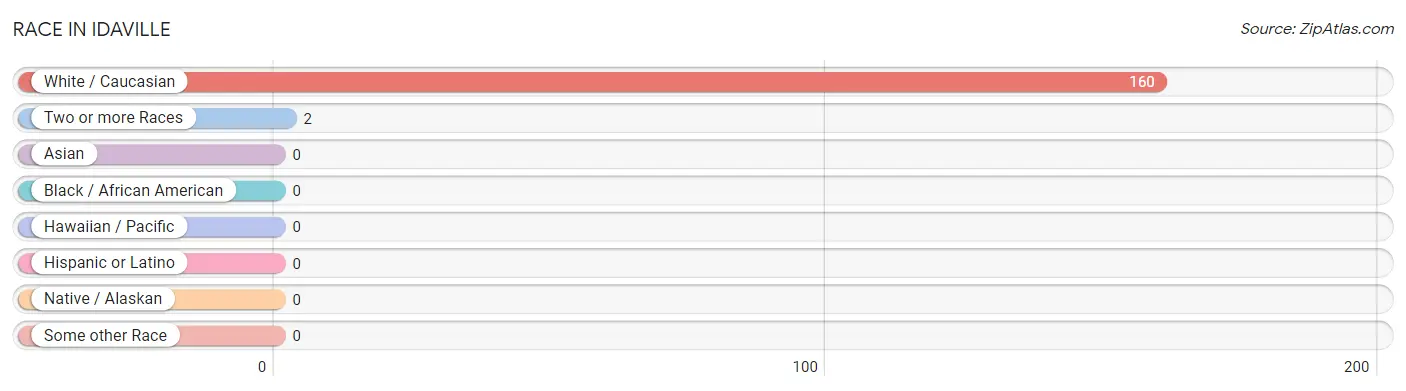
| Race | # Population | % Population |
| Asian | 0 | 0.0% |
| Black / African American | 0 | 0.0% |
| Hawaiian / Pacific | 0 | 0.0% |
| Hispanic or Latino | 0 | 0.0% |
| Native / Alaskan | 0 | 0.0% |
| White / Caucasian | 160 | 98.8% |
| Two or more Races | 2 | 1.2% |
| Some other Race | 0 | 0.0% |
| Total | 162 | 100.0% |
Ancestry in Idaville
The most populous ancestries reported in Idaville are German (72 | 44.4%), Irish (20 | 12.3%), Italian (15 | 9.3%), English (14 | 8.6%), and Dutch (13 | 8.0%), together accounting for 82.7% of all Idaville residents.
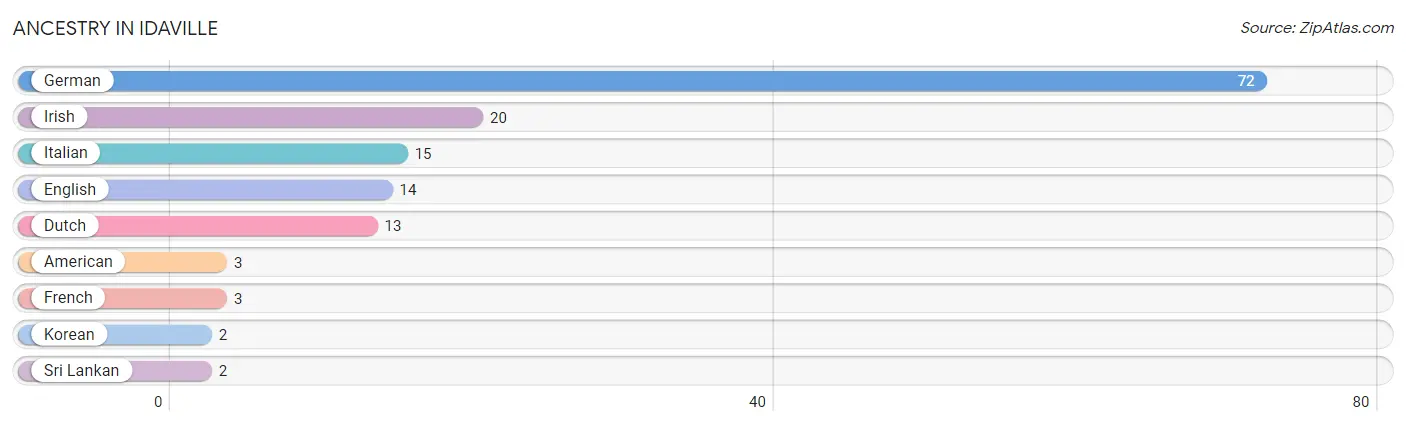
| Ancestry | # Population | % Population |
| American | 3 | 1.8% |
| Dutch | 13 | 8.0% |
| English | 14 | 8.6% |
| French | 3 | 1.8% |
| German | 72 | 44.4% |
| Irish | 20 | 12.3% |
| Italian | 15 | 9.3% |
| Korean | 2 | 1.2% |
| Sri Lankan | 2 | 1.2% | View All 9 Rows |
Immigrants in Idaville

| Immigration Origin | # Population | % Population | View All 0 Rows |
Sex and Age in Idaville
Sex and Age in Idaville
The most populous age groups in Idaville are 65 to 69 Years (17 | 23.6%) for men and 25 to 29 Years (14 | 15.6%) for women.
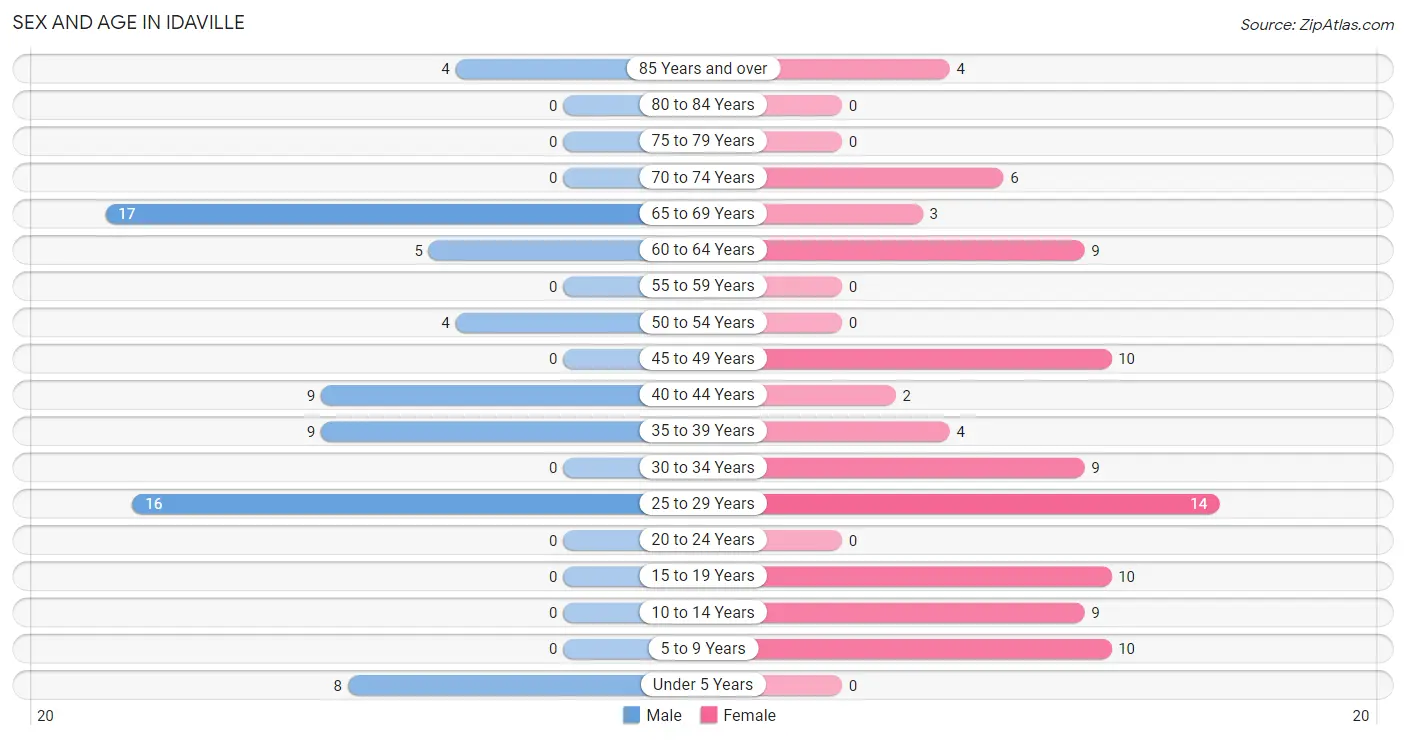
| Age Bracket | Male | Female |
| Under 5 Years | 8 (11.1%) | 0 (0.0%) |
| 5 to 9 Years | 0 (0.0%) | 10 (11.1%) |
| 10 to 14 Years | 0 (0.0%) | 9 (10.0%) |
| 15 to 19 Years | 0 (0.0%) | 10 (11.1%) |
| 20 to 24 Years | 0 (0.0%) | 0 (0.0%) |
| 25 to 29 Years | 16 (22.2%) | 14 (15.6%) |
| 30 to 34 Years | 0 (0.0%) | 9 (10.0%) |
| 35 to 39 Years | 9 (12.5%) | 4 (4.4%) |
| 40 to 44 Years | 9 (12.5%) | 2 (2.2%) |
| 45 to 49 Years | 0 (0.0%) | 10 (11.1%) |
| 50 to 54 Years | 4 (5.6%) | 0 (0.0%) |
| 55 to 59 Years | 0 (0.0%) | 0 (0.0%) |
| 60 to 64 Years | 5 (6.9%) | 9 (10.0%) |
| 65 to 69 Years | 17 (23.6%) | 3 (3.3%) |
| 70 to 74 Years | 0 (0.0%) | 6 (6.7%) |
| 75 to 79 Years | 0 (0.0%) | 0 (0.0%) |
| 80 to 84 Years | 0 (0.0%) | 0 (0.0%) |
| 85 Years and over | 4 (5.6%) | 4 (4.4%) |
| Total | 72 (100.0%) | 90 (100.0%) |
Families and Households in Idaville
Median Family Size in Idaville
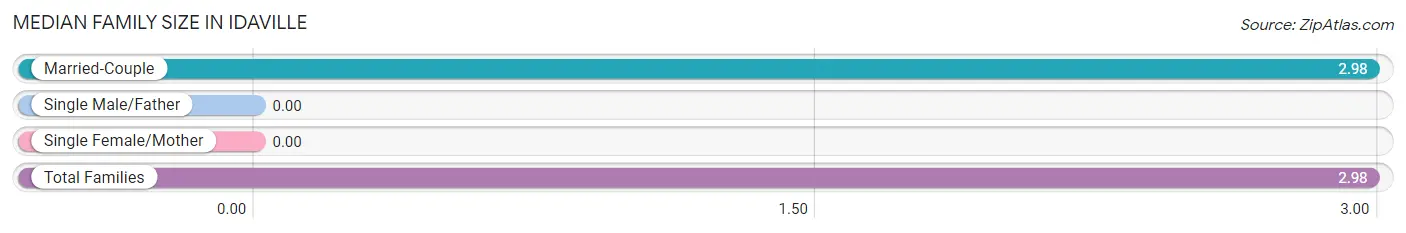
| Family Type | # Families | Family Size |
| Married-Couple | 40 (100.0%) | 2.98 |
| Single Male/Father | 0 (0.0%) | - |
| Single Female/Mother | 0 (0.0%) | - |
| Total Families | 40 (100.0%) | 2.98 |
Median Household Size in Idaville
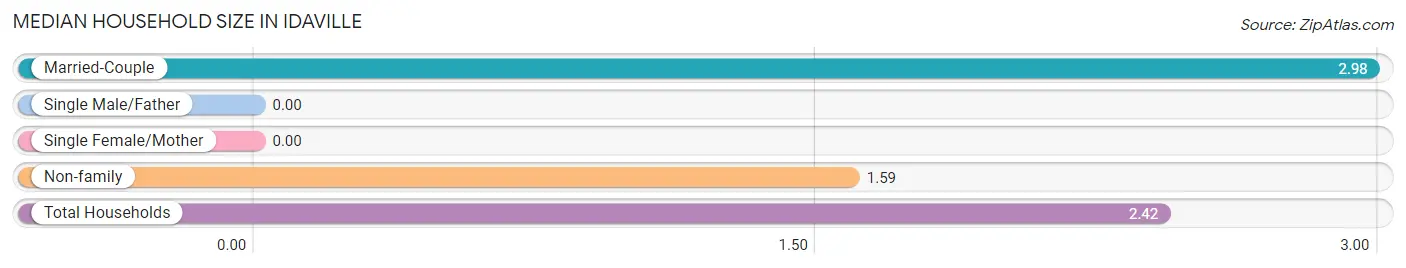
| Household Type | # Households | Household Size |
| Married-Couple | 40 (59.7%) | 2.98 |
| Single Male/Father | 0 (0.0%) | - |
| Single Female/Mother | 0 (0.0%) | - |
| Non-family | 27 (40.3%) | 1.59 |
| Total Households | 67 (100.0%) | 2.42 |
Household Size by Marriage Status in Idaville
Out of a total of 67 households in Idaville, 40 (59.7%) are family households, while 27 (40.3%) are nonfamily households. The most numerous type of family households are 2-person households, comprising 18, and the most common type of nonfamily households are 2-person households, comprising 14.
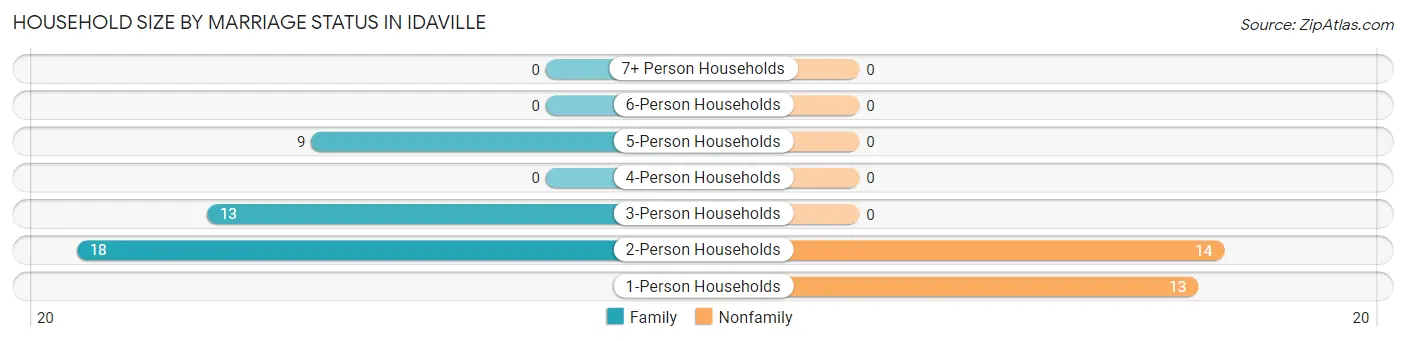
| Household Size | Family Households | Nonfamily Households |
| 1-Person Households | - | 13 (19.4%) |
| 2-Person Households | 18 (26.9%) | 14 (20.9%) |
| 3-Person Households | 13 (19.4%) | 0 (0.0%) |
| 4-Person Households | 0 (0.0%) | 0 (0.0%) |
| 5-Person Households | 9 (13.4%) | 0 (0.0%) |
| 6-Person Households | 0 (0.0%) | 0 (0.0%) |
| 7+ Person Households | 0 (0.0%) | 0 (0.0%) |
| Total | 40 (59.7%) | 27 (40.3%) |
Female Fertility in Idaville
Fertility by Age in Idaville
| Age Bracket | Women with Births | Births / 1,000 Women |
| 15 to 19 years | 0 (0.0%) | 0.0 |
| 20 to 34 years | 0 (0.0%) | 0.0 |
| 35 to 50 years | 0 (0.0%) | 0.0 |
| Total | 0 (0.0%) | 0.0 |
Fertility by Age by Marriage Status in Idaville
| Age Bracket | Married | Unmarried |
| 15 to 19 years | 0 (0.0%) | 0 (0.0%) |
| 20 to 34 years | 0 (0.0%) | 0 (0.0%) |
| 35 to 50 years | 0 (0.0%) | 0 (0.0%) |
| Total | 0 (0.0%) | 0 (0.0%) |
Fertility by Education in Idaville
| Educational Attainment | Women with Births | Births / 1,000 Women |
| Less than High School | 0 (0.0%) | 0.0 |
| High School Diploma | 0 (0.0%) | 0.0 |
| College or Associate's Degree | 0 (0.0%) | 0.0 |
| Bachelor's Degree | 0 (0.0%) | 0.0 |
| Graduate Degree | 0 (0.0%) | 0.0 |
| Total | 0 (0.0%) | 0.0 |
Fertility by Education by Marriage Status in Idaville
| Educational Attainment | Married | Unmarried |
| Less than High School | 0 (0.0%) | 0 (0.0%) |
| High School Diploma | 0 (0.0%) | 0 (0.0%) |
| College or Associate's Degree | 0 (0.0%) | 0 (0.0%) |
| Bachelor's Degree | 0 (0.0%) | 0 (0.0%) |
| Graduate Degree | 0 (0.0%) | 0 (0.0%) |
| Total | 0 (0.0%) | 0 (0.0%) |
Employment Characteristics in Idaville
Employment by Class of Employer in Idaville
Among the 77 employed individuals in Idaville, private company employees (68 | 88.3%), self-employed (not incorporated) (6 | 7.8%), and self-employed (incorporated) (3 | 3.9%) make up the most common classes of employment.
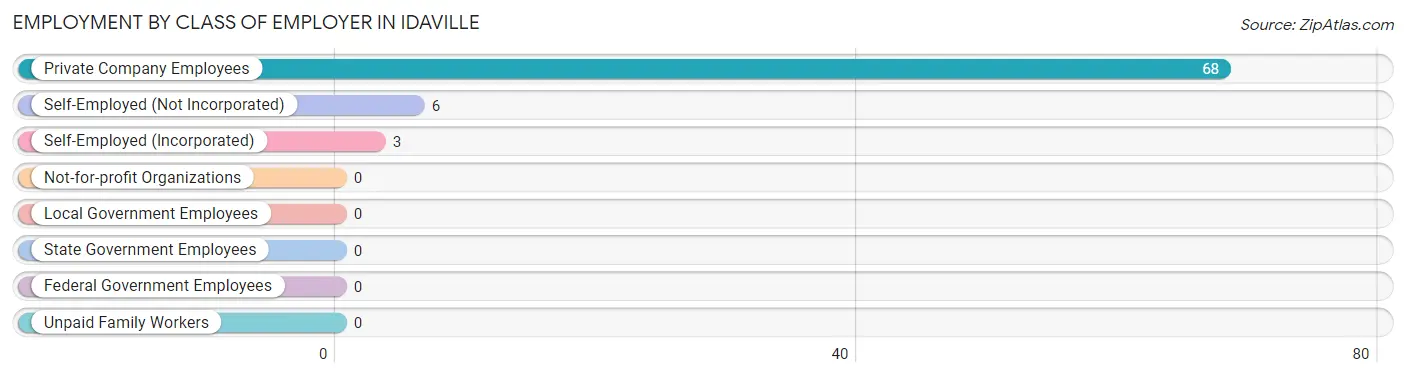
| Employer Class | # Employees | % Employees |
| Private Company Employees | 68 | 88.3% |
| Self-Employed (Incorporated) | 3 | 3.9% |
| Self-Employed (Not Incorporated) | 6 | 7.8% |
| Not-for-profit Organizations | 0 | 0.0% |
| Local Government Employees | 0 | 0.0% |
| State Government Employees | 0 | 0.0% |
| Federal Government Employees | 0 | 0.0% |
| Unpaid Family Workers | 0 | 0.0% |
| Total | 77 | 100.0% |
Employment Status by Age in Idaville
According to the labor force statistics for Idaville, out of the total population over 16 years of age (135), 62.2% or 84 individuals are in the labor force, with 4.8% or 4 of them unemployed. The age group with the highest labor force participation rate is 25 to 29 years, with 100.0% or 30 individuals in the labor force. Within the labor force, the 35 to 44 years age range has the highest percentage of unemployed individuals, with 16.7% or 4 of them being unemployed.
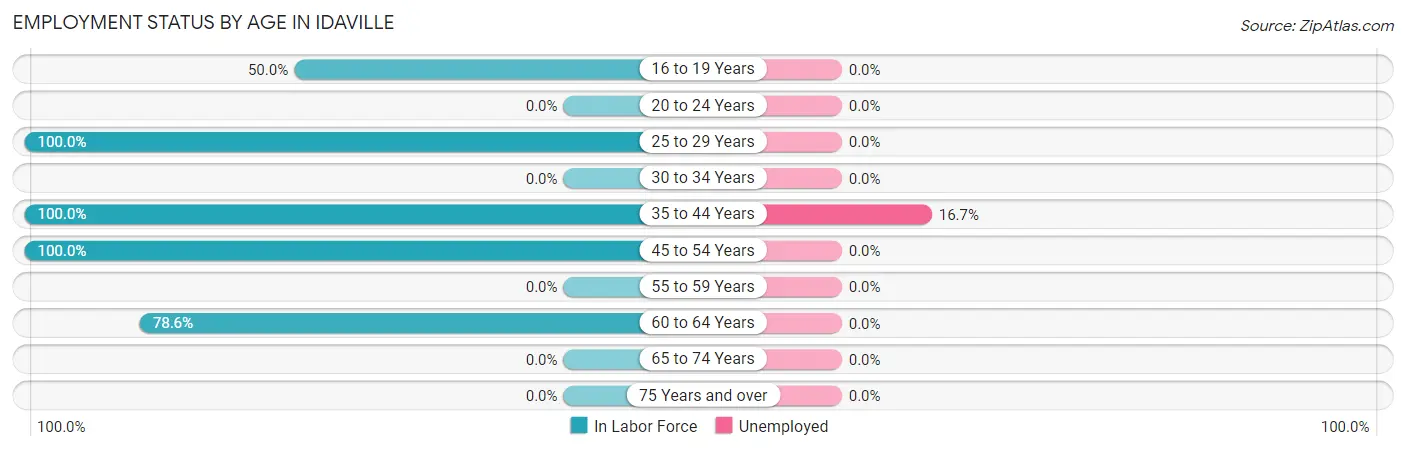
| Age Bracket | In Labor Force | Unemployed |
| 16 to 19 Years | 5 (50.0%) | 0 (0.0%) |
| 20 to 24 Years | 0 (0.0%) | 0 (0.0%) |
| 25 to 29 Years | 30 (100.0%) | 0 (0.0%) |
| 30 to 34 Years | 0 (0.0%) | 0 (0.0%) |
| 35 to 44 Years | 24 (100.0%) | 4 (16.7%) |
| 45 to 54 Years | 14 (100.0%) | 0 (0.0%) |
| 55 to 59 Years | 0 (0.0%) | 0 (0.0%) |
| 60 to 64 Years | 11 (78.6%) | 0 (0.0%) |
| 65 to 74 Years | 0 (0.0%) | 0 (0.0%) |
| 75 Years and over | 0 (0.0%) | 0 (0.0%) |
| Total | 84 (62.2%) | 4 (4.8%) |
Employment Status by Educational Attainment in Idaville
According to labor force statistics for Idaville, 86.8% of individuals (79) out of the total population between 25 and 64 years of age (91) are in the labor force, with 5.1% or 4 of them being unemployed. The group with the highest labor force participation rate are those with the educational attainment of less than high school, with 100.0% or 22 individuals in the labor force. Within the labor force, individuals with high school diploma education have the highest percentage of unemployment, with 8.9% or 4 of them being unemployed.
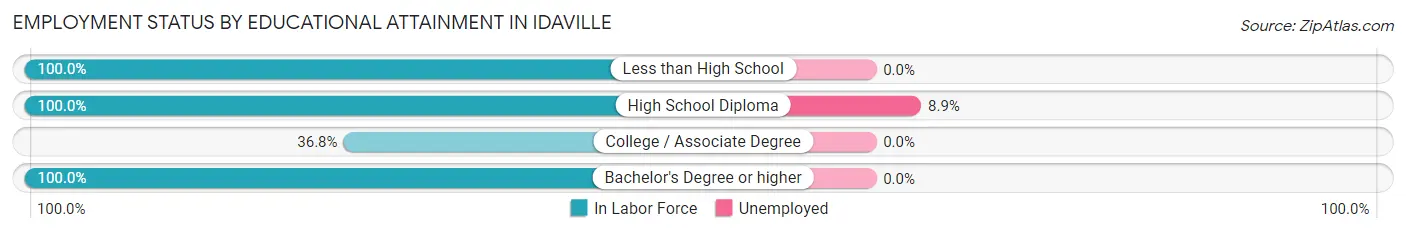
| Educational Attainment | In Labor Force | Unemployed |
| Less than High School | 22 (100.0%) | 0 (0.0%) |
| High School Diploma | 45 (100.0%) | 4 (8.9%) |
| College / Associate Degree | 7 (36.8%) | 0 (0.0%) |
| Bachelor's Degree or higher | 5 (100.0%) | 0 (0.0%) |
| Total | 79 (86.8%) | 5 (5.1%) |
Employment Occupations by Sex in Idaville
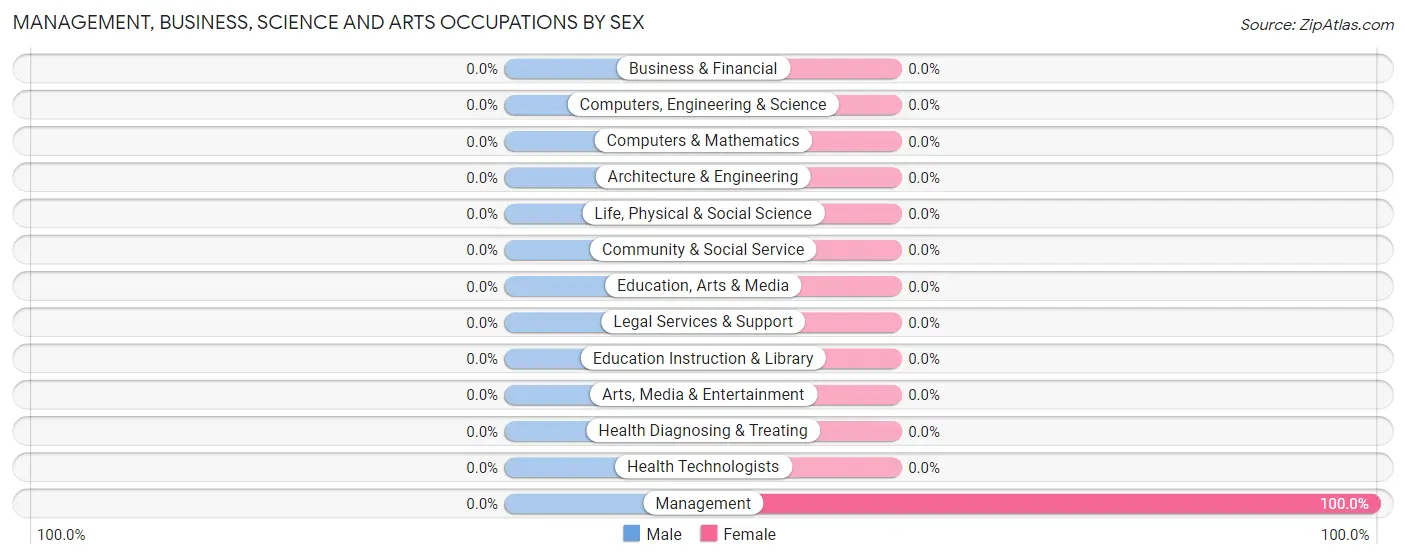
Management, Business, Science and Arts Occupations
The most common Management, Business, Science and Arts occupations in Idaville are , and Management (3 | 3.7%).
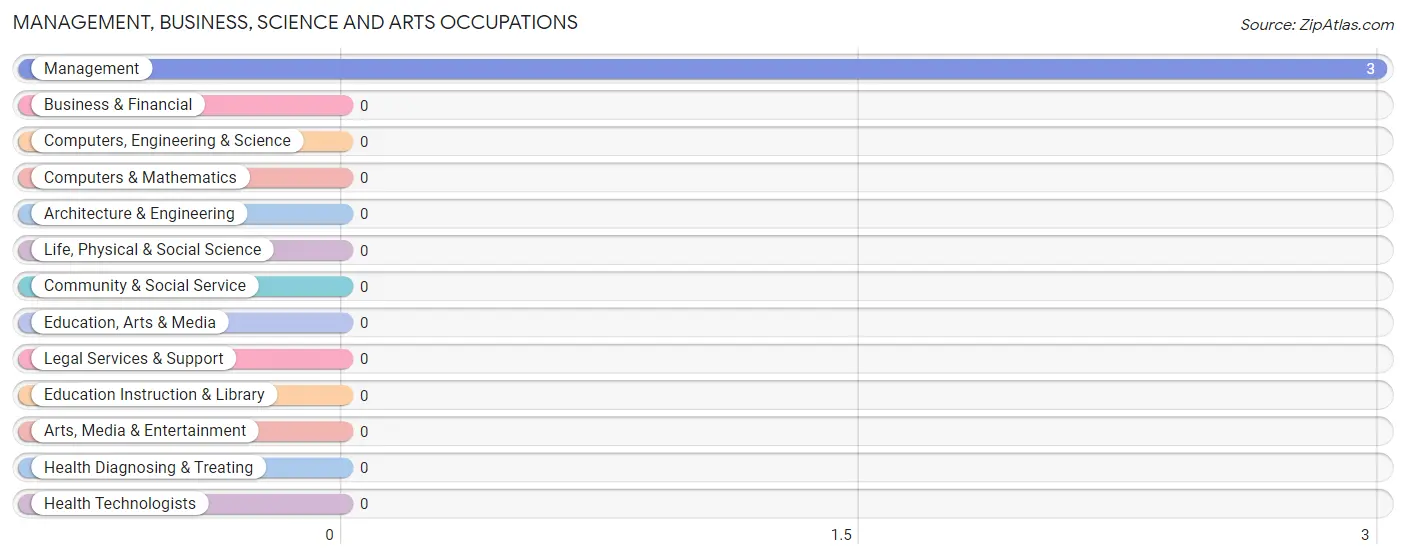
Management, Business, Science and Arts Occupations by Sex
| Occupation | Male | Female |
| Management | 0 (0.0%) | 3 (100.0%) |
| Business & Financial | 0 (0.0%) | 0 (0.0%) |
| Computers, Engineering & Science | 0 (0.0%) | 0 (0.0%) |
| Computers & Mathematics | 0 (0.0%) | 0 (0.0%) |
| Architecture & Engineering | 0 (0.0%) | 0 (0.0%) |
| Life, Physical & Social Science | 0 (0.0%) | 0 (0.0%) |
| Community & Social Service | 0 (0.0%) | 0 (0.0%) |
| Education, Arts & Media | 0 (0.0%) | 0 (0.0%) |
| Legal Services & Support | 0 (0.0%) | 0 (0.0%) |
| Education Instruction & Library | 0 (0.0%) | 0 (0.0%) |
| Arts, Media & Entertainment | 0 (0.0%) | 0 (0.0%) |
| Health Diagnosing & Treating | 0 (0.0%) | 0 (0.0%) |
| Health Technologists | 0 (0.0%) | 0 (0.0%) |
| Total (Category) | 0 (0.0%) | 3 (100.0%) |
| Total (Overall) | 43 (53.7%) | 37 (46.3%) |
Services Occupations
The most common Services occupations in Idaville are , and Cleaning & Maintenance (3 | 3.7%).
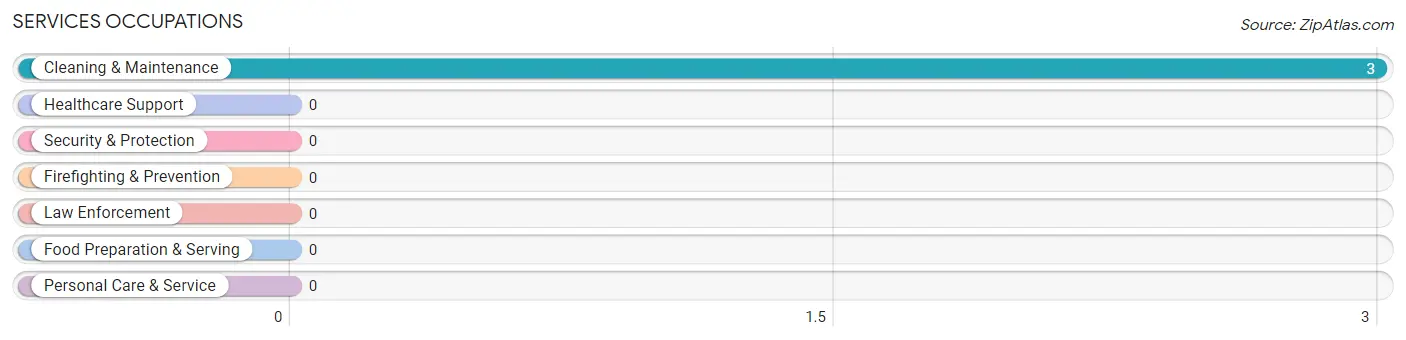
Services Occupations by Sex
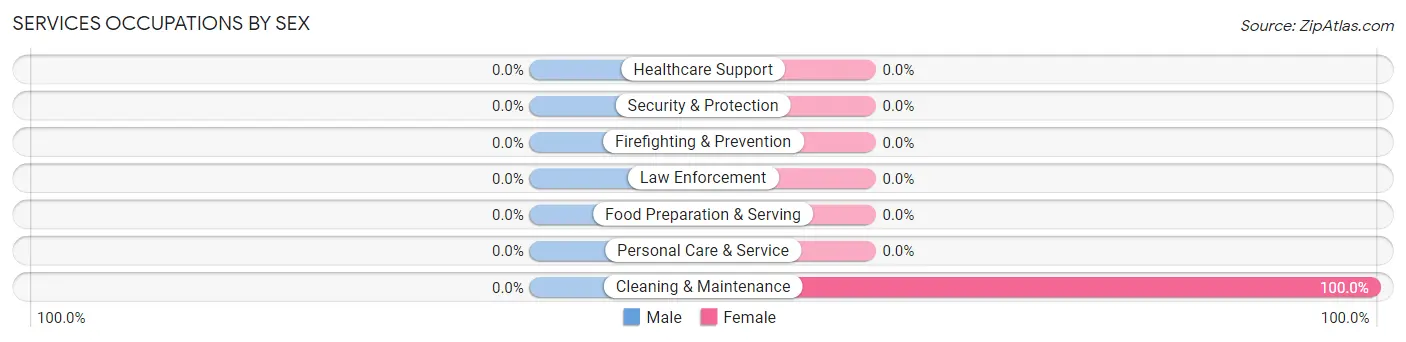
| Occupation | Male | Female |
| Healthcare Support | 0 (0.0%) | 0 (0.0%) |
| Security & Protection | 0 (0.0%) | 0 (0.0%) |
| Firefighting & Prevention | 0 (0.0%) | 0 (0.0%) |
| Law Enforcement | 0 (0.0%) | 0 (0.0%) |
| Food Preparation & Serving | 0 (0.0%) | 0 (0.0%) |
| Cleaning & Maintenance | 0 (0.0%) | 3 (100.0%) |
| Personal Care & Service | 0 (0.0%) | 0 (0.0%) |
| Total (Category) | 0 (0.0%) | 3 (100.0%) |
| Total (Overall) | 43 (53.7%) | 37 (46.3%) |
Sales and Office Occupations
The most common Sales and Office occupations in Idaville are Office & Administration (31 | 38.8%), and Sales & Related (5 | 6.2%).
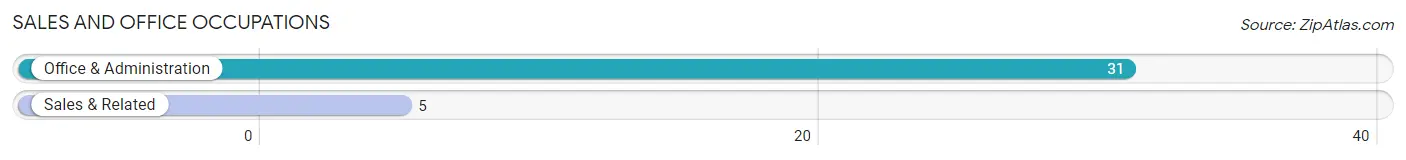
Sales and Office Occupations by Sex
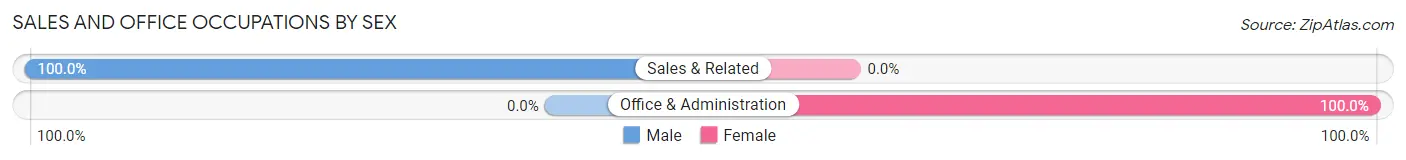
| Occupation | Male | Female |
| Sales & Related | 5 (100.0%) | 0 (0.0%) |
| Office & Administration | 0 (0.0%) | 31 (100.0%) |
| Total (Category) | 5 (13.9%) | 31 (86.1%) |
| Total (Overall) | 43 (53.7%) | 37 (46.3%) |
Natural Resources, Construction and Maintenance Occupations
The most common Natural Resources, Construction and Maintenance occupations in Idaville are Construction & Extraction (6 | 7.5%), and Installation, Maintenance & Repair (4 | 5.0%).
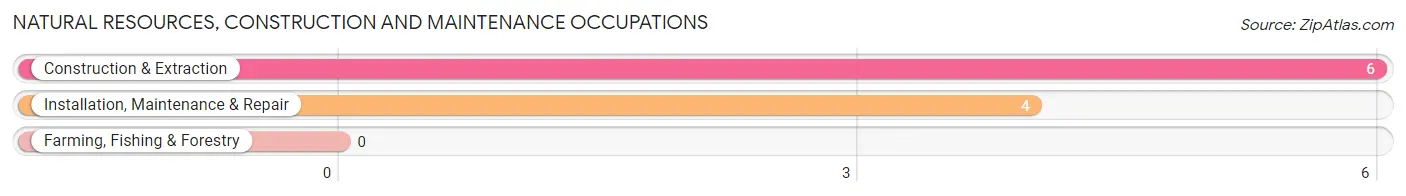
Natural Resources, Construction and Maintenance Occupations by Sex
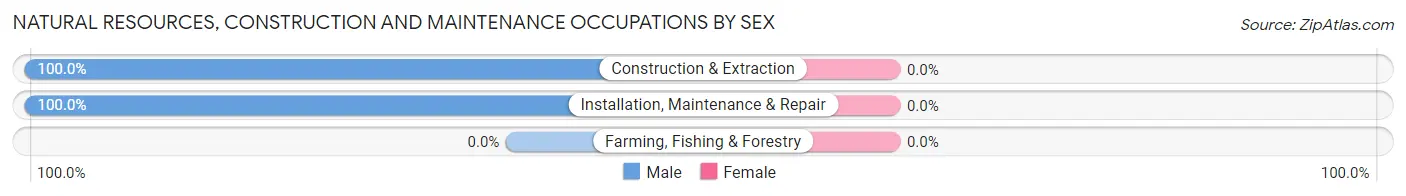
| Occupation | Male | Female |
| Farming, Fishing & Forestry | 0 (0.0%) | 0 (0.0%) |
| Construction & Extraction | 6 (100.0%) | 0 (0.0%) |
| Installation, Maintenance & Repair | 4 (100.0%) | 0 (0.0%) |
| Total (Category) | 10 (100.0%) | 0 (0.0%) |
| Total (Overall) | 43 (53.7%) | 37 (46.3%) |
Production, Transportation and Moving Occupations
The most common Production, Transportation and Moving occupations in Idaville are Transportation (16 | 20.0%), and Production (12 | 15.0%).
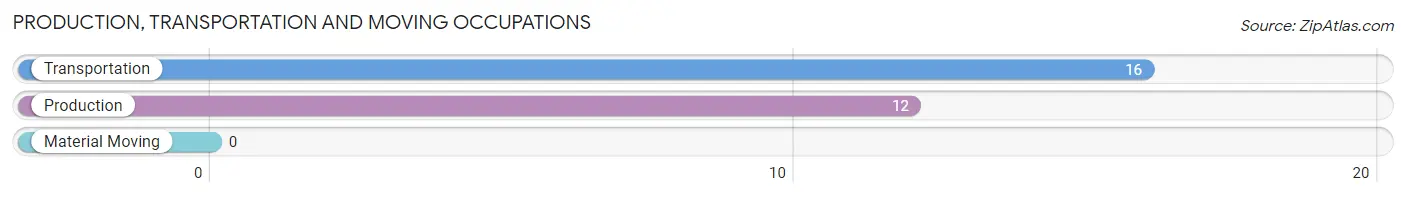
Production, Transportation and Moving Occupations by Sex
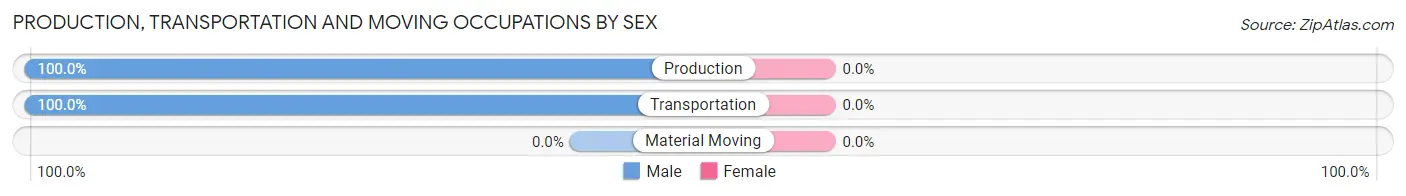
| Occupation | Male | Female |
| Production | 12 (100.0%) | 0 (0.0%) |
| Transportation | 16 (100.0%) | 0 (0.0%) |
| Material Moving | 0 (0.0%) | 0 (0.0%) |
| Total (Category) | 28 (100.0%) | 0 (0.0%) |
| Total (Overall) | 43 (53.7%) | 37 (46.3%) |
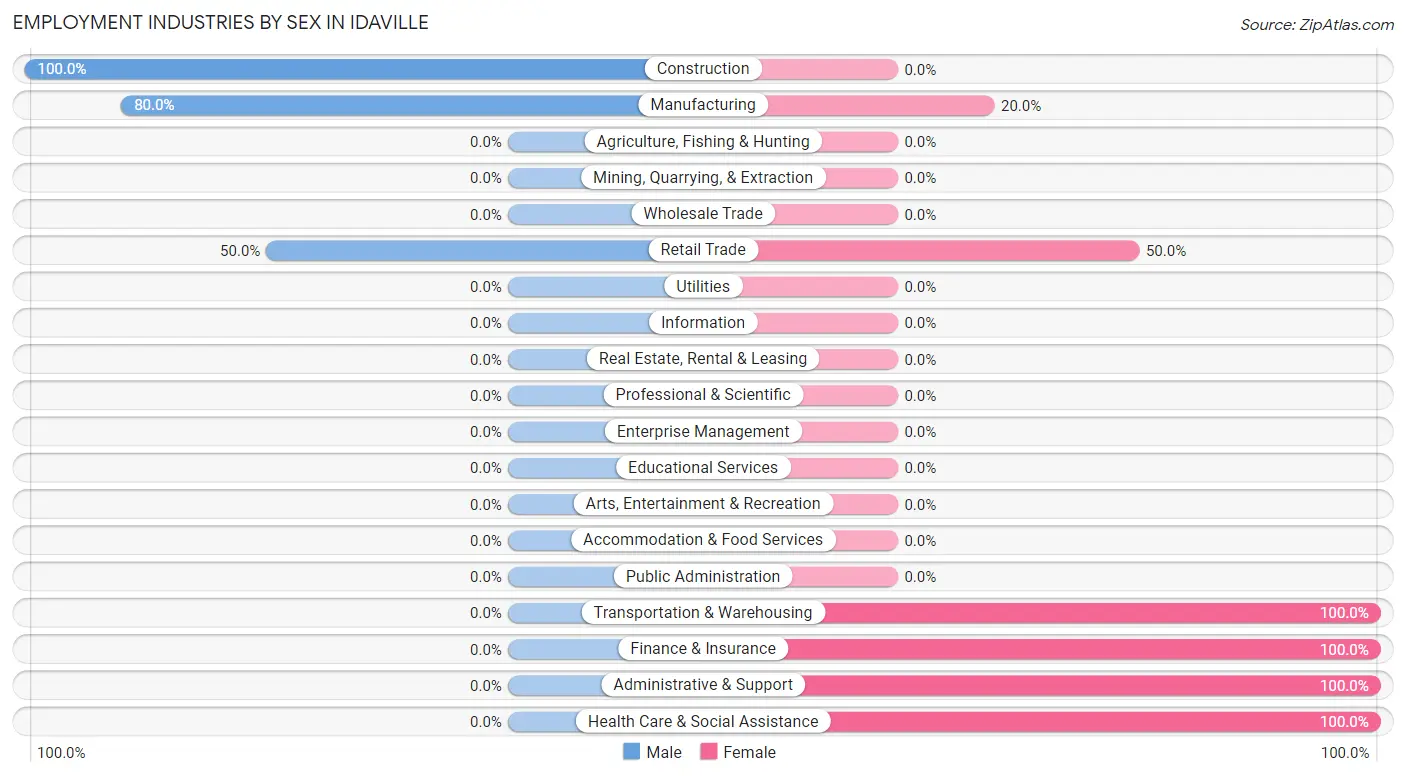
Employment Industries by Sex in Idaville
Employment Industries in Idaville
The major employment industries in Idaville include Manufacturing (40 | 50.0%), Transportation & Warehousing (14 | 17.5%), Retail Trade (10 | 12.5%), Construction (6 | 7.5%), and Finance & Insurance (4 | 5.0%).
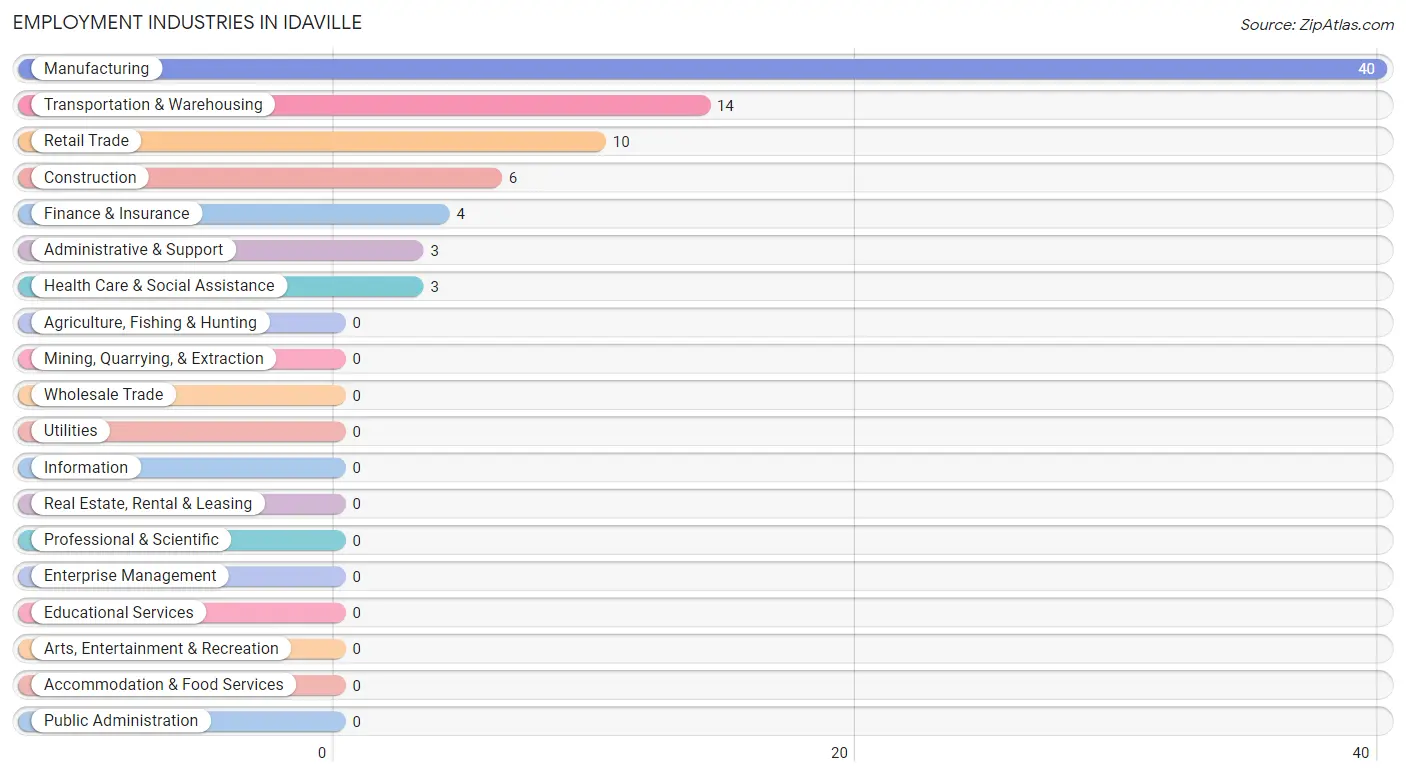
Employment Industries by Sex in Idaville
The Idaville industries that see more men than women are Construction (100.0%), Manufacturing (80.0%), and Retail Trade (50.0%), whereas the industries that tend to have a higher number of women are Transportation & Warehousing (100.0%), Finance & Insurance (100.0%), and Administrative & Support (100.0%).
| Industry | Male | Female |
| Agriculture, Fishing & Hunting | 0 (0.0%) | 0 (0.0%) |
| Mining, Quarrying, & Extraction | 0 (0.0%) | 0 (0.0%) |
| Construction | 6 (100.0%) | 0 (0.0%) |
| Manufacturing | 32 (80.0%) | 8 (20.0%) |
| Wholesale Trade | 0 (0.0%) | 0 (0.0%) |
| Retail Trade | 5 (50.0%) | 5 (50.0%) |
| Transportation & Warehousing | 0 (0.0%) | 14 (100.0%) |
| Utilities | 0 (0.0%) | 0 (0.0%) |
| Information | 0 (0.0%) | 0 (0.0%) |
| Finance & Insurance | 0 (0.0%) | 4 (100.0%) |
| Real Estate, Rental & Leasing | 0 (0.0%) | 0 (0.0%) |
| Professional & Scientific | 0 (0.0%) | 0 (0.0%) |
| Enterprise Management | 0 (0.0%) | 0 (0.0%) |
| Administrative & Support | 0 (0.0%) | 3 (100.0%) |
| Educational Services | 0 (0.0%) | 0 (0.0%) |
| Health Care & Social Assistance | 0 (0.0%) | 3 (100.0%) |
| Arts, Entertainment & Recreation | 0 (0.0%) | 0 (0.0%) |
| Accommodation & Food Services | 0 (0.0%) | 0 (0.0%) |
| Public Administration | 0 (0.0%) | 0 (0.0%) |
| Total | 43 (53.7%) | 37 (46.3%) |
Education in Idaville
School Enrollment in Idaville
The most common levels of schooling among the 29 students in Idaville are elementary school (10 | 34.5%), middle school (9 | 31.0%), and high school (5 | 17.2%).
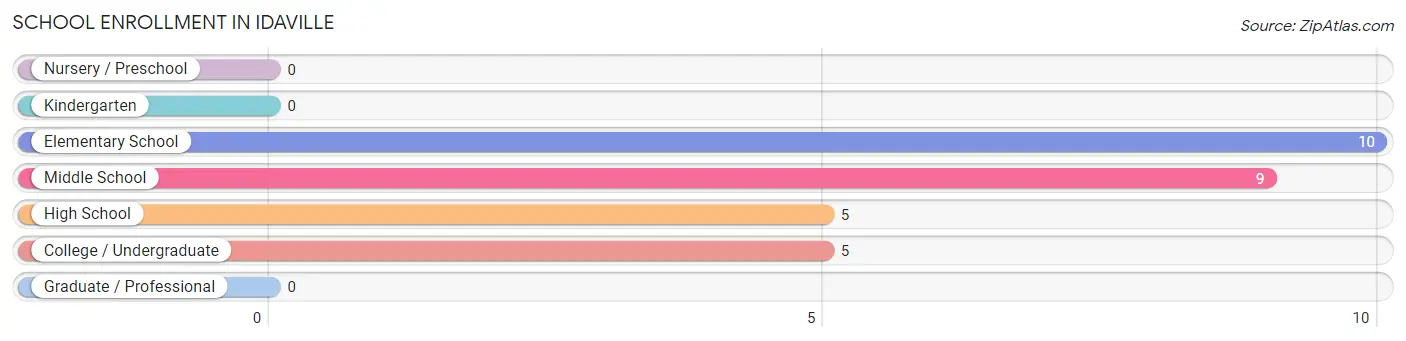
| School Level | # Students | % Students |
| Nursery / Preschool | 0 | 0.0% |
| Kindergarten | 0 | 0.0% |
| Elementary School | 10 | 34.5% |
| Middle School | 9 | 31.0% |
| High School | 5 | 17.2% |
| College / Undergraduate | 5 | 17.2% |
| Graduate / Professional | 0 | 0.0% |
| Total | 29 | 100.0% |
School Enrollment by Age by Funding Source in Idaville
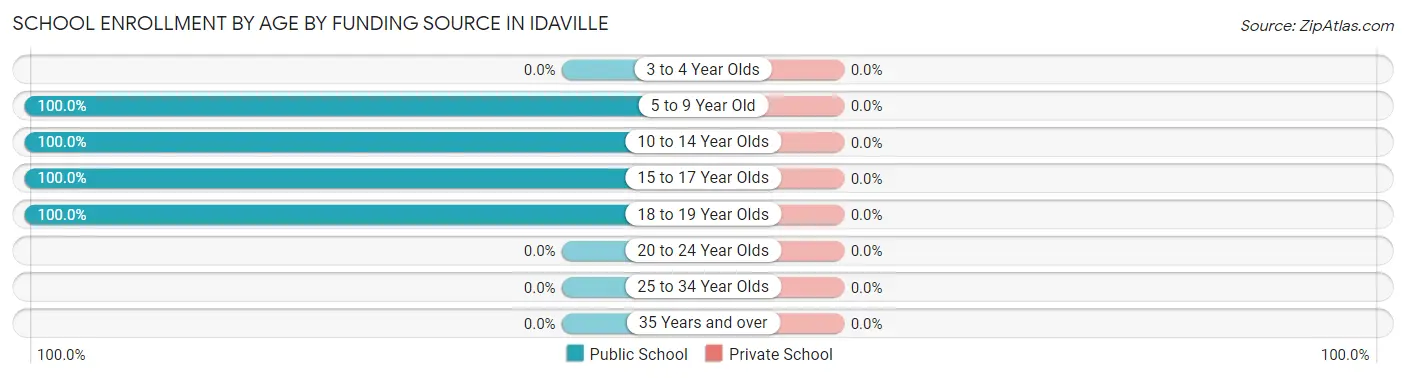
| Age Bracket | Public School | Private School |
| 3 to 4 Year Olds | 0 (0.0%) | 0 (0.0%) |
| 5 to 9 Year Old | 10 (100.0%) | 0 (0.0%) |
| 10 to 14 Year Olds | 9 (100.0%) | 0 (0.0%) |
| 15 to 17 Year Olds | 5 (100.0%) | 0 (0.0%) |
| 18 to 19 Year Olds | 5 (100.0%) | 0 (0.0%) |
| 20 to 24 Year Olds | 0 (0.0%) | 0 (0.0%) |
| 25 to 34 Year Olds | 0 (0.0%) | 0 (0.0%) |
| 35 Years and over | 0 (0.0%) | 0 (0.0%) |
| Total | 29 (100.0%) | 0 (0.0%) |
Educational Attainment by Field of Study in Idaville
Education (6 | 30.0%), social sciences (3 | 15.0%), literature & languages (3 | 15.0%), visual & performing arts (3 | 15.0%), and arts & humanities (3 | 15.0%) are the most common fields of study among 20 individuals in Idaville who have obtained a bachelor's degree or higher.
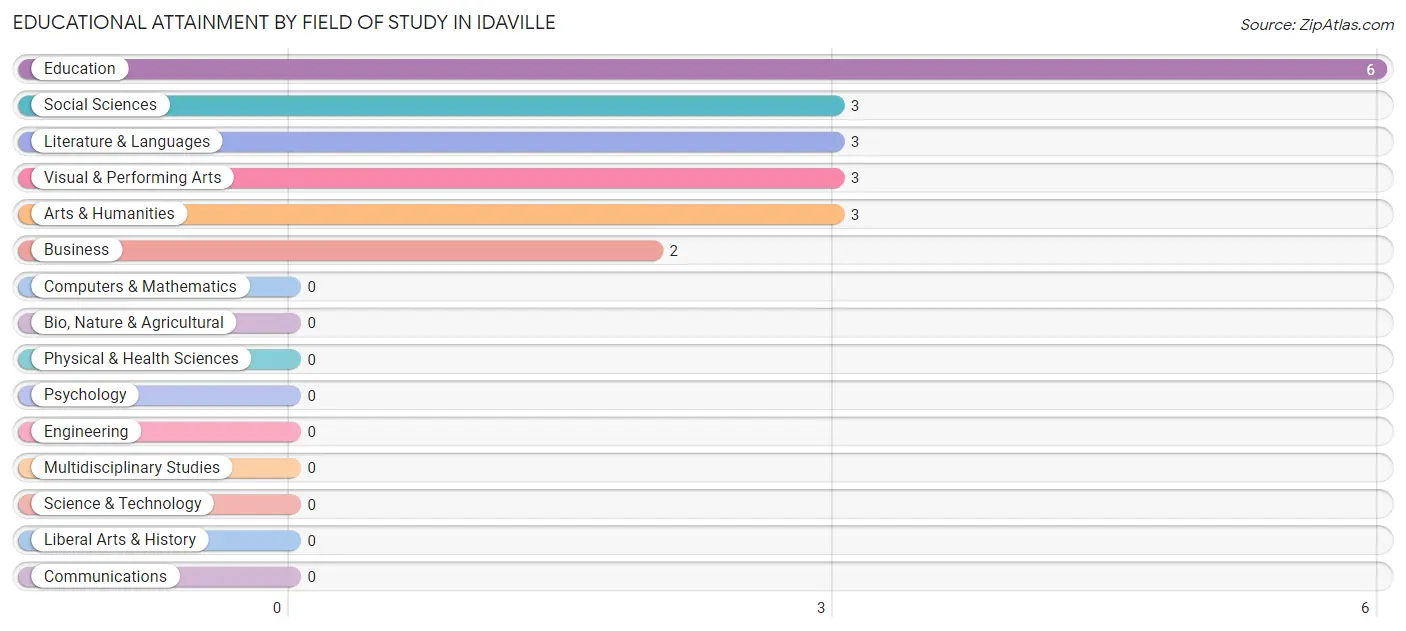
| Field of Study | # Graduates | % Graduates |
| Computers & Mathematics | 0 | 0.0% |
| Bio, Nature & Agricultural | 0 | 0.0% |
| Physical & Health Sciences | 0 | 0.0% |
| Psychology | 0 | 0.0% |
| Social Sciences | 3 | 15.0% |
| Engineering | 0 | 0.0% |
| Multidisciplinary Studies | 0 | 0.0% |
| Science & Technology | 0 | 0.0% |
| Business | 2 | 10.0% |
| Education | 6 | 30.0% |
| Literature & Languages | 3 | 15.0% |
| Liberal Arts & History | 0 | 0.0% |
| Visual & Performing Arts | 3 | 15.0% |
| Communications | 0 | 0.0% |
| Arts & Humanities | 3 | 15.0% |
| Total | 20 | 100.0% |
Transportation & Commute in Idaville
Vehicle Availability by Sex in Idaville
The most prevalent vehicle ownership categories in Idaville are males with 2 vehicles (17, accounting for 39.5%) and females with 2 vehicles (2, making up 50.0%).
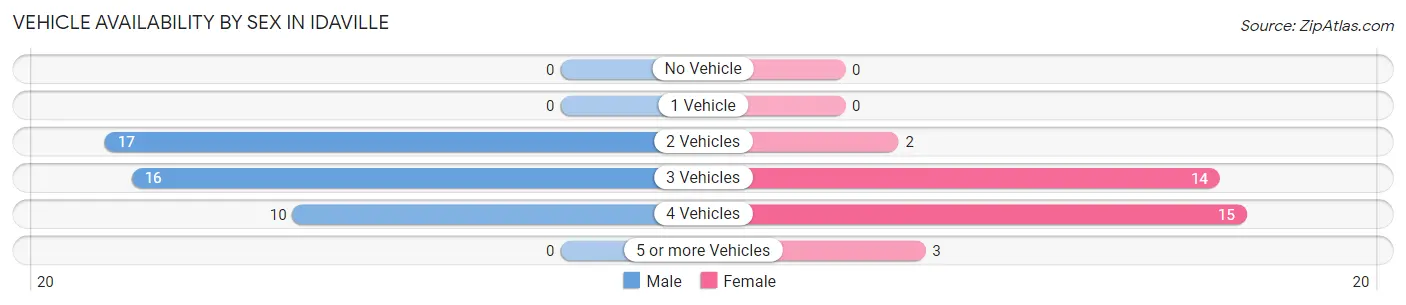
| Vehicles Available | Male | Female |
| No Vehicle | 0 (0.0%) | 0 (0.0%) |
| 1 Vehicle | 0 (0.0%) | 0 (0.0%) |
| 2 Vehicles | 17 (39.5%) | 2 (5.9%) |
| 3 Vehicles | 16 (37.2%) | 14 (41.2%) |
| 4 Vehicles | 10 (23.3%) | 15 (44.1%) |
| 5 or more Vehicles | 0 (0.0%) | 3 (8.8%) |
| Total | 43 (100.0%) | 34 (100.0%) |
Commute Time in Idaville
The most frequently occuring commute durations in Idaville are 5 to 9 minutes (27 commuters, 35.1%), 20 to 24 minutes (14 commuters, 18.2%), and 10 to 14 minutes (11 commuters, 14.3%).
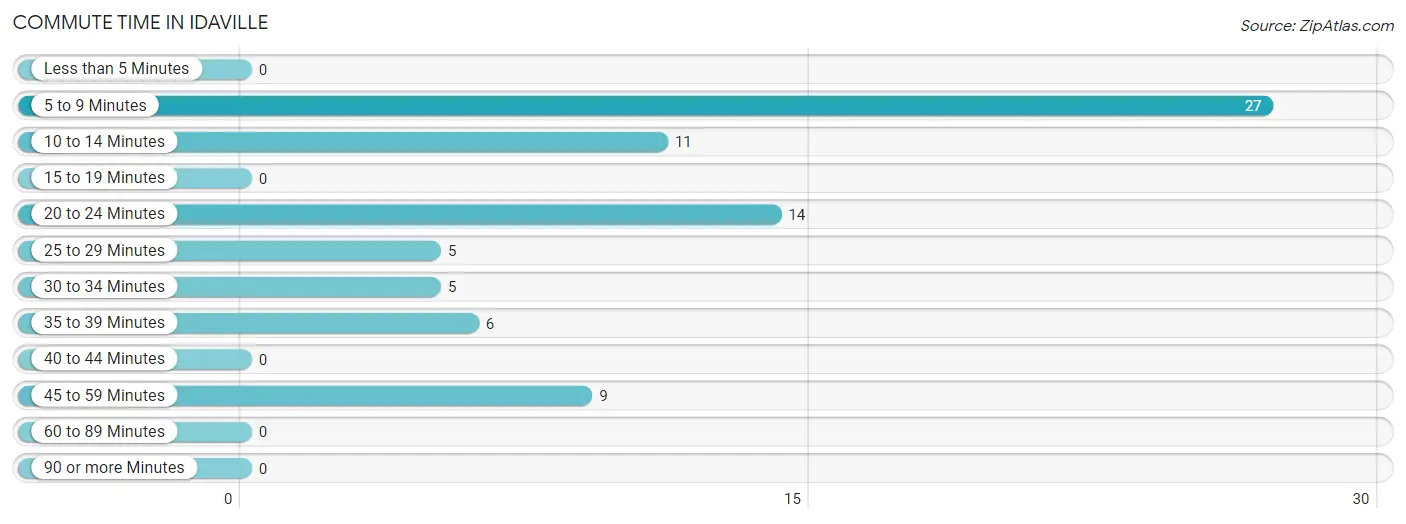
| Commute Time | # Commuters | % Commuters |
| Less than 5 Minutes | 0 | 0.0% |
| 5 to 9 Minutes | 27 | 35.1% |
| 10 to 14 Minutes | 11 | 14.3% |
| 15 to 19 Minutes | 0 | 0.0% |
| 20 to 24 Minutes | 14 | 18.2% |
| 25 to 29 Minutes | 5 | 6.5% |
| 30 to 34 Minutes | 5 | 6.5% |
| 35 to 39 Minutes | 6 | 7.8% |
| 40 to 44 Minutes | 0 | 0.0% |
| 45 to 59 Minutes | 9 | 11.7% |
| 60 to 89 Minutes | 0 | 0.0% |
| 90 or more Minutes | 0 | 0.0% |
Commute Time by Sex in Idaville
The most common commute times in Idaville are 5 to 9 minutes (23 commuters, 53.5%) for males and 20 to 24 minutes (14 commuters, 41.2%) for females.
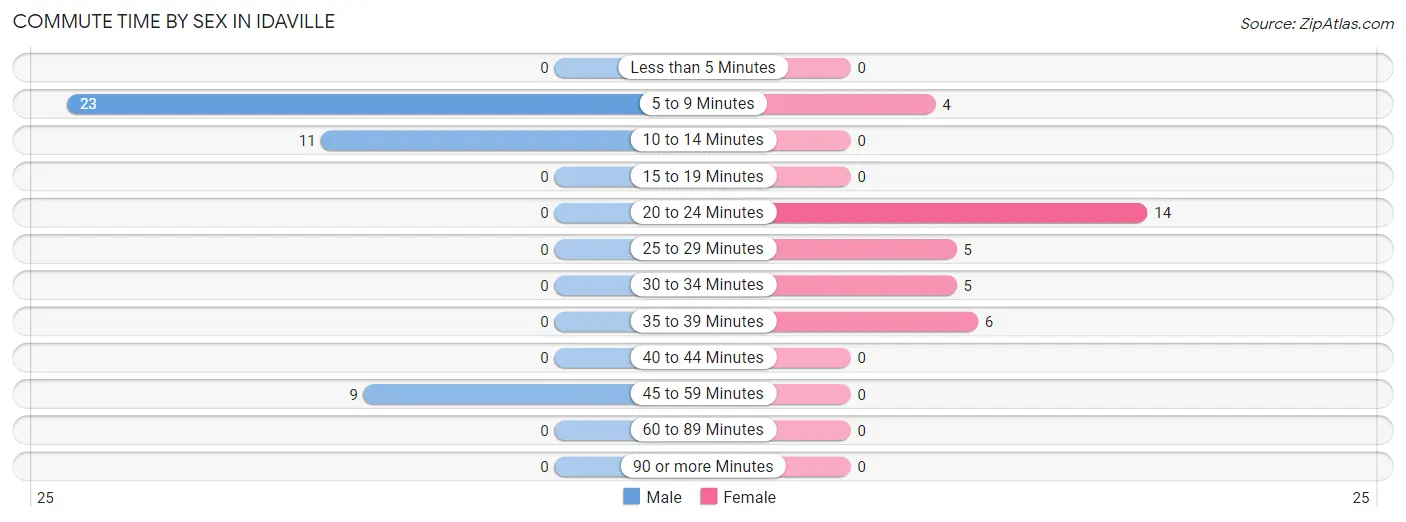
| Commute Time | Male | Female |
| Less than 5 Minutes | 0 (0.0%) | 0 (0.0%) |
| 5 to 9 Minutes | 23 (53.5%) | 4 (11.8%) |
| 10 to 14 Minutes | 11 (25.6%) | 0 (0.0%) |
| 15 to 19 Minutes | 0 (0.0%) | 0 (0.0%) |
| 20 to 24 Minutes | 0 (0.0%) | 14 (41.2%) |
| 25 to 29 Minutes | 0 (0.0%) | 5 (14.7%) |
| 30 to 34 Minutes | 0 (0.0%) | 5 (14.7%) |
| 35 to 39 Minutes | 0 (0.0%) | 6 (17.6%) |
| 40 to 44 Minutes | 0 (0.0%) | 0 (0.0%) |
| 45 to 59 Minutes | 9 (20.9%) | 0 (0.0%) |
| 60 to 89 Minutes | 0 (0.0%) | 0 (0.0%) |
| 90 or more Minutes | 0 (0.0%) | 0 (0.0%) |
Time of Departure to Work by Sex in Idaville
The most frequent times of departure to work in Idaville are 6:30 AM to 6:59 AM (24, 55.8%) for males and 6:30 AM to 6:59 AM (20, 58.8%) for females.
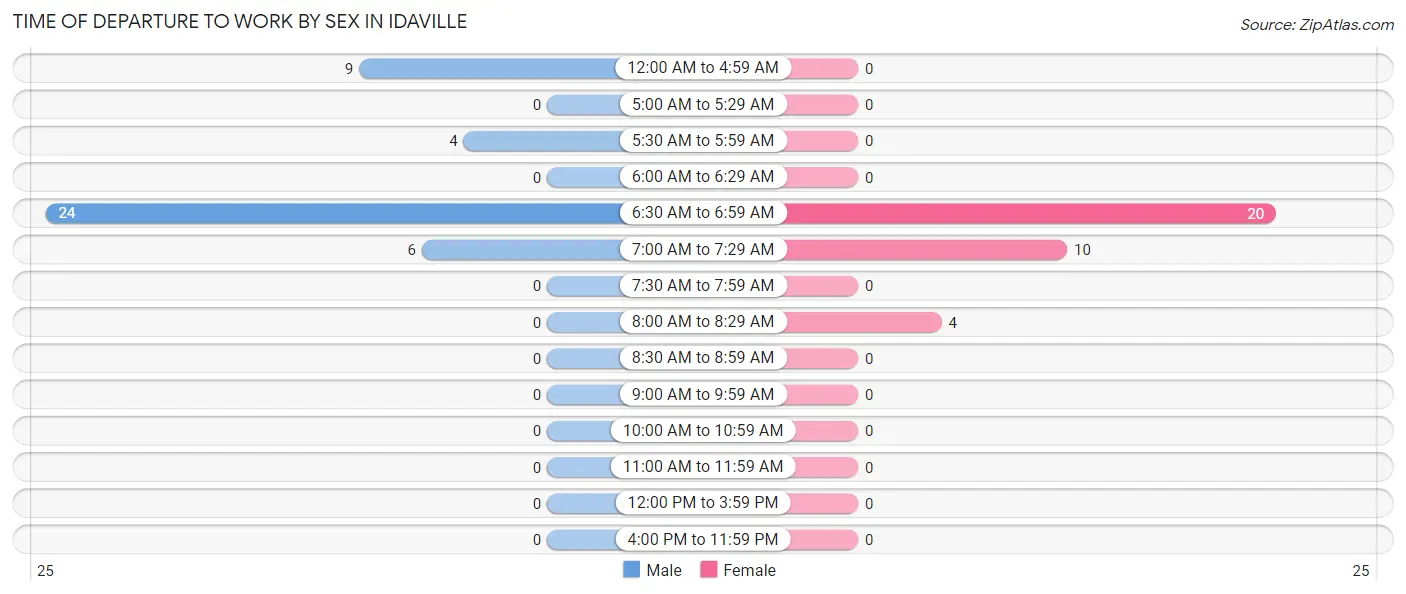
| Time of Departure | Male | Female |
| 12:00 AM to 4:59 AM | 9 (20.9%) | 0 (0.0%) |
| 5:00 AM to 5:29 AM | 0 (0.0%) | 0 (0.0%) |
| 5:30 AM to 5:59 AM | 4 (9.3%) | 0 (0.0%) |
| 6:00 AM to 6:29 AM | 0 (0.0%) | 0 (0.0%) |
| 6:30 AM to 6:59 AM | 24 (55.8%) | 20 (58.8%) |
| 7:00 AM to 7:29 AM | 6 (14.0%) | 10 (29.4%) |
| 7:30 AM to 7:59 AM | 0 (0.0%) | 0 (0.0%) |
| 8:00 AM to 8:29 AM | 0 (0.0%) | 4 (11.8%) |
| 8:30 AM to 8:59 AM | 0 (0.0%) | 0 (0.0%) |
| 9:00 AM to 9:59 AM | 0 (0.0%) | 0 (0.0%) |
| 10:00 AM to 10:59 AM | 0 (0.0%) | 0 (0.0%) |
| 11:00 AM to 11:59 AM | 0 (0.0%) | 0 (0.0%) |
| 12:00 PM to 3:59 PM | 0 (0.0%) | 0 (0.0%) |
| 4:00 PM to 11:59 PM | 0 (0.0%) | 0 (0.0%) |
| Total | 43 (100.0%) | 34 (100.0%) |
Housing Occupancy in Idaville
Occupancy by Ownership in Idaville
Of the total 67 dwellings in Idaville, owner-occupied units account for 53 (79.1%), while renter-occupied units make up 14 (20.9%).
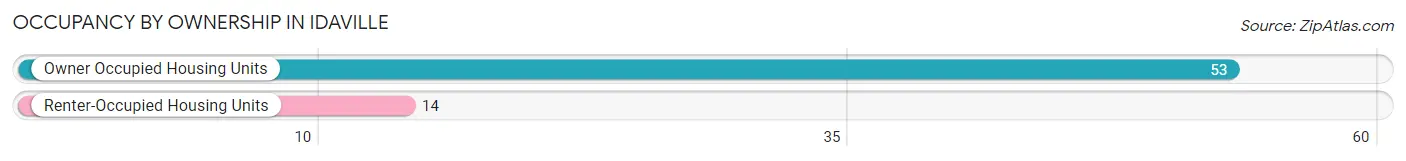
| Occupancy | # Housing Units | % Housing Units |
| Owner Occupied Housing Units | 53 | 79.1% |
| Renter-Occupied Housing Units | 14 | 20.9% |
| Total Occupied Housing Units | 67 | 100.0% |
Occupancy by Household Size in Idaville
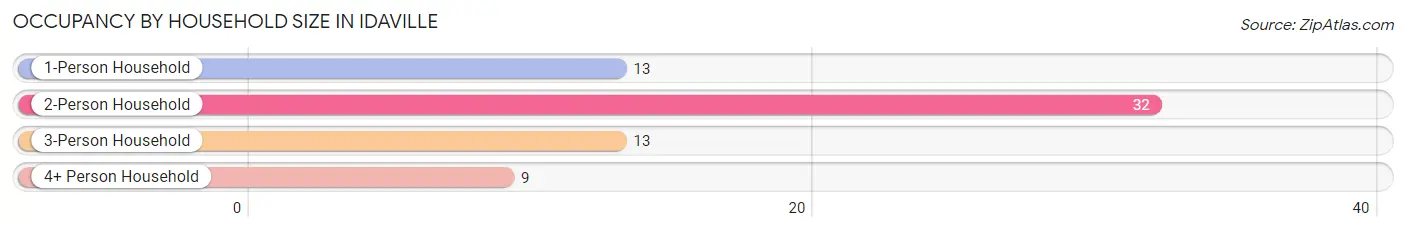
| Household Size | # Housing Units | % Housing Units |
| 1-Person Household | 13 | 19.4% |
| 2-Person Household | 32 | 47.8% |
| 3-Person Household | 13 | 19.4% |
| 4+ Person Household | 9 | 13.4% |
| Total Housing Units | 67 | 100.0% |
Occupancy by Ownership by Household Size in Idaville
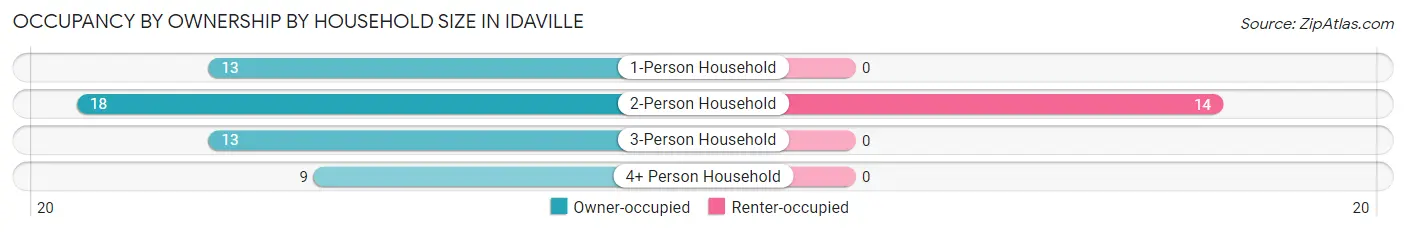
| Household Size | Owner-occupied | Renter-occupied |
| 1-Person Household | 13 (100.0%) | 0 (0.0%) |
| 2-Person Household | 18 (56.2%) | 14 (43.8%) |
| 3-Person Household | 13 (100.0%) | 0 (0.0%) |
| 4+ Person Household | 9 (100.0%) | 0 (0.0%) |
| Total Housing Units | 53 (79.1%) | 14 (20.9%) |
Occupancy by Educational Attainment in Idaville
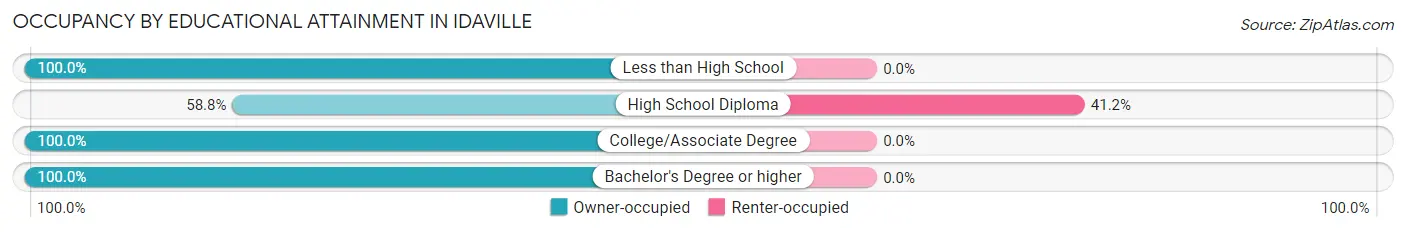
| Household Size | Owner-occupied | Renter-occupied |
| Less than High School | 6 (100.0%) | 0 (0.0%) |
| High School Diploma | 20 (58.8%) | 14 (41.2%) |
| College/Associate Degree | 16 (100.0%) | 0 (0.0%) |
| Bachelor's Degree or higher | 11 (100.0%) | 0 (0.0%) |
Occupancy by Age of Householder in Idaville
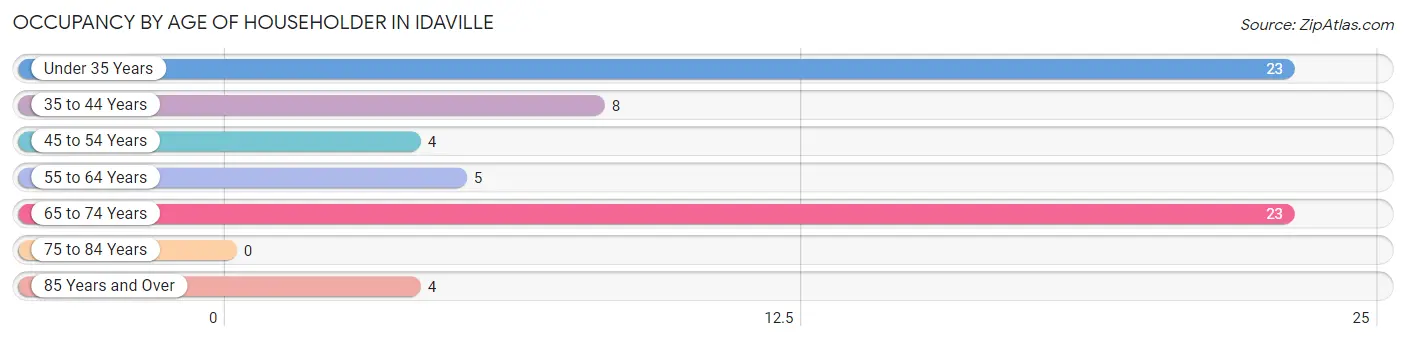
| Age Bracket | # Households | % Households |
| Under 35 Years | 23 | 34.3% |
| 35 to 44 Years | 8 | 11.9% |
| 45 to 54 Years | 4 | 6.0% |
| 55 to 64 Years | 5 | 7.5% |
| 65 to 74 Years | 23 | 34.3% |
| 75 to 84 Years | 0 | 0.0% |
| 85 Years and Over | 4 | 6.0% |
| Total | 67 | 100.0% |
Housing Finances in Idaville
Median Income by Occupancy in Idaville
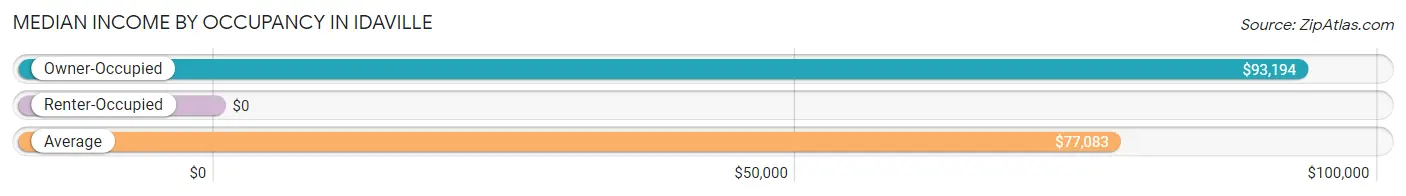
| Occupancy Type | # Households | Median Income |
| Owner-Occupied | 53 (79.1%) | $93,194 |
| Renter-Occupied | 14 (20.9%) | $0 |
| Average | 67 (100.0%) | $77,083 |
Occupancy by Householder Income Bracket in Idaville
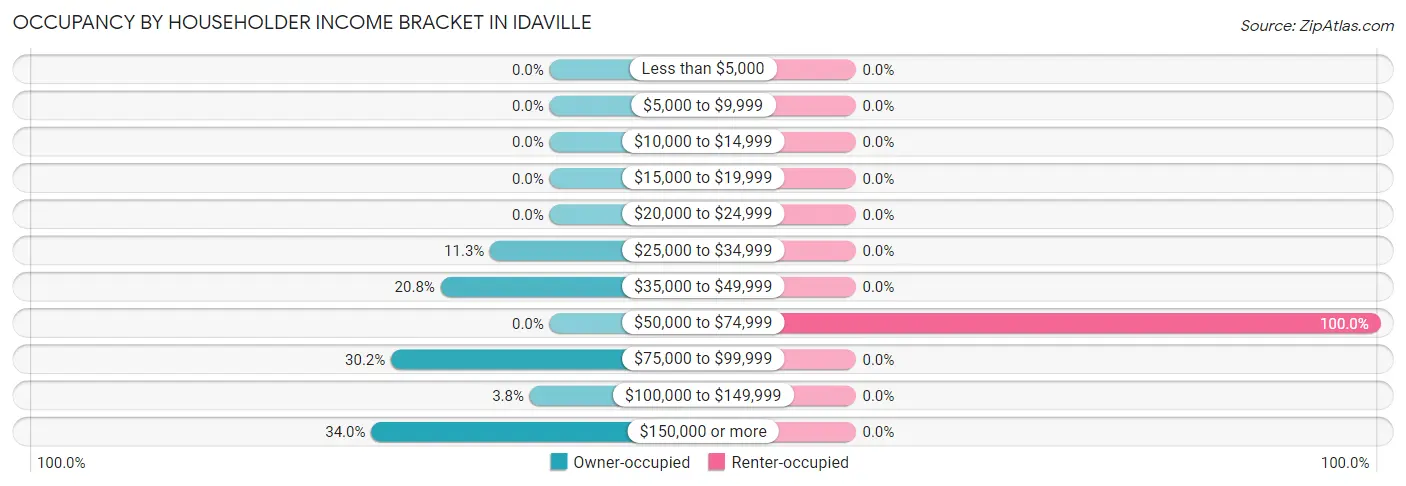
| Income Bracket | Owner-occupied | Renter-occupied |
| Less than $5,000 | 0 (0.0%) | 0 (0.0%) |
| $5,000 to $9,999 | 0 (0.0%) | 0 (0.0%) |
| $10,000 to $14,999 | 0 (0.0%) | 0 (0.0%) |
| $15,000 to $19,999 | 0 (0.0%) | 0 (0.0%) |
| $20,000 to $24,999 | 0 (0.0%) | 0 (0.0%) |
| $25,000 to $34,999 | 6 (11.3%) | 0 (0.0%) |
| $35,000 to $49,999 | 11 (20.7%) | 0 (0.0%) |
| $50,000 to $74,999 | 0 (0.0%) | 14 (100.0%) |
| $75,000 to $99,999 | 16 (30.2%) | 0 (0.0%) |
| $100,000 to $149,999 | 2 (3.8%) | 0 (0.0%) |
| $150,000 or more | 18 (34.0%) | 0 (0.0%) |
| Total | 53 (100.0%) | 14 (100.0%) |
Monthly Housing Cost Tiers in Idaville
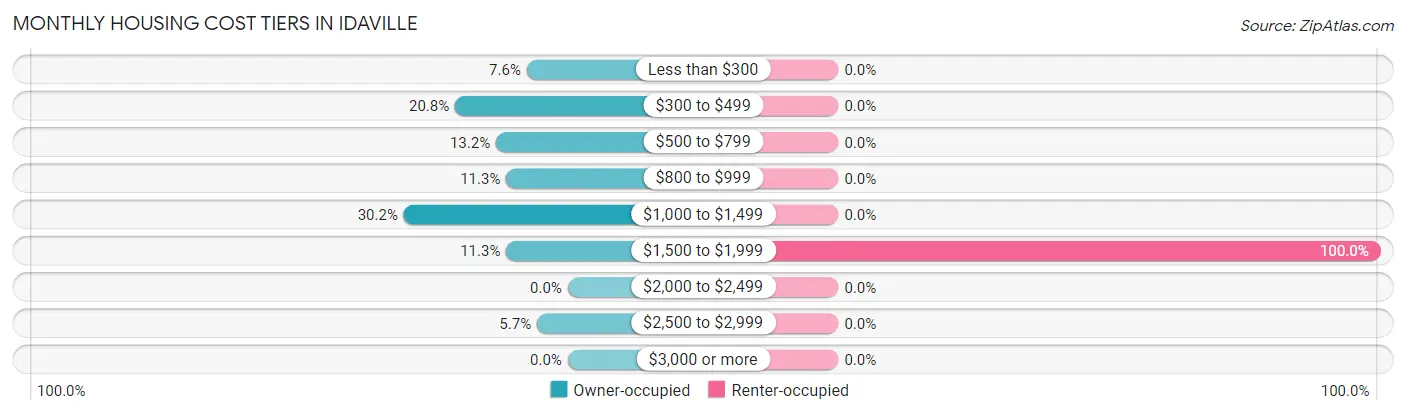
| Monthly Cost | Owner-occupied | Renter-occupied |
| Less than $300 | 4 (7.5%) | 0 (0.0%) |
| $300 to $499 | 11 (20.7%) | 0 (0.0%) |
| $500 to $799 | 7 (13.2%) | 0 (0.0%) |
| $800 to $999 | 6 (11.3%) | 0 (0.0%) |
| $1,000 to $1,499 | 16 (30.2%) | 0 (0.0%) |
| $1,500 to $1,999 | 6 (11.3%) | 14 (100.0%) |
| $2,000 to $2,499 | 0 (0.0%) | 0 (0.0%) |
| $2,500 to $2,999 | 3 (5.7%) | 0 (0.0%) |
| $3,000 or more | 0 (0.0%) | 0 (0.0%) |
| Total | 53 (100.0%) | 14 (100.0%) |
Physical Housing Characteristics in Idaville
Housing Structures in Idaville
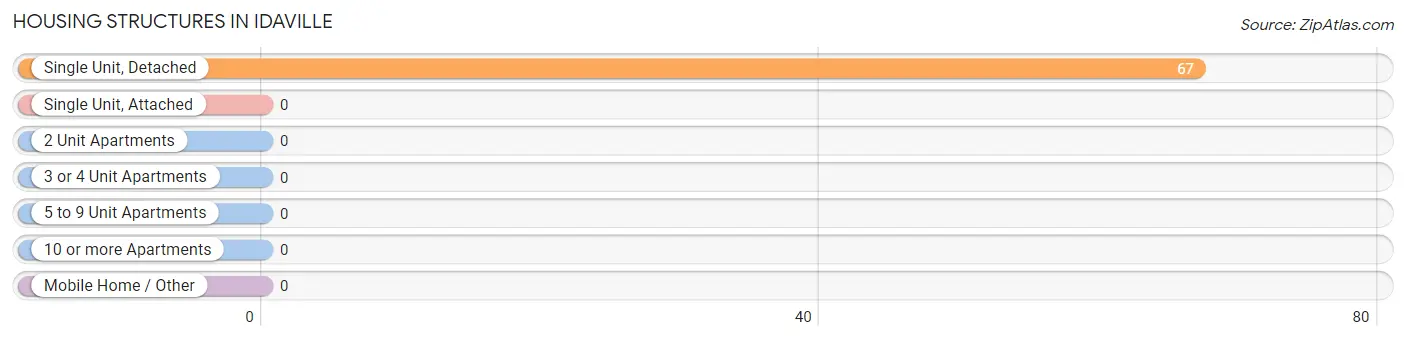
| Structure Type | # Housing Units | % Housing Units |
| Single Unit, Detached | 67 | 100.0% |
| Single Unit, Attached | 0 | 0.0% |
| 2 Unit Apartments | 0 | 0.0% |
| 3 or 4 Unit Apartments | 0 | 0.0% |
| 5 to 9 Unit Apartments | 0 | 0.0% |
| 10 or more Apartments | 0 | 0.0% |
| Mobile Home / Other | 0 | 0.0% |
| Total | 67 | 100.0% |
Housing Structures by Occupancy in Idaville
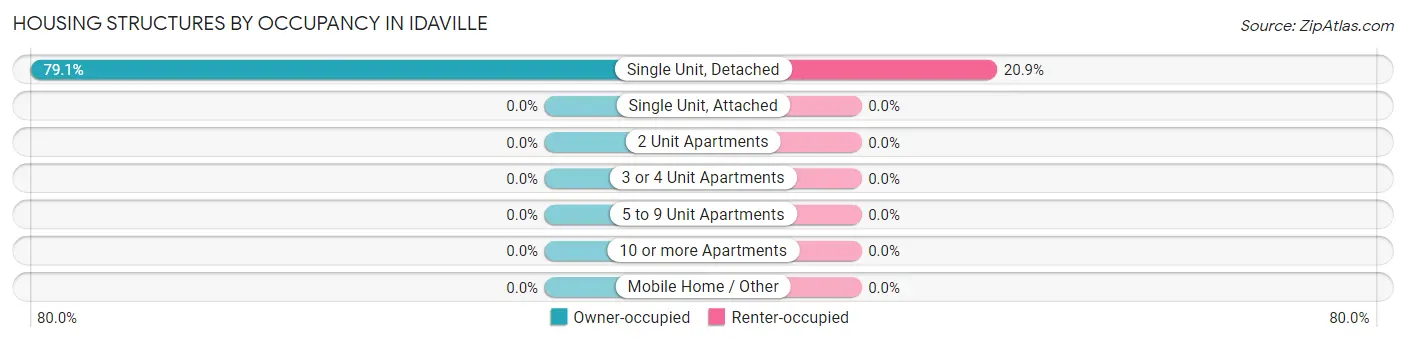
| Structure Type | Owner-occupied | Renter-occupied |
| Single Unit, Detached | 53 (79.1%) | 14 (20.9%) |
| Single Unit, Attached | 0 (0.0%) | 0 (0.0%) |
| 2 Unit Apartments | 0 (0.0%) | 0 (0.0%) |
| 3 or 4 Unit Apartments | 0 (0.0%) | 0 (0.0%) |
| 5 to 9 Unit Apartments | 0 (0.0%) | 0 (0.0%) |
| 10 or more Apartments | 0 (0.0%) | 0 (0.0%) |
| Mobile Home / Other | 0 (0.0%) | 0 (0.0%) |
| Total | 53 (79.1%) | 14 (20.9%) |
Housing Structures by Number of Rooms in Idaville
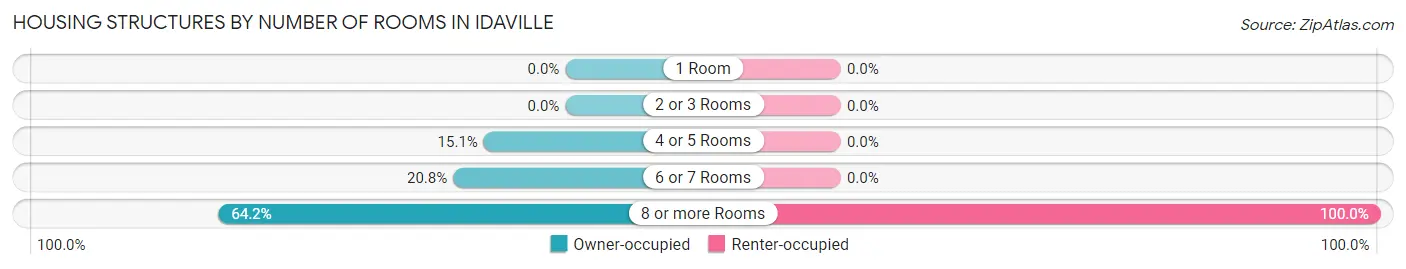
| Number of Rooms | Owner-occupied | Renter-occupied |
| 1 Room | 0 (0.0%) | 0 (0.0%) |
| 2 or 3 Rooms | 0 (0.0%) | 0 (0.0%) |
| 4 or 5 Rooms | 8 (15.1%) | 0 (0.0%) |
| 6 or 7 Rooms | 11 (20.7%) | 0 (0.0%) |
| 8 or more Rooms | 34 (64.1%) | 14 (100.0%) |
| Total | 53 (100.0%) | 14 (100.0%) |
Housing Structure by Heating Type in Idaville
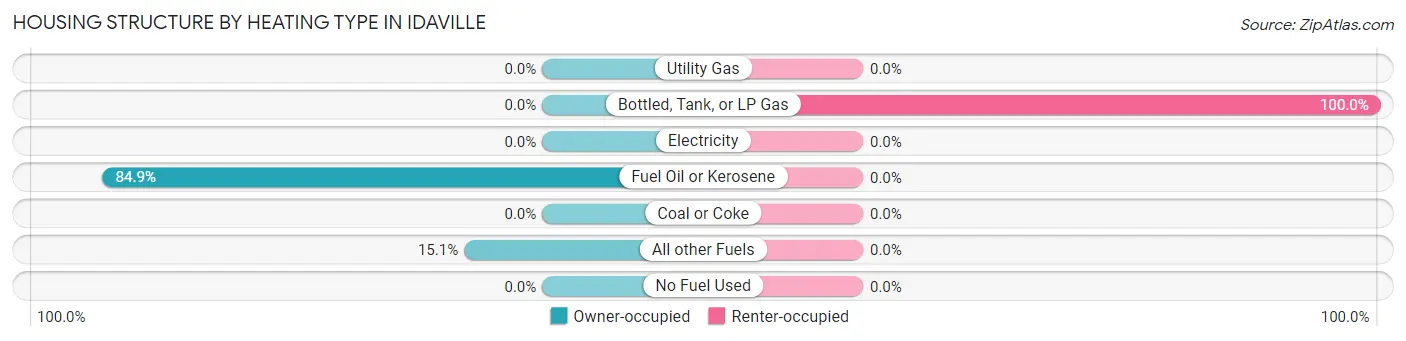
| Heating Type | Owner-occupied | Renter-occupied |
| Utility Gas | 0 (0.0%) | 0 (0.0%) |
| Bottled, Tank, or LP Gas | 0 (0.0%) | 14 (100.0%) |
| Electricity | 0 (0.0%) | 0 (0.0%) |
| Fuel Oil or Kerosene | 45 (84.9%) | 0 (0.0%) |
| Coal or Coke | 0 (0.0%) | 0 (0.0%) |
| All other Fuels | 8 (15.1%) | 0 (0.0%) |
| No Fuel Used | 0 (0.0%) | 0 (0.0%) |
| Total | 53 (100.0%) | 14 (100.0%) |
Household Vehicle Usage in Idaville
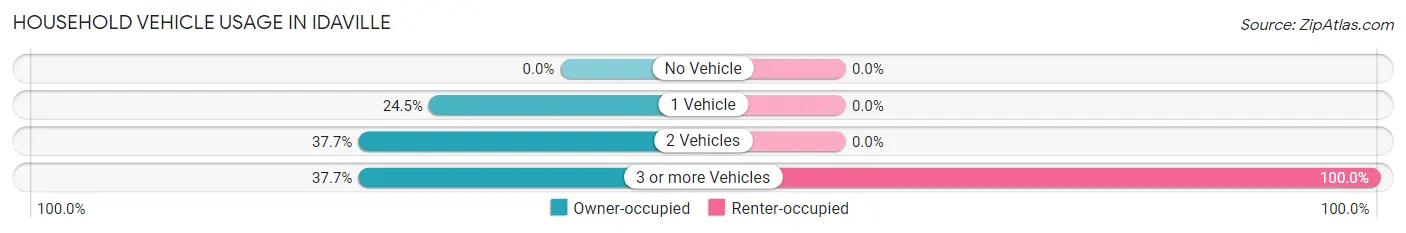
| Vehicles per Household | Owner-occupied | Renter-occupied |
| No Vehicle | 0 (0.0%) | 0 (0.0%) |
| 1 Vehicle | 13 (24.5%) | 0 (0.0%) |
| 2 Vehicles | 20 (37.7%) | 0 (0.0%) |
| 3 or more Vehicles | 20 (37.7%) | 14 (100.0%) |
| Total | 53 (100.0%) | 14 (100.0%) |
Real Estate & Mortgages in Idaville
Real Estate and Mortgage Overview in Idaville
| Characteristic | Without Mortgage | With Mortgage |
| Housing Units | 22 | 31 |
| Median Property Value | $264,300 | $197,500 |
| Median Household Income | $45,357 | $18 |
| Monthly Housing Costs | $464 | $0 |
| Real Estate Taxes | $3,333 | $0 |
Property Value by Mortgage Status in Idaville
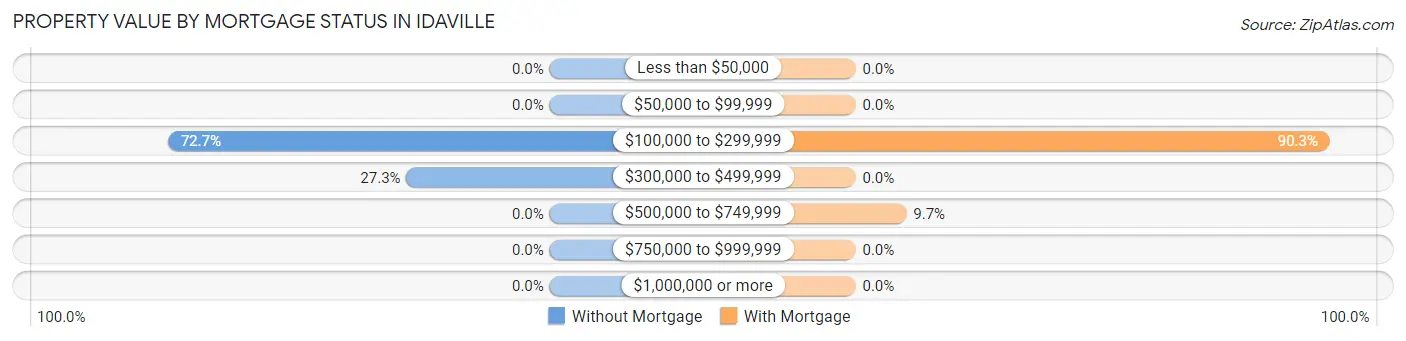
| Property Value | Without Mortgage | With Mortgage |
| Less than $50,000 | 0 (0.0%) | 0 (0.0%) |
| $50,000 to $99,999 | 0 (0.0%) | 0 (0.0%) |
| $100,000 to $299,999 | 16 (72.7%) | 28 (90.3%) |
| $300,000 to $499,999 | 6 (27.3%) | 0 (0.0%) |
| $500,000 to $749,999 | 0 (0.0%) | 3 (9.7%) |
| $750,000 to $999,999 | 0 (0.0%) | 0 (0.0%) |
| $1,000,000 or more | 0 (0.0%) | 0 (0.0%) |
| Total | 22 (100.0%) | 31 (100.0%) |
Household Income by Mortgage Status in Idaville
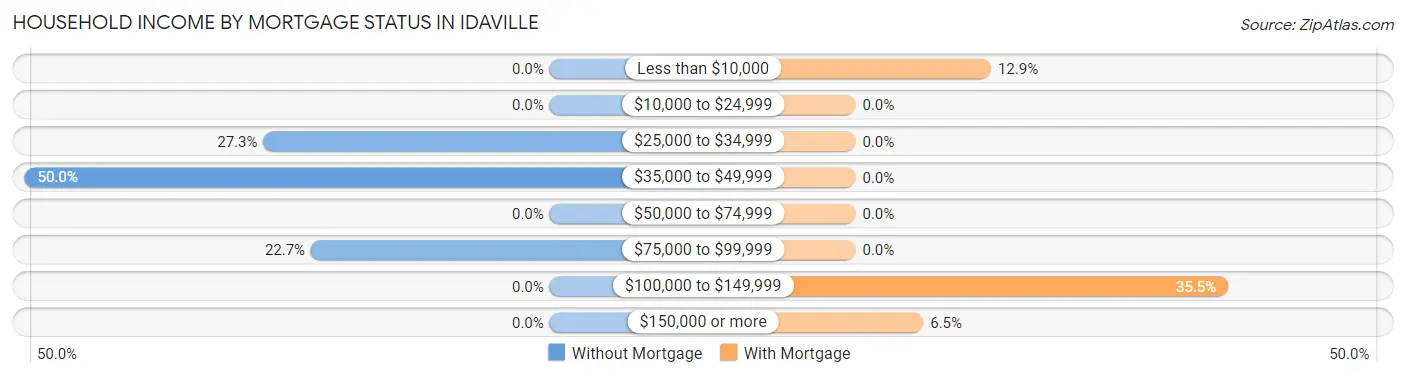
| Household Income | Without Mortgage | With Mortgage |
| Less than $10,000 | 0 (0.0%) | 4 (12.9%) |
| $10,000 to $24,999 | 0 (0.0%) | 0 (0.0%) |
| $25,000 to $34,999 | 6 (27.3%) | 0 (0.0%) |
| $35,000 to $49,999 | 11 (50.0%) | 0 (0.0%) |
| $50,000 to $74,999 | 0 (0.0%) | 0 (0.0%) |
| $75,000 to $99,999 | 5 (22.7%) | 0 (0.0%) |
| $100,000 to $149,999 | 0 (0.0%) | 11 (35.5%) |
| $150,000 or more | 0 (0.0%) | 2 (6.5%) |
| Total | 22 (100.0%) | 31 (100.0%) |
Property Value to Household Income Ratio in Idaville
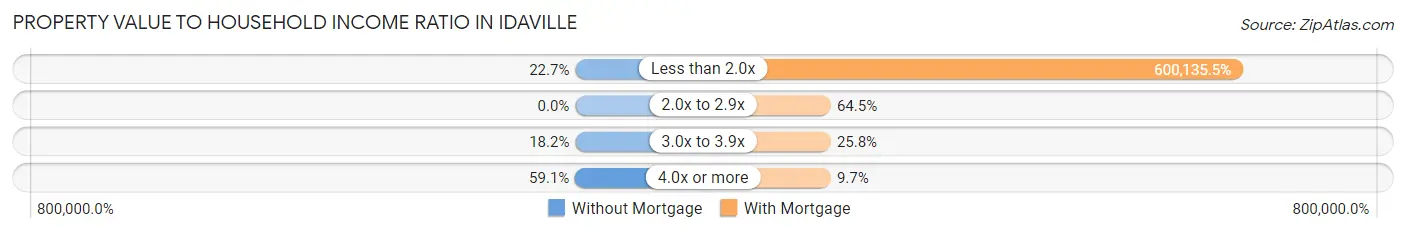
| Value-to-Income Ratio | Without Mortgage | With Mortgage |
| Less than 2.0x | 5 (22.7%) | 186,042 (600,135.5%) |
| 2.0x to 2.9x | 0 (0.0%) | 20 (64.5%) |
| 3.0x to 3.9x | 4 (18.2%) | 8 (25.8%) |
| 4.0x or more | 13 (59.1%) | 3 (9.7%) |
| Total | 22 (100.0%) | 31 (100.0%) |
Real Estate Taxes by Mortgage Status in Idaville
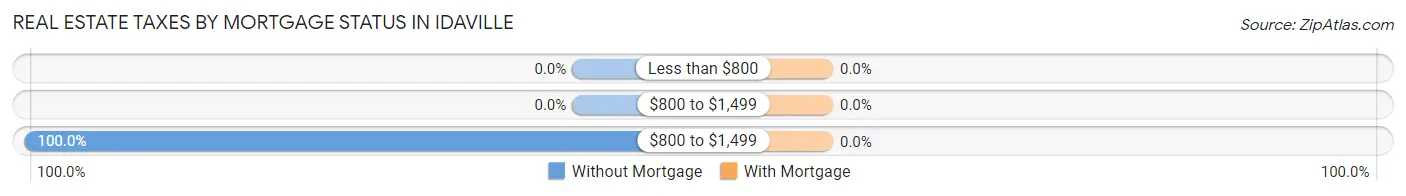
| Property Taxes | Without Mortgage | With Mortgage |
| Less than $800 | 0 (0.0%) | 0 (0.0%) |
| $800 to $1,499 | 0 (0.0%) | 0 (0.0%) |
| $800 to $1,499 | 22 (100.0%) | 0 (0.0%) |
| Total | 22 (100.0%) | 31 (100.0%) |
Health & Disability in Idaville
Health Insurance Coverage by Age in Idaville
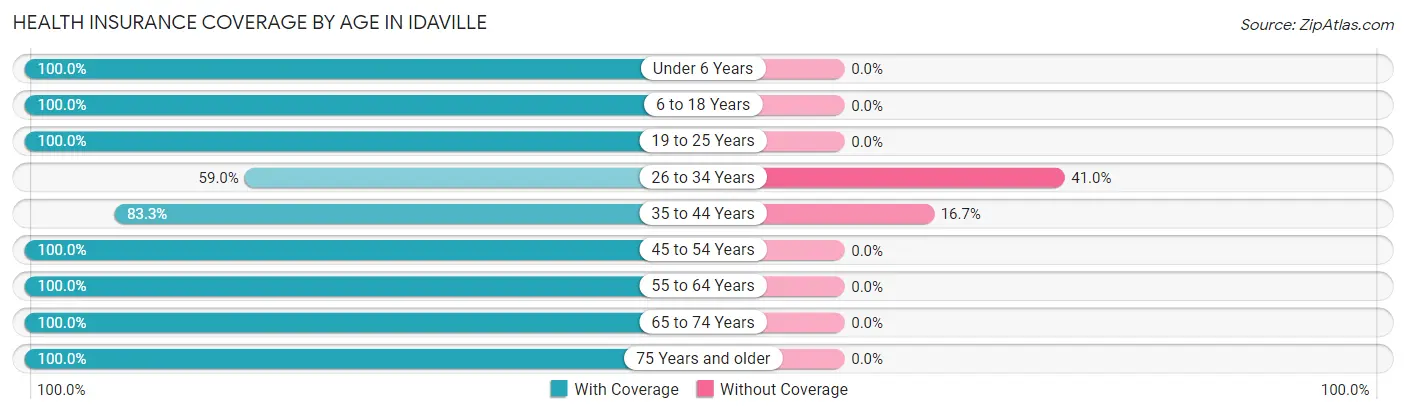
| Age Bracket | With Coverage | Without Coverage |
| Under 6 Years | 8 (100.0%) | 0 (0.0%) |
| 6 to 18 Years | 24 (100.0%) | 0 (0.0%) |
| 19 to 25 Years | 5 (100.0%) | 0 (0.0%) |
| 26 to 34 Years | 23 (59.0%) | 16 (41.0%) |
| 35 to 44 Years | 20 (83.3%) | 4 (16.7%) |
| 45 to 54 Years | 14 (100.0%) | 0 (0.0%) |
| 55 to 64 Years | 14 (100.0%) | 0 (0.0%) |
| 65 to 74 Years | 26 (100.0%) | 0 (0.0%) |
| 75 Years and older | 8 (100.0%) | 0 (0.0%) |
| Total | 142 (87.6%) | 20 (12.3%) |
Health Insurance Coverage by Citizenship Status in Idaville
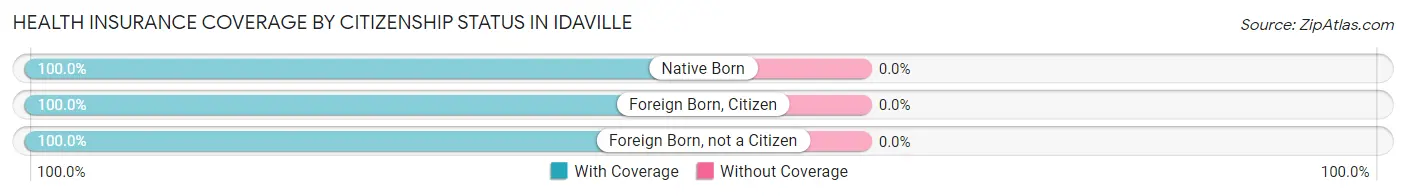
| Citizenship Status | With Coverage | Without Coverage |
| Native Born | 8 (100.0%) | 0 (0.0%) |
| Foreign Born, Citizen | 24 (100.0%) | 0 (0.0%) |
| Foreign Born, not a Citizen | 5 (100.0%) | 0 (0.0%) |
Health Insurance Coverage by Household Income in Idaville
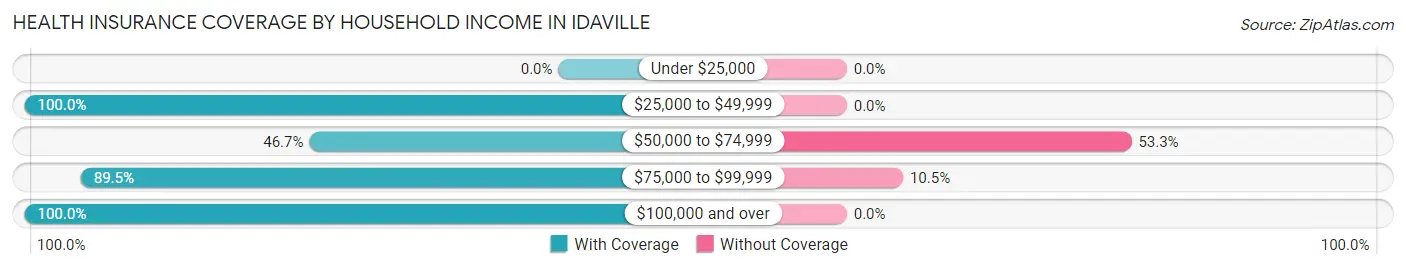
| Household Income | With Coverage | Without Coverage |
| Under $25,000 | 0 (0.0%) | 0 (0.0%) |
| $25,000 to $49,999 | 21 (100.0%) | 0 (0.0%) |
| $50,000 to $74,999 | 14 (46.7%) | 16 (53.3%) |
| $75,000 to $99,999 | 34 (89.5%) | 4 (10.5%) |
| $100,000 and over | 73 (100.0%) | 0 (0.0%) |
Public vs Private Health Insurance Coverage by Age in Idaville
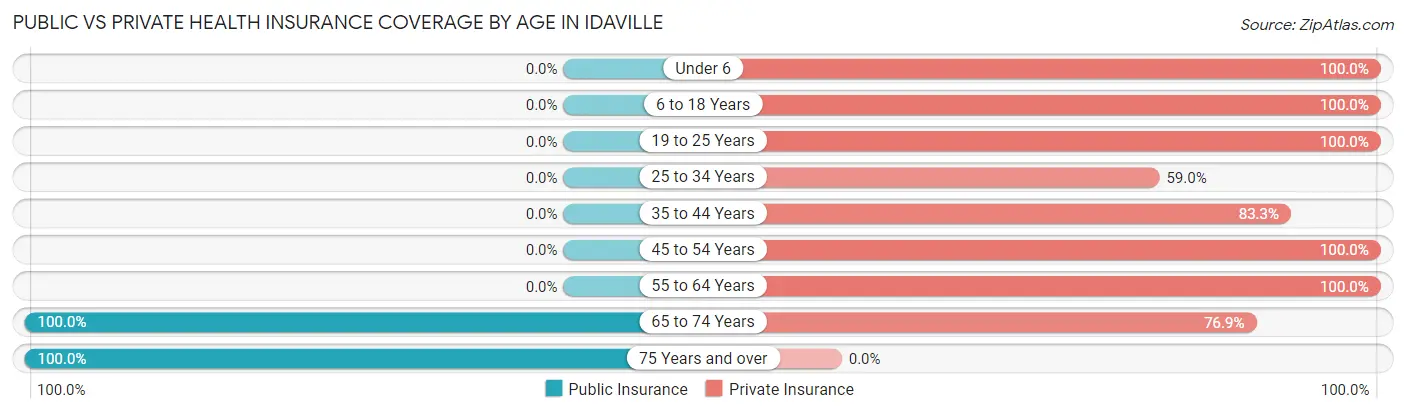
| Age Bracket | Public Insurance | Private Insurance |
| Under 6 | 0 (0.0%) | 8 (100.0%) |
| 6 to 18 Years | 0 (0.0%) | 24 (100.0%) |
| 19 to 25 Years | 0 (0.0%) | 5 (100.0%) |
| 25 to 34 Years | 0 (0.0%) | 23 (59.0%) |
| 35 to 44 Years | 0 (0.0%) | 20 (83.3%) |
| 45 to 54 Years | 0 (0.0%) | 14 (100.0%) |
| 55 to 64 Years | 0 (0.0%) | 14 (100.0%) |
| 65 to 74 Years | 26 (100.0%) | 20 (76.9%) |
| 75 Years and over | 8 (100.0%) | 0 (0.0%) |
| Total | 34 (21.0%) | 128 (79.0%) |
Disability Status by Sex by Age in Idaville

| Age Bracket | Male | Female |
| Under 5 Years | 0 (0.0%) | 0 (0.0%) |
| 5 to 17 Years | 0 (0.0%) | 0 (0.0%) |
| 18 to 34 Years | 0 (0.0%) | 0 (0.0%) |
| 35 to 64 Years | 0 (0.0%) | 0 (0.0%) |
| 65 to 74 Years | 6 (35.3%) | 0 (0.0%) |
| 75 Years and over | 4 (100.0%) | 4 (100.0%) |
Disability Class by Sex by Age in Idaville
Disability Class: Hearing Difficulty
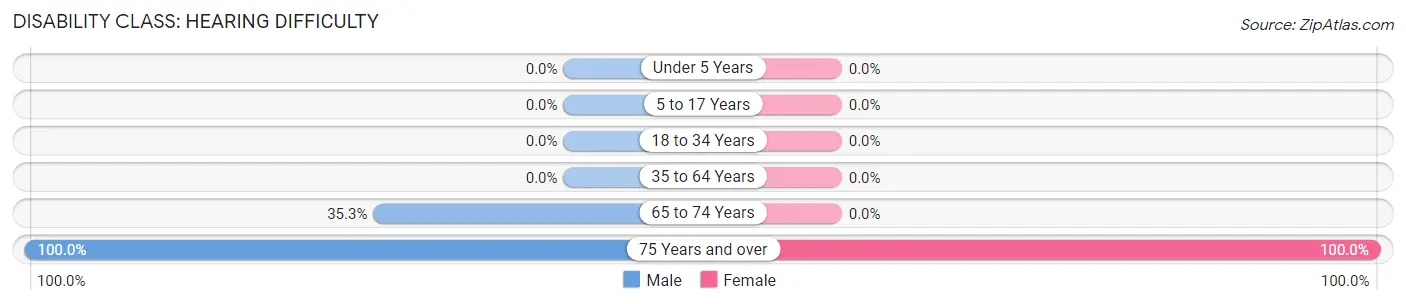
| Age Bracket | Male | Female |
| Under 5 Years | 0 (0.0%) | 0 (0.0%) |
| 5 to 17 Years | 0 (0.0%) | 0 (0.0%) |
| 18 to 34 Years | 0 (0.0%) | 0 (0.0%) |
| 35 to 64 Years | 0 (0.0%) | 0 (0.0%) |
| 65 to 74 Years | 6 (35.3%) | 0 (0.0%) |
| 75 Years and over | 4 (100.0%) | 4 (100.0%) |
Disability Class: Vision Difficulty
| Age Bracket | Male | Female |
| Under 5 Years | 0 (0.0%) | 0 (0.0%) |
| 5 to 17 Years | 0 (0.0%) | 0 (0.0%) |
| 18 to 34 Years | 0 (0.0%) | 0 (0.0%) |
| 35 to 64 Years | 0 (0.0%) | 0 (0.0%) |
| 65 to 74 Years | 0 (0.0%) | 0 (0.0%) |
| 75 Years and over | 0 (0.0%) | 0 (0.0%) |
Disability Class: Cognitive Difficulty
| Age Bracket | Male | Female |
| 5 to 17 Years | 0 (0.0%) | 0 (0.0%) |
| 18 to 34 Years | 0 (0.0%) | 0 (0.0%) |
| 35 to 64 Years | 0 (0.0%) | 0 (0.0%) |
| 65 to 74 Years | 0 (0.0%) | 0 (0.0%) |
| 75 Years and over | 0 (0.0%) | 0 (0.0%) |
Disability Class: Ambulatory Difficulty
| Age Bracket | Male | Female |
| 5 to 17 Years | 0 (0.0%) | 0 (0.0%) |
| 18 to 34 Years | 0 (0.0%) | 0 (0.0%) |
| 35 to 64 Years | 0 (0.0%) | 0 (0.0%) |
| 65 to 74 Years | 0 (0.0%) | 0 (0.0%) |
| 75 Years and over | 0 (0.0%) | 4 (100.0%) |
Disability Class: Self-Care Difficulty
| Age Bracket | Male | Female |
| 5 to 17 Years | 0 (0.0%) | 0 (0.0%) |
| 18 to 34 Years | 0 (0.0%) | 0 (0.0%) |
| 35 to 64 Years | 0 (0.0%) | 0 (0.0%) |
| 65 to 74 Years | 0 (0.0%) | 0 (0.0%) |
| 75 Years and over | 0 (0.0%) | 0 (0.0%) |
Technology Access in Idaville
Computing Device Access in Idaville
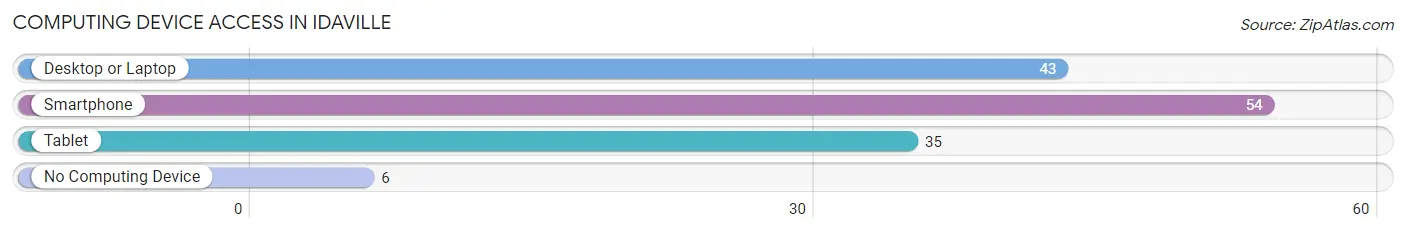
| Device Type | # Households | % Households |
| Desktop or Laptop | 43 | 64.2% |
| Smartphone | 54 | 80.6% |
| Tablet | 35 | 52.2% |
| No Computing Device | 6 | 9.0% |
| Total | 67 | 100.0% |
Internet Access in Idaville
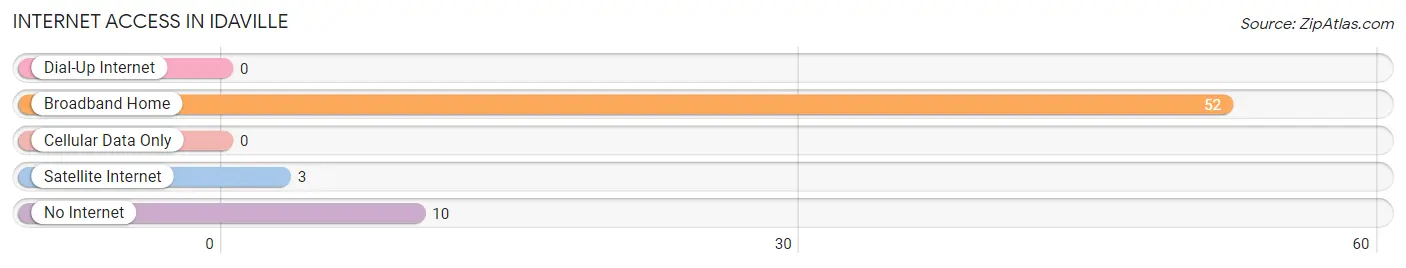
| Internet Type | # Households | % Households |
| Dial-Up Internet | 0 | 0.0% |
| Broadband Home | 52 | 77.6% |
| Cellular Data Only | 0 | 0.0% |
| Satellite Internet | 3 | 4.5% |
| No Internet | 10 | 14.9% |
| Total | 67 | 100.0% |
Idaville Summary
Idaville, Pennsylvania is a small borough located in Perry County, Pennsylvania. It is situated in the Susquehanna Valley, approximately 10 miles south of Harrisburg, the state capital. The population of Idaville was 1,093 at the 2010 census.
History
Idaville was founded in 1845 by John Idaville, a German immigrant. He purchased the land from the local Native American tribes and named the town after himself. Idaville was originally a farming community, but it soon developed into a small industrial center. The town was incorporated in 1876.
In the late 19th century, Idaville was home to several factories, including a woolen mill, a paper mill, and a brickyard. The town also had a railroad station, which connected it to Harrisburg and other nearby towns.
In the early 20th century, Idaville experienced a period of growth and prosperity. The town was home to several businesses, including a bank, a hotel, a movie theater, and a variety of stores.
Geography
Idaville is located in Perry County, Pennsylvania. It is situated in the Susquehanna Valley, approximately 10 miles south of Harrisburg, the state capital. The town is located on the east bank of the Susquehanna River.
The terrain of Idaville is mostly flat, with some rolling hills. The town is surrounded by farmland and wooded areas.
Economy
Idaville’s economy is largely based on agriculture and light industry. The town is home to several small businesses, including a grocery store, a hardware store, and a restaurant.
The town is also home to a variety of manufacturing companies, including a paper mill, a brickyard, and a furniture factory.
Demographics
As of the 2010 census, the population of Idaville was 1,093. The racial makeup of the town was 97.3% White, 0.7% African American, 0.2% Native American, 0.2% Asian, and 1.6% from other races.
The median household income in Idaville was $41,250, and the median family income was $50,000. The per capita income was $20,945.
Conclusion
Idaville, Pennsylvania is a small borough located in Perry County, Pennsylvania. It is situated in the Susquehanna Valley, approximately 10 miles south of Harrisburg, the state capital. The population of Idaville was 1,093 at the 2010 census. The town’s economy is largely based on agriculture and light industry. The racial makeup of the town was 97.3% White, 0.7% African American, 0.2% Native American, 0.2% Asian, and 1.6% from other races. The median household income in Idaville was $41,250, and the median family income was $50,000. The per capita income was $20,945. Idaville is a small town with a rich history and a bright future.
Common Questions
What is Per Capita Income in Idaville?
Per Capita income in Idaville is $44,636.
What is the Median Household income in Idaville?
Median Household Income in Idaville is $77,083.
What is Income or Wage Gap in Idaville?
Income or Wage Gap in Idaville is 61.8%.
Women in Idaville earn 38.2 cents for every dollar earned by a man.
What is Inequality or Gini Index in Idaville?
Inequality or Gini Index in Idaville is 0.39.
What is the Total Population of Idaville?
Total Population of Idaville is 162.
What is the Total Male Population of Idaville?
Total Male Population of Idaville is 72.
What is the Total Female Population of Idaville?
Total Female Population of Idaville is 90.
What is the Ratio of Males per 100 Females in Idaville?
There are 80.00 Males per 100 Females in Idaville.
What is the Ratio of Females per 100 Males in Idaville?
There are 125.00 Females per 100 Males in Idaville.
What is the Median Population Age in Idaville?
Median Population Age in Idaville is 38.1 Years.
What is the Average Family Size in Idaville
Average Family Size in Idaville is 3.0 People.
What is the Average Household Size in Idaville
Average Household Size in Idaville is 2.4 People.
How Large is the Labor Force in Idaville?
There are 84 People in the Labor Forcein in Idaville.
What is the Percentage of People in the Labor Force in Idaville?
62.2% of People are in the Labor Force in Idaville.
What is the Unemployment Rate in Idaville?
Unemployment Rate in Idaville is 4.8%.