Spring Grove borough, PA Map & Demographics
Spring Grove borough Overview
$31,165
PER CAPITA INCOME
$78,542
AVG FAMILY INCOME
$65,524
AVG HOUSEHOLD INCOME
47.7%
WAGE / INCOME GAP [ % ]
52.3¢/ $1
WAGE / INCOME GAP [ $ ]
0.37
INEQUALITY / GINI INDEX
2,141
TOTAL POPULATION
977
MALE POPULATION
1,164
FEMALE POPULATION
83.93
MALES / 100 FEMALES
119.14
FEMALES / 100 MALES
41.4
MEDIAN AGE
3.2
AVG FAMILY SIZE
2.6
AVG HOUSEHOLD SIZE
1,176
LABOR FORCE [ PEOPLE ]
66.8%
PERCENT IN LABOR FORCE
2.6%
UNEMPLOYMENT RATE
Income in Spring Grove borough
Income Overview in Spring Grove borough
Per Capita Income in Spring Grove borough is $31,165, while median incomes of families and households are $78,542 and $65,524 respectively.
| Characteristic | Number | Measure |
| Per Capita Income | 2,141 | $31,165 |
| Median Family Income | 555 | $78,542 |
| Mean Family Income | 555 | $91,277 |
| Median Household Income | 817 | $65,524 |
| Mean Household Income | 817 | $78,630 |
| Income Deficit | 555 | $0 |
| Wage / Income Gap (%) | 2,141 | 47.65% |
| Wage / Income Gap ($) | 2,141 | 52.35¢ per $1 |
| Gini / Inequality Index | 2,141 | 0.37 |
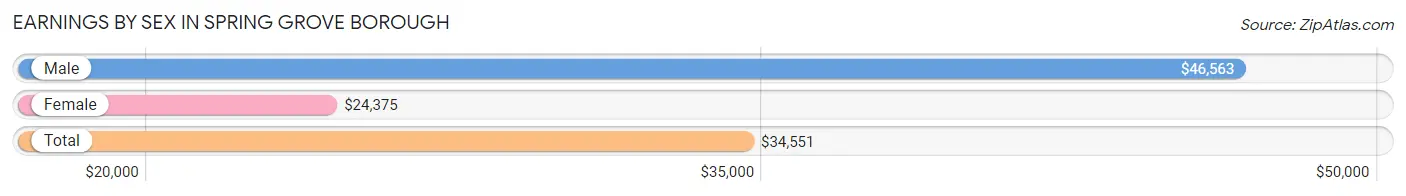
Earnings by Sex in Spring Grove borough
Average Earnings in Spring Grove borough are $34,551, $46,563 for men and $24,375 for women, a difference of 47.6%.
| Sex | Number | Average Earnings |
| Male | 614 (51.9%) | $46,563 |
| Female | 568 (48.0%) | $24,375 |
| Total | 1,182 (100.0%) | $34,551 |
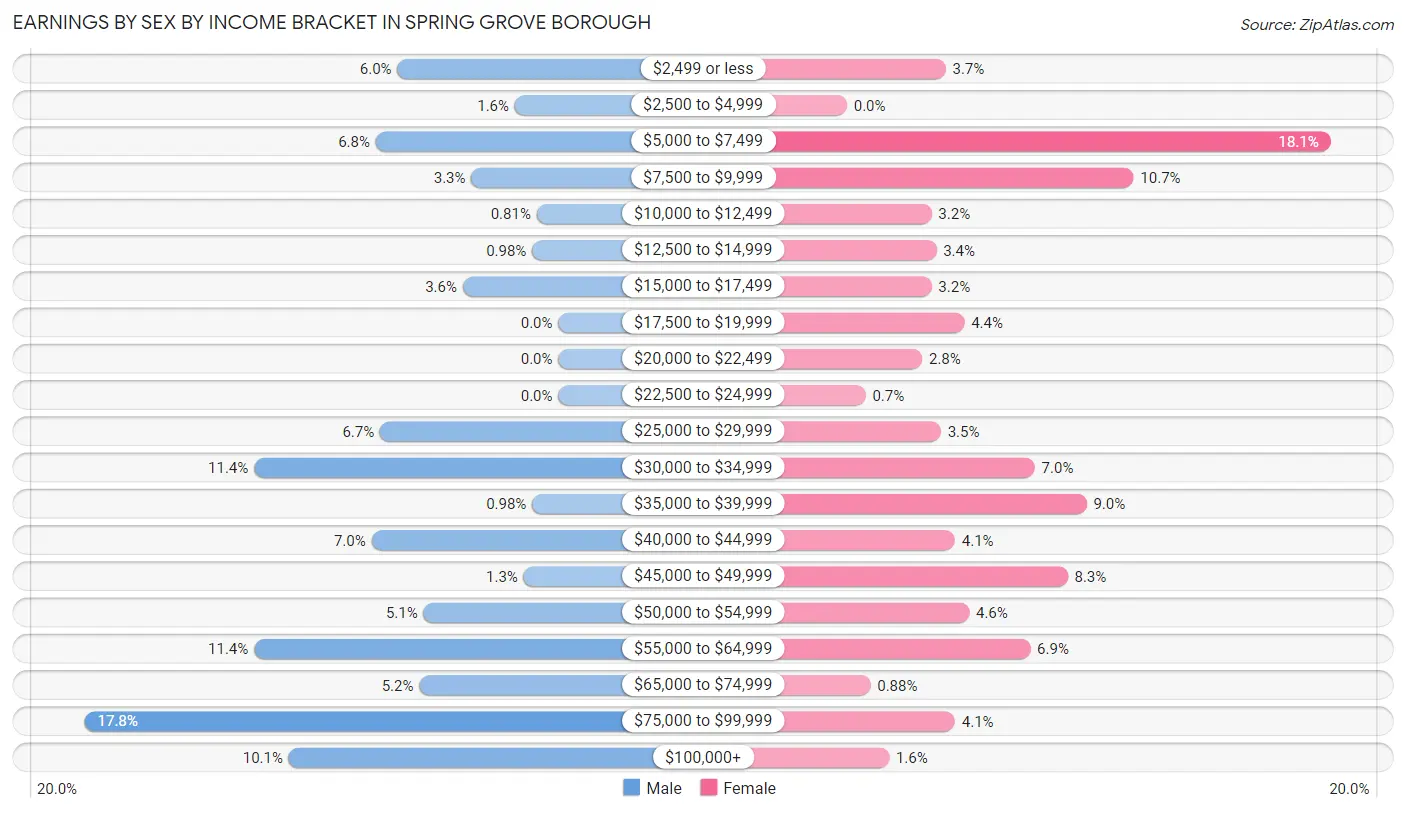
Earnings by Sex by Income Bracket in Spring Grove borough
The most common earnings brackets in Spring Grove borough are $75,000 to $99,999 for men (109 | 17.7%) and $5,000 to $7,499 for women (103 | 18.1%).
| Income | Male | Female |
| $2,499 or less | 37 (6.0%) | 21 (3.7%) |
| $2,500 to $4,999 | 10 (1.6%) | 0 (0.0%) |
| $5,000 to $7,499 | 42 (6.8%) | 103 (18.1%) |
| $7,500 to $9,999 | 20 (3.3%) | 61 (10.7%) |
| $10,000 to $12,499 | 5 (0.8%) | 18 (3.2%) |
| $12,500 to $14,999 | 6 (1.0%) | 19 (3.4%) |
| $15,000 to $17,499 | 22 (3.6%) | 18 (3.2%) |
| $17,500 to $19,999 | 0 (0.0%) | 25 (4.4%) |
| $20,000 to $22,499 | 0 (0.0%) | 16 (2.8%) |
| $22,500 to $24,999 | 0 (0.0%) | 4 (0.7%) |
| $25,000 to $29,999 | 41 (6.7%) | 20 (3.5%) |
| $30,000 to $34,999 | 70 (11.4%) | 40 (7.0%) |
| $35,000 to $39,999 | 6 (1.0%) | 51 (9.0%) |
| $40,000 to $44,999 | 43 (7.0%) | 23 (4.1%) |
| $45,000 to $49,999 | 8 (1.3%) | 47 (8.3%) |
| $50,000 to $54,999 | 31 (5.1%) | 26 (4.6%) |
| $55,000 to $64,999 | 70 (11.4%) | 39 (6.9%) |
| $65,000 to $74,999 | 32 (5.2%) | 5 (0.9%) |
| $75,000 to $99,999 | 109 (17.7%) | 23 (4.1%) |
| $100,000+ | 62 (10.1%) | 9 (1.6%) |
| Total | 614 (100.0%) | 568 (100.0%) |
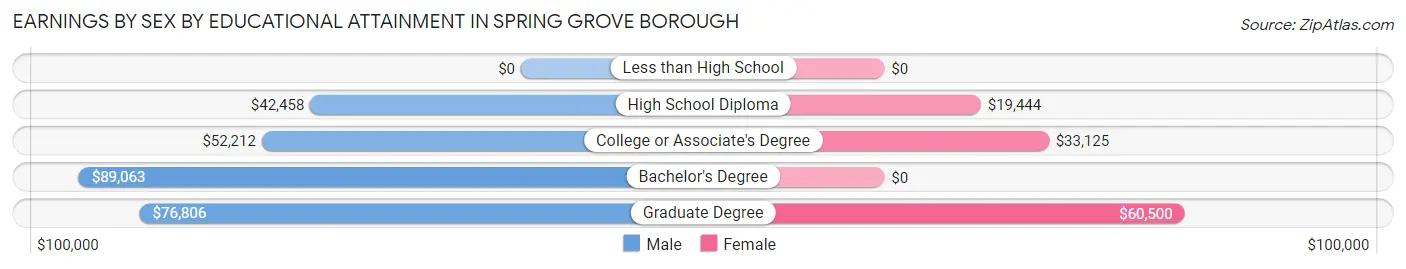
Earnings by Sex by Educational Attainment in Spring Grove borough
Average earnings in Spring Grove borough are $52,262 for men and $25,577 for women, a difference of 51.1%. Men with an educational attainment of bachelor's degree enjoy the highest average annual earnings of $89,063, while those with high school diploma education earn the least with $42,458. Women with an educational attainment of graduate degree earn the most with the average annual earnings of $60,500, while those with high school diploma education have the smallest earnings of $19,444.
| Educational Attainment | Male Income | Female Income |
| Less than High School | - | - |
| High School Diploma | $42,458 | $19,444 |
| College or Associate's Degree | $52,212 | $33,125 |
| Bachelor's Degree | $89,063 | $0 |
| Graduate Degree | $76,806 | $60,500 |
| Total | $52,262 | $25,577 |
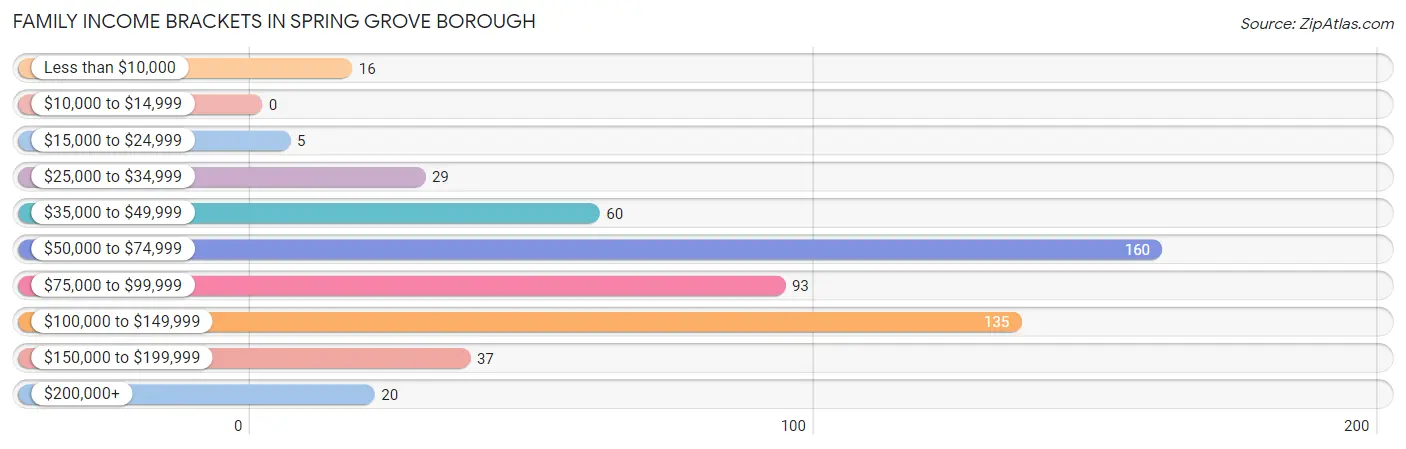
Family Income in Spring Grove borough
Family Income Brackets in Spring Grove borough
According to the Spring Grove borough family income data, there are 160 families falling into the $50,000 to $74,999 income range, which is the most common income bracket and makes up 28.8% of all families.
| Income Bracket | # Families | % Families |
| Less than $10,000 | 16 | 2.9% |
| $10,000 to $14,999 | 0 | 0.0% |
| $15,000 to $24,999 | 5 | 0.9% |
| $25,000 to $34,999 | 29 | 5.2% |
| $35,000 to $49,999 | 60 | 10.8% |
| $50,000 to $74,999 | 160 | 28.8% |
| $75,000 to $99,999 | 93 | 16.8% |
| $100,000 to $149,999 | 135 | 24.3% |
| $150,000 to $199,999 | 37 | 6.7% |
| $200,000+ | 20 | 3.6% |
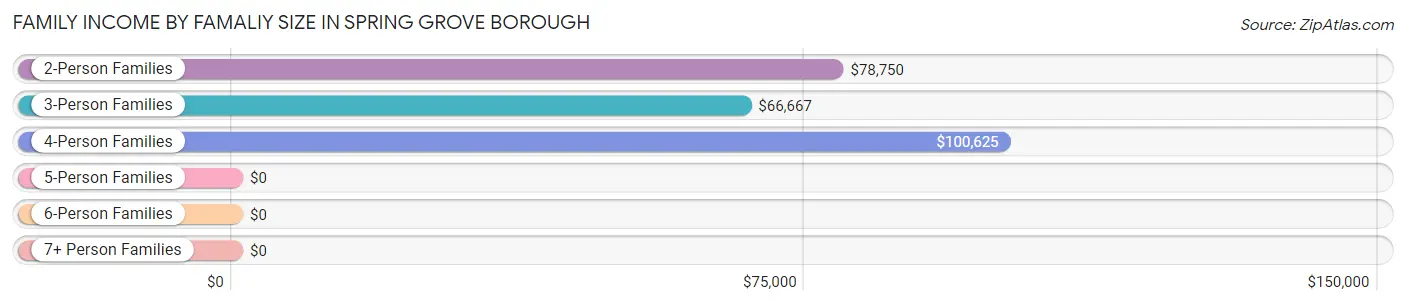
Family Income by Famaliy Size in Spring Grove borough
4-person families (104 | 18.7%) account for the highest median family income in Spring Grove borough with $100,625 per family, while 2-person families (270 | 48.6%) have the highest median income of $39,375 per family member.
| Income Bracket | # Families | Median Income |
| 2-Person Families | 270 (48.6%) | $78,750 |
| 3-Person Families | 146 (26.3%) | $66,667 |
| 4-Person Families | 104 (18.7%) | $100,625 |
| 5-Person Families | 4 (0.7%) | $0 |
| 6-Person Families | 17 (3.1%) | $0 |
| 7+ Person Families | 14 (2.5%) | $0 |
| Total | 555 (100.0%) | $78,542 |
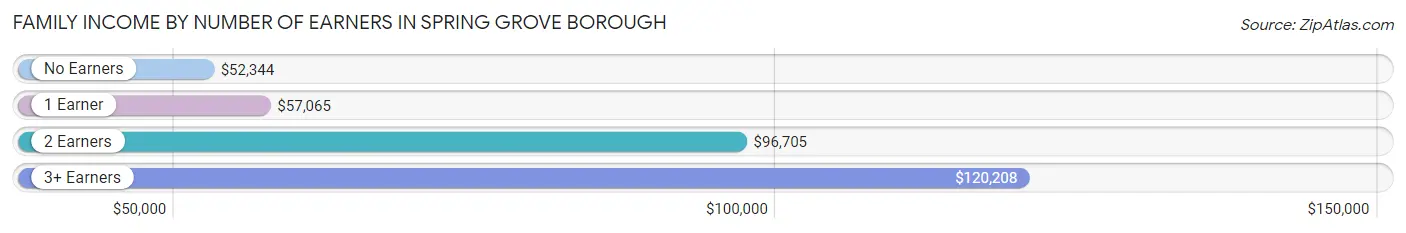
Family Income by Number of Earners in Spring Grove borough
The median family income in Spring Grove borough is $78,542, with families comprising 3+ earners (69) having the highest median family income of $120,208, while families with no earners (59) have the lowest median family income of $52,344, accounting for 12.4% and 10.6% of families, respectively.
| Number of Earners | # Families | Median Income |
| No Earners | 59 (10.6%) | $52,344 |
| 1 Earner | 192 (34.6%) | $57,065 |
| 2 Earners | 235 (42.3%) | $96,705 |
| 3+ Earners | 69 (12.4%) | $120,208 |
| Total | 555 (100.0%) | $78,542 |
Household Income in Spring Grove borough
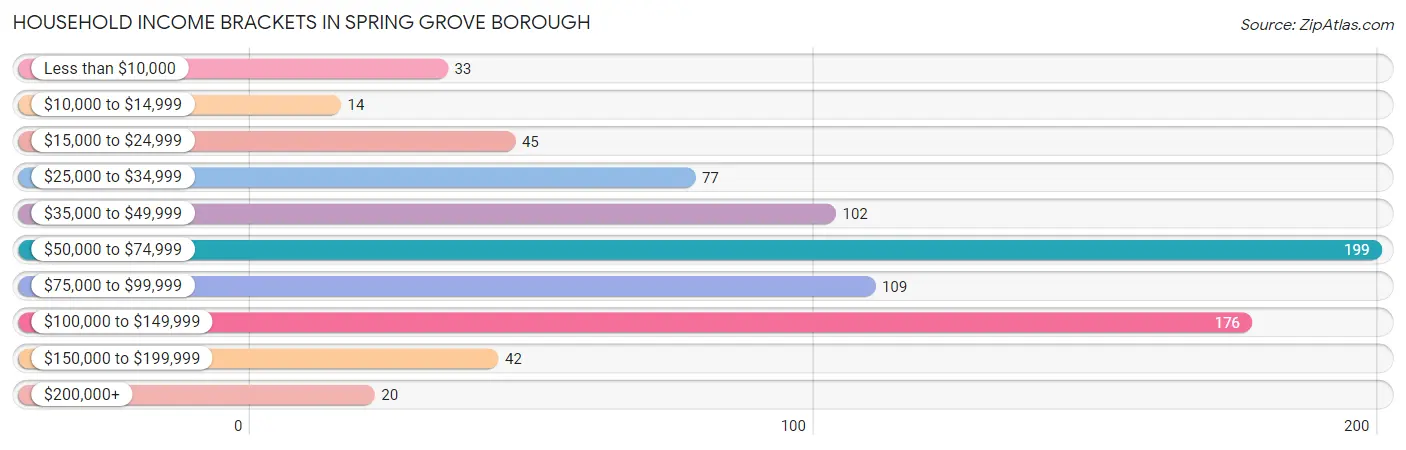
Household Income Brackets in Spring Grove borough
With 199 households falling in the category, the $50,000 to $74,999 income range is the most frequent in Spring Grove borough, accounting for 24.4% of all households. In contrast, only 14 households (1.7%) fall into the $10,000 to $14,999 income bracket, making it the least populous group.
| Income Bracket | # Households | % Households |
| Less than $10,000 | 33 | 4.0% |
| $10,000 to $14,999 | 14 | 1.7% |
| $15,000 to $24,999 | 45 | 5.5% |
| $25,000 to $34,999 | 77 | 9.4% |
| $35,000 to $49,999 | 102 | 12.5% |
| $50,000 to $74,999 | 199 | 24.4% |
| $75,000 to $99,999 | 109 | 13.3% |
| $100,000 to $149,999 | 176 | 21.5% |
| $150,000 to $199,999 | 42 | 5.1% |
| $200,000+ | 20 | 2.4% |
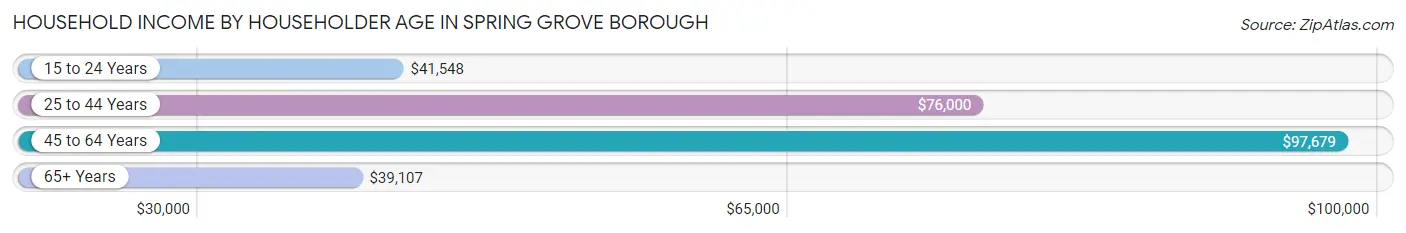
Household Income by Householder Age in Spring Grove borough
The median household income in Spring Grove borough is $65,524, with the highest median household income of $97,679 found in the 45 to 64 years age bracket for the primary householder. A total of 296 households (36.2%) fall into this category. Meanwhile, the 65+ years age bracket for the primary householder has the lowest median household income of $39,107, with 277 households (33.9%) in this group.
| Income Bracket | # Households | Median Income |
| 15 to 24 Years | 42 (5.1%) | $41,548 |
| 25 to 44 Years | 202 (24.7%) | $76,000 |
| 45 to 64 Years | 296 (36.2%) | $97,679 |
| 65+ Years | 277 (33.9%) | $39,107 |
| Total | 817 (100.0%) | $65,524 |
Poverty in Spring Grove borough
Income Below Poverty by Sex and Age in Spring Grove borough
With 8.0% poverty level for males and 13.7% for females among the residents of Spring Grove borough, 5 year old males and 16 and 17 year old females are the most vulnerable to poverty, with 16 males (100.0%) and 15 females (75.0%) in their respective age groups living below the poverty level.
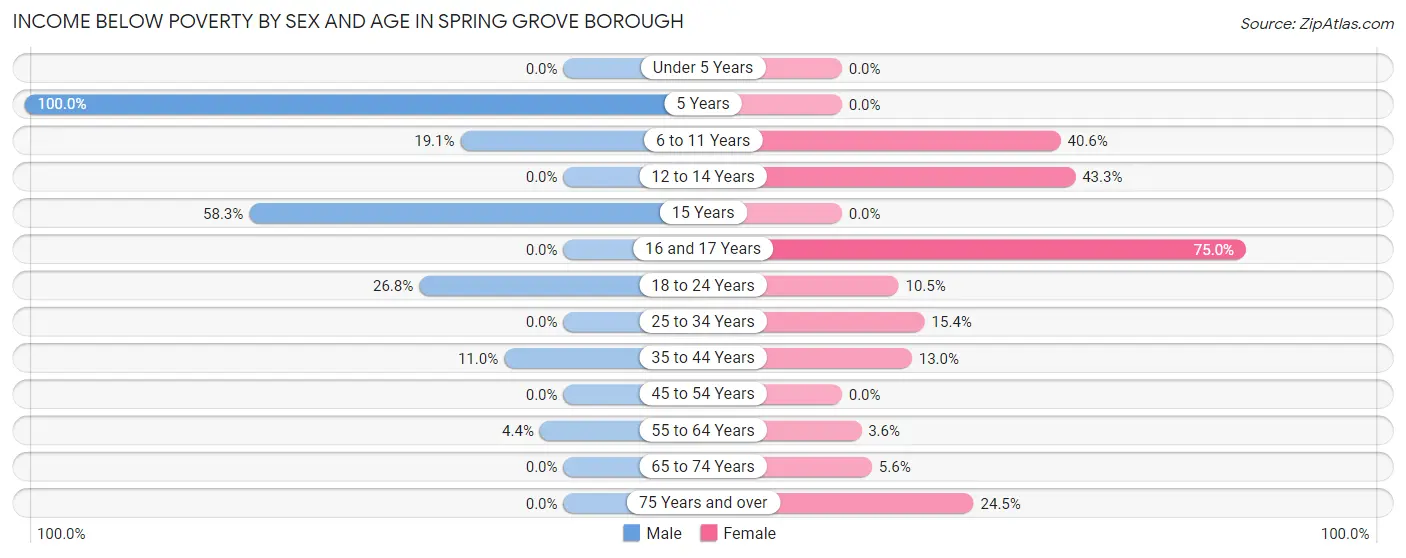
| Age Bracket | Male | Female |
| Under 5 Years | 0 (0.0%) | 0 (0.0%) |
| 5 Years | 16 (100.0%) | 0 (0.0%) |
| 6 to 11 Years | 13 (19.1%) | 39 (40.6%) |
| 12 to 14 Years | 0 (0.0%) | 13 (43.3%) |
| 15 Years | 14 (58.3%) | 0 (0.0%) |
| 16 and 17 Years | 0 (0.0%) | 15 (75.0%) |
| 18 to 24 Years | 15 (26.8%) | 8 (10.5%) |
| 25 to 34 Years | 0 (0.0%) | 22 (15.4%) |
| 35 to 44 Years | 14 (11.0%) | 26 (13.0%) |
| 45 to 54 Years | 0 (0.0%) | 0 (0.0%) |
| 55 to 64 Years | 6 (4.4%) | 5 (3.6%) |
| 65 to 74 Years | 0 (0.0%) | 8 (5.6%) |
| 75 Years and over | 0 (0.0%) | 23 (24.5%) |
| Total | 78 (8.0%) | 159 (13.7%) |
Income Above Poverty by Sex and Age in Spring Grove borough
According to the poverty statistics in Spring Grove borough, males aged under 5 years and females aged under 5 years are the age groups that are most secure financially, with 100.0% of males and 100.0% of females in these age groups living above the poverty line.
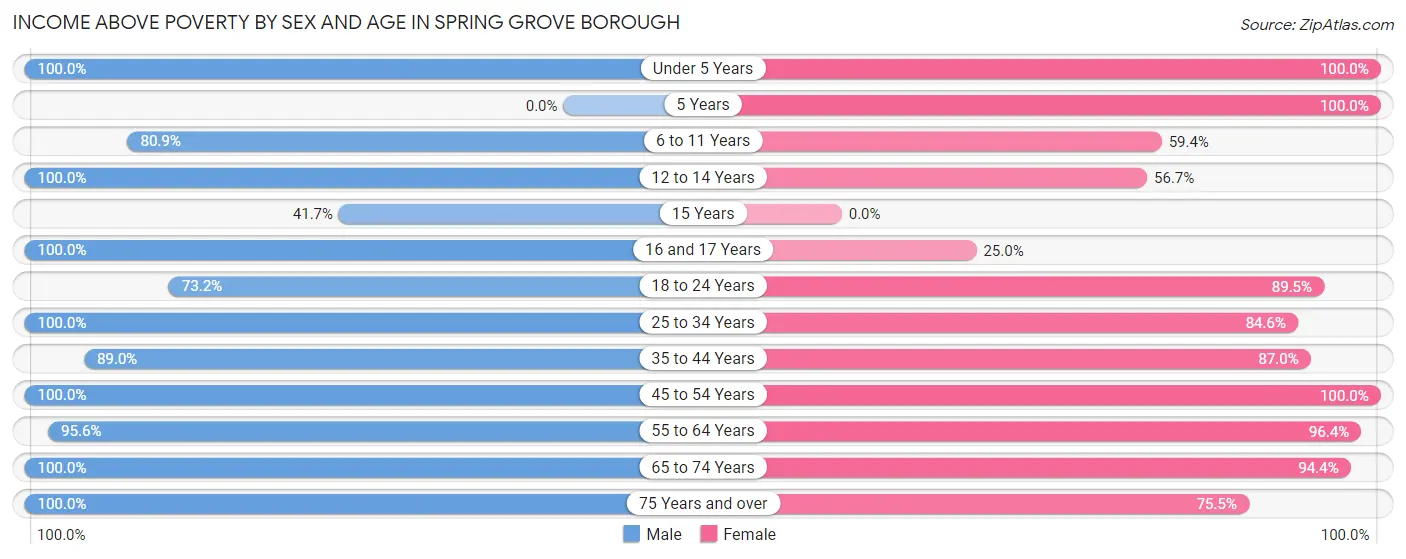
| Age Bracket | Male | Female |
| Under 5 Years | 51 (100.0%) | 62 (100.0%) |
| 5 Years | 0 (0.0%) | 11 (100.0%) |
| 6 to 11 Years | 55 (80.9%) | 57 (59.4%) |
| 12 to 14 Years | 13 (100.0%) | 17 (56.7%) |
| 15 Years | 10 (41.7%) | 0 (0.0%) |
| 16 and 17 Years | 14 (100.0%) | 5 (25.0%) |
| 18 to 24 Years | 41 (73.2%) | 68 (89.5%) |
| 25 to 34 Years | 167 (100.0%) | 121 (84.6%) |
| 35 to 44 Years | 113 (89.0%) | 174 (87.0%) |
| 45 to 54 Years | 134 (100.0%) | 143 (100.0%) |
| 55 to 64 Years | 131 (95.6%) | 134 (96.4%) |
| 65 to 74 Years | 144 (100.0%) | 135 (94.4%) |
| 75 Years and over | 23 (100.0%) | 71 (75.5%) |
| Total | 896 (92.0%) | 998 (86.3%) |
Income Below Poverty Among Married-Couple Families in Spring Grove borough
The poverty statistics for married-couple families in Spring Grove borough show that 4.4% or 19 of the total 433 families live below the poverty line. Families with 5 or more children have the highest poverty rate of 100.0%, comprising of 14 families. On the other hand, families with 1 or 2 children have the lowest poverty rate of 0.0%, which includes 0 families.
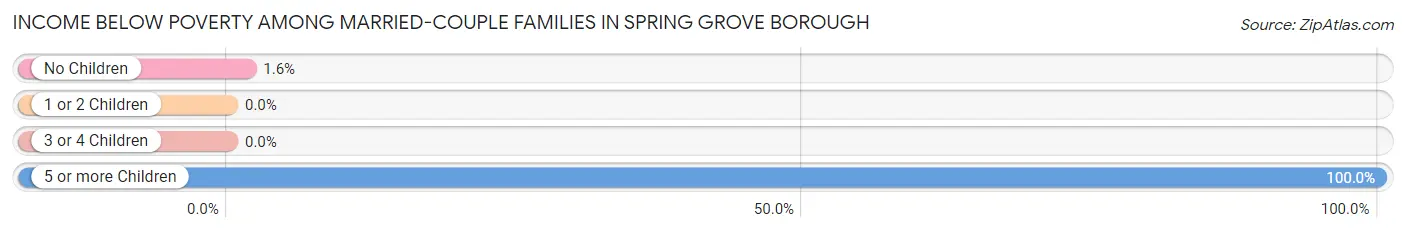
| Children | Above Poverty | Below Poverty |
| No Children | 310 (98.4%) | 5 (1.6%) |
| 1 or 2 Children | 100 (100.0%) | 0 (0.0%) |
| 3 or 4 Children | 4 (100.0%) | 0 (0.0%) |
| 5 or more Children | 0 (0.0%) | 14 (100.0%) |
| Total | 414 (95.6%) | 19 (4.4%) |
Income Below Poverty Among Single-Parent Households in Spring Grove borough
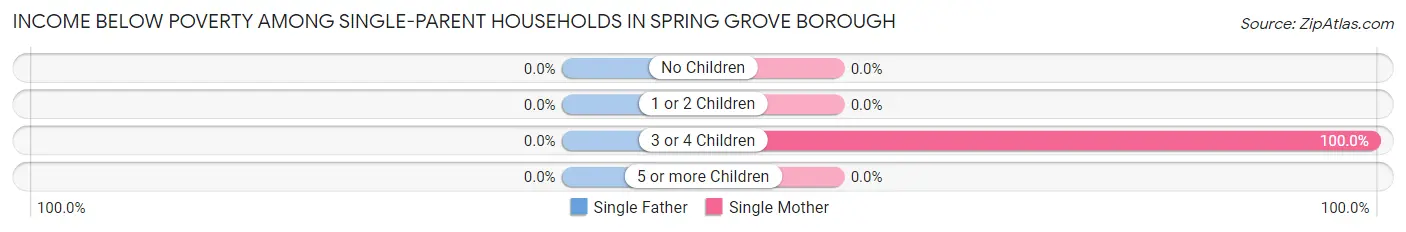
| Children | Single Father | Single Mother |
| No Children | 0 (0.0%) | 0 (0.0%) |
| 1 or 2 Children | 0 (0.0%) | 0 (0.0%) |
| 3 or 4 Children | 0 (0.0%) | 16 (100.0%) |
| 5 or more Children | 0 (0.0%) | 0 (0.0%) |
| Total | 0 (0.0%) | 16 (18.4%) |
Income Below Poverty Among Married-Couple vs Single-Parent Households in Spring Grove borough
The poverty data for Spring Grove borough shows that 19 of the married-couple family households (4.4%) and 16 of the single-parent households (13.1%) are living below the poverty level. Within the married-couple family households, those with 5 or more children have the highest poverty rate, with 14 households (100.0%) falling below the poverty line. Among the single-parent households, those with 3 or 4 children have the highest poverty rate, with 16 household (100.0%) living below poverty.
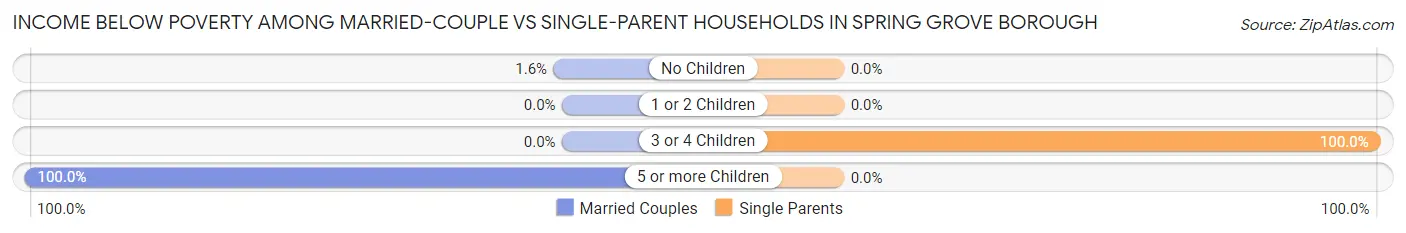
| Children | Married-Couple Families | Single-Parent Households |
| No Children | 5 (1.6%) | 0 (0.0%) |
| 1 or 2 Children | 0 (0.0%) | 0 (0.0%) |
| 3 or 4 Children | 0 (0.0%) | 16 (100.0%) |
| 5 or more Children | 14 (100.0%) | 0 (0.0%) |
| Total | 19 (4.4%) | 16 (13.1%) |
Race in Spring Grove borough
The most populous races in Spring Grove borough are White / Caucasian (1,925 | 89.9%), Hispanic or Latino (214 | 10.0%), and Two or more Races (180 | 8.4%).
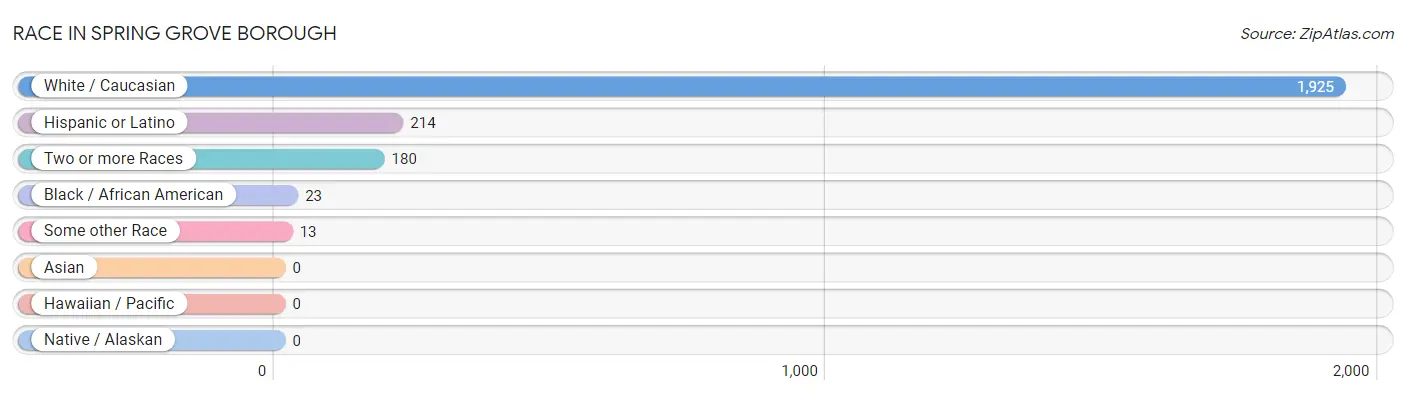
| Race | # Population | % Population |
| Asian | 0 | 0.0% |
| Black / African American | 23 | 1.1% |
| Hawaiian / Pacific | 0 | 0.0% |
| Hispanic or Latino | 214 | 10.0% |
| Native / Alaskan | 0 | 0.0% |
| White / Caucasian | 1,925 | 89.9% |
| Two or more Races | 180 | 8.4% |
| Some other Race | 13 | 0.6% |
| Total | 2,141 | 100.0% |
Ancestry in Spring Grove borough
The most populous ancestries reported in Spring Grove borough are German (1,177 | 55.0%), English (249 | 11.6%), American (200 | 9.3%), Irish (194 | 9.1%), and Mexican (97 | 4.5%), together accounting for 89.5% of all Spring Grove borough residents.
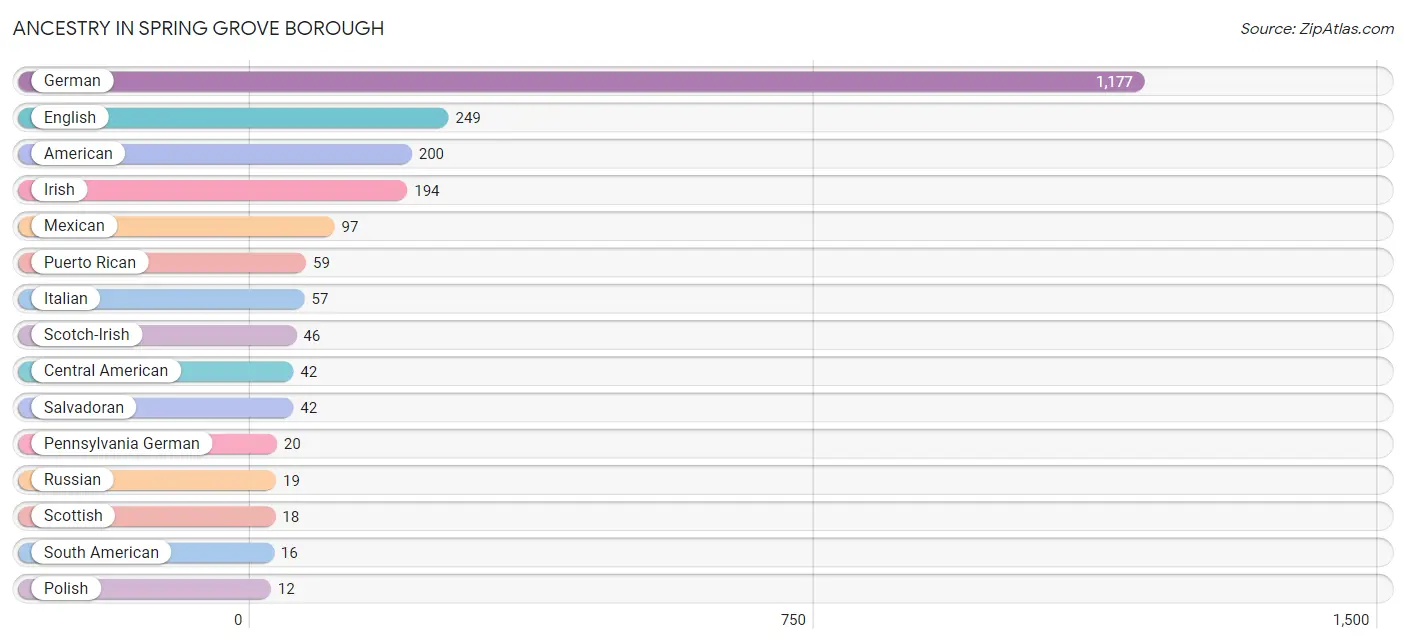
| Ancestry | # Population | % Population |
| American | 200 | 9.3% |
| Central American | 42 | 2.0% |
| Cherokee | 9 | 0.4% |
| Colombian | 11 | 0.5% |
| Danish | 8 | 0.4% |
| Dutch | 5 | 0.2% |
| Ecuadorian | 5 | 0.2% |
| English | 249 | 11.6% |
| European | 10 | 0.5% |
| German | 1,177 | 55.0% |
| Irish | 194 | 9.1% |
| Italian | 57 | 2.7% |
| Jamaican | 4 | 0.2% |
| Mexican | 97 | 4.5% |
| Norwegian | 10 | 0.5% |
| Pennsylvania German | 20 | 0.9% |
| Polish | 12 | 0.6% |
| Puerto Rican | 59 | 2.8% |
| Russian | 19 | 0.9% |
| Salvadoran | 42 | 2.0% |
| Scotch-Irish | 46 | 2.1% |
| Scottish | 18 | 0.8% |
| South American | 16 | 0.7% |
| Swedish | 6 | 0.3% |
| Welsh | 7 | 0.3% | View All 25 Rows |
Immigrants in Spring Grove borough
The most numerous immigrant groups reported in Spring Grove borough came from Latin America (14 | 0.6%), South America (10 | 0.5%), Colombia (5 | 0.2%), Ecuador (5 | 0.2%), and Caribbean (4 | 0.2%), together accounting for 1.8% of all Spring Grove borough residents.
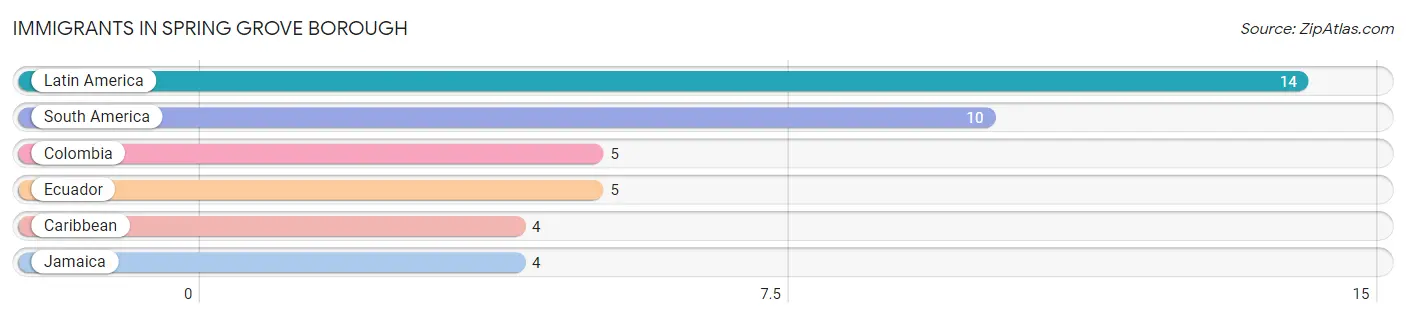
| Immigration Origin | # Population | % Population |
| Caribbean | 4 | 0.2% |
| Colombia | 5 | 0.2% |
| Ecuador | 5 | 0.2% |
| Jamaica | 4 | 0.2% |
| Latin America | 14 | 0.6% |
| South America | 10 | 0.5% | View All 6 Rows |
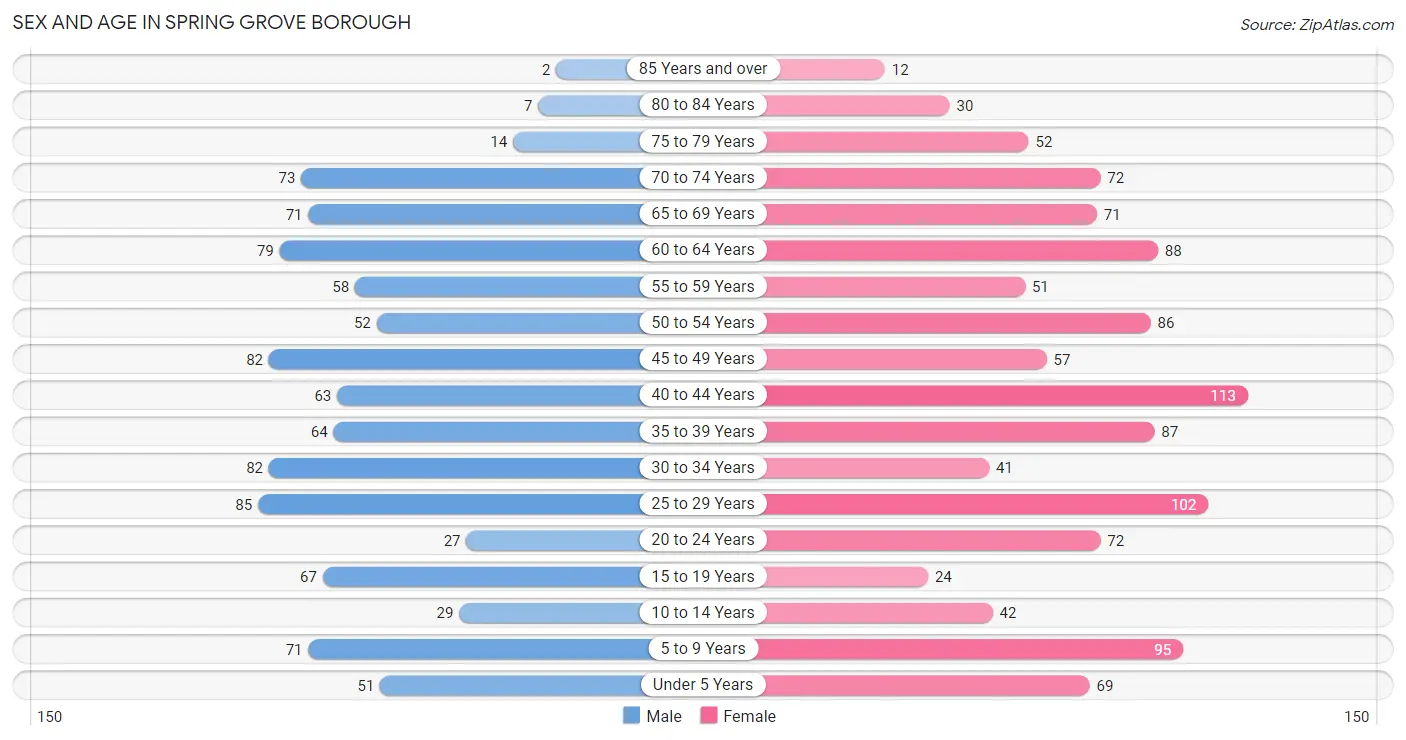
Sex and Age in Spring Grove borough
Sex and Age in Spring Grove borough
The most populous age groups in Spring Grove borough are 25 to 29 Years (85 | 8.7%) for men and 40 to 44 Years (113 | 9.7%) for women.
| Age Bracket | Male | Female |
| Under 5 Years | 51 (5.2%) | 69 (5.9%) |
| 5 to 9 Years | 71 (7.3%) | 95 (8.2%) |
| 10 to 14 Years | 29 (3.0%) | 42 (3.6%) |
| 15 to 19 Years | 67 (6.9%) | 24 (2.1%) |
| 20 to 24 Years | 27 (2.8%) | 72 (6.2%) |
| 25 to 29 Years | 85 (8.7%) | 102 (8.8%) |
| 30 to 34 Years | 82 (8.4%) | 41 (3.5%) |
| 35 to 39 Years | 64 (6.6%) | 87 (7.5%) |
| 40 to 44 Years | 63 (6.5%) | 113 (9.7%) |
| 45 to 49 Years | 82 (8.4%) | 57 (4.9%) |
| 50 to 54 Years | 52 (5.3%) | 86 (7.4%) |
| 55 to 59 Years | 58 (5.9%) | 51 (4.4%) |
| 60 to 64 Years | 79 (8.1%) | 88 (7.6%) |
| 65 to 69 Years | 71 (7.3%) | 71 (6.1%) |
| 70 to 74 Years | 73 (7.5%) | 72 (6.2%) |
| 75 to 79 Years | 14 (1.4%) | 52 (4.5%) |
| 80 to 84 Years | 7 (0.7%) | 30 (2.6%) |
| 85 Years and over | 2 (0.2%) | 12 (1.0%) |
| Total | 977 (100.0%) | 1,164 (100.0%) |
Families and Households in Spring Grove borough
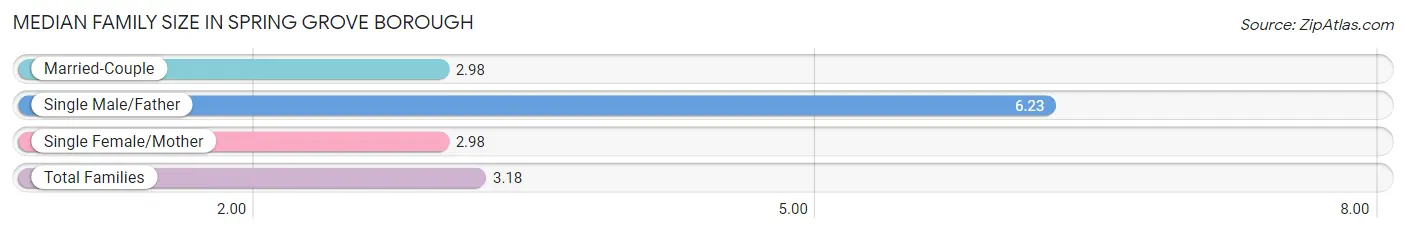
Median Family Size in Spring Grove borough
The median family size in Spring Grove borough is 3.18 persons per family, with single male/father families (35 | 6.3%) accounting for the largest median family size of 6.23 persons per family. On the other hand, married-couple families (433 | 78.0%) represent the smallest median family size with 2.98 persons per family.
| Family Type | # Families | Family Size |
| Married-Couple | 433 (78.0%) | 2.98 |
| Single Male/Father | 35 (6.3%) | 6.23 |
| Single Female/Mother | 87 (15.7%) | 2.98 |
| Total Families | 555 (100.0%) | 3.18 |
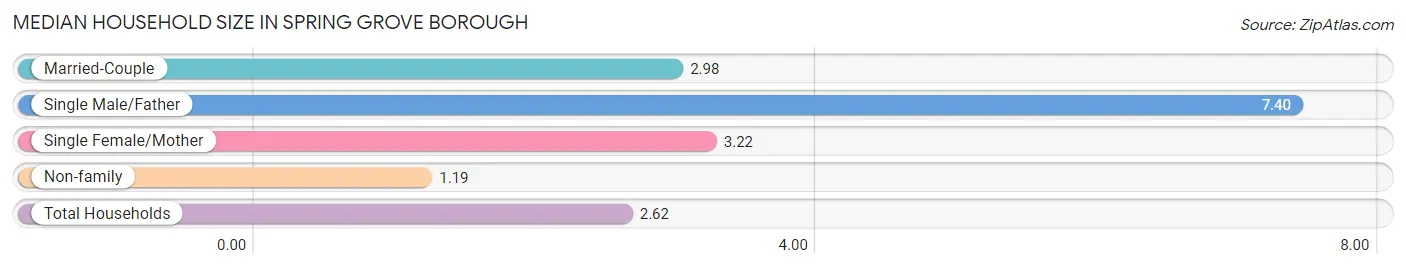
Median Household Size in Spring Grove borough
The median household size in Spring Grove borough is 2.62 persons per household, with single male/father households (35 | 4.3%) accounting for the largest median household size of 7.4 persons per household. non-family households (262 | 32.1%) represent the smallest median household size with 1.19 persons per household.
| Household Type | # Households | Household Size |
| Married-Couple | 433 (53.0%) | 2.98 |
| Single Male/Father | 35 (4.3%) | 7.40 |
| Single Female/Mother | 87 (10.6%) | 3.22 |
| Non-family | 262 (32.1%) | 1.19 |
| Total Households | 817 (100.0%) | 2.62 |
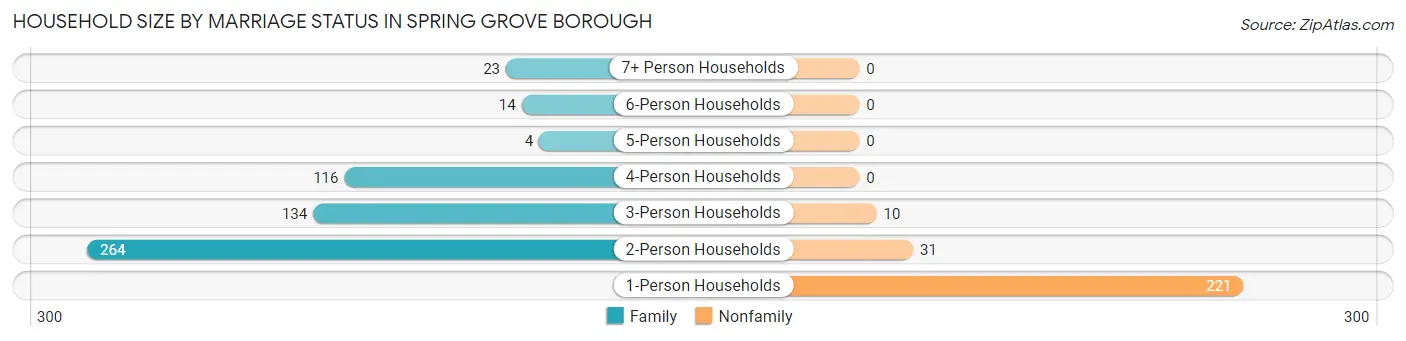
Household Size by Marriage Status in Spring Grove borough
Out of a total of 817 households in Spring Grove borough, 555 (67.9%) are family households, while 262 (32.1%) are nonfamily households. The most numerous type of family households are 2-person households, comprising 264, and the most common type of nonfamily households are 1-person households, comprising 221.
| Household Size | Family Households | Nonfamily Households |
| 1-Person Households | - | 221 (27.1%) |
| 2-Person Households | 264 (32.3%) | 31 (3.8%) |
| 3-Person Households | 134 (16.4%) | 10 (1.2%) |
| 4-Person Households | 116 (14.2%) | 0 (0.0%) |
| 5-Person Households | 4 (0.5%) | 0 (0.0%) |
| 6-Person Households | 14 (1.7%) | 0 (0.0%) |
| 7+ Person Households | 23 (2.8%) | 0 (0.0%) |
| Total | 555 (67.9%) | 262 (32.1%) |
Female Fertility in Spring Grove borough
Fertility by Age in Spring Grove borough
Average fertility rate in Spring Grove borough is 24.0 births per 1,000 women. Women in the age bracket of 20 to 34 years have the highest fertility rate with 56.0 births per 1,000 women. Women in the age bracket of 20 to 34 years acount for 100.0% of all women with births.
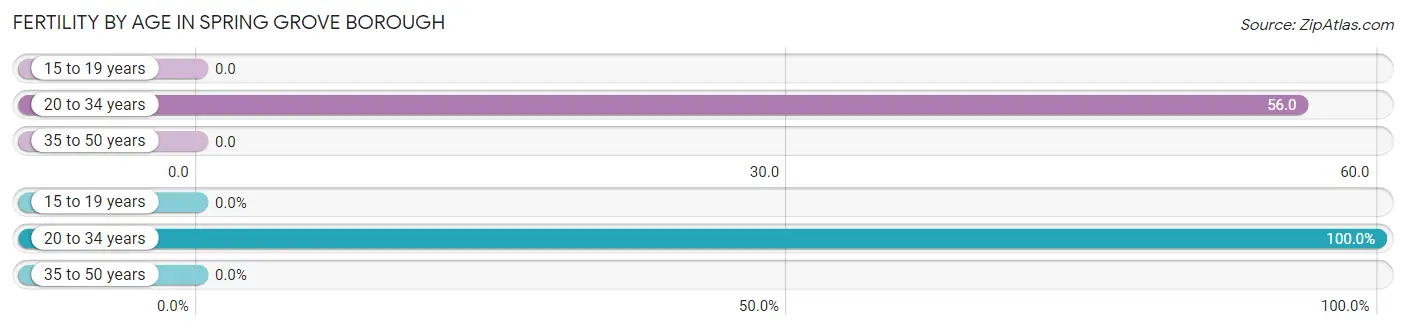
| Age Bracket | Women with Births | Births / 1,000 Women |
| 15 to 19 years | 0 (0.0%) | 0.0 |
| 20 to 34 years | 12 (100.0%) | 56.0 |
| 35 to 50 years | 0 (0.0%) | 0.0 |
| Total | 12 (100.0%) | 24.0 |
Fertility by Age by Marriage Status in Spring Grove borough
41.7% of women with births (12) in Spring Grove borough are married. The highest percentage of unmarried women with births falls into 20 to 34 years age bracket with 58.3% of them unmarried at the time of birth, while the lowest percentage of unmarried women with births belong to 20 to 34 years age bracket with 58.3% of them unmarried.
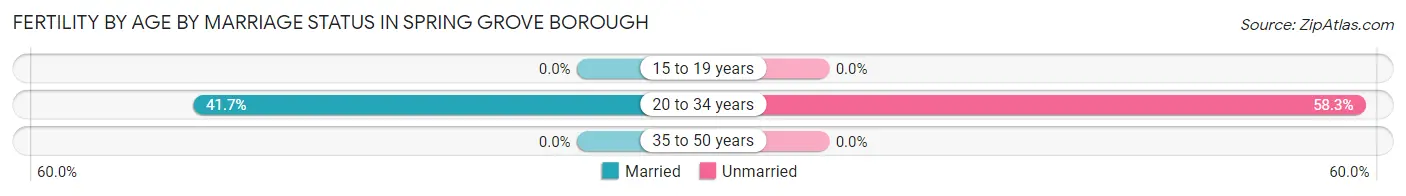
| Age Bracket | Married | Unmarried |
| 15 to 19 years | 0 (0.0%) | 0 (0.0%) |
| 20 to 34 years | 5 (41.7%) | 7 (58.3%) |
| 35 to 50 years | 0 (0.0%) | 0 (0.0%) |
| Total | 5 (41.7%) | 7 (58.3%) |
Fertility by Education in Spring Grove borough
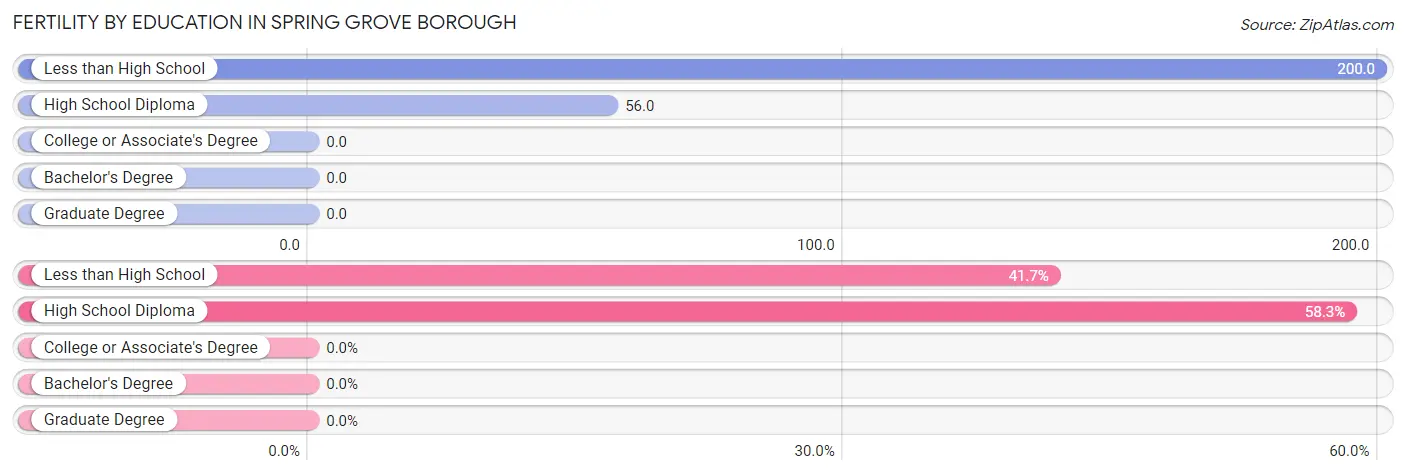
| Educational Attainment | Women with Births | Births / 1,000 Women |
| Less than High School | 5 (41.7%) | 200.0 |
| High School Diploma | 7 (58.3%) | 56.0 |
| College or Associate's Degree | 0 (0.0%) | 0.0 |
| Bachelor's Degree | 0 (0.0%) | 0.0 |
| Graduate Degree | 0 (0.0%) | 0.0 |
| Total | 12 (100.0%) | 24.0 |
Fertility by Education by Marriage Status in Spring Grove borough
58.3% of women with births in Spring Grove borough are unmarried. Women with the educational attainment of less than high school are most likely to be married with 100.0% of them married at childbirth, while women with the educational attainment of high school diploma are least likely to be married with 100.0% of them unmarried at childbirth.
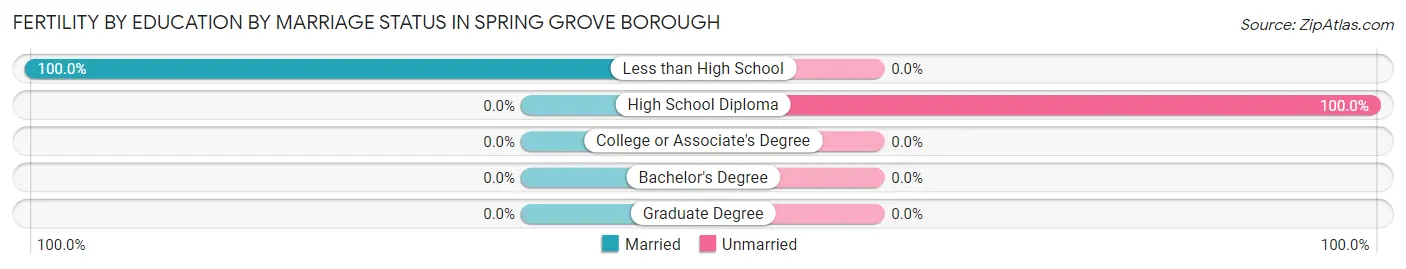
| Educational Attainment | Married | Unmarried |
| Less than High School | 5 (100.0%) | 0 (0.0%) |
| High School Diploma | 0 (0.0%) | 7 (100.0%) |
| College or Associate's Degree | 0 (0.0%) | 0 (0.0%) |
| Bachelor's Degree | 0 (0.0%) | 0 (0.0%) |
| Graduate Degree | 0 (0.0%) | 0 (0.0%) |
| Total | 5 (41.7%) | 7 (58.3%) |
Employment Characteristics in Spring Grove borough
Employment by Class of Employer in Spring Grove borough
Among the 1,137 employed individuals in Spring Grove borough, private company employees (824 | 72.5%), self-employed (not incorporated) (136 | 12.0%), and local government employees (77 | 6.8%) make up the most common classes of employment.
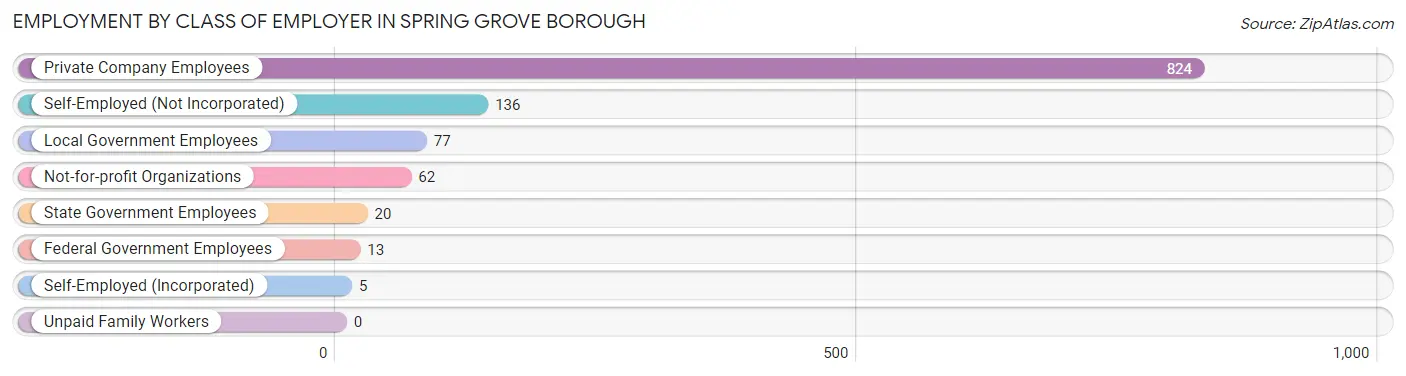
| Employer Class | # Employees | % Employees |
| Private Company Employees | 824 | 72.5% |
| Self-Employed (Incorporated) | 5 | 0.4% |
| Self-Employed (Not Incorporated) | 136 | 12.0% |
| Not-for-profit Organizations | 62 | 5.4% |
| Local Government Employees | 77 | 6.8% |
| State Government Employees | 20 | 1.8% |
| Federal Government Employees | 13 | 1.1% |
| Unpaid Family Workers | 0 | 0.0% |
| Total | 1,137 | 100.0% |
Employment Status by Age in Spring Grove borough
According to the labor force statistics for Spring Grove borough, out of the total population over 16 years of age (1,760), 66.8% or 1,176 individuals are in the labor force, with 2.6% or 31 of them unemployed. The age group with the highest labor force participation rate is 30 to 34 years, with 95.9% or 118 individuals in the labor force. Within the labor force, the 16 to 19 years age range has the highest percentage of unemployed individuals, with 45.5% or 15 of them being unemployed.
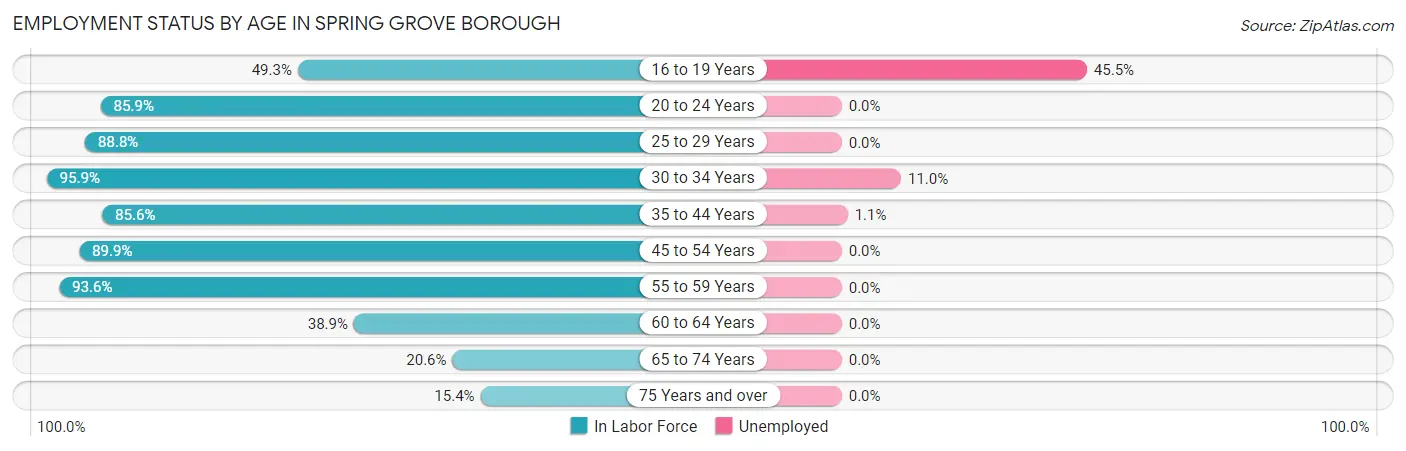
| Age Bracket | In Labor Force | Unemployed |
| 16 to 19 Years | 33 (49.3%) | 15 (45.5%) |
| 20 to 24 Years | 85 (85.9%) | 0 (0.0%) |
| 25 to 29 Years | 166 (88.8%) | 0 (0.0%) |
| 30 to 34 Years | 118 (95.9%) | 13 (11.0%) |
| 35 to 44 Years | 280 (85.6%) | 3 (1.1%) |
| 45 to 54 Years | 249 (89.9%) | 0 (0.0%) |
| 55 to 59 Years | 102 (93.6%) | 0 (0.0%) |
| 60 to 64 Years | 65 (38.9%) | 0 (0.0%) |
| 65 to 74 Years | 59 (20.6%) | 0 (0.0%) |
| 75 Years and over | 18 (15.4%) | 0 (0.0%) |
| Total | 1,176 (66.8%) | 31 (2.6%) |
Employment Status by Educational Attainment in Spring Grove borough
According to labor force statistics for Spring Grove borough, 82.4% of individuals (981) out of the total population between 25 and 64 years of age (1,190) are in the labor force, with 1.6% or 16 of them being unemployed. The group with the highest labor force participation rate are those with the educational attainment of bachelor's degree or higher, with 98.4% or 300 individuals in the labor force. Within the labor force, individuals with high school diploma education have the highest percentage of unemployment, with 3.6% or 16 of them being unemployed.
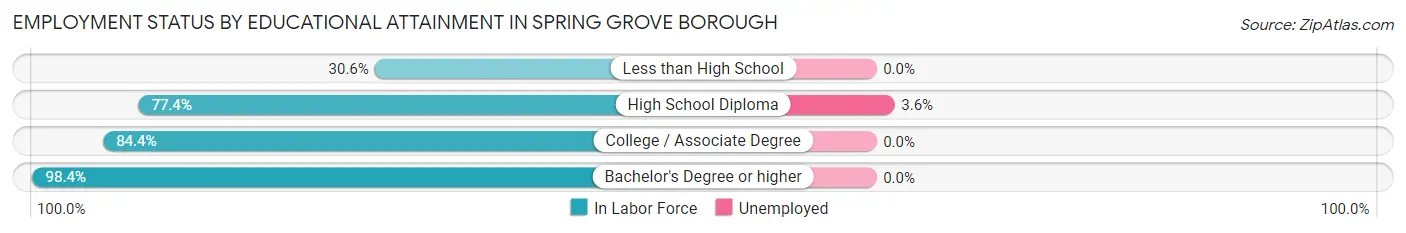
| Educational Attainment | In Labor Force | Unemployed |
| Less than High School | 15 (30.6%) | 0 (0.0%) |
| High School Diploma | 448 (77.4%) | 21 (3.6%) |
| College / Associate Degree | 217 (84.4%) | 0 (0.0%) |
| Bachelor's Degree or higher | 300 (98.4%) | 0 (0.0%) |
| Total | 981 (82.4%) | 19 (1.6%) |
Employment Occupations by Sex in Spring Grove borough
Management, Business, Science and Arts Occupations
The most common Management, Business, Science and Arts occupations in Spring Grove borough are Management (171 | 14.9%), Community & Social Service (82 | 7.2%), Education Instruction & Library (59 | 5.2%), Health Diagnosing & Treating (45 | 3.9%), and Computers, Engineering & Science (29 | 2.5%).
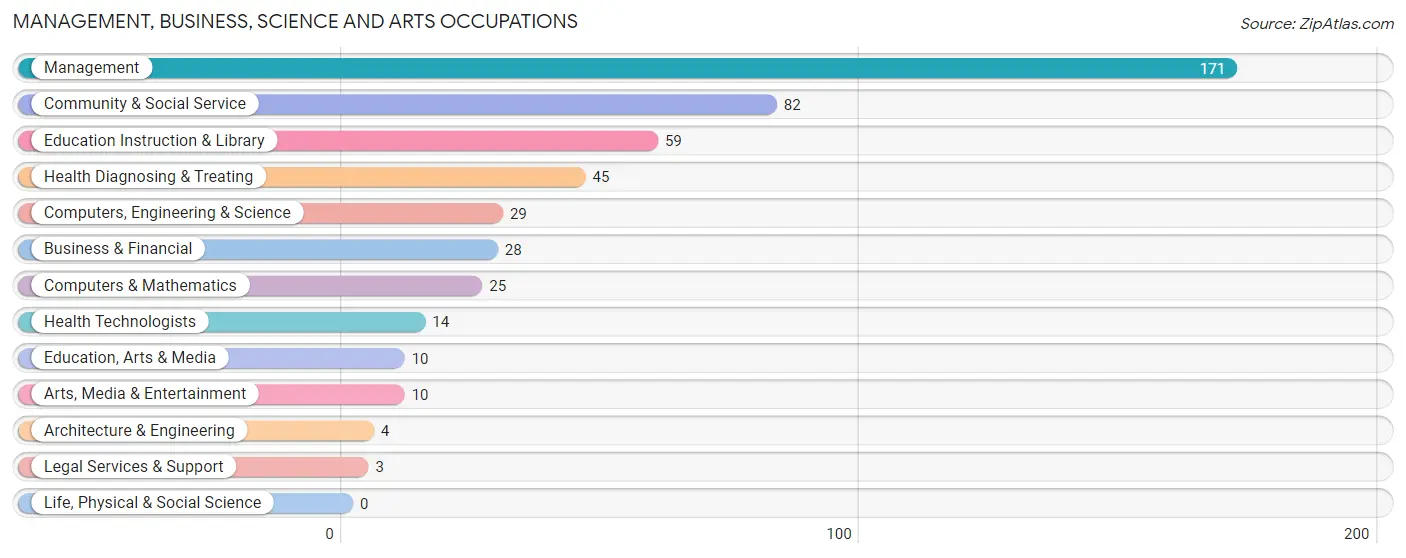
Management, Business, Science and Arts Occupations by Sex
Within the Management, Business, Science and Arts occupations in Spring Grove borough, the most male-oriented occupations are Computers, Engineering & Science (100.0%), Computers & Mathematics (100.0%), and Architecture & Engineering (100.0%), while the most female-oriented occupations are Legal Services & Support (100.0%), Health Diagnosing & Treating (100.0%), and Health Technologists (100.0%).
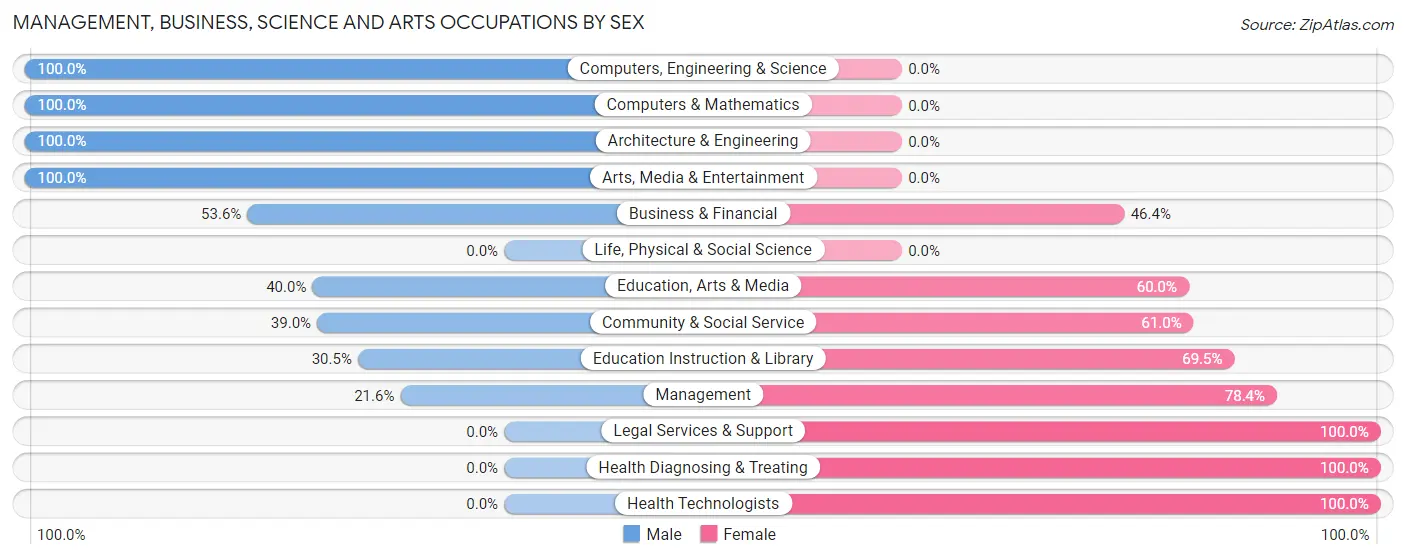
| Occupation | Male | Female |
| Management | 37 (21.6%) | 134 (78.4%) |
| Business & Financial | 15 (53.6%) | 13 (46.4%) |
| Computers, Engineering & Science | 29 (100.0%) | 0 (0.0%) |
| Computers & Mathematics | 25 (100.0%) | 0 (0.0%) |
| Architecture & Engineering | 4 (100.0%) | 0 (0.0%) |
| Life, Physical & Social Science | 0 (0.0%) | 0 (0.0%) |
| Community & Social Service | 32 (39.0%) | 50 (61.0%) |
| Education, Arts & Media | 4 (40.0%) | 6 (60.0%) |
| Legal Services & Support | 0 (0.0%) | 3 (100.0%) |
| Education Instruction & Library | 18 (30.5%) | 41 (69.5%) |
| Arts, Media & Entertainment | 10 (100.0%) | 0 (0.0%) |
| Health Diagnosing & Treating | 0 (0.0%) | 45 (100.0%) |
| Health Technologists | 0 (0.0%) | 14 (100.0%) |
| Total (Category) | 113 (31.8%) | 242 (68.2%) |
| Total (Overall) | 579 (50.6%) | 565 (49.4%) |
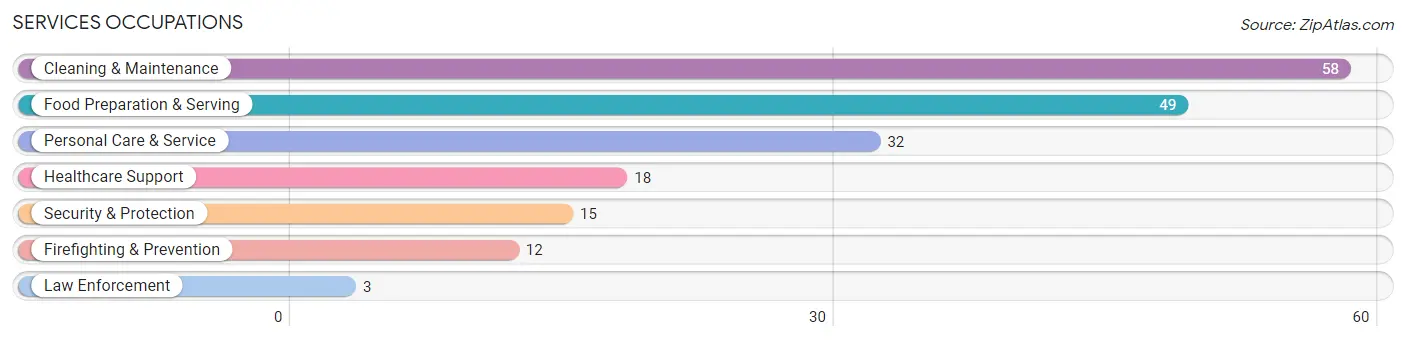
Services Occupations
The most common Services occupations in Spring Grove borough are Cleaning & Maintenance (58 | 5.1%), Food Preparation & Serving (49 | 4.3%), Personal Care & Service (32 | 2.8%), Healthcare Support (18 | 1.6%), and Security & Protection (15 | 1.3%).
Services Occupations by Sex
Within the Services occupations in Spring Grove borough, the most male-oriented occupations are Firefighting & Prevention (100.0%), Security & Protection (80.0%), and Cleaning & Maintenance (43.1%), while the most female-oriented occupations are Law Enforcement (100.0%), Personal Care & Service (100.0%), and Healthcare Support (83.3%).
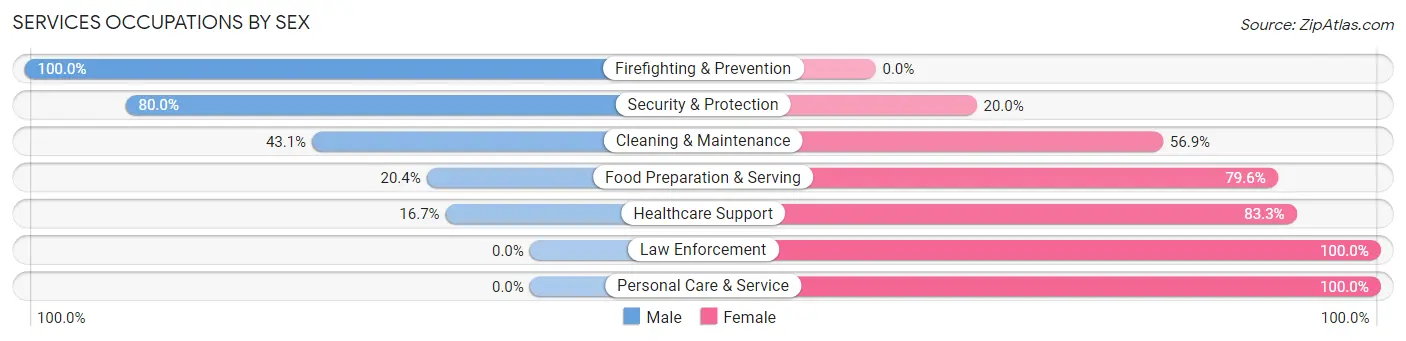
| Occupation | Male | Female |
| Healthcare Support | 3 (16.7%) | 15 (83.3%) |
| Security & Protection | 12 (80.0%) | 3 (20.0%) |
| Firefighting & Prevention | 12 (100.0%) | 0 (0.0%) |
| Law Enforcement | 0 (0.0%) | 3 (100.0%) |
| Food Preparation & Serving | 10 (20.4%) | 39 (79.6%) |
| Cleaning & Maintenance | 25 (43.1%) | 33 (56.9%) |
| Personal Care & Service | 0 (0.0%) | 32 (100.0%) |
| Total (Category) | 50 (29.1%) | 122 (70.9%) |
| Total (Overall) | 579 (50.6%) | 565 (49.4%) |
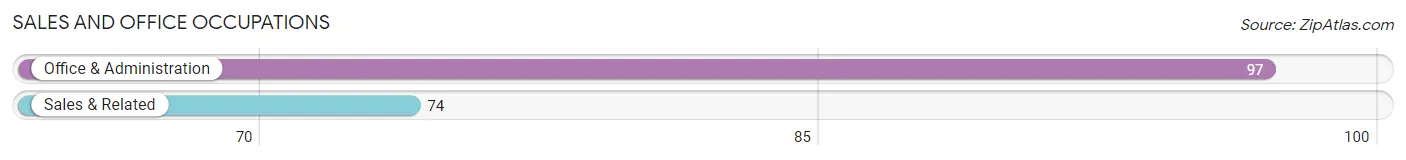
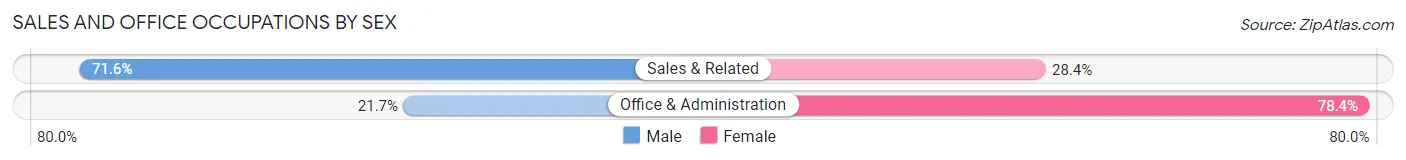
Sales and Office Occupations
The most common Sales and Office occupations in Spring Grove borough are Office & Administration (97 | 8.5%), and Sales & Related (74 | 6.5%).
Sales and Office Occupations by Sex
| Occupation | Male | Female |
| Sales & Related | 53 (71.6%) | 21 (28.4%) |
| Office & Administration | 21 (21.6%) | 76 (78.3%) |
| Total (Category) | 74 (43.3%) | 97 (56.7%) |
| Total (Overall) | 579 (50.6%) | 565 (49.4%) |
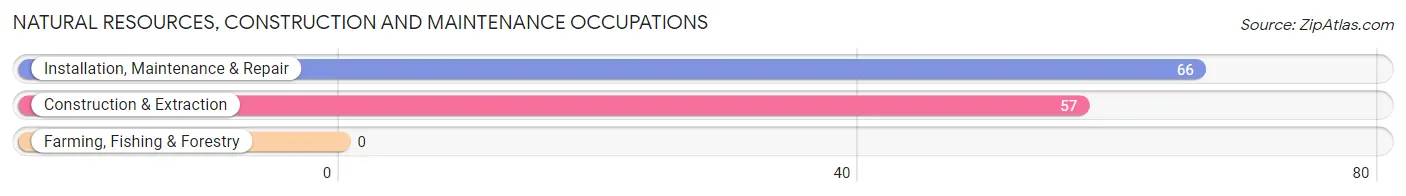
Natural Resources, Construction and Maintenance Occupations
The most common Natural Resources, Construction and Maintenance occupations in Spring Grove borough are Installation, Maintenance & Repair (66 | 5.8%), and Construction & Extraction (57 | 5.0%).
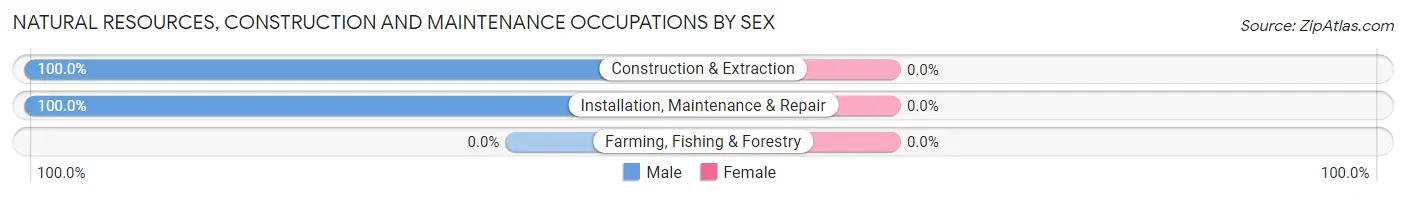
Natural Resources, Construction and Maintenance Occupations by Sex
| Occupation | Male | Female |
| Farming, Fishing & Forestry | 0 (0.0%) | 0 (0.0%) |
| Construction & Extraction | 57 (100.0%) | 0 (0.0%) |
| Installation, Maintenance & Repair | 66 (100.0%) | 0 (0.0%) |
| Total (Category) | 123 (100.0%) | 0 (0.0%) |
| Total (Overall) | 579 (50.6%) | 565 (49.4%) |
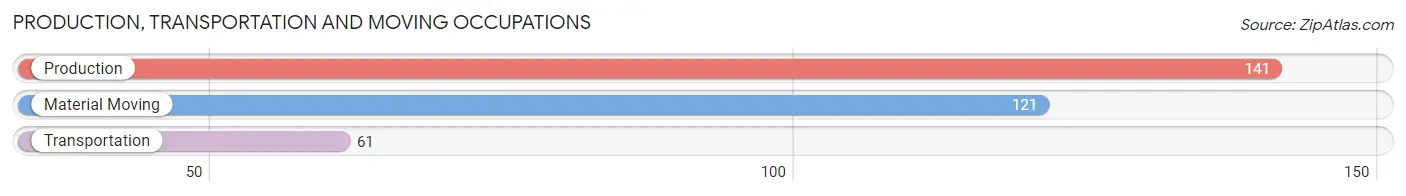
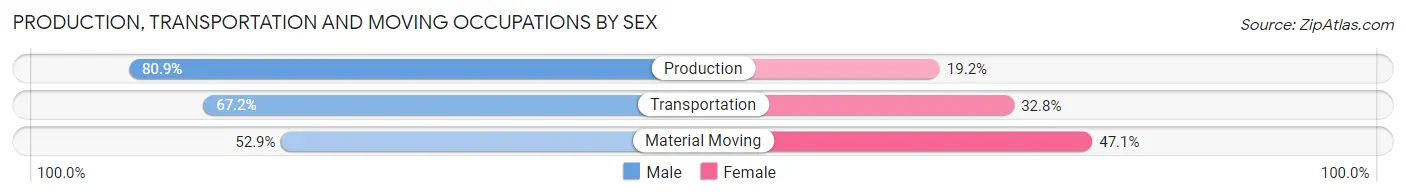
Production, Transportation and Moving Occupations
The most common Production, Transportation and Moving occupations in Spring Grove borough are Production (141 | 12.3%), Material Moving (121 | 10.6%), and Transportation (61 | 5.3%).
Production, Transportation and Moving Occupations by Sex
| Occupation | Male | Female |
| Production | 114 (80.8%) | 27 (19.2%) |
| Transportation | 41 (67.2%) | 20 (32.8%) |
| Material Moving | 64 (52.9%) | 57 (47.1%) |
| Total (Category) | 219 (67.8%) | 104 (32.2%) |
| Total (Overall) | 579 (50.6%) | 565 (49.4%) |
Employment Industries by Sex in Spring Grove borough
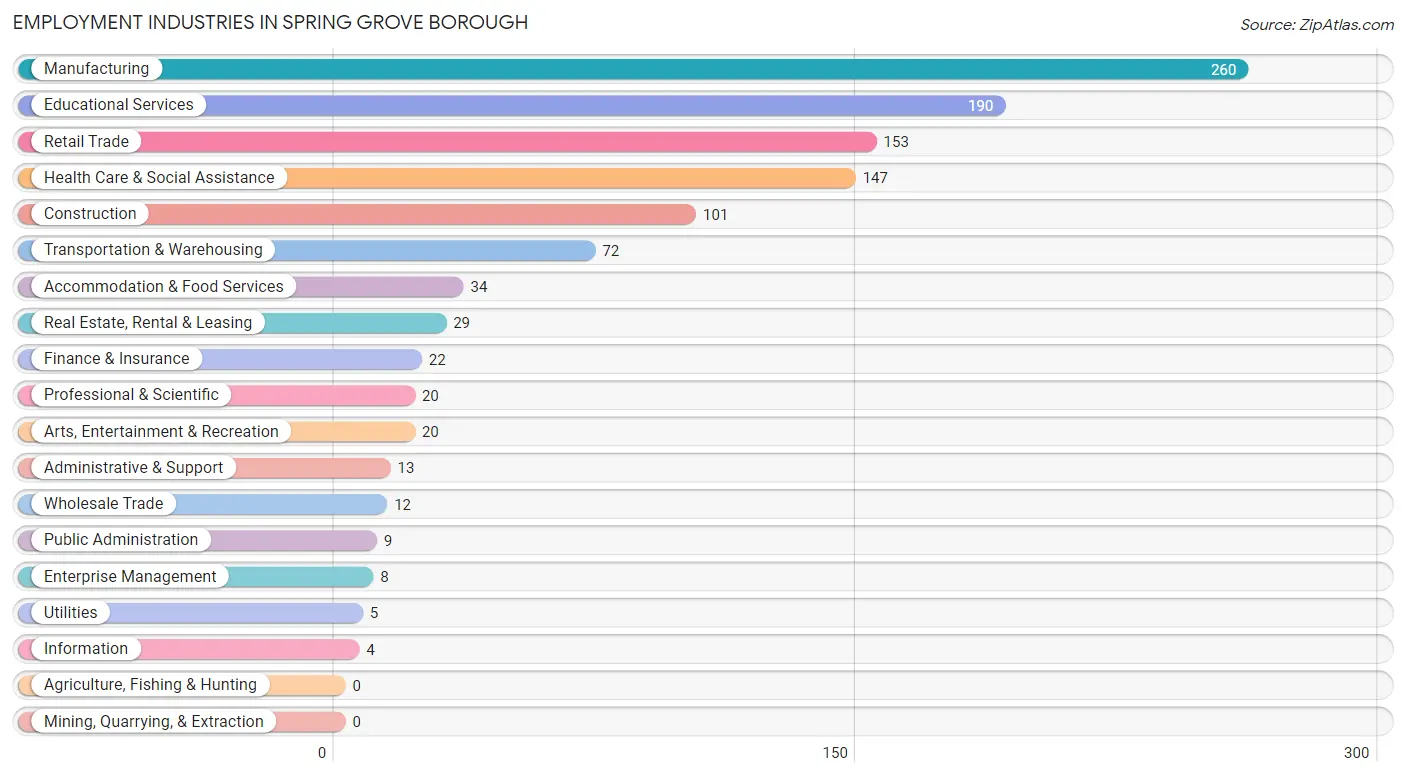
Employment Industries in Spring Grove borough
The major employment industries in Spring Grove borough include Manufacturing (260 | 22.7%), Educational Services (190 | 16.6%), Retail Trade (153 | 13.4%), Health Care & Social Assistance (147 | 12.9%), and Construction (101 | 8.8%).
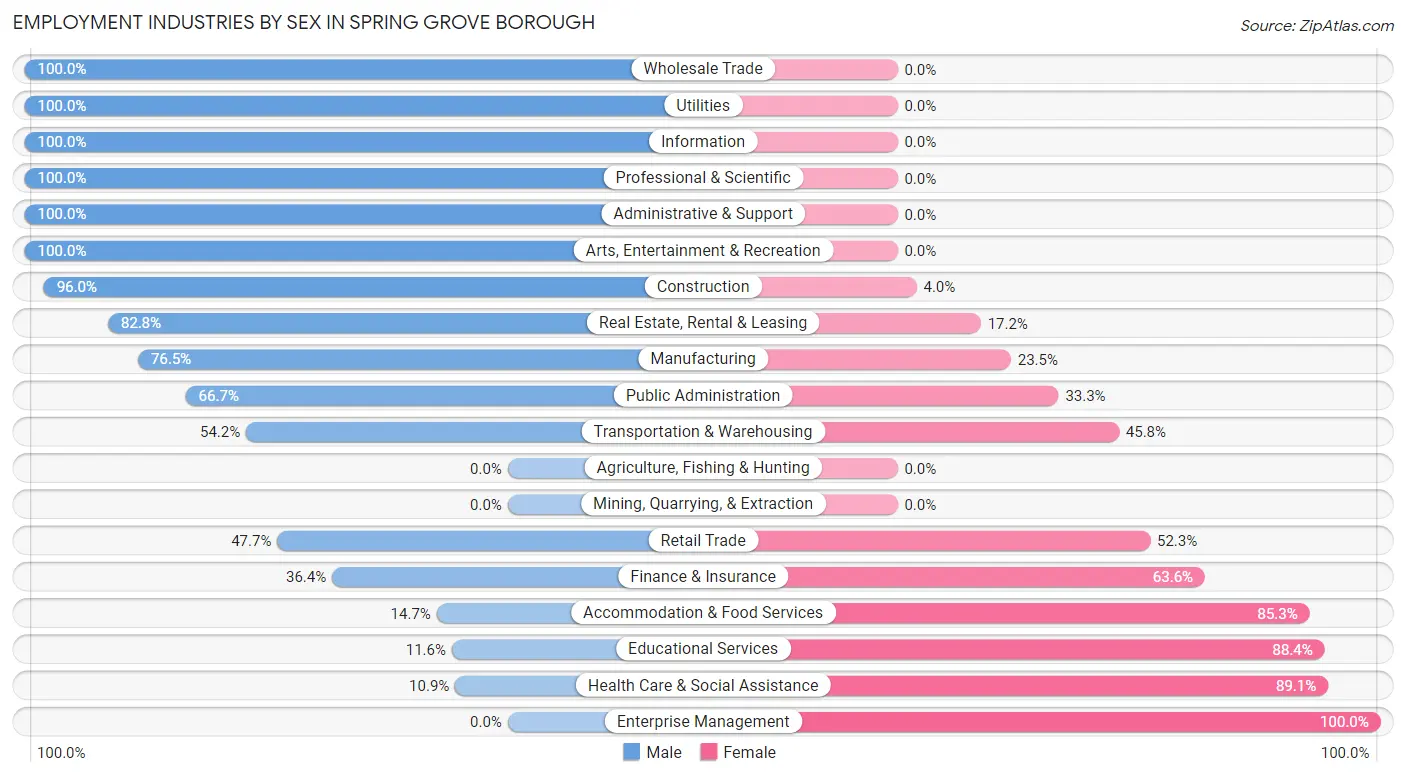
Employment Industries by Sex in Spring Grove borough
The Spring Grove borough industries that see more men than women are Wholesale Trade (100.0%), Utilities (100.0%), and Information (100.0%), whereas the industries that tend to have a higher number of women are Enterprise Management (100.0%), Health Care & Social Assistance (89.1%), and Educational Services (88.4%).
| Industry | Male | Female |
| Agriculture, Fishing & Hunting | 0 (0.0%) | 0 (0.0%) |
| Mining, Quarrying, & Extraction | 0 (0.0%) | 0 (0.0%) |
| Construction | 97 (96.0%) | 4 (4.0%) |
| Manufacturing | 199 (76.5%) | 61 (23.5%) |
| Wholesale Trade | 12 (100.0%) | 0 (0.0%) |
| Retail Trade | 73 (47.7%) | 80 (52.3%) |
| Transportation & Warehousing | 39 (54.2%) | 33 (45.8%) |
| Utilities | 5 (100.0%) | 0 (0.0%) |
| Information | 4 (100.0%) | 0 (0.0%) |
| Finance & Insurance | 8 (36.4%) | 14 (63.6%) |
| Real Estate, Rental & Leasing | 24 (82.8%) | 5 (17.2%) |
| Professional & Scientific | 20 (100.0%) | 0 (0.0%) |
| Enterprise Management | 0 (0.0%) | 8 (100.0%) |
| Administrative & Support | 13 (100.0%) | 0 (0.0%) |
| Educational Services | 22 (11.6%) | 168 (88.4%) |
| Health Care & Social Assistance | 16 (10.9%) | 131 (89.1%) |
| Arts, Entertainment & Recreation | 20 (100.0%) | 0 (0.0%) |
| Accommodation & Food Services | 5 (14.7%) | 29 (85.3%) |
| Public Administration | 6 (66.7%) | 3 (33.3%) |
| Total | 579 (50.6%) | 565 (49.4%) |
Education in Spring Grove borough
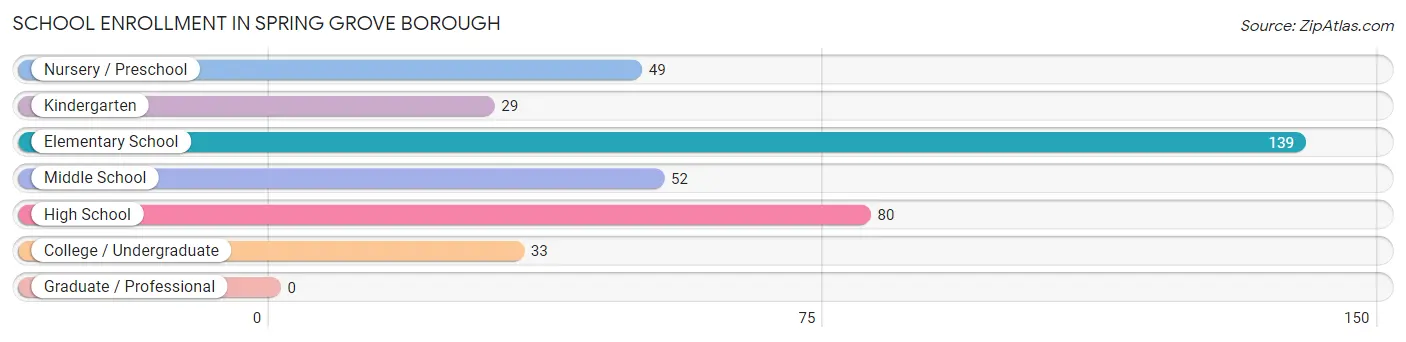
School Enrollment in Spring Grove borough
The most common levels of schooling among the 382 students in Spring Grove borough are elementary school (139 | 36.4%), high school (80 | 20.9%), and middle school (52 | 13.6%).
| School Level | # Students | % Students |
| Nursery / Preschool | 49 | 12.8% |
| Kindergarten | 29 | 7.6% |
| Elementary School | 139 | 36.4% |
| Middle School | 52 | 13.6% |
| High School | 80 | 20.9% |
| College / Undergraduate | 33 | 8.6% |
| Graduate / Professional | 0 | 0.0% |
| Total | 382 | 100.0% |
School Enrollment by Age by Funding Source in Spring Grove borough
Out of a total of 382 students who are enrolled in schools in Spring Grove borough, 60 (15.7%) attend a private institution, while the remaining 322 (84.3%) are enrolled in public schools. The age group of 3 to 4 year olds has the highest likelihood of being enrolled in private schools, with 44 (100.0% in the age bracket) enrolled. Conversely, the age group of 15 to 17 year olds has the lowest likelihood of being enrolled in a private school, with 58 (100.0% in the age bracket) attending a public institution.
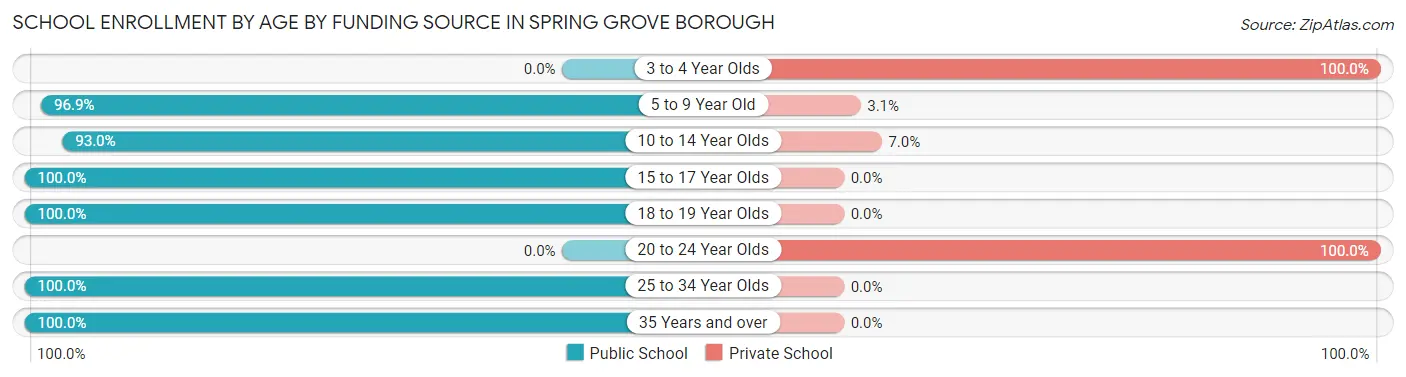
| Age Bracket | Public School | Private School |
| 3 to 4 Year Olds | 0 (0.0%) | 44 (100.0%) |
| 5 to 9 Year Old | 157 (96.9%) | 5 (3.1%) |
| 10 to 14 Year Olds | 66 (93.0%) | 5 (7.0%) |
| 15 to 17 Year Olds | 58 (100.0%) | 0 (0.0%) |
| 18 to 19 Year Olds | 18 (100.0%) | 0 (0.0%) |
| 20 to 24 Year Olds | 0 (0.0%) | 6 (100.0%) |
| 25 to 34 Year Olds | 18 (100.0%) | 0 (0.0%) |
| 35 Years and over | 5 (100.0%) | 0 (0.0%) |
| Total | 322 (84.3%) | 60 (15.7%) |
Educational Attainment by Field of Study in Spring Grove borough
Visual & performing arts (108 | 29.3%), social sciences (57 | 15.4%), business (41 | 11.1%), education (37 | 10.0%), and communications (29 | 7.9%) are the most common fields of study among 369 individuals in Spring Grove borough who have obtained a bachelor's degree or higher.
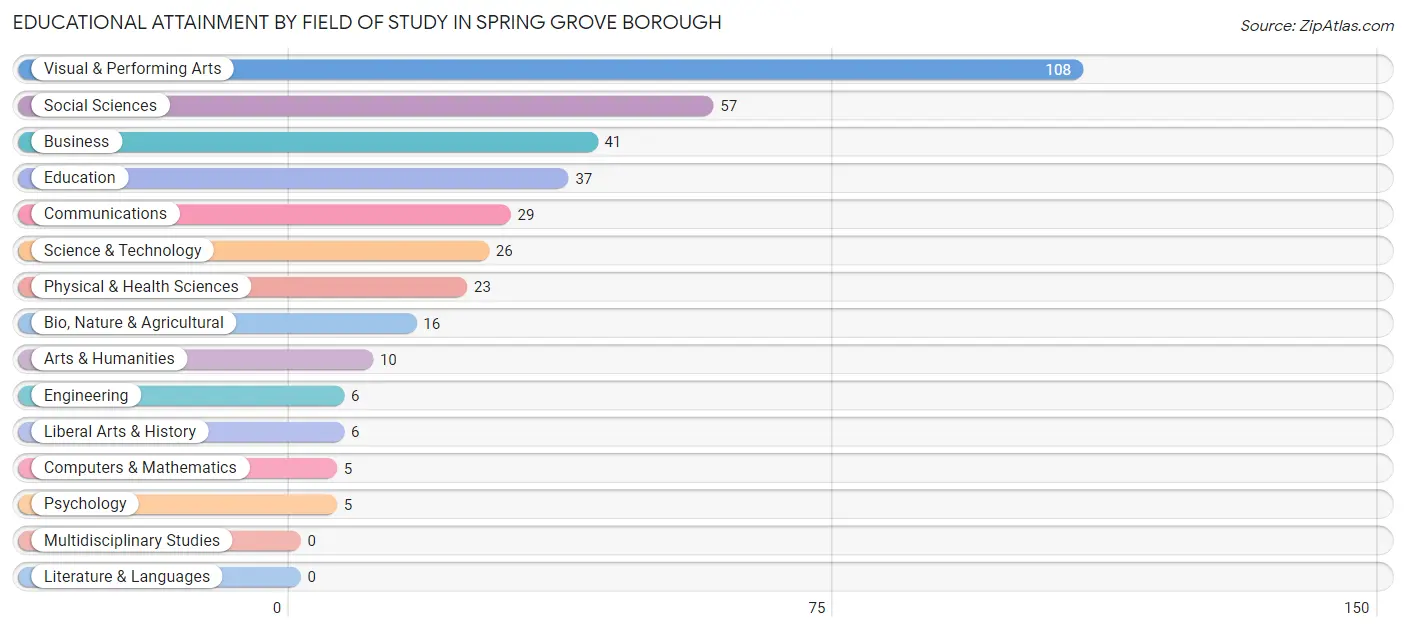
| Field of Study | # Graduates | % Graduates |
| Computers & Mathematics | 5 | 1.4% |
| Bio, Nature & Agricultural | 16 | 4.3% |
| Physical & Health Sciences | 23 | 6.2% |
| Psychology | 5 | 1.4% |
| Social Sciences | 57 | 15.4% |
| Engineering | 6 | 1.6% |
| Multidisciplinary Studies | 0 | 0.0% |
| Science & Technology | 26 | 7.0% |
| Business | 41 | 11.1% |
| Education | 37 | 10.0% |
| Literature & Languages | 0 | 0.0% |
| Liberal Arts & History | 6 | 1.6% |
| Visual & Performing Arts | 108 | 29.3% |
| Communications | 29 | 7.9% |
| Arts & Humanities | 10 | 2.7% |
| Total | 369 | 100.0% |
Transportation & Commute in Spring Grove borough
Vehicle Availability by Sex in Spring Grove borough
The most prevalent vehicle ownership categories in Spring Grove borough are males with 2 vehicles (241, accounting for 41.6%) and females with 2 vehicles (275, making up 43.2%).
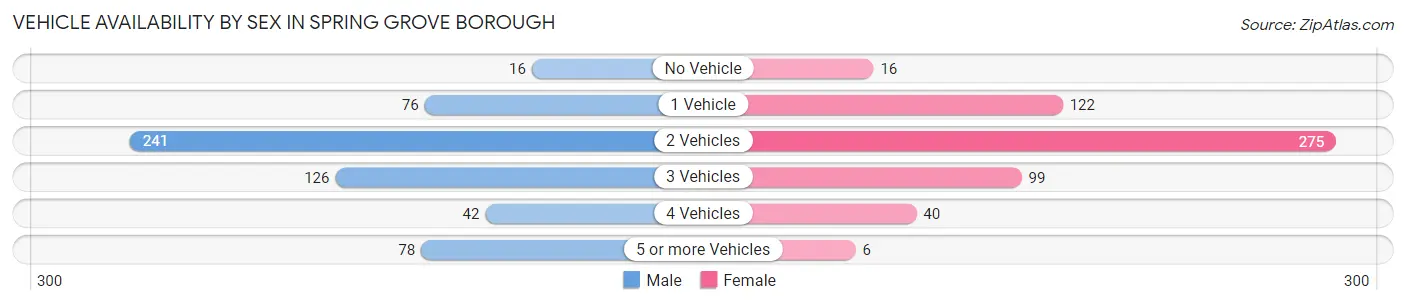
| Vehicles Available | Male | Female |
| No Vehicle | 16 (2.8%) | 16 (2.9%) |
| 1 Vehicle | 76 (13.1%) | 122 (21.9%) |
| 2 Vehicles | 241 (41.6%) | 275 (49.3%) |
| 3 Vehicles | 126 (21.8%) | 99 (17.7%) |
| 4 Vehicles | 42 (7.2%) | 40 (7.2%) |
| 5 or more Vehicles | 78 (13.5%) | 6 (1.1%) |
| Total | 579 (100.0%) | 558 (100.0%) |
Commute Time in Spring Grove borough
The most frequently occuring commute durations in Spring Grove borough are 5 to 9 minutes (205 commuters, 19.0%), 20 to 24 minutes (204 commuters, 18.9%), and 30 to 34 minutes (118 commuters, 10.9%).
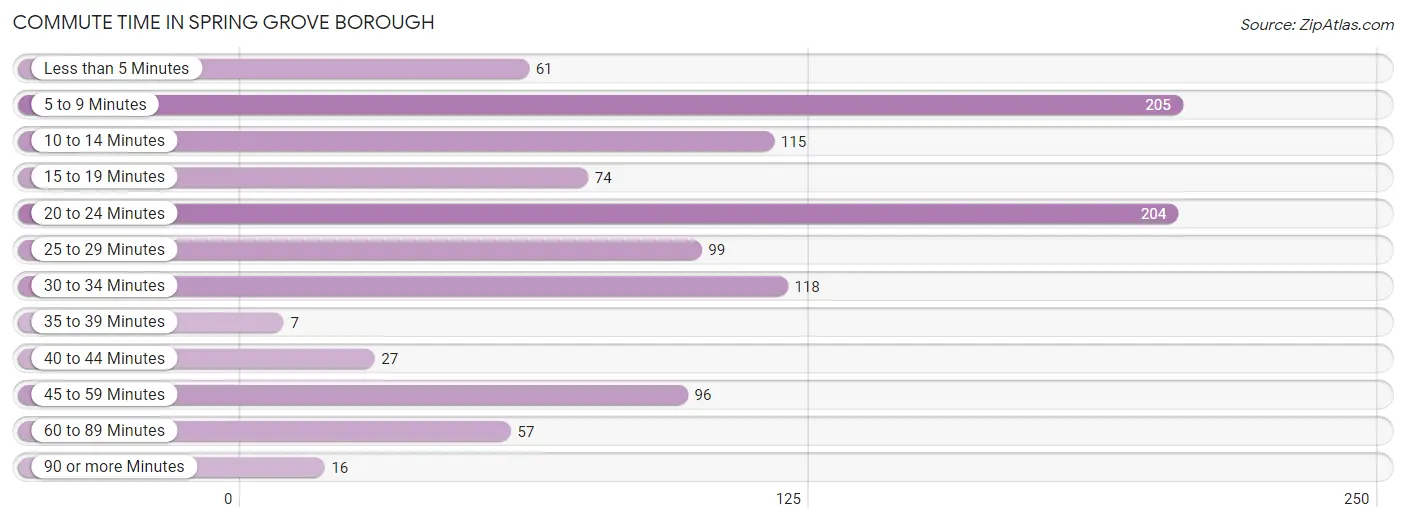
| Commute Time | # Commuters | % Commuters |
| Less than 5 Minutes | 61 | 5.7% |
| 5 to 9 Minutes | 205 | 19.0% |
| 10 to 14 Minutes | 115 | 10.7% |
| 15 to 19 Minutes | 74 | 6.9% |
| 20 to 24 Minutes | 204 | 18.9% |
| 25 to 29 Minutes | 99 | 9.2% |
| 30 to 34 Minutes | 118 | 10.9% |
| 35 to 39 Minutes | 7 | 0.6% |
| 40 to 44 Minutes | 27 | 2.5% |
| 45 to 59 Minutes | 96 | 8.9% |
| 60 to 89 Minutes | 57 | 5.3% |
| 90 or more Minutes | 16 | 1.5% |
Commute Time by Sex in Spring Grove borough
The most common commute times in Spring Grove borough are 20 to 24 minutes (93 commuters, 16.9%) for males and 5 to 9 minutes (149 commuters, 28.3%) for females.
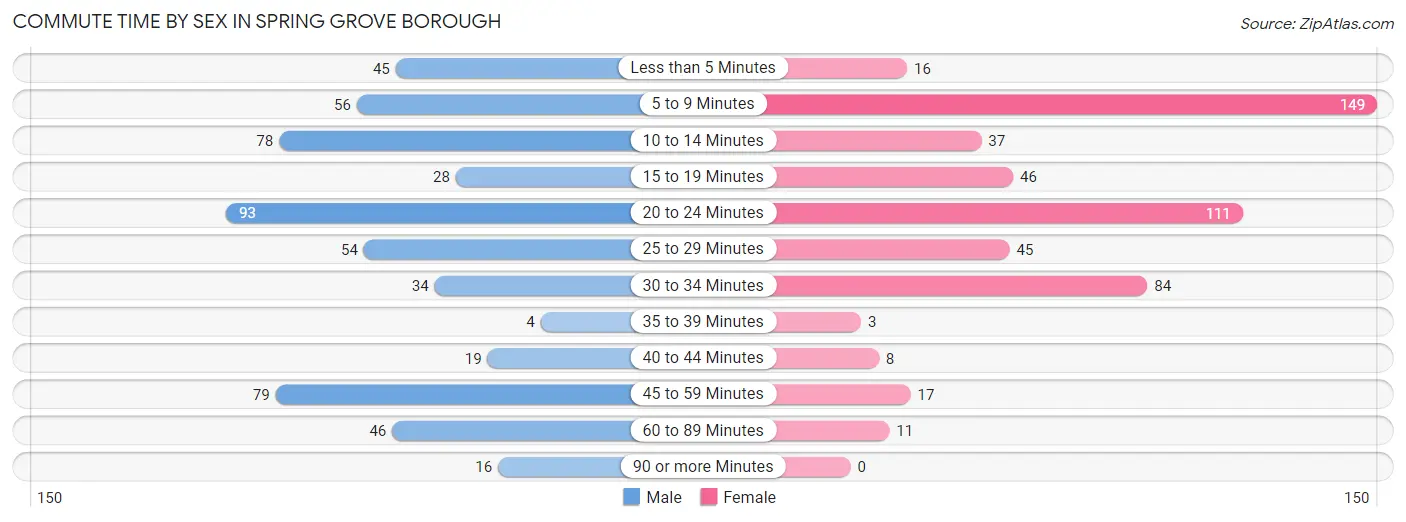
| Commute Time | Male | Female |
| Less than 5 Minutes | 45 (8.2%) | 16 (3.0%) |
| 5 to 9 Minutes | 56 (10.1%) | 149 (28.3%) |
| 10 to 14 Minutes | 78 (14.1%) | 37 (7.0%) |
| 15 to 19 Minutes | 28 (5.1%) | 46 (8.7%) |
| 20 to 24 Minutes | 93 (16.9%) | 111 (21.1%) |
| 25 to 29 Minutes | 54 (9.8%) | 45 (8.5%) |
| 30 to 34 Minutes | 34 (6.2%) | 84 (15.9%) |
| 35 to 39 Minutes | 4 (0.7%) | 3 (0.6%) |
| 40 to 44 Minutes | 19 (3.4%) | 8 (1.5%) |
| 45 to 59 Minutes | 79 (14.3%) | 17 (3.2%) |
| 60 to 89 Minutes | 46 (8.3%) | 11 (2.1%) |
| 90 or more Minutes | 16 (2.9%) | 0 (0.0%) |
Time of Departure to Work by Sex in Spring Grove borough
The most frequent times of departure to work in Spring Grove borough are 6:30 AM to 6:59 AM (113, 20.5%) for males and 4:00 PM to 11:59 PM (127, 24.1%) for females.
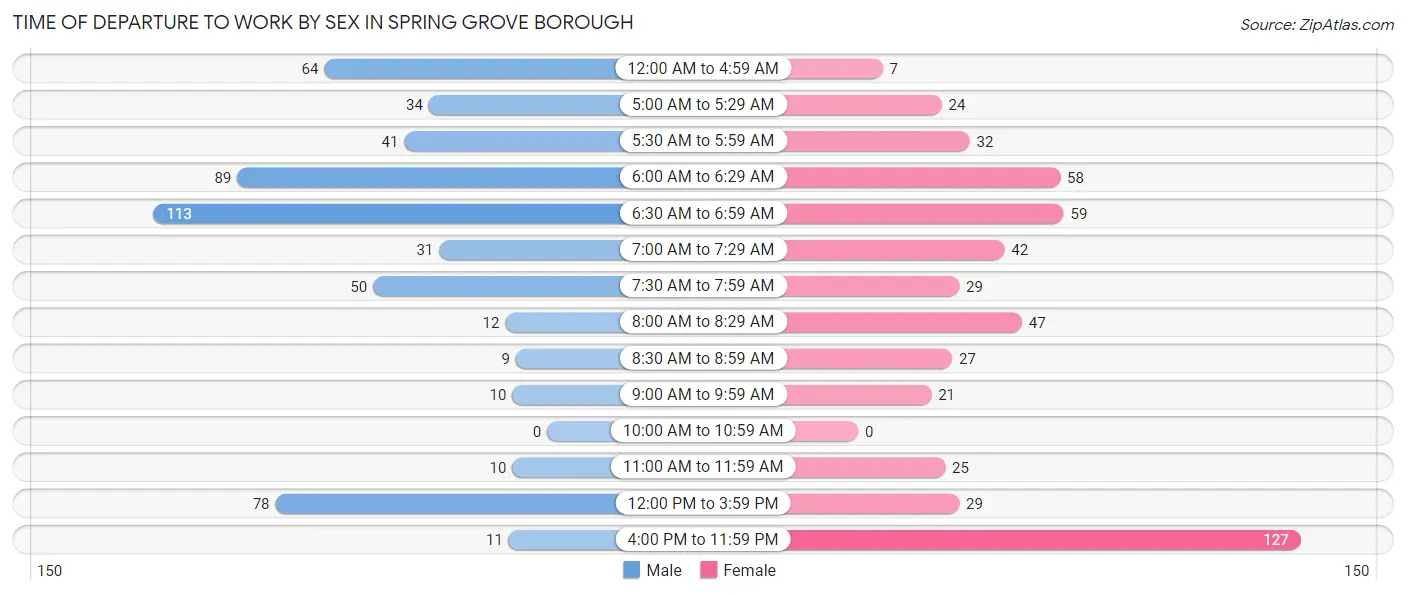
| Time of Departure | Male | Female |
| 12:00 AM to 4:59 AM | 64 (11.6%) | 7 (1.3%) |
| 5:00 AM to 5:29 AM | 34 (6.2%) | 24 (4.5%) |
| 5:30 AM to 5:59 AM | 41 (7.4%) | 32 (6.1%) |
| 6:00 AM to 6:29 AM | 89 (16.1%) | 58 (11.0%) |
| 6:30 AM to 6:59 AM | 113 (20.5%) | 59 (11.2%) |
| 7:00 AM to 7:29 AM | 31 (5.6%) | 42 (8.0%) |
| 7:30 AM to 7:59 AM | 50 (9.1%) | 29 (5.5%) |
| 8:00 AM to 8:29 AM | 12 (2.2%) | 47 (8.9%) |
| 8:30 AM to 8:59 AM | 9 (1.6%) | 27 (5.1%) |
| 9:00 AM to 9:59 AM | 10 (1.8%) | 21 (4.0%) |
| 10:00 AM to 10:59 AM | 0 (0.0%) | 0 (0.0%) |
| 11:00 AM to 11:59 AM | 10 (1.8%) | 25 (4.7%) |
| 12:00 PM to 3:59 PM | 78 (14.1%) | 29 (5.5%) |
| 4:00 PM to 11:59 PM | 11 (2.0%) | 127 (24.1%) |
| Total | 552 (100.0%) | 527 (100.0%) |
Housing Occupancy in Spring Grove borough
Occupancy by Ownership in Spring Grove borough
Of the total 817 dwellings in Spring Grove borough, owner-occupied units account for 568 (69.5%), while renter-occupied units make up 249 (30.5%).
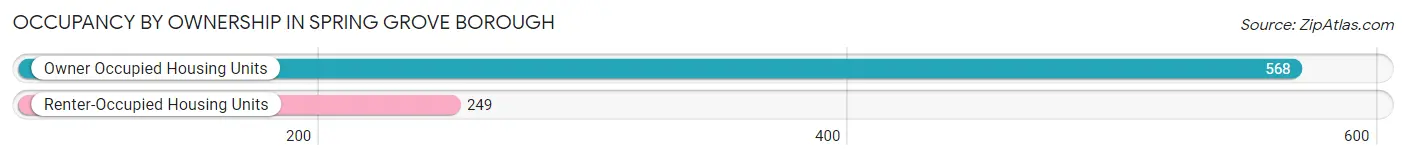
| Occupancy | # Housing Units | % Housing Units |
| Owner Occupied Housing Units | 568 | 69.5% |
| Renter-Occupied Housing Units | 249 | 30.5% |
| Total Occupied Housing Units | 817 | 100.0% |
Occupancy by Household Size in Spring Grove borough
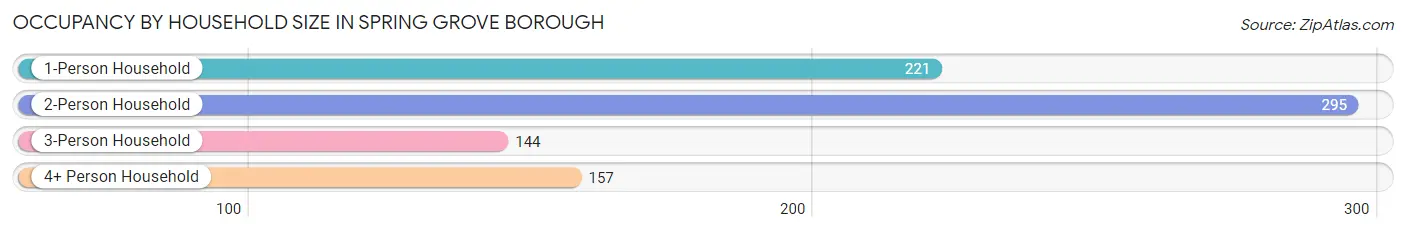
| Household Size | # Housing Units | % Housing Units |
| 1-Person Household | 221 | 27.1% |
| 2-Person Household | 295 | 36.1% |
| 3-Person Household | 144 | 17.6% |
| 4+ Person Household | 157 | 19.2% |
| Total Housing Units | 817 | 100.0% |
Occupancy by Ownership by Household Size in Spring Grove borough
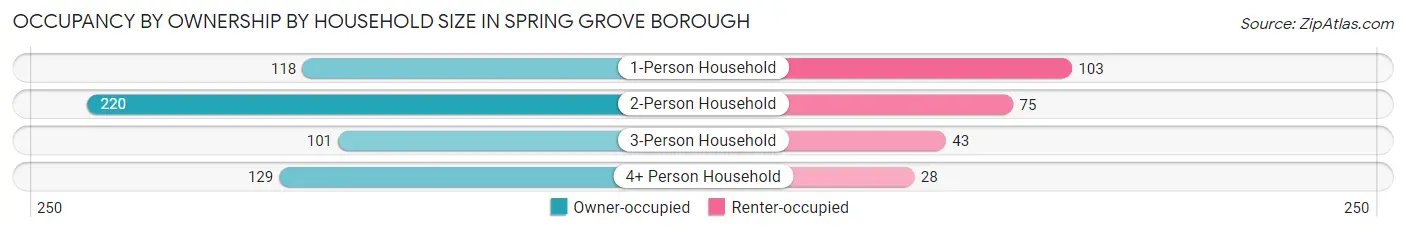
| Household Size | Owner-occupied | Renter-occupied |
| 1-Person Household | 118 (53.4%) | 103 (46.6%) |
| 2-Person Household | 220 (74.6%) | 75 (25.4%) |
| 3-Person Household | 101 (70.1%) | 43 (29.9%) |
| 4+ Person Household | 129 (82.2%) | 28 (17.8%) |
| Total Housing Units | 568 (69.5%) | 249 (30.5%) |
Occupancy by Educational Attainment in Spring Grove borough
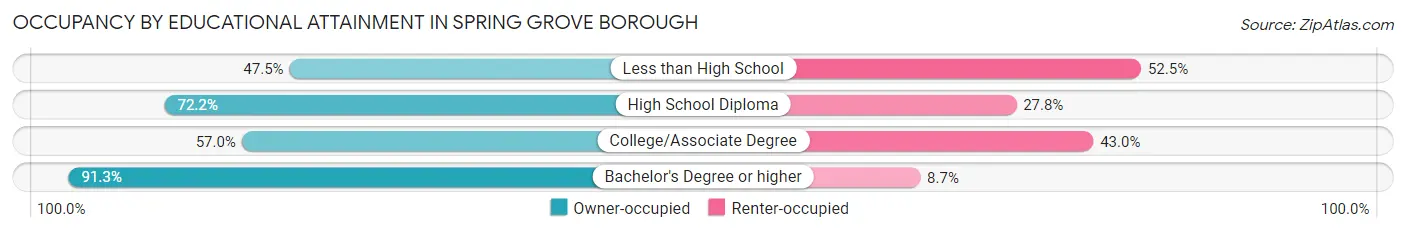
| Household Size | Owner-occupied | Renter-occupied |
| Less than High School | 38 (47.5%) | 42 (52.5%) |
| High School Diploma | 242 (72.2%) | 93 (27.8%) |
| College/Associate Degree | 131 (57.0%) | 99 (43.0%) |
| Bachelor's Degree or higher | 157 (91.3%) | 15 (8.7%) |
Occupancy by Age of Householder in Spring Grove borough
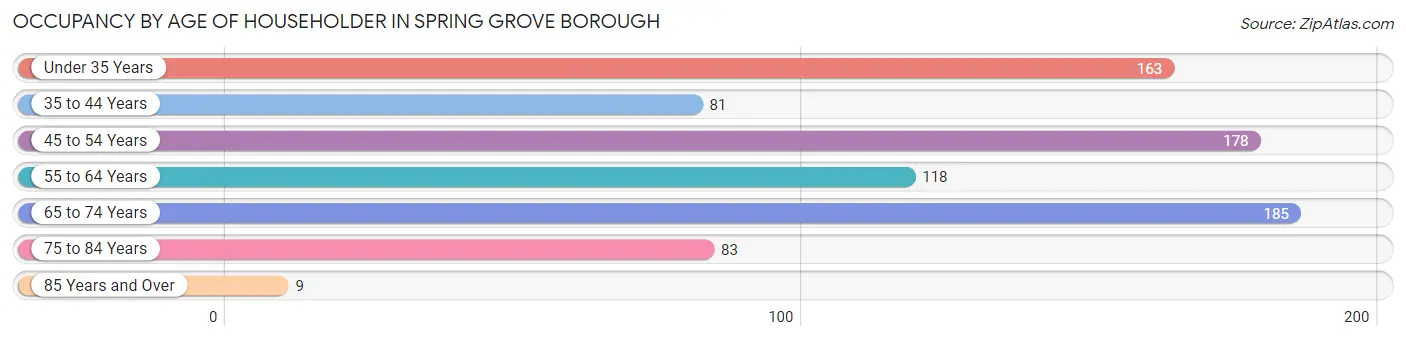
| Age Bracket | # Households | % Households |
| Under 35 Years | 163 | 20.0% |
| 35 to 44 Years | 81 | 9.9% |
| 45 to 54 Years | 178 | 21.8% |
| 55 to 64 Years | 118 | 14.4% |
| 65 to 74 Years | 185 | 22.6% |
| 75 to 84 Years | 83 | 10.2% |
| 85 Years and Over | 9 | 1.1% |
| Total | 817 | 100.0% |
Housing Finances in Spring Grove borough
Median Income by Occupancy in Spring Grove borough
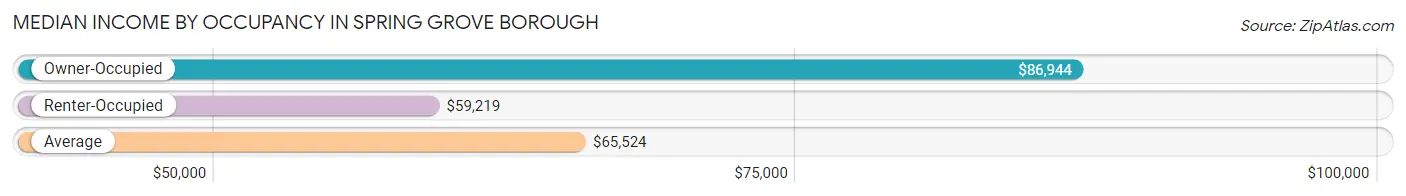
| Occupancy Type | # Households | Median Income |
| Owner-Occupied | 568 (69.5%) | $86,944 |
| Renter-Occupied | 249 (30.5%) | $59,219 |
| Average | 817 (100.0%) | $65,524 |
Occupancy by Householder Income Bracket in Spring Grove borough
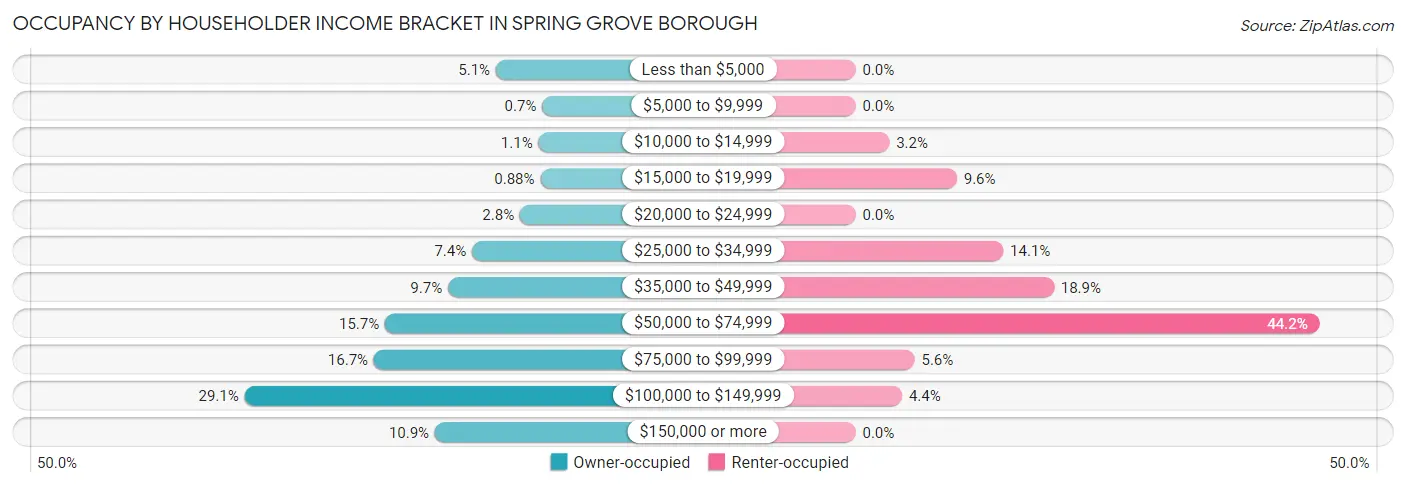
| Income Bracket | Owner-occupied | Renter-occupied |
| Less than $5,000 | 29 (5.1%) | 0 (0.0%) |
| $5,000 to $9,999 | 4 (0.7%) | 0 (0.0%) |
| $10,000 to $14,999 | 6 (1.1%) | 8 (3.2%) |
| $15,000 to $19,999 | 5 (0.9%) | 24 (9.6%) |
| $20,000 to $24,999 | 16 (2.8%) | 0 (0.0%) |
| $25,000 to $34,999 | 42 (7.4%) | 35 (14.1%) |
| $35,000 to $49,999 | 55 (9.7%) | 47 (18.9%) |
| $50,000 to $74,999 | 89 (15.7%) | 110 (44.2%) |
| $75,000 to $99,999 | 95 (16.7%) | 14 (5.6%) |
| $100,000 to $149,999 | 165 (29.0%) | 11 (4.4%) |
| $150,000 or more | 62 (10.9%) | 0 (0.0%) |
| Total | 568 (100.0%) | 249 (100.0%) |
Monthly Housing Cost Tiers in Spring Grove borough
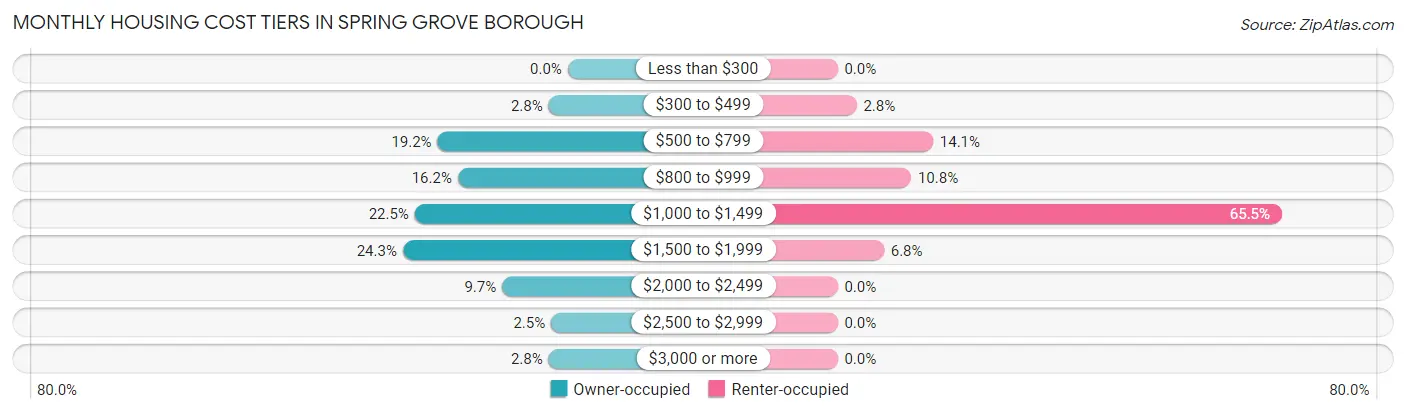
| Monthly Cost | Owner-occupied | Renter-occupied |
| Less than $300 | 0 (0.0%) | 0 (0.0%) |
| $300 to $499 | 16 (2.8%) | 7 (2.8%) |
| $500 to $799 | 109 (19.2%) | 35 (14.1%) |
| $800 to $999 | 92 (16.2%) | 27 (10.8%) |
| $1,000 to $1,499 | 128 (22.5%) | 163 (65.5%) |
| $1,500 to $1,999 | 138 (24.3%) | 17 (6.8%) |
| $2,000 to $2,499 | 55 (9.7%) | 0 (0.0%) |
| $2,500 to $2,999 | 14 (2.5%) | 0 (0.0%) |
| $3,000 or more | 16 (2.8%) | 0 (0.0%) |
| Total | 568 (100.0%) | 249 (100.0%) |
Physical Housing Characteristics in Spring Grove borough
Housing Structures in Spring Grove borough
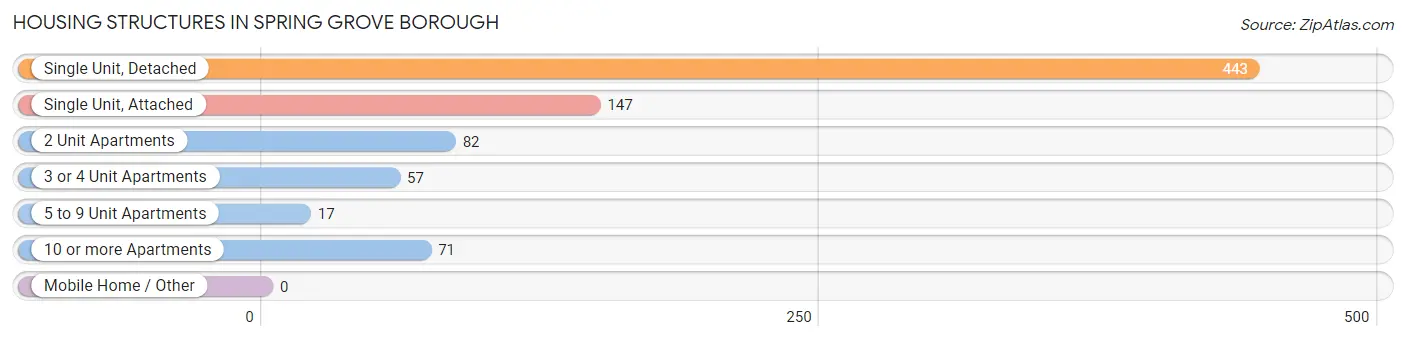
| Structure Type | # Housing Units | % Housing Units |
| Single Unit, Detached | 443 | 54.2% |
| Single Unit, Attached | 147 | 18.0% |
| 2 Unit Apartments | 82 | 10.0% |
| 3 or 4 Unit Apartments | 57 | 7.0% |
| 5 to 9 Unit Apartments | 17 | 2.1% |
| 10 or more Apartments | 71 | 8.7% |
| Mobile Home / Other | 0 | 0.0% |
| Total | 817 | 100.0% |
Housing Structures by Occupancy in Spring Grove borough
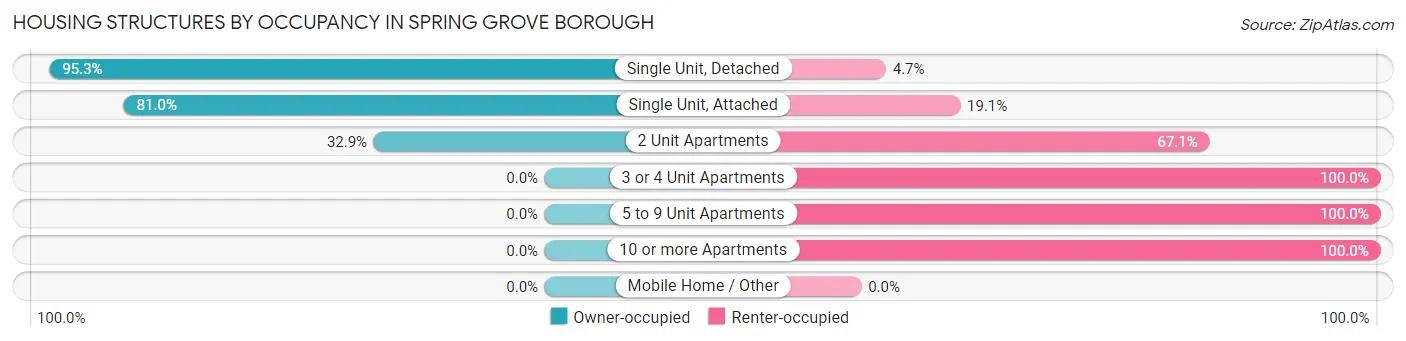
| Structure Type | Owner-occupied | Renter-occupied |
| Single Unit, Detached | 422 (95.3%) | 21 (4.7%) |
| Single Unit, Attached | 119 (80.9%) | 28 (19.1%) |
| 2 Unit Apartments | 27 (32.9%) | 55 (67.1%) |
| 3 or 4 Unit Apartments | 0 (0.0%) | 57 (100.0%) |
| 5 to 9 Unit Apartments | 0 (0.0%) | 17 (100.0%) |
| 10 or more Apartments | 0 (0.0%) | 71 (100.0%) |
| Mobile Home / Other | 0 (0.0%) | 0 (0.0%) |
| Total | 568 (69.5%) | 249 (30.5%) |
Housing Structures by Number of Rooms in Spring Grove borough
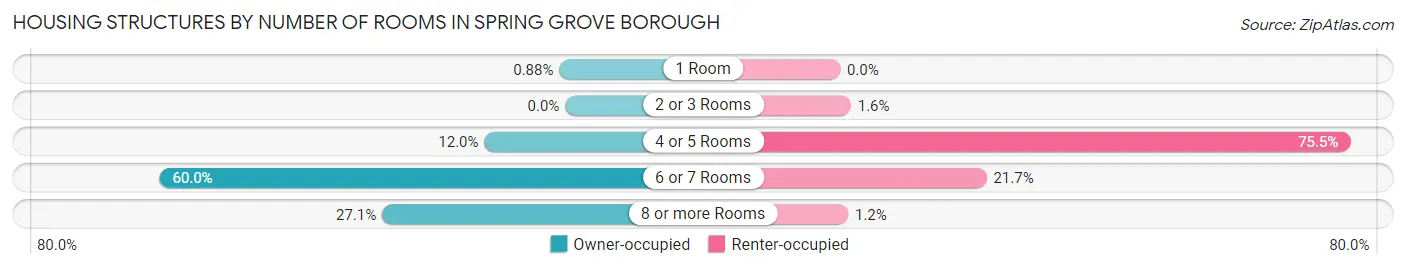
| Number of Rooms | Owner-occupied | Renter-occupied |
| 1 Room | 5 (0.9%) | 0 (0.0%) |
| 2 or 3 Rooms | 0 (0.0%) | 4 (1.6%) |
| 4 or 5 Rooms | 68 (12.0%) | 188 (75.5%) |
| 6 or 7 Rooms | 341 (60.0%) | 54 (21.7%) |
| 8 or more Rooms | 154 (27.1%) | 3 (1.2%) |
| Total | 568 (100.0%) | 249 (100.0%) |
Housing Structure by Heating Type in Spring Grove borough
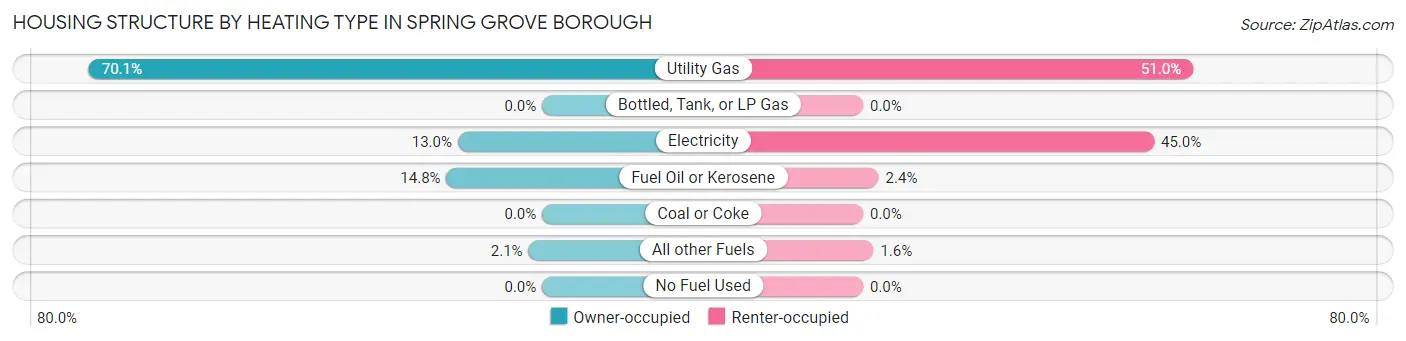
| Heating Type | Owner-occupied | Renter-occupied |
| Utility Gas | 398 (70.1%) | 127 (51.0%) |
| Bottled, Tank, or LP Gas | 0 (0.0%) | 0 (0.0%) |
| Electricity | 74 (13.0%) | 112 (45.0%) |
| Fuel Oil or Kerosene | 84 (14.8%) | 6 (2.4%) |
| Coal or Coke | 0 (0.0%) | 0 (0.0%) |
| All other Fuels | 12 (2.1%) | 4 (1.6%) |
| No Fuel Used | 0 (0.0%) | 0 (0.0%) |
| Total | 568 (100.0%) | 249 (100.0%) |
Household Vehicle Usage in Spring Grove borough
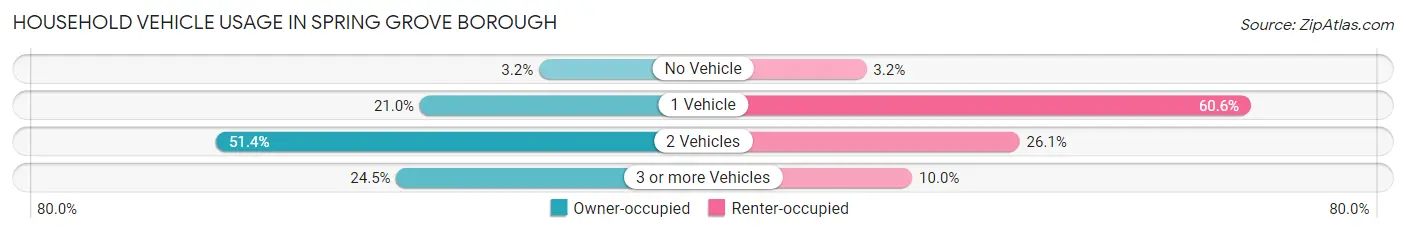
| Vehicles per Household | Owner-occupied | Renter-occupied |
| No Vehicle | 18 (3.2%) | 8 (3.2%) |
| 1 Vehicle | 119 (20.9%) | 151 (60.6%) |
| 2 Vehicles | 292 (51.4%) | 65 (26.1%) |
| 3 or more Vehicles | 139 (24.5%) | 25 (10.0%) |
| Total | 568 (100.0%) | 249 (100.0%) |
Real Estate & Mortgages in Spring Grove borough
Real Estate and Mortgage Overview in Spring Grove borough
| Characteristic | Without Mortgage | With Mortgage |
| Housing Units | 175 | 393 |
| Median Property Value | $196,900 | $175,800 |
| Median Household Income | $53,036 | $40 |
| Monthly Housing Costs | $702 | $16 |
| Real Estate Taxes | $3,382 | $0 |
Property Value by Mortgage Status in Spring Grove borough
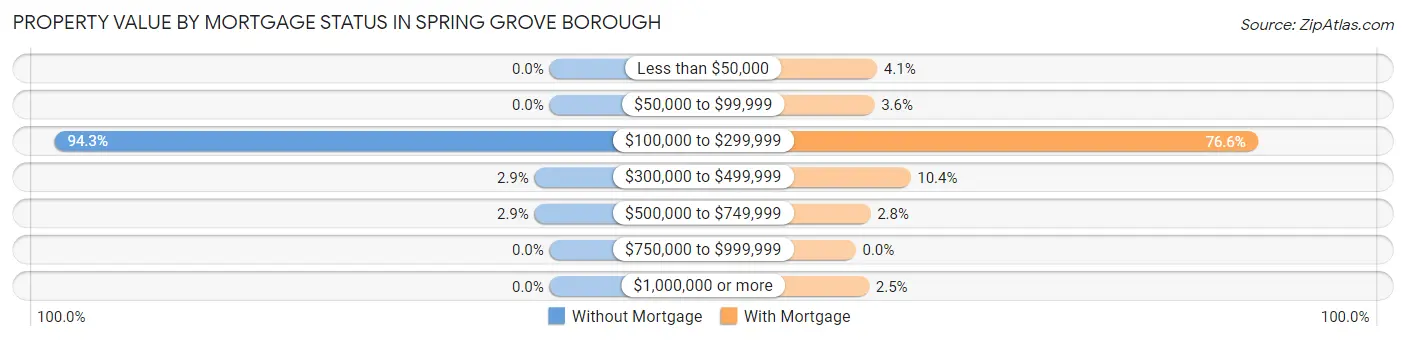
| Property Value | Without Mortgage | With Mortgage |
| Less than $50,000 | 0 (0.0%) | 16 (4.1%) |
| $50,000 to $99,999 | 0 (0.0%) | 14 (3.6%) |
| $100,000 to $299,999 | 165 (94.3%) | 301 (76.6%) |
| $300,000 to $499,999 | 5 (2.9%) | 41 (10.4%) |
| $500,000 to $749,999 | 5 (2.9%) | 11 (2.8%) |
| $750,000 to $999,999 | 0 (0.0%) | 0 (0.0%) |
| $1,000,000 or more | 0 (0.0%) | 10 (2.5%) |
| Total | 175 (100.0%) | 393 (100.0%) |
Household Income by Mortgage Status in Spring Grove borough
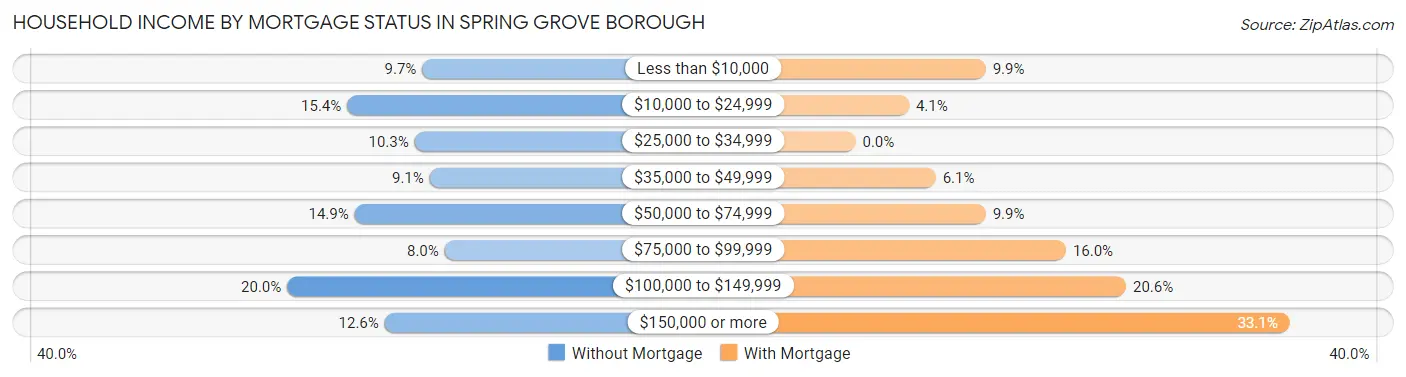
| Household Income | Without Mortgage | With Mortgage |
| Less than $10,000 | 17 (9.7%) | 39 (9.9%) |
| $10,000 to $24,999 | 27 (15.4%) | 16 (4.1%) |
| $25,000 to $34,999 | 18 (10.3%) | 0 (0.0%) |
| $35,000 to $49,999 | 16 (9.1%) | 24 (6.1%) |
| $50,000 to $74,999 | 26 (14.9%) | 39 (9.9%) |
| $75,000 to $99,999 | 14 (8.0%) | 63 (16.0%) |
| $100,000 to $149,999 | 35 (20.0%) | 81 (20.6%) |
| $150,000 or more | 22 (12.6%) | 130 (33.1%) |
| Total | 175 (100.0%) | 393 (100.0%) |
Property Value to Household Income Ratio in Spring Grove borough
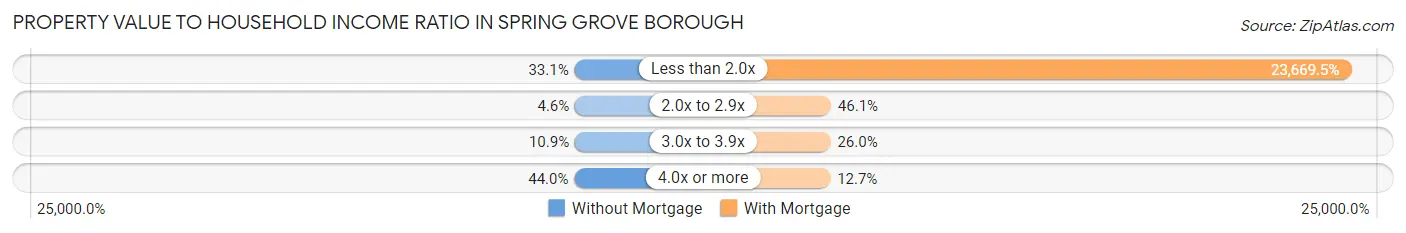
| Value-to-Income Ratio | Without Mortgage | With Mortgage |
| Less than 2.0x | 58 (33.1%) | 93,021 (23,669.5%) |
| 2.0x to 2.9x | 8 (4.6%) | 181 (46.1%) |
| 3.0x to 3.9x | 19 (10.9%) | 102 (26.0%) |
| 4.0x or more | 77 (44.0%) | 50 (12.7%) |
| Total | 175 (100.0%) | 393 (100.0%) |
Real Estate Taxes by Mortgage Status in Spring Grove borough
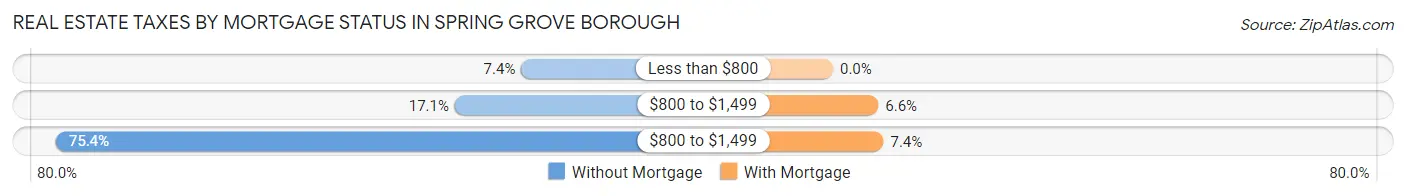
| Property Taxes | Without Mortgage | With Mortgage |
| Less than $800 | 13 (7.4%) | 0 (0.0%) |
| $800 to $1,499 | 30 (17.1%) | 26 (6.6%) |
| $800 to $1,499 | 132 (75.4%) | 29 (7.4%) |
| Total | 175 (100.0%) | 393 (100.0%) |
Health & Disability in Spring Grove borough
Health Insurance Coverage by Age in Spring Grove borough
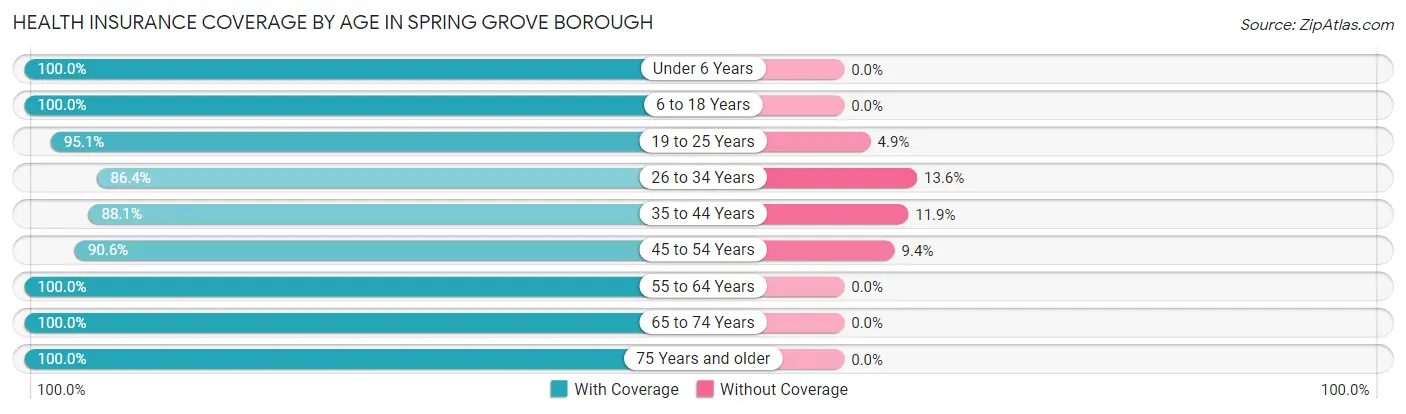
| Age Bracket | With Coverage | Without Coverage |
| Under 6 Years | 147 (100.0%) | 0 (0.0%) |
| 6 to 18 Years | 282 (100.0%) | 0 (0.0%) |
| 19 to 25 Years | 155 (95.1%) | 8 (4.9%) |
| 26 to 34 Years | 229 (86.4%) | 36 (13.6%) |
| 35 to 44 Years | 288 (88.1%) | 39 (11.9%) |
| 45 to 54 Years | 251 (90.6%) | 26 (9.4%) |
| 55 to 64 Years | 276 (100.0%) | 0 (0.0%) |
| 65 to 74 Years | 287 (100.0%) | 0 (0.0%) |
| 75 Years and older | 117 (100.0%) | 0 (0.0%) |
| Total | 2,032 (94.9%) | 109 (5.1%) |
Health Insurance Coverage by Citizenship Status in Spring Grove borough
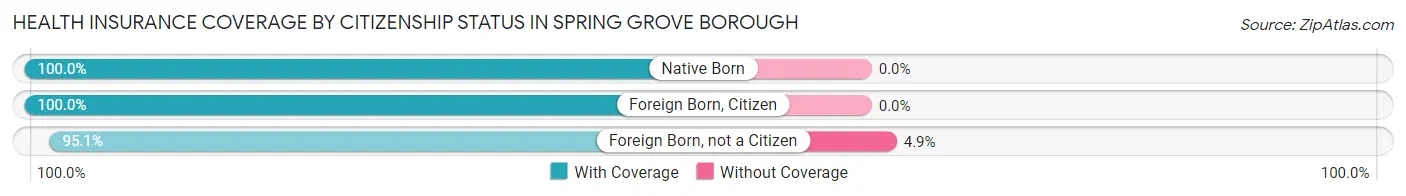
| Citizenship Status | With Coverage | Without Coverage |
| Native Born | 147 (100.0%) | 0 (0.0%) |
| Foreign Born, Citizen | 282 (100.0%) | 0 (0.0%) |
| Foreign Born, not a Citizen | 155 (95.1%) | 8 (4.9%) |
Health Insurance Coverage by Household Income in Spring Grove borough
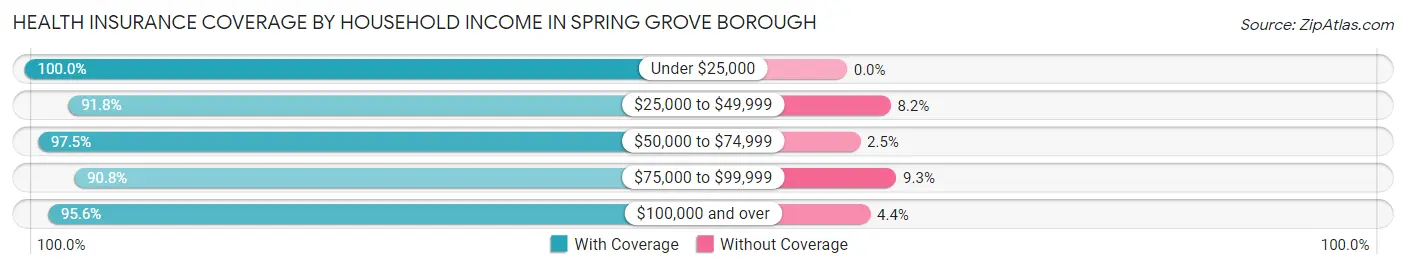
| Household Income | With Coverage | Without Coverage |
| Under $25,000 | 140 (100.0%) | 0 (0.0%) |
| $25,000 to $49,999 | 359 (91.8%) | 32 (8.2%) |
| $50,000 to $74,999 | 392 (97.5%) | 10 (2.5%) |
| $75,000 to $99,999 | 265 (90.7%) | 27 (9.2%) |
| $100,000 and over | 876 (95.6%) | 40 (4.4%) |
Public vs Private Health Insurance Coverage by Age in Spring Grove borough
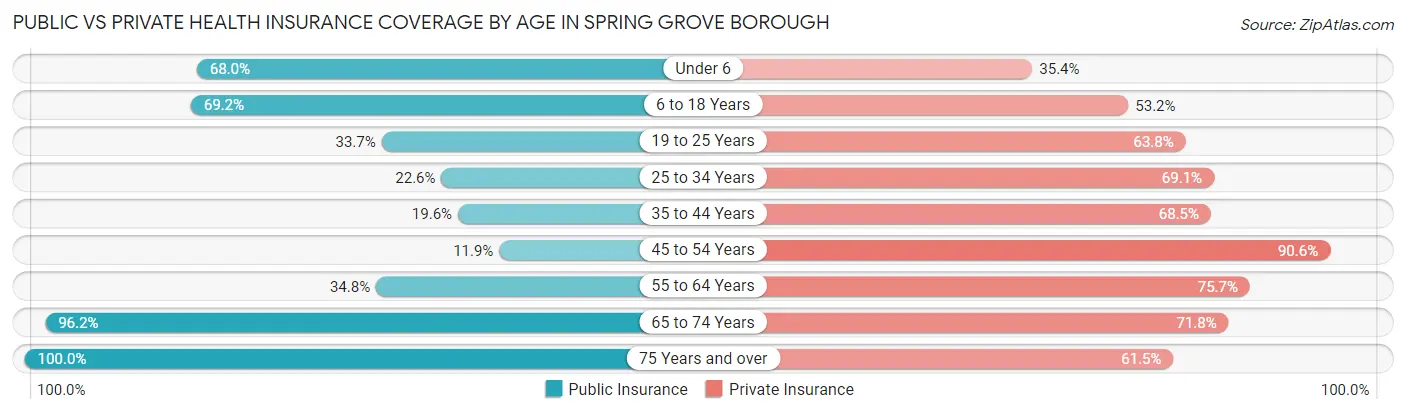
| Age Bracket | Public Insurance | Private Insurance |
| Under 6 | 100 (68.0%) | 52 (35.4%) |
| 6 to 18 Years | 195 (69.2%) | 150 (53.2%) |
| 19 to 25 Years | 55 (33.7%) | 104 (63.8%) |
| 25 to 34 Years | 60 (22.6%) | 183 (69.1%) |
| 35 to 44 Years | 64 (19.6%) | 224 (68.5%) |
| 45 to 54 Years | 33 (11.9%) | 251 (90.6%) |
| 55 to 64 Years | 96 (34.8%) | 209 (75.7%) |
| 65 to 74 Years | 276 (96.2%) | 206 (71.8%) |
| 75 Years and over | 117 (100.0%) | 72 (61.5%) |
| Total | 996 (46.5%) | 1,451 (67.8%) |
Disability Status by Sex by Age in Spring Grove borough
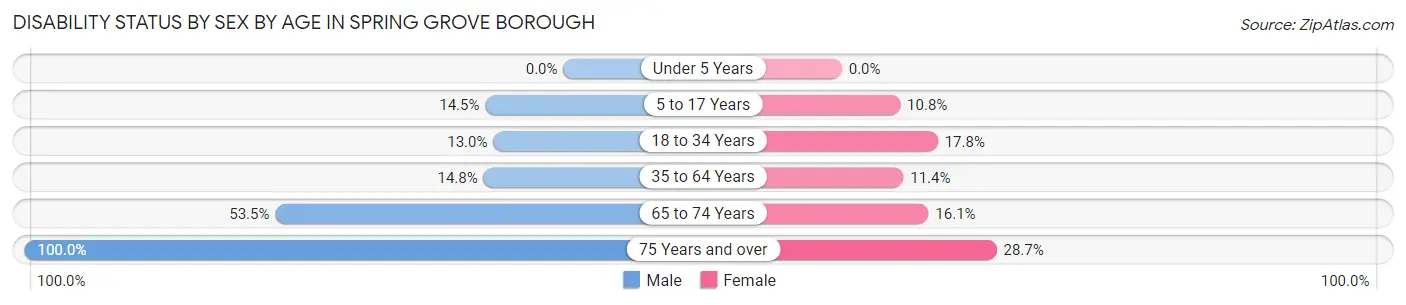
| Age Bracket | Male | Female |
| Under 5 Years | 0 (0.0%) | 0 (0.0%) |
| 5 to 17 Years | 20 (14.5%) | 17 (10.8%) |
| 18 to 34 Years | 29 (13.0%) | 39 (17.8%) |
| 35 to 64 Years | 59 (14.8%) | 55 (11.4%) |
| 65 to 74 Years | 77 (53.5%) | 23 (16.1%) |
| 75 Years and over | 23 (100.0%) | 27 (28.7%) |
Disability Class by Sex by Age in Spring Grove borough
Disability Class: Hearing Difficulty
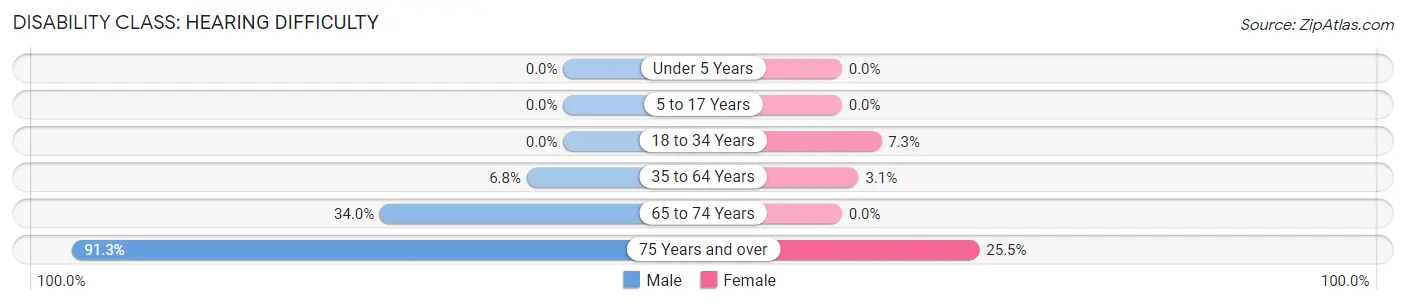
| Age Bracket | Male | Female |
| Under 5 Years | 0 (0.0%) | 0 (0.0%) |
| 5 to 17 Years | 0 (0.0%) | 0 (0.0%) |
| 18 to 34 Years | 0 (0.0%) | 16 (7.3%) |
| 35 to 64 Years | 27 (6.8%) | 15 (3.1%) |
| 65 to 74 Years | 49 (34.0%) | 0 (0.0%) |
| 75 Years and over | 21 (91.3%) | 24 (25.5%) |
Disability Class: Vision Difficulty
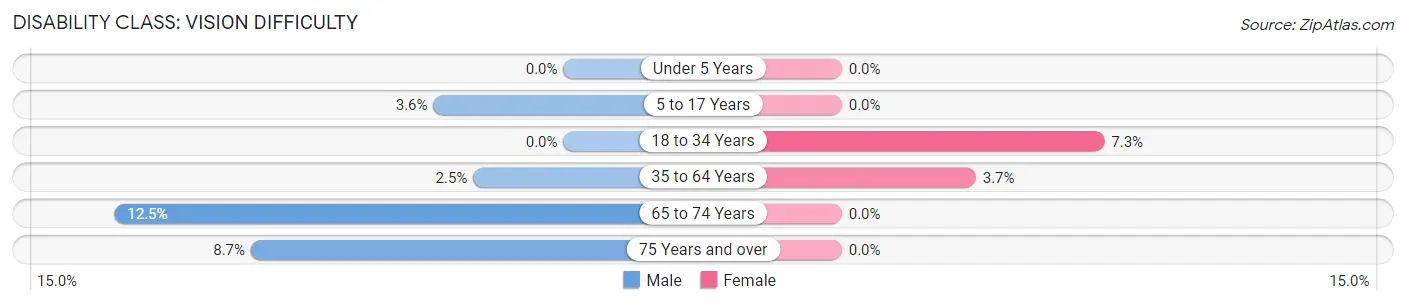
| Age Bracket | Male | Female |
| Under 5 Years | 0 (0.0%) | 0 (0.0%) |
| 5 to 17 Years | 5 (3.6%) | 0 (0.0%) |
| 18 to 34 Years | 0 (0.0%) | 16 (7.3%) |
| 35 to 64 Years | 10 (2.5%) | 18 (3.7%) |
| 65 to 74 Years | 18 (12.5%) | 0 (0.0%) |
| 75 Years and over | 2 (8.7%) | 0 (0.0%) |
Disability Class: Cognitive Difficulty
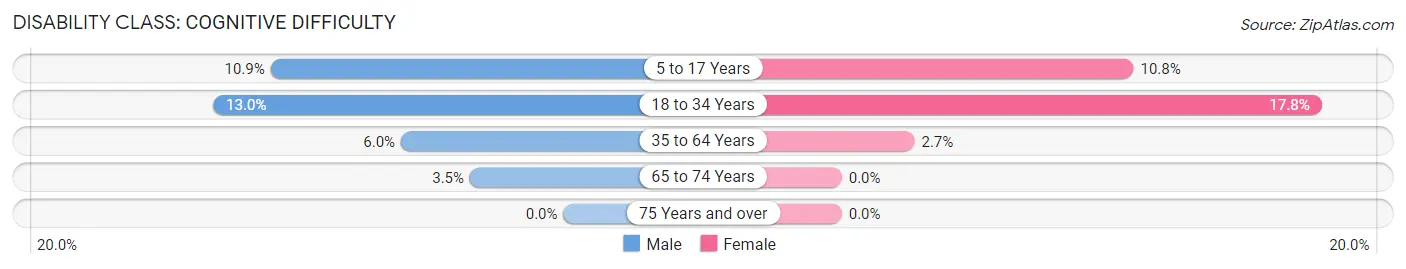
| Age Bracket | Male | Female |
| 5 to 17 Years | 15 (10.9%) | 17 (10.8%) |
| 18 to 34 Years | 29 (13.0%) | 39 (17.8%) |
| 35 to 64 Years | 24 (6.0%) | 13 (2.7%) |
| 65 to 74 Years | 5 (3.5%) | 0 (0.0%) |
| 75 Years and over | 0 (0.0%) | 0 (0.0%) |
Disability Class: Ambulatory Difficulty
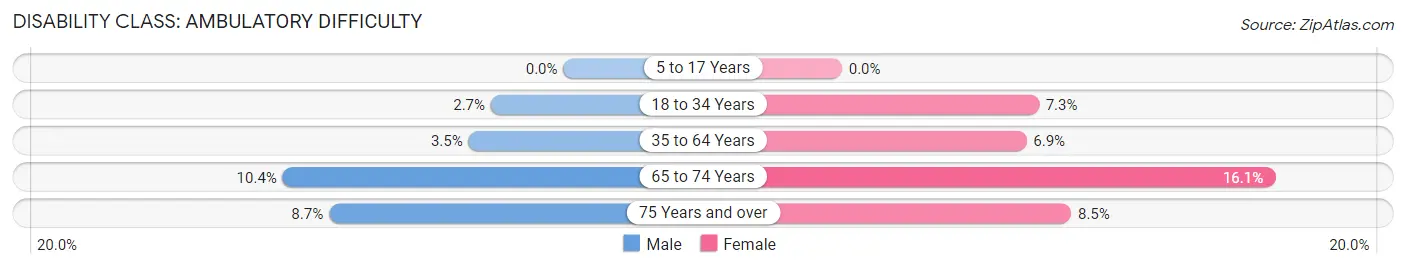
| Age Bracket | Male | Female |
| 5 to 17 Years | 0 (0.0%) | 0 (0.0%) |
| 18 to 34 Years | 6 (2.7%) | 16 (7.3%) |
| 35 to 64 Years | 14 (3.5%) | 33 (6.9%) |
| 65 to 74 Years | 15 (10.4%) | 23 (16.1%) |
| 75 Years and over | 2 (8.7%) | 8 (8.5%) |
Disability Class: Self-Care Difficulty
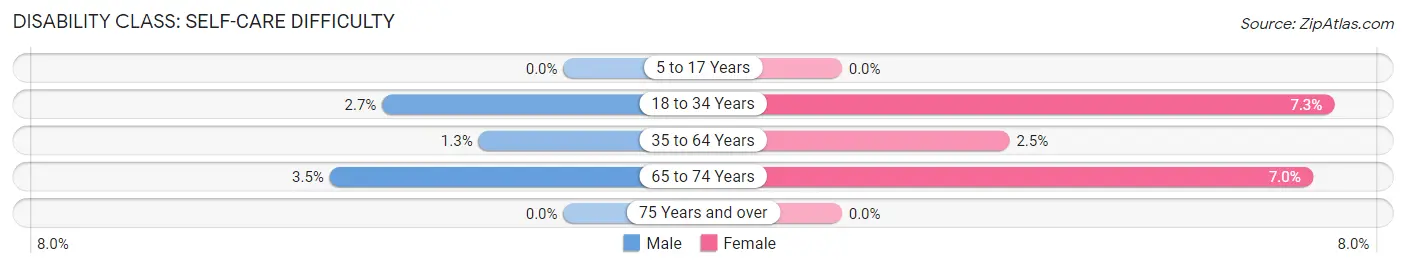
| Age Bracket | Male | Female |
| 5 to 17 Years | 0 (0.0%) | 0 (0.0%) |
| 18 to 34 Years | 6 (2.7%) | 16 (7.3%) |
| 35 to 64 Years | 5 (1.3%) | 12 (2.5%) |
| 65 to 74 Years | 5 (3.5%) | 10 (7.0%) |
| 75 Years and over | 0 (0.0%) | 0 (0.0%) |
Technology Access in Spring Grove borough
Computing Device Access in Spring Grove borough
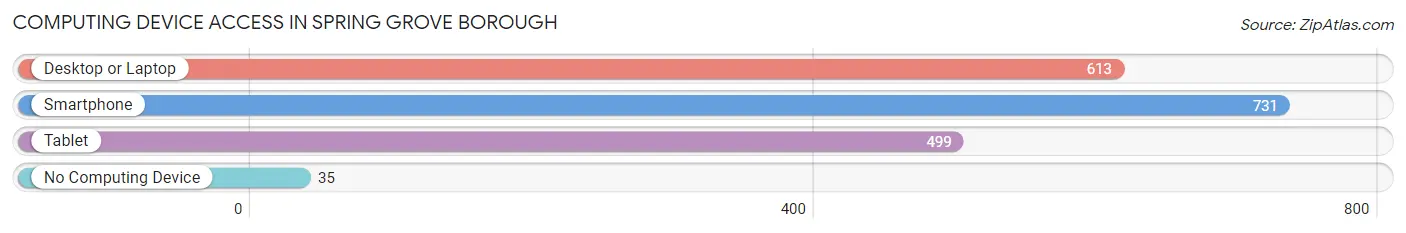
| Device Type | # Households | % Households |
| Desktop or Laptop | 613 | 75.0% |
| Smartphone | 731 | 89.5% |
| Tablet | 499 | 61.1% |
| No Computing Device | 35 | 4.3% |
| Total | 817 | 100.0% |
Internet Access in Spring Grove borough
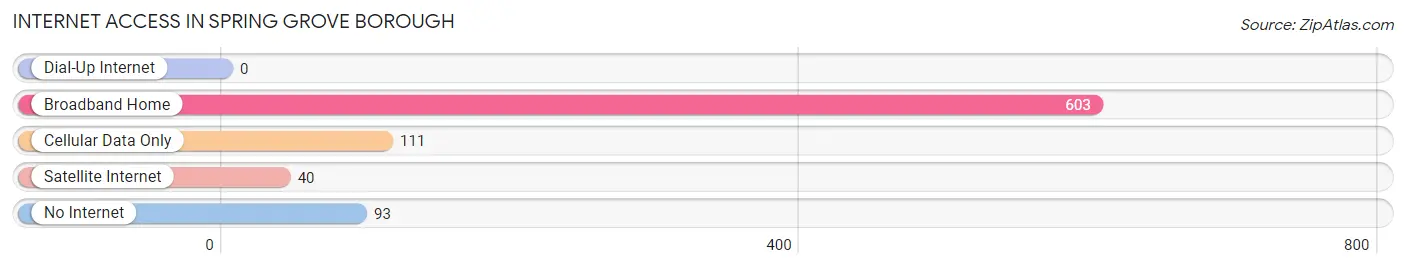
| Internet Type | # Households | % Households |
| Dial-Up Internet | 0 | 0.0% |
| Broadband Home | 603 | 73.8% |
| Cellular Data Only | 111 | 13.6% |
| Satellite Internet | 40 | 4.9% |
| No Internet | 93 | 11.4% |
| Total | 817 | 100.0% |
Spring Grove borough Summary
Introduction
Spring Grove Borough is a borough located in York County, Pennsylvania. It is situated in the south-central part of the state, approximately 20 miles south of the state capital of Harrisburg. The borough is part of the York-Hanover Metropolitan Statistical Area. As of the 2010 census, the population of Spring Grove Borough was 2,919.
History
The area that is now Spring Grove Borough was first settled in the late 1700s by German immigrants. The town was originally known as “Spring Grove” and was incorporated as a borough in 1872. The town was named for the many springs that were located in the area.
In the late 1800s, the town was a major center for the production of cigars. The cigar industry was a major employer in the town and provided many jobs for the local residents. The town also had a thriving agricultural industry, with many farms located in the area.
In the early 1900s, the town began to experience a decline in its cigar industry. This was due to the rise of the cigarette industry, which was more popular than cigars. The town also experienced a decline in its agricultural industry due to the introduction of new farming techniques and the development of new technologies.
In the mid-1900s, the town began to experience a resurgence in its economy. This was due to the development of new industries, such as manufacturing and tourism. The town also experienced a population growth, as many people moved to the area to take advantage of the new job opportunities.
Geography
Spring Grove Borough is located in south-central Pennsylvania, approximately 20 miles south of the state capital of Harrisburg. The borough is situated in York County and is part of the York-Hanover Metropolitan Statistical Area.
The borough has a total area of 1.2 square miles, all of which is land. The borough is located in a rural area and is surrounded by farmland. The borough is located near the Susquehanna River and is home to several small creeks and streams.
Economy
The economy of Spring Grove Borough is largely based on manufacturing and tourism. The town is home to several manufacturing companies, including a plastics manufacturer, a metal fabricator, and a printing company. The town is also home to several tourist attractions, such as the Spring Grove Historic District and the Spring Grove Railroad Museum.
The town also has a thriving agricultural industry, with many farms located in the area. The town is home to several farmers’ markets, which sell locally grown produce.
Demographics
As of the 2010 census, the population of Spring Grove Borough was 2,919. The racial makeup of the borough was 95.3% White, 1.2% African American, 0.3% Native American, 0.7% Asian, 0.1% Pacific Islander, 0.7% from other races, and 1.7% from two or more races. Hispanic or Latino of any race were 2.2% of the population.
The median household income in the borough was $45,938, and the median family income was $51,938. The per capita income in the borough was $20,938. About 8.3% of families and 10.2% of the population were below the poverty line, including 14.2% of those under age 18 and 6.2% of those age 65 or over.
Conclusion
Spring Grove Borough is a borough located in York County, Pennsylvania. It is situated in the south-central part of the state, approximately 20 miles south of the state capital of Harrisburg. The borough is part of the York-Hanover Metropolitan Statistical Area. As of the 2010 census, the population of Spring Grove Borough was 2,919. The economy of the borough is largely based on manufacturing and tourism, and the town is home to several tourist attractions and a thriving agricultural industry. The racial makeup of the borough was 95.3% White, 1.2% African American, 0.3% Native American, 0.7% Asian, 0.1% Pacific Islander, 0.7% from other races, and 1.7% from two or more races. The median household income in the borough was $45,938, and the median family income was $51,938.
Common Questions
What is Per Capita Income in Spring Grove borough?
Per Capita income in Spring Grove borough is $31,165.
What is the Median Family Income in Spring Grove borough?
Median Family Income in Spring Grove borough is $78,542.
What is the Median Household income in Spring Grove borough?
Median Household Income in Spring Grove borough is $65,524.
What is Income or Wage Gap in Spring Grove borough?
Income or Wage Gap in Spring Grove borough is 47.7%.
Women in Spring Grove borough earn 52.3 cents for every dollar earned by a man.
What is Inequality or Gini Index in Spring Grove borough?
Inequality or Gini Index in Spring Grove borough is 0.37.
What is the Total Population of Spring Grove borough?
Total Population of Spring Grove borough is 2,141.
What is the Total Male Population of Spring Grove borough?
Total Male Population of Spring Grove borough is 977.
What is the Total Female Population of Spring Grove borough?
Total Female Population of Spring Grove borough is 1,164.
What is the Ratio of Males per 100 Females in Spring Grove borough?
There are 83.93 Males per 100 Females in Spring Grove borough.
What is the Ratio of Females per 100 Males in Spring Grove borough?
There are 119.14 Females per 100 Males in Spring Grove borough.
What is the Median Population Age in Spring Grove borough?
Median Population Age in Spring Grove borough is 41.4 Years.
What is the Average Family Size in Spring Grove borough
Average Family Size in Spring Grove borough is 3.2 People.
What is the Average Household Size in Spring Grove borough
Average Household Size in Spring Grove borough is 2.6 People.
How Large is the Labor Force in Spring Grove borough?
There are 1,176 People in the Labor Forcein in Spring Grove borough.
What is the Percentage of People in the Labor Force in Spring Grove borough?
66.8% of People are in the Labor Force in Spring Grove borough.
What is the Unemployment Rate in Spring Grove borough?
Unemployment Rate in Spring Grove borough is 2.6%.