Jerseytown, PA Map & Demographics
Jerseytown Map
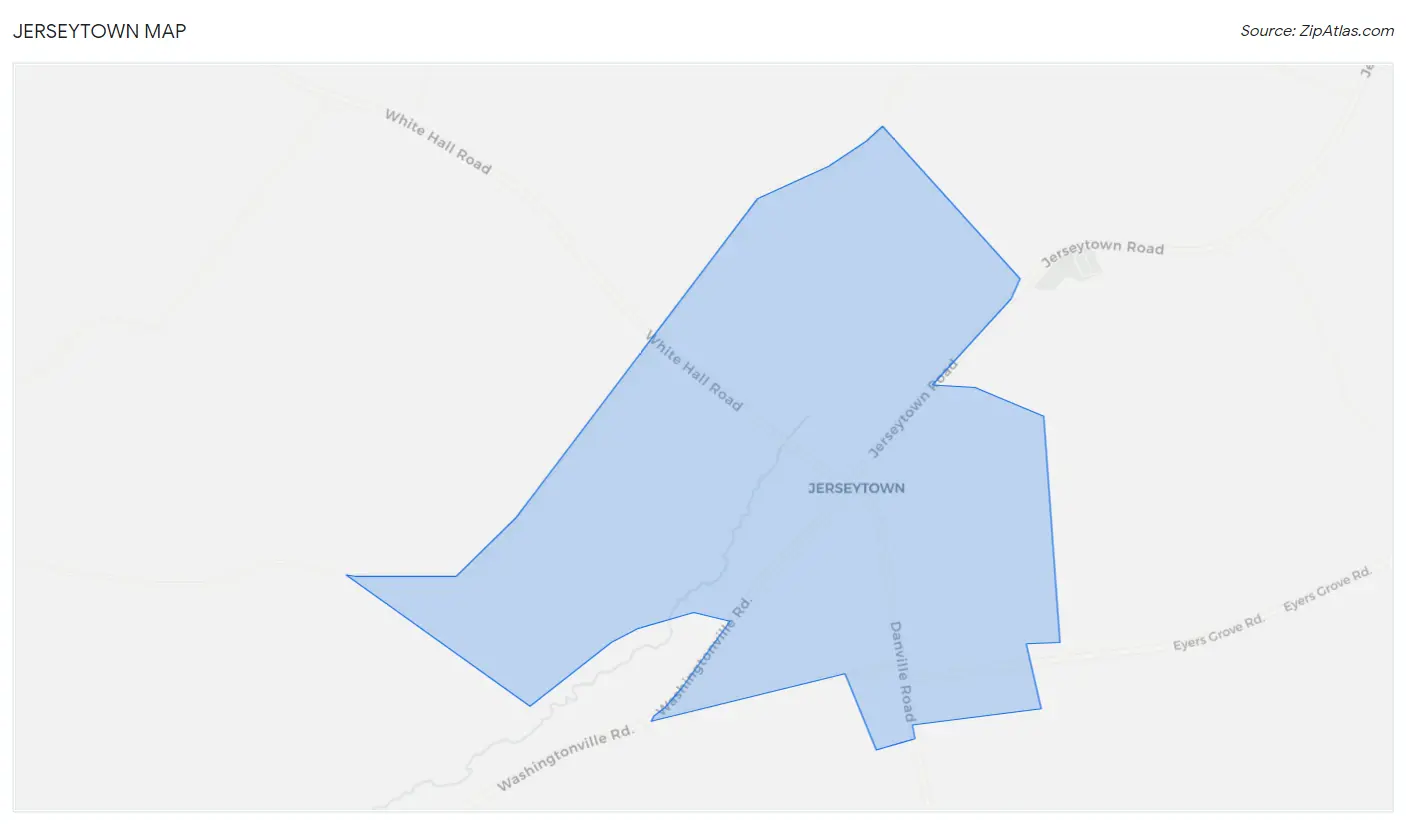
Jerseytown Overview
$28,009
PER CAPITA INCOME
$111,250
AVG FAMILY INCOME
$48,333
AVG HOUSEHOLD INCOME
32.1%
WAGE / INCOME GAP [ % ]
67.9¢/ $1
WAGE / INCOME GAP [ $ ]
0.50
INEQUALITY / GINI INDEX
169
TOTAL POPULATION
102
MALE POPULATION
67
FEMALE POPULATION
152.24
MALES / 100 FEMALES
65.69
FEMALES / 100 MALES
46.0
MEDIAN AGE
3.2
AVG FAMILY SIZE
2.2
AVG HOUSEHOLD SIZE
86
LABOR FORCE [ PEOPLE ]
57.0%
PERCENT IN LABOR FORCE
14.0%
UNEMPLOYMENT RATE
Income in Jerseytown
Income Overview in Jerseytown
Per Capita Income in Jerseytown is $28,009, while median incomes of families and households are $111,250 and $48,333 respectively.
| Characteristic | Number | Measure |
| Per Capita Income | 169 | $28,009 |
| Median Family Income | 38 | $111,250 |
| Mean Family Income | 38 | $96,018 |
| Median Household Income | 78 | $48,333 |
| Mean Household Income | 78 | $61,329 |
| Income Deficit | 38 | $0 |
| Wage / Income Gap (%) | 169 | 32.11% |
| Wage / Income Gap ($) | 169 | 67.89¢ per $1 |
| Gini / Inequality Index | 169 | 0.50 |
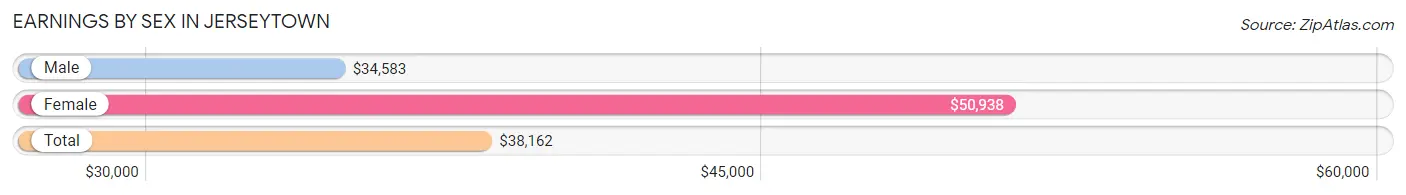
Earnings by Sex in Jerseytown
Average Earnings in Jerseytown are $38,162, $34,583 for men and $50,938 for women, a difference of 32.1%.
| Sex | Number | Average Earnings |
| Male | 54 (60.7%) | $34,583 |
| Female | 35 (39.3%) | $50,938 |
| Total | 89 (100.0%) | $38,162 |
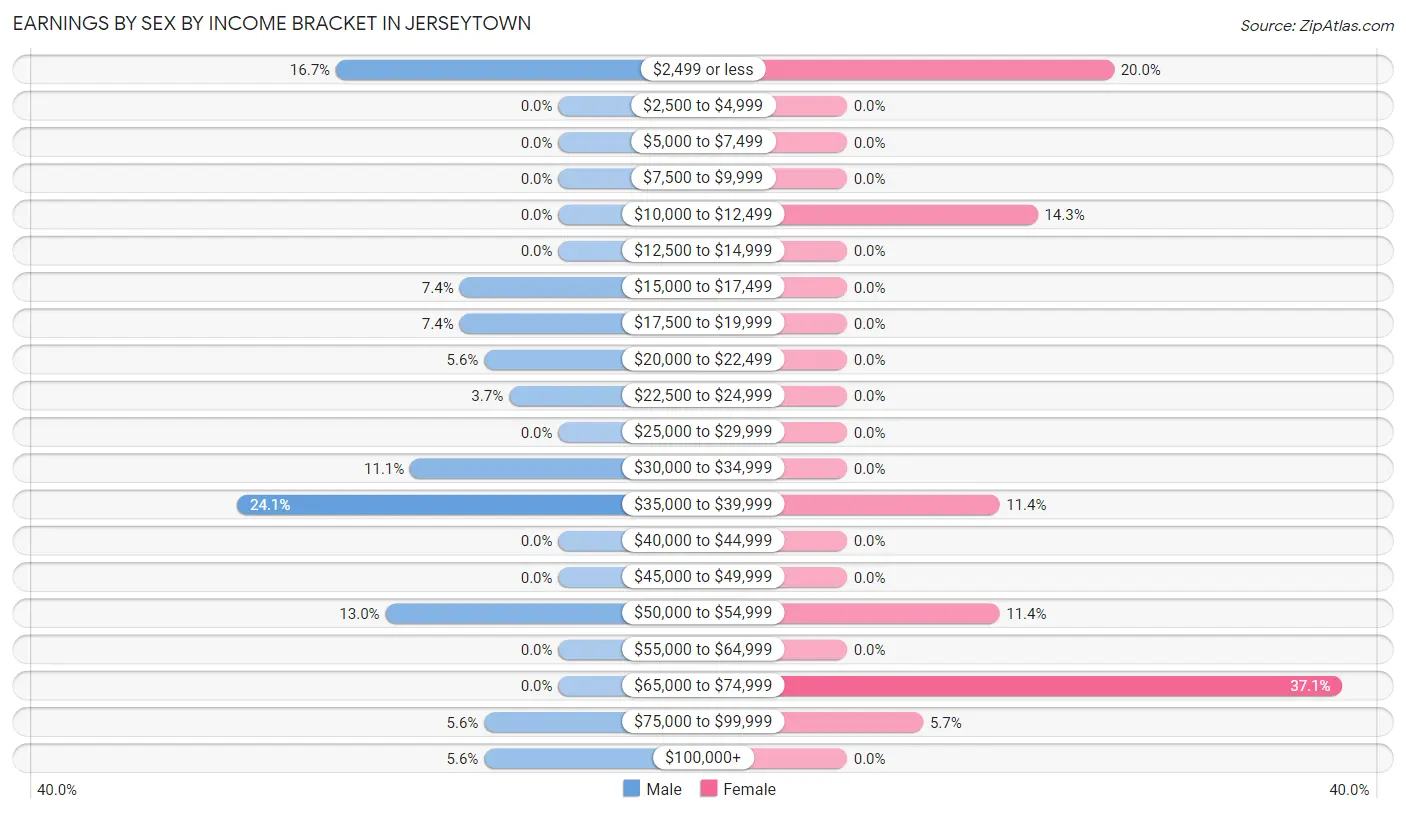
Earnings by Sex by Income Bracket in Jerseytown
The most common earnings brackets in Jerseytown are $35,000 to $39,999 for men (13 | 24.1%) and $65,000 to $74,999 for women (13 | 37.1%).
| Income | Male | Female |
| $2,499 or less | 9 (16.7%) | 7 (20.0%) |
| $2,500 to $4,999 | 0 (0.0%) | 0 (0.0%) |
| $5,000 to $7,499 | 0 (0.0%) | 0 (0.0%) |
| $7,500 to $9,999 | 0 (0.0%) | 0 (0.0%) |
| $10,000 to $12,499 | 0 (0.0%) | 5 (14.3%) |
| $12,500 to $14,999 | 0 (0.0%) | 0 (0.0%) |
| $15,000 to $17,499 | 4 (7.4%) | 0 (0.0%) |
| $17,500 to $19,999 | 4 (7.4%) | 0 (0.0%) |
| $20,000 to $22,499 | 3 (5.6%) | 0 (0.0%) |
| $22,500 to $24,999 | 2 (3.7%) | 0 (0.0%) |
| $25,000 to $29,999 | 0 (0.0%) | 0 (0.0%) |
| $30,000 to $34,999 | 6 (11.1%) | 0 (0.0%) |
| $35,000 to $39,999 | 13 (24.1%) | 4 (11.4%) |
| $40,000 to $44,999 | 0 (0.0%) | 0 (0.0%) |
| $45,000 to $49,999 | 0 (0.0%) | 0 (0.0%) |
| $50,000 to $54,999 | 7 (13.0%) | 4 (11.4%) |
| $55,000 to $64,999 | 0 (0.0%) | 0 (0.0%) |
| $65,000 to $74,999 | 0 (0.0%) | 13 (37.1%) |
| $75,000 to $99,999 | 3 (5.6%) | 2 (5.7%) |
| $100,000+ | 3 (5.6%) | 0 (0.0%) |
| Total | 54 (100.0%) | 35 (100.0%) |
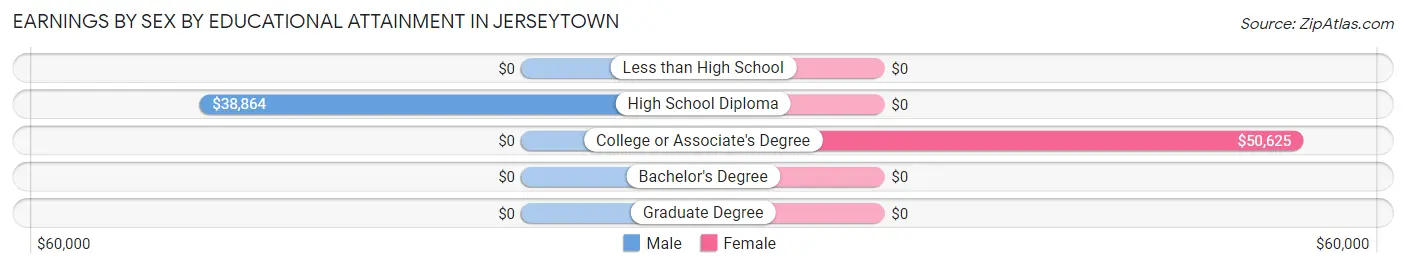
Earnings by Sex by Educational Attainment in Jerseytown
Average earnings in Jerseytown are $39,135 for men and $72,885 for women, a difference of 46.3%. Men with an educational attainment of high school diploma enjoy the highest average annual earnings of $38,864, while those with high school diploma education earn the least with $38,864. Women with an educational attainment of college or associate's degree earn the most with the average annual earnings of $50,625, while those with college or associate's degree education have the smallest earnings of $50,625.
| Educational Attainment | Male Income | Female Income |
| Less than High School | - | - |
| High School Diploma | $38,864 | $0 |
| College or Associate's Degree | - | - |
| Bachelor's Degree | - | - |
| Graduate Degree | - | - |
| Total | $39,135 | $72,885 |
Family Income in Jerseytown
Family Income Brackets in Jerseytown
According to the Jerseytown family income data, there are 17 families falling into the $100,000 to $149,999 income range, which is the most common income bracket and makes up 44.7% of all families.
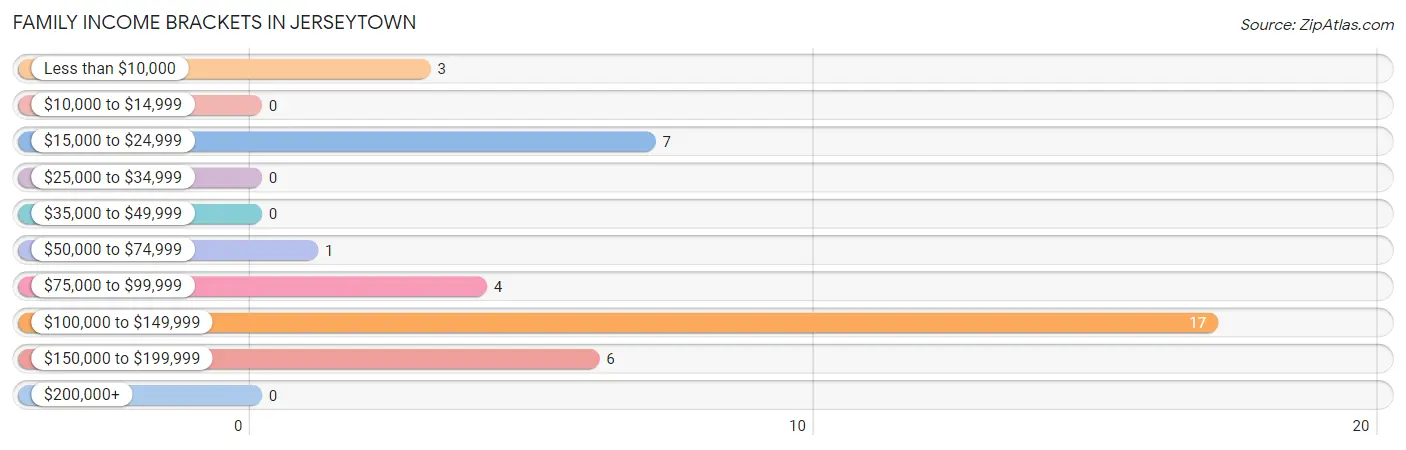
| Income Bracket | # Families | % Families |
| Less than $10,000 | 3 | 7.9% |
| $10,000 to $14,999 | 0 | 0.0% |
| $15,000 to $24,999 | 7 | 18.4% |
| $25,000 to $34,999 | 0 | 0.0% |
| $35,000 to $49,999 | 0 | 0.0% |
| $50,000 to $74,999 | 1 | 2.6% |
| $75,000 to $99,999 | 4 | 10.5% |
| $100,000 to $149,999 | 17 | 44.7% |
| $150,000 to $199,999 | 6 | 15.8% |
| $200,000+ | 0 | 0.0% |
Family Income by Famaliy Size in Jerseytown
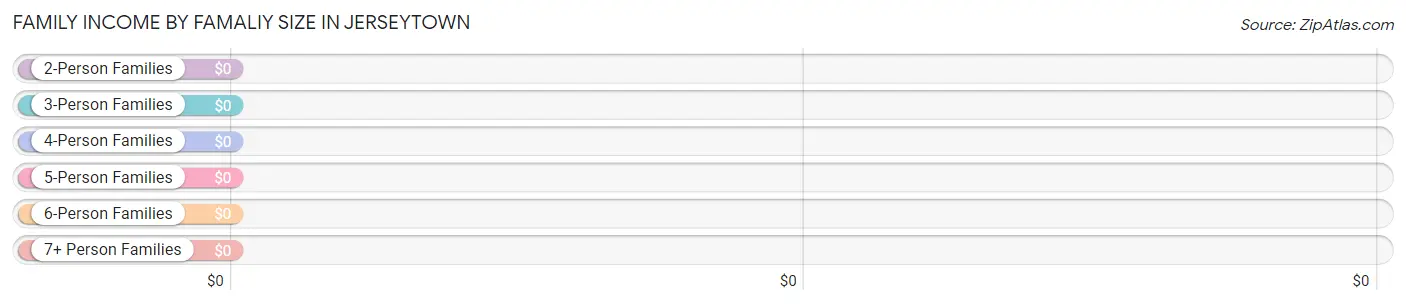
| Income Bracket | # Families | Median Income |
| 2-Person Families | 20 (52.6%) | $0 |
| 3-Person Families | 10 (26.3%) | $0 |
| 4-Person Families | 4 (10.5%) | $0 |
| 5-Person Families | 0 (0.0%) | $0 |
| 6-Person Families | 0 (0.0%) | $0 |
| 7+ Person Families | 4 (10.5%) | $0 |
| Total | 38 (100.0%) | $111,250 |
Family Income by Number of Earners in Jerseytown
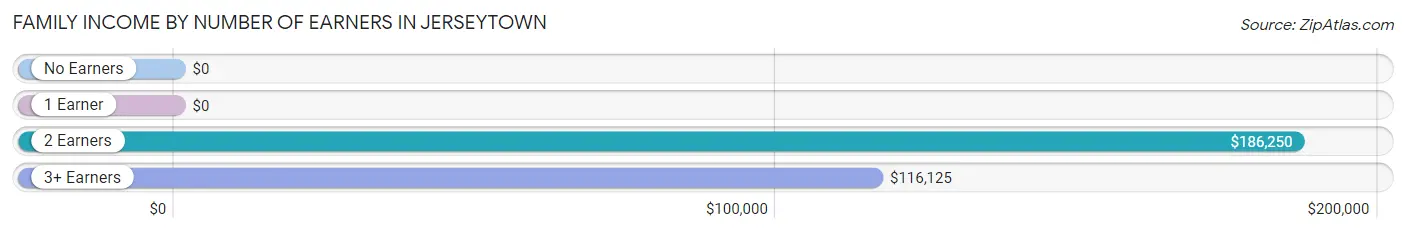
| Number of Earners | # Families | Median Income |
| No Earners | 7 (18.4%) | $0 |
| 1 Earner | 5 (13.2%) | $0 |
| 2 Earners | 9 (23.7%) | $186,250 |
| 3+ Earners | 17 (44.7%) | $116,125 |
| Total | 38 (100.0%) | $111,250 |
Household Income in Jerseytown
Household Income Brackets in Jerseytown
With 18 households falling in the category, the less than $10,000 income range is the most frequent in Jerseytown, accounting for 23.1% of all households.
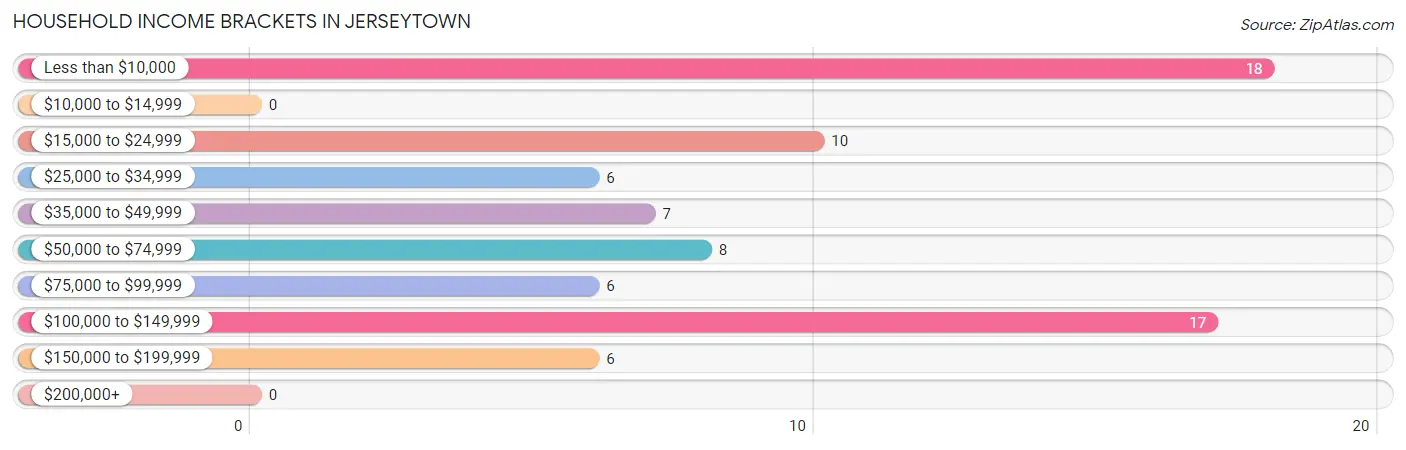
| Income Bracket | # Households | % Households |
| Less than $10,000 | 18 | 23.1% |
| $10,000 to $14,999 | 0 | 0.0% |
| $15,000 to $24,999 | 10 | 12.8% |
| $25,000 to $34,999 | 6 | 7.7% |
| $35,000 to $49,999 | 7 | 9.0% |
| $50,000 to $74,999 | 8 | 10.3% |
| $75,000 to $99,999 | 6 | 7.7% |
| $100,000 to $149,999 | 17 | 21.8% |
| $150,000 to $199,999 | 6 | 7.7% |
| $200,000+ | 0 | 0.0% |
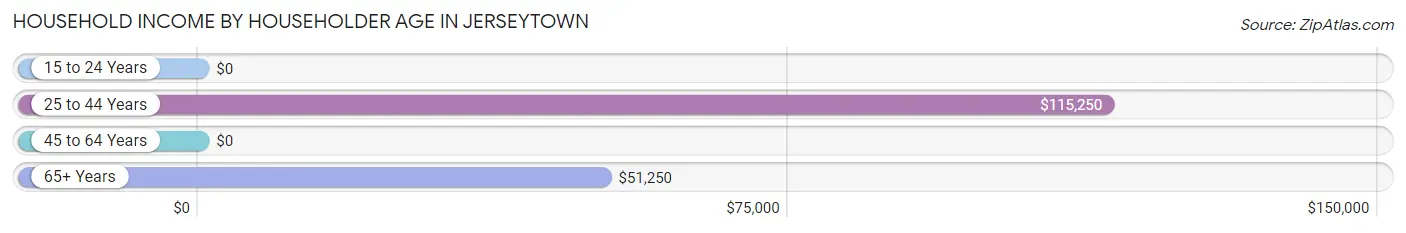
Household Income by Householder Age in Jerseytown
The median household income in Jerseytown is $48,333, with the highest median household income of $115,250 found in the 25 to 44 years age bracket for the primary householder. A total of 18 households (23.1%) fall into this category. Meanwhile, the 15 to 24 years age bracket for the primary householder has the lowest median household income of $0, with 3 households (3.8%) in this group.
| Income Bracket | # Households | Median Income |
| 15 to 24 Years | 3 (3.8%) | $0 |
| 25 to 44 Years | 18 (23.1%) | $115,250 |
| 45 to 64 Years | 37 (47.4%) | $0 |
| 65+ Years | 20 (25.6%) | $51,250 |
| Total | 78 (100.0%) | $48,333 |
Poverty in Jerseytown
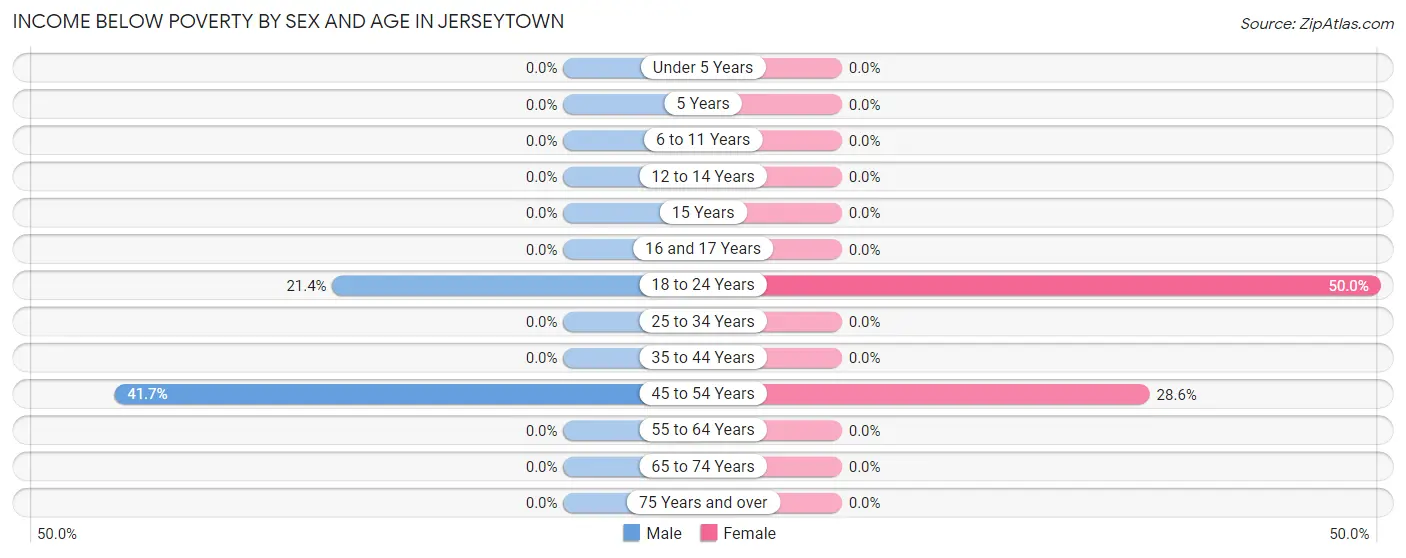
Income Below Poverty by Sex and Age in Jerseytown
With 18.4% poverty level for males and 13.4% for females among the residents of Jerseytown, 45 to 54 year old males and 18 to 24 year old females are the most vulnerable to poverty, with 15 males (41.7%) and 5 females (50.0%) in their respective age groups living below the poverty level.
| Age Bracket | Male | Female |
| Under 5 Years | 0 (0.0%) | 0 (0.0%) |
| 5 Years | 0 (0.0%) | 0 (0.0%) |
| 6 to 11 Years | 0 (0.0%) | 0 (0.0%) |
| 12 to 14 Years | 0 (0.0%) | 0 (0.0%) |
| 15 Years | 0 (0.0%) | 0 (0.0%) |
| 16 and 17 Years | 0 (0.0%) | 0 (0.0%) |
| 18 to 24 Years | 3 (21.4%) | 5 (50.0%) |
| 25 to 34 Years | 0 (0.0%) | 0 (0.0%) |
| 35 to 44 Years | 0 (0.0%) | 0 (0.0%) |
| 45 to 54 Years | 15 (41.7%) | 4 (28.6%) |
| 55 to 64 Years | 0 (0.0%) | 0 (0.0%) |
| 65 to 74 Years | 0 (0.0%) | 0 (0.0%) |
| 75 Years and over | 0 (0.0%) | 0 (0.0%) |
| Total | 18 (18.4%) | 9 (13.4%) |
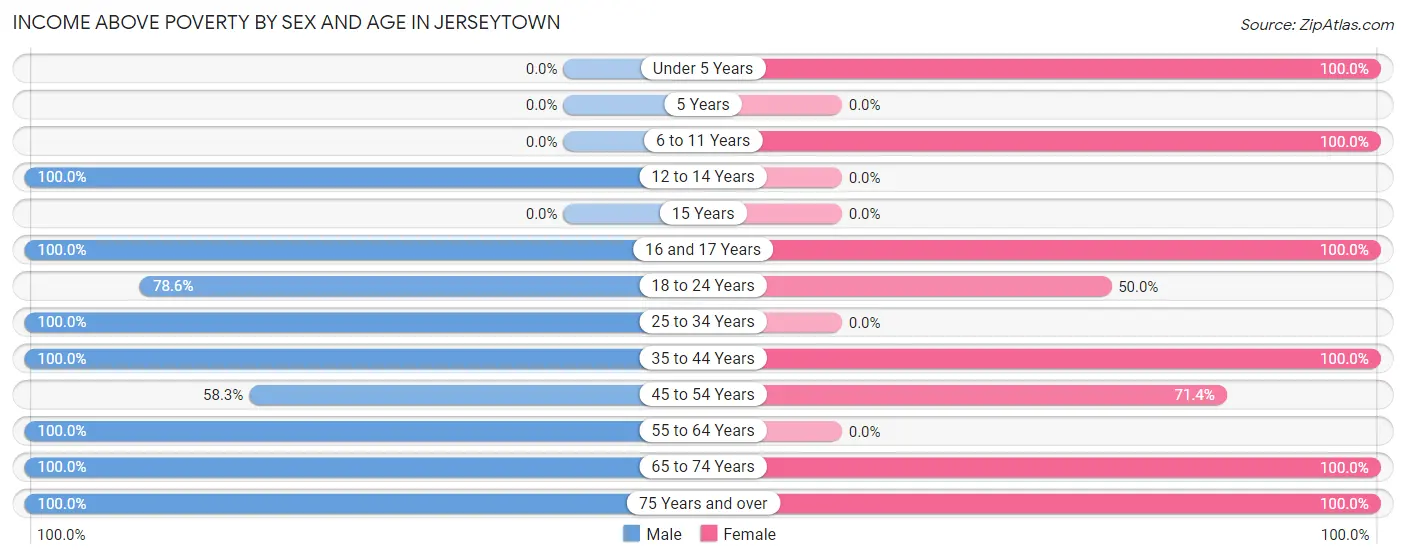
Income Above Poverty by Sex and Age in Jerseytown
According to the poverty statistics in Jerseytown, males aged 12 to 14 years and females aged under 5 years are the age groups that are most secure financially, with 100.0% of males and 100.0% of females in these age groups living above the poverty line.
| Age Bracket | Male | Female |
| Under 5 Years | 0 (0.0%) | 4 (100.0%) |
| 5 Years | 0 (0.0%) | 0 (0.0%) |
| 6 to 11 Years | 0 (0.0%) | 6 (100.0%) |
| 12 to 14 Years | 4 (100.0%) | 0 (0.0%) |
| 15 Years | 0 (0.0%) | 0 (0.0%) |
| 16 and 17 Years | 6 (100.0%) | 8 (100.0%) |
| 18 to 24 Years | 11 (78.6%) | 5 (50.0%) |
| 25 to 34 Years | 10 (100.0%) | 0 (0.0%) |
| 35 to 44 Years | 6 (100.0%) | 12 (100.0%) |
| 45 to 54 Years | 21 (58.3%) | 10 (71.4%) |
| 55 to 64 Years | 10 (100.0%) | 0 (0.0%) |
| 65 to 74 Years | 2 (100.0%) | 8 (100.0%) |
| 75 Years and over | 10 (100.0%) | 5 (100.0%) |
| Total | 80 (81.6%) | 58 (86.6%) |
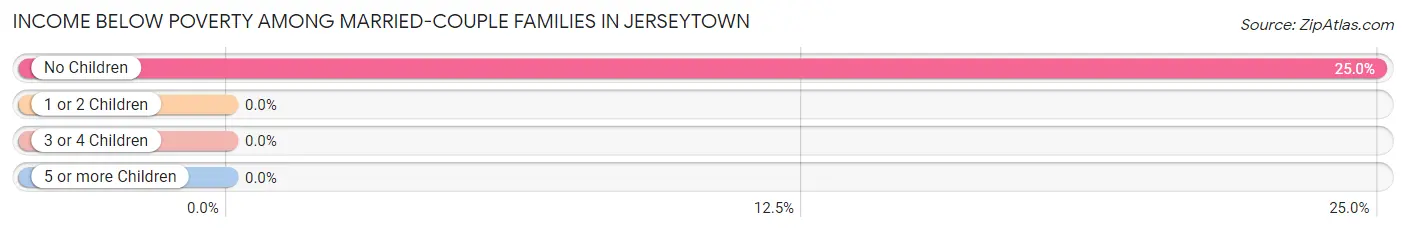
Income Below Poverty Among Married-Couple Families in Jerseytown
The poverty statistics for married-couple families in Jerseytown show that 12.0% or 3 of the total 25 families live below the poverty line. Families with no children have the highest poverty rate of 25.0%, comprising of 3 families. On the other hand, families with 1 or 2 children have the lowest poverty rate of 0.0%, which includes 0 families.
| Children | Above Poverty | Below Poverty |
| No Children | 9 (75.0%) | 3 (25.0%) |
| 1 or 2 Children | 13 (100.0%) | 0 (0.0%) |
| 3 or 4 Children | 0 (0.0%) | 0 (0.0%) |
| 5 or more Children | 0 (0.0%) | 0 (0.0%) |
| Total | 22 (88.0%) | 3 (12.0%) |
Income Below Poverty Among Single-Parent Households in Jerseytown
| Children | Single Father | Single Mother |
| No Children | 0 (0.0%) | 0 (0.0%) |
| 1 or 2 Children | 0 (0.0%) | 0 (0.0%) |
| 3 or 4 Children | 0 (0.0%) | 0 (0.0%) |
| 5 or more Children | 0 (0.0%) | 0 (0.0%) |
| Total | 0 (0.0%) | 0 (0.0%) |
Income Below Poverty Among Married-Couple vs Single-Parent Households in Jerseytown
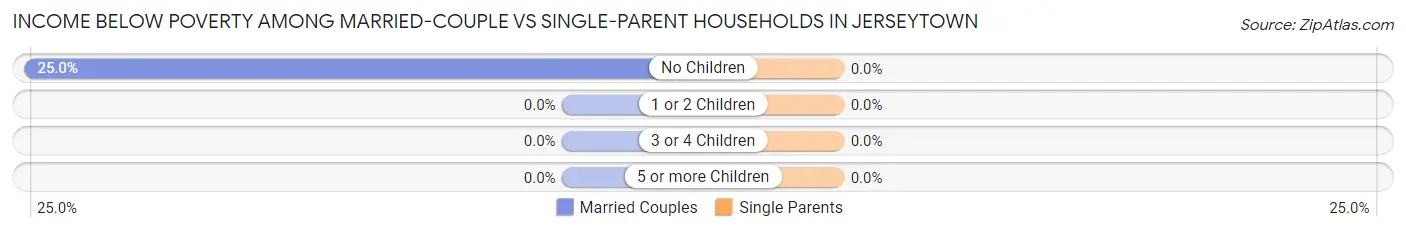
| Children | Married-Couple Families | Single-Parent Households |
| No Children | 3 (25.0%) | 0 (0.0%) |
| 1 or 2 Children | 0 (0.0%) | 0 (0.0%) |
| 3 or 4 Children | 0 (0.0%) | 0 (0.0%) |
| 5 or more Children | 0 (0.0%) | 0 (0.0%) |
| Total | 3 (12.0%) | 0 (0.0%) |
Race in Jerseytown
The most populous races in Jerseytown are , and White / Caucasian (169 | 100.0%).
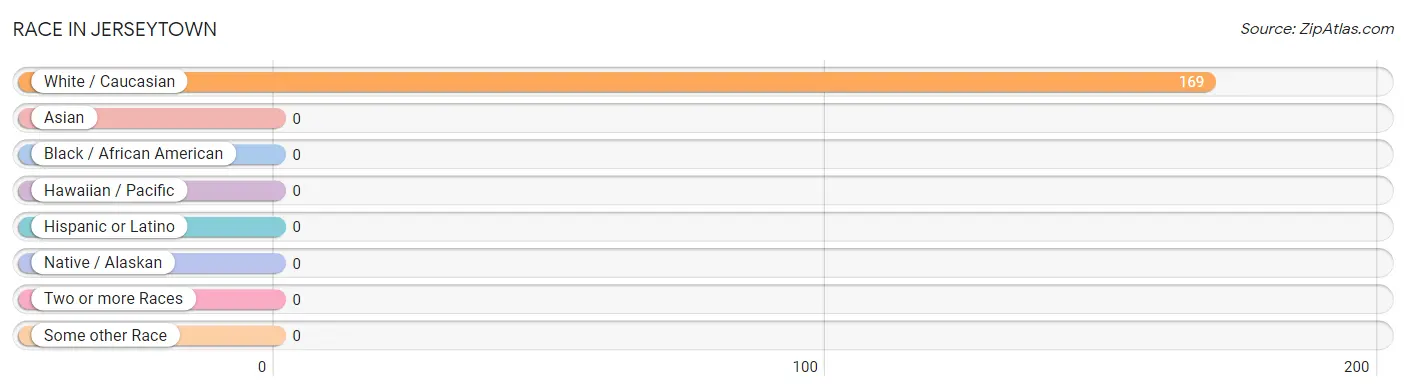
| Race | # Population | % Population |
| Asian | 0 | 0.0% |
| Black / African American | 0 | 0.0% |
| Hawaiian / Pacific | 0 | 0.0% |
| Hispanic or Latino | 0 | 0.0% |
| Native / Alaskan | 0 | 0.0% |
| White / Caucasian | 169 | 100.0% |
| Two or more Races | 0 | 0.0% |
| Some other Race | 0 | 0.0% |
| Total | 169 | 100.0% |
Ancestry in Jerseytown
The most populous ancestries reported in Jerseytown are German (73 | 43.2%), English (45 | 26.6%), French (10 | 5.9%), Irish (7 | 4.1%), and Scotch-Irish (7 | 4.1%), together accounting for 84.0% of all Jerseytown residents.
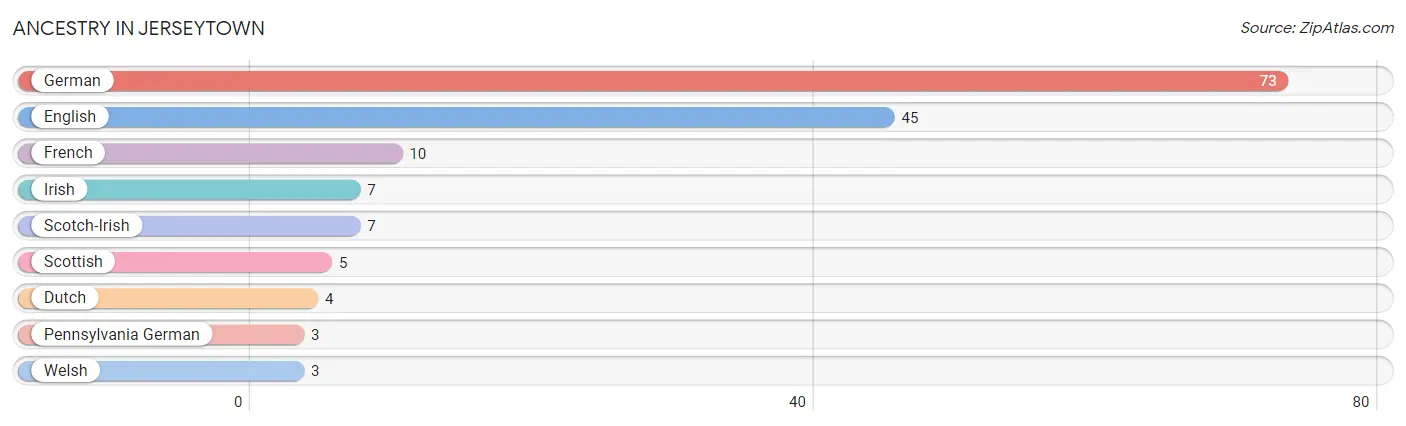
| Ancestry | # Population | % Population |
| Dutch | 4 | 2.4% |
| English | 45 | 26.6% |
| French | 10 | 5.9% |
| German | 73 | 43.2% |
| Irish | 7 | 4.1% |
| Pennsylvania German | 3 | 1.8% |
| Scotch-Irish | 7 | 4.1% |
| Scottish | 5 | 3.0% |
| Welsh | 3 | 1.8% | View All 9 Rows |
Immigrants in Jerseytown

| Immigration Origin | # Population | % Population | View All 0 Rows |
Sex and Age in Jerseytown
Sex and Age in Jerseytown
The most populous age groups in Jerseytown are 45 to 49 Years (29 | 28.4%) for men and 40 to 44 Years (12 | 17.9%) for women.
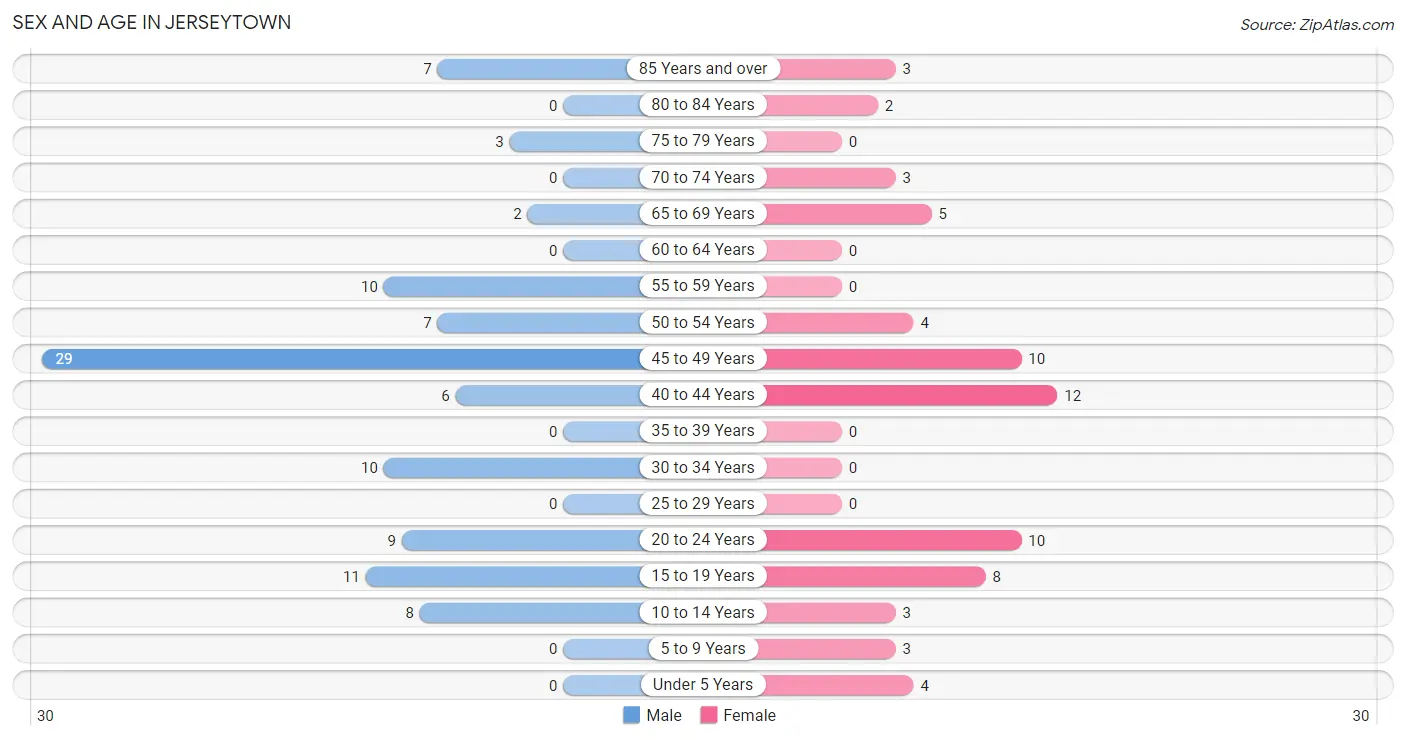
| Age Bracket | Male | Female |
| Under 5 Years | 0 (0.0%) | 4 (6.0%) |
| 5 to 9 Years | 0 (0.0%) | 3 (4.5%) |
| 10 to 14 Years | 8 (7.8%) | 3 (4.5%) |
| 15 to 19 Years | 11 (10.8%) | 8 (11.9%) |
| 20 to 24 Years | 9 (8.8%) | 10 (14.9%) |
| 25 to 29 Years | 0 (0.0%) | 0 (0.0%) |
| 30 to 34 Years | 10 (9.8%) | 0 (0.0%) |
| 35 to 39 Years | 0 (0.0%) | 0 (0.0%) |
| 40 to 44 Years | 6 (5.9%) | 12 (17.9%) |
| 45 to 49 Years | 29 (28.4%) | 10 (14.9%) |
| 50 to 54 Years | 7 (6.9%) | 4 (6.0%) |
| 55 to 59 Years | 10 (9.8%) | 0 (0.0%) |
| 60 to 64 Years | 0 (0.0%) | 0 (0.0%) |
| 65 to 69 Years | 2 (2.0%) | 5 (7.5%) |
| 70 to 74 Years | 0 (0.0%) | 3 (4.5%) |
| 75 to 79 Years | 3 (2.9%) | 0 (0.0%) |
| 80 to 84 Years | 0 (0.0%) | 2 (3.0%) |
| 85 Years and over | 7 (6.9%) | 3 (4.5%) |
| Total | 102 (100.0%) | 67 (100.0%) |
Families and Households in Jerseytown
Median Family Size in Jerseytown
The median family size in Jerseytown is 3.18 persons per family, with single male/father families (11 | 28.9%) accounting for the largest median family size of 4.27 persons per family. On the other hand, single female/mother families (2 | 5.3%) represent the smallest median family size with 2.00 persons per family.
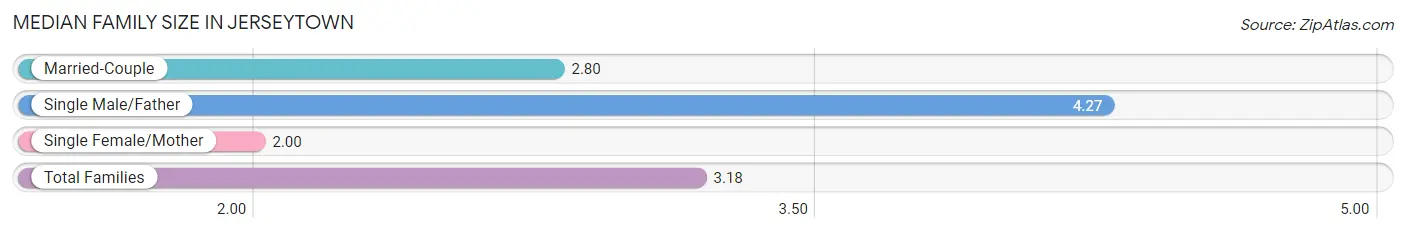
| Family Type | # Families | Family Size |
| Married-Couple | 25 (65.8%) | 2.80 |
| Single Male/Father | 11 (28.9%) | 4.27 |
| Single Female/Mother | 2 (5.3%) | 2.00 |
| Total Families | 38 (100.0%) | 3.18 |
Median Household Size in Jerseytown
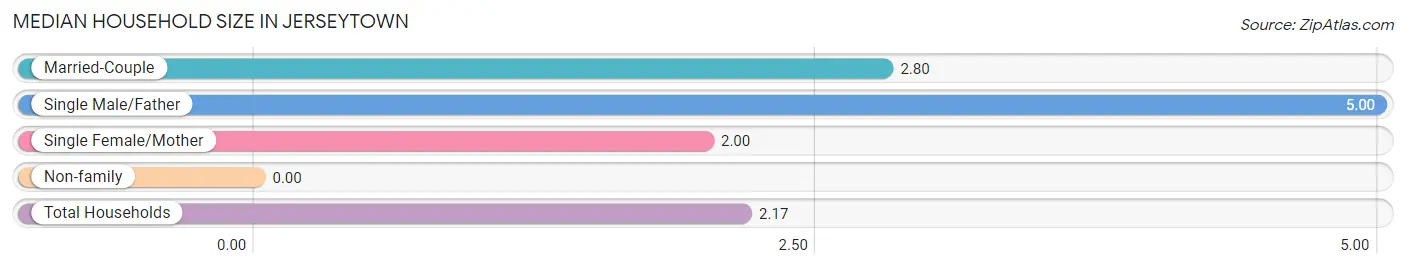
| Household Type | # Households | Household Size |
| Married-Couple | 25 (32.1%) | 2.80 |
| Single Male/Father | 11 (14.1%) | 5.00 |
| Single Female/Mother | 2 (2.6%) | 2.00 |
| Non-family | 40 (51.3%) | - |
| Total Households | 78 (100.0%) | 2.17 |
Household Size by Marriage Status in Jerseytown
Out of a total of 78 households in Jerseytown, 38 (48.7%) are family households, while 40 (51.3%) are nonfamily households. The most numerous type of family households are 2-person households, comprising 20, and the most common type of nonfamily households are 1-person households, comprising 40.
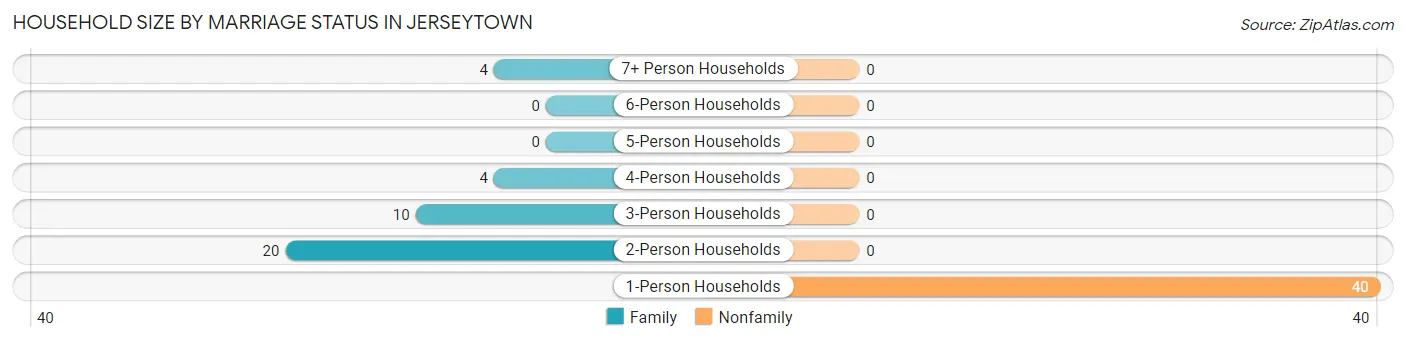
| Household Size | Family Households | Nonfamily Households |
| 1-Person Households | - | 40 (51.3%) |
| 2-Person Households | 20 (25.6%) | 0 (0.0%) |
| 3-Person Households | 10 (12.8%) | 0 (0.0%) |
| 4-Person Households | 4 (5.1%) | 0 (0.0%) |
| 5-Person Households | 0 (0.0%) | 0 (0.0%) |
| 6-Person Households | 0 (0.0%) | 0 (0.0%) |
| 7+ Person Households | 4 (5.1%) | 0 (0.0%) |
| Total | 38 (48.7%) | 40 (51.3%) |
Female Fertility in Jerseytown
Fertility by Age in Jerseytown
| Age Bracket | Women with Births | Births / 1,000 Women |
| 15 to 19 years | 0 (0.0%) | 0.0 |
| 20 to 34 years | 0 (0.0%) | 0.0 |
| 35 to 50 years | 0 (0.0%) | 0.0 |
| Total | 0 (0.0%) | 0.0 |
Fertility by Age by Marriage Status in Jerseytown
| Age Bracket | Married | Unmarried |
| 15 to 19 years | 0 (0.0%) | 0 (0.0%) |
| 20 to 34 years | 0 (0.0%) | 0 (0.0%) |
| 35 to 50 years | 0 (0.0%) | 0 (0.0%) |
| Total | 0 (0.0%) | 0 (0.0%) |
Fertility by Education in Jerseytown
| Educational Attainment | Women with Births | Births / 1,000 Women |
| Less than High School | 0 (0.0%) | 0.0 |
| High School Diploma | 0 (0.0%) | 0.0 |
| College or Associate's Degree | 0 (0.0%) | 0.0 |
| Bachelor's Degree | 0 (0.0%) | 0.0 |
| Graduate Degree | 0 (0.0%) | 0.0 |
| Total | 0 (0.0%) | 0.0 |
Fertility by Education by Marriage Status in Jerseytown
| Educational Attainment | Married | Unmarried |
| Less than High School | 0 (0.0%) | 0 (0.0%) |
| High School Diploma | 0 (0.0%) | 0 (0.0%) |
| College or Associate's Degree | 0 (0.0%) | 0 (0.0%) |
| Bachelor's Degree | 0 (0.0%) | 0 (0.0%) |
| Graduate Degree | 0 (0.0%) | 0 (0.0%) |
| Total | 0 (0.0%) | 0 (0.0%) |
Employment Characteristics in Jerseytown
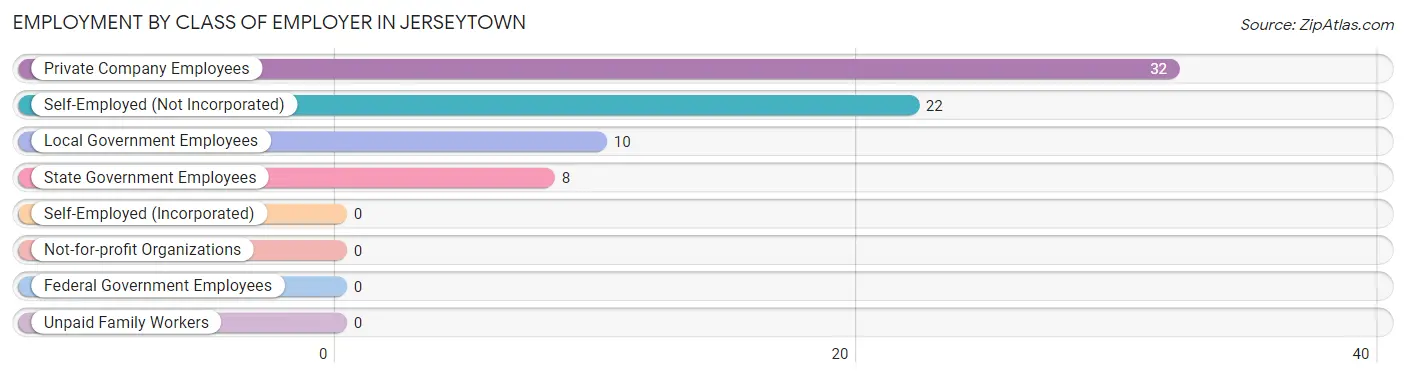
Employment by Class of Employer in Jerseytown
Among the 72 employed individuals in Jerseytown, private company employees (32 | 44.4%), self-employed (not incorporated) (22 | 30.6%), and local government employees (10 | 13.9%) make up the most common classes of employment.
| Employer Class | # Employees | % Employees |
| Private Company Employees | 32 | 44.4% |
| Self-Employed (Incorporated) | 0 | 0.0% |
| Self-Employed (Not Incorporated) | 22 | 30.6% |
| Not-for-profit Organizations | 0 | 0.0% |
| Local Government Employees | 10 | 13.9% |
| State Government Employees | 8 | 11.1% |
| Federal Government Employees | 0 | 0.0% |
| Unpaid Family Workers | 0 | 0.0% |
| Total | 72 | 100.0% |
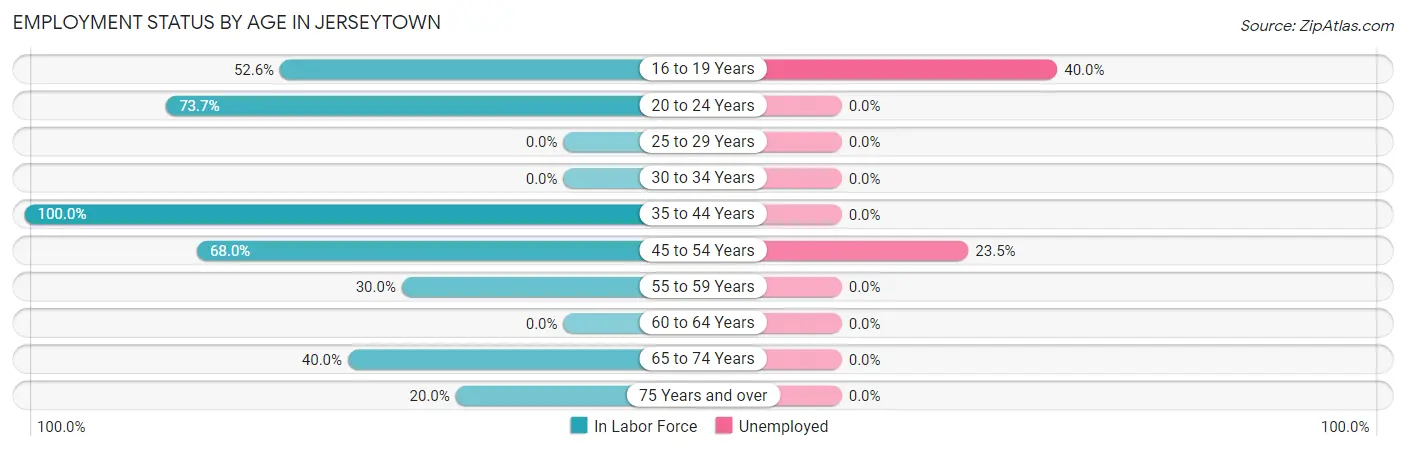
Employment Status by Age in Jerseytown
According to the labor force statistics for Jerseytown, out of the total population over 16 years of age (151), 57.0% or 86 individuals are in the labor force, with 14.0% or 12 of them unemployed. The age group with the highest labor force participation rate is 35 to 44 years, with 100.0% or 18 individuals in the labor force. Within the labor force, the 16 to 19 years age range has the highest percentage of unemployed individuals, with 40.0% or 4 of them being unemployed.
| Age Bracket | In Labor Force | Unemployed |
| 16 to 19 Years | 10 (52.6%) | 4 (40.0%) |
| 20 to 24 Years | 14 (73.7%) | 0 (0.0%) |
| 25 to 29 Years | 0 (0.0%) | 0 (0.0%) |
| 30 to 34 Years | 0 (0.0%) | 0 (0.0%) |
| 35 to 44 Years | 18 (100.0%) | 0 (0.0%) |
| 45 to 54 Years | 34 (68.0%) | 8 (23.5%) |
| 55 to 59 Years | 3 (30.0%) | 0 (0.0%) |
| 60 to 64 Years | 0 (0.0%) | 0 (0.0%) |
| 65 to 74 Years | 4 (40.0%) | 0 (0.0%) |
| 75 Years and over | 3 (20.0%) | 0 (0.0%) |
| Total | 86 (57.0%) | 12 (14.0%) |
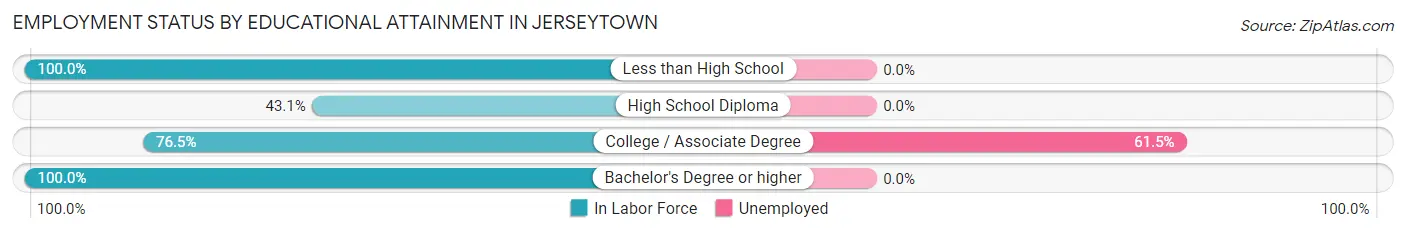
Employment Status by Educational Attainment in Jerseytown
According to labor force statistics for Jerseytown, 62.5% of individuals (55) out of the total population between 25 and 64 years of age (88) are in the labor force, with 14.5% or 8 of them being unemployed. The group with the highest labor force participation rate are those with the educational attainment of less than high school, with 100.0% or 3 individuals in the labor force. Within the labor force, individuals with college / associate degree education have the highest percentage of unemployment, with 61.5% or 8 of them being unemployed.
| Educational Attainment | In Labor Force | Unemployed |
| Less than High School | 3 (100.0%) | 0 (0.0%) |
| High School Diploma | 22 (43.1%) | 0 (0.0%) |
| College / Associate Degree | 13 (76.5%) | 10 (61.5%) |
| Bachelor's Degree or higher | 17 (100.0%) | 0 (0.0%) |
| Total | 55 (62.5%) | 13 (14.5%) |
Employment Occupations by Sex in Jerseytown
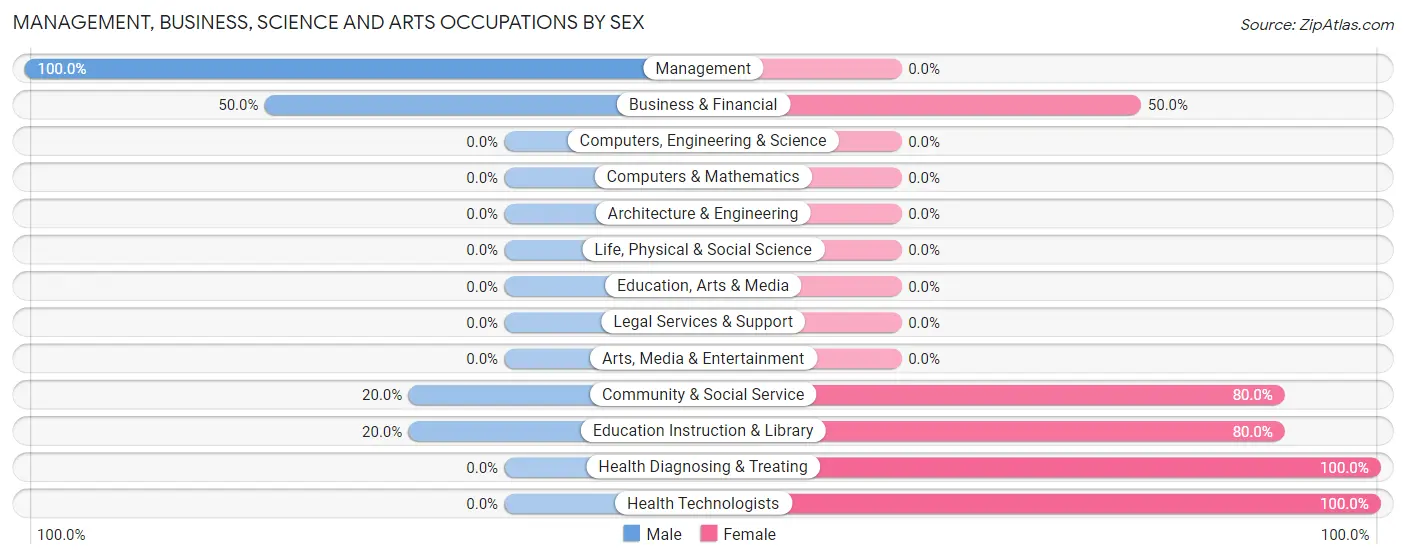
Management, Business, Science and Arts Occupations
The most common Management, Business, Science and Arts occupations in Jerseytown are Community & Social Service (15 | 20.3%), Education Instruction & Library (15 | 20.3%), Business & Financial (6 | 8.1%), Management (5 | 6.8%), and Health Diagnosing & Treating (2 | 2.7%).
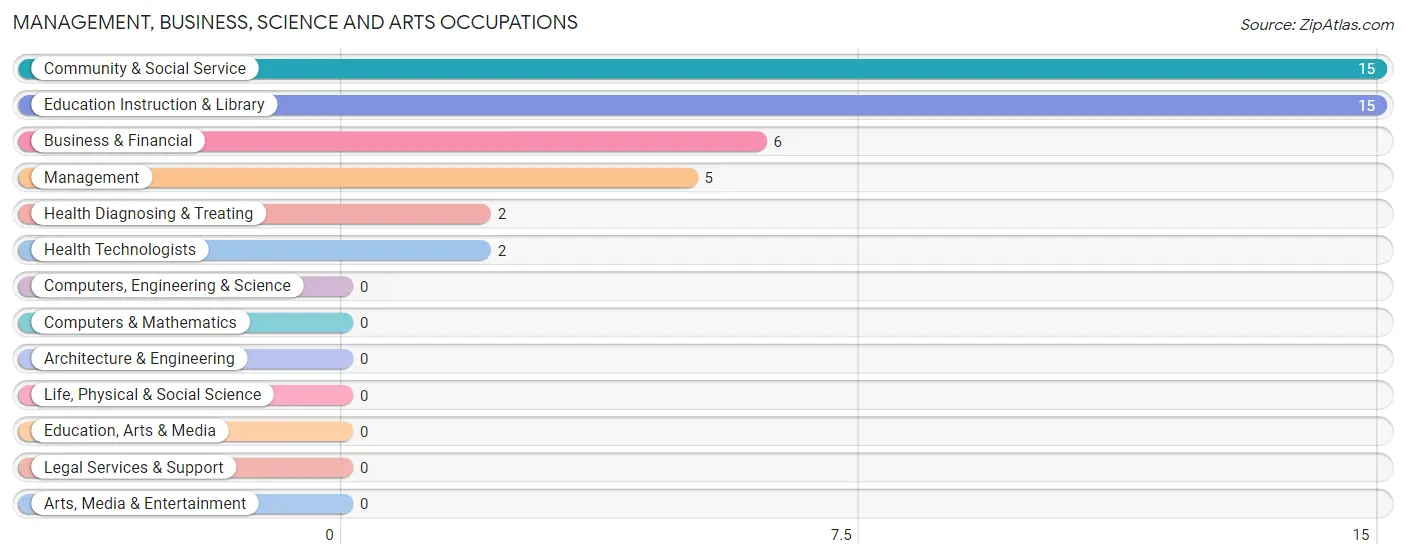
Management, Business, Science and Arts Occupations by Sex
Within the Management, Business, Science and Arts occupations in Jerseytown, the most male-oriented occupations are Management (100.0%), Business & Financial (50.0%), and Community & Social Service (20.0%), while the most female-oriented occupations are Health Diagnosing & Treating (100.0%), Health Technologists (100.0%), and Community & Social Service (80.0%).
| Occupation | Male | Female |
| Management | 5 (100.0%) | 0 (0.0%) |
| Business & Financial | 3 (50.0%) | 3 (50.0%) |
| Computers, Engineering & Science | 0 (0.0%) | 0 (0.0%) |
| Computers & Mathematics | 0 (0.0%) | 0 (0.0%) |
| Architecture & Engineering | 0 (0.0%) | 0 (0.0%) |
| Life, Physical & Social Science | 0 (0.0%) | 0 (0.0%) |
| Community & Social Service | 3 (20.0%) | 12 (80.0%) |
| Education, Arts & Media | 0 (0.0%) | 0 (0.0%) |
| Legal Services & Support | 0 (0.0%) | 0 (0.0%) |
| Education Instruction & Library | 3 (20.0%) | 12 (80.0%) |
| Arts, Media & Entertainment | 0 (0.0%) | 0 (0.0%) |
| Health Diagnosing & Treating | 0 (0.0%) | 2 (100.0%) |
| Health Technologists | 0 (0.0%) | 2 (100.0%) |
| Total (Category) | 11 (39.3%) | 17 (60.7%) |
| Total (Overall) | 50 (67.6%) | 24 (32.4%) |
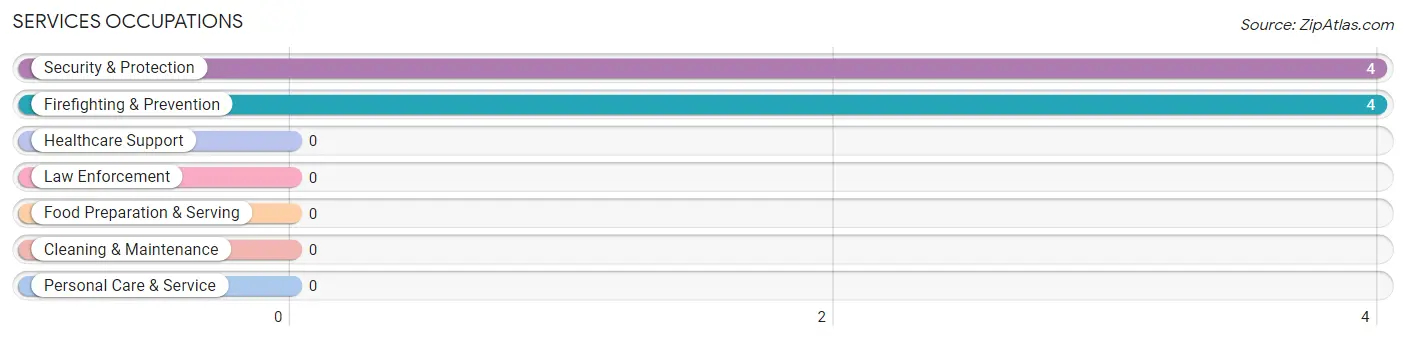
Services Occupations
The most common Services occupations in Jerseytown are Security & Protection (4 | 5.4%), and Firefighting & Prevention (4 | 5.4%).
Services Occupations by Sex
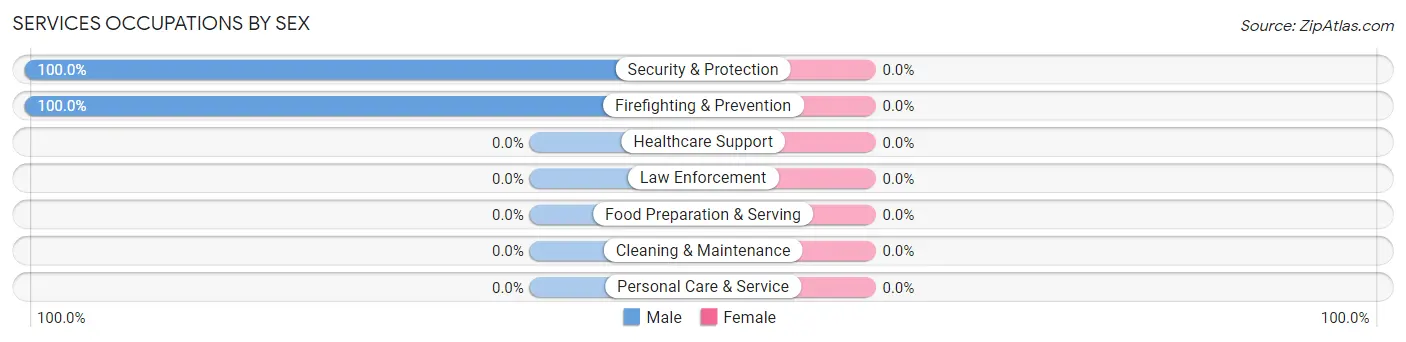
| Occupation | Male | Female |
| Healthcare Support | 0 (0.0%) | 0 (0.0%) |
| Security & Protection | 4 (100.0%) | 0 (0.0%) |
| Firefighting & Prevention | 4 (100.0%) | 0 (0.0%) |
| Law Enforcement | 0 (0.0%) | 0 (0.0%) |
| Food Preparation & Serving | 0 (0.0%) | 0 (0.0%) |
| Cleaning & Maintenance | 0 (0.0%) | 0 (0.0%) |
| Personal Care & Service | 0 (0.0%) | 0 (0.0%) |
| Total (Category) | 4 (100.0%) | 0 (0.0%) |
| Total (Overall) | 50 (67.6%) | 24 (32.4%) |
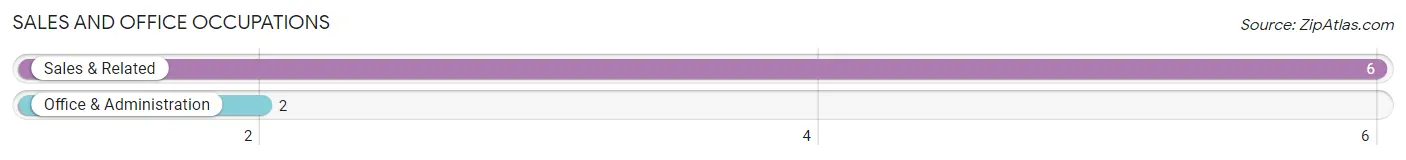
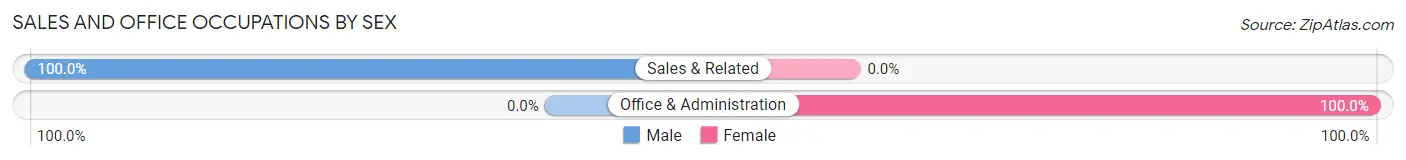
Sales and Office Occupations
The most common Sales and Office occupations in Jerseytown are Sales & Related (6 | 8.1%), and Office & Administration (2 | 2.7%).
Sales and Office Occupations by Sex
| Occupation | Male | Female |
| Sales & Related | 6 (100.0%) | 0 (0.0%) |
| Office & Administration | 0 (0.0%) | 2 (100.0%) |
| Total (Category) | 6 (75.0%) | 2 (25.0%) |
| Total (Overall) | 50 (67.6%) | 24 (32.4%) |
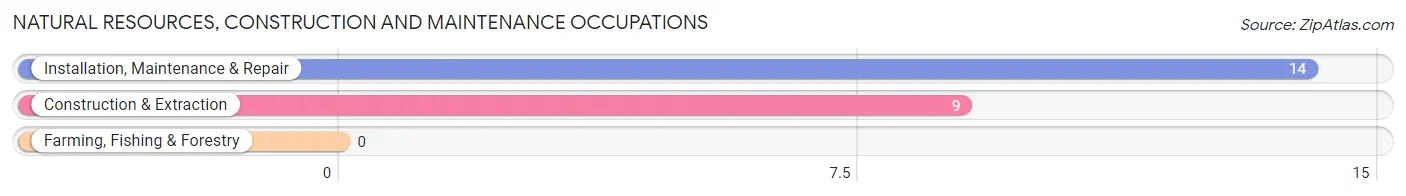
Natural Resources, Construction and Maintenance Occupations
The most common Natural Resources, Construction and Maintenance occupations in Jerseytown are Installation, Maintenance & Repair (14 | 18.9%), and Construction & Extraction (9 | 12.2%).
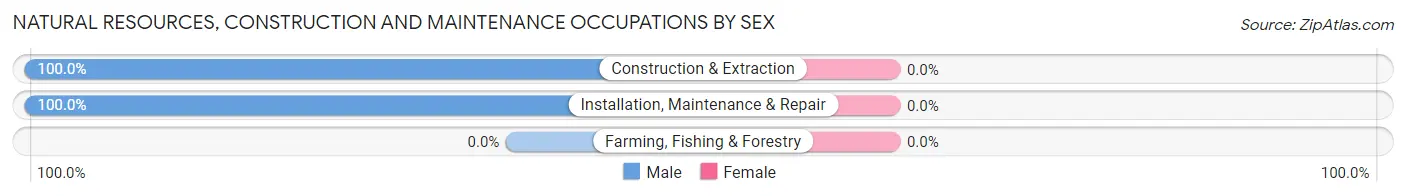
Natural Resources, Construction and Maintenance Occupations by Sex
| Occupation | Male | Female |
| Farming, Fishing & Forestry | 0 (0.0%) | 0 (0.0%) |
| Construction & Extraction | 9 (100.0%) | 0 (0.0%) |
| Installation, Maintenance & Repair | 14 (100.0%) | 0 (0.0%) |
| Total (Category) | 23 (100.0%) | 0 (0.0%) |
| Total (Overall) | 50 (67.6%) | 24 (32.4%) |
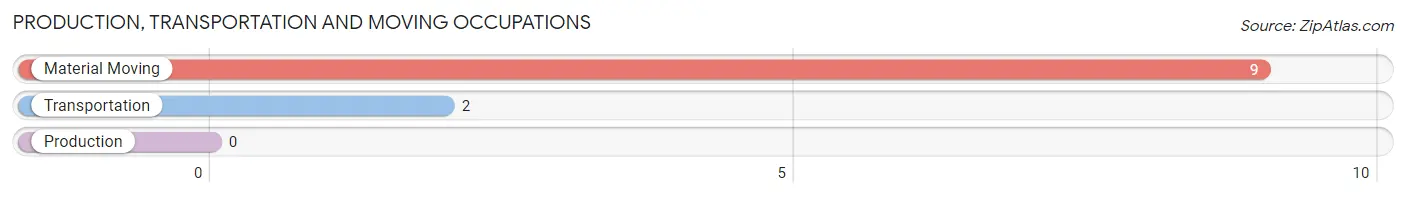
Production, Transportation and Moving Occupations
The most common Production, Transportation and Moving occupations in Jerseytown are Material Moving (9 | 12.2%), and Transportation (2 | 2.7%).
Production, Transportation and Moving Occupations by Sex
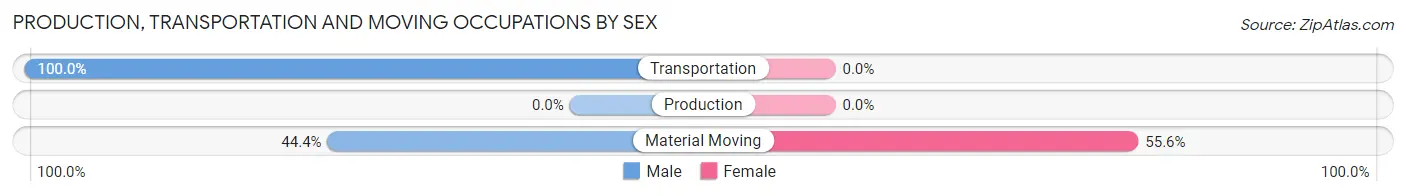
| Occupation | Male | Female |
| Production | 0 (0.0%) | 0 (0.0%) |
| Transportation | 2 (100.0%) | 0 (0.0%) |
| Material Moving | 4 (44.4%) | 5 (55.6%) |
| Total (Category) | 6 (54.5%) | 5 (45.5%) |
| Total (Overall) | 50 (67.6%) | 24 (32.4%) |
Employment Industries by Sex in Jerseytown
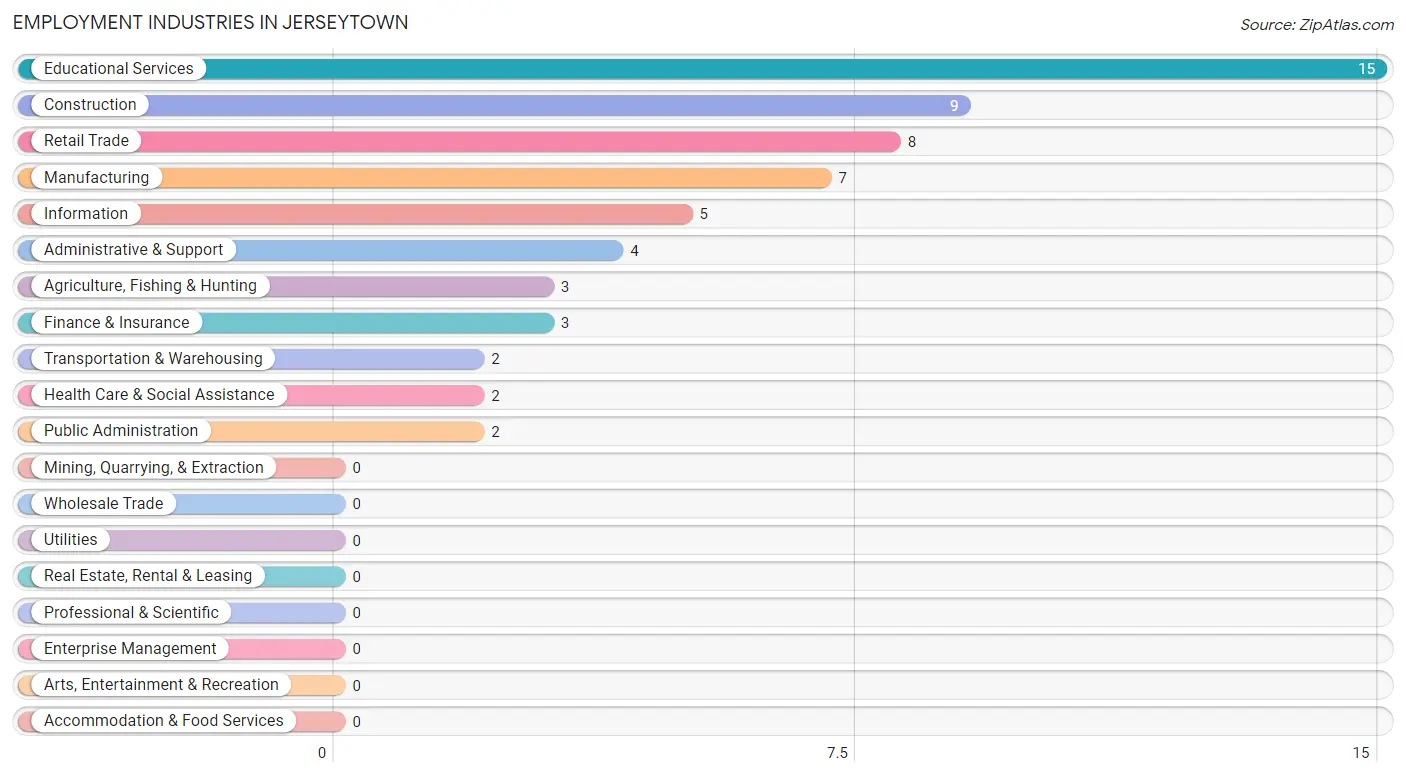
Employment Industries in Jerseytown
The major employment industries in Jerseytown include Educational Services (15 | 20.3%), Construction (9 | 12.2%), Retail Trade (8 | 10.8%), Manufacturing (7 | 9.5%), and Information (5 | 6.8%).
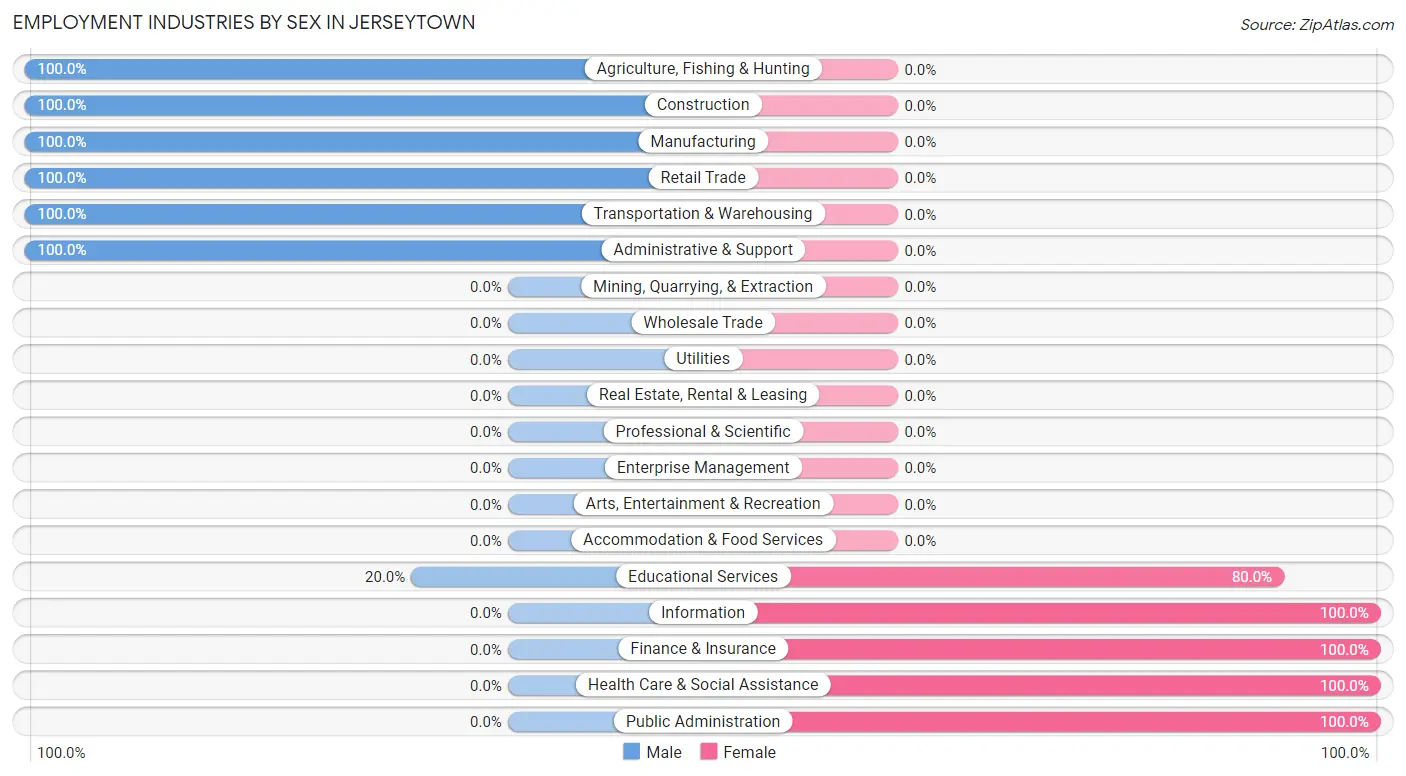
Employment Industries by Sex in Jerseytown
The Jerseytown industries that see more men than women are Agriculture, Fishing & Hunting (100.0%), Construction (100.0%), and Manufacturing (100.0%), whereas the industries that tend to have a higher number of women are Information (100.0%), Finance & Insurance (100.0%), and Health Care & Social Assistance (100.0%).
| Industry | Male | Female |
| Agriculture, Fishing & Hunting | 3 (100.0%) | 0 (0.0%) |
| Mining, Quarrying, & Extraction | 0 (0.0%) | 0 (0.0%) |
| Construction | 9 (100.0%) | 0 (0.0%) |
| Manufacturing | 7 (100.0%) | 0 (0.0%) |
| Wholesale Trade | 0 (0.0%) | 0 (0.0%) |
| Retail Trade | 8 (100.0%) | 0 (0.0%) |
| Transportation & Warehousing | 2 (100.0%) | 0 (0.0%) |
| Utilities | 0 (0.0%) | 0 (0.0%) |
| Information | 0 (0.0%) | 5 (100.0%) |
| Finance & Insurance | 0 (0.0%) | 3 (100.0%) |
| Real Estate, Rental & Leasing | 0 (0.0%) | 0 (0.0%) |
| Professional & Scientific | 0 (0.0%) | 0 (0.0%) |
| Enterprise Management | 0 (0.0%) | 0 (0.0%) |
| Administrative & Support | 4 (100.0%) | 0 (0.0%) |
| Educational Services | 3 (20.0%) | 12 (80.0%) |
| Health Care & Social Assistance | 0 (0.0%) | 2 (100.0%) |
| Arts, Entertainment & Recreation | 0 (0.0%) | 0 (0.0%) |
| Accommodation & Food Services | 0 (0.0%) | 0 (0.0%) |
| Public Administration | 0 (0.0%) | 2 (100.0%) |
| Total | 50 (67.6%) | 24 (32.4%) |
Education in Jerseytown
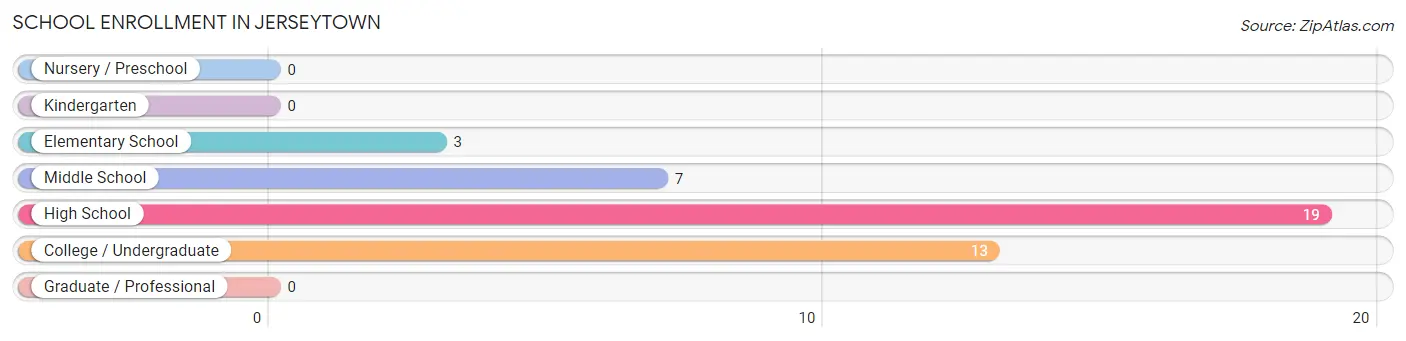
School Enrollment in Jerseytown
The most common levels of schooling among the 42 students in Jerseytown are high school (19 | 45.2%), college / undergraduate (13 | 30.9%), and middle school (7 | 16.7%).
| School Level | # Students | % Students |
| Nursery / Preschool | 0 | 0.0% |
| Kindergarten | 0 | 0.0% |
| Elementary School | 3 | 7.1% |
| Middle School | 7 | 16.7% |
| High School | 19 | 45.2% |
| College / Undergraduate | 13 | 30.9% |
| Graduate / Professional | 0 | 0.0% |
| Total | 42 | 100.0% |
School Enrollment by Age by Funding Source in Jerseytown
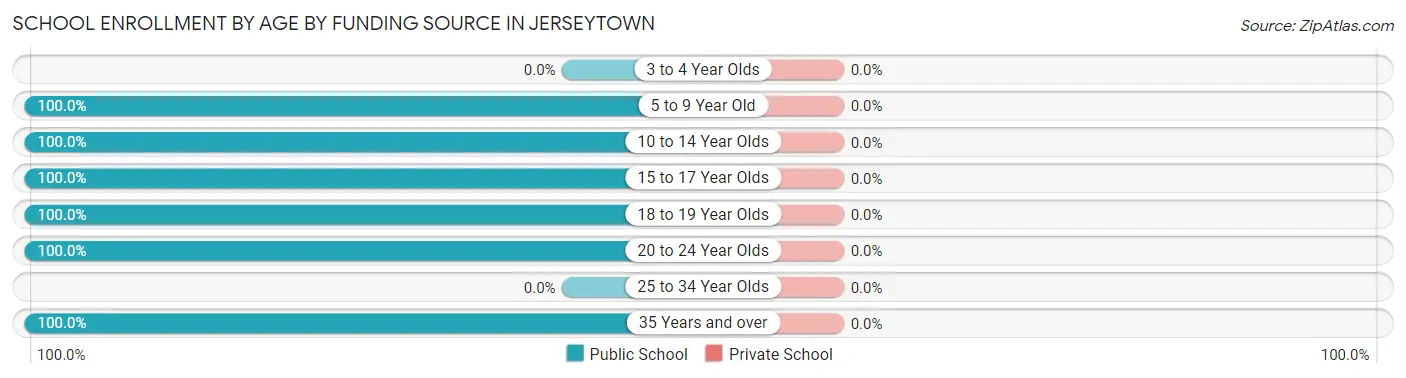
| Age Bracket | Public School | Private School |
| 3 to 4 Year Olds | 0 (0.0%) | 0 (0.0%) |
| 5 to 9 Year Old | 3 (100.0%) | 0 (0.0%) |
| 10 to 14 Year Olds | 11 (100.0%) | 0 (0.0%) |
| 15 to 17 Year Olds | 14 (100.0%) | 0 (0.0%) |
| 18 to 19 Year Olds | 1 (100.0%) | 0 (0.0%) |
| 20 to 24 Year Olds | 9 (100.0%) | 0 (0.0%) |
| 25 to 34 Year Olds | 0 (0.0%) | 0 (0.0%) |
| 35 Years and over | 4 (100.0%) | 0 (0.0%) |
| Total | 42 (100.0%) | 0 (0.0%) |
Educational Attainment by Field of Study in Jerseytown
Education (10 | 50.0%), literature & languages (5 | 25.0%), social sciences (3 | 15.0%), and liberal arts & history (2 | 10.0%) are the most common fields of study among 20 individuals in Jerseytown who have obtained a bachelor's degree or higher.
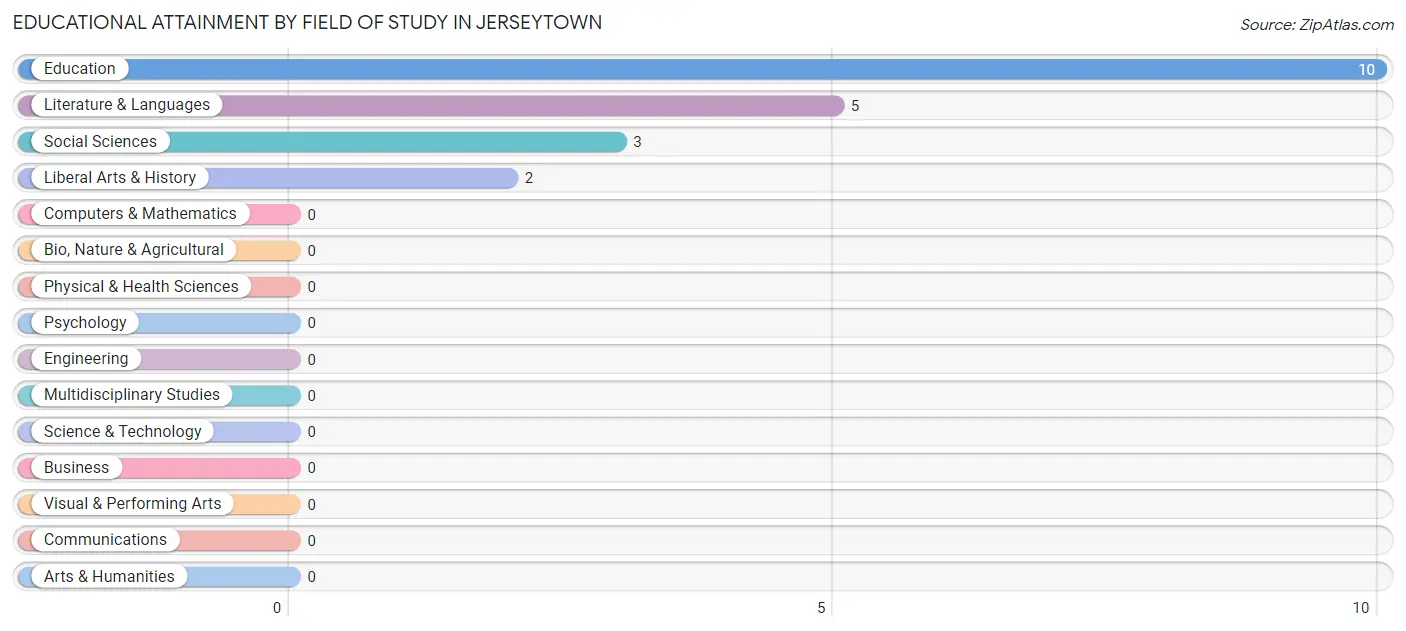
| Field of Study | # Graduates | % Graduates |
| Computers & Mathematics | 0 | 0.0% |
| Bio, Nature & Agricultural | 0 | 0.0% |
| Physical & Health Sciences | 0 | 0.0% |
| Psychology | 0 | 0.0% |
| Social Sciences | 3 | 15.0% |
| Engineering | 0 | 0.0% |
| Multidisciplinary Studies | 0 | 0.0% |
| Science & Technology | 0 | 0.0% |
| Business | 0 | 0.0% |
| Education | 10 | 50.0% |
| Literature & Languages | 5 | 25.0% |
| Liberal Arts & History | 2 | 10.0% |
| Visual & Performing Arts | 0 | 0.0% |
| Communications | 0 | 0.0% |
| Arts & Humanities | 0 | 0.0% |
| Total | 20 | 100.0% |
Transportation & Commute in Jerseytown
Vehicle Availability by Sex in Jerseytown
The most prevalent vehicle ownership categories in Jerseytown are males with 4 vehicles (17, accounting for 34.0%) and females with 4 vehicles (10, making up 77.3%).
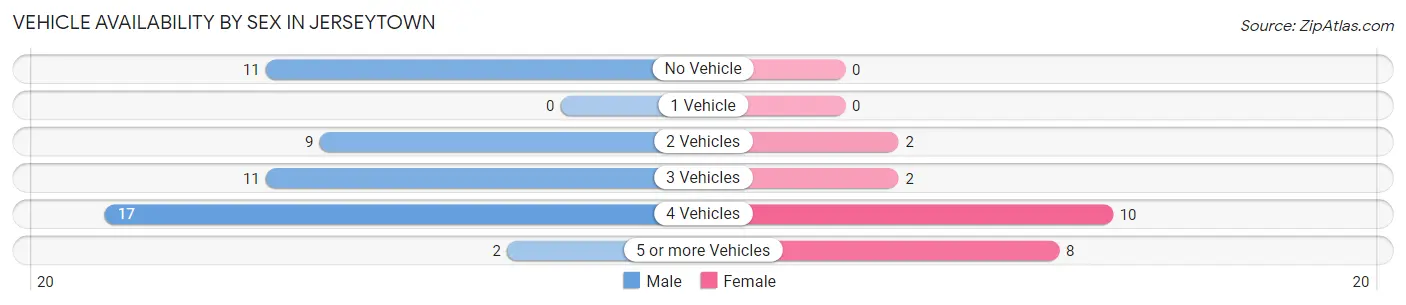
| Vehicles Available | Male | Female |
| No Vehicle | 11 (22.0%) | 0 (0.0%) |
| 1 Vehicle | 0 (0.0%) | 0 (0.0%) |
| 2 Vehicles | 9 (18.0%) | 2 (9.1%) |
| 3 Vehicles | 11 (22.0%) | 2 (9.1%) |
| 4 Vehicles | 17 (34.0%) | 10 (45.5%) |
| 5 or more Vehicles | 2 (4.0%) | 8 (36.4%) |
| Total | 50 (100.0%) | 22 (100.0%) |
Commute Time in Jerseytown
The most frequently occuring commute durations in Jerseytown are 15 to 19 minutes (17 commuters, 30.9%), less than 5 minutes (14 commuters, 25.5%), and 20 to 24 minutes (9 commuters, 16.4%).
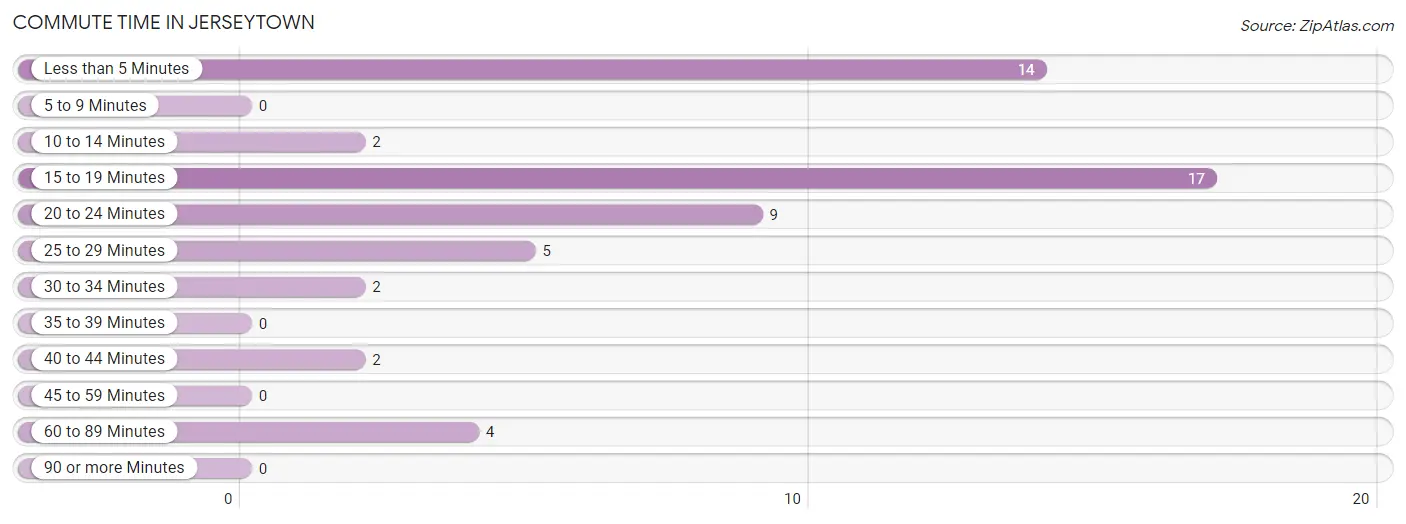
| Commute Time | # Commuters | % Commuters |
| Less than 5 Minutes | 14 | 25.5% |
| 5 to 9 Minutes | 0 | 0.0% |
| 10 to 14 Minutes | 2 | 3.6% |
| 15 to 19 Minutes | 17 | 30.9% |
| 20 to 24 Minutes | 9 | 16.4% |
| 25 to 29 Minutes | 5 | 9.1% |
| 30 to 34 Minutes | 2 | 3.6% |
| 35 to 39 Minutes | 0 | 0.0% |
| 40 to 44 Minutes | 2 | 3.6% |
| 45 to 59 Minutes | 0 | 0.0% |
| 60 to 89 Minutes | 4 | 7.3% |
| 90 or more Minutes | 0 | 0.0% |
Commute Time by Sex in Jerseytown
The most common commute times in Jerseytown are less than 5 minutes (14 commuters, 36.8%) for males and 15 to 19 minutes (10 commuters, 58.8%) for females.
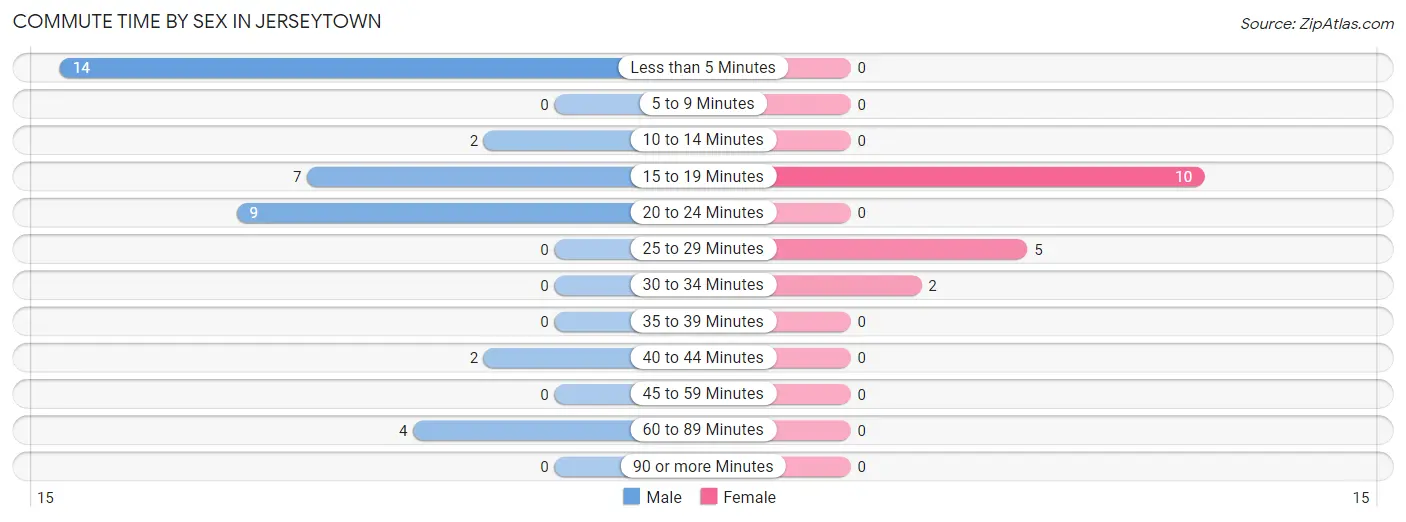
| Commute Time | Male | Female |
| Less than 5 Minutes | 14 (36.8%) | 0 (0.0%) |
| 5 to 9 Minutes | 0 (0.0%) | 0 (0.0%) |
| 10 to 14 Minutes | 2 (5.3%) | 0 (0.0%) |
| 15 to 19 Minutes | 7 (18.4%) | 10 (58.8%) |
| 20 to 24 Minutes | 9 (23.7%) | 0 (0.0%) |
| 25 to 29 Minutes | 0 (0.0%) | 5 (29.4%) |
| 30 to 34 Minutes | 0 (0.0%) | 2 (11.8%) |
| 35 to 39 Minutes | 0 (0.0%) | 0 (0.0%) |
| 40 to 44 Minutes | 2 (5.3%) | 0 (0.0%) |
| 45 to 59 Minutes | 0 (0.0%) | 0 (0.0%) |
| 60 to 89 Minutes | 4 (10.5%) | 0 (0.0%) |
| 90 or more Minutes | 0 (0.0%) | 0 (0.0%) |
Time of Departure to Work by Sex in Jerseytown
The most frequent times of departure to work in Jerseytown are 7:30 AM to 7:59 AM (11, 28.9%) for males and 7:30 AM to 7:59 AM (15, 88.2%) for females.
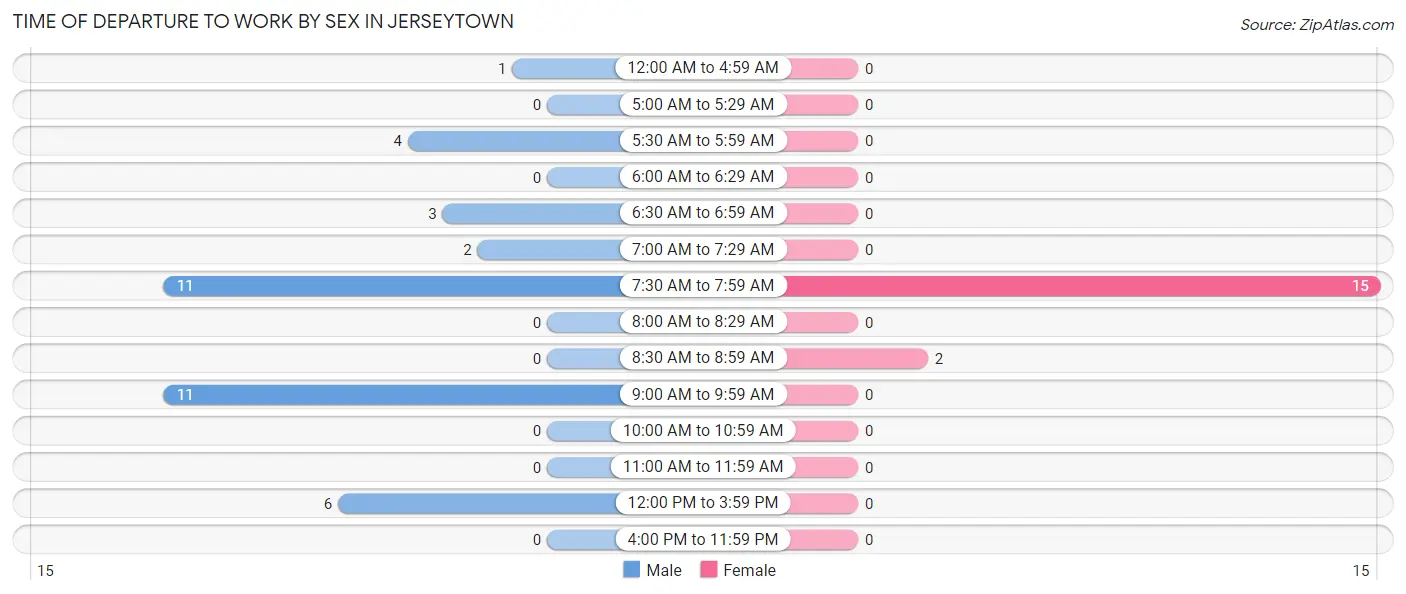
| Time of Departure | Male | Female |
| 12:00 AM to 4:59 AM | 1 (2.6%) | 0 (0.0%) |
| 5:00 AM to 5:29 AM | 0 (0.0%) | 0 (0.0%) |
| 5:30 AM to 5:59 AM | 4 (10.5%) | 0 (0.0%) |
| 6:00 AM to 6:29 AM | 0 (0.0%) | 0 (0.0%) |
| 6:30 AM to 6:59 AM | 3 (7.9%) | 0 (0.0%) |
| 7:00 AM to 7:29 AM | 2 (5.3%) | 0 (0.0%) |
| 7:30 AM to 7:59 AM | 11 (28.9%) | 15 (88.2%) |
| 8:00 AM to 8:29 AM | 0 (0.0%) | 0 (0.0%) |
| 8:30 AM to 8:59 AM | 0 (0.0%) | 2 (11.8%) |
| 9:00 AM to 9:59 AM | 11 (28.9%) | 0 (0.0%) |
| 10:00 AM to 10:59 AM | 0 (0.0%) | 0 (0.0%) |
| 11:00 AM to 11:59 AM | 0 (0.0%) | 0 (0.0%) |
| 12:00 PM to 3:59 PM | 6 (15.8%) | 0 (0.0%) |
| 4:00 PM to 11:59 PM | 0 (0.0%) | 0 (0.0%) |
| Total | 38 (100.0%) | 17 (100.0%) |
Housing Occupancy in Jerseytown
Occupancy by Ownership in Jerseytown
Of the total 78 dwellings in Jerseytown, owner-occupied units account for 46 (59.0%), while renter-occupied units make up 32 (41.0%).
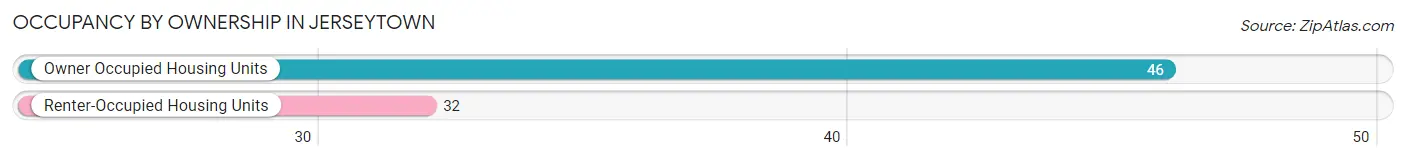
| Occupancy | # Housing Units | % Housing Units |
| Owner Occupied Housing Units | 46 | 59.0% |
| Renter-Occupied Housing Units | 32 | 41.0% |
| Total Occupied Housing Units | 78 | 100.0% |
Occupancy by Household Size in Jerseytown
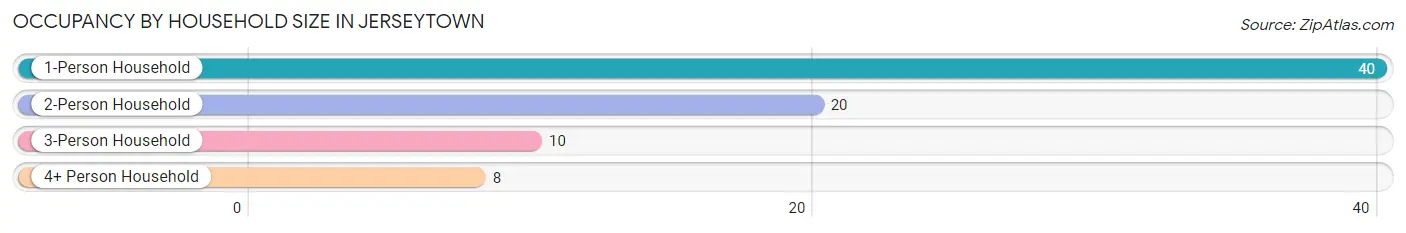
| Household Size | # Housing Units | % Housing Units |
| 1-Person Household | 40 | 51.3% |
| 2-Person Household | 20 | 25.6% |
| 3-Person Household | 10 | 12.8% |
| 4+ Person Household | 8 | 10.3% |
| Total Housing Units | 78 | 100.0% |
Occupancy by Ownership by Household Size in Jerseytown
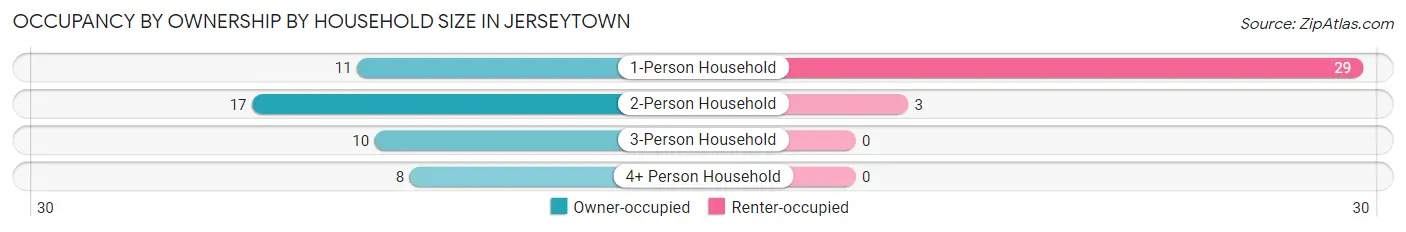
| Household Size | Owner-occupied | Renter-occupied |
| 1-Person Household | 11 (27.5%) | 29 (72.5%) |
| 2-Person Household | 17 (85.0%) | 3 (15.0%) |
| 3-Person Household | 10 (100.0%) | 0 (0.0%) |
| 4+ Person Household | 8 (100.0%) | 0 (0.0%) |
| Total Housing Units | 46 (59.0%) | 32 (41.0%) |
Occupancy by Educational Attainment in Jerseytown
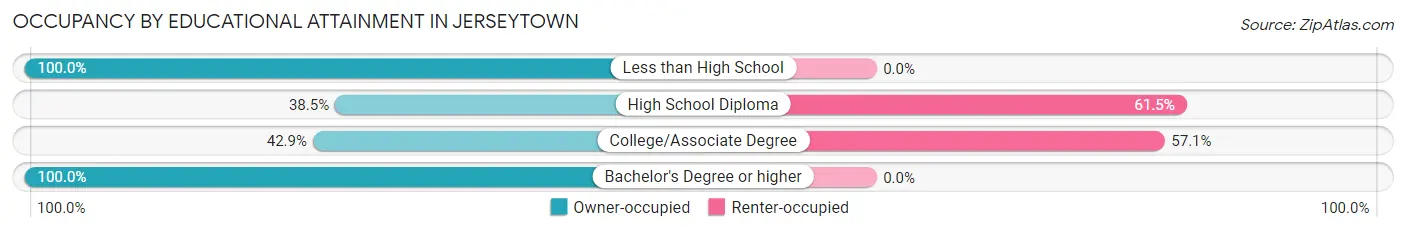
| Household Size | Owner-occupied | Renter-occupied |
| Less than High School | 10 (100.0%) | 0 (0.0%) |
| High School Diploma | 15 (38.5%) | 24 (61.5%) |
| College/Associate Degree | 6 (42.9%) | 8 (57.1%) |
| Bachelor's Degree or higher | 15 (100.0%) | 0 (0.0%) |
Occupancy by Age of Householder in Jerseytown
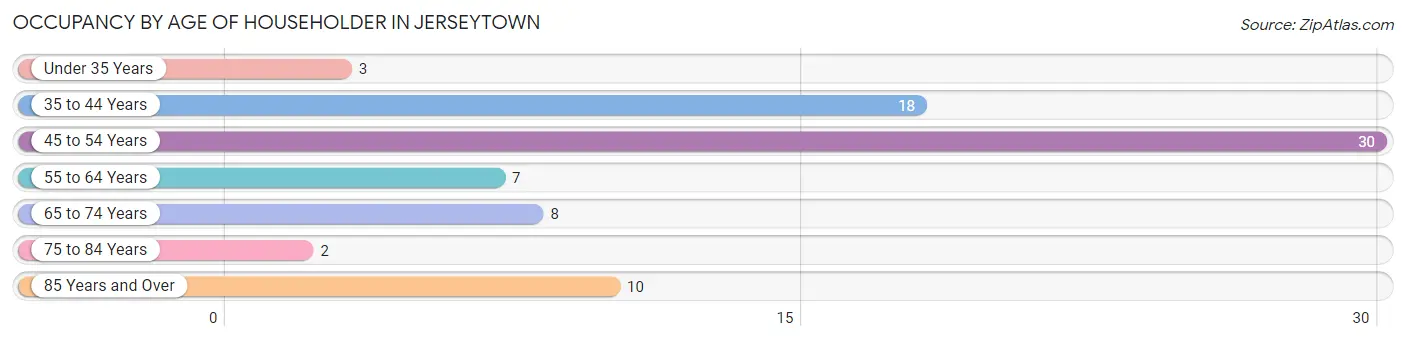
| Age Bracket | # Households | % Households |
| Under 35 Years | 3 | 3.8% |
| 35 to 44 Years | 18 | 23.1% |
| 45 to 54 Years | 30 | 38.5% |
| 55 to 64 Years | 7 | 9.0% |
| 65 to 74 Years | 8 | 10.3% |
| 75 to 84 Years | 2 | 2.6% |
| 85 Years and Over | 10 | 12.8% |
| Total | 78 | 100.0% |
Housing Finances in Jerseytown
Median Income by Occupancy in Jerseytown
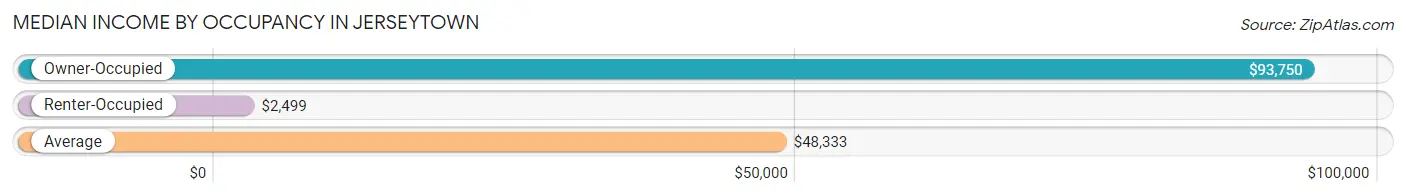
| Occupancy Type | # Households | Median Income |
| Owner-Occupied | 46 (59.0%) | $93,750 |
| Renter-Occupied | 32 (41.0%) | $2,499 |
| Average | 78 (100.0%) | $48,333 |
Occupancy by Householder Income Bracket in Jerseytown
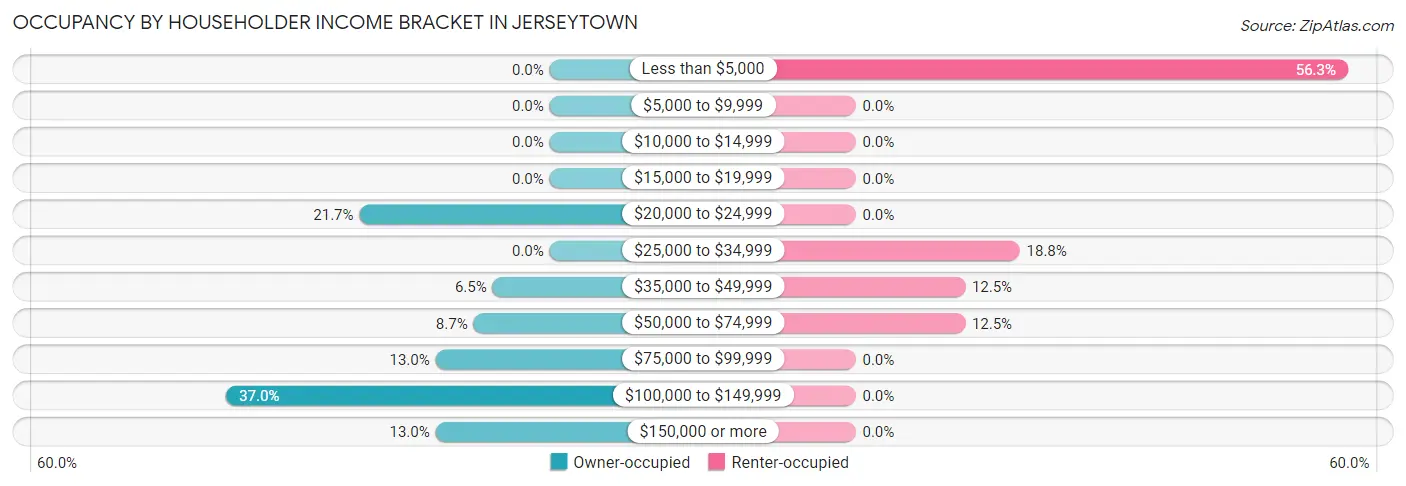
| Income Bracket | Owner-occupied | Renter-occupied |
| Less than $5,000 | 0 (0.0%) | 18 (56.2%) |
| $5,000 to $9,999 | 0 (0.0%) | 0 (0.0%) |
| $10,000 to $14,999 | 0 (0.0%) | 0 (0.0%) |
| $15,000 to $19,999 | 0 (0.0%) | 0 (0.0%) |
| $20,000 to $24,999 | 10 (21.7%) | 0 (0.0%) |
| $25,000 to $34,999 | 0 (0.0%) | 6 (18.8%) |
| $35,000 to $49,999 | 3 (6.5%) | 4 (12.5%) |
| $50,000 to $74,999 | 4 (8.7%) | 4 (12.5%) |
| $75,000 to $99,999 | 6 (13.0%) | 0 (0.0%) |
| $100,000 to $149,999 | 17 (37.0%) | 0 (0.0%) |
| $150,000 or more | 6 (13.0%) | 0 (0.0%) |
| Total | 46 (100.0%) | 32 (100.0%) |
Monthly Housing Cost Tiers in Jerseytown
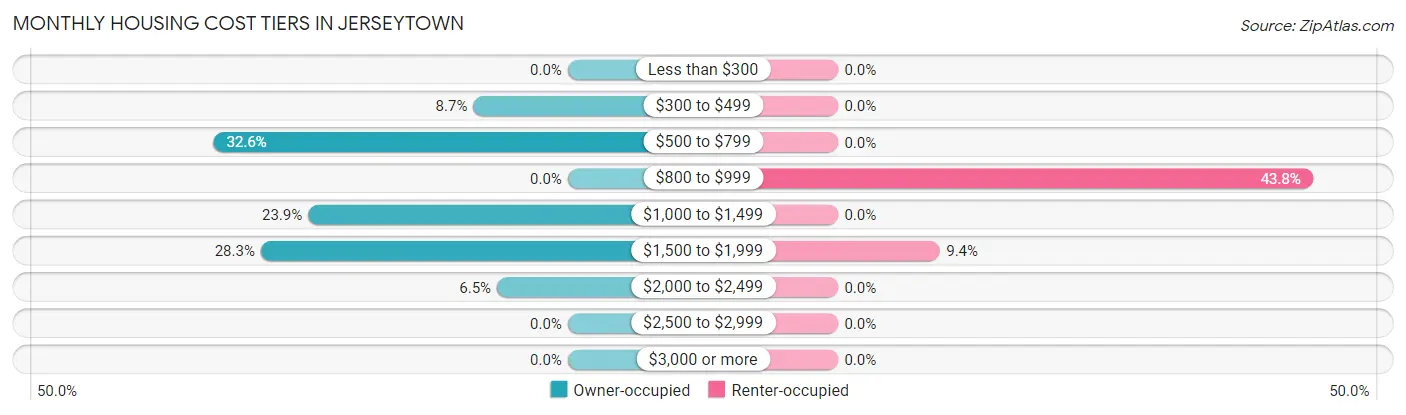
| Monthly Cost | Owner-occupied | Renter-occupied |
| Less than $300 | 0 (0.0%) | 0 (0.0%) |
| $300 to $499 | 4 (8.7%) | 0 (0.0%) |
| $500 to $799 | 15 (32.6%) | 0 (0.0%) |
| $800 to $999 | 0 (0.0%) | 14 (43.8%) |
| $1,000 to $1,499 | 11 (23.9%) | 0 (0.0%) |
| $1,500 to $1,999 | 13 (28.3%) | 3 (9.4%) |
| $2,000 to $2,499 | 3 (6.5%) | 0 (0.0%) |
| $2,500 to $2,999 | 0 (0.0%) | 0 (0.0%) |
| $3,000 or more | 0 (0.0%) | 0 (0.0%) |
| Total | 46 (100.0%) | 32 (100.0%) |
Physical Housing Characteristics in Jerseytown
Housing Structures in Jerseytown
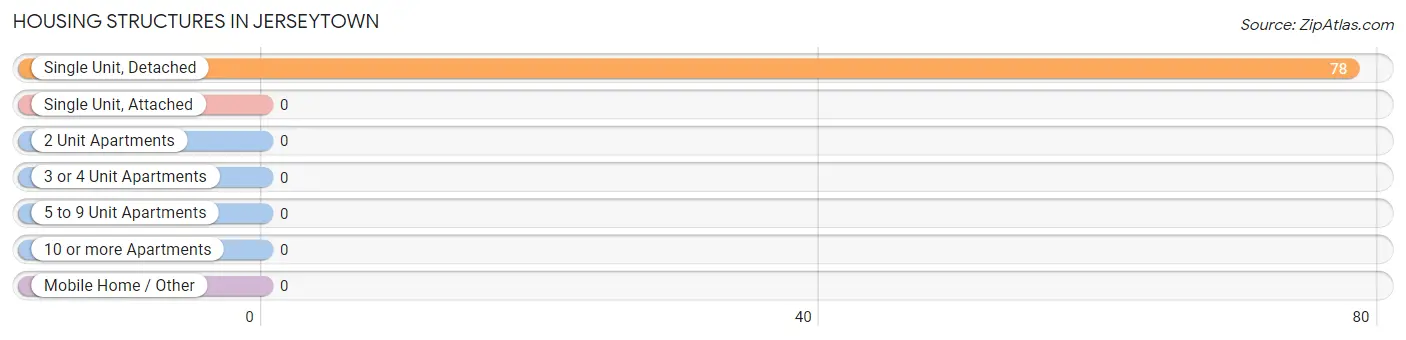
| Structure Type | # Housing Units | % Housing Units |
| Single Unit, Detached | 78 | 100.0% |
| Single Unit, Attached | 0 | 0.0% |
| 2 Unit Apartments | 0 | 0.0% |
| 3 or 4 Unit Apartments | 0 | 0.0% |
| 5 to 9 Unit Apartments | 0 | 0.0% |
| 10 or more Apartments | 0 | 0.0% |
| Mobile Home / Other | 0 | 0.0% |
| Total | 78 | 100.0% |
Housing Structures by Occupancy in Jerseytown
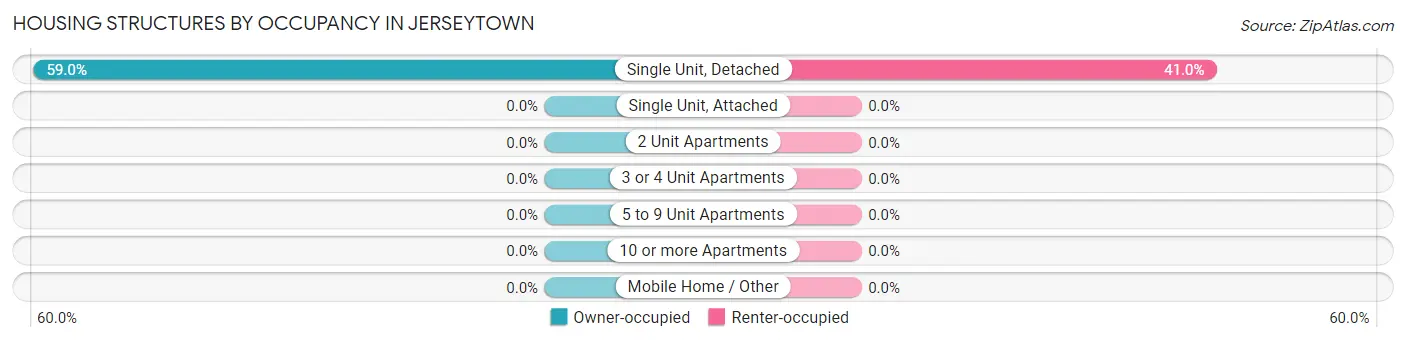
| Structure Type | Owner-occupied | Renter-occupied |
| Single Unit, Detached | 46 (59.0%) | 32 (41.0%) |
| Single Unit, Attached | 0 (0.0%) | 0 (0.0%) |
| 2 Unit Apartments | 0 (0.0%) | 0 (0.0%) |
| 3 or 4 Unit Apartments | 0 (0.0%) | 0 (0.0%) |
| 5 to 9 Unit Apartments | 0 (0.0%) | 0 (0.0%) |
| 10 or more Apartments | 0 (0.0%) | 0 (0.0%) |
| Mobile Home / Other | 0 (0.0%) | 0 (0.0%) |
| Total | 46 (59.0%) | 32 (41.0%) |
Housing Structures by Number of Rooms in Jerseytown
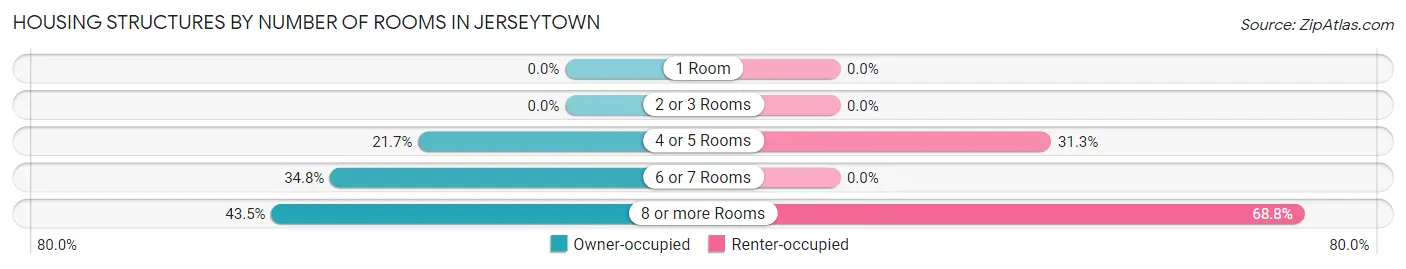
| Number of Rooms | Owner-occupied | Renter-occupied |
| 1 Room | 0 (0.0%) | 0 (0.0%) |
| 2 or 3 Rooms | 0 (0.0%) | 0 (0.0%) |
| 4 or 5 Rooms | 10 (21.7%) | 10 (31.2%) |
| 6 or 7 Rooms | 16 (34.8%) | 0 (0.0%) |
| 8 or more Rooms | 20 (43.5%) | 22 (68.8%) |
| Total | 46 (100.0%) | 32 (100.0%) |
Housing Structure by Heating Type in Jerseytown
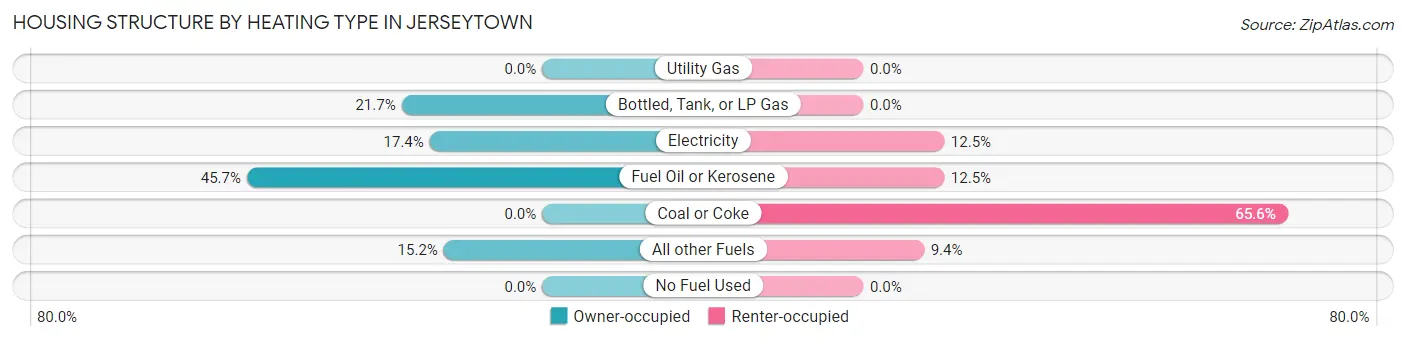
| Heating Type | Owner-occupied | Renter-occupied |
| Utility Gas | 0 (0.0%) | 0 (0.0%) |
| Bottled, Tank, or LP Gas | 10 (21.7%) | 0 (0.0%) |
| Electricity | 8 (17.4%) | 4 (12.5%) |
| Fuel Oil or Kerosene | 21 (45.7%) | 4 (12.5%) |
| Coal or Coke | 0 (0.0%) | 21 (65.6%) |
| All other Fuels | 7 (15.2%) | 3 (9.4%) |
| No Fuel Used | 0 (0.0%) | 0 (0.0%) |
| Total | 46 (100.0%) | 32 (100.0%) |
Household Vehicle Usage in Jerseytown
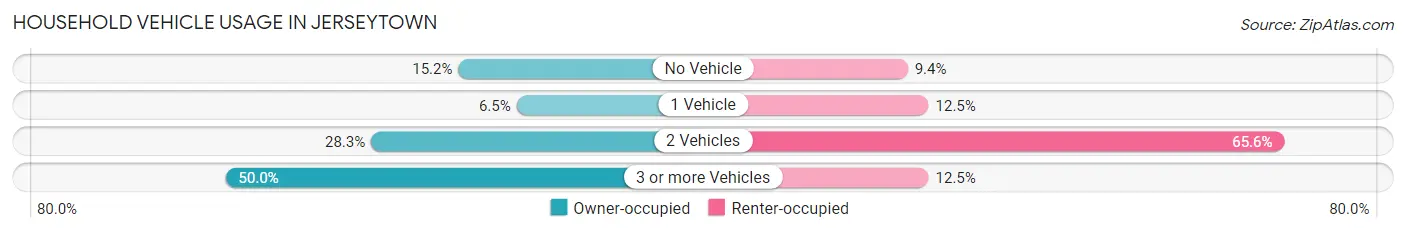
| Vehicles per Household | Owner-occupied | Renter-occupied |
| No Vehicle | 7 (15.2%) | 3 (9.4%) |
| 1 Vehicle | 3 (6.5%) | 4 (12.5%) |
| 2 Vehicles | 13 (28.3%) | 21 (65.6%) |
| 3 or more Vehicles | 23 (50.0%) | 4 (12.5%) |
| Total | 46 (100.0%) | 32 (100.0%) |
Real Estate & Mortgages in Jerseytown
Real Estate and Mortgage Overview in Jerseytown
| Characteristic | Without Mortgage | With Mortgage |
| Housing Units | 25 | 21 |
| Median Property Value | $168,800 | $168,800 |
| Median Household Income | $54,583 | $3 |
| Monthly Housing Costs | $707 | $0 |
| Real Estate Taxes | $3,050 | $2 |
Property Value by Mortgage Status in Jerseytown
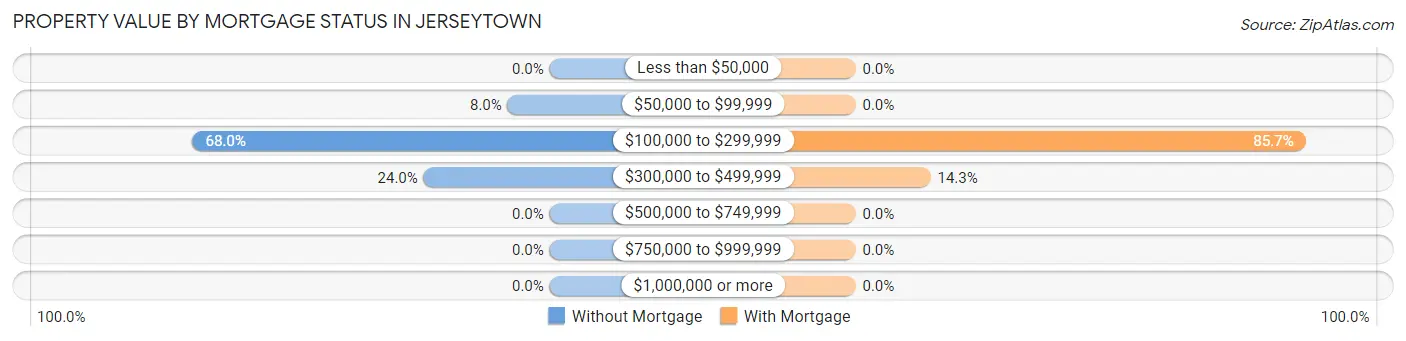
| Property Value | Without Mortgage | With Mortgage |
| Less than $50,000 | 0 (0.0%) | 0 (0.0%) |
| $50,000 to $99,999 | 2 (8.0%) | 0 (0.0%) |
| $100,000 to $299,999 | 17 (68.0%) | 18 (85.7%) |
| $300,000 to $499,999 | 6 (24.0%) | 3 (14.3%) |
| $500,000 to $749,999 | 0 (0.0%) | 0 (0.0%) |
| $750,000 to $999,999 | 0 (0.0%) | 0 (0.0%) |
| $1,000,000 or more | 0 (0.0%) | 0 (0.0%) |
| Total | 25 (100.0%) | 21 (100.0%) |
Household Income by Mortgage Status in Jerseytown
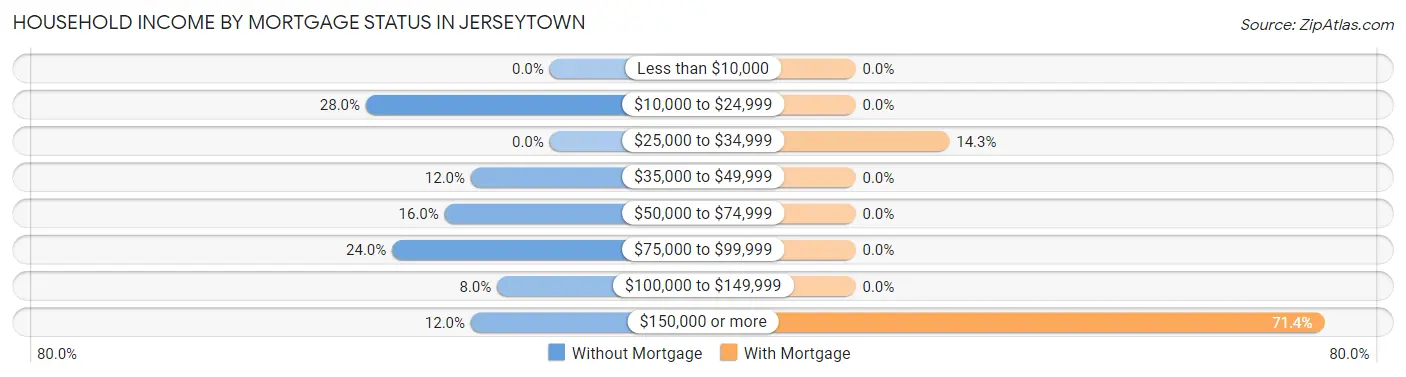
| Household Income | Without Mortgage | With Mortgage |
| Less than $10,000 | 0 (0.0%) | 0 (0.0%) |
| $10,000 to $24,999 | 7 (28.0%) | 0 (0.0%) |
| $25,000 to $34,999 | 0 (0.0%) | 3 (14.3%) |
| $35,000 to $49,999 | 3 (12.0%) | 0 (0.0%) |
| $50,000 to $74,999 | 4 (16.0%) | 0 (0.0%) |
| $75,000 to $99,999 | 6 (24.0%) | 0 (0.0%) |
| $100,000 to $149,999 | 2 (8.0%) | 0 (0.0%) |
| $150,000 or more | 3 (12.0%) | 15 (71.4%) |
| Total | 25 (100.0%) | 21 (100.0%) |
Property Value to Household Income Ratio in Jerseytown
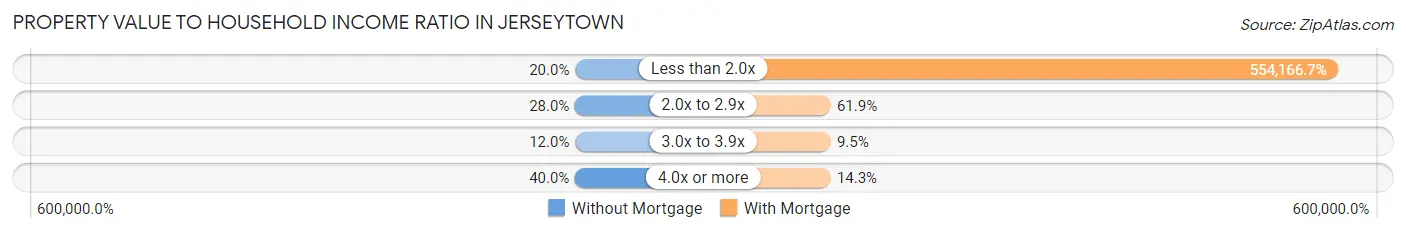
| Value-to-Income Ratio | Without Mortgage | With Mortgage |
| Less than 2.0x | 5 (20.0%) | 116,375 (554,166.7%) |
| 2.0x to 2.9x | 7 (28.0%) | 13 (61.9%) |
| 3.0x to 3.9x | 3 (12.0%) | 2 (9.5%) |
| 4.0x or more | 10 (40.0%) | 3 (14.3%) |
| Total | 25 (100.0%) | 21 (100.0%) |
Real Estate Taxes by Mortgage Status in Jerseytown
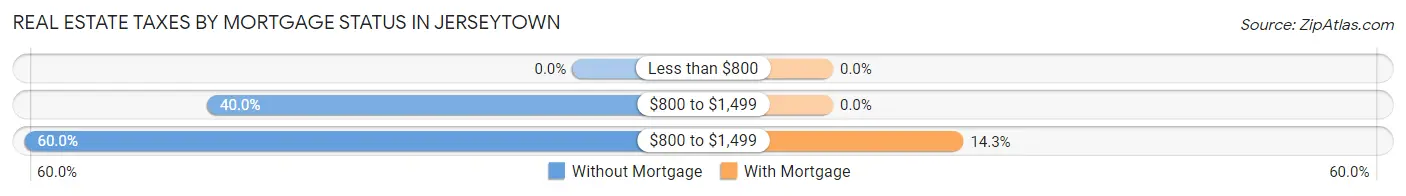
| Property Taxes | Without Mortgage | With Mortgage |
| Less than $800 | 0 (0.0%) | 0 (0.0%) |
| $800 to $1,499 | 10 (40.0%) | 0 (0.0%) |
| $800 to $1,499 | 15 (60.0%) | 3 (14.3%) |
| Total | 25 (100.0%) | 21 (100.0%) |
Health & Disability in Jerseytown
Health Insurance Coverage by Age in Jerseytown
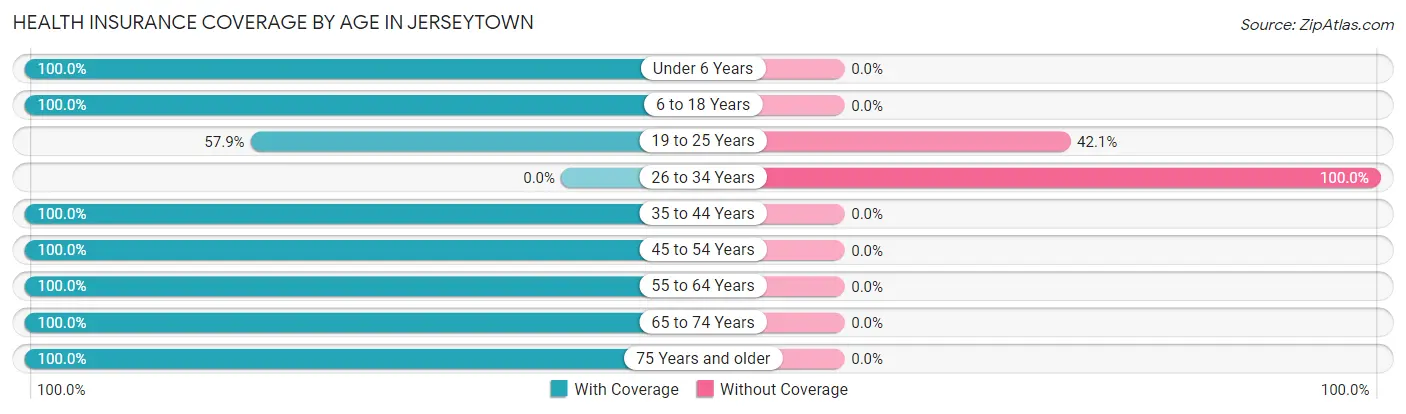
| Age Bracket | With Coverage | Without Coverage |
| Under 6 Years | 4 (100.0%) | 0 (0.0%) |
| 6 to 18 Years | 33 (100.0%) | 0 (0.0%) |
| 19 to 25 Years | 11 (57.9%) | 8 (42.1%) |
| 26 to 34 Years | 0 (0.0%) | 10 (100.0%) |
| 35 to 44 Years | 18 (100.0%) | 0 (0.0%) |
| 45 to 54 Years | 50 (100.0%) | 0 (0.0%) |
| 55 to 64 Years | 10 (100.0%) | 0 (0.0%) |
| 65 to 74 Years | 10 (100.0%) | 0 (0.0%) |
| 75 Years and older | 15 (100.0%) | 0 (0.0%) |
| Total | 151 (89.3%) | 18 (10.6%) |
Health Insurance Coverage by Citizenship Status in Jerseytown
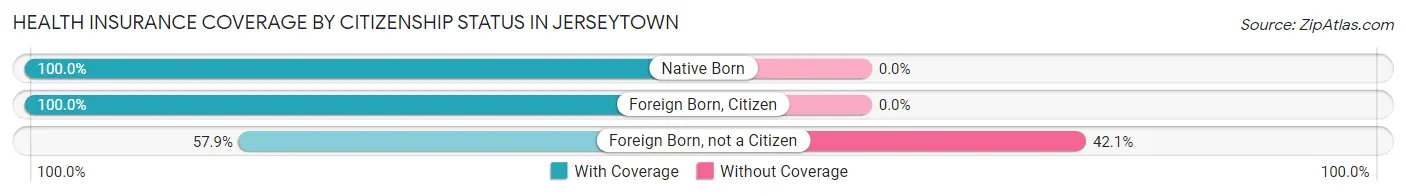
| Citizenship Status | With Coverage | Without Coverage |
| Native Born | 4 (100.0%) | 0 (0.0%) |
| Foreign Born, Citizen | 33 (100.0%) | 0 (0.0%) |
| Foreign Born, not a Citizen | 11 (57.9%) | 8 (42.1%) |
Health Insurance Coverage by Household Income in Jerseytown
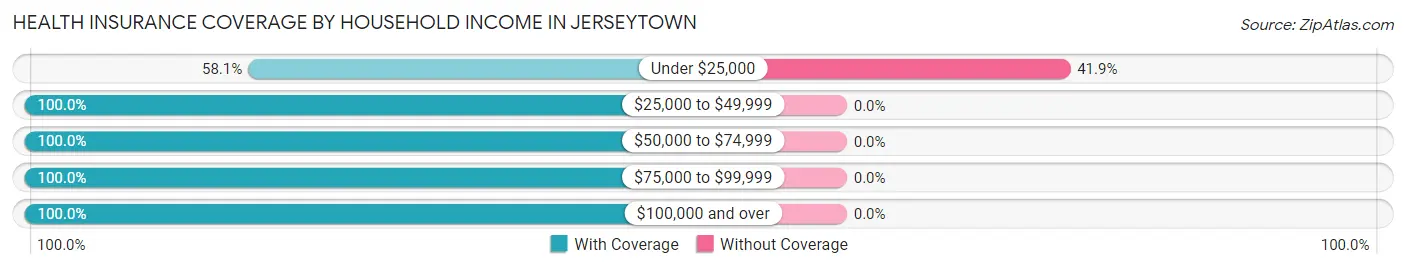
| Household Income | With Coverage | Without Coverage |
| Under $25,000 | 25 (58.1%) | 18 (41.9%) |
| $25,000 to $49,999 | 13 (100.0%) | 0 (0.0%) |
| $50,000 to $74,999 | 14 (100.0%) | 0 (0.0%) |
| $75,000 to $99,999 | 40 (100.0%) | 0 (0.0%) |
| $100,000 and over | 59 (100.0%) | 0 (0.0%) |
Public vs Private Health Insurance Coverage by Age in Jerseytown
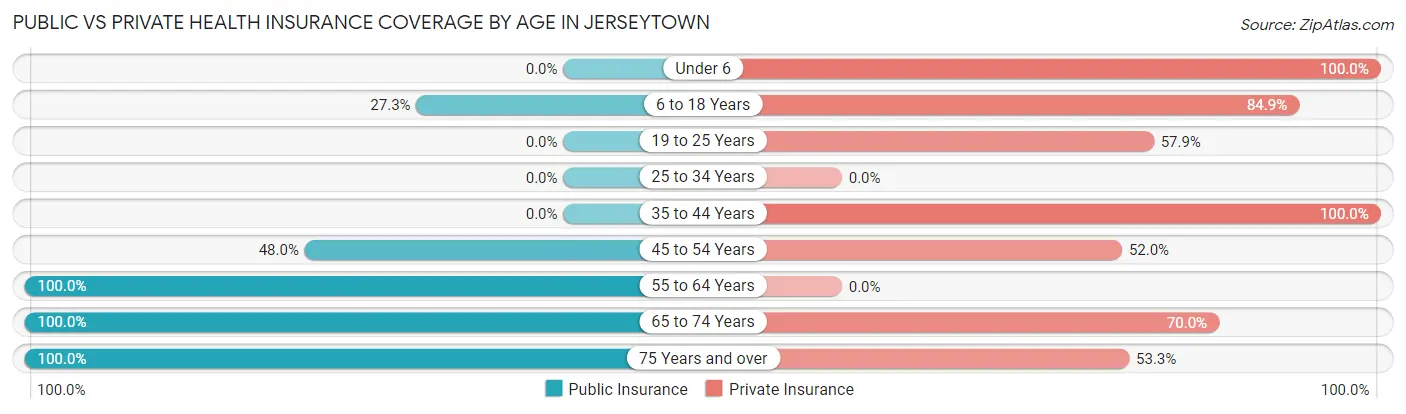
| Age Bracket | Public Insurance | Private Insurance |
| Under 6 | 0 (0.0%) | 4 (100.0%) |
| 6 to 18 Years | 9 (27.3%) | 28 (84.9%) |
| 19 to 25 Years | 0 (0.0%) | 11 (57.9%) |
| 25 to 34 Years | 0 (0.0%) | 0 (0.0%) |
| 35 to 44 Years | 0 (0.0%) | 18 (100.0%) |
| 45 to 54 Years | 24 (48.0%) | 26 (52.0%) |
| 55 to 64 Years | 10 (100.0%) | 0 (0.0%) |
| 65 to 74 Years | 10 (100.0%) | 7 (70.0%) |
| 75 Years and over | 15 (100.0%) | 8 (53.3%) |
| Total | 68 (40.2%) | 102 (60.4%) |
Disability Status by Sex by Age in Jerseytown
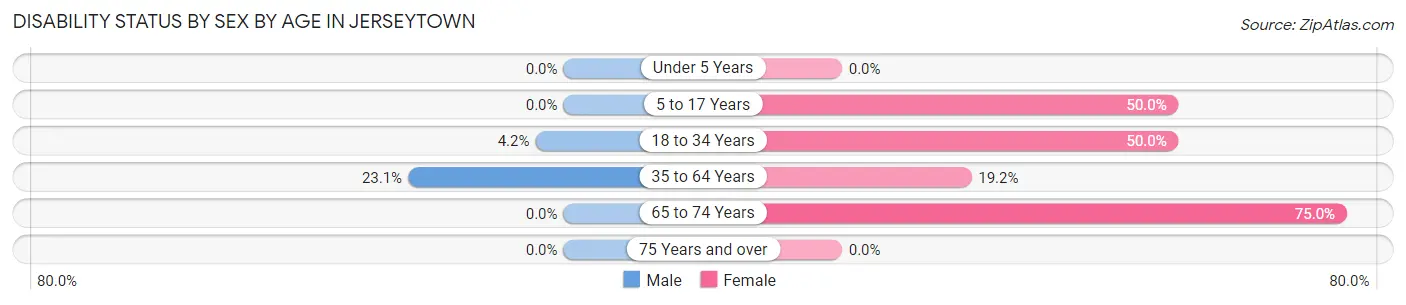
| Age Bracket | Male | Female |
| Under 5 Years | 0 (0.0%) | 0 (0.0%) |
| 5 to 17 Years | 0 (0.0%) | 7 (50.0%) |
| 18 to 34 Years | 1 (4.2%) | 5 (50.0%) |
| 35 to 64 Years | 12 (23.1%) | 5 (19.2%) |
| 65 to 74 Years | 0 (0.0%) | 6 (75.0%) |
| 75 Years and over | 0 (0.0%) | 0 (0.0%) |
Disability Class by Sex by Age in Jerseytown
Disability Class: Hearing Difficulty
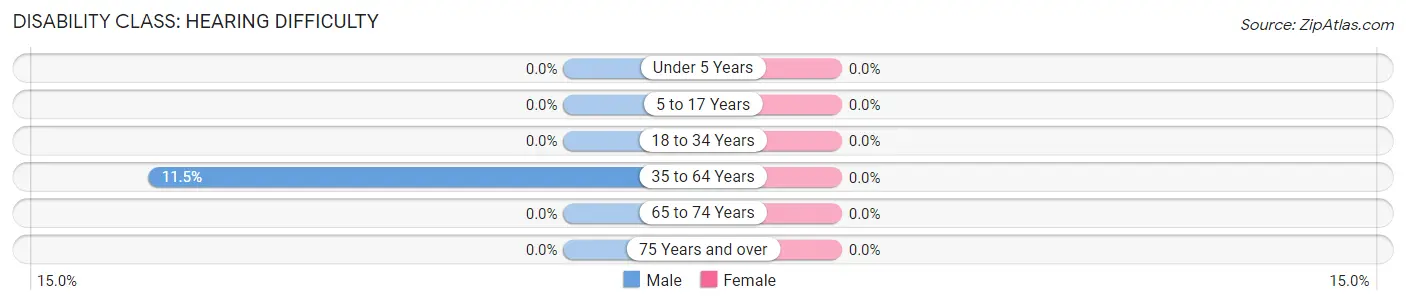
| Age Bracket | Male | Female |
| Under 5 Years | 0 (0.0%) | 0 (0.0%) |
| 5 to 17 Years | 0 (0.0%) | 0 (0.0%) |
| 18 to 34 Years | 0 (0.0%) | 0 (0.0%) |
| 35 to 64 Years | 6 (11.5%) | 0 (0.0%) |
| 65 to 74 Years | 0 (0.0%) | 0 (0.0%) |
| 75 Years and over | 0 (0.0%) | 0 (0.0%) |
Disability Class: Vision Difficulty
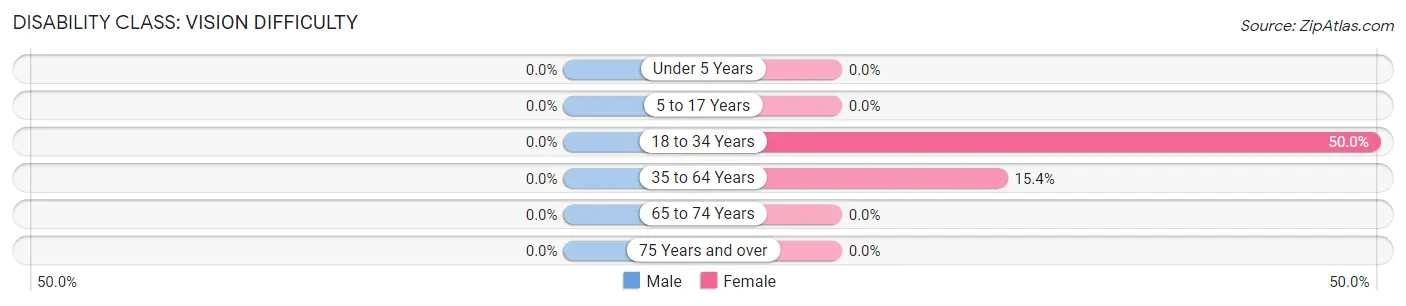
| Age Bracket | Male | Female |
| Under 5 Years | 0 (0.0%) | 0 (0.0%) |
| 5 to 17 Years | 0 (0.0%) | 0 (0.0%) |
| 18 to 34 Years | 0 (0.0%) | 5 (50.0%) |
| 35 to 64 Years | 0 (0.0%) | 4 (15.4%) |
| 65 to 74 Years | 0 (0.0%) | 0 (0.0%) |
| 75 Years and over | 0 (0.0%) | 0 (0.0%) |
Disability Class: Cognitive Difficulty
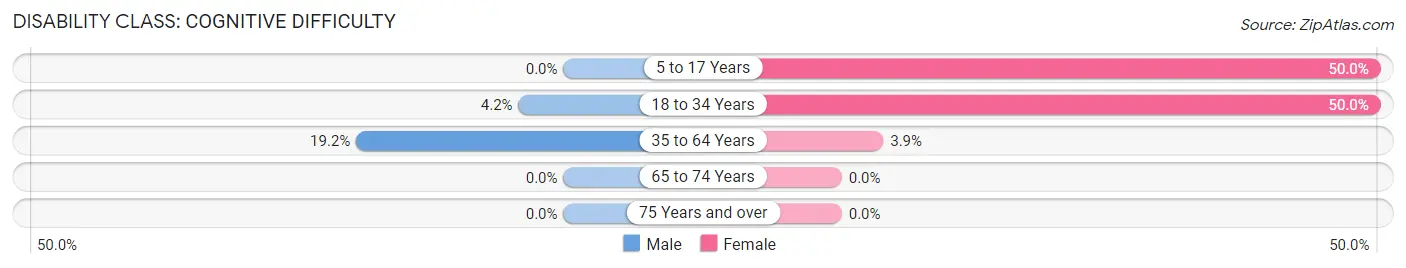
| Age Bracket | Male | Female |
| 5 to 17 Years | 0 (0.0%) | 7 (50.0%) |
| 18 to 34 Years | 1 (4.2%) | 5 (50.0%) |
| 35 to 64 Years | 10 (19.2%) | 1 (3.8%) |
| 65 to 74 Years | 0 (0.0%) | 0 (0.0%) |
| 75 Years and over | 0 (0.0%) | 0 (0.0%) |
Disability Class: Ambulatory Difficulty
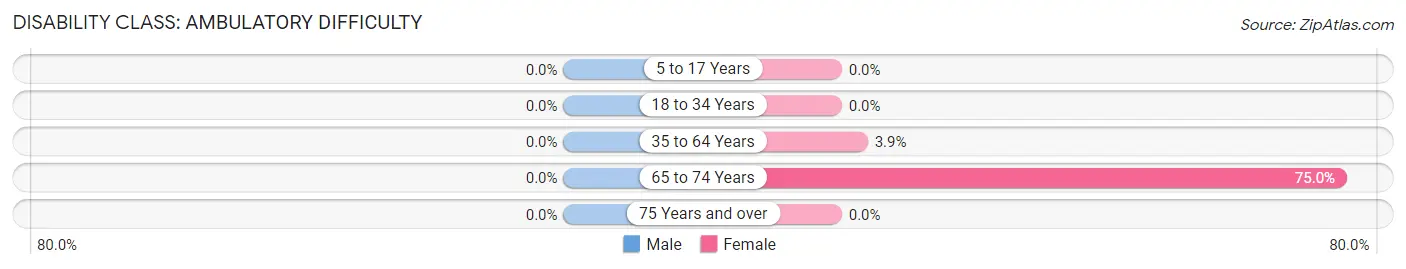
| Age Bracket | Male | Female |
| 5 to 17 Years | 0 (0.0%) | 0 (0.0%) |
| 18 to 34 Years | 0 (0.0%) | 0 (0.0%) |
| 35 to 64 Years | 0 (0.0%) | 1 (3.8%) |
| 65 to 74 Years | 0 (0.0%) | 6 (75.0%) |
| 75 Years and over | 0 (0.0%) | 0 (0.0%) |
Disability Class: Self-Care Difficulty
| Age Bracket | Male | Female |
| 5 to 17 Years | 0 (0.0%) | 0 (0.0%) |
| 18 to 34 Years | 0 (0.0%) | 0 (0.0%) |
| 35 to 64 Years | 0 (0.0%) | 0 (0.0%) |
| 65 to 74 Years | 0 (0.0%) | 0 (0.0%) |
| 75 Years and over | 0 (0.0%) | 0 (0.0%) |
Technology Access in Jerseytown
Computing Device Access in Jerseytown
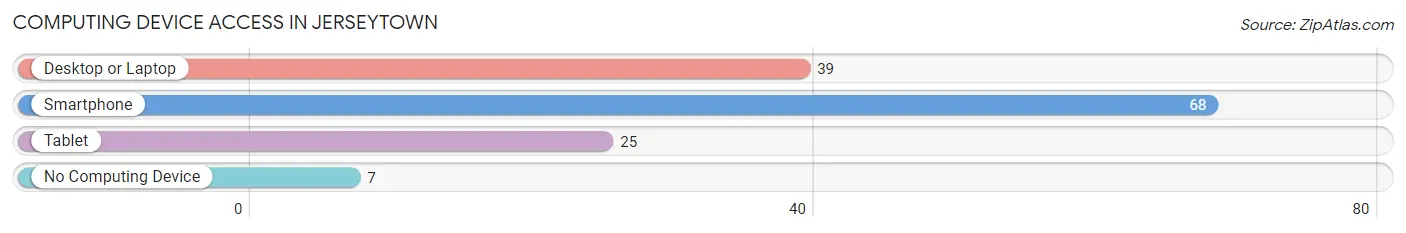
| Device Type | # Households | % Households |
| Desktop or Laptop | 39 | 50.0% |
| Smartphone | 68 | 87.2% |
| Tablet | 25 | 32.1% |
| No Computing Device | 7 | 9.0% |
| Total | 78 | 100.0% |
Internet Access in Jerseytown
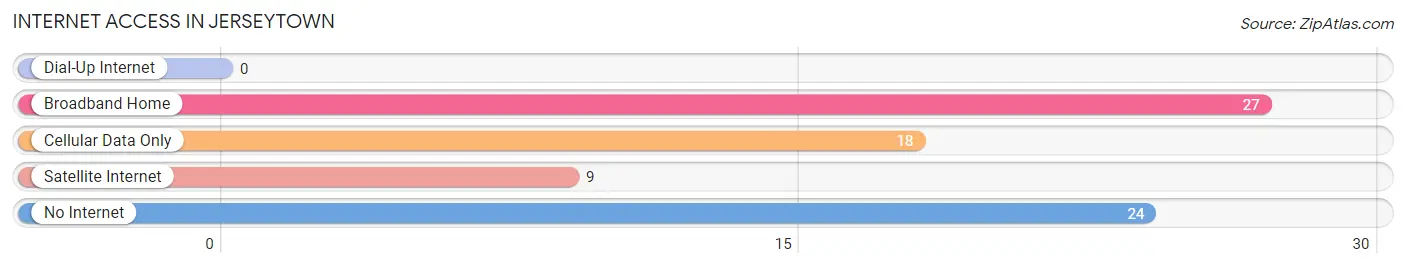
| Internet Type | # Households | % Households |
| Dial-Up Internet | 0 | 0.0% |
| Broadband Home | 27 | 34.6% |
| Cellular Data Only | 18 | 23.1% |
| Satellite Internet | 9 | 11.5% |
| No Internet | 24 | 30.8% |
| Total | 78 | 100.0% |
Jerseytown Summary
Jerseytown is a small borough located in Schuylkill County, Pennsylvania. It is situated in the southern part of the county, approximately 8 miles south of Pottsville and about 20 miles northwest of Reading. The population of Jerseytown was 1,093 at the 2010 census.
History
The area that is now Jerseytown was first settled in the late 1700s by German immigrants. The town was originally known as “Jersey” after the Jersey family who owned much of the land in the area. In 1845, the town was officially incorporated as “Jerseytown”.
During the 19th century, Jerseytown was a thriving coal mining town. The coal industry was the main source of employment for the town’s residents. The town also had several stores, a post office, a hotel, and a school.
In the early 20th century, the coal industry began to decline and many of the town’s residents moved away in search of work. The population of Jerseytown decreased from 1,500 in 1900 to just over 1,000 in 1950.
Geography
Jerseytown is located in southern Schuylkill County at 40°41'17" North, 76°14'45" West (40.6879, -76.2458). It is situated in the southern part of the county, approximately 8 miles south of Pottsville and about 20 miles northwest of Reading.
The borough is located in the Appalachian Mountains and is surrounded by rolling hills and forests. The town is situated along the Little Schuylkill River, which flows through the center of town.
Economy
The economy of Jerseytown is largely based on agriculture and tourism. The town is home to several farms, which produce a variety of crops, including corn, soybeans, and hay.
The town is also a popular tourist destination, as it is located near several state parks and recreational areas. The town is home to several bed and breakfasts, as well as a few restaurants and shops.
Demographics
As of the 2010 census, there were 1,093 people, 441 households, and 298 families residing in the borough. The population density was 1,093 people per square mile (421.3/km2). There were 441 housing units at an average density of 441 per square mile (170.3/km2).
The racial makeup of the borough was 97.7% White, 0.7% African American, 0.2% Native American, 0.2% Asian, 0.1% from other races, and 1.1% from two or more races. Hispanic or Latino of any race were 0.7% of the population.
There were 441 households, out of which 28.2% had children under the age of 18 living with them, 51.6% were married couples living together, 10.2% had a female householder with no husband present, and 33.2% were non-families. 28.2% of all households were made up of individuals, and 14.3% had someone living alone who was 65 years of age or older. The average household size was 2.47 and the average family size was 3.03.
In the borough, the population was spread out, with 24.2% under the age of 18, 7.2% from 18 to 24, 27.2% from 25 to 44, 24.2% from 45 to 64, and 17.2% who were 65 years of age or older. The median age was 39 years. For every 100 females, there were 92.2 males. For every 100 females age 18 and over, there were 88.2 males.
The median income for a household in the borough was $35,000, and the median income for a family was $41,250. Males had a median income of $30,000 versus $21,250 for females. The per capita income for the borough was $17,845. About 8.2% of families and 10.2% of the population were below the poverty line, including 14.3% of those under age 18 and 8.2% of those age 65 or over.
Common Questions
What is Per Capita Income in Jerseytown?
Per Capita income in Jerseytown is $28,009.
What is the Median Family Income in Jerseytown?
Median Family Income in Jerseytown is $111,250.
What is the Median Household income in Jerseytown?
Median Household Income in Jerseytown is $48,333.
What is Income or Wage Gap in Jerseytown?
Income or Wage Gap in Jerseytown is 32.1%.
Women in Jerseytown earn 67.9 cents for every dollar earned by a man.
What is Inequality or Gini Index in Jerseytown?
Inequality or Gini Index in Jerseytown is 0.50.
What is the Total Population of Jerseytown?
Total Population of Jerseytown is 169.
What is the Total Male Population of Jerseytown?
Total Male Population of Jerseytown is 102.
What is the Total Female Population of Jerseytown?
Total Female Population of Jerseytown is 67.
What is the Ratio of Males per 100 Females in Jerseytown?
There are 152.24 Males per 100 Females in Jerseytown.
What is the Ratio of Females per 100 Males in Jerseytown?
There are 65.69 Females per 100 Males in Jerseytown.
What is the Median Population Age in Jerseytown?
Median Population Age in Jerseytown is 46.0 Years.
What is the Average Family Size in Jerseytown
Average Family Size in Jerseytown is 3.2 People.
What is the Average Household Size in Jerseytown
Average Household Size in Jerseytown is 2.2 People.
How Large is the Labor Force in Jerseytown?
There are 86 People in the Labor Forcein in Jerseytown.
What is the Percentage of People in the Labor Force in Jerseytown?
57.0% of People are in the Labor Force in Jerseytown.
What is the Unemployment Rate in Jerseytown?
Unemployment Rate in Jerseytown is 14.0%.