Zip Codes with the Highest Percentage of Population Employed in Installation, Maintenance & Repair in Scranton, PA
RELATED REPORTS & OPTIONS
Installation, Maintenance & Repair
Scranton
Compare Zip Codes
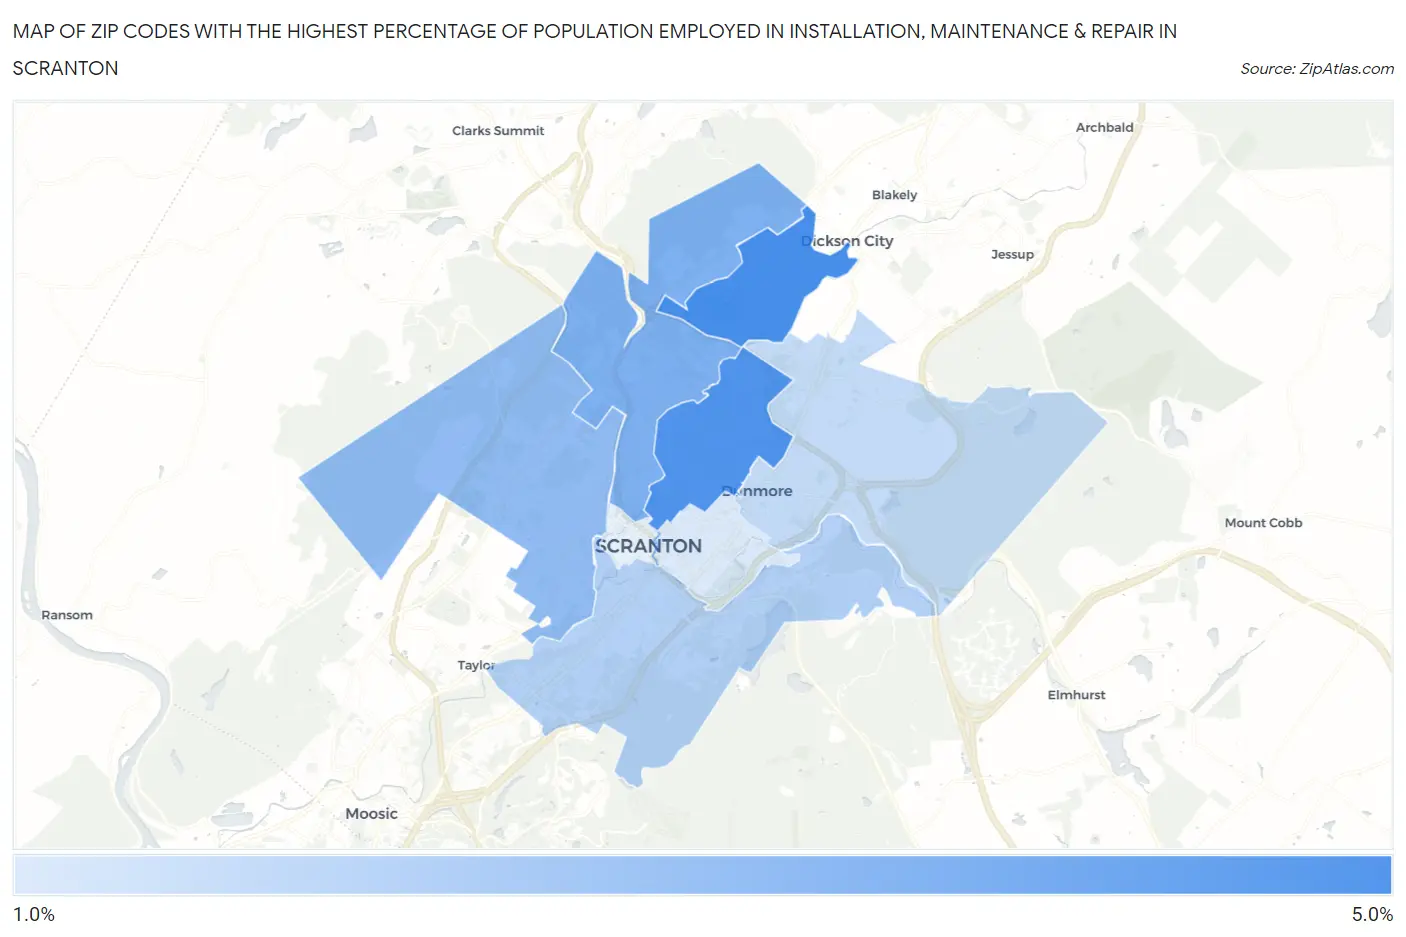
Map of Zip Codes with the Highest Percentage of Population Employed in Installation, Maintenance & Repair in Scranton
1.5%
4.9%
Zip Codes with the Highest Percentage of Population Employed in Installation, Maintenance & Repair in Scranton, PA
| Zip Code | % Employed | vs State | vs National | |
| 1. | 18519 | 4.9% | 3.1%(+1.78)#526 | 3.1%(+1.81)#9,130 |
| 2. | 18509 | 4.6% | 3.1%(+1.55)#576 | 3.1%(+1.58)#9,879 |
| 3. | 18508 | 3.6% | 3.1%(+0.546)#838 | 3.1%(+0.571)#13,988 |
| 4. | 18504 | 3.2% | 3.1%(+0.147)#942 | 3.1%(+0.171)#15,840 |
| 5. | 18505 | 2.5% | 3.1%(-0.617)#1,118 | 3.1%(-0.592)#19,663 |
| 6. | 18512 | 2.1% | 3.1%(-0.970)#1,201 | 3.1%(-0.945)#21,433 |
| 7. | 18510 | 1.5% | 3.1%(-1.54)#1,312 | 3.1%(-1.52)#23,972 |
1
Common Questions
What are the Top 5 Zip Codes with the Highest Percentage of Population Employed in Installation, Maintenance & Repair in Scranton, PA?
Top 5 Zip Codes with the Highest Percentage of Population Employed in Installation, Maintenance & Repair in Scranton, PA are:
What zip code has the Highest Percentage of Population Employed in Installation, Maintenance & Repair in Scranton, PA?
18519 has the Highest Percentage of Population Employed in Installation, Maintenance & Repair in Scranton, PA with 4.9%.
What is the Percentage of Population Employed in Installation, Maintenance & Repair in Scranton, PA?
Percentage of Population Employed in Installation, Maintenance & Repair in Scranton is 3.1%.
What is the Percentage of Population Employed in Installation, Maintenance & Repair in Pennsylvania?
Percentage of Population Employed in Installation, Maintenance & Repair in Pennsylvania is 3.1%.
What is the Percentage of Population Employed in Installation, Maintenance & Repair in the United States?
Percentage of Population Employed in Installation, Maintenance & Repair in the United States is 3.1%.