New Salem borough, PA Map & Demographics
New Salem borough Overview
$45,332
PER CAPITA INCOME
$98,235
AVG FAMILY INCOME
$99,549
AVG HOUSEHOLD INCOME
36.1%
WAGE / INCOME GAP [ % ]
63.9¢/ $1
WAGE / INCOME GAP [ $ ]
0.35
INEQUALITY / GINI INDEX
991
TOTAL POPULATION
467
MALE POPULATION
524
FEMALE POPULATION
89.12
MALES / 100 FEMALES
112.21
FEMALES / 100 MALES
37.8
MEDIAN AGE
2.8
AVG FAMILY SIZE
2.6
AVG HOUSEHOLD SIZE
584
LABOR FORCE [ PEOPLE ]
75.4%
PERCENT IN LABOR FORCE
3.6%
UNEMPLOYMENT RATE
New Salem borough Area Codes
Income in New Salem borough
Income Overview in New Salem borough
Per Capita Income in New Salem borough is $45,332, while median incomes of families and households are $98,235 and $99,549 respectively.
| Characteristic | Number | Measure |
| Per Capita Income | 991 | $45,332 |
| Median Family Income | 292 | $98,235 |
| Mean Family Income | 292 | $105,774 |
| Median Household Income | 375 | $99,549 |
| Mean Household Income | 375 | $120,979 |
| Income Deficit | 292 | $0 |
| Wage / Income Gap (%) | 991 | 36.09% |
| Wage / Income Gap ($) | 991 | 63.91¢ per $1 |
| Gini / Inequality Index | 991 | 0.35 |
Earnings by Sex in New Salem borough
Average Earnings in New Salem borough are $49,293, $60,948 for men and $38,949 for women, a difference of 36.1%.
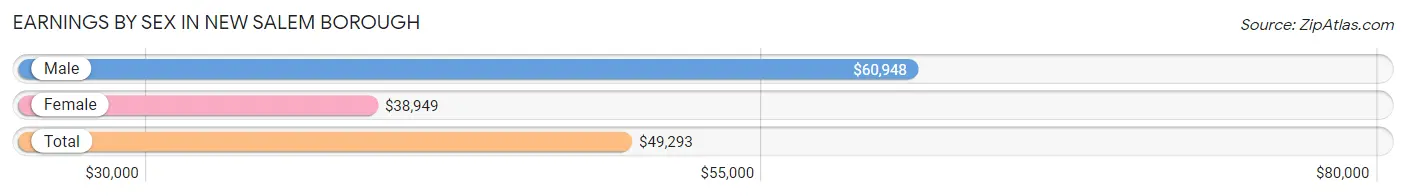
| Sex | Number | Average Earnings |
| Male | 296 (48.9%) | $60,948 |
| Female | 309 (51.1%) | $38,949 |
| Total | 605 (100.0%) | $49,293 |
Earnings by Sex by Income Bracket in New Salem borough
The most common earnings brackets in New Salem borough are $55,000 to $64,999 for men (52 | 17.6%) and $35,000 to $39,999 for women (48 | 15.5%).
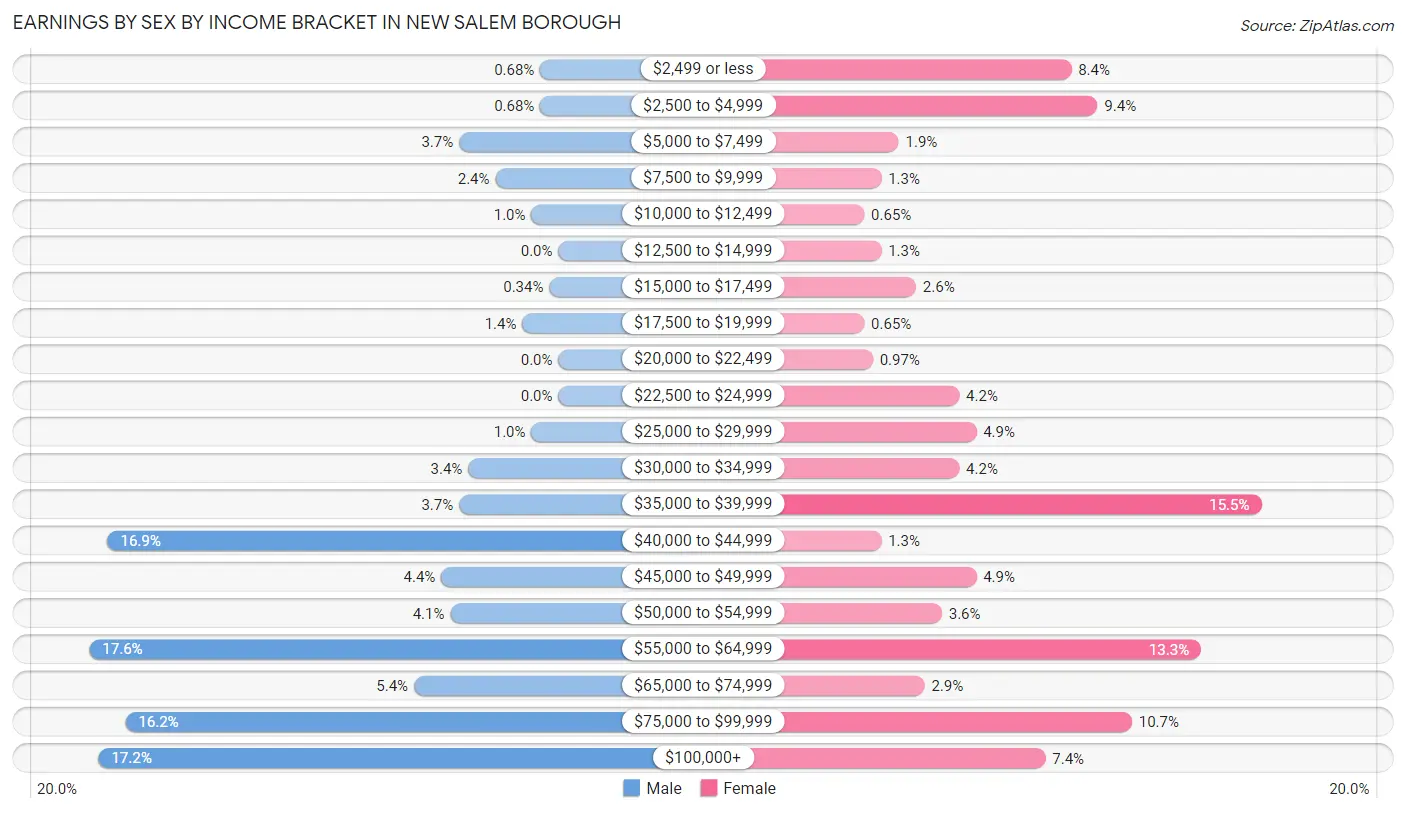
| Income | Male | Female |
| $2,499 or less | 2 (0.7%) | 26 (8.4%) |
| $2,500 to $4,999 | 2 (0.7%) | 29 (9.4%) |
| $5,000 to $7,499 | 11 (3.7%) | 6 (1.9%) |
| $7,500 to $9,999 | 7 (2.4%) | 4 (1.3%) |
| $10,000 to $12,499 | 3 (1.0%) | 2 (0.6%) |
| $12,500 to $14,999 | 0 (0.0%) | 4 (1.3%) |
| $15,000 to $17,499 | 1 (0.3%) | 8 (2.6%) |
| $17,500 to $19,999 | 4 (1.3%) | 2 (0.6%) |
| $20,000 to $22,499 | 0 (0.0%) | 3 (1.0%) |
| $22,500 to $24,999 | 0 (0.0%) | 13 (4.2%) |
| $25,000 to $29,999 | 3 (1.0%) | 15 (4.9%) |
| $30,000 to $34,999 | 10 (3.4%) | 13 (4.2%) |
| $35,000 to $39,999 | 11 (3.7%) | 48 (15.5%) |
| $40,000 to $44,999 | 50 (16.9%) | 4 (1.3%) |
| $45,000 to $49,999 | 13 (4.4%) | 15 (4.9%) |
| $50,000 to $54,999 | 12 (4.1%) | 11 (3.6%) |
| $55,000 to $64,999 | 52 (17.6%) | 41 (13.3%) |
| $65,000 to $74,999 | 16 (5.4%) | 9 (2.9%) |
| $75,000 to $99,999 | 48 (16.2%) | 33 (10.7%) |
| $100,000+ | 51 (17.2%) | 23 (7.4%) |
| Total | 296 (100.0%) | 309 (100.0%) |
Earnings by Sex by Educational Attainment in New Salem borough
Average earnings in New Salem borough are $62,069 for men and $39,545 for women, a difference of 36.3%. Men with an educational attainment of graduate degree enjoy the highest average annual earnings of $107,917, while those with high school diploma education earn the least with $47,917. Women with an educational attainment of graduate degree earn the most with the average annual earnings of $156,250, while those with college or associate's degree education have the smallest earnings of $37,632.
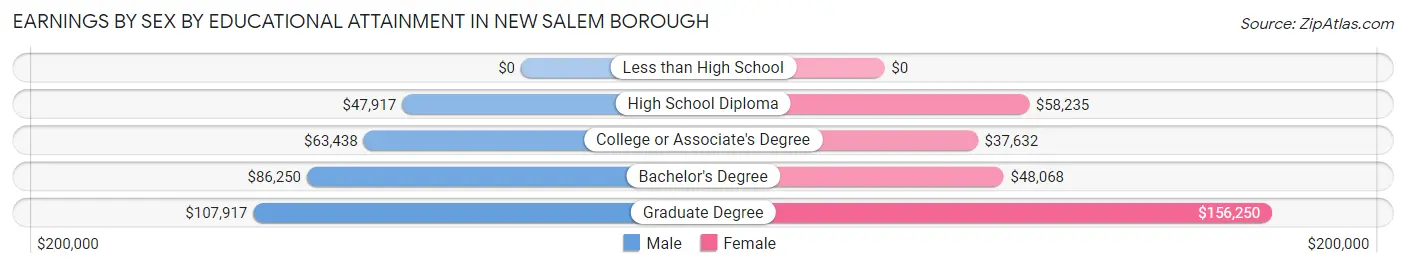
| Educational Attainment | Male Income | Female Income |
| Less than High School | - | - |
| High School Diploma | $47,917 | $58,235 |
| College or Associate's Degree | $63,438 | $37,632 |
| Bachelor's Degree | $86,250 | $48,068 |
| Graduate Degree | $107,917 | $156,250 |
| Total | $62,069 | $39,545 |
Family Income in New Salem borough
Family Income Brackets in New Salem borough
According to the New Salem borough family income data, there are 72 families falling into the $75,000 to $99,999 income range, which is the most common income bracket and makes up 24.7% of all families.
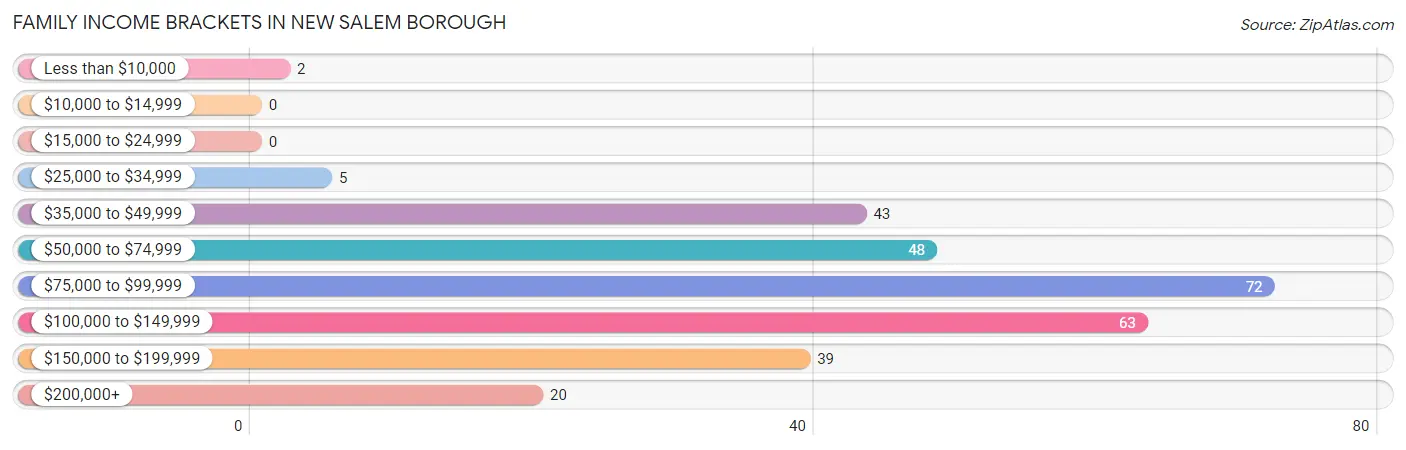
| Income Bracket | # Families | % Families |
| Less than $10,000 | 2 | 0.7% |
| $10,000 to $14,999 | 0 | 0.0% |
| $15,000 to $24,999 | 0 | 0.0% |
| $25,000 to $34,999 | 5 | 1.7% |
| $35,000 to $49,999 | 43 | 14.7% |
| $50,000 to $74,999 | 48 | 16.4% |
| $75,000 to $99,999 | 72 | 24.7% |
| $100,000 to $149,999 | 63 | 21.6% |
| $150,000 to $199,999 | 39 | 13.4% |
| $200,000+ | 20 | 6.8% |
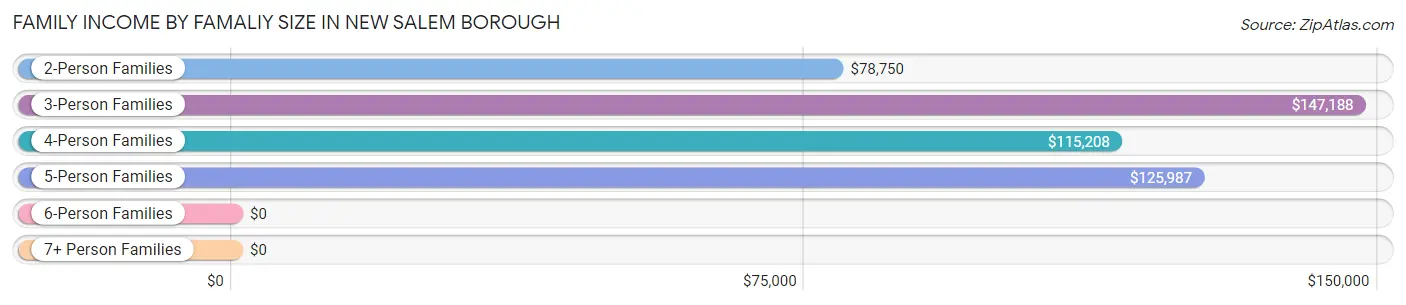
Family Income by Famaliy Size in New Salem borough
3-person families (37 | 12.7%) account for the highest median family income in New Salem borough with $147,188 per family, while 3-person families (37 | 12.7%) have the highest median income of $49,063 per family member.
| Income Bracket | # Families | Median Income |
| 2-Person Families | 167 (57.2%) | $78,750 |
| 3-Person Families | 37 (12.7%) | $147,188 |
| 4-Person Families | 49 (16.8%) | $115,208 |
| 5-Person Families | 27 (9.2%) | $125,987 |
| 6-Person Families | 5 (1.7%) | $0 |
| 7+ Person Families | 7 (2.4%) | $0 |
| Total | 292 (100.0%) | $98,235 |
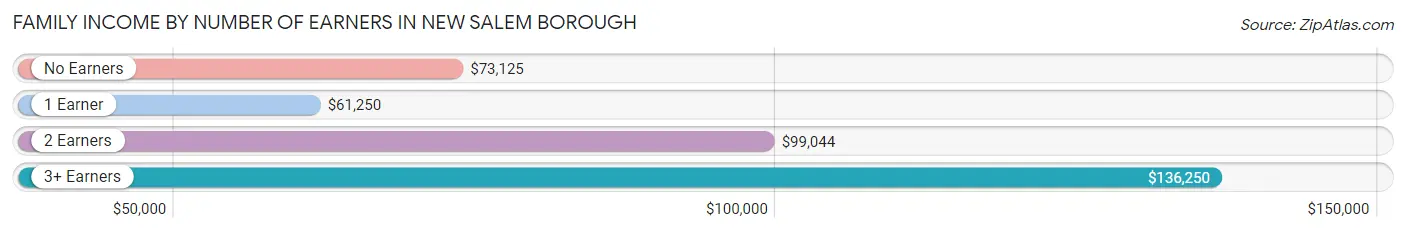
Family Income by Number of Earners in New Salem borough
The median family income in New Salem borough is $98,235, with families comprising 3+ earners (45) having the highest median family income of $136,250, while families with 1 earner (86) have the lowest median family income of $61,250, accounting for 15.4% and 29.4% of families, respectively.
| Number of Earners | # Families | Median Income |
| No Earners | 29 (9.9%) | $73,125 |
| 1 Earner | 86 (29.4%) | $61,250 |
| 2 Earners | 132 (45.2%) | $99,044 |
| 3+ Earners | 45 (15.4%) | $136,250 |
| Total | 292 (100.0%) | $98,235 |
Household Income in New Salem borough
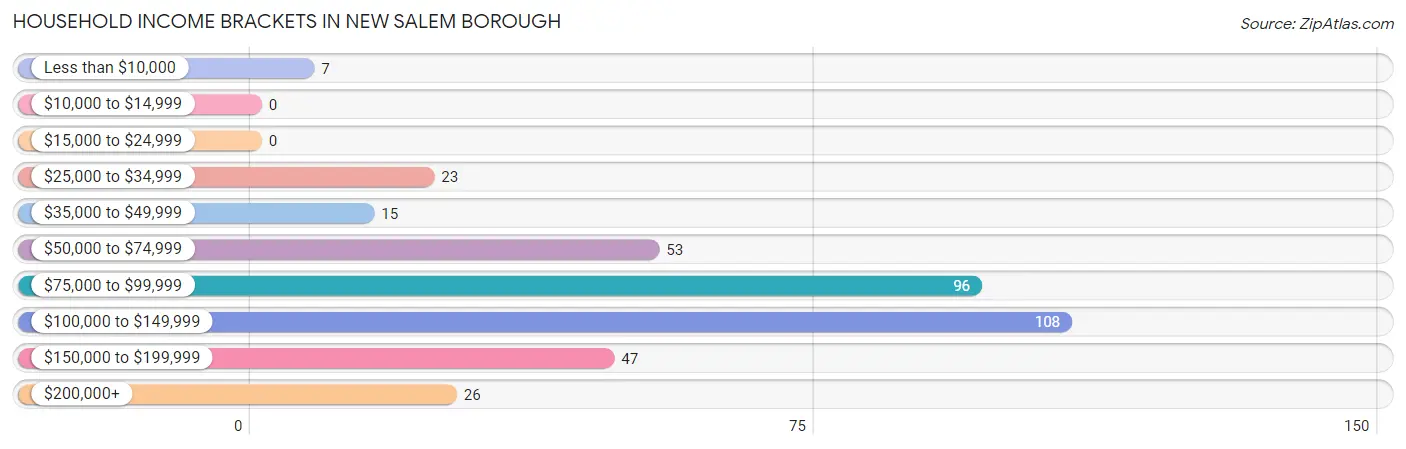
Household Income Brackets in New Salem borough
With 108 households falling in the category, the $100,000 to $149,999 income range is the most frequent in New Salem borough, accounting for 28.8% of all households.
| Income Bracket | # Households | % Households |
| Less than $10,000 | 7 | 1.9% |
| $10,000 to $14,999 | 0 | 0.0% |
| $15,000 to $24,999 | 0 | 0.0% |
| $25,000 to $34,999 | 23 | 6.1% |
| $35,000 to $49,999 | 15 | 4.0% |
| $50,000 to $74,999 | 53 | 14.1% |
| $75,000 to $99,999 | 96 | 25.6% |
| $100,000 to $149,999 | 108 | 28.8% |
| $150,000 to $199,999 | 47 | 12.5% |
| $200,000+ | 26 | 6.9% |
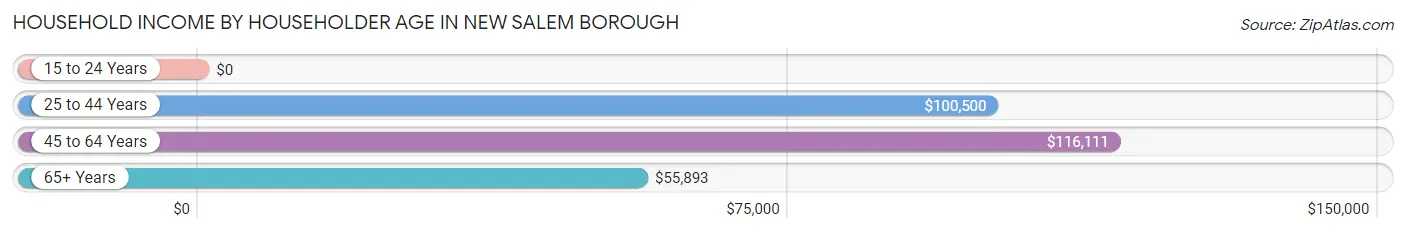
Household Income by Householder Age in New Salem borough
The median household income in New Salem borough is $99,549, with the highest median household income of $116,111 found in the 45 to 64 years age bracket for the primary householder. A total of 164 households (43.7%) fall into this category. Meanwhile, the 15 to 24 years age bracket for the primary householder has the lowest median household income of $0, with 8 households (2.1%) in this group.
| Income Bracket | # Households | Median Income |
| 15 to 24 Years | 8 (2.1%) | $0 |
| 25 to 44 Years | 128 (34.1%) | $100,500 |
| 45 to 64 Years | 164 (43.7%) | $116,111 |
| 65+ Years | 75 (20.0%) | $55,893 |
| Total | 375 (100.0%) | $99,549 |
Poverty in New Salem borough
Income Below Poverty by Sex and Age in New Salem borough
With 4.1% poverty level for males and 1.5% for females among the residents of New Salem borough, 6 to 11 year old males and 12 to 14 year old females are the most vulnerable to poverty, with 4 males (17.4%) and 4 females (16.0%) in their respective age groups living below the poverty level.
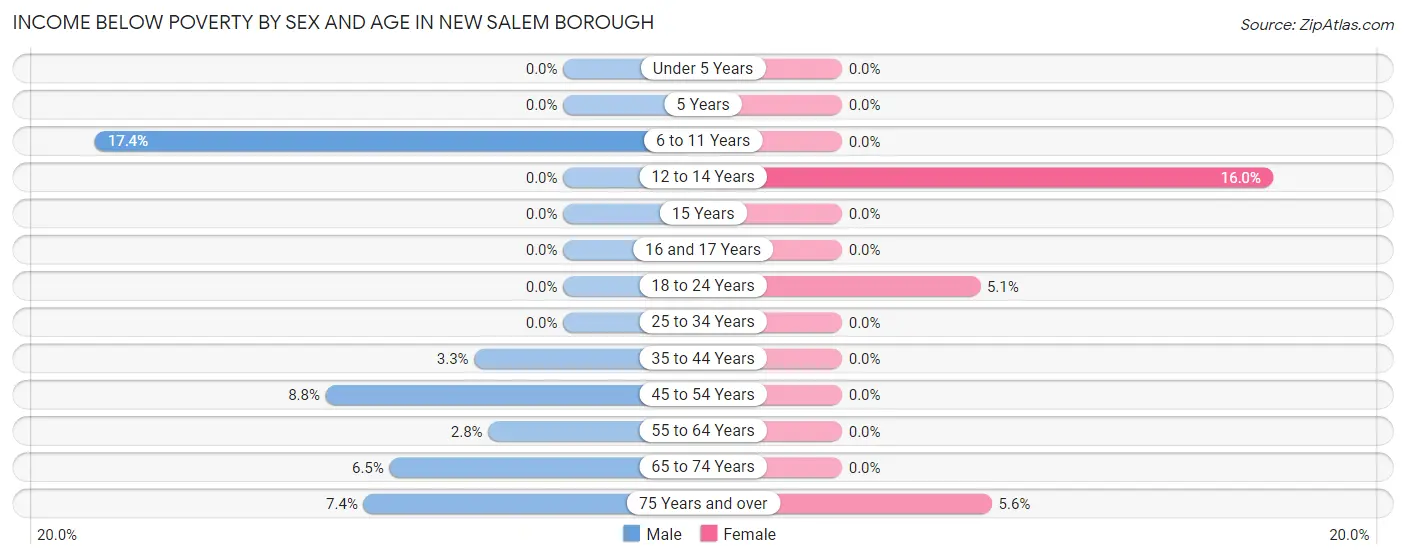
| Age Bracket | Male | Female |
| Under 5 Years | 0 (0.0%) | 0 (0.0%) |
| 5 Years | 0 (0.0%) | 0 (0.0%) |
| 6 to 11 Years | 4 (17.4%) | 0 (0.0%) |
| 12 to 14 Years | 0 (0.0%) | 4 (16.0%) |
| 15 Years | 0 (0.0%) | 0 (0.0%) |
| 16 and 17 Years | 0 (0.0%) | 0 (0.0%) |
| 18 to 24 Years | 0 (0.0%) | 2 (5.1%) |
| 25 to 34 Years | 0 (0.0%) | 0 (0.0%) |
| 35 to 44 Years | 3 (3.3%) | 0 (0.0%) |
| 45 to 54 Years | 6 (8.8%) | 0 (0.0%) |
| 55 to 64 Years | 2 (2.8%) | 0 (0.0%) |
| 65 to 74 Years | 2 (6.5%) | 0 (0.0%) |
| 75 Years and over | 2 (7.4%) | 2 (5.6%) |
| Total | 19 (4.1%) | 8 (1.5%) |
Income Above Poverty by Sex and Age in New Salem borough
According to the poverty statistics in New Salem borough, males aged under 5 years and females aged under 5 years are the age groups that are most secure financially, with 100.0% of males and 100.0% of females in these age groups living above the poverty line.
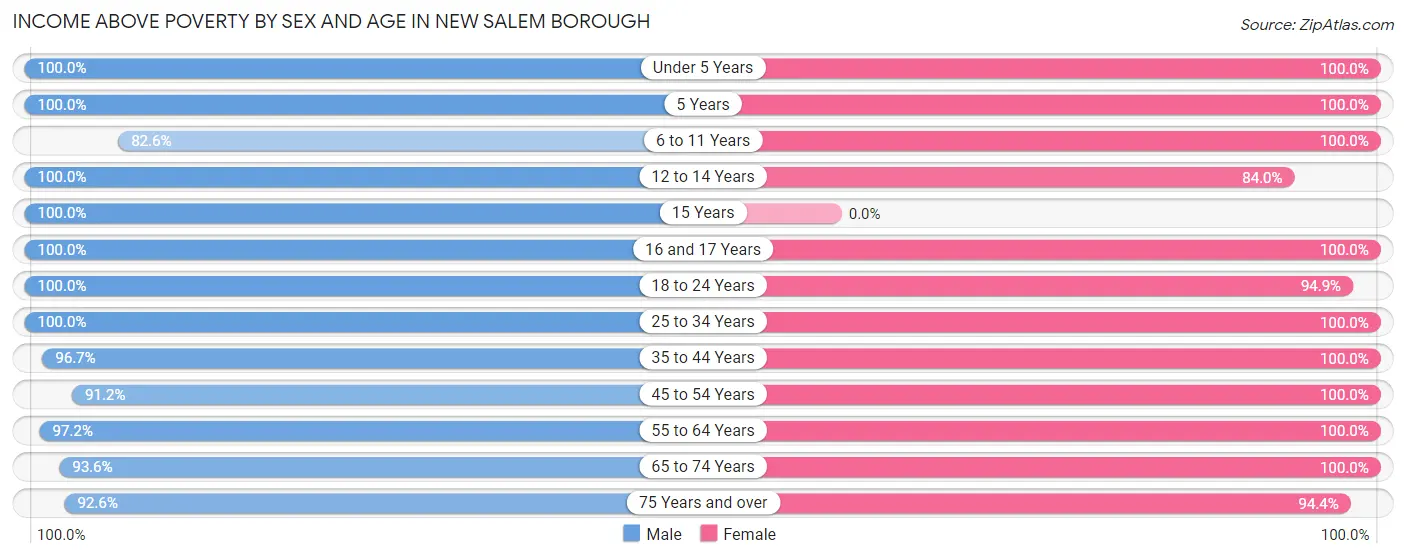
| Age Bracket | Male | Female |
| Under 5 Years | 19 (100.0%) | 54 (100.0%) |
| 5 Years | 9 (100.0%) | 13 (100.0%) |
| 6 to 11 Years | 19 (82.6%) | 46 (100.0%) |
| 12 to 14 Years | 18 (100.0%) | 21 (84.0%) |
| 15 Years | 9 (100.0%) | 0 (0.0%) |
| 16 and 17 Years | 21 (100.0%) | 6 (100.0%) |
| 18 to 24 Years | 21 (100.0%) | 37 (94.9%) |
| 25 to 34 Years | 58 (100.0%) | 97 (100.0%) |
| 35 to 44 Years | 88 (96.7%) | 42 (100.0%) |
| 45 to 54 Years | 62 (91.2%) | 50 (100.0%) |
| 55 to 64 Years | 70 (97.2%) | 86 (100.0%) |
| 65 to 74 Years | 29 (93.5%) | 30 (100.0%) |
| 75 Years and over | 25 (92.6%) | 34 (94.4%) |
| Total | 448 (95.9%) | 516 (98.5%) |
Income Below Poverty Among Married-Couple Families in New Salem borough
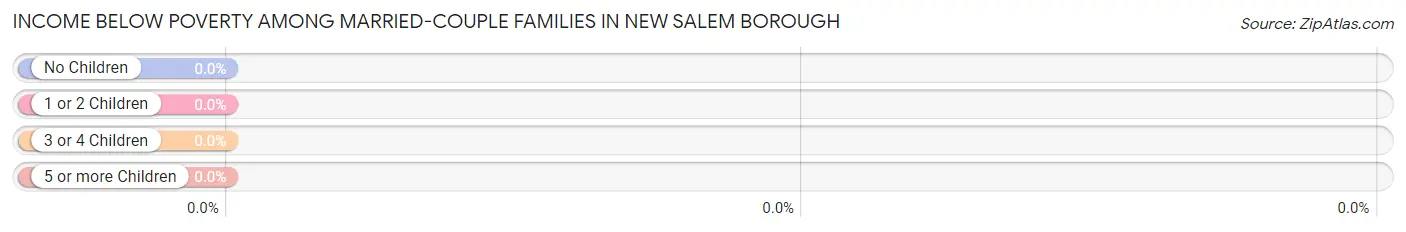
| Children | Above Poverty | Below Poverty |
| No Children | 121 (100.0%) | 0 (0.0%) |
| 1 or 2 Children | 78 (100.0%) | 0 (0.0%) |
| 3 or 4 Children | 11 (100.0%) | 0 (0.0%) |
| 5 or more Children | 0 (0.0%) | 0 (0.0%) |
| Total | 210 (100.0%) | 0 (0.0%) |
Income Below Poverty Among Single-Parent Households in New Salem borough
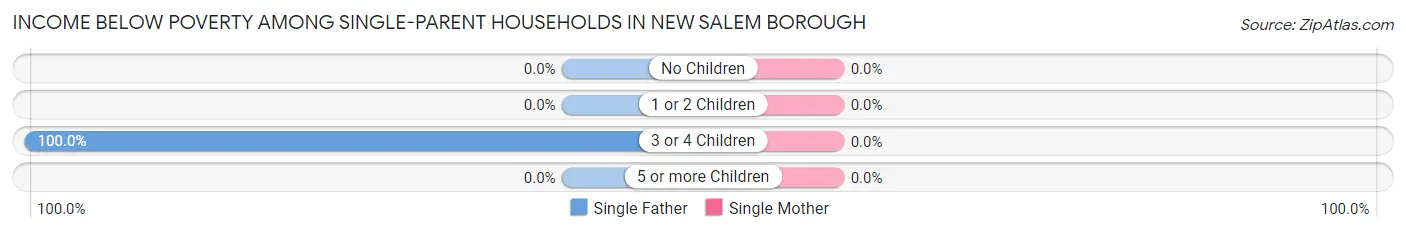
| Children | Single Father | Single Mother |
| No Children | 0 (0.0%) | 0 (0.0%) |
| 1 or 2 Children | 0 (0.0%) | 0 (0.0%) |
| 3 or 4 Children | 2 (100.0%) | 0 (0.0%) |
| 5 or more Children | 0 (0.0%) | 0 (0.0%) |
| Total | 2 (9.5%) | 0 (0.0%) |
Income Below Poverty Among Married-Couple vs Single-Parent Households in New Salem borough
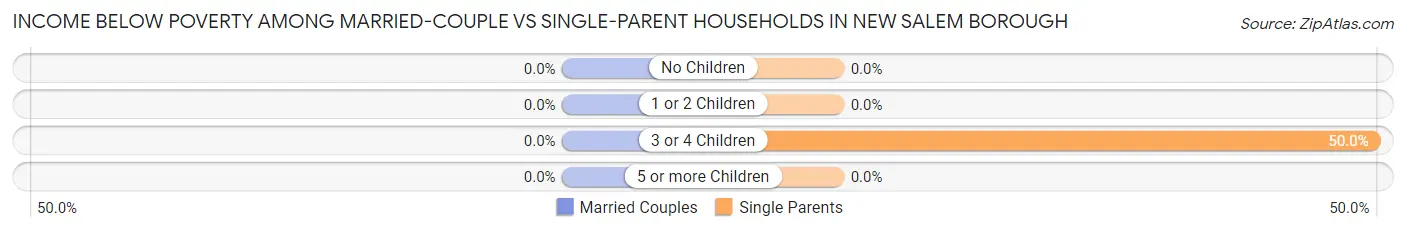
| Children | Married-Couple Families | Single-Parent Households |
| No Children | 0 (0.0%) | 0 (0.0%) |
| 1 or 2 Children | 0 (0.0%) | 0 (0.0%) |
| 3 or 4 Children | 0 (0.0%) | 2 (50.0%) |
| 5 or more Children | 0 (0.0%) | 0 (0.0%) |
| Total | 0 (0.0%) | 2 (2.4%) |
Race in New Salem borough
The most populous races in New Salem borough are White / Caucasian (875 | 88.3%), Black / African American (102 | 10.3%), and Hispanic or Latino (10 | 1.0%).
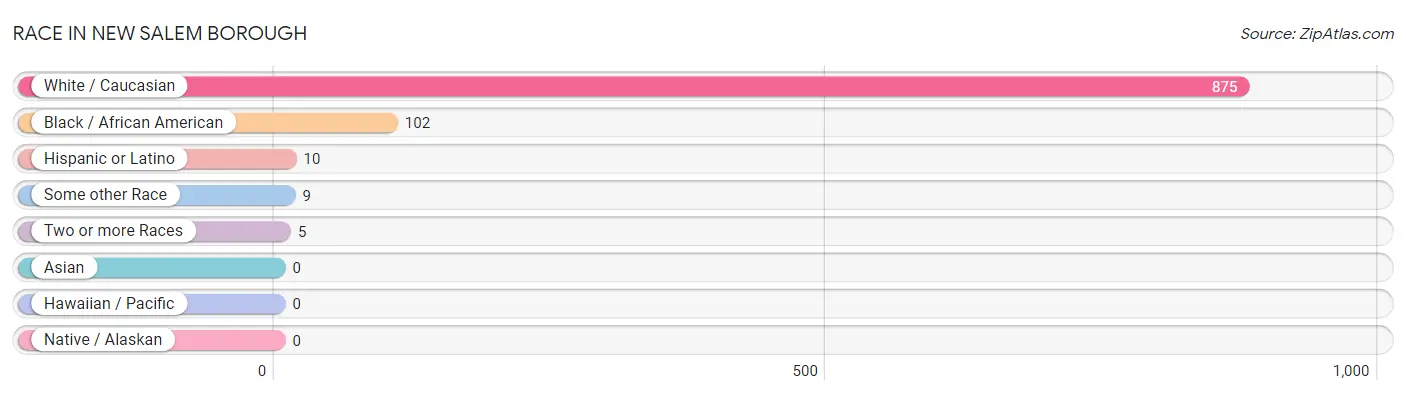
| Race | # Population | % Population |
| Asian | 0 | 0.0% |
| Black / African American | 102 | 10.3% |
| Hawaiian / Pacific | 0 | 0.0% |
| Hispanic or Latino | 10 | 1.0% |
| Native / Alaskan | 0 | 0.0% |
| White / Caucasian | 875 | 88.3% |
| Two or more Races | 5 | 0.5% |
| Some other Race | 9 | 0.9% |
| Total | 991 | 100.0% |
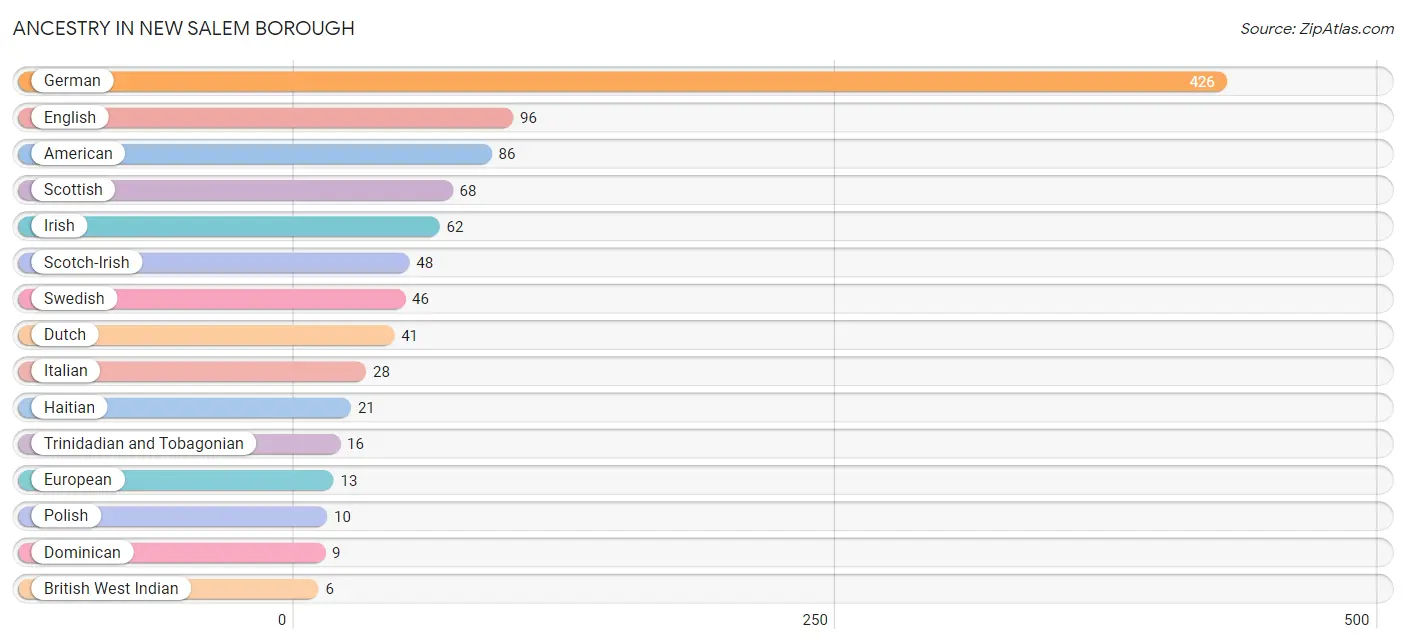
Ancestry in New Salem borough
The most populous ancestries reported in New Salem borough are German (426 | 43.0%), English (96 | 9.7%), American (86 | 8.7%), Scottish (68 | 6.9%), and Irish (62 | 6.3%), together accounting for 74.5% of all New Salem borough residents.
| Ancestry | # Population | % Population |
| American | 86 | 8.7% |
| Arab | 3 | 0.3% |
| British West Indian | 6 | 0.6% |
| Cherokee | 2 | 0.2% |
| Dominican | 9 | 0.9% |
| Dutch | 41 | 4.1% |
| Eastern European | 3 | 0.3% |
| English | 96 | 9.7% |
| European | 13 | 1.3% |
| French | 4 | 0.4% |
| German | 426 | 43.0% |
| Haitian | 21 | 2.1% |
| Hungarian | 6 | 0.6% |
| Irish | 62 | 6.3% |
| Italian | 28 | 2.8% |
| Korean | 1 | 0.1% |
| Lebanese | 3 | 0.3% |
| Mexican | 1 | 0.1% |
| Norwegian | 2 | 0.2% |
| Pennsylvania German | 3 | 0.3% |
| Polish | 10 | 1.0% |
| Scandinavian | 2 | 0.2% |
| Scotch-Irish | 48 | 4.8% |
| Scottish | 68 | 6.9% |
| Swedish | 46 | 4.6% |
| Swiss | 3 | 0.3% |
| Trinidadian and Tobagonian | 16 | 1.6% |
| Welsh | 6 | 0.6% | View All 28 Rows |
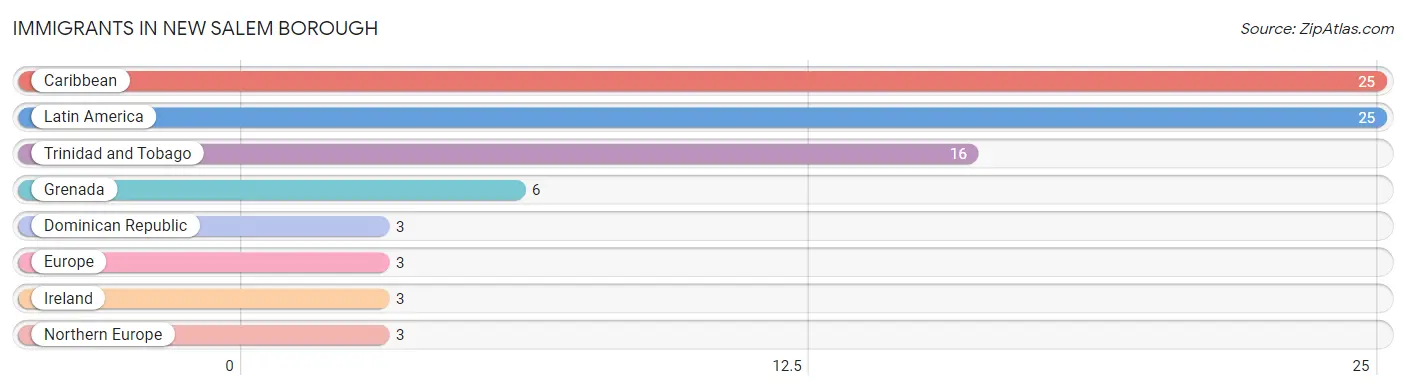
Immigrants in New Salem borough
The most numerous immigrant groups reported in New Salem borough came from Caribbean (25 | 2.5%), Latin America (25 | 2.5%), Trinidad and Tobago (16 | 1.6%), Grenada (6 | 0.6%), and Dominican Republic (3 | 0.3%), together accounting for 7.6% of all New Salem borough residents.
| Immigration Origin | # Population | % Population |
| Caribbean | 25 | 2.5% |
| Dominican Republic | 3 | 0.3% |
| Europe | 3 | 0.3% |
| Grenada | 6 | 0.6% |
| Ireland | 3 | 0.3% |
| Latin America | 25 | 2.5% |
| Northern Europe | 3 | 0.3% |
| Trinidad and Tobago | 16 | 1.6% | View All 8 Rows |
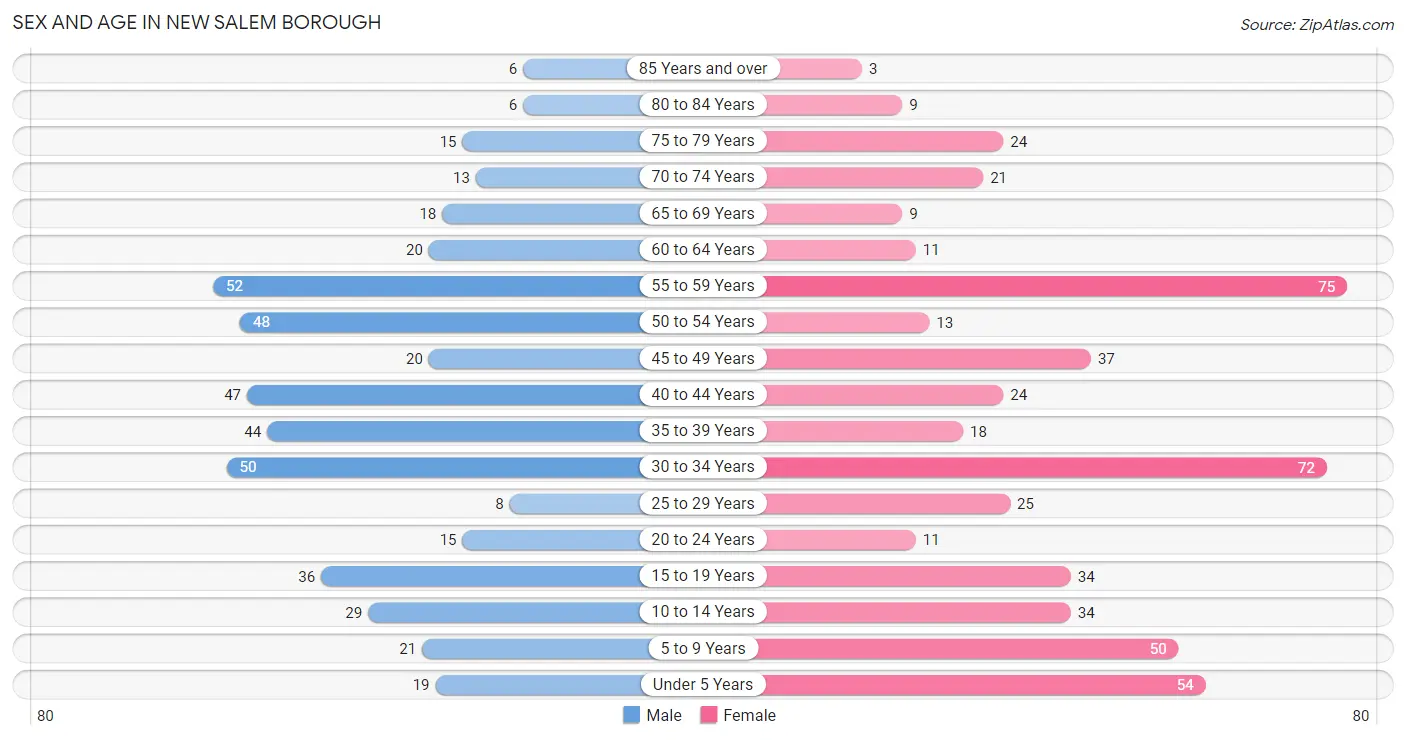
Sex and Age in New Salem borough
Sex and Age in New Salem borough
The most populous age groups in New Salem borough are 55 to 59 Years (52 | 11.1%) for men and 55 to 59 Years (75 | 14.3%) for women.
| Age Bracket | Male | Female |
| Under 5 Years | 19 (4.1%) | 54 (10.3%) |
| 5 to 9 Years | 21 (4.5%) | 50 (9.5%) |
| 10 to 14 Years | 29 (6.2%) | 34 (6.5%) |
| 15 to 19 Years | 36 (7.7%) | 34 (6.5%) |
| 20 to 24 Years | 15 (3.2%) | 11 (2.1%) |
| 25 to 29 Years | 8 (1.7%) | 25 (4.8%) |
| 30 to 34 Years | 50 (10.7%) | 72 (13.7%) |
| 35 to 39 Years | 44 (9.4%) | 18 (3.4%) |
| 40 to 44 Years | 47 (10.1%) | 24 (4.6%) |
| 45 to 49 Years | 20 (4.3%) | 37 (7.1%) |
| 50 to 54 Years | 48 (10.3%) | 13 (2.5%) |
| 55 to 59 Years | 52 (11.1%) | 75 (14.3%) |
| 60 to 64 Years | 20 (4.3%) | 11 (2.1%) |
| 65 to 69 Years | 18 (3.8%) | 9 (1.7%) |
| 70 to 74 Years | 13 (2.8%) | 21 (4.0%) |
| 75 to 79 Years | 15 (3.2%) | 24 (4.6%) |
| 80 to 84 Years | 6 (1.3%) | 9 (1.7%) |
| 85 Years and over | 6 (1.3%) | 3 (0.6%) |
| Total | 467 (100.0%) | 524 (100.0%) |
Families and Households in New Salem borough
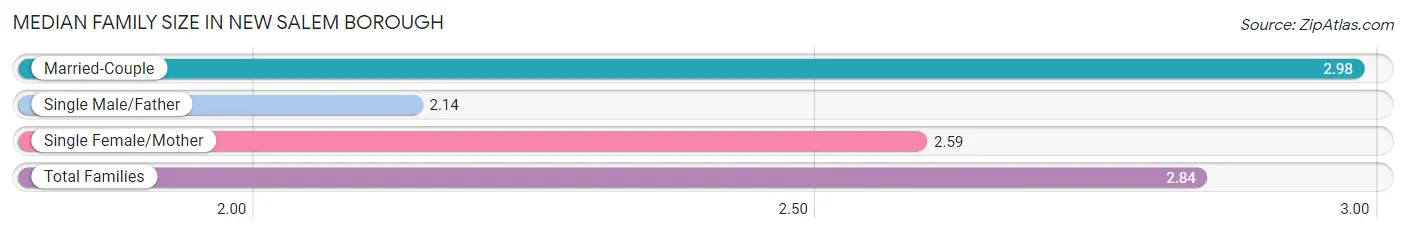
Median Family Size in New Salem borough
The median family size in New Salem borough is 2.84 persons per family, with married-couple families (210 | 71.9%) accounting for the largest median family size of 2.98 persons per family. On the other hand, single male/father families (21 | 7.2%) represent the smallest median family size with 2.14 persons per family.
| Family Type | # Families | Family Size |
| Married-Couple | 210 (71.9%) | 2.98 |
| Single Male/Father | 21 (7.2%) | 2.14 |
| Single Female/Mother | 61 (20.9%) | 2.59 |
| Total Families | 292 (100.0%) | 2.84 |
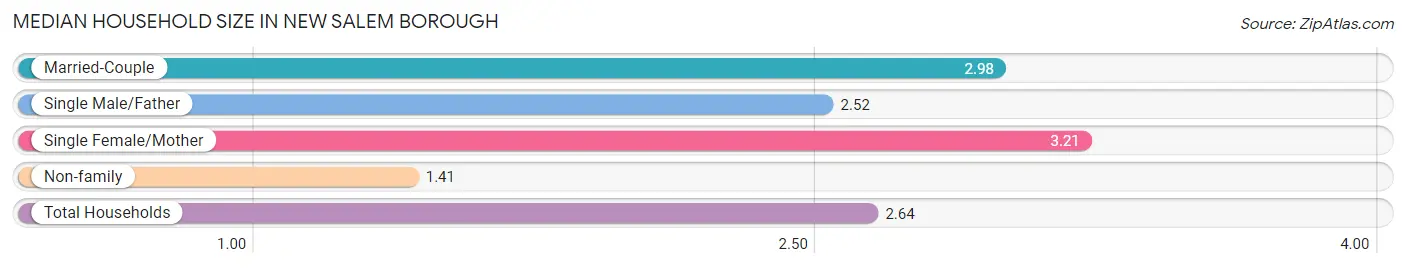
Median Household Size in New Salem borough
The median household size in New Salem borough is 2.64 persons per household, with single female/mother households (61 | 16.3%) accounting for the largest median household size of 3.21 persons per household. non-family households (83 | 22.1%) represent the smallest median household size with 1.41 persons per household.
| Household Type | # Households | Household Size |
| Married-Couple | 210 (56.0%) | 2.98 |
| Single Male/Father | 21 (5.6%) | 2.52 |
| Single Female/Mother | 61 (16.3%) | 3.21 |
| Non-family | 83 (22.1%) | 1.41 |
| Total Households | 375 (100.0%) | 2.64 |
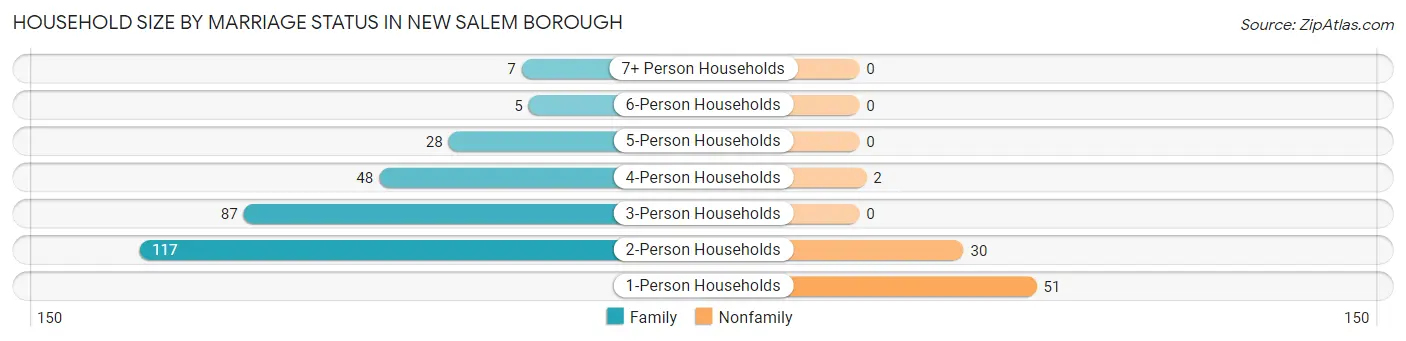
Household Size by Marriage Status in New Salem borough
Out of a total of 375 households in New Salem borough, 292 (77.9%) are family households, while 83 (22.1%) are nonfamily households. The most numerous type of family households are 2-person households, comprising 117, and the most common type of nonfamily households are 1-person households, comprising 51.
| Household Size | Family Households | Nonfamily Households |
| 1-Person Households | - | 51 (13.6%) |
| 2-Person Households | 117 (31.2%) | 30 (8.0%) |
| 3-Person Households | 87 (23.2%) | 0 (0.0%) |
| 4-Person Households | 48 (12.8%) | 2 (0.5%) |
| 5-Person Households | 28 (7.5%) | 0 (0.0%) |
| 6-Person Households | 5 (1.3%) | 0 (0.0%) |
| 7+ Person Households | 7 (1.9%) | 0 (0.0%) |
| Total | 292 (77.9%) | 83 (22.1%) |
Female Fertility in New Salem borough
Fertility by Age in New Salem borough
Average fertility rate in New Salem borough is 18.0 births per 1,000 women. Women in the age bracket of 35 to 50 years have the highest fertility rate with 49.0 births per 1,000 women. Women in the age bracket of 35 to 50 years acount for 100.0% of all women with births.
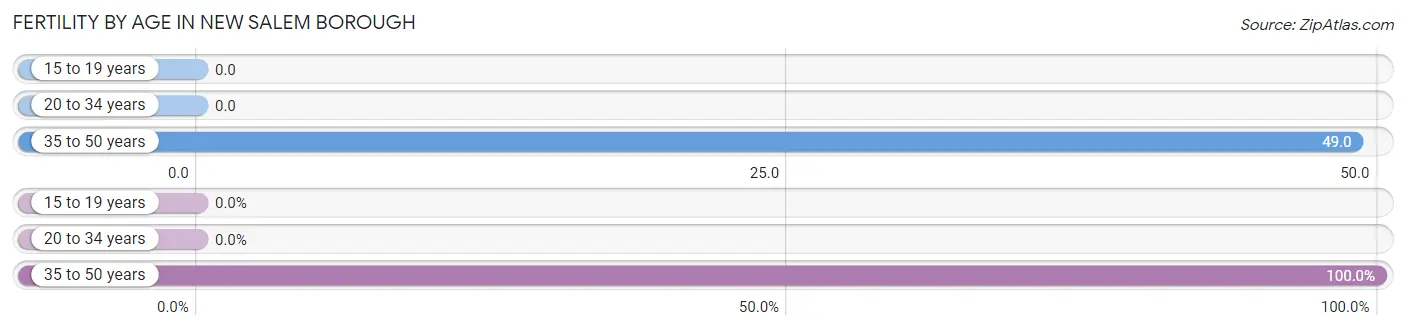
| Age Bracket | Women with Births | Births / 1,000 Women |
| 15 to 19 years | 0 (0.0%) | 0.0 |
| 20 to 34 years | 0 (0.0%) | 0.0 |
| 35 to 50 years | 4 (100.0%) | 49.0 |
| Total | 4 (100.0%) | 18.0 |
Fertility by Age by Marriage Status in New Salem borough
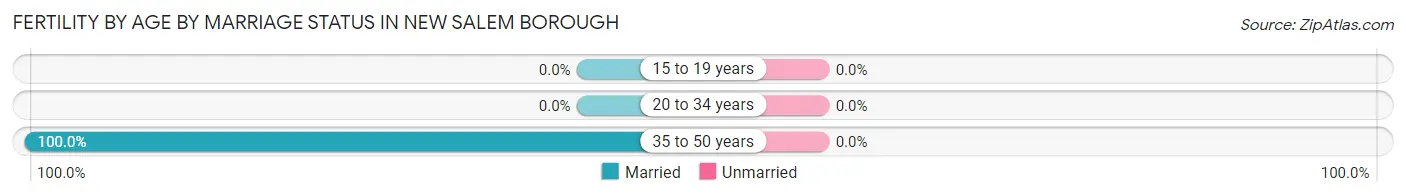
| Age Bracket | Married | Unmarried |
| 15 to 19 years | 0 (0.0%) | 0 (0.0%) |
| 20 to 34 years | 0 (0.0%) | 0 (0.0%) |
| 35 to 50 years | 4 (100.0%) | 0 (0.0%) |
| Total | 4 (100.0%) | 0 (0.0%) |
Fertility by Education in New Salem borough
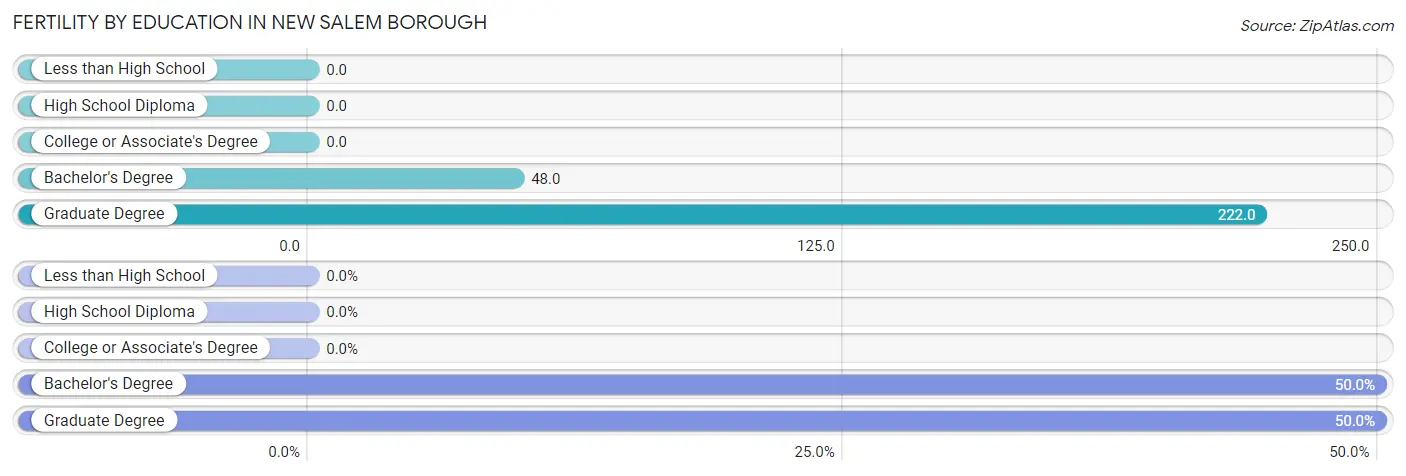
| Educational Attainment | Women with Births | Births / 1,000 Women |
| Less than High School | 0 (0.0%) | 0.0 |
| High School Diploma | 0 (0.0%) | 0.0 |
| College or Associate's Degree | 0 (0.0%) | 0.0 |
| Bachelor's Degree | 2 (50.0%) | 48.0 |
| Graduate Degree | 2 (50.0%) | 222.0 |
| Total | 4 (100.0%) | 18.0 |
Fertility by Education by Marriage Status in New Salem borough
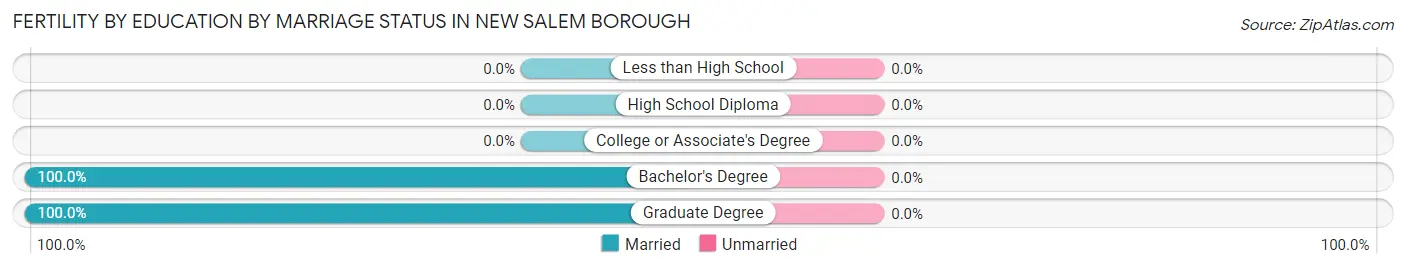
| Educational Attainment | Married | Unmarried |
| Less than High School | 0 (0.0%) | 0 (0.0%) |
| High School Diploma | 0 (0.0%) | 0 (0.0%) |
| College or Associate's Degree | 0 (0.0%) | 0 (0.0%) |
| Bachelor's Degree | 2 (100.0%) | 0 (0.0%) |
| Graduate Degree | 2 (100.0%) | 0 (0.0%) |
| Total | 4 (100.0%) | 0 (0.0%) |
Employment Characteristics in New Salem borough
Employment by Class of Employer in New Salem borough
Among the 485 employed individuals in New Salem borough, private company employees (328 | 67.6%), not-for-profit organizations (85 | 17.5%), and local government employees (21 | 4.3%) make up the most common classes of employment.
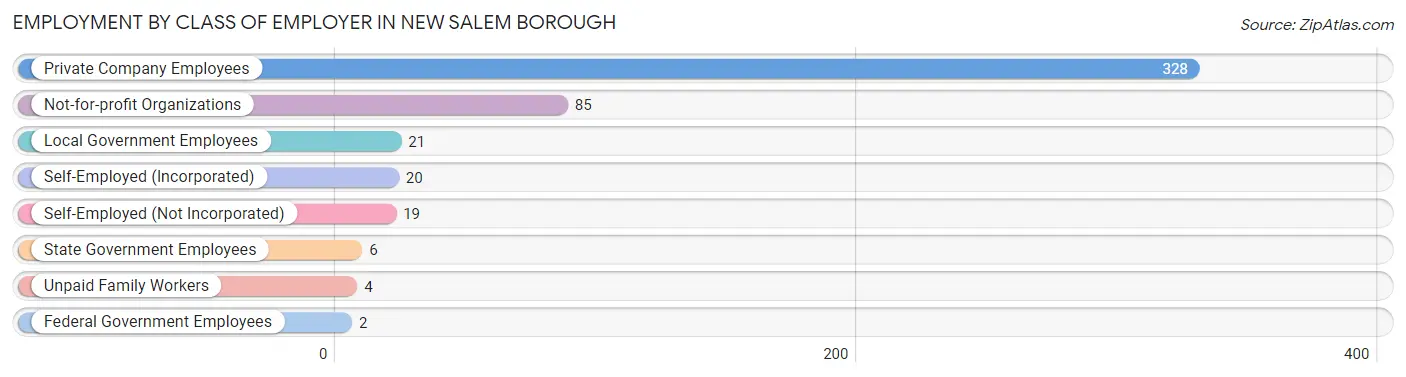
| Employer Class | # Employees | % Employees |
| Private Company Employees | 328 | 67.6% |
| Self-Employed (Incorporated) | 20 | 4.1% |
| Self-Employed (Not Incorporated) | 19 | 3.9% |
| Not-for-profit Organizations | 85 | 17.5% |
| Local Government Employees | 21 | 4.3% |
| State Government Employees | 6 | 1.2% |
| Federal Government Employees | 2 | 0.4% |
| Unpaid Family Workers | 4 | 0.8% |
| Total | 485 | 100.0% |
Employment Status by Age in New Salem borough
According to the labor force statistics for New Salem borough, out of the total population over 16 years of age (775), 75.4% or 584 individuals are in the labor force, with 3.6% or 21 of them unemployed. The age group with the highest labor force participation rate is 20 to 24 years, with 100.0% or 26 individuals in the labor force. Within the labor force, the 45 to 54 years age range has the highest percentage of unemployed individuals, with 12.5% or 11 of them being unemployed.
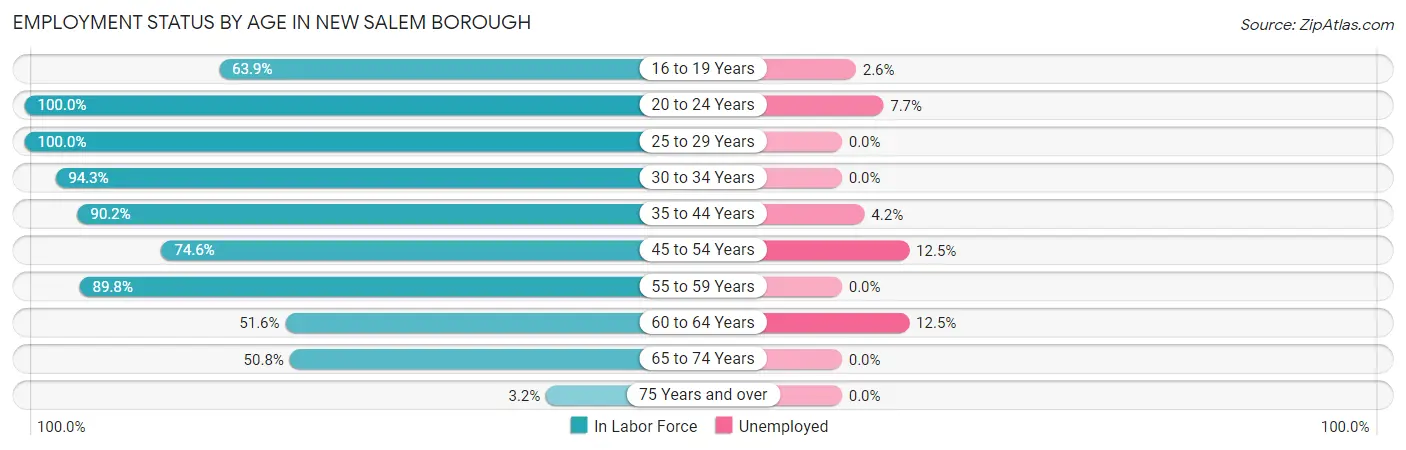
| Age Bracket | In Labor Force | Unemployed |
| 16 to 19 Years | 39 (63.9%) | 1 (2.6%) |
| 20 to 24 Years | 26 (100.0%) | 2 (7.7%) |
| 25 to 29 Years | 33 (100.0%) | 0 (0.0%) |
| 30 to 34 Years | 115 (94.3%) | 0 (0.0%) |
| 35 to 44 Years | 120 (90.2%) | 5 (4.2%) |
| 45 to 54 Years | 88 (74.6%) | 11 (12.5%) |
| 55 to 59 Years | 114 (89.8%) | 0 (0.0%) |
| 60 to 64 Years | 16 (51.6%) | 2 (12.5%) |
| 65 to 74 Years | 31 (50.8%) | 0 (0.0%) |
| 75 Years and over | 2 (3.2%) | 0 (0.0%) |
| Total | 584 (75.4%) | 21 (3.6%) |
Employment Status by Educational Attainment in New Salem borough
According to labor force statistics for New Salem borough, 86.2% of individuals (486) out of the total population between 25 and 64 years of age (564) are in the labor force, with 3.7% or 18 of them being unemployed. The group with the highest labor force participation rate are those with the educational attainment of bachelor's degree or higher, with 95.9% or 117 individuals in the labor force. Within the labor force, individuals with bachelor's degree or higher education have the highest percentage of unemployment, with 13.7% or 16 of them being unemployed.
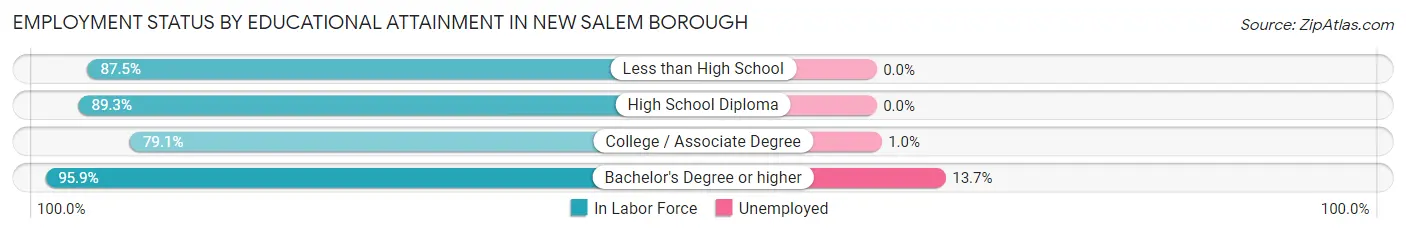
| Educational Attainment | In Labor Force | Unemployed |
| Less than High School | 14 (87.5%) | 0 (0.0%) |
| High School Diploma | 158 (89.3%) | 0 (0.0%) |
| College / Associate Degree | 197 (79.1%) | 2 (1.0%) |
| Bachelor's Degree or higher | 117 (95.9%) | 17 (13.7%) |
| Total | 486 (86.2%) | 21 (3.7%) |
Employment Occupations by Sex in New Salem borough
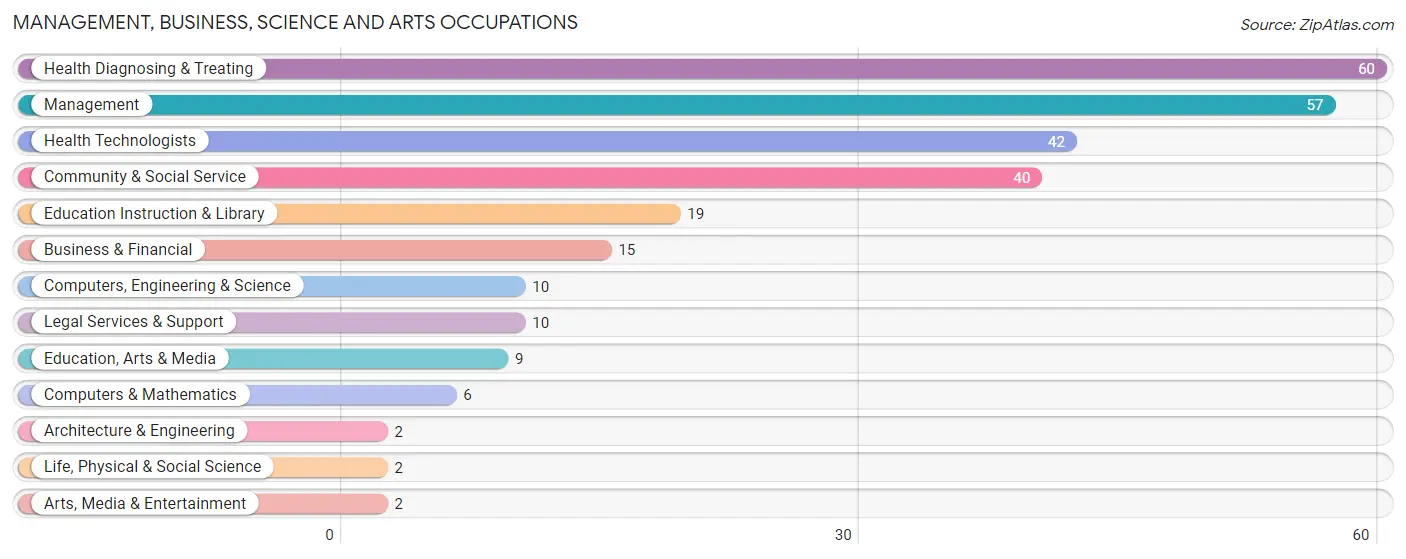
Management, Business, Science and Arts Occupations
The most common Management, Business, Science and Arts occupations in New Salem borough are Health Diagnosing & Treating (60 | 10.7%), Management (57 | 10.1%), Health Technologists (42 | 7.5%), Community & Social Service (40 | 7.1%), and Education Instruction & Library (19 | 3.4%).
Management, Business, Science and Arts Occupations by Sex
Within the Management, Business, Science and Arts occupations in New Salem borough, the most male-oriented occupations are Computers, Engineering & Science (100.0%), Computers & Mathematics (100.0%), and Architecture & Engineering (100.0%), while the most female-oriented occupations are Legal Services & Support (100.0%), Arts, Media & Entertainment (100.0%), and Health Technologists (100.0%).
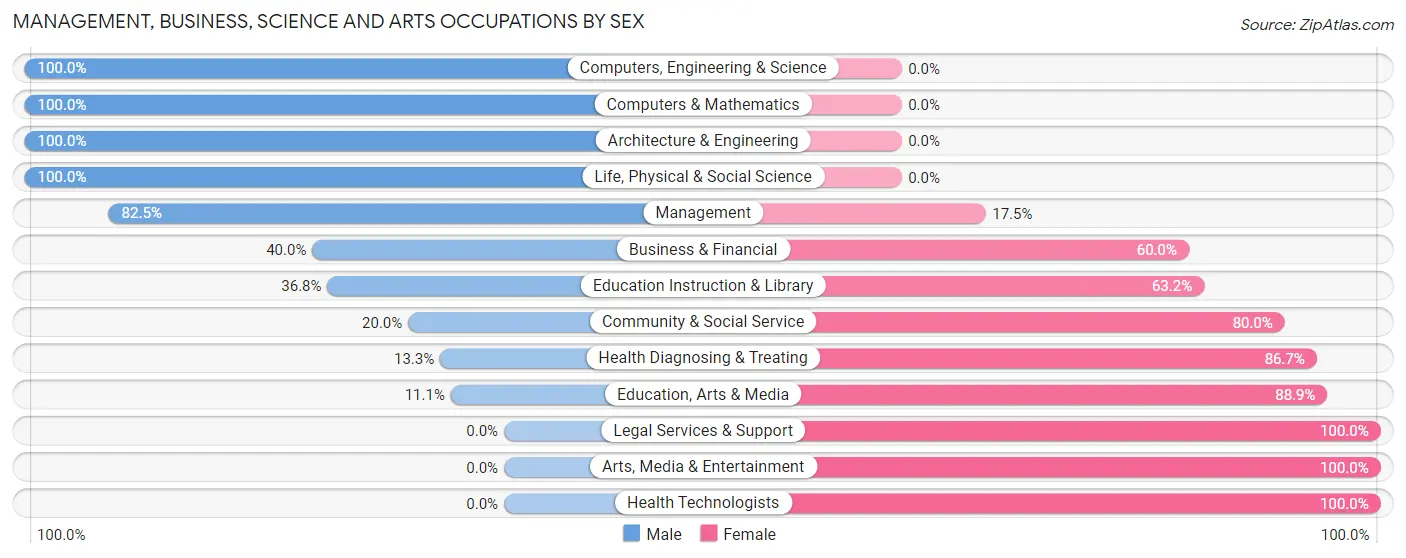
| Occupation | Male | Female |
| Management | 47 (82.5%) | 10 (17.5%) |
| Business & Financial | 6 (40.0%) | 9 (60.0%) |
| Computers, Engineering & Science | 10 (100.0%) | 0 (0.0%) |
| Computers & Mathematics | 6 (100.0%) | 0 (0.0%) |
| Architecture & Engineering | 2 (100.0%) | 0 (0.0%) |
| Life, Physical & Social Science | 2 (100.0%) | 0 (0.0%) |
| Community & Social Service | 8 (20.0%) | 32 (80.0%) |
| Education, Arts & Media | 1 (11.1%) | 8 (88.9%) |
| Legal Services & Support | 0 (0.0%) | 10 (100.0%) |
| Education Instruction & Library | 7 (36.8%) | 12 (63.2%) |
| Arts, Media & Entertainment | 0 (0.0%) | 2 (100.0%) |
| Health Diagnosing & Treating | 8 (13.3%) | 52 (86.7%) |
| Health Technologists | 0 (0.0%) | 42 (100.0%) |
| Total (Category) | 79 (43.4%) | 103 (56.6%) |
| Total (Overall) | 284 (50.4%) | 279 (49.6%) |
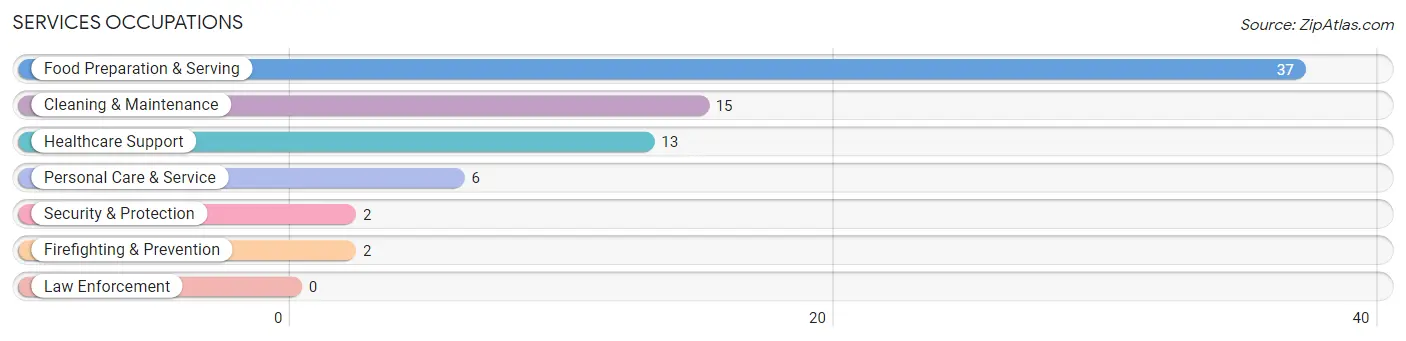
Services Occupations
The most common Services occupations in New Salem borough are Food Preparation & Serving (37 | 6.6%), Cleaning & Maintenance (15 | 2.7%), Healthcare Support (13 | 2.3%), Personal Care & Service (6 | 1.1%), and Security & Protection (2 | 0.4%).
Services Occupations by Sex
Within the Services occupations in New Salem borough, the most male-oriented occupations are Security & Protection (100.0%), Firefighting & Prevention (100.0%), and Cleaning & Maintenance (73.3%), while the most female-oriented occupations are Personal Care & Service (100.0%), Food Preparation & Serving (89.2%), and Healthcare Support (84.6%).
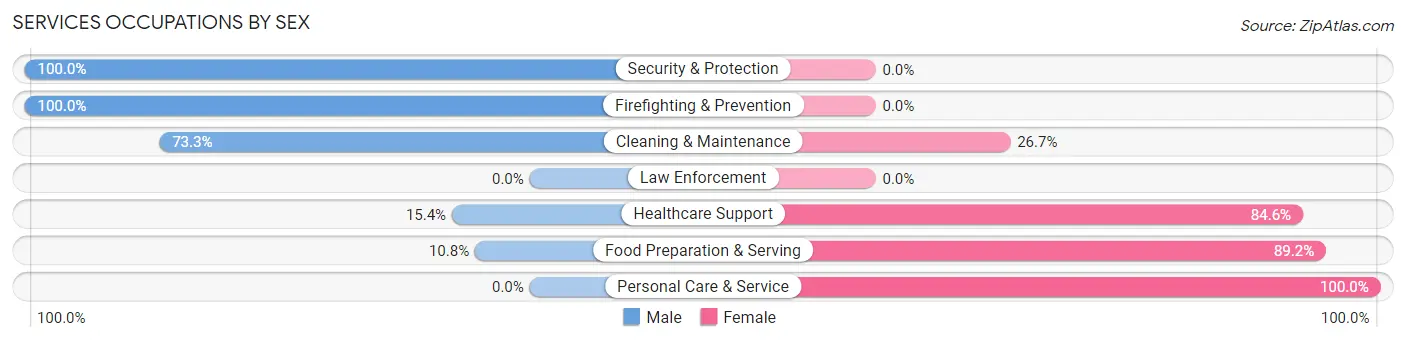
| Occupation | Male | Female |
| Healthcare Support | 2 (15.4%) | 11 (84.6%) |
| Security & Protection | 2 (100.0%) | 0 (0.0%) |
| Firefighting & Prevention | 2 (100.0%) | 0 (0.0%) |
| Law Enforcement | 0 (0.0%) | 0 (0.0%) |
| Food Preparation & Serving | 4 (10.8%) | 33 (89.2%) |
| Cleaning & Maintenance | 11 (73.3%) | 4 (26.7%) |
| Personal Care & Service | 0 (0.0%) | 6 (100.0%) |
| Total (Category) | 19 (26.0%) | 54 (74.0%) |
| Total (Overall) | 284 (50.4%) | 279 (49.6%) |
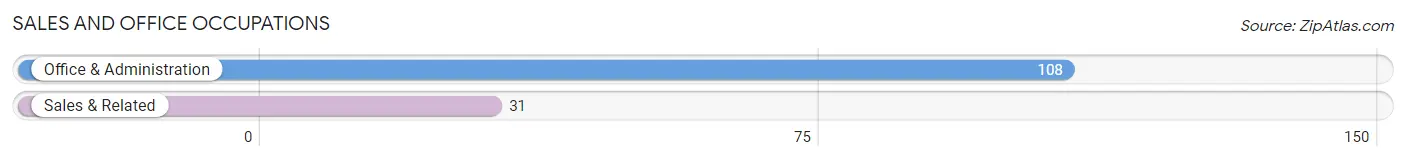
Sales and Office Occupations
The most common Sales and Office occupations in New Salem borough are Office & Administration (108 | 19.2%), and Sales & Related (31 | 5.5%).
Sales and Office Occupations by Sex
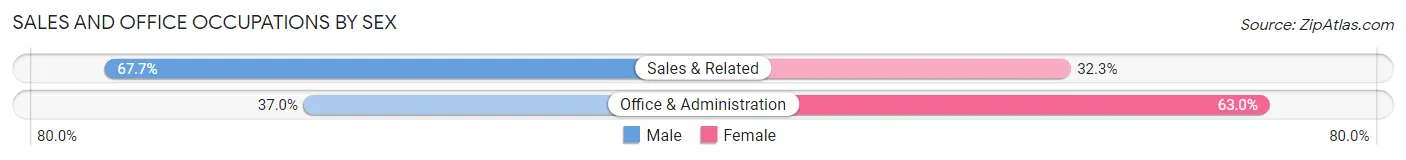
| Occupation | Male | Female |
| Sales & Related | 21 (67.7%) | 10 (32.3%) |
| Office & Administration | 40 (37.0%) | 68 (63.0%) |
| Total (Category) | 61 (43.9%) | 78 (56.1%) |
| Total (Overall) | 284 (50.4%) | 279 (49.6%) |
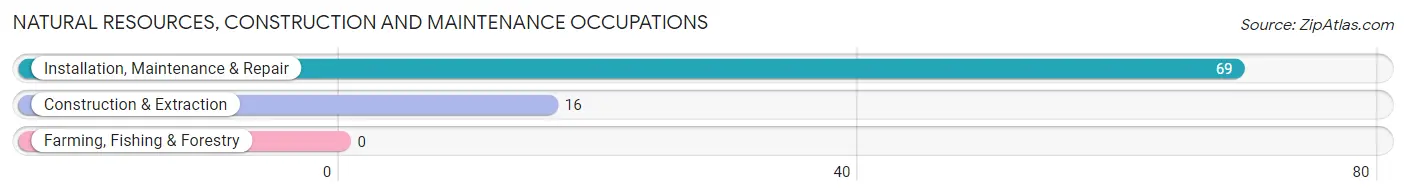
Natural Resources, Construction and Maintenance Occupations
The most common Natural Resources, Construction and Maintenance occupations in New Salem borough are Installation, Maintenance & Repair (69 | 12.3%), and Construction & Extraction (16 | 2.8%).
Natural Resources, Construction and Maintenance Occupations by Sex
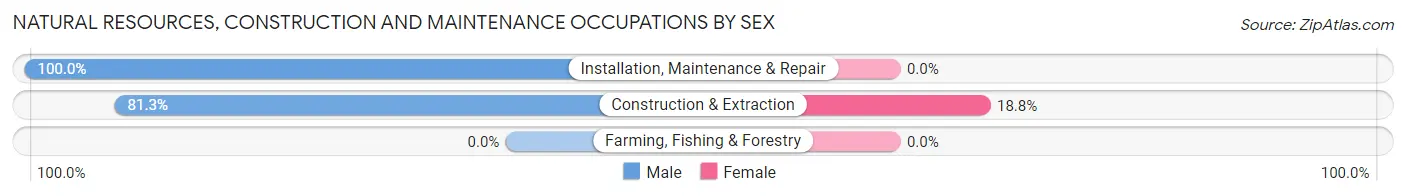
| Occupation | Male | Female |
| Farming, Fishing & Forestry | 0 (0.0%) | 0 (0.0%) |
| Construction & Extraction | 13 (81.2%) | 3 (18.8%) |
| Installation, Maintenance & Repair | 69 (100.0%) | 0 (0.0%) |
| Total (Category) | 82 (96.5%) | 3 (3.5%) |
| Total (Overall) | 284 (50.4%) | 279 (49.6%) |
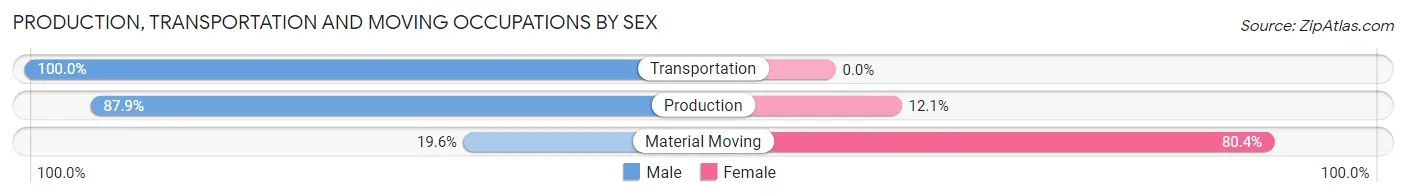
Production, Transportation and Moving Occupations
The most common Production, Transportation and Moving occupations in New Salem borough are Material Moving (46 | 8.2%), Production (33 | 5.9%), and Transportation (5 | 0.9%).
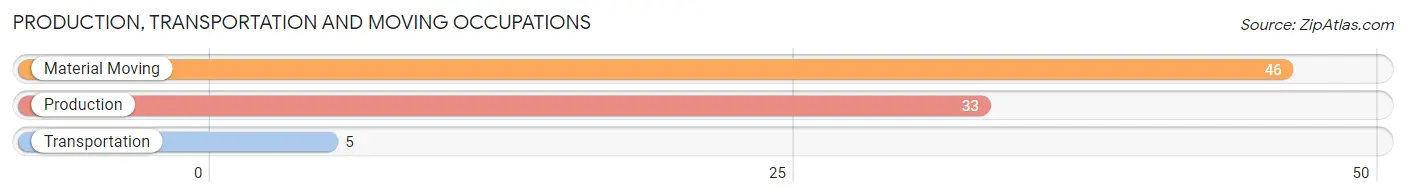
Production, Transportation and Moving Occupations by Sex
| Occupation | Male | Female |
| Production | 29 (87.9%) | 4 (12.1%) |
| Transportation | 5 (100.0%) | 0 (0.0%) |
| Material Moving | 9 (19.6%) | 37 (80.4%) |
| Total (Category) | 43 (51.2%) | 41 (48.8%) |
| Total (Overall) | 284 (50.4%) | 279 (49.6%) |
Employment Industries by Sex in New Salem borough
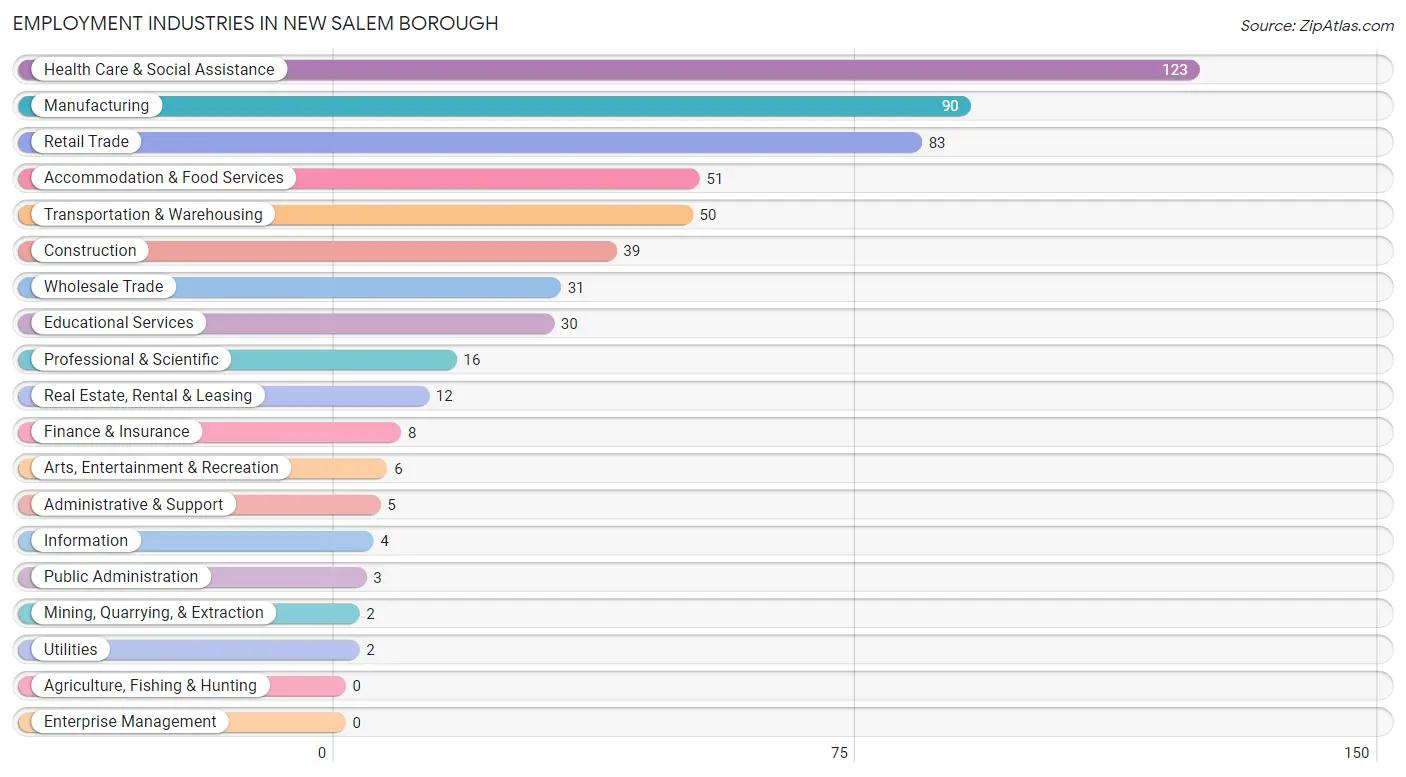
Employment Industries in New Salem borough
The major employment industries in New Salem borough include Health Care & Social Assistance (123 | 21.8%), Manufacturing (90 | 16.0%), Retail Trade (83 | 14.7%), Accommodation & Food Services (51 | 9.1%), and Transportation & Warehousing (50 | 8.9%).
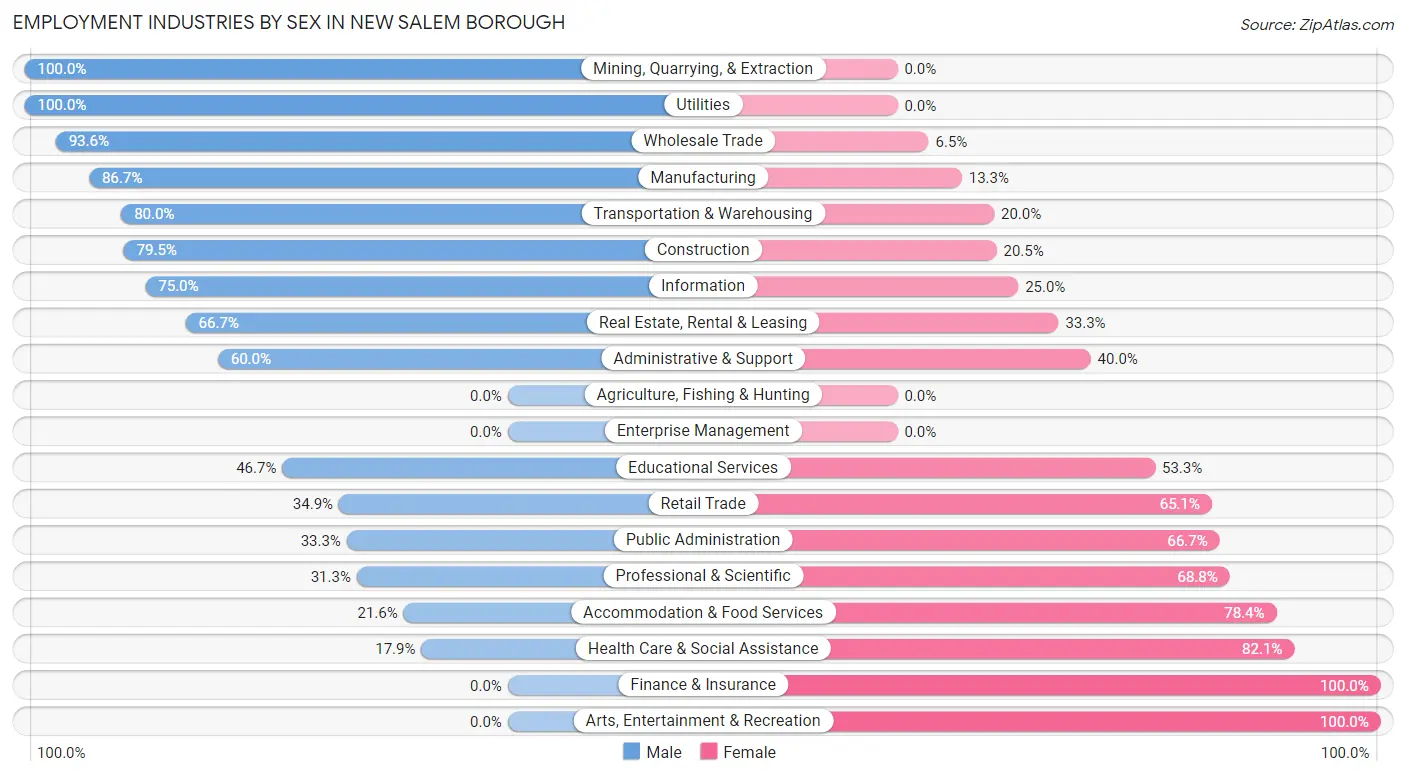
Employment Industries by Sex in New Salem borough
The New Salem borough industries that see more men than women are Mining, Quarrying, & Extraction (100.0%), Utilities (100.0%), and Wholesale Trade (93.5%), whereas the industries that tend to have a higher number of women are Finance & Insurance (100.0%), Arts, Entertainment & Recreation (100.0%), and Health Care & Social Assistance (82.1%).
| Industry | Male | Female |
| Agriculture, Fishing & Hunting | 0 (0.0%) | 0 (0.0%) |
| Mining, Quarrying, & Extraction | 2 (100.0%) | 0 (0.0%) |
| Construction | 31 (79.5%) | 8 (20.5%) |
| Manufacturing | 78 (86.7%) | 12 (13.3%) |
| Wholesale Trade | 29 (93.5%) | 2 (6.5%) |
| Retail Trade | 29 (34.9%) | 54 (65.1%) |
| Transportation & Warehousing | 40 (80.0%) | 10 (20.0%) |
| Utilities | 2 (100.0%) | 0 (0.0%) |
| Information | 3 (75.0%) | 1 (25.0%) |
| Finance & Insurance | 0 (0.0%) | 8 (100.0%) |
| Real Estate, Rental & Leasing | 8 (66.7%) | 4 (33.3%) |
| Professional & Scientific | 5 (31.2%) | 11 (68.8%) |
| Enterprise Management | 0 (0.0%) | 0 (0.0%) |
| Administrative & Support | 3 (60.0%) | 2 (40.0%) |
| Educational Services | 14 (46.7%) | 16 (53.3%) |
| Health Care & Social Assistance | 22 (17.9%) | 101 (82.1%) |
| Arts, Entertainment & Recreation | 0 (0.0%) | 6 (100.0%) |
| Accommodation & Food Services | 11 (21.6%) | 40 (78.4%) |
| Public Administration | 1 (33.3%) | 2 (66.7%) |
| Total | 284 (50.4%) | 279 (49.6%) |
Education in New Salem borough
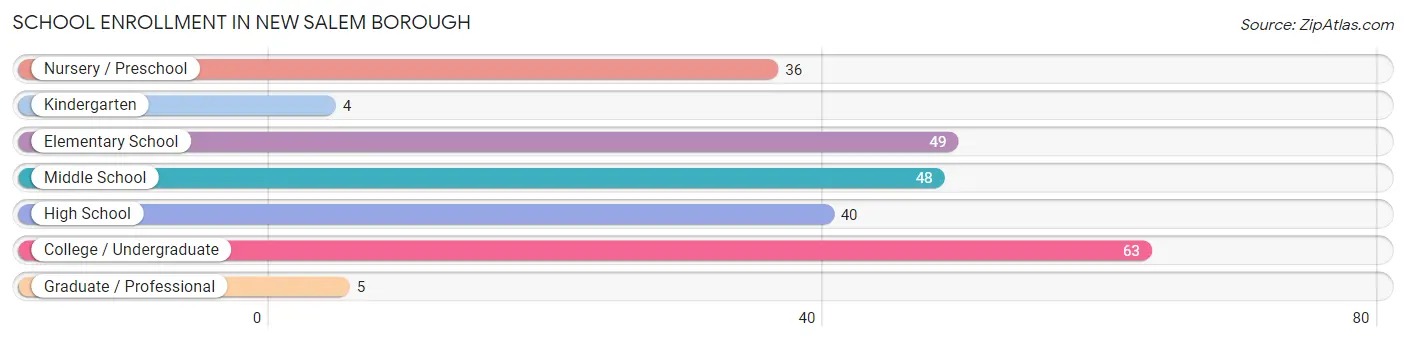
School Enrollment in New Salem borough
The most common levels of schooling among the 245 students in New Salem borough are college / undergraduate (63 | 25.7%), elementary school (49 | 20.0%), and middle school (48 | 19.6%).
| School Level | # Students | % Students |
| Nursery / Preschool | 36 | 14.7% |
| Kindergarten | 4 | 1.6% |
| Elementary School | 49 | 20.0% |
| Middle School | 48 | 19.6% |
| High School | 40 | 16.3% |
| College / Undergraduate | 63 | 25.7% |
| Graduate / Professional | 5 | 2.0% |
| Total | 245 | 100.0% |
School Enrollment by Age by Funding Source in New Salem borough
Out of a total of 245 students who are enrolled in schools in New Salem borough, 70 (28.6%) attend a private institution, while the remaining 175 (71.4%) are enrolled in public schools. The age group of 3 to 4 year olds has the highest likelihood of being enrolled in private schools, with 29 (93.5% in the age bracket) enrolled. Conversely, the age group of 10 to 14 year olds has the lowest likelihood of being enrolled in a private school, with 52 (100.0% in the age bracket) attending a public institution.
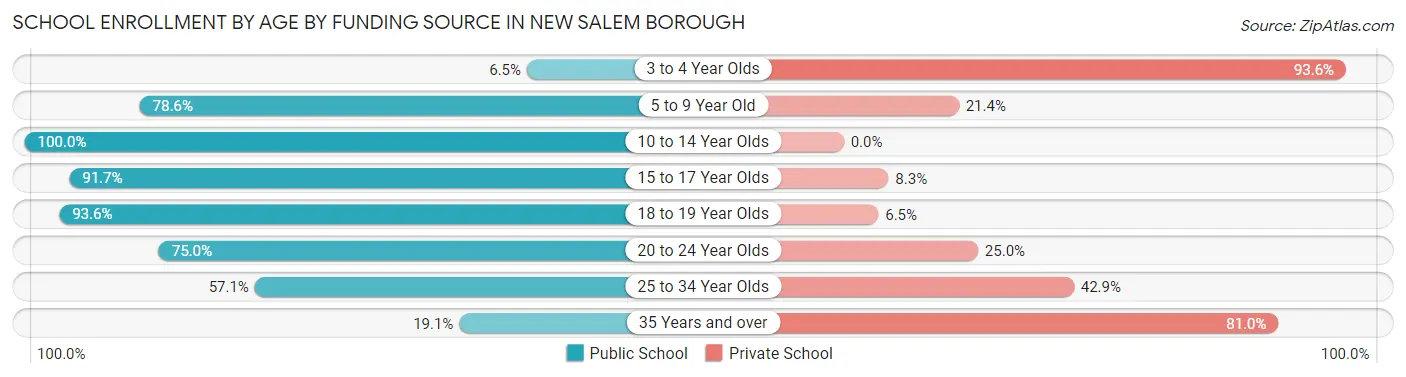
| Age Bracket | Public School | Private School |
| 3 to 4 Year Olds | 2 (6.5%) | 29 (93.5%) |
| 5 to 9 Year Old | 44 (78.6%) | 12 (21.4%) |
| 10 to 14 Year Olds | 52 (100.0%) | 0 (0.0%) |
| 15 to 17 Year Olds | 33 (91.7%) | 3 (8.3%) |
| 18 to 19 Year Olds | 29 (93.5%) | 2 (6.5%) |
| 20 to 24 Year Olds | 3 (75.0%) | 1 (25.0%) |
| 25 to 34 Year Olds | 8 (57.1%) | 6 (42.9%) |
| 35 Years and over | 4 (19.1%) | 17 (80.9%) |
| Total | 175 (71.4%) | 70 (28.6%) |
Educational Attainment by Field of Study in New Salem borough
Science & technology (38 | 23.3%), education (25 | 15.3%), arts & humanities (18 | 11.0%), business (17 | 10.4%), and psychology (11 | 6.8%) are the most common fields of study among 163 individuals in New Salem borough who have obtained a bachelor's degree or higher.
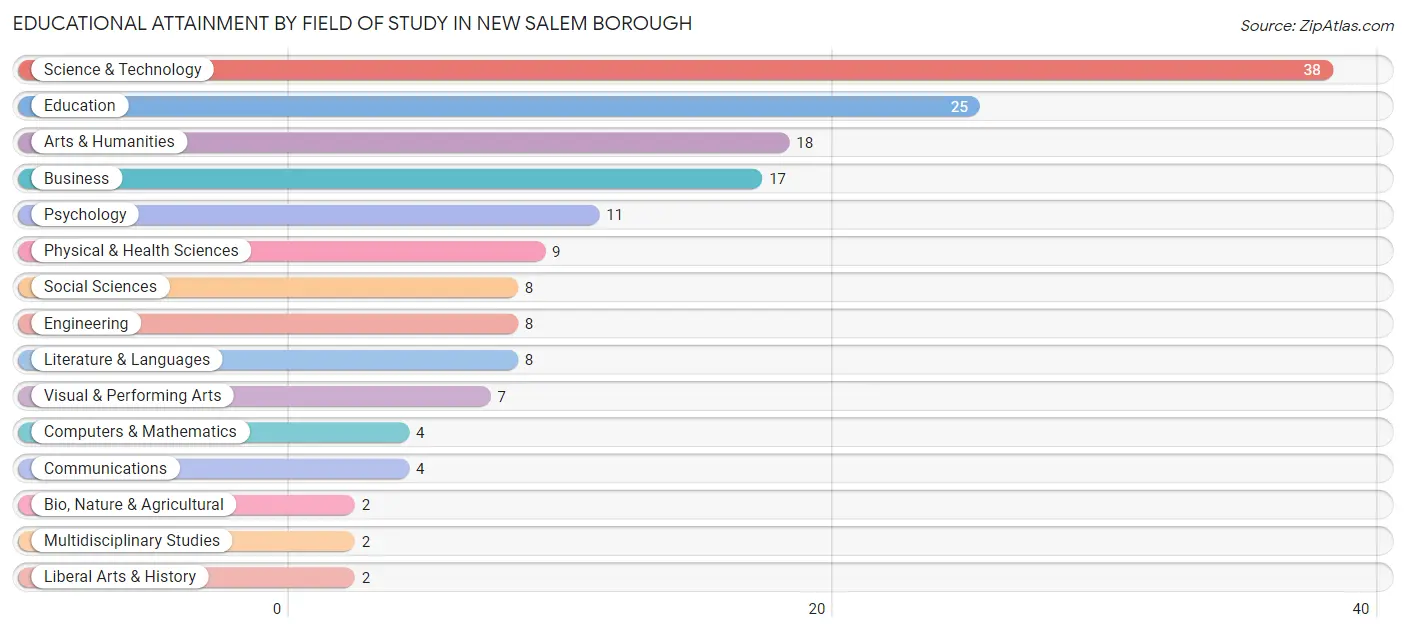
| Field of Study | # Graduates | % Graduates |
| Computers & Mathematics | 4 | 2.5% |
| Bio, Nature & Agricultural | 2 | 1.2% |
| Physical & Health Sciences | 9 | 5.5% |
| Psychology | 11 | 6.8% |
| Social Sciences | 8 | 4.9% |
| Engineering | 8 | 4.9% |
| Multidisciplinary Studies | 2 | 1.2% |
| Science & Technology | 38 | 23.3% |
| Business | 17 | 10.4% |
| Education | 25 | 15.3% |
| Literature & Languages | 8 | 4.9% |
| Liberal Arts & History | 2 | 1.2% |
| Visual & Performing Arts | 7 | 4.3% |
| Communications | 4 | 2.5% |
| Arts & Humanities | 18 | 11.0% |
| Total | 163 | 100.0% |
Transportation & Commute in New Salem borough
Vehicle Availability by Sex in New Salem borough
The most prevalent vehicle ownership categories in New Salem borough are males with 2 vehicles (111, accounting for 39.6%) and females with 2 vehicles (95, making up 54.1%).
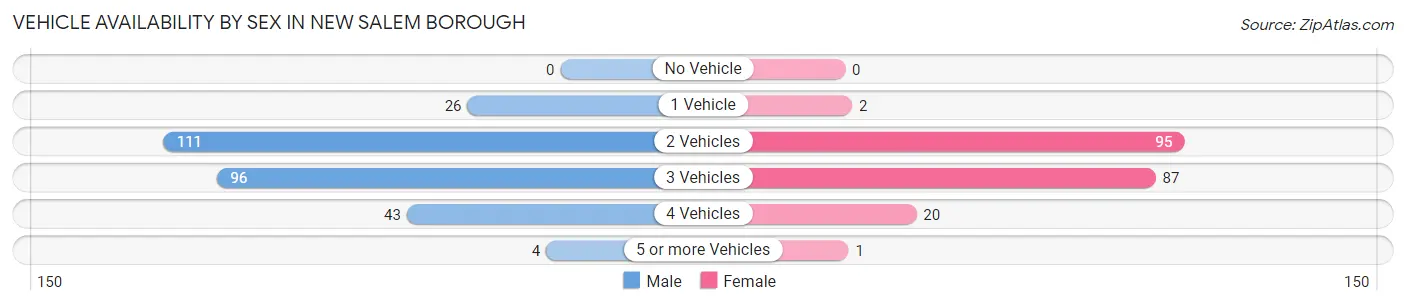
| Vehicles Available | Male | Female |
| No Vehicle | 0 (0.0%) | 0 (0.0%) |
| 1 Vehicle | 26 (9.3%) | 2 (1.0%) |
| 2 Vehicles | 111 (39.6%) | 95 (46.3%) |
| 3 Vehicles | 96 (34.3%) | 87 (42.4%) |
| 4 Vehicles | 43 (15.4%) | 20 (9.8%) |
| 5 or more Vehicles | 4 (1.4%) | 1 (0.5%) |
| Total | 280 (100.0%) | 205 (100.0%) |
Commute Time in New Salem borough
The most frequently occuring commute durations in New Salem borough are 15 to 19 minutes (149 commuters, 32.5%), 10 to 14 minutes (79 commuters, 17.2%), and 20 to 24 minutes (68 commuters, 14.8%).
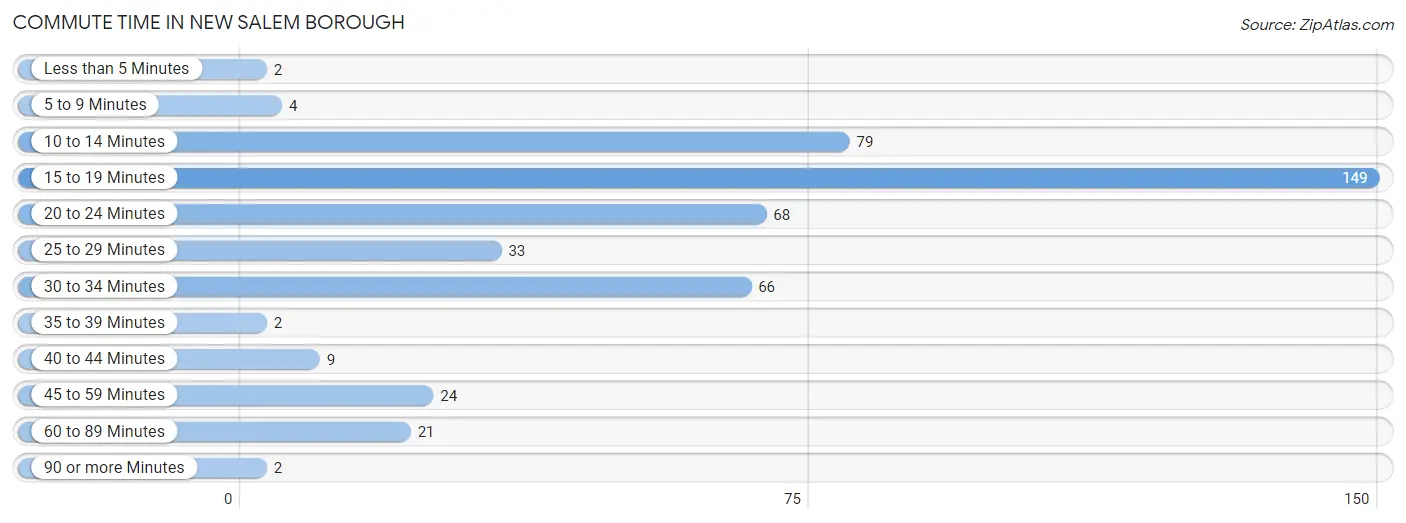
| Commute Time | # Commuters | % Commuters |
| Less than 5 Minutes | 2 | 0.4% |
| 5 to 9 Minutes | 4 | 0.9% |
| 10 to 14 Minutes | 79 | 17.2% |
| 15 to 19 Minutes | 149 | 32.5% |
| 20 to 24 Minutes | 68 | 14.8% |
| 25 to 29 Minutes | 33 | 7.2% |
| 30 to 34 Minutes | 66 | 14.4% |
| 35 to 39 Minutes | 2 | 0.4% |
| 40 to 44 Minutes | 9 | 2.0% |
| 45 to 59 Minutes | 24 | 5.2% |
| 60 to 89 Minutes | 21 | 4.6% |
| 90 or more Minutes | 2 | 0.4% |
Commute Time by Sex in New Salem borough
The most common commute times in New Salem borough are 15 to 19 minutes (74 commuters, 28.3%) for males and 15 to 19 minutes (75 commuters, 37.9%) for females.
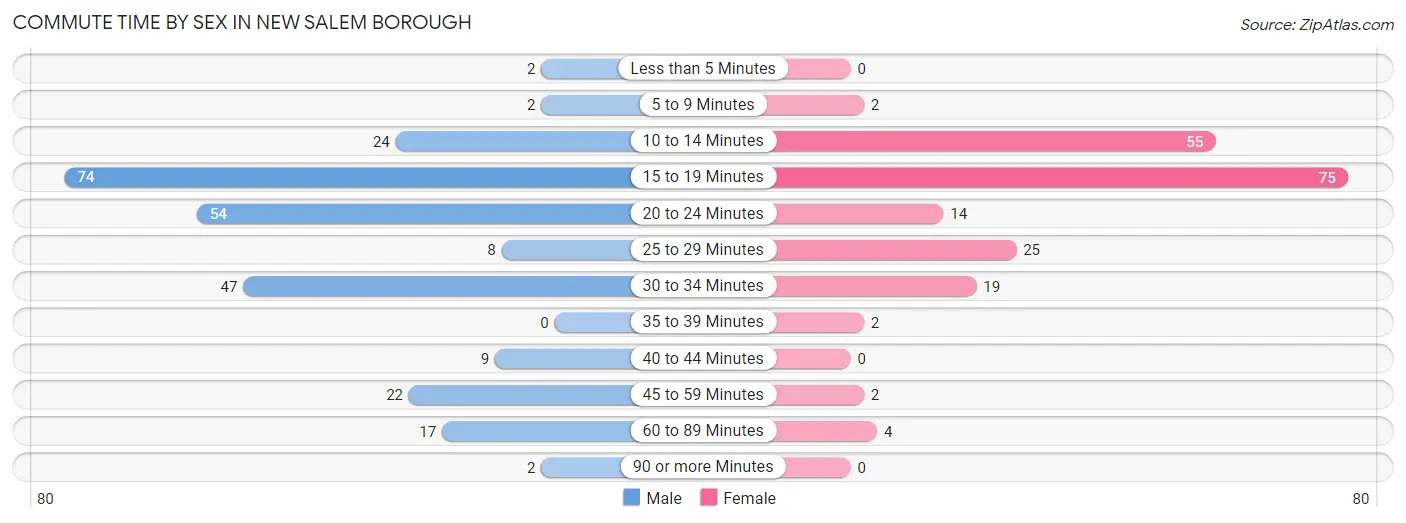
| Commute Time | Male | Female |
| Less than 5 Minutes | 2 (0.8%) | 0 (0.0%) |
| 5 to 9 Minutes | 2 (0.8%) | 2 (1.0%) |
| 10 to 14 Minutes | 24 (9.2%) | 55 (27.8%) |
| 15 to 19 Minutes | 74 (28.3%) | 75 (37.9%) |
| 20 to 24 Minutes | 54 (20.7%) | 14 (7.1%) |
| 25 to 29 Minutes | 8 (3.1%) | 25 (12.6%) |
| 30 to 34 Minutes | 47 (18.0%) | 19 (9.6%) |
| 35 to 39 Minutes | 0 (0.0%) | 2 (1.0%) |
| 40 to 44 Minutes | 9 (3.5%) | 0 (0.0%) |
| 45 to 59 Minutes | 22 (8.4%) | 2 (1.0%) |
| 60 to 89 Minutes | 17 (6.5%) | 4 (2.0%) |
| 90 or more Minutes | 2 (0.8%) | 0 (0.0%) |
Time of Departure to Work by Sex in New Salem borough
The most frequent times of departure to work in New Salem borough are 4:00 PM to 11:59 PM (57, 21.8%) for males and 8:00 AM to 8:29 AM (45, 22.7%) for females.
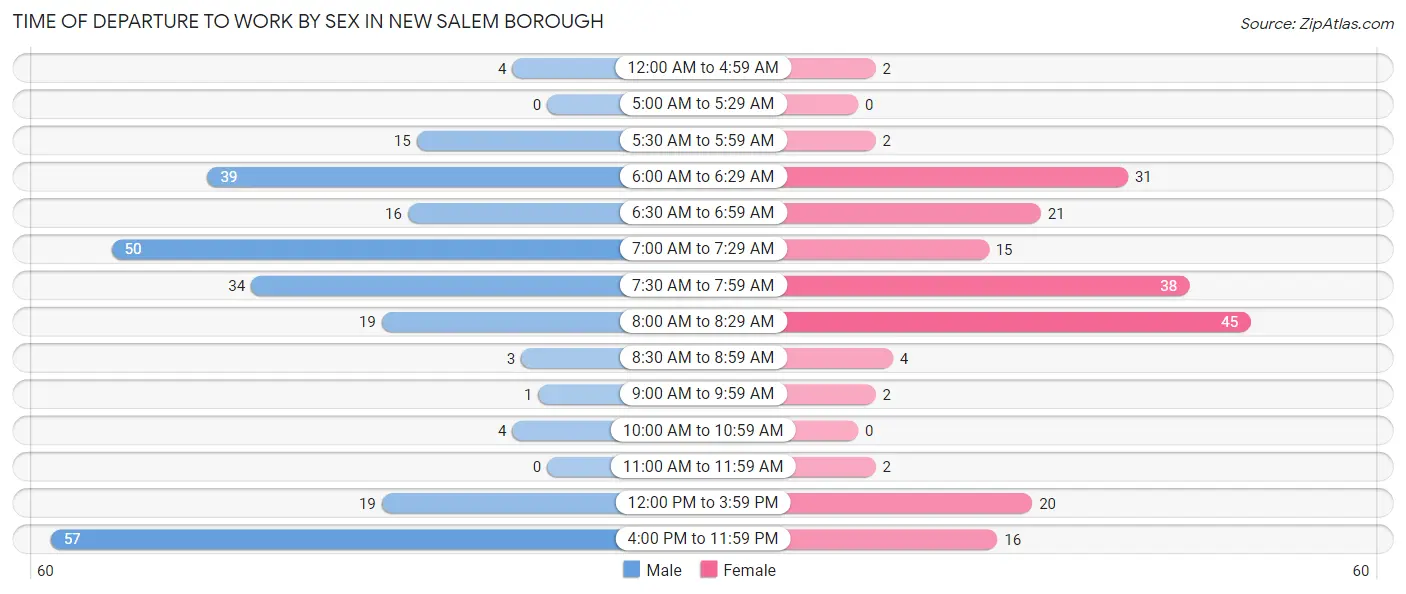
| Time of Departure | Male | Female |
| 12:00 AM to 4:59 AM | 4 (1.5%) | 2 (1.0%) |
| 5:00 AM to 5:29 AM | 0 (0.0%) | 0 (0.0%) |
| 5:30 AM to 5:59 AM | 15 (5.8%) | 2 (1.0%) |
| 6:00 AM to 6:29 AM | 39 (14.9%) | 31 (15.7%) |
| 6:30 AM to 6:59 AM | 16 (6.1%) | 21 (10.6%) |
| 7:00 AM to 7:29 AM | 50 (19.2%) | 15 (7.6%) |
| 7:30 AM to 7:59 AM | 34 (13.0%) | 38 (19.2%) |
| 8:00 AM to 8:29 AM | 19 (7.3%) | 45 (22.7%) |
| 8:30 AM to 8:59 AM | 3 (1.1%) | 4 (2.0%) |
| 9:00 AM to 9:59 AM | 1 (0.4%) | 2 (1.0%) |
| 10:00 AM to 10:59 AM | 4 (1.5%) | 0 (0.0%) |
| 11:00 AM to 11:59 AM | 0 (0.0%) | 2 (1.0%) |
| 12:00 PM to 3:59 PM | 19 (7.3%) | 20 (10.1%) |
| 4:00 PM to 11:59 PM | 57 (21.8%) | 16 (8.1%) |
| Total | 261 (100.0%) | 198 (100.0%) |
Housing Occupancy in New Salem borough
Occupancy by Ownership in New Salem borough
Of the total 375 dwellings in New Salem borough, owner-occupied units account for 361 (96.3%), while renter-occupied units make up 14 (3.7%).
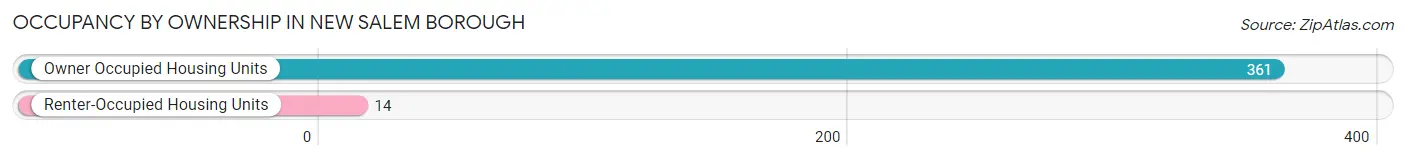
| Occupancy | # Housing Units | % Housing Units |
| Owner Occupied Housing Units | 361 | 96.3% |
| Renter-Occupied Housing Units | 14 | 3.7% |
| Total Occupied Housing Units | 375 | 100.0% |
Occupancy by Household Size in New Salem borough
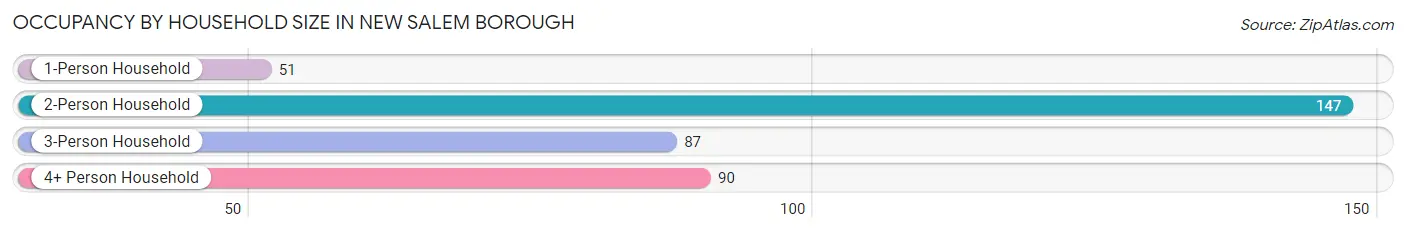
| Household Size | # Housing Units | % Housing Units |
| 1-Person Household | 51 | 13.6% |
| 2-Person Household | 147 | 39.2% |
| 3-Person Household | 87 | 23.2% |
| 4+ Person Household | 90 | 24.0% |
| Total Housing Units | 375 | 100.0% |
Occupancy by Ownership by Household Size in New Salem borough
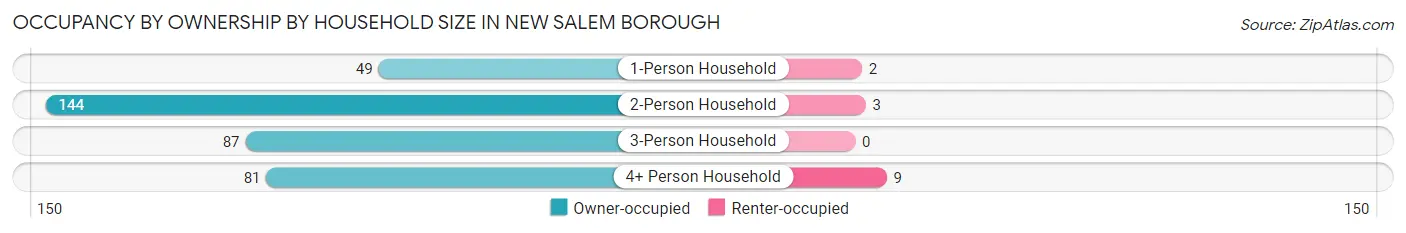
| Household Size | Owner-occupied | Renter-occupied |
| 1-Person Household | 49 (96.1%) | 2 (3.9%) |
| 2-Person Household | 144 (98.0%) | 3 (2.0%) |
| 3-Person Household | 87 (100.0%) | 0 (0.0%) |
| 4+ Person Household | 81 (90.0%) | 9 (10.0%) |
| Total Housing Units | 361 (96.3%) | 14 (3.7%) |
Occupancy by Educational Attainment in New Salem borough
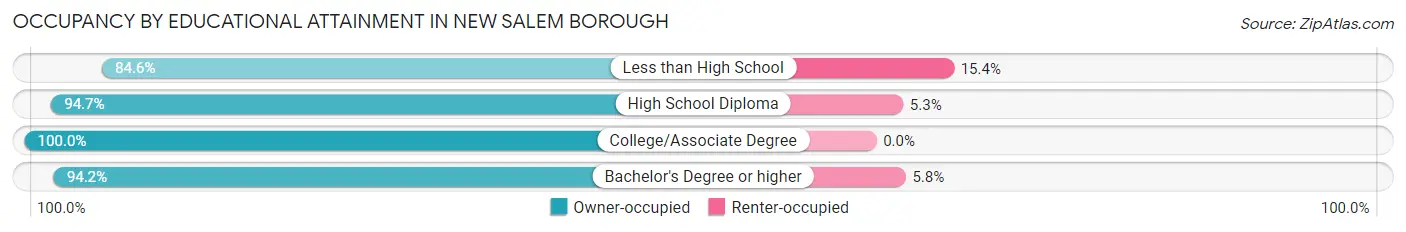
| Household Size | Owner-occupied | Renter-occupied |
| Less than High School | 11 (84.6%) | 2 (15.4%) |
| High School Diploma | 125 (94.7%) | 7 (5.3%) |
| College/Associate Degree | 144 (100.0%) | 0 (0.0%) |
| Bachelor's Degree or higher | 81 (94.2%) | 5 (5.8%) |
Occupancy by Age of Householder in New Salem borough
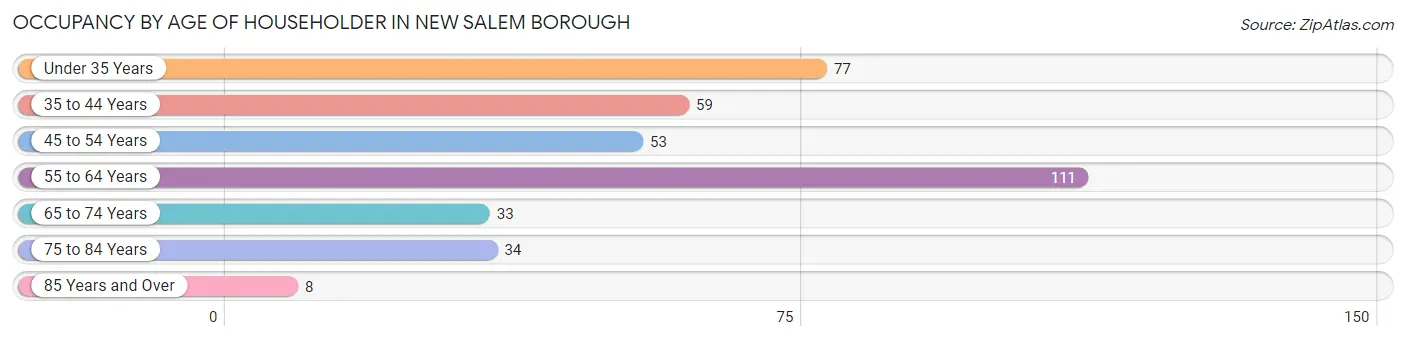
| Age Bracket | # Households | % Households |
| Under 35 Years | 77 | 20.5% |
| 35 to 44 Years | 59 | 15.7% |
| 45 to 54 Years | 53 | 14.1% |
| 55 to 64 Years | 111 | 29.6% |
| 65 to 74 Years | 33 | 8.8% |
| 75 to 84 Years | 34 | 9.1% |
| 85 Years and Over | 8 | 2.1% |
| Total | 375 | 100.0% |
Housing Finances in New Salem borough
Median Income by Occupancy in New Salem borough
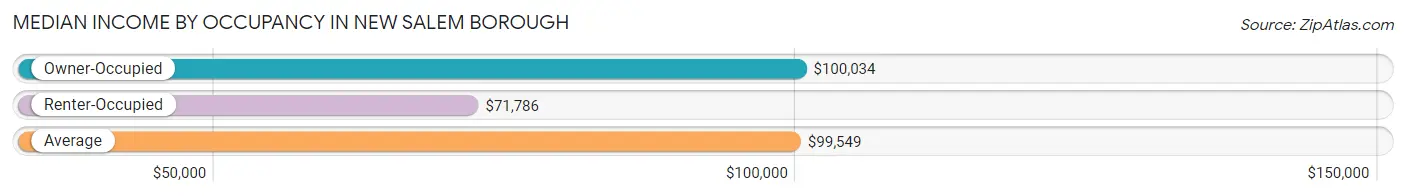
| Occupancy Type | # Households | Median Income |
| Owner-Occupied | 361 (96.3%) | $100,034 |
| Renter-Occupied | 14 (3.7%) | $71,786 |
| Average | 375 (100.0%) | $99,549 |
Occupancy by Householder Income Bracket in New Salem borough
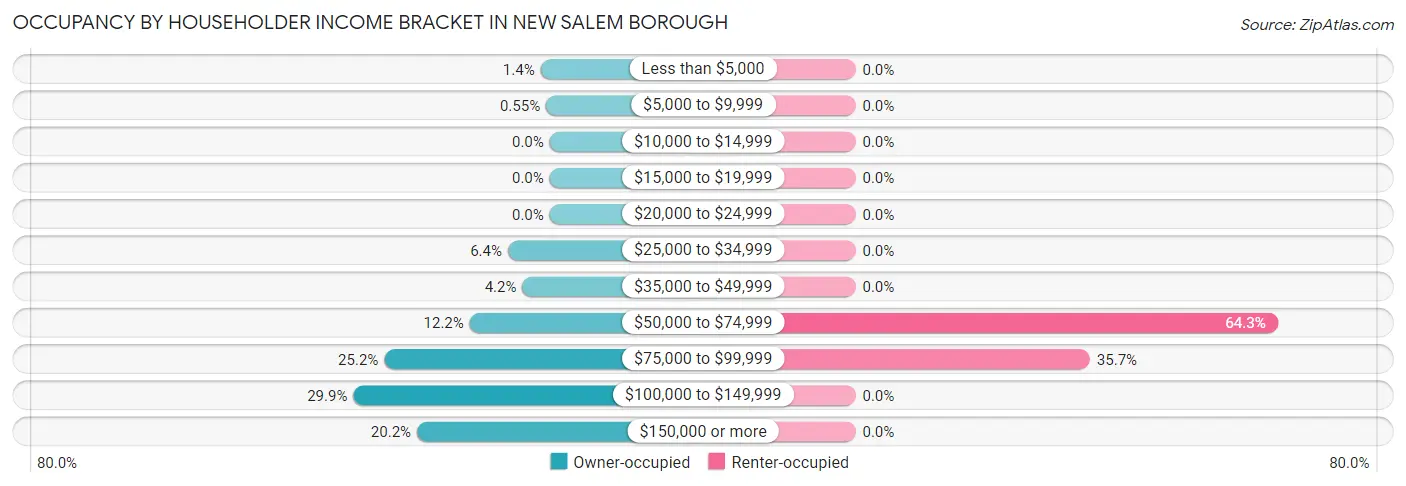
| Income Bracket | Owner-occupied | Renter-occupied |
| Less than $5,000 | 5 (1.4%) | 0 (0.0%) |
| $5,000 to $9,999 | 2 (0.5%) | 0 (0.0%) |
| $10,000 to $14,999 | 0 (0.0%) | 0 (0.0%) |
| $15,000 to $19,999 | 0 (0.0%) | 0 (0.0%) |
| $20,000 to $24,999 | 0 (0.0%) | 0 (0.0%) |
| $25,000 to $34,999 | 23 (6.4%) | 0 (0.0%) |
| $35,000 to $49,999 | 15 (4.2%) | 0 (0.0%) |
| $50,000 to $74,999 | 44 (12.2%) | 9 (64.3%) |
| $75,000 to $99,999 | 91 (25.2%) | 5 (35.7%) |
| $100,000 to $149,999 | 108 (29.9%) | 0 (0.0%) |
| $150,000 or more | 73 (20.2%) | 0 (0.0%) |
| Total | 361 (100.0%) | 14 (100.0%) |
Monthly Housing Cost Tiers in New Salem borough
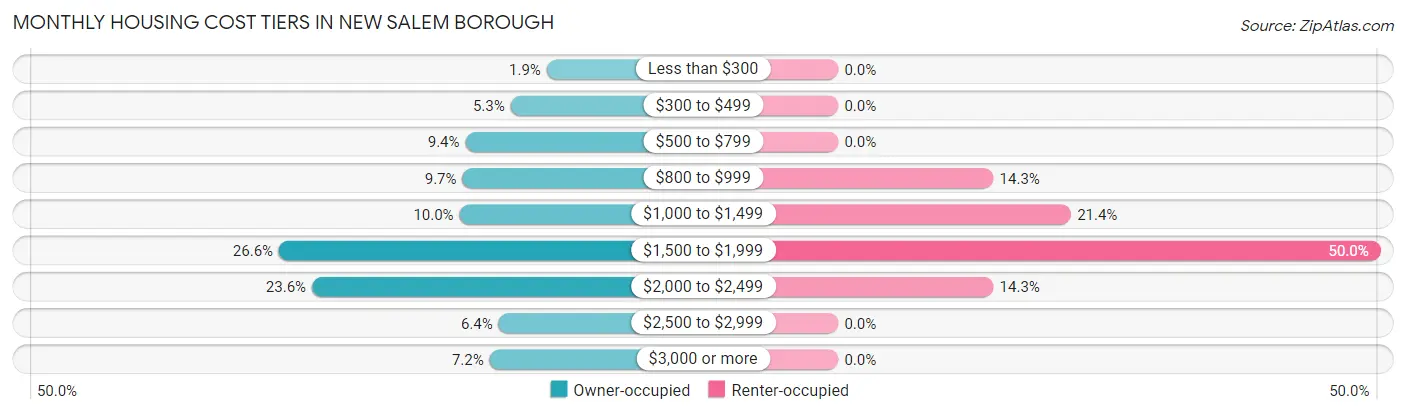
| Monthly Cost | Owner-occupied | Renter-occupied |
| Less than $300 | 7 (1.9%) | 0 (0.0%) |
| $300 to $499 | 19 (5.3%) | 0 (0.0%) |
| $500 to $799 | 34 (9.4%) | 0 (0.0%) |
| $800 to $999 | 35 (9.7%) | 2 (14.3%) |
| $1,000 to $1,499 | 36 (10.0%) | 3 (21.4%) |
| $1,500 to $1,999 | 96 (26.6%) | 7 (50.0%) |
| $2,000 to $2,499 | 85 (23.5%) | 2 (14.3%) |
| $2,500 to $2,999 | 23 (6.4%) | 0 (0.0%) |
| $3,000 or more | 26 (7.2%) | 0 (0.0%) |
| Total | 361 (100.0%) | 14 (100.0%) |
Physical Housing Characteristics in New Salem borough
Housing Structures in New Salem borough
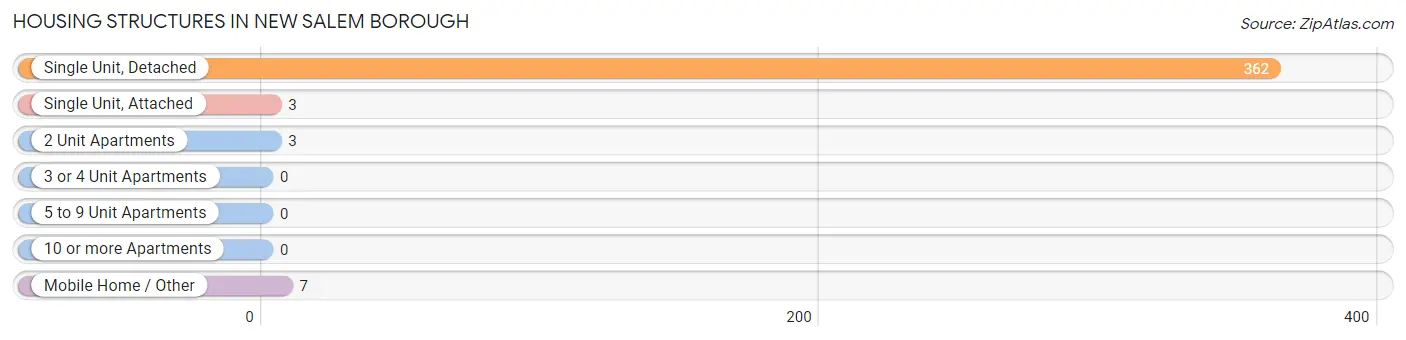
| Structure Type | # Housing Units | % Housing Units |
| Single Unit, Detached | 362 | 96.5% |
| Single Unit, Attached | 3 | 0.8% |
| 2 Unit Apartments | 3 | 0.8% |
| 3 or 4 Unit Apartments | 0 | 0.0% |
| 5 to 9 Unit Apartments | 0 | 0.0% |
| 10 or more Apartments | 0 | 0.0% |
| Mobile Home / Other | 7 | 1.9% |
| Total | 375 | 100.0% |
Housing Structures by Occupancy in New Salem borough
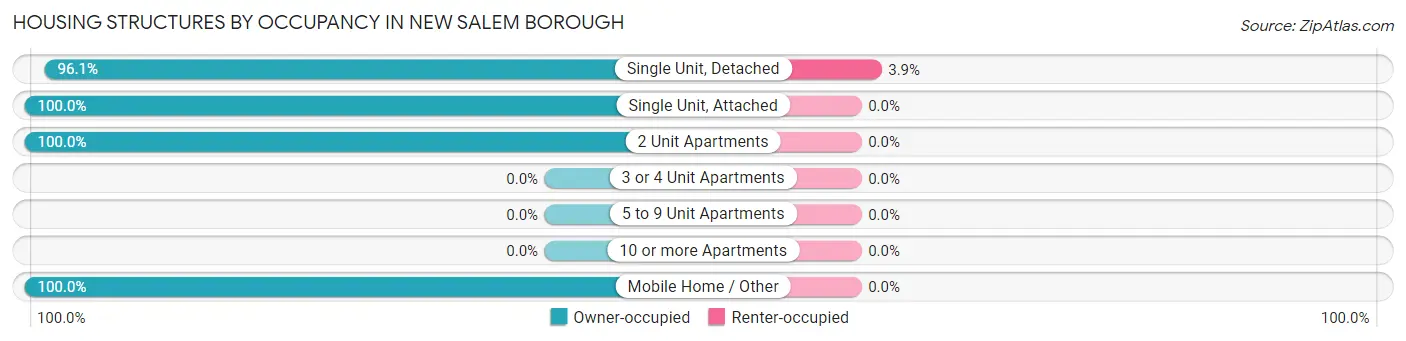
| Structure Type | Owner-occupied | Renter-occupied |
| Single Unit, Detached | 348 (96.1%) | 14 (3.9%) |
| Single Unit, Attached | 3 (100.0%) | 0 (0.0%) |
| 2 Unit Apartments | 3 (100.0%) | 0 (0.0%) |
| 3 or 4 Unit Apartments | 0 (0.0%) | 0 (0.0%) |
| 5 to 9 Unit Apartments | 0 (0.0%) | 0 (0.0%) |
| 10 or more Apartments | 0 (0.0%) | 0 (0.0%) |
| Mobile Home / Other | 7 (100.0%) | 0 (0.0%) |
| Total | 361 (96.3%) | 14 (3.7%) |
Housing Structures by Number of Rooms in New Salem borough
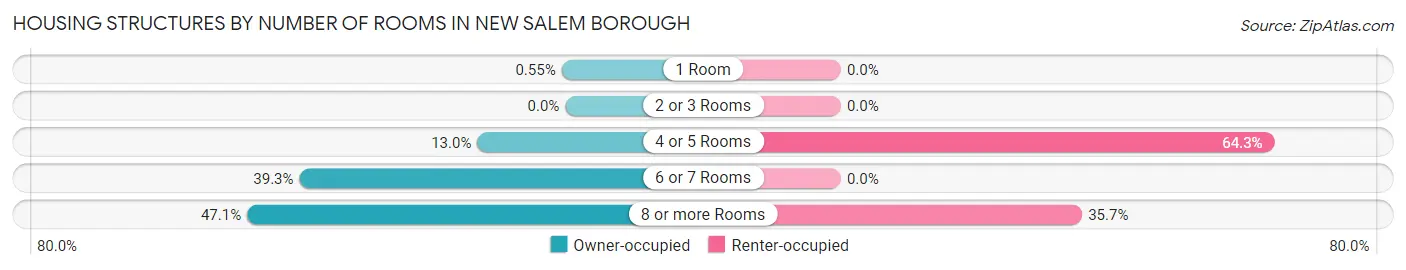
| Number of Rooms | Owner-occupied | Renter-occupied |
| 1 Room | 2 (0.5%) | 0 (0.0%) |
| 2 or 3 Rooms | 0 (0.0%) | 0 (0.0%) |
| 4 or 5 Rooms | 47 (13.0%) | 9 (64.3%) |
| 6 or 7 Rooms | 142 (39.3%) | 0 (0.0%) |
| 8 or more Rooms | 170 (47.1%) | 5 (35.7%) |
| Total | 361 (100.0%) | 14 (100.0%) |
Housing Structure by Heating Type in New Salem borough
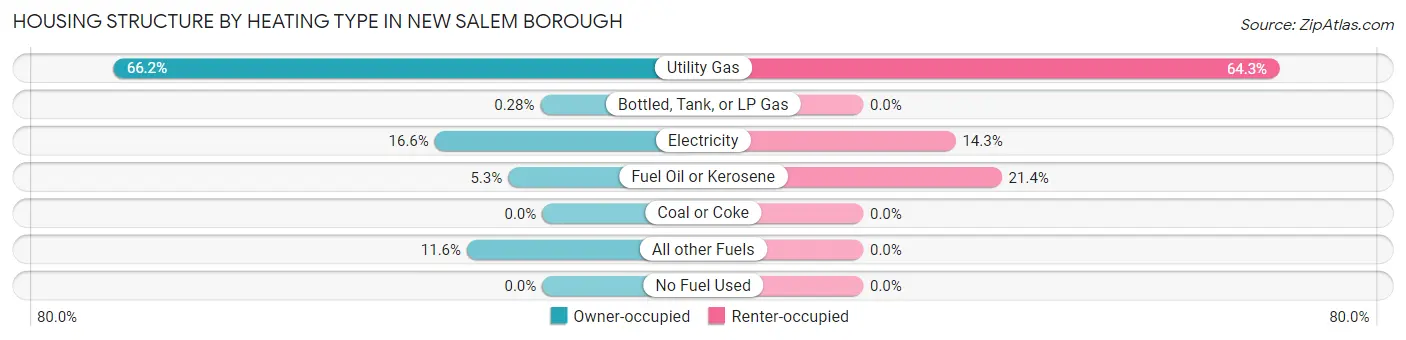
| Heating Type | Owner-occupied | Renter-occupied |
| Utility Gas | 239 (66.2%) | 9 (64.3%) |
| Bottled, Tank, or LP Gas | 1 (0.3%) | 0 (0.0%) |
| Electricity | 60 (16.6%) | 2 (14.3%) |
| Fuel Oil or Kerosene | 19 (5.3%) | 3 (21.4%) |
| Coal or Coke | 0 (0.0%) | 0 (0.0%) |
| All other Fuels | 42 (11.6%) | 0 (0.0%) |
| No Fuel Used | 0 (0.0%) | 0 (0.0%) |
| Total | 361 (100.0%) | 14 (100.0%) |
Household Vehicle Usage in New Salem borough
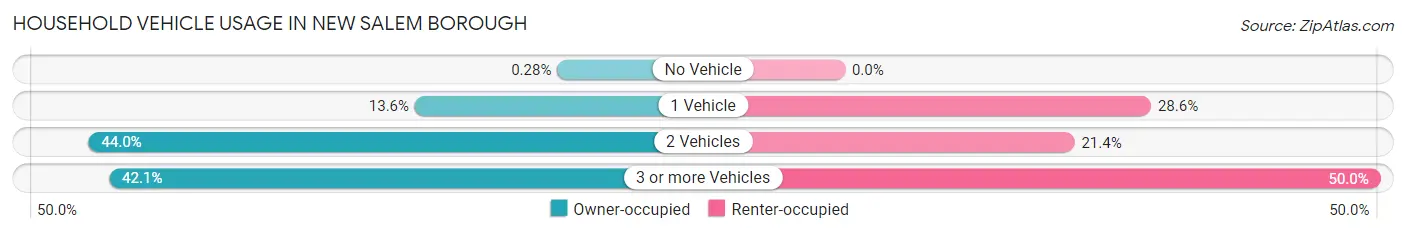
| Vehicles per Household | Owner-occupied | Renter-occupied |
| No Vehicle | 1 (0.3%) | 0 (0.0%) |
| 1 Vehicle | 49 (13.6%) | 4 (28.6%) |
| 2 Vehicles | 159 (44.0%) | 3 (21.4%) |
| 3 or more Vehicles | 152 (42.1%) | 7 (50.0%) |
| Total | 361 (100.0%) | 14 (100.0%) |
Real Estate & Mortgages in New Salem borough
Real Estate and Mortgage Overview in New Salem borough
| Characteristic | Without Mortgage | With Mortgage |
| Housing Units | 90 | 271 |
| Median Property Value | $222,200 | $232,500 |
| Median Household Income | $59,444 | $56 |
| Monthly Housing Costs | $658 | $26 |
| Real Estate Taxes | $4,000 | $3 |
Property Value by Mortgage Status in New Salem borough
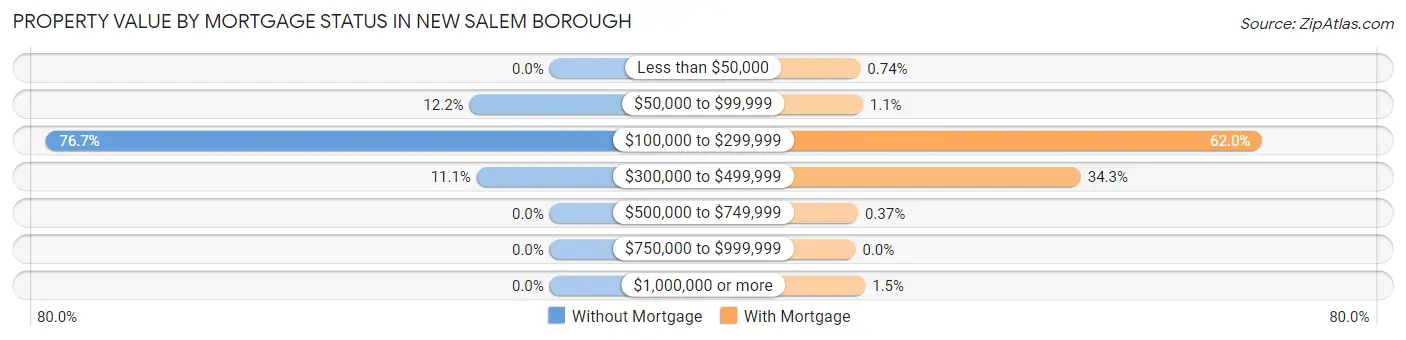
| Property Value | Without Mortgage | With Mortgage |
| Less than $50,000 | 0 (0.0%) | 2 (0.7%) |
| $50,000 to $99,999 | 11 (12.2%) | 3 (1.1%) |
| $100,000 to $299,999 | 69 (76.7%) | 168 (62.0%) |
| $300,000 to $499,999 | 10 (11.1%) | 93 (34.3%) |
| $500,000 to $749,999 | 0 (0.0%) | 1 (0.4%) |
| $750,000 to $999,999 | 0 (0.0%) | 0 (0.0%) |
| $1,000,000 or more | 0 (0.0%) | 4 (1.5%) |
| Total | 90 (100.0%) | 271 (100.0%) |
Household Income by Mortgage Status in New Salem borough
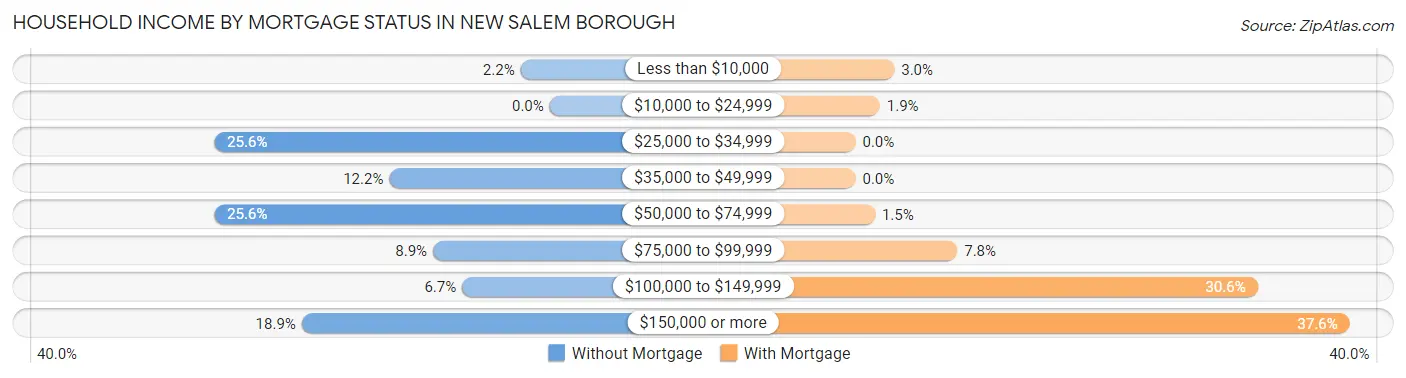
| Household Income | Without Mortgage | With Mortgage |
| Less than $10,000 | 2 (2.2%) | 8 (2.9%) |
| $10,000 to $24,999 | 0 (0.0%) | 5 (1.8%) |
| $25,000 to $34,999 | 23 (25.6%) | 0 (0.0%) |
| $35,000 to $49,999 | 11 (12.2%) | 0 (0.0%) |
| $50,000 to $74,999 | 23 (25.6%) | 4 (1.5%) |
| $75,000 to $99,999 | 8 (8.9%) | 21 (7.7%) |
| $100,000 to $149,999 | 6 (6.7%) | 83 (30.6%) |
| $150,000 or more | 17 (18.9%) | 102 (37.6%) |
| Total | 90 (100.0%) | 271 (100.0%) |
Property Value to Household Income Ratio in New Salem borough
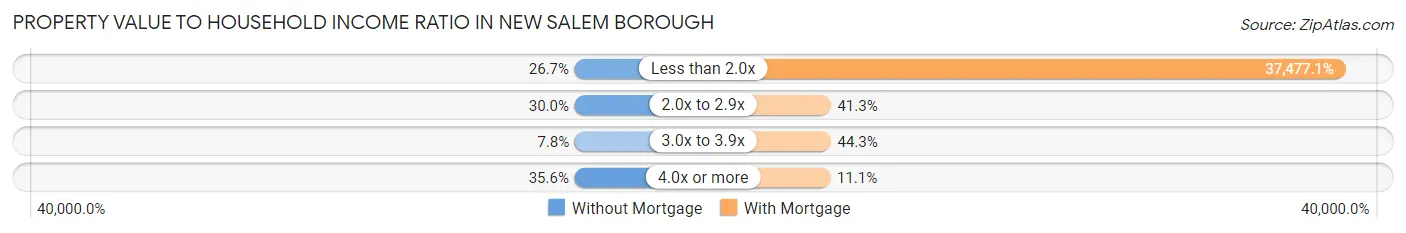
| Value-to-Income Ratio | Without Mortgage | With Mortgage |
| Less than 2.0x | 24 (26.7%) | 101,563 (37,477.1%) |
| 2.0x to 2.9x | 27 (30.0%) | 112 (41.3%) |
| 3.0x to 3.9x | 7 (7.8%) | 120 (44.3%) |
| 4.0x or more | 32 (35.6%) | 30 (11.1%) |
| Total | 90 (100.0%) | 271 (100.0%) |
Real Estate Taxes by Mortgage Status in New Salem borough
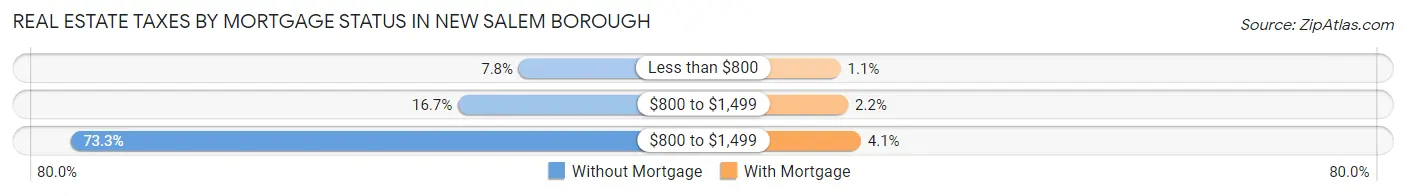
| Property Taxes | Without Mortgage | With Mortgage |
| Less than $800 | 7 (7.8%) | 3 (1.1%) |
| $800 to $1,499 | 15 (16.7%) | 6 (2.2%) |
| $800 to $1,499 | 66 (73.3%) | 11 (4.1%) |
| Total | 90 (100.0%) | 271 (100.0%) |
Health & Disability in New Salem borough
Health Insurance Coverage by Age in New Salem borough
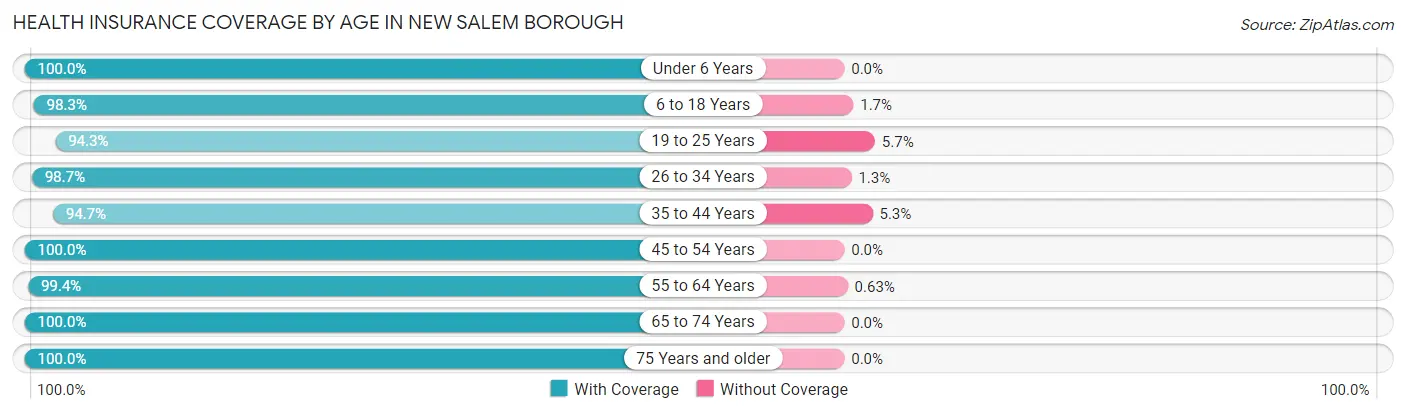
| Age Bracket | With Coverage | Without Coverage |
| Under 6 Years | 95 (100.0%) | 0 (0.0%) |
| 6 to 18 Years | 176 (98.3%) | 3 (1.7%) |
| 19 to 25 Years | 33 (94.3%) | 2 (5.7%) |
| 26 to 34 Years | 147 (98.7%) | 2 (1.3%) |
| 35 to 44 Years | 126 (94.7%) | 7 (5.3%) |
| 45 to 54 Years | 118 (100.0%) | 0 (0.0%) |
| 55 to 64 Years | 157 (99.4%) | 1 (0.6%) |
| 65 to 74 Years | 61 (100.0%) | 0 (0.0%) |
| 75 Years and older | 63 (100.0%) | 0 (0.0%) |
| Total | 976 (98.5%) | 15 (1.5%) |
Health Insurance Coverage by Citizenship Status in New Salem borough
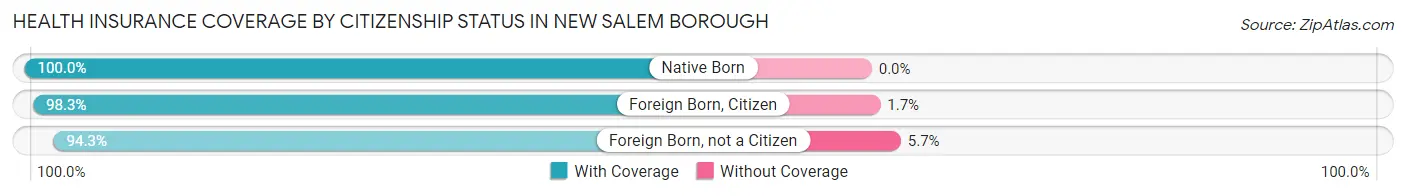
| Citizenship Status | With Coverage | Without Coverage |
| Native Born | 95 (100.0%) | 0 (0.0%) |
| Foreign Born, Citizen | 176 (98.3%) | 3 (1.7%) |
| Foreign Born, not a Citizen | 33 (94.3%) | 2 (5.7%) |
Health Insurance Coverage by Household Income in New Salem borough
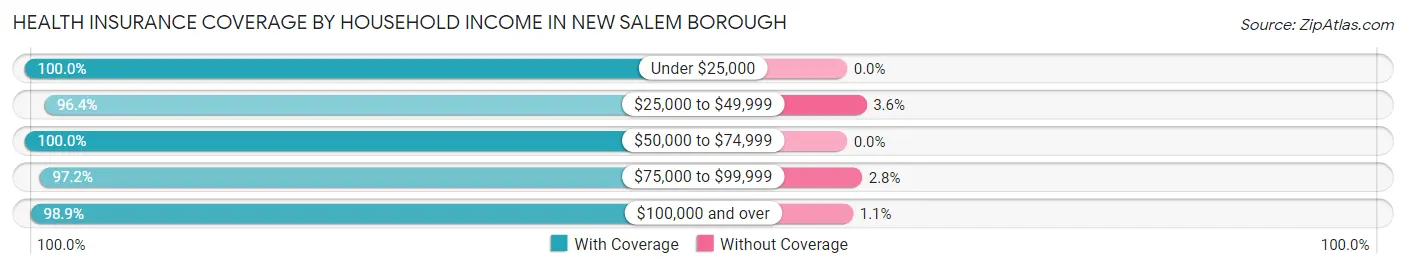
| Household Income | With Coverage | Without Coverage |
| Under $25,000 | 15 (100.0%) | 0 (0.0%) |
| $25,000 to $49,999 | 53 (96.4%) | 2 (3.6%) |
| $50,000 to $74,999 | 134 (100.0%) | 0 (0.0%) |
| $75,000 to $99,999 | 242 (97.2%) | 7 (2.8%) |
| $100,000 and over | 532 (98.9%) | 6 (1.1%) |
Public vs Private Health Insurance Coverage by Age in New Salem borough
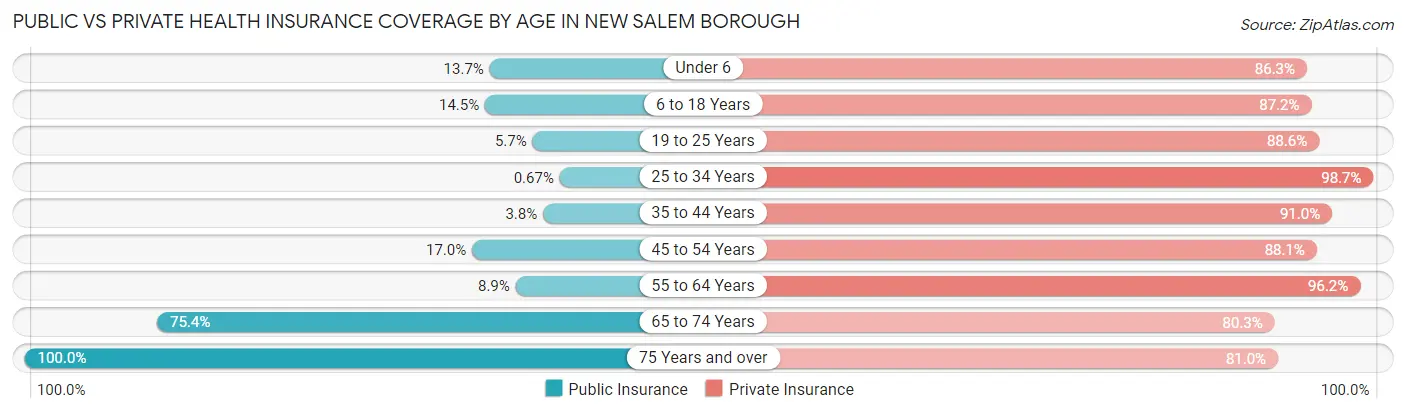
| Age Bracket | Public Insurance | Private Insurance |
| Under 6 | 13 (13.7%) | 82 (86.3%) |
| 6 to 18 Years | 26 (14.5%) | 156 (87.2%) |
| 19 to 25 Years | 2 (5.7%) | 31 (88.6%) |
| 25 to 34 Years | 1 (0.7%) | 147 (98.7%) |
| 35 to 44 Years | 5 (3.8%) | 121 (91.0%) |
| 45 to 54 Years | 20 (17.0%) | 104 (88.1%) |
| 55 to 64 Years | 14 (8.9%) | 152 (96.2%) |
| 65 to 74 Years | 46 (75.4%) | 49 (80.3%) |
| 75 Years and over | 63 (100.0%) | 51 (80.9%) |
| Total | 190 (19.2%) | 893 (90.1%) |
Disability Status by Sex by Age in New Salem borough
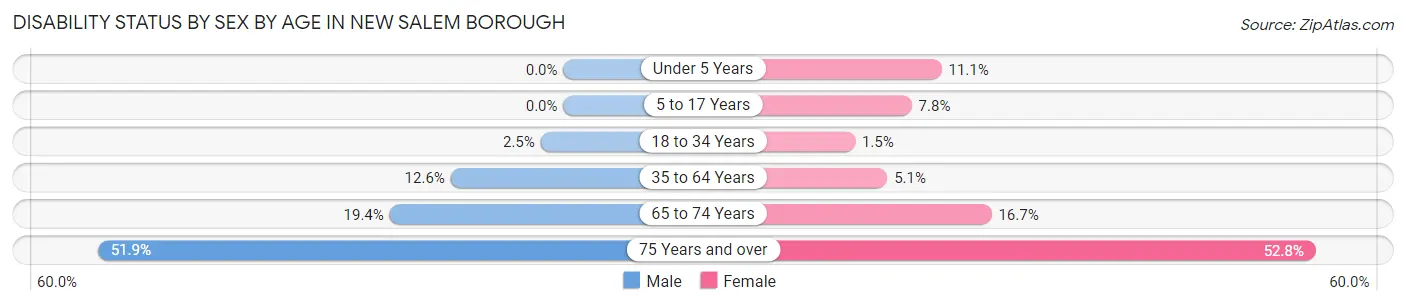
| Age Bracket | Male | Female |
| Under 5 Years | 0 (0.0%) | 6 (11.1%) |
| 5 to 17 Years | 0 (0.0%) | 7 (7.8%) |
| 18 to 34 Years | 2 (2.5%) | 2 (1.5%) |
| 35 to 64 Years | 29 (12.6%) | 9 (5.1%) |
| 65 to 74 Years | 6 (19.4%) | 5 (16.7%) |
| 75 Years and over | 14 (51.8%) | 19 (52.8%) |
Disability Class by Sex by Age in New Salem borough
Disability Class: Hearing Difficulty
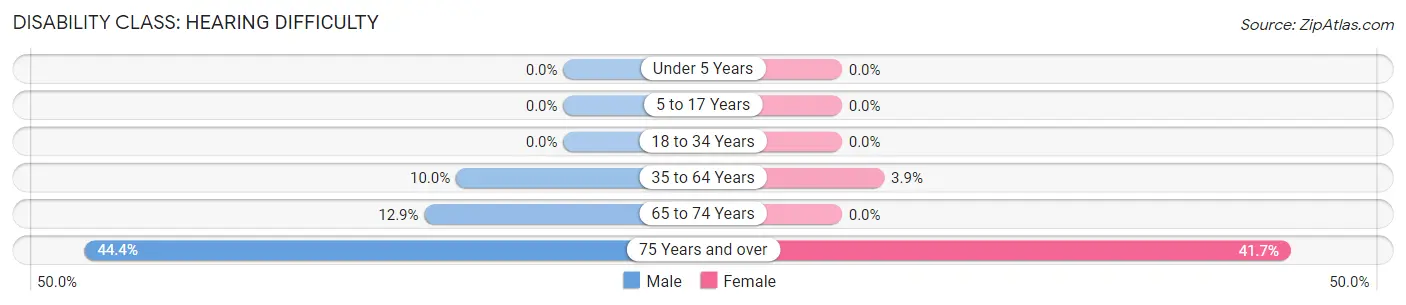
| Age Bracket | Male | Female |
| Under 5 Years | 0 (0.0%) | 0 (0.0%) |
| 5 to 17 Years | 0 (0.0%) | 0 (0.0%) |
| 18 to 34 Years | 0 (0.0%) | 0 (0.0%) |
| 35 to 64 Years | 23 (10.0%) | 7 (3.9%) |
| 65 to 74 Years | 4 (12.9%) | 0 (0.0%) |
| 75 Years and over | 12 (44.4%) | 15 (41.7%) |
Disability Class: Vision Difficulty
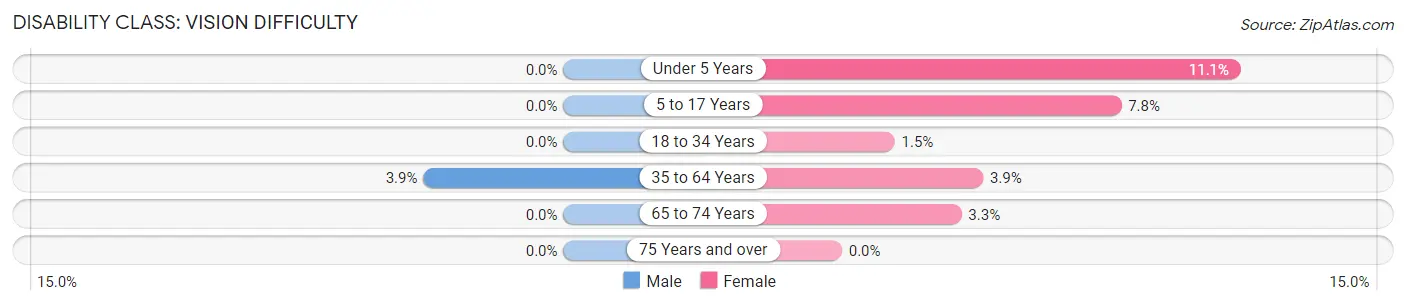
| Age Bracket | Male | Female |
| Under 5 Years | 0 (0.0%) | 6 (11.1%) |
| 5 to 17 Years | 0 (0.0%) | 7 (7.8%) |
| 18 to 34 Years | 0 (0.0%) | 2 (1.5%) |
| 35 to 64 Years | 9 (3.9%) | 7 (3.9%) |
| 65 to 74 Years | 0 (0.0%) | 1 (3.3%) |
| 75 Years and over | 0 (0.0%) | 0 (0.0%) |
Disability Class: Cognitive Difficulty
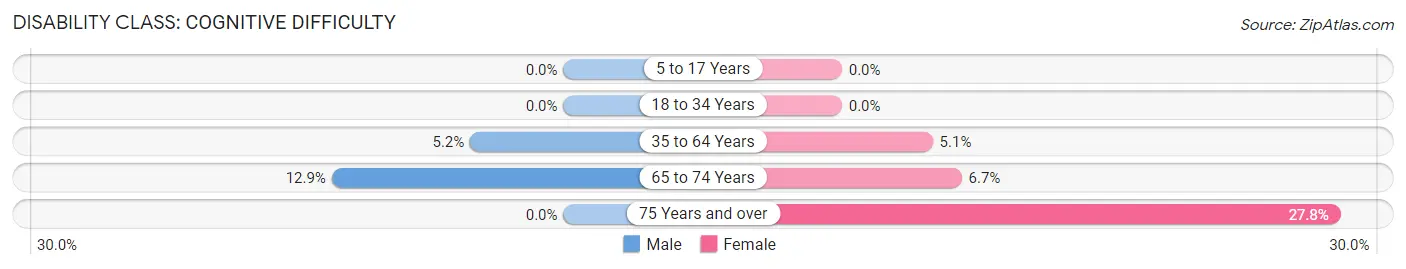
| Age Bracket | Male | Female |
| 5 to 17 Years | 0 (0.0%) | 0 (0.0%) |
| 18 to 34 Years | 0 (0.0%) | 0 (0.0%) |
| 35 to 64 Years | 12 (5.2%) | 9 (5.1%) |
| 65 to 74 Years | 4 (12.9%) | 2 (6.7%) |
| 75 Years and over | 0 (0.0%) | 10 (27.8%) |
Disability Class: Ambulatory Difficulty
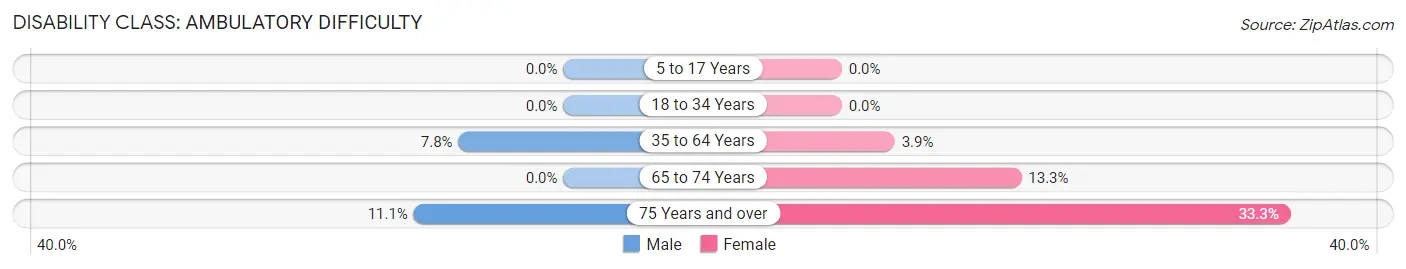
| Age Bracket | Male | Female |
| 5 to 17 Years | 0 (0.0%) | 0 (0.0%) |
| 18 to 34 Years | 0 (0.0%) | 0 (0.0%) |
| 35 to 64 Years | 18 (7.8%) | 7 (3.9%) |
| 65 to 74 Years | 0 (0.0%) | 4 (13.3%) |
| 75 Years and over | 3 (11.1%) | 12 (33.3%) |
Disability Class: Self-Care Difficulty
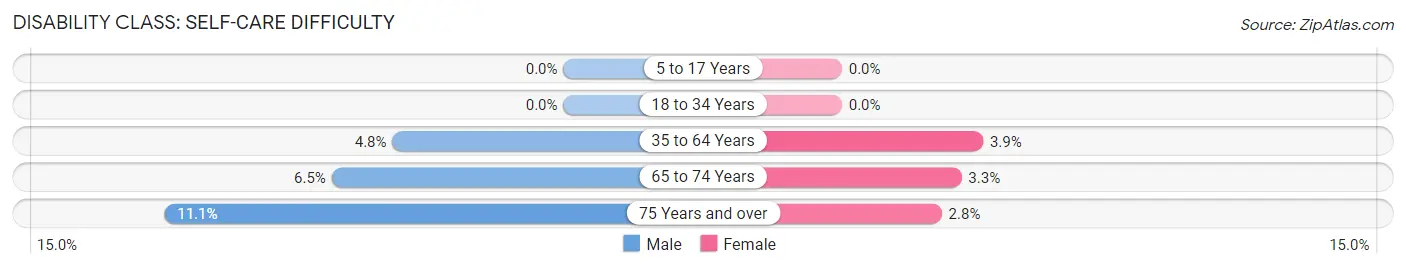
| Age Bracket | Male | Female |
| 5 to 17 Years | 0 (0.0%) | 0 (0.0%) |
| 18 to 34 Years | 0 (0.0%) | 0 (0.0%) |
| 35 to 64 Years | 11 (4.8%) | 7 (3.9%) |
| 65 to 74 Years | 2 (6.5%) | 1 (3.3%) |
| 75 Years and over | 3 (11.1%) | 1 (2.8%) |
Technology Access in New Salem borough
Computing Device Access in New Salem borough
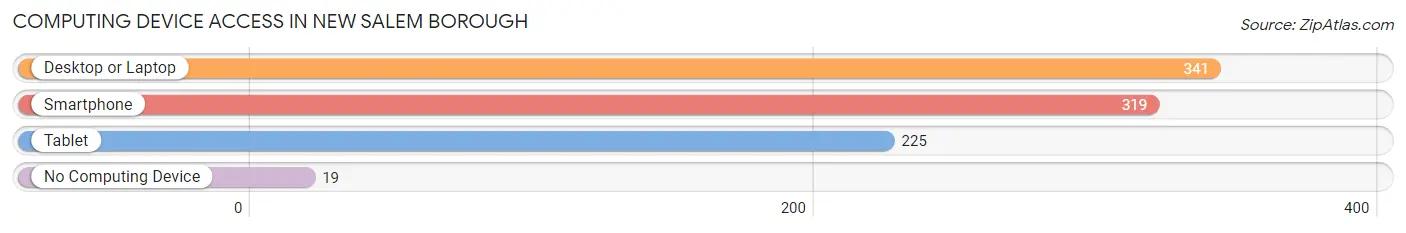
| Device Type | # Households | % Households |
| Desktop or Laptop | 341 | 90.9% |
| Smartphone | 319 | 85.1% |
| Tablet | 225 | 60.0% |
| No Computing Device | 19 | 5.1% |
| Total | 375 | 100.0% |
Internet Access in New Salem borough
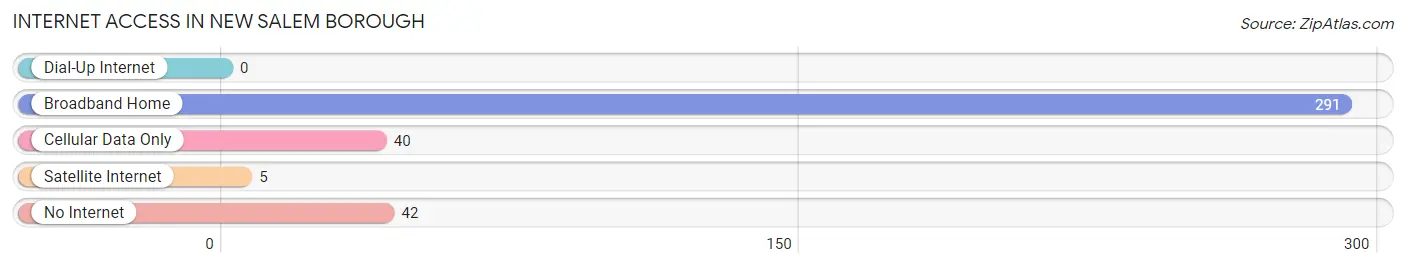
| Internet Type | # Households | % Households |
| Dial-Up Internet | 0 | 0.0% |
| Broadband Home | 291 | 77.6% |
| Cellular Data Only | 40 | 10.7% |
| Satellite Internet | 5 | 1.3% |
| No Internet | 42 | 11.2% |
| Total | 375 | 100.0% |
New Salem borough Summary
New Salem Borough is a small borough located in Westmoreland County, Pennsylvania. It is situated in the foothills of the Allegheny Mountains, approximately 30 miles southeast of Pittsburgh. The borough was incorporated in 1891 and has a population of approximately 1,000 people.
History
The area that is now New Salem Borough was first settled in the late 1700s by a group of German immigrants. The town was originally known as “New Salem” and was named after the biblical city of Salem. The town was officially incorporated in 1891 and was the first borough in Westmoreland County.
The town was originally a farming community and was known for its production of apples, peaches, and other fruits. In the late 1800s, the town began to grow and develop as a result of the coal mining industry. The coal mines provided jobs for many of the town’s residents and helped to fuel the local economy.
In the early 1900s, the town began to experience a decline in the coal mining industry. This led to a decrease in population and a decrease in economic activity. However, the town was able to rebound in the mid-1900s with the development of the local steel industry. This provided jobs for many of the town’s residents and helped to fuel the local economy.
Geography
New Salem Borough is located in Westmoreland County, Pennsylvania. It is situated in the foothills of the Allegheny Mountains, approximately 30 miles southeast of Pittsburgh. The borough is bordered by the towns of Derry, Ligonier, and Donegal.
The borough has a total area of 0.7 square miles, all of which is land. The borough is located at an elevation of 1,400 feet above sea level. The climate in the area is characterized by hot, humid summers and cold, snowy winters.
Economy
The economy of New Salem Borough is largely based on the steel industry. The town is home to several steel mills, which provide jobs for many of the town’s residents. The town is also home to several small businesses, including restaurants, retail stores, and service providers.
The town is also home to several tourist attractions, including the New Salem Historical Society Museum and the New Salem Railroad Museum. These attractions draw visitors from all over the region and help to fuel the local economy.
Demographics
As of the 2010 census, the population of New Salem Borough was 1,000 people. The racial makeup of the borough was 97.7% White, 0.7% African American, 0.2% Native American, 0.2% Asian, and 1.2% from other races. The median household income in the borough was $37,500.
The town is home to several churches, including the New Salem United Methodist Church, the New Salem Presbyterian Church, and the New Salem Baptist Church. The town is also home to several schools, including the New Salem Elementary School and the New Salem High School.
Conclusion
New Salem Borough is a small borough located in Westmoreland County, Pennsylvania. It is situated in the foothills of the Allegheny Mountains, approximately 30 miles southeast of Pittsburgh. The borough was incorporated in 1891 and has a population of approximately 1,000 people. The economy of the borough is largely based on the steel industry, and the town is home to several tourist attractions. The racial makeup of the borough is 97.7% White, 0.7% African American, 0.2% Native American, 0.2% Asian, and 1.2% from other races. The median household income in the borough was $37,500.
Common Questions
What is Per Capita Income in New Salem borough?
Per Capita income in New Salem borough is $45,332.
What is the Median Family Income in New Salem borough?
Median Family Income in New Salem borough is $98,235.
What is the Median Household income in New Salem borough?
Median Household Income in New Salem borough is $99,549.
What is Income or Wage Gap in New Salem borough?
Income or Wage Gap in New Salem borough is 36.1%.
Women in New Salem borough earn 63.9 cents for every dollar earned by a man.
What is Inequality or Gini Index in New Salem borough?
Inequality or Gini Index in New Salem borough is 0.35.
What is the Total Population of New Salem borough?
Total Population of New Salem borough is 991.
What is the Total Male Population of New Salem borough?
Total Male Population of New Salem borough is 467.
What is the Total Female Population of New Salem borough?
Total Female Population of New Salem borough is 524.
What is the Ratio of Males per 100 Females in New Salem borough?
There are 89.12 Males per 100 Females in New Salem borough.
What is the Ratio of Females per 100 Males in New Salem borough?
There are 112.21 Females per 100 Males in New Salem borough.
What is the Median Population Age in New Salem borough?
Median Population Age in New Salem borough is 37.8 Years.
What is the Average Family Size in New Salem borough
Average Family Size in New Salem borough is 2.8 People.
What is the Average Household Size in New Salem borough
Average Household Size in New Salem borough is 2.6 People.
How Large is the Labor Force in New Salem borough?
There are 584 People in the Labor Forcein in New Salem borough.
What is the Percentage of People in the Labor Force in New Salem borough?
75.4% of People are in the Labor Force in New Salem borough.
What is the Unemployment Rate in New Salem borough?
Unemployment Rate in New Salem borough is 3.6%.