Zip Codes with the Highest Percentage of Population Employed in Installation, Maintenance & Repair in Lebanon, PA
RELATED REPORTS & OPTIONS
Installation, Maintenance & Repair
Lebanon
Compare Zip Codes
Map of Zip Codes with the Highest Percentage of Population Employed in Installation, Maintenance & Repair in Lebanon
3.2%
3.6%
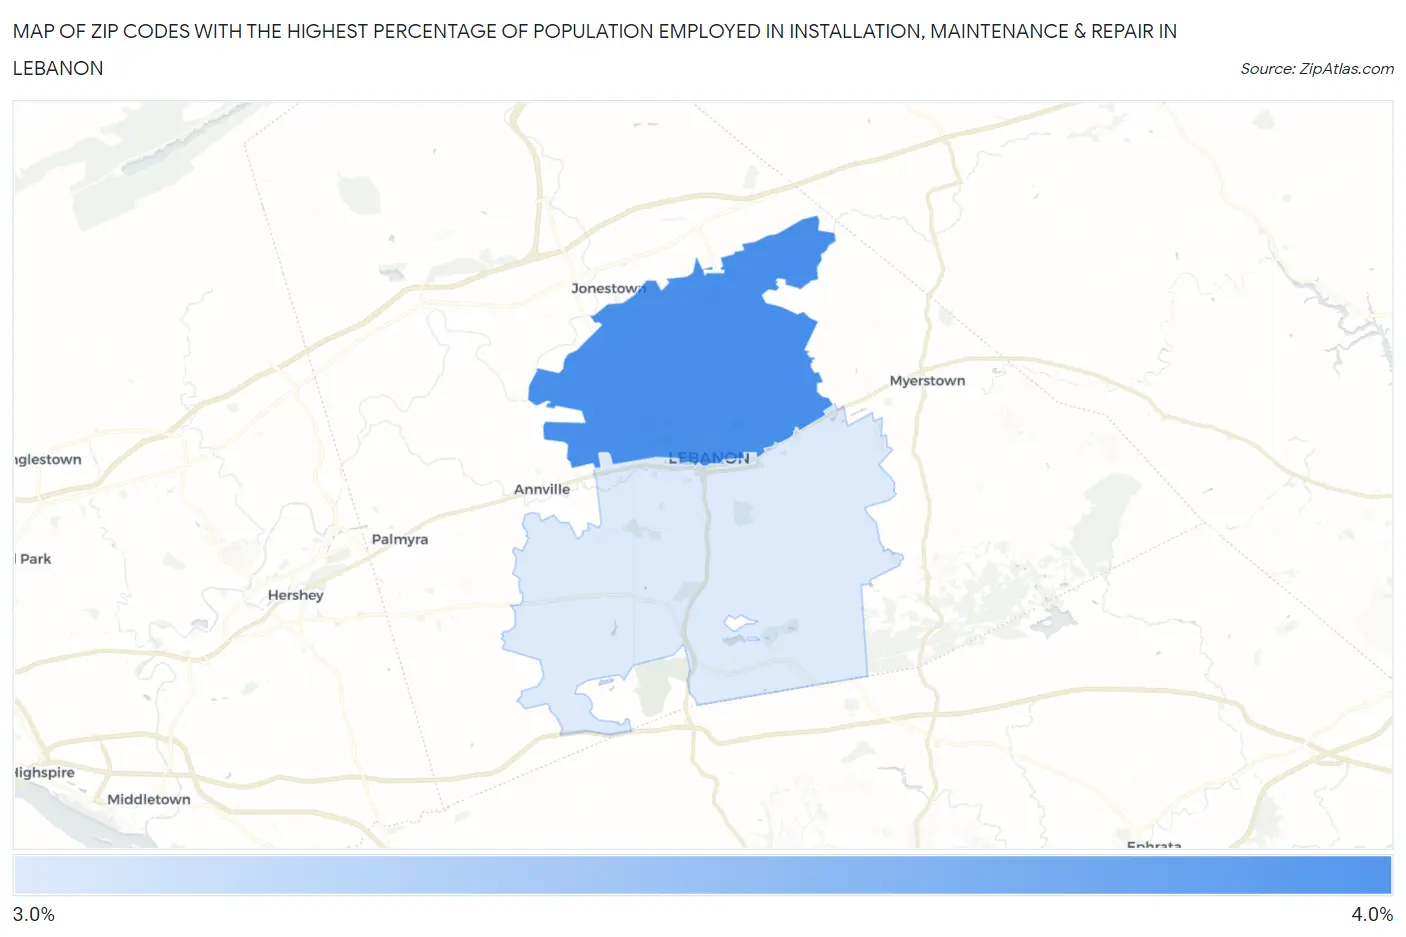
Zip Codes with the Highest Percentage of Population Employed in Installation, Maintenance & Repair in Lebanon, PA
| Zip Code | % Employed | vs State | vs National | |
| 1. | 17046 | 3.6% | 3.1%(+0.553)#837 | 3.1%(+0.577)#13,947 |
| 2. | 17042 | 3.2% | 3.1%(+0.081)#958 | 3.1%(+0.105)#16,166 |
1
Common Questions
What are the Top Zip Codes with the Highest Percentage of Population Employed in Installation, Maintenance & Repair in Lebanon, PA?
Top Zip Codes with the Highest Percentage of Population Employed in Installation, Maintenance & Repair in Lebanon, PA are:
What zip code has the Highest Percentage of Population Employed in Installation, Maintenance & Repair in Lebanon, PA?
17046 has the Highest Percentage of Population Employed in Installation, Maintenance & Repair in Lebanon, PA with 3.6%.
What is the Percentage of Population Employed in Installation, Maintenance & Repair in Lebanon, PA?
Percentage of Population Employed in Installation, Maintenance & Repair in Lebanon is 2.5%.
What is the Percentage of Population Employed in Installation, Maintenance & Repair in Pennsylvania?
Percentage of Population Employed in Installation, Maintenance & Repair in Pennsylvania is 3.1%.
What is the Percentage of Population Employed in Installation, Maintenance & Repair in the United States?
Percentage of Population Employed in Installation, Maintenance & Repair in the United States is 3.1%.