Hopeland, PA Map & Demographics
Hopeland Map
Hopeland Overview
$30,669
PER CAPITA INCOME
$71,000
AVG FAMILY INCOME
$71,000
AVG HOUSEHOLD INCOME
69.9%
WAGE / INCOME GAP [ % ]
30.1¢/ $1
WAGE / INCOME GAP [ $ ]
0.24
INEQUALITY / GINI INDEX
642
TOTAL POPULATION
346
MALE POPULATION
296
FEMALE POPULATION
116.89
MALES / 100 FEMALES
85.55
FEMALES / 100 MALES
33.7
MEDIAN AGE
2.6
AVG FAMILY SIZE
2.6
AVG HOUSEHOLD SIZE
354
LABOR FORCE [ PEOPLE ]
59.7%
PERCENT IN LABOR FORCE
Hopeland Area Codes
Income in Hopeland
Income Overview in Hopeland
Per Capita Income in Hopeland is $30,669, while median incomes of families and households are $71,000 and $71,000 respectively.
| Characteristic | Number | Measure |
| Per Capita Income | 642 | $30,669 |
| Median Family Income | 242 | $71,000 |
| Mean Family Income | 242 | $82,028 |
| Median Household Income | 242 | $71,000 |
| Mean Household Income | 242 | $82,028 |
| Income Deficit | 242 | $0 |
| Wage / Income Gap (%) | 642 | 69.92% |
| Wage / Income Gap ($) | 642 | 30.08¢ per $1 |
| Gini / Inequality Index | 642 | 0.24 |
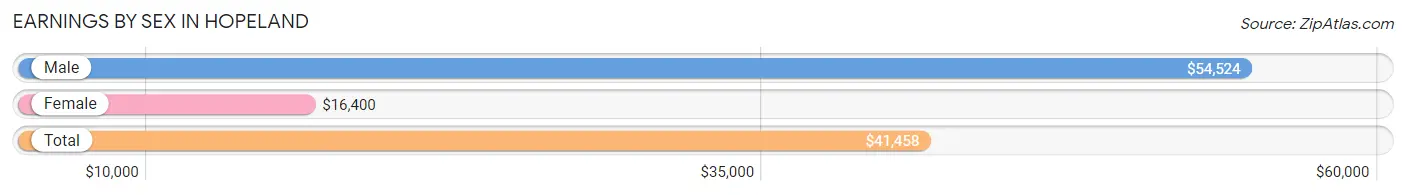
Earnings by Sex in Hopeland
Average Earnings in Hopeland are $41,458, $54,524 for men and $16,400 for women, a difference of 69.9%.
| Sex | Number | Average Earnings |
| Male | 246 (66.8%) | $54,524 |
| Female | 122 (33.2%) | $16,400 |
| Total | 368 (100.0%) | $41,458 |
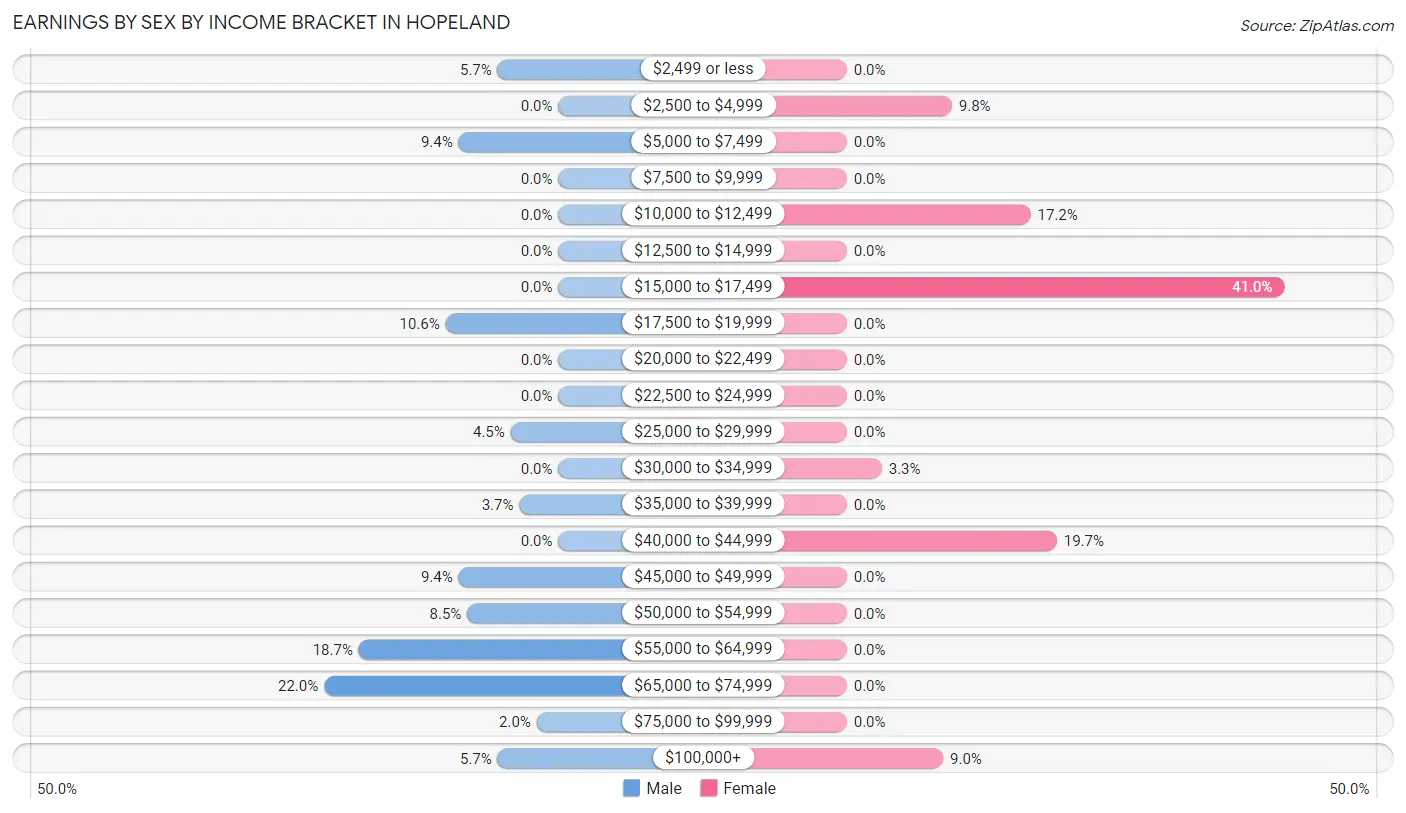
Earnings by Sex by Income Bracket in Hopeland
The most common earnings brackets in Hopeland are $65,000 to $74,999 for men (54 | 22.0%) and $15,000 to $17,499 for women (50 | 41.0%).
| Income | Male | Female |
| $2,499 or less | 14 (5.7%) | 0 (0.0%) |
| $2,500 to $4,999 | 0 (0.0%) | 12 (9.8%) |
| $5,000 to $7,499 | 23 (9.3%) | 0 (0.0%) |
| $7,500 to $9,999 | 0 (0.0%) | 0 (0.0%) |
| $10,000 to $12,499 | 0 (0.0%) | 21 (17.2%) |
| $12,500 to $14,999 | 0 (0.0%) | 0 (0.0%) |
| $15,000 to $17,499 | 0 (0.0%) | 50 (41.0%) |
| $17,500 to $19,999 | 26 (10.6%) | 0 (0.0%) |
| $20,000 to $22,499 | 0 (0.0%) | 0 (0.0%) |
| $22,500 to $24,999 | 0 (0.0%) | 0 (0.0%) |
| $25,000 to $29,999 | 11 (4.5%) | 0 (0.0%) |
| $30,000 to $34,999 | 0 (0.0%) | 4 (3.3%) |
| $35,000 to $39,999 | 9 (3.7%) | 0 (0.0%) |
| $40,000 to $44,999 | 0 (0.0%) | 24 (19.7%) |
| $45,000 to $49,999 | 23 (9.3%) | 0 (0.0%) |
| $50,000 to $54,999 | 21 (8.5%) | 0 (0.0%) |
| $55,000 to $64,999 | 46 (18.7%) | 0 (0.0%) |
| $65,000 to $74,999 | 54 (22.0%) | 0 (0.0%) |
| $75,000 to $99,999 | 5 (2.0%) | 0 (0.0%) |
| $100,000+ | 14 (5.7%) | 11 (9.0%) |
| Total | 246 (100.0%) | 122 (100.0%) |
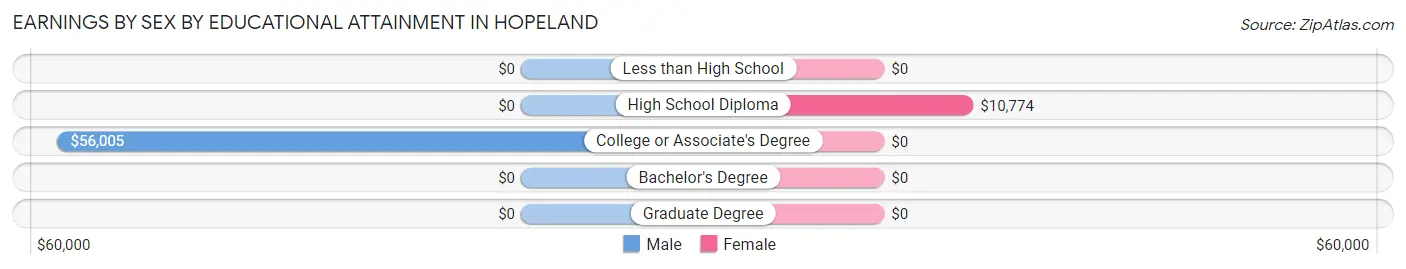
Earnings by Sex by Educational Attainment in Hopeland
Average earnings in Hopeland are $55,082 for men and $15,313 for women, a difference of 72.2%. Men with an educational attainment of college or associate's degree enjoy the highest average annual earnings of $56,005, while those with college or associate's degree education earn the least with $56,005. Women with an educational attainment of high school diploma earn the most with the average annual earnings of $10,774, while those with high school diploma education have the smallest earnings of $10,774.
| Educational Attainment | Male Income | Female Income |
| Less than High School | - | - |
| High School Diploma | - | - |
| College or Associate's Degree | $56,005 | $0 |
| Bachelor's Degree | - | - |
| Graduate Degree | - | - |
| Total | $55,082 | $15,313 |
Family Income in Hopeland
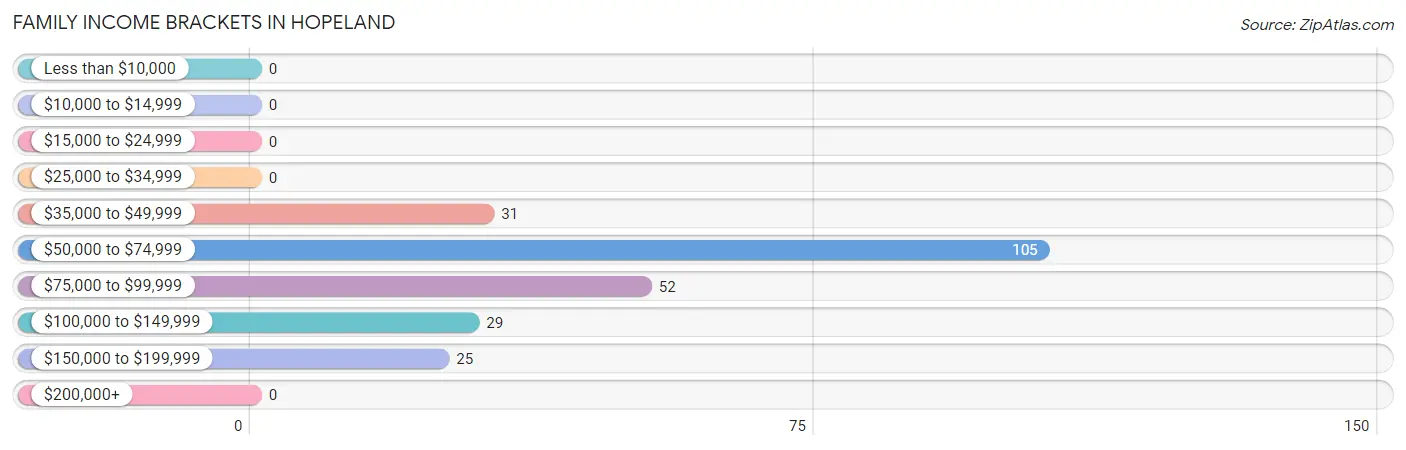
Family Income Brackets in Hopeland
According to the Hopeland family income data, there are 105 families falling into the $50,000 to $74,999 income range, which is the most common income bracket and makes up 43.4% of all families.
| Income Bracket | # Families | % Families |
| Less than $10,000 | 0 | 0.0% |
| $10,000 to $14,999 | 0 | 0.0% |
| $15,000 to $24,999 | 0 | 0.0% |
| $25,000 to $34,999 | 0 | 0.0% |
| $35,000 to $49,999 | 31 | 12.8% |
| $50,000 to $74,999 | 105 | 43.4% |
| $75,000 to $99,999 | 52 | 21.5% |
| $100,000 to $149,999 | 29 | 12.0% |
| $150,000 to $199,999 | 25 | 10.3% |
| $200,000+ | 0 | 0.0% |
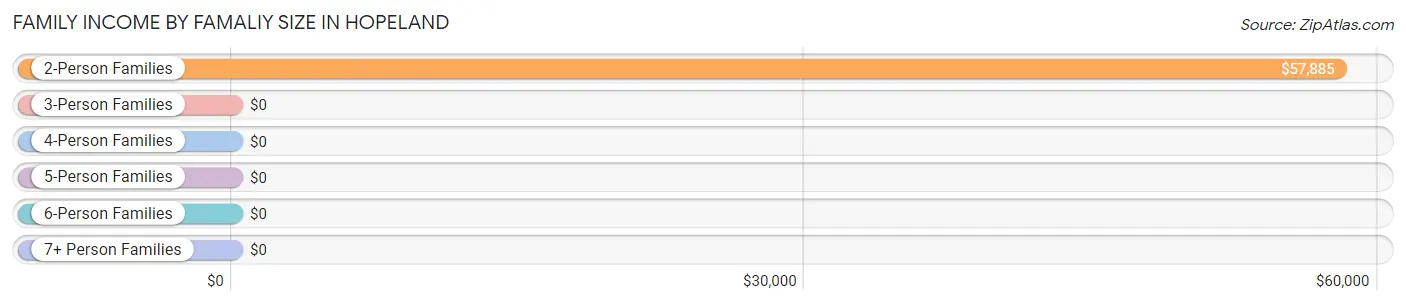
Family Income by Famaliy Size in Hopeland
2-person families (158 | 65.3%) account for the highest median family income in Hopeland with $57,885 per family, while 2-person families (158 | 65.3%) have the highest median income of $28,942 per family member.
| Income Bracket | # Families | Median Income |
| 2-Person Families | 158 (65.3%) | $57,885 |
| 3-Person Families | 21 (8.7%) | $0 |
| 4-Person Families | 39 (16.1%) | $0 |
| 5-Person Families | 24 (9.9%) | $0 |
| 6-Person Families | 0 (0.0%) | $0 |
| 7+ Person Families | 0 (0.0%) | $0 |
| Total | 242 (100.0%) | $71,000 |
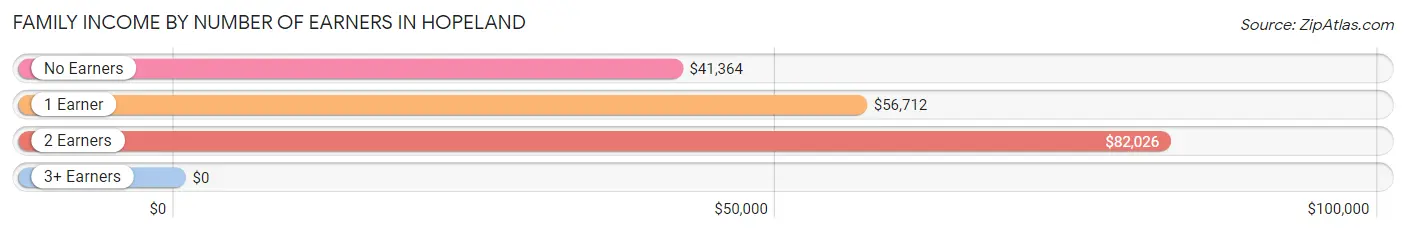
Family Income by Number of Earners in Hopeland
| Number of Earners | # Families | Median Income |
| No Earners | 36 (14.9%) | $41,364 |
| 1 Earner | 79 (32.6%) | $56,712 |
| 2 Earners | 89 (36.8%) | $82,026 |
| 3+ Earners | 38 (15.7%) | $0 |
| Total | 242 (100.0%) | $71,000 |
Household Income in Hopeland
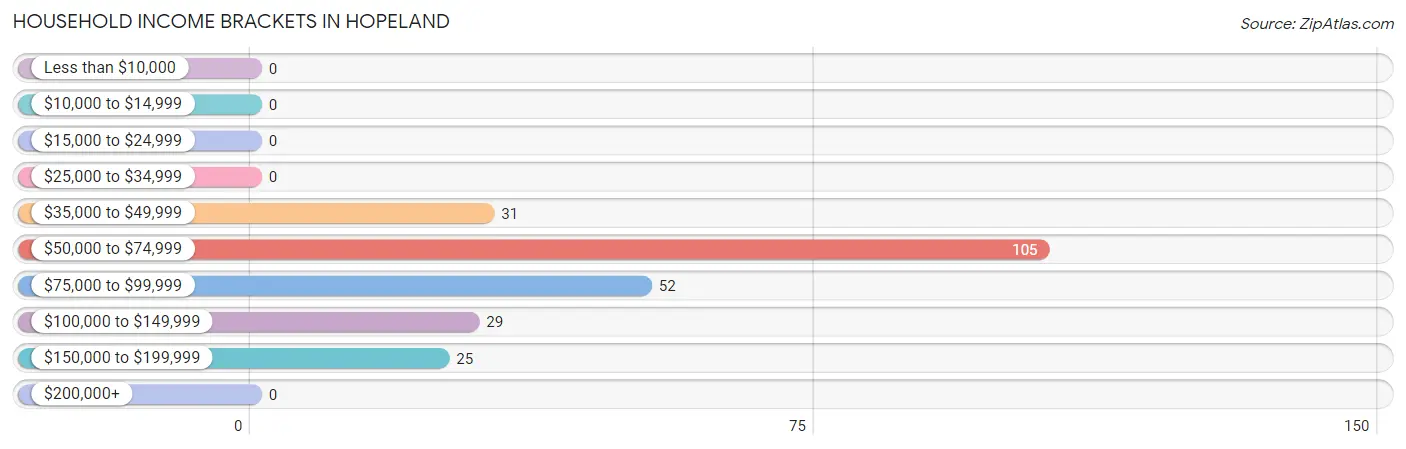
Household Income Brackets in Hopeland
With 105 households falling in the category, the $50,000 to $74,999 income range is the most frequent in Hopeland, accounting for 43.4% of all households.
| Income Bracket | # Households | % Households |
| Less than $10,000 | 0 | 0.0% |
| $10,000 to $14,999 | 0 | 0.0% |
| $15,000 to $24,999 | 0 | 0.0% |
| $25,000 to $34,999 | 0 | 0.0% |
| $35,000 to $49,999 | 31 | 12.8% |
| $50,000 to $74,999 | 105 | 43.4% |
| $75,000 to $99,999 | 52 | 21.5% |
| $100,000 to $149,999 | 29 | 12.0% |
| $150,000 to $199,999 | 25 | 10.3% |
| $200,000+ | 0 | 0.0% |
Household Income by Householder Age in Hopeland
The median household income in Hopeland is $71,000, with the highest median household income of $88,913 found in the 25 to 44 years age bracket for the primary householder. A total of 68 households (28.1%) fall into this category. Meanwhile, the 15 to 24 years age bracket for the primary householder has the lowest median household income of $0, with 29 households (12.0%) in this group.
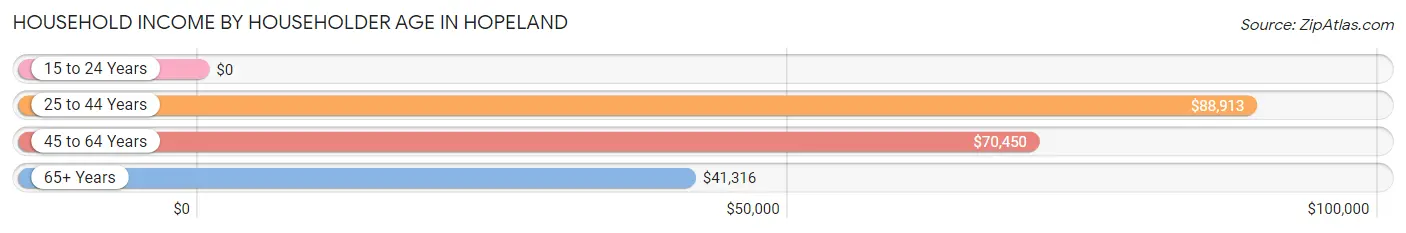
| Income Bracket | # Households | Median Income |
| 15 to 24 Years | 29 (12.0%) | $0 |
| 25 to 44 Years | 68 (28.1%) | $88,913 |
| 45 to 64 Years | 101 (41.7%) | $70,450 |
| 65+ Years | 44 (18.2%) | $41,316 |
| Total | 242 (100.0%) | $71,000 |
Poverty in Hopeland
Income Below Poverty by Sex and Age in Hopeland
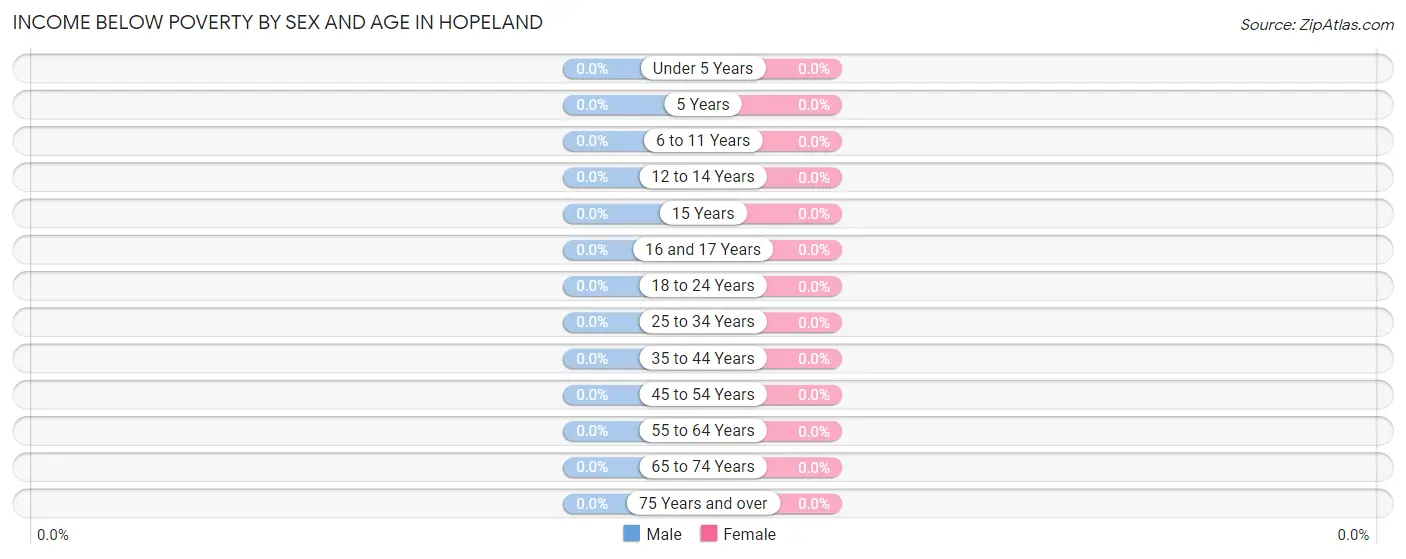
| Age Bracket | Male | Female |
| Under 5 Years | 0 (0.0%) | 0 (0.0%) |
| 5 Years | 0 (0.0%) | 0 (0.0%) |
| 6 to 11 Years | 0 (0.0%) | 0 (0.0%) |
| 12 to 14 Years | 0 (0.0%) | 0 (0.0%) |
| 15 Years | 0 (0.0%) | 0 (0.0%) |
| 16 and 17 Years | 0 (0.0%) | 0 (0.0%) |
| 18 to 24 Years | 0 (0.0%) | 0 (0.0%) |
| 25 to 34 Years | 0 (0.0%) | 0 (0.0%) |
| 35 to 44 Years | 0 (0.0%) | 0 (0.0%) |
| 45 to 54 Years | 0 (0.0%) | 0 (0.0%) |
| 55 to 64 Years | 0 (0.0%) | 0 (0.0%) |
| 65 to 74 Years | 0 (0.0%) | 0 (0.0%) |
| 75 Years and over | 0 (0.0%) | 0 (0.0%) |
| Total | 0 (0.0%) | 0 (0.0%) |
Income Above Poverty by Sex and Age in Hopeland
According to the poverty statistics in Hopeland, males aged 16 and 17 years and females aged under 5 years are the age groups that are most secure financially, with 100.0% of males and 100.0% of females in these age groups living above the poverty line.
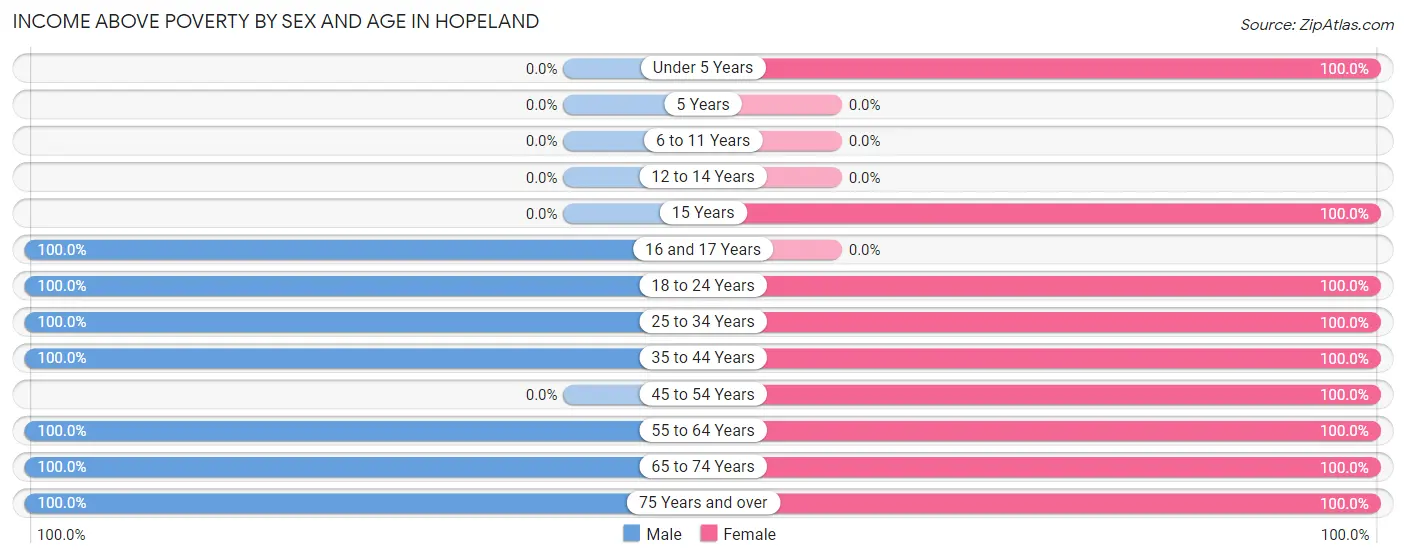
| Age Bracket | Male | Female |
| Under 5 Years | 0 (0.0%) | 22 (100.0%) |
| 5 Years | 0 (0.0%) | 0 (0.0%) |
| 6 to 11 Years | 0 (0.0%) | 0 (0.0%) |
| 12 to 14 Years | 0 (0.0%) | 0 (0.0%) |
| 15 Years | 0 (0.0%) | 27 (100.0%) |
| 16 and 17 Years | 53 (100.0%) | 0 (0.0%) |
| 18 to 24 Years | 55 (100.0%) | 50 (100.0%) |
| 25 to 34 Years | 86 (100.0%) | 34 (100.0%) |
| 35 to 44 Years | 25 (100.0%) | 24 (100.0%) |
| 45 to 54 Years | 0 (0.0%) | 23 (100.0%) |
| 55 to 64 Years | 101 (100.0%) | 71 (100.0%) |
| 65 to 74 Years | 13 (100.0%) | 37 (100.0%) |
| 75 Years and over | 13 (100.0%) | 8 (100.0%) |
| Total | 346 (100.0%) | 296 (100.0%) |
Income Below Poverty Among Married-Couple Families in Hopeland
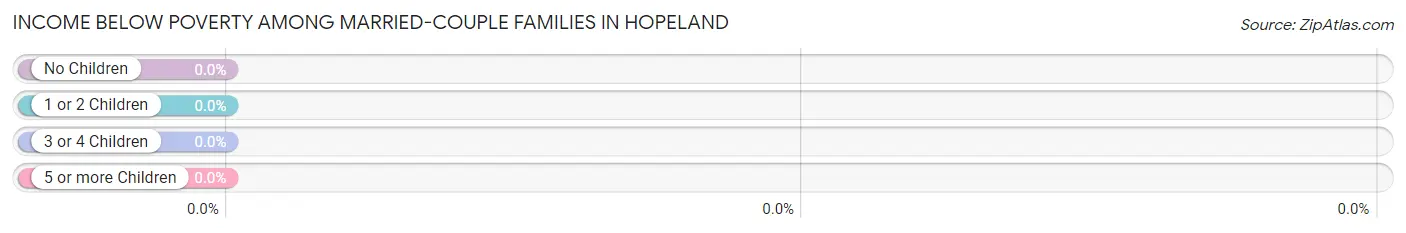
| Children | Above Poverty | Below Poverty |
| No Children | 164 (100.0%) | 0 (0.0%) |
| 1 or 2 Children | 59 (100.0%) | 0 (0.0%) |
| 3 or 4 Children | 0 (0.0%) | 0 (0.0%) |
| 5 or more Children | 0 (0.0%) | 0 (0.0%) |
| Total | 223 (100.0%) | 0 (0.0%) |
Income Below Poverty Among Single-Parent Households in Hopeland
| Children | Single Father | Single Mother |
| No Children | 0 (0.0%) | 0 (0.0%) |
| 1 or 2 Children | 0 (0.0%) | 0 (0.0%) |
| 3 or 4 Children | 0 (0.0%) | 0 (0.0%) |
| 5 or more Children | 0 (0.0%) | 0 (0.0%) |
| Total | 0 (0.0%) | 0 (0.0%) |
Income Below Poverty Among Married-Couple vs Single-Parent Households in Hopeland
| Children | Married-Couple Families | Single-Parent Households |
| No Children | 0 (0.0%) | 0 (0.0%) |
| 1 or 2 Children | 0 (0.0%) | 0 (0.0%) |
| 3 or 4 Children | 0 (0.0%) | 0 (0.0%) |
| 5 or more Children | 0 (0.0%) | 0 (0.0%) |
| Total | 0 (0.0%) | 0 (0.0%) |
Race in Hopeland
The most populous races in Hopeland are White / Caucasian (589 | 91.7%), and Some other Race (53 | 8.3%).
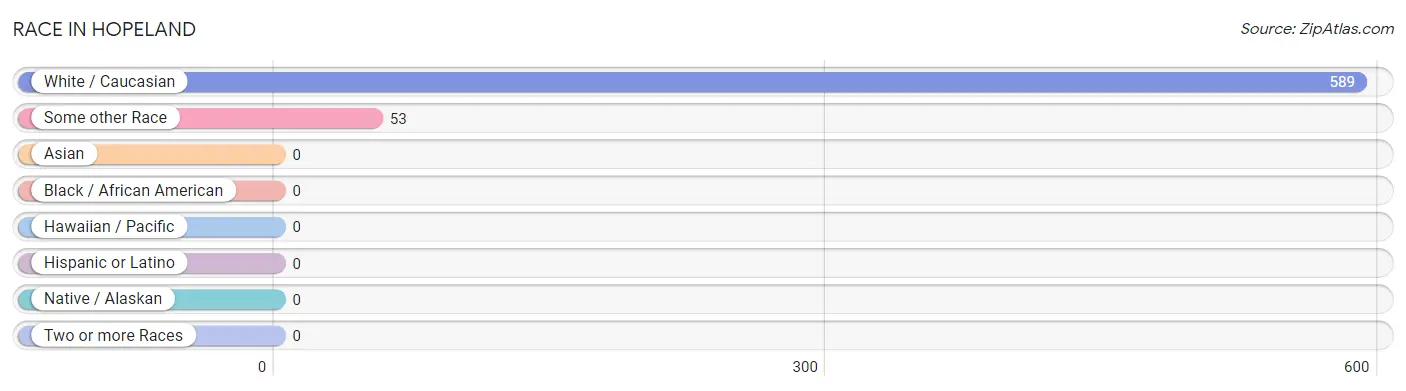
| Race | # Population | % Population |
| Asian | 0 | 0.0% |
| Black / African American | 0 | 0.0% |
| Hawaiian / Pacific | 0 | 0.0% |
| Hispanic or Latino | 0 | 0.0% |
| Native / Alaskan | 0 | 0.0% |
| White / Caucasian | 589 | 91.7% |
| Two or more Races | 0 | 0.0% |
| Some other Race | 53 | 8.3% |
| Total | 642 | 100.0% |
Ancestry in Hopeland
The most populous ancestries reported in Hopeland are German (334 | 52.0%), Swiss (88 | 13.7%), Irish (67 | 10.4%), British (24 | 3.7%), and European (24 | 3.7%), together accounting for 83.7% of all Hopeland residents.
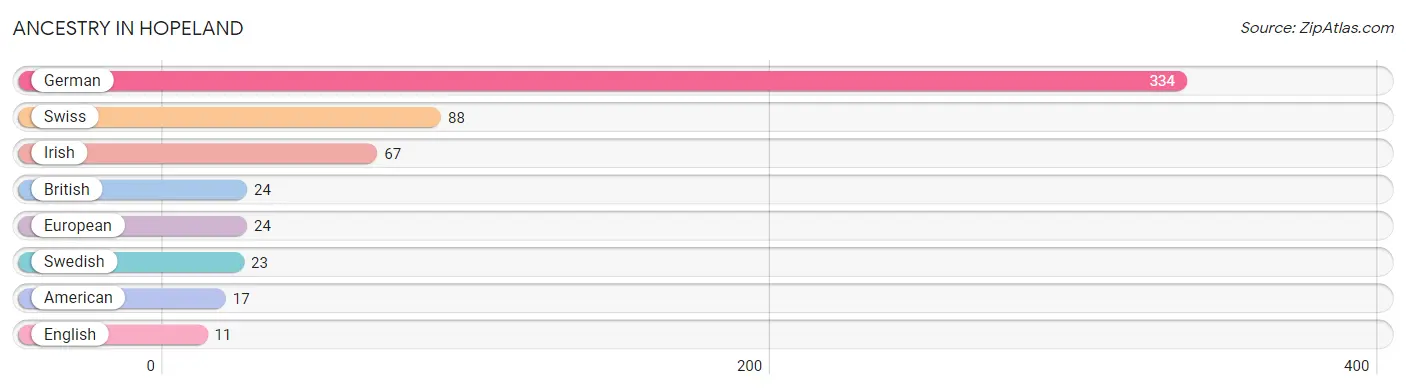
| Ancestry | # Population | % Population |
| American | 17 | 2.6% |
| British | 24 | 3.7% |
| English | 11 | 1.7% |
| European | 24 | 3.7% |
| German | 334 | 52.0% |
| Irish | 67 | 10.4% |
| Swedish | 23 | 3.6% |
| Swiss | 88 | 13.7% | View All 8 Rows |
Immigrants in Hopeland

| Immigration Origin | # Population | % Population | View All 0 Rows |
Sex and Age in Hopeland
Sex and Age in Hopeland
The most populous age groups in Hopeland are 15 to 19 Years (79 | 22.8%) for men and 20 to 24 Years (50 | 16.9%) for women.
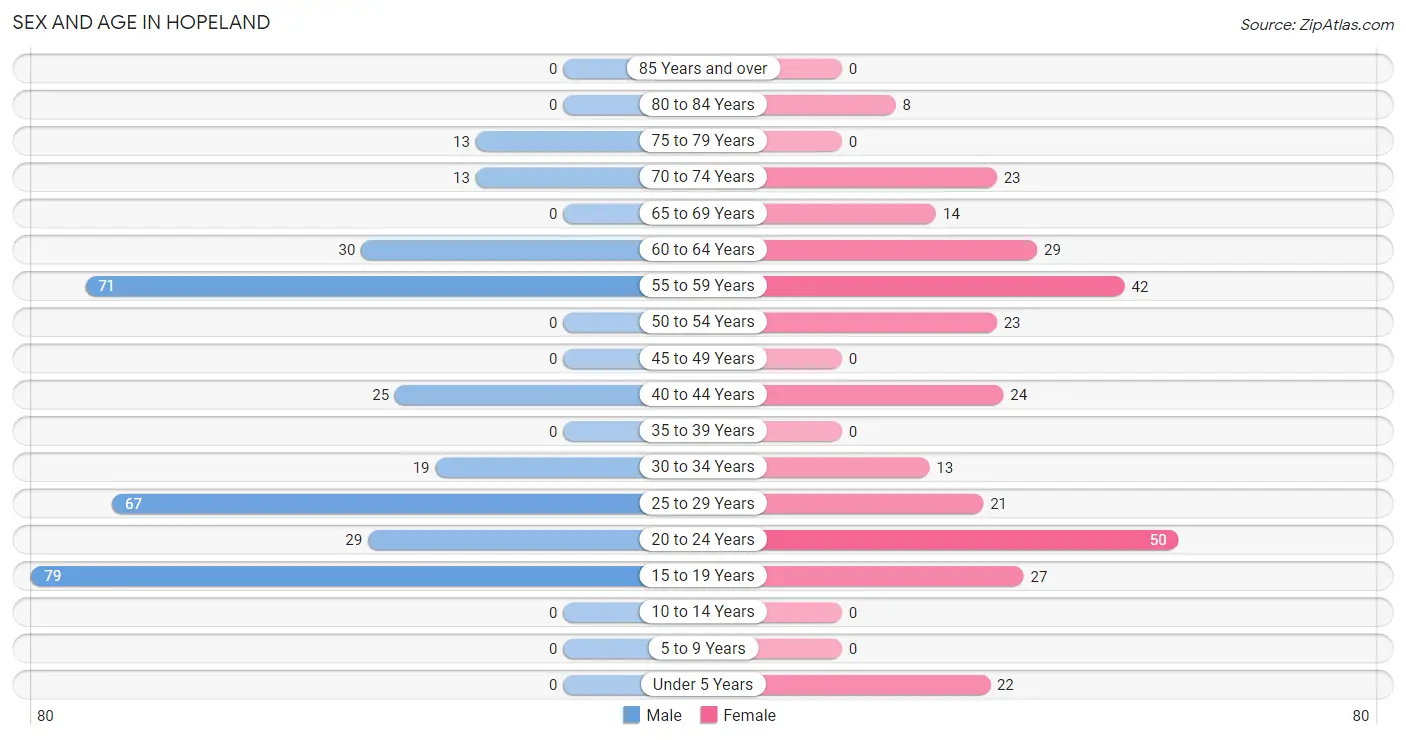
| Age Bracket | Male | Female |
| Under 5 Years | 0 (0.0%) | 22 (7.4%) |
| 5 to 9 Years | 0 (0.0%) | 0 (0.0%) |
| 10 to 14 Years | 0 (0.0%) | 0 (0.0%) |
| 15 to 19 Years | 79 (22.8%) | 27 (9.1%) |
| 20 to 24 Years | 29 (8.4%) | 50 (16.9%) |
| 25 to 29 Years | 67 (19.4%) | 21 (7.1%) |
| 30 to 34 Years | 19 (5.5%) | 13 (4.4%) |
| 35 to 39 Years | 0 (0.0%) | 0 (0.0%) |
| 40 to 44 Years | 25 (7.2%) | 24 (8.1%) |
| 45 to 49 Years | 0 (0.0%) | 0 (0.0%) |
| 50 to 54 Years | 0 (0.0%) | 23 (7.8%) |
| 55 to 59 Years | 71 (20.5%) | 42 (14.2%) |
| 60 to 64 Years | 30 (8.7%) | 29 (9.8%) |
| 65 to 69 Years | 0 (0.0%) | 14 (4.7%) |
| 70 to 74 Years | 13 (3.8%) | 23 (7.8%) |
| 75 to 79 Years | 13 (3.8%) | 0 (0.0%) |
| 80 to 84 Years | 0 (0.0%) | 8 (2.7%) |
| 85 Years and over | 0 (0.0%) | 0 (0.0%) |
| Total | 346 (100.0%) | 296 (100.0%) |
Families and Households in Hopeland
Median Family Size in Hopeland
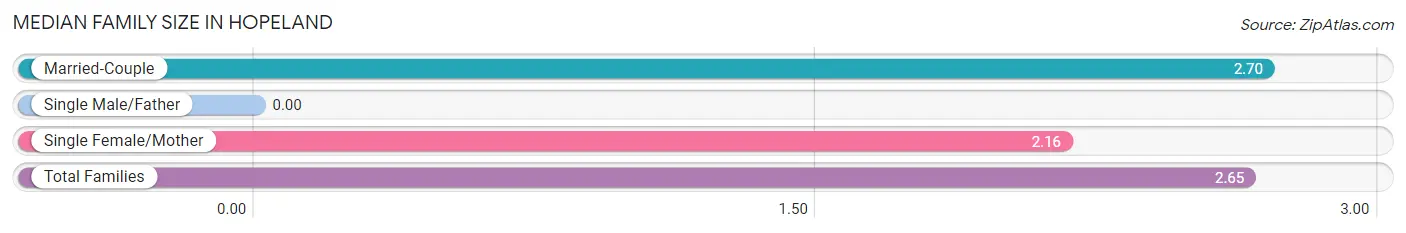
| Family Type | # Families | Family Size |
| Married-Couple | 223 (92.1%) | 2.70 |
| Single Male/Father | 0 (0.0%) | - |
| Single Female/Mother | 19 (7.9%) | 2.16 |
| Total Families | 242 (100.0%) | 2.65 |
Median Household Size in Hopeland
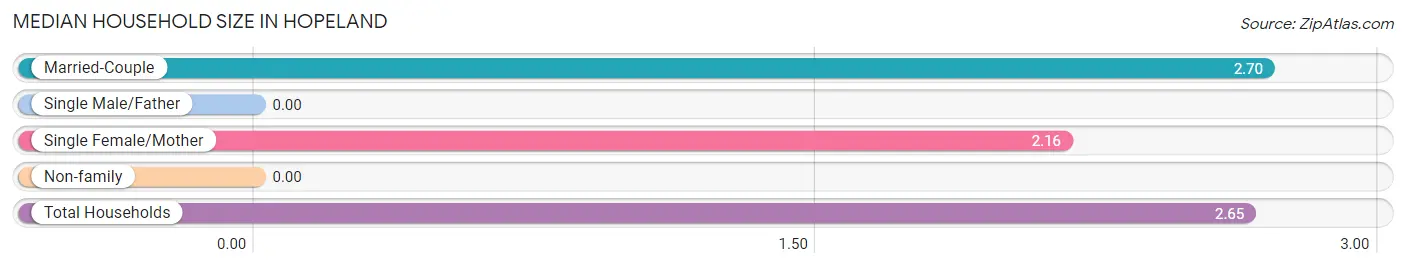
| Household Type | # Households | Household Size |
| Married-Couple | 223 (92.1%) | 2.70 |
| Single Male/Father | 0 (0.0%) | - |
| Single Female/Mother | 19 (7.9%) | 2.16 |
| Non-family | 0 (0.0%) | - |
| Total Households | 242 (100.0%) | 2.65 |
Household Size by Marriage Status in Hopeland
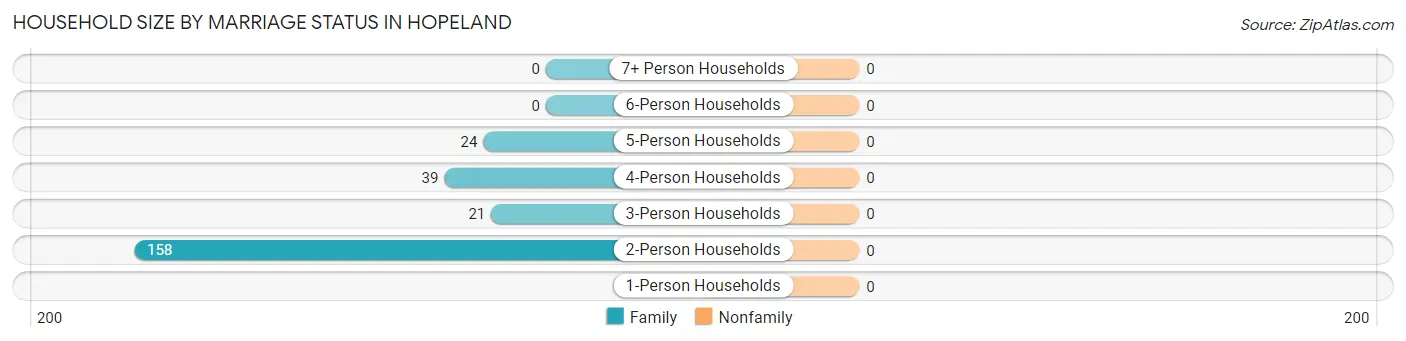
| Household Size | Family Households | Nonfamily Households |
| 1-Person Households | - | 0 (0.0%) |
| 2-Person Households | 158 (65.3%) | 0 (0.0%) |
| 3-Person Households | 21 (8.7%) | 0 (0.0%) |
| 4-Person Households | 39 (16.1%) | 0 (0.0%) |
| 5-Person Households | 24 (9.9%) | 0 (0.0%) |
| 6-Person Households | 0 (0.0%) | 0 (0.0%) |
| 7+ Person Households | 0 (0.0%) | 0 (0.0%) |
| Total | 242 (100.0%) | 0 (0.0%) |
Female Fertility in Hopeland
Fertility by Age in Hopeland
| Age Bracket | Women with Births | Births / 1,000 Women |
| 15 to 19 years | 0 (0.0%) | 0.0 |
| 20 to 34 years | 0 (0.0%) | 0.0 |
| 35 to 50 years | 0 (0.0%) | 0.0 |
| Total | 0 (0.0%) | 0.0 |
Fertility by Age by Marriage Status in Hopeland
| Age Bracket | Married | Unmarried |
| 15 to 19 years | 0 (0.0%) | 0 (0.0%) |
| 20 to 34 years | 0 (0.0%) | 0 (0.0%) |
| 35 to 50 years | 0 (0.0%) | 0 (0.0%) |
| Total | 0 (0.0%) | 0 (0.0%) |
Fertility by Education in Hopeland
| Educational Attainment | Women with Births | Births / 1,000 Women |
| Less than High School | 0 (0.0%) | 0.0 |
| High School Diploma | 0 (0.0%) | 0.0 |
| College or Associate's Degree | 0 (0.0%) | 0.0 |
| Bachelor's Degree | 0 (0.0%) | 0.0 |
| Graduate Degree | 0 (0.0%) | 0.0 |
| Total | 0 (0.0%) | 0.0 |
Fertility by Education by Marriage Status in Hopeland
| Educational Attainment | Married | Unmarried |
| Less than High School | 0 (0.0%) | 0 (0.0%) |
| High School Diploma | 0 (0.0%) | 0 (0.0%) |
| College or Associate's Degree | 0 (0.0%) | 0 (0.0%) |
| Bachelor's Degree | 0 (0.0%) | 0 (0.0%) |
| Graduate Degree | 0 (0.0%) | 0 (0.0%) |
| Total | 0 (0.0%) | 0 (0.0%) |
Employment Characteristics in Hopeland
Employment by Class of Employer in Hopeland
Among the 354 employed individuals in Hopeland, private company employees (268 | 75.7%), self-employed (not incorporated) (25 | 7.1%), and local government employees (24 | 6.8%) make up the most common classes of employment.
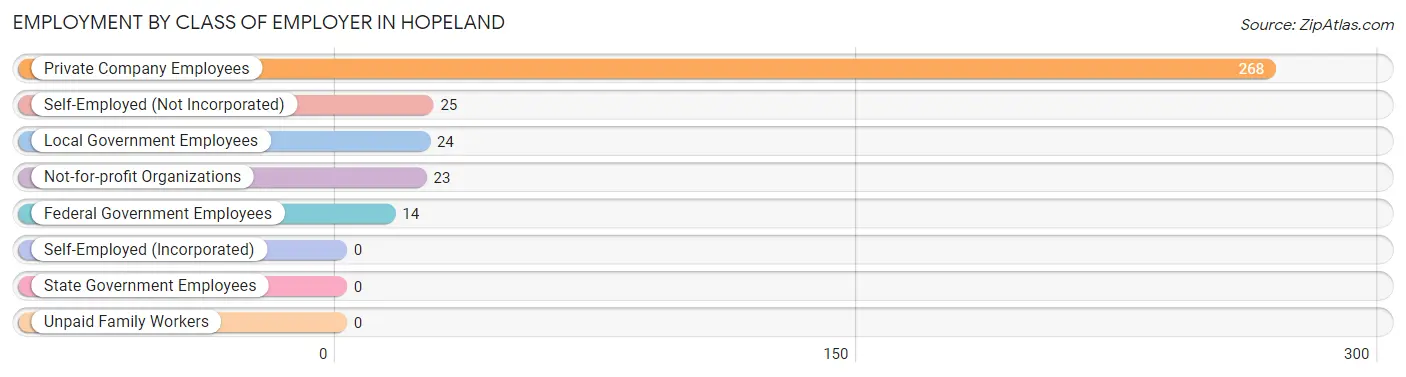
| Employer Class | # Employees | % Employees |
| Private Company Employees | 268 | 75.7% |
| Self-Employed (Incorporated) | 0 | 0.0% |
| Self-Employed (Not Incorporated) | 25 | 7.1% |
| Not-for-profit Organizations | 23 | 6.5% |
| Local Government Employees | 24 | 6.8% |
| State Government Employees | 0 | 0.0% |
| Federal Government Employees | 14 | 4.0% |
| Unpaid Family Workers | 0 | 0.0% |
| Total | 354 | 100.0% |
Employment Status by Age in Hopeland
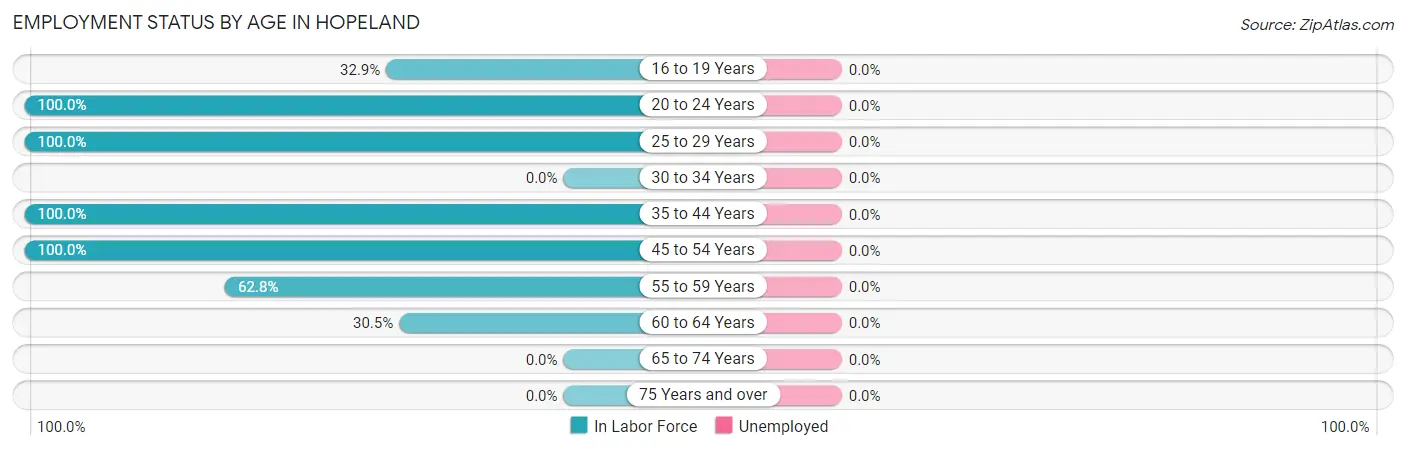
| Age Bracket | In Labor Force | Unemployed |
| 16 to 19 Years | 26 (32.9%) | 0 (0.0%) |
| 20 to 24 Years | 79 (100.0%) | 0 (0.0%) |
| 25 to 29 Years | 88 (100.0%) | 0 (0.0%) |
| 30 to 34 Years | 0 (0.0%) | 0 (0.0%) |
| 35 to 44 Years | 49 (100.0%) | 0 (0.0%) |
| 45 to 54 Years | 23 (100.0%) | 0 (0.0%) |
| 55 to 59 Years | 71 (62.8%) | 0 (0.0%) |
| 60 to 64 Years | 18 (30.5%) | 0 (0.0%) |
| 65 to 74 Years | 0 (0.0%) | 0 (0.0%) |
| 75 Years and over | 0 (0.0%) | 0 (0.0%) |
| Total | 354 (59.7%) | 0 (0.0%) |
Employment Status by Educational Attainment in Hopeland
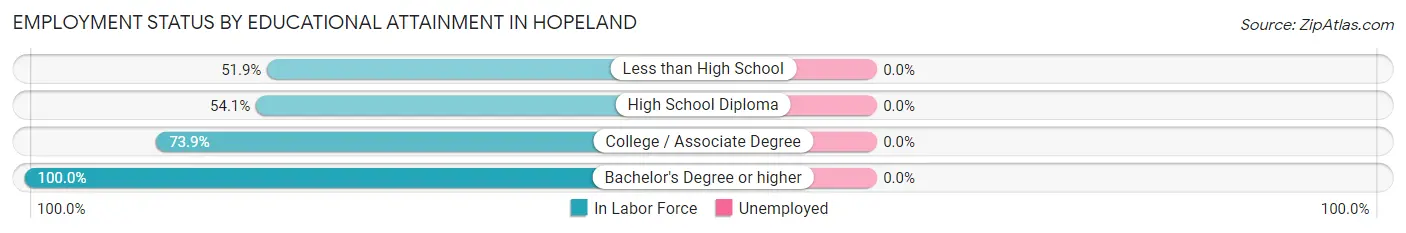
| Educational Attainment | In Labor Force | Unemployed |
| Less than High School | 14 (51.9%) | 0 (0.0%) |
| High School Diploma | 72 (54.1%) | 0 (0.0%) |
| College / Associate Degree | 116 (73.9%) | 0 (0.0%) |
| Bachelor's Degree or higher | 47 (100.0%) | 0 (0.0%) |
| Total | 249 (68.4%) | 0 (0.0%) |
Employment Occupations by Sex in Hopeland
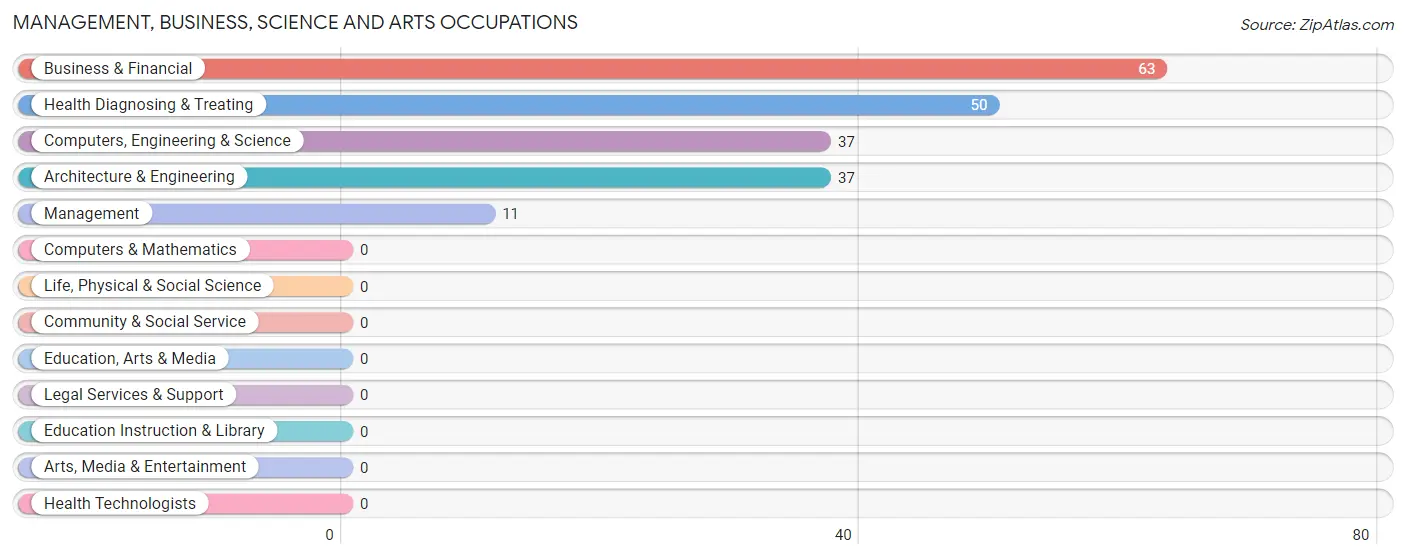
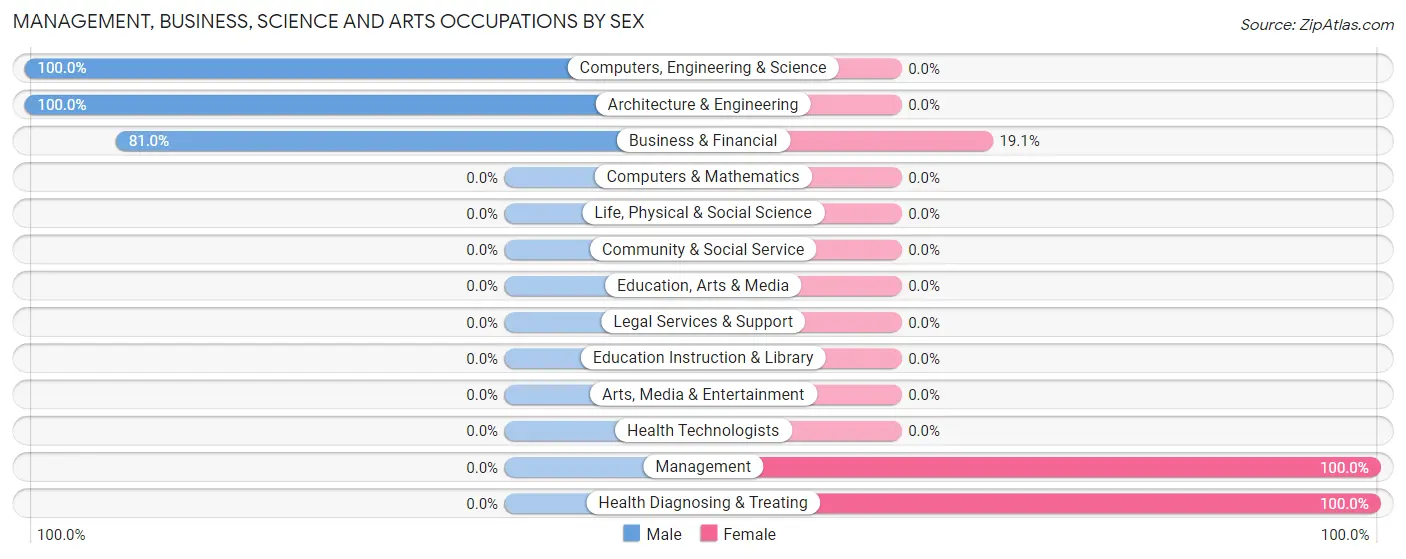
Management, Business, Science and Arts Occupations
The most common Management, Business, Science and Arts occupations in Hopeland are Business & Financial (63 | 17.8%), Health Diagnosing & Treating (50 | 14.1%), Computers, Engineering & Science (37 | 10.4%), Architecture & Engineering (37 | 10.4%), and Management (11 | 3.1%).
Management, Business, Science and Arts Occupations by Sex
Within the Management, Business, Science and Arts occupations in Hopeland, the most male-oriented occupations are Computers, Engineering & Science (100.0%), Architecture & Engineering (100.0%), and Business & Financial (80.9%), while the most female-oriented occupations are Management (100.0%), Health Diagnosing & Treating (100.0%), and Business & Financial (19.1%).
| Occupation | Male | Female |
| Management | 0 (0.0%) | 11 (100.0%) |
| Business & Financial | 51 (80.9%) | 12 (19.1%) |
| Computers, Engineering & Science | 37 (100.0%) | 0 (0.0%) |
| Computers & Mathematics | 0 (0.0%) | 0 (0.0%) |
| Architecture & Engineering | 37 (100.0%) | 0 (0.0%) |
| Life, Physical & Social Science | 0 (0.0%) | 0 (0.0%) |
| Community & Social Service | 0 (0.0%) | 0 (0.0%) |
| Education, Arts & Media | 0 (0.0%) | 0 (0.0%) |
| Legal Services & Support | 0 (0.0%) | 0 (0.0%) |
| Education Instruction & Library | 0 (0.0%) | 0 (0.0%) |
| Arts, Media & Entertainment | 0 (0.0%) | 0 (0.0%) |
| Health Diagnosing & Treating | 0 (0.0%) | 50 (100.0%) |
| Health Technologists | 0 (0.0%) | 0 (0.0%) |
| Total (Category) | 88 (54.7%) | 73 (45.3%) |
| Total (Overall) | 232 (65.5%) | 122 (34.5%) |
Services Occupations
The most common Services occupations in Hopeland are Security & Protection (23 | 6.5%), Law Enforcement (23 | 6.5%), and Healthcare Support (21 | 5.9%).
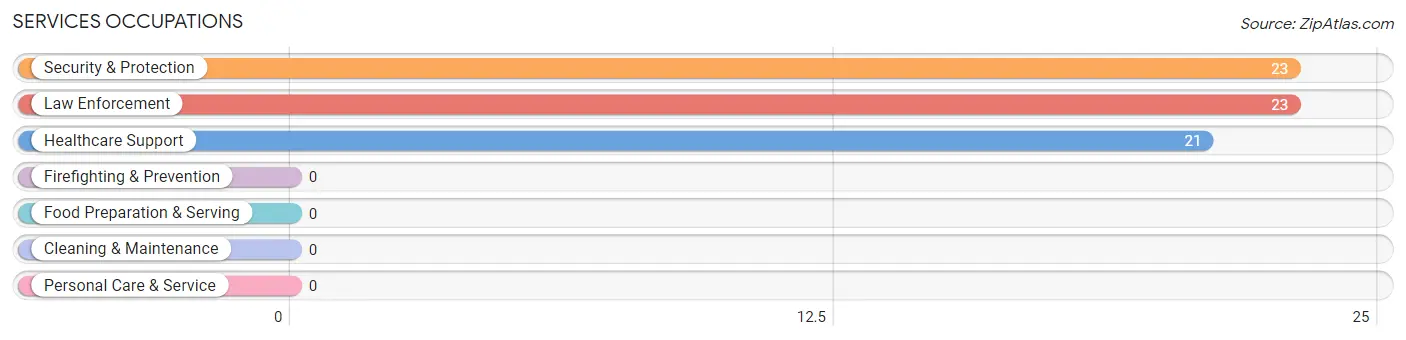
Services Occupations by Sex
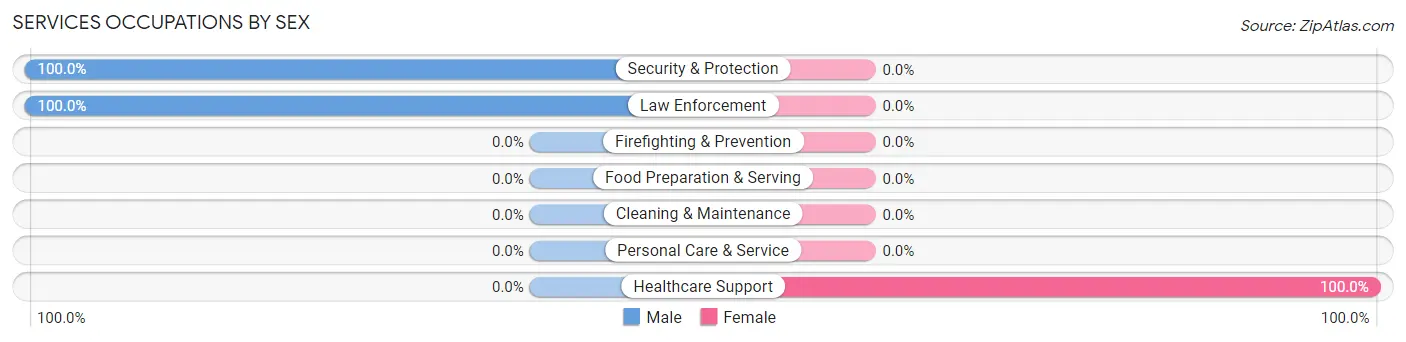
| Occupation | Male | Female |
| Healthcare Support | 0 (0.0%) | 21 (100.0%) |
| Security & Protection | 23 (100.0%) | 0 (0.0%) |
| Firefighting & Prevention | 0 (0.0%) | 0 (0.0%) |
| Law Enforcement | 23 (100.0%) | 0 (0.0%) |
| Food Preparation & Serving | 0 (0.0%) | 0 (0.0%) |
| Cleaning & Maintenance | 0 (0.0%) | 0 (0.0%) |
| Personal Care & Service | 0 (0.0%) | 0 (0.0%) |
| Total (Category) | 23 (52.3%) | 21 (47.7%) |
| Total (Overall) | 232 (65.5%) | 122 (34.5%) |
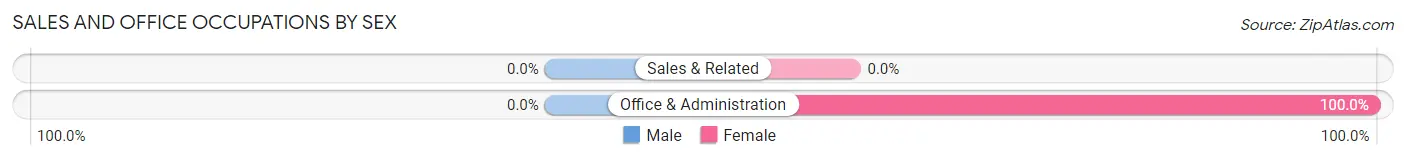
Sales and Office Occupations
The most common Sales and Office occupations in Hopeland are , and Office & Administration (28 | 7.9%).

Sales and Office Occupations by Sex
| Occupation | Male | Female |
| Sales & Related | 0 (0.0%) | 0 (0.0%) |
| Office & Administration | 0 (0.0%) | 28 (100.0%) |
| Total (Category) | 0 (0.0%) | 28 (100.0%) |
| Total (Overall) | 232 (65.5%) | 122 (34.5%) |
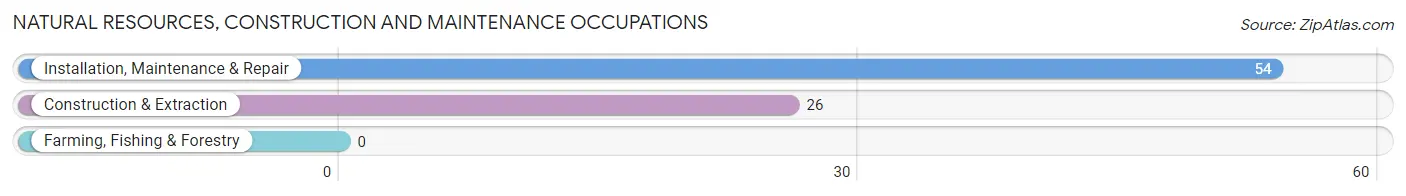
Natural Resources, Construction and Maintenance Occupations
The most common Natural Resources, Construction and Maintenance occupations in Hopeland are Installation, Maintenance & Repair (54 | 15.2%), and Construction & Extraction (26 | 7.3%).
Natural Resources, Construction and Maintenance Occupations by Sex
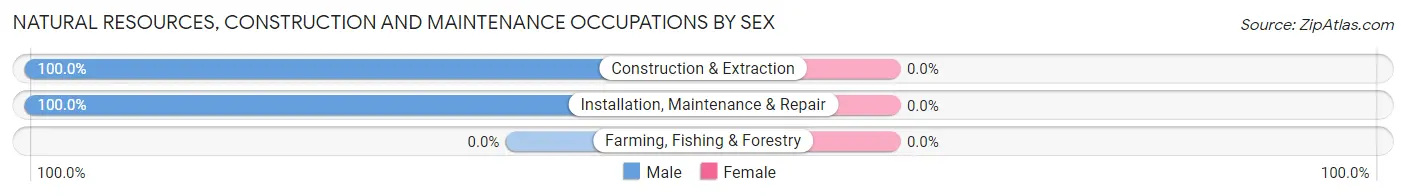
| Occupation | Male | Female |
| Farming, Fishing & Forestry | 0 (0.0%) | 0 (0.0%) |
| Construction & Extraction | 26 (100.0%) | 0 (0.0%) |
| Installation, Maintenance & Repair | 54 (100.0%) | 0 (0.0%) |
| Total (Category) | 80 (100.0%) | 0 (0.0%) |
| Total (Overall) | 232 (65.5%) | 122 (34.5%) |
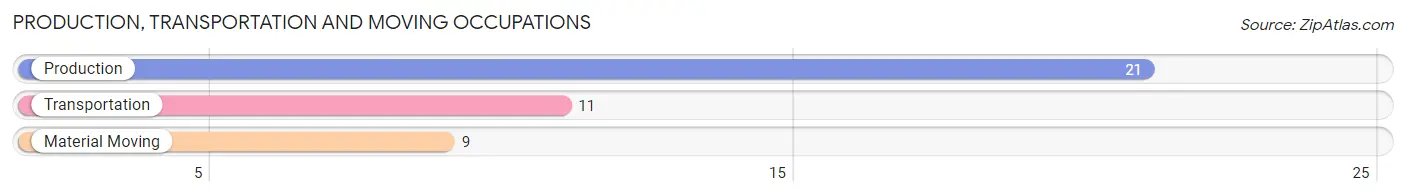
Production, Transportation and Moving Occupations
The most common Production, Transportation and Moving occupations in Hopeland are Production (21 | 5.9%), Transportation (11 | 3.1%), and Material Moving (9 | 2.5%).
Production, Transportation and Moving Occupations by Sex
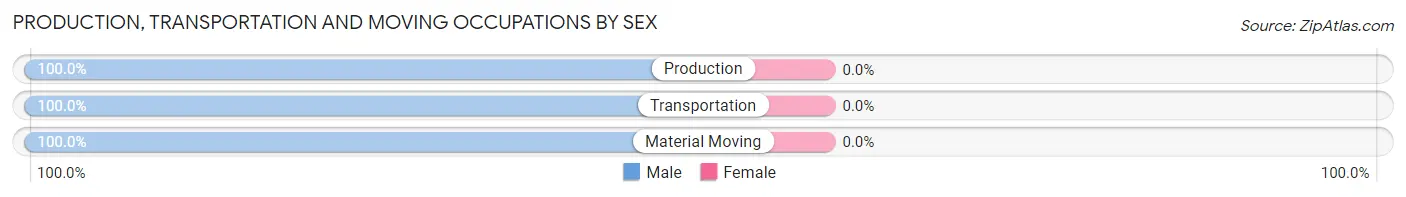
| Occupation | Male | Female |
| Production | 21 (100.0%) | 0 (0.0%) |
| Transportation | 11 (100.0%) | 0 (0.0%) |
| Material Moving | 9 (100.0%) | 0 (0.0%) |
| Total (Category) | 41 (100.0%) | 0 (0.0%) |
| Total (Overall) | 232 (65.5%) | 122 (34.5%) |
Employment Industries by Sex in Hopeland
Employment Industries in Hopeland
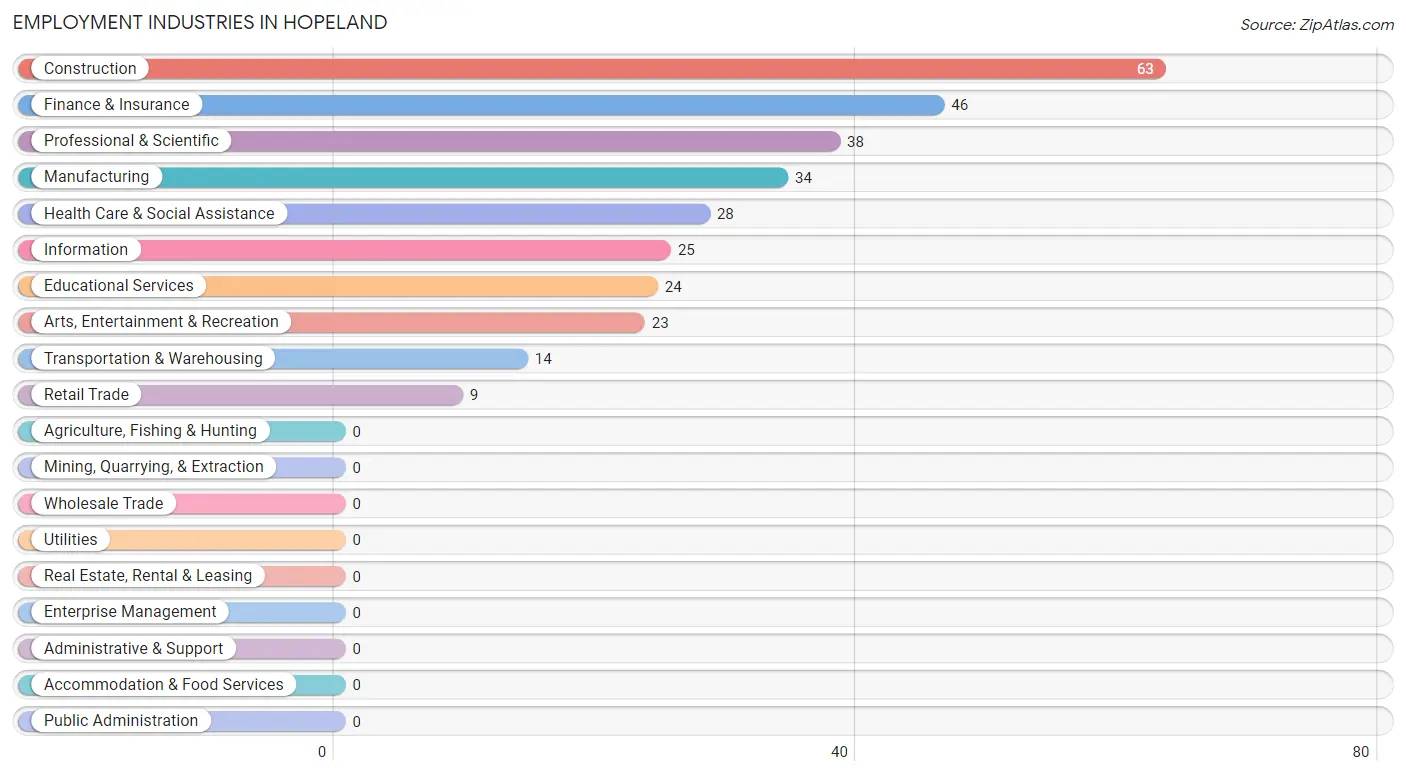
The major employment industries in Hopeland include Construction (63 | 17.8%), Finance & Insurance (46 | 13.0%), Professional & Scientific (38 | 10.7%), Manufacturing (34 | 9.6%), and Health Care & Social Assistance (28 | 7.9%).
Employment Industries by Sex in Hopeland
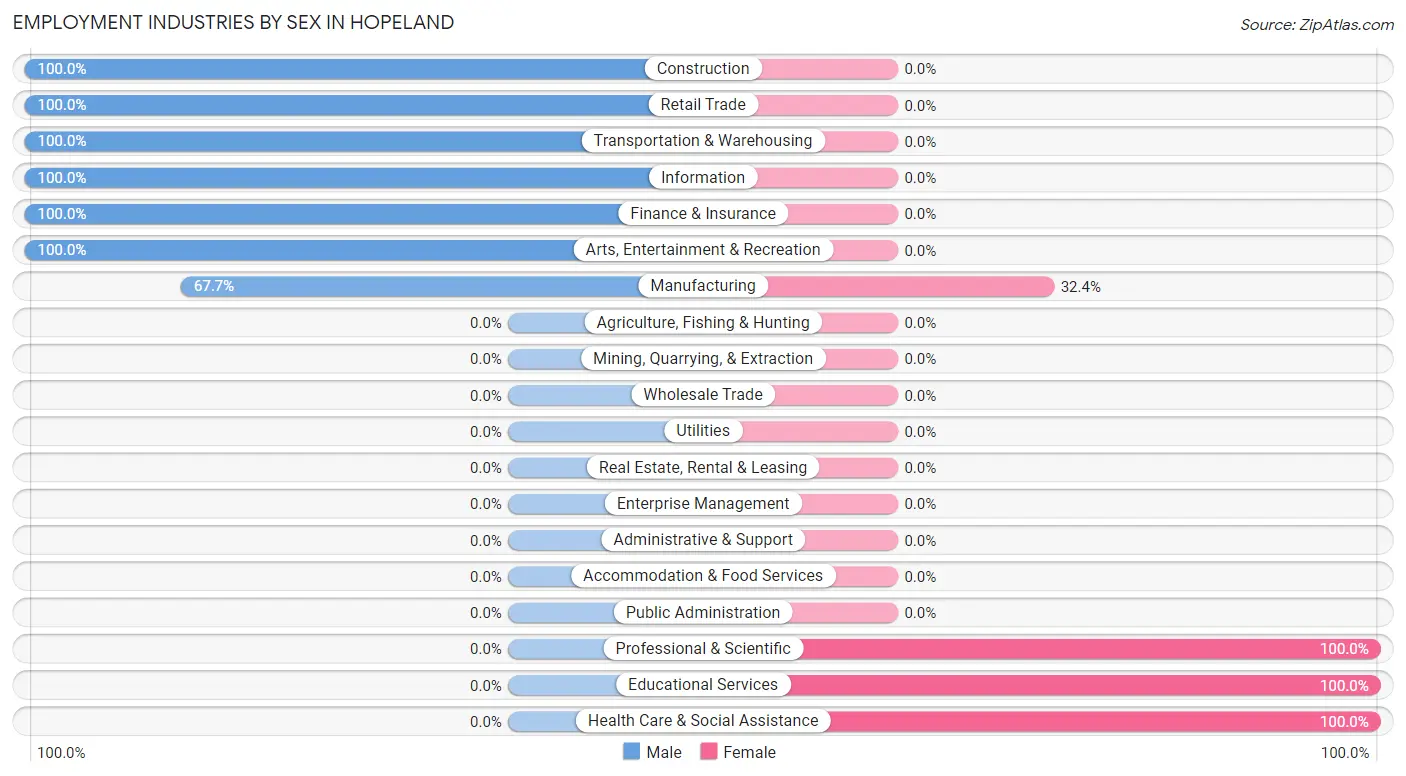
The Hopeland industries that see more men than women are Construction (100.0%), Retail Trade (100.0%), and Transportation & Warehousing (100.0%), whereas the industries that tend to have a higher number of women are Professional & Scientific (100.0%), Educational Services (100.0%), and Health Care & Social Assistance (100.0%).
| Industry | Male | Female |
| Agriculture, Fishing & Hunting | 0 (0.0%) | 0 (0.0%) |
| Mining, Quarrying, & Extraction | 0 (0.0%) | 0 (0.0%) |
| Construction | 63 (100.0%) | 0 (0.0%) |
| Manufacturing | 23 (67.6%) | 11 (32.4%) |
| Wholesale Trade | 0 (0.0%) | 0 (0.0%) |
| Retail Trade | 9 (100.0%) | 0 (0.0%) |
| Transportation & Warehousing | 14 (100.0%) | 0 (0.0%) |
| Utilities | 0 (0.0%) | 0 (0.0%) |
| Information | 25 (100.0%) | 0 (0.0%) |
| Finance & Insurance | 46 (100.0%) | 0 (0.0%) |
| Real Estate, Rental & Leasing | 0 (0.0%) | 0 (0.0%) |
| Professional & Scientific | 0 (0.0%) | 38 (100.0%) |
| Enterprise Management | 0 (0.0%) | 0 (0.0%) |
| Administrative & Support | 0 (0.0%) | 0 (0.0%) |
| Educational Services | 0 (0.0%) | 24 (100.0%) |
| Health Care & Social Assistance | 0 (0.0%) | 28 (100.0%) |
| Arts, Entertainment & Recreation | 23 (100.0%) | 0 (0.0%) |
| Accommodation & Food Services | 0 (0.0%) | 0 (0.0%) |
| Public Administration | 0 (0.0%) | 0 (0.0%) |
| Total | 232 (65.5%) | 122 (34.5%) |
Education in Hopeland
School Enrollment in Hopeland
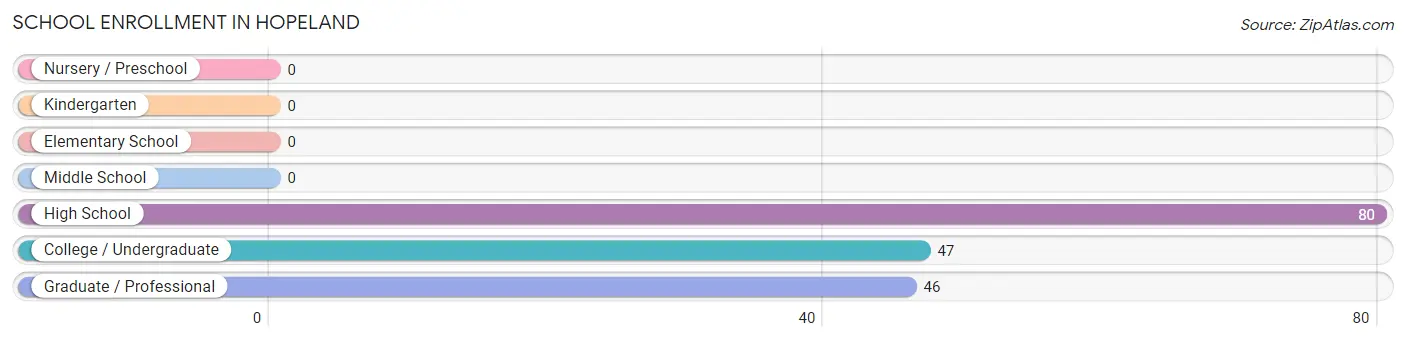
The most common levels of schooling among the 173 students in Hopeland are high school (80 | 46.2%), college / undergraduate (47 | 27.2%), and graduate / professional (46 | 26.6%).
| School Level | # Students | % Students |
| Nursery / Preschool | 0 | 0.0% |
| Kindergarten | 0 | 0.0% |
| Elementary School | 0 | 0.0% |
| Middle School | 0 | 0.0% |
| High School | 80 | 46.2% |
| College / Undergraduate | 47 | 27.2% |
| Graduate / Professional | 46 | 26.6% |
| Total | 173 | 100.0% |
School Enrollment by Age by Funding Source in Hopeland
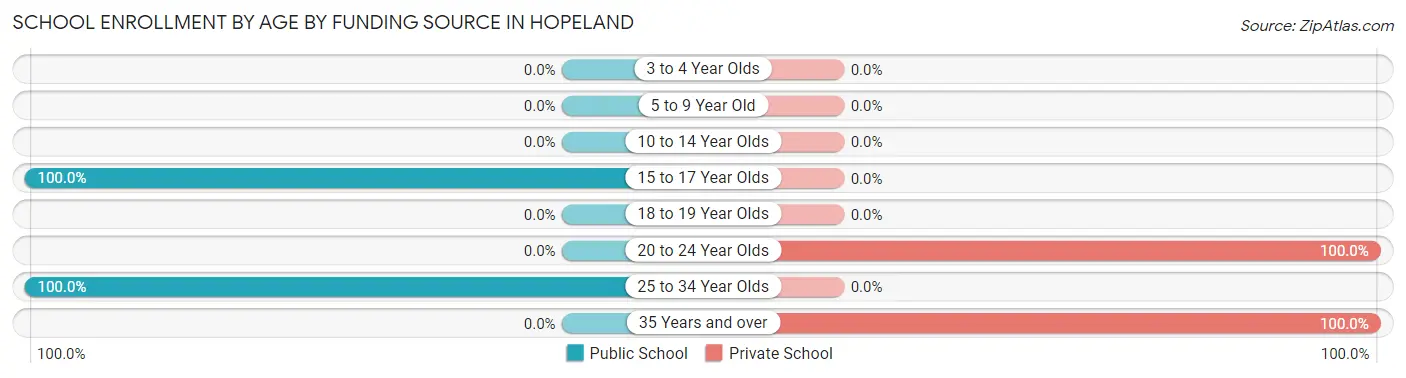
Out of a total of 173 students who are enrolled in schools in Hopeland, 70 (40.5%) attend a private institution, while the remaining 103 (59.5%) are enrolled in public schools. The age group of 20 to 24 year olds has the highest likelihood of being enrolled in private schools, with 24 (100.0% in the age bracket) enrolled. Conversely, the age group of 15 to 17 year olds has the lowest likelihood of being enrolled in a private school, with 80 (100.0% in the age bracket) attending a public institution.
| Age Bracket | Public School | Private School |
| 3 to 4 Year Olds | 0 (0.0%) | 0 (0.0%) |
| 5 to 9 Year Old | 0 (0.0%) | 0 (0.0%) |
| 10 to 14 Year Olds | 0 (0.0%) | 0 (0.0%) |
| 15 to 17 Year Olds | 80 (100.0%) | 0 (0.0%) |
| 18 to 19 Year Olds | 0 (0.0%) | 0 (0.0%) |
| 20 to 24 Year Olds | 0 (0.0%) | 24 (100.0%) |
| 25 to 34 Year Olds | 23 (100.0%) | 0 (0.0%) |
| 35 Years and over | 0 (0.0%) | 46 (100.0%) |
| Total | 103 (59.5%) | 70 (40.5%) |
Educational Attainment by Field of Study in Hopeland
Education (24 | 51.1%), and bio, nature & agricultural (23 | 48.9%) are the most common fields of study among 47 individuals in Hopeland who have obtained a bachelor's degree or higher.
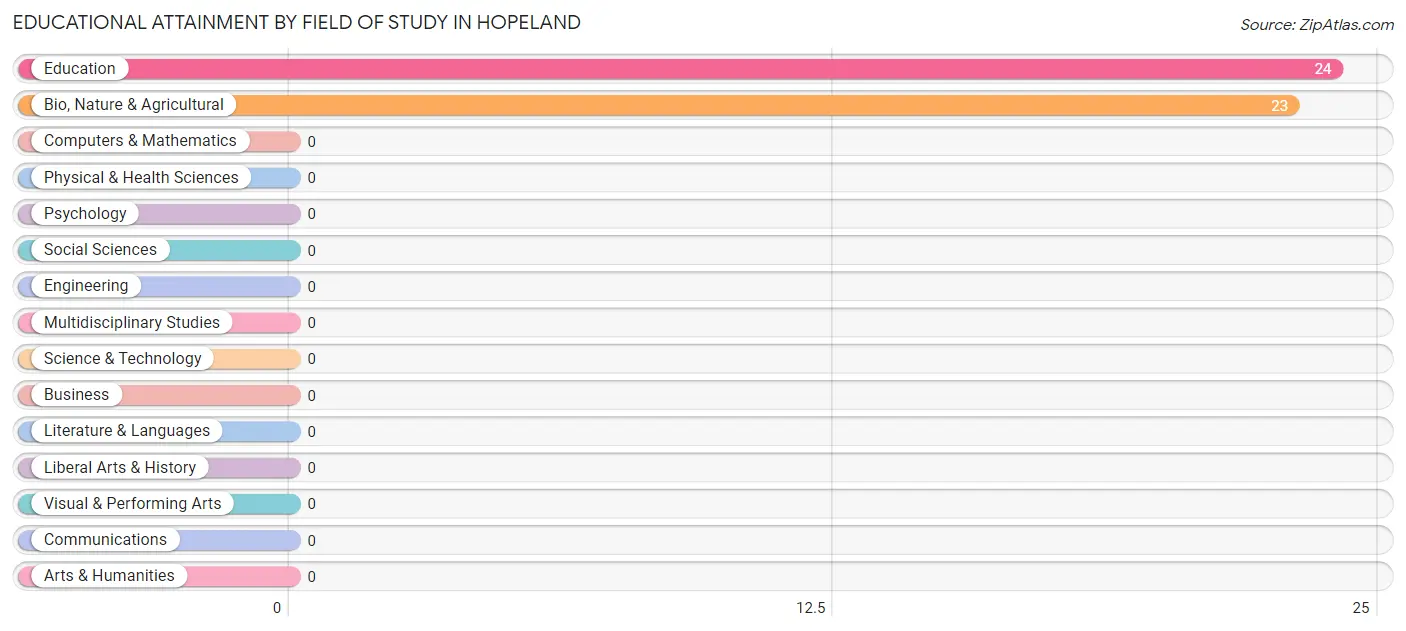
| Field of Study | # Graduates | % Graduates |
| Computers & Mathematics | 0 | 0.0% |
| Bio, Nature & Agricultural | 23 | 48.9% |
| Physical & Health Sciences | 0 | 0.0% |
| Psychology | 0 | 0.0% |
| Social Sciences | 0 | 0.0% |
| Engineering | 0 | 0.0% |
| Multidisciplinary Studies | 0 | 0.0% |
| Science & Technology | 0 | 0.0% |
| Business | 0 | 0.0% |
| Education | 24 | 51.1% |
| Literature & Languages | 0 | 0.0% |
| Liberal Arts & History | 0 | 0.0% |
| Visual & Performing Arts | 0 | 0.0% |
| Communications | 0 | 0.0% |
| Arts & Humanities | 0 | 0.0% |
| Total | 47 | 100.0% |
Transportation & Commute in Hopeland
Vehicle Availability by Sex in Hopeland
The most prevalent vehicle ownership categories in Hopeland are males with 2 vehicles (98, accounting for 42.2%) and females with 2 vehicles (94, making up 80.3%).
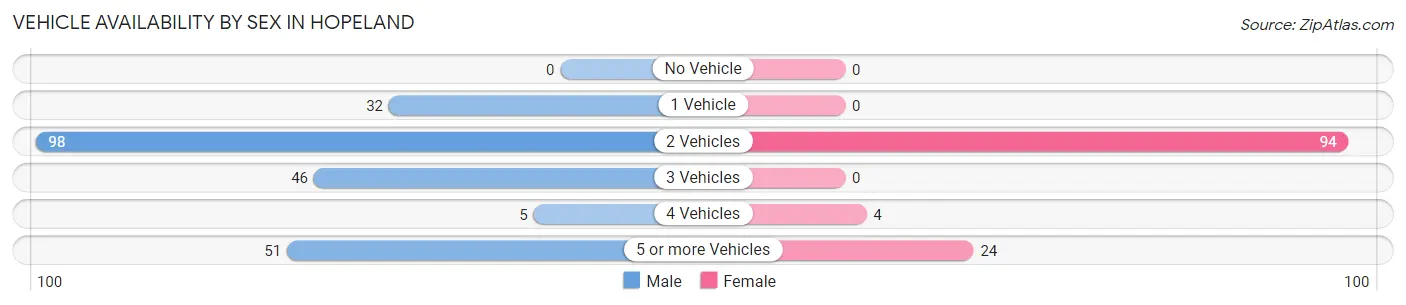
| Vehicles Available | Male | Female |
| No Vehicle | 0 (0.0%) | 0 (0.0%) |
| 1 Vehicle | 32 (13.8%) | 0 (0.0%) |
| 2 Vehicles | 98 (42.2%) | 94 (77.0%) |
| 3 Vehicles | 46 (19.8%) | 0 (0.0%) |
| 4 Vehicles | 5 (2.2%) | 4 (3.3%) |
| 5 or more Vehicles | 51 (22.0%) | 24 (19.7%) |
| Total | 232 (100.0%) | 122 (100.0%) |
Commute Time in Hopeland
The most frequently occuring commute durations in Hopeland are 30 to 34 minutes (63 commuters, 20.8%), 5 to 9 minutes (51 commuters, 16.8%), and 25 to 29 minutes (47 commuters, 15.5%).
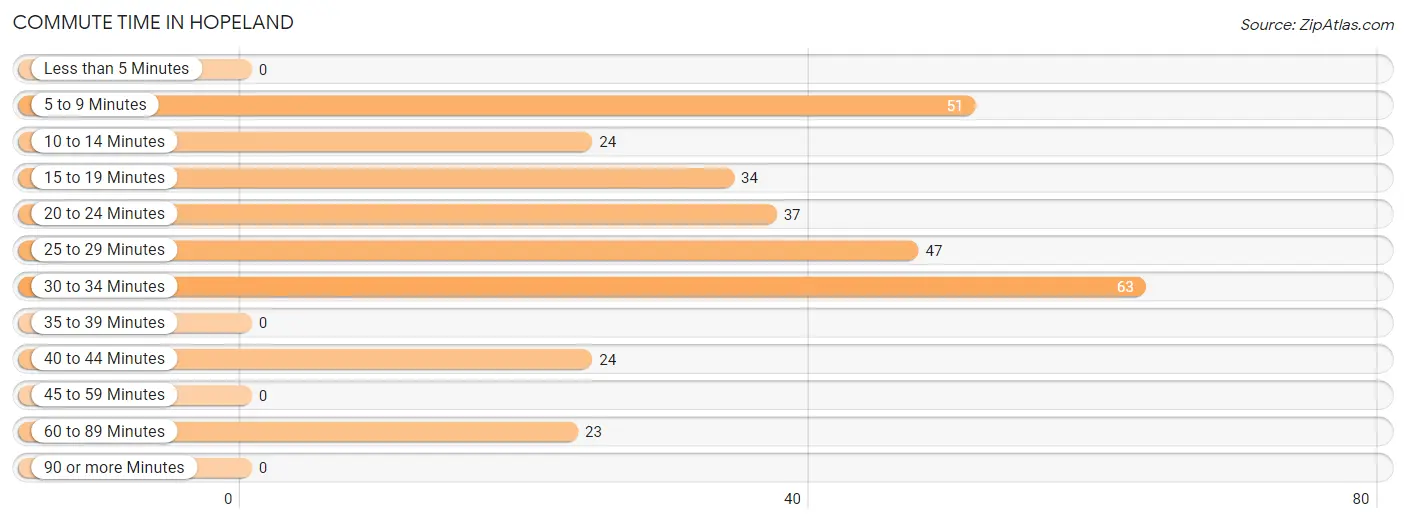
| Commute Time | # Commuters | % Commuters |
| Less than 5 Minutes | 0 | 0.0% |
| 5 to 9 Minutes | 51 | 16.8% |
| 10 to 14 Minutes | 24 | 7.9% |
| 15 to 19 Minutes | 34 | 11.2% |
| 20 to 24 Minutes | 37 | 12.2% |
| 25 to 29 Minutes | 47 | 15.5% |
| 30 to 34 Minutes | 63 | 20.8% |
| 35 to 39 Minutes | 0 | 0.0% |
| 40 to 44 Minutes | 24 | 7.9% |
| 45 to 59 Minutes | 0 | 0.0% |
| 60 to 89 Minutes | 23 | 7.6% |
| 90 or more Minutes | 0 | 0.0% |
Commute Time by Sex in Hopeland
The most common commute times in Hopeland are 30 to 34 minutes (52 commuters, 26.9%) for males and 20 to 24 minutes (26 commuters, 23.6%) for females.
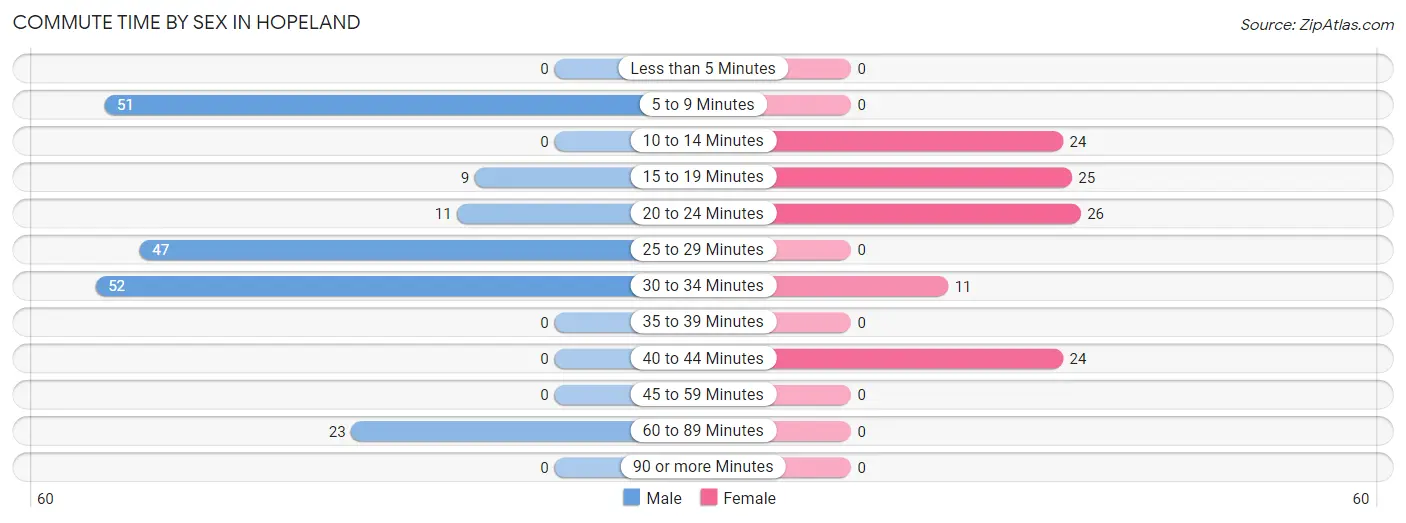
| Commute Time | Male | Female |
| Less than 5 Minutes | 0 (0.0%) | 0 (0.0%) |
| 5 to 9 Minutes | 51 (26.4%) | 0 (0.0%) |
| 10 to 14 Minutes | 0 (0.0%) | 24 (21.8%) |
| 15 to 19 Minutes | 9 (4.7%) | 25 (22.7%) |
| 20 to 24 Minutes | 11 (5.7%) | 26 (23.6%) |
| 25 to 29 Minutes | 47 (24.3%) | 0 (0.0%) |
| 30 to 34 Minutes | 52 (26.9%) | 11 (10.0%) |
| 35 to 39 Minutes | 0 (0.0%) | 0 (0.0%) |
| 40 to 44 Minutes | 0 (0.0%) | 24 (21.8%) |
| 45 to 59 Minutes | 0 (0.0%) | 0 (0.0%) |
| 60 to 89 Minutes | 23 (11.9%) | 0 (0.0%) |
| 90 or more Minutes | 0 (0.0%) | 0 (0.0%) |
Time of Departure to Work by Sex in Hopeland
The most frequent times of departure to work in Hopeland are 6:30 AM to 6:59 AM (78, 40.4%) for males and 6:30 AM to 6:59 AM (48, 43.6%) for females.
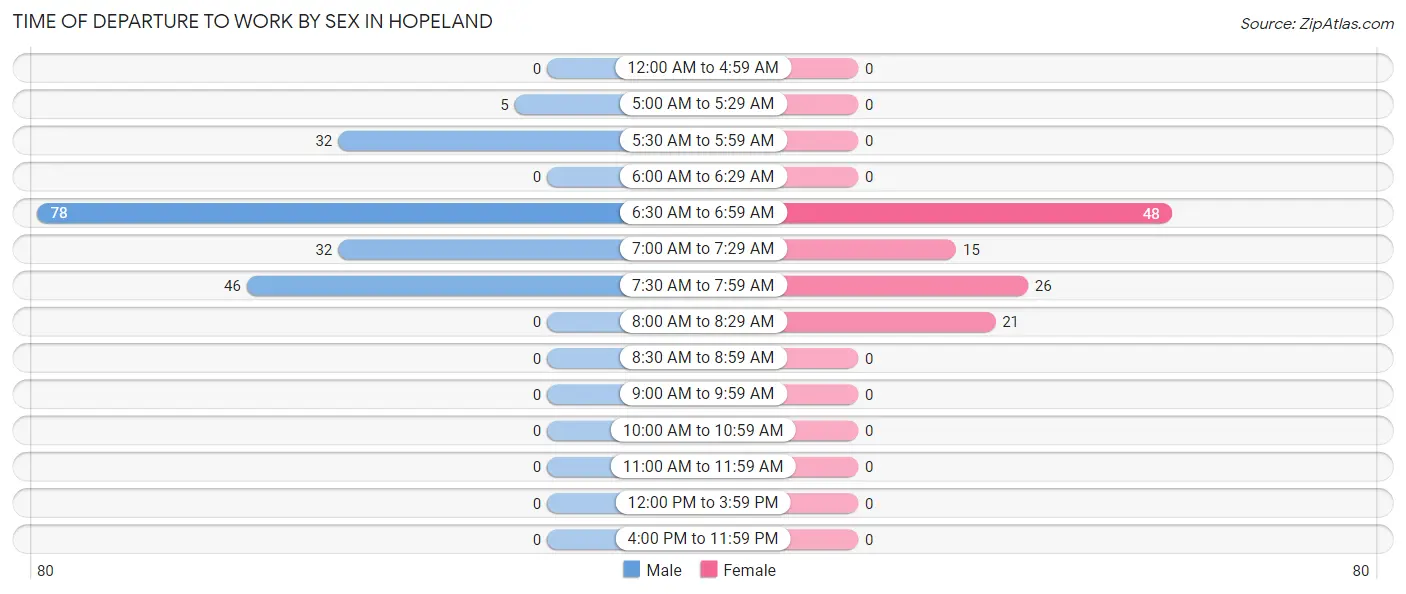
| Time of Departure | Male | Female |
| 12:00 AM to 4:59 AM | 0 (0.0%) | 0 (0.0%) |
| 5:00 AM to 5:29 AM | 5 (2.6%) | 0 (0.0%) |
| 5:30 AM to 5:59 AM | 32 (16.6%) | 0 (0.0%) |
| 6:00 AM to 6:29 AM | 0 (0.0%) | 0 (0.0%) |
| 6:30 AM to 6:59 AM | 78 (40.4%) | 48 (43.6%) |
| 7:00 AM to 7:29 AM | 32 (16.6%) | 15 (13.6%) |
| 7:30 AM to 7:59 AM | 46 (23.8%) | 26 (23.6%) |
| 8:00 AM to 8:29 AM | 0 (0.0%) | 21 (19.1%) |
| 8:30 AM to 8:59 AM | 0 (0.0%) | 0 (0.0%) |
| 9:00 AM to 9:59 AM | 0 (0.0%) | 0 (0.0%) |
| 10:00 AM to 10:59 AM | 0 (0.0%) | 0 (0.0%) |
| 11:00 AM to 11:59 AM | 0 (0.0%) | 0 (0.0%) |
| 12:00 PM to 3:59 PM | 0 (0.0%) | 0 (0.0%) |
| 4:00 PM to 11:59 PM | 0 (0.0%) | 0 (0.0%) |
| Total | 193 (100.0%) | 110 (100.0%) |
Housing Occupancy in Hopeland
Occupancy by Ownership in Hopeland
Of the total 242 dwellings in Hopeland, owner-occupied units account for 231 (95.5%), while renter-occupied units make up 11 (4.5%).
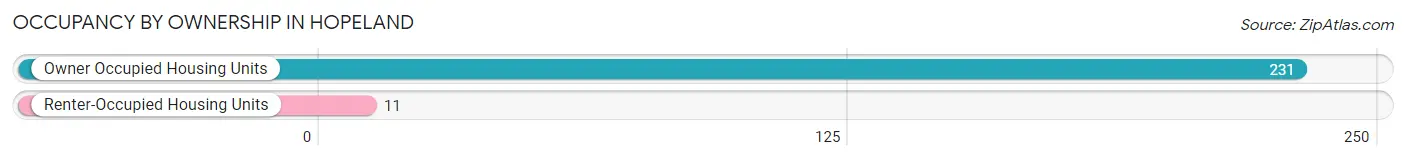
| Occupancy | # Housing Units | % Housing Units |
| Owner Occupied Housing Units | 231 | 95.5% |
| Renter-Occupied Housing Units | 11 | 4.5% |
| Total Occupied Housing Units | 242 | 100.0% |
Occupancy by Household Size in Hopeland
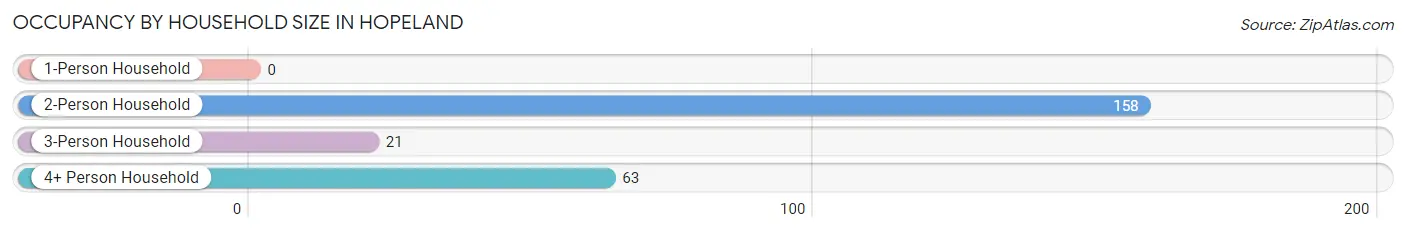
| Household Size | # Housing Units | % Housing Units |
| 1-Person Household | 0 | 0.0% |
| 2-Person Household | 158 | 65.3% |
| 3-Person Household | 21 | 8.7% |
| 4+ Person Household | 63 | 26.0% |
| Total Housing Units | 242 | 100.0% |
Occupancy by Ownership by Household Size in Hopeland
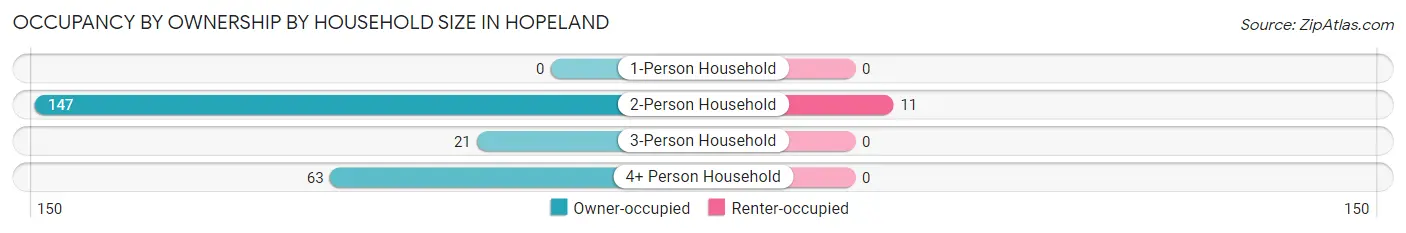
| Household Size | Owner-occupied | Renter-occupied |
| 1-Person Household | 0 (0.0%) | 0 (0.0%) |
| 2-Person Household | 147 (93.0%) | 11 (7.0%) |
| 3-Person Household | 21 (100.0%) | 0 (0.0%) |
| 4+ Person Household | 63 (100.0%) | 0 (0.0%) |
| Total Housing Units | 231 (95.5%) | 11 (4.5%) |
Occupancy by Educational Attainment in Hopeland
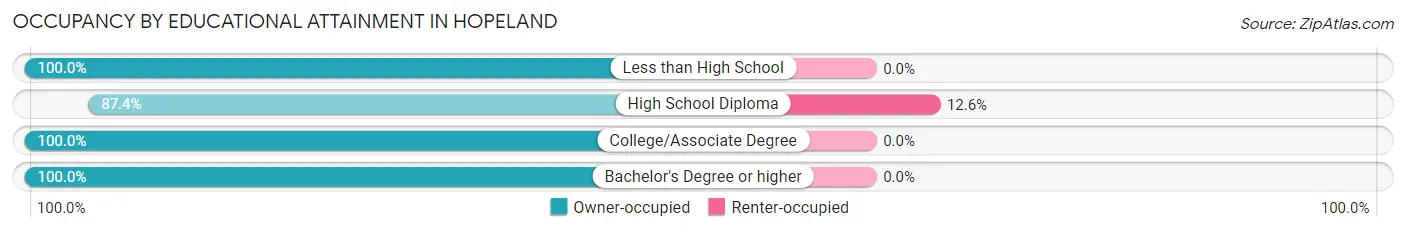
| Household Size | Owner-occupied | Renter-occupied |
| Less than High School | 26 (100.0%) | 0 (0.0%) |
| High School Diploma | 76 (87.4%) | 11 (12.6%) |
| College/Associate Degree | 105 (100.0%) | 0 (0.0%) |
| Bachelor's Degree or higher | 24 (100.0%) | 0 (0.0%) |
Occupancy by Age of Householder in Hopeland
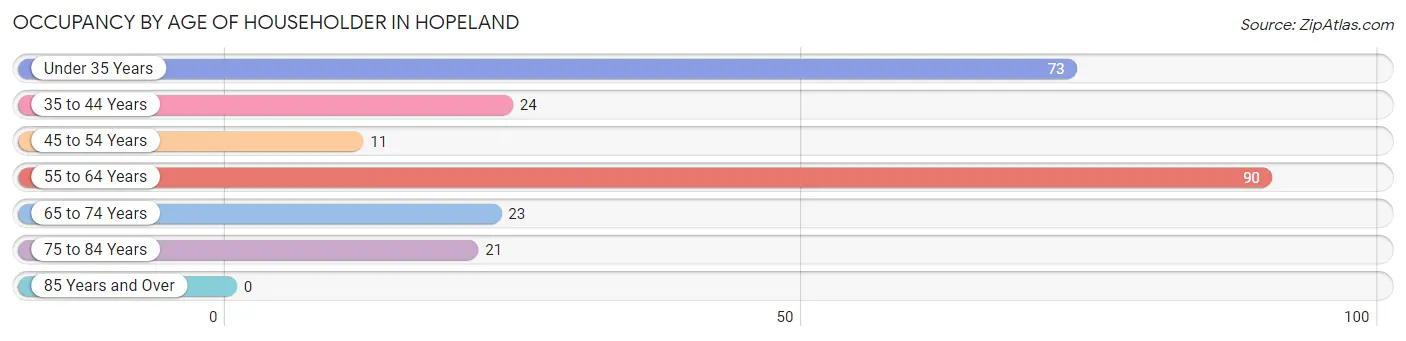
| Age Bracket | # Households | % Households |
| Under 35 Years | 73 | 30.2% |
| 35 to 44 Years | 24 | 9.9% |
| 45 to 54 Years | 11 | 4.5% |
| 55 to 64 Years | 90 | 37.2% |
| 65 to 74 Years | 23 | 9.5% |
| 75 to 84 Years | 21 | 8.7% |
| 85 Years and Over | 0 | 0.0% |
| Total | 242 | 100.0% |
Housing Finances in Hopeland
Median Income by Occupancy in Hopeland
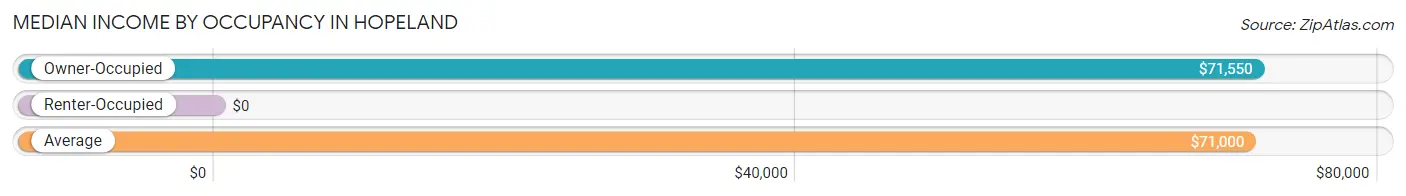
| Occupancy Type | # Households | Median Income |
| Owner-Occupied | 231 (95.5%) | $71,550 |
| Renter-Occupied | 11 (4.5%) | $0 |
| Average | 242 (100.0%) | $71,000 |
Occupancy by Householder Income Bracket in Hopeland
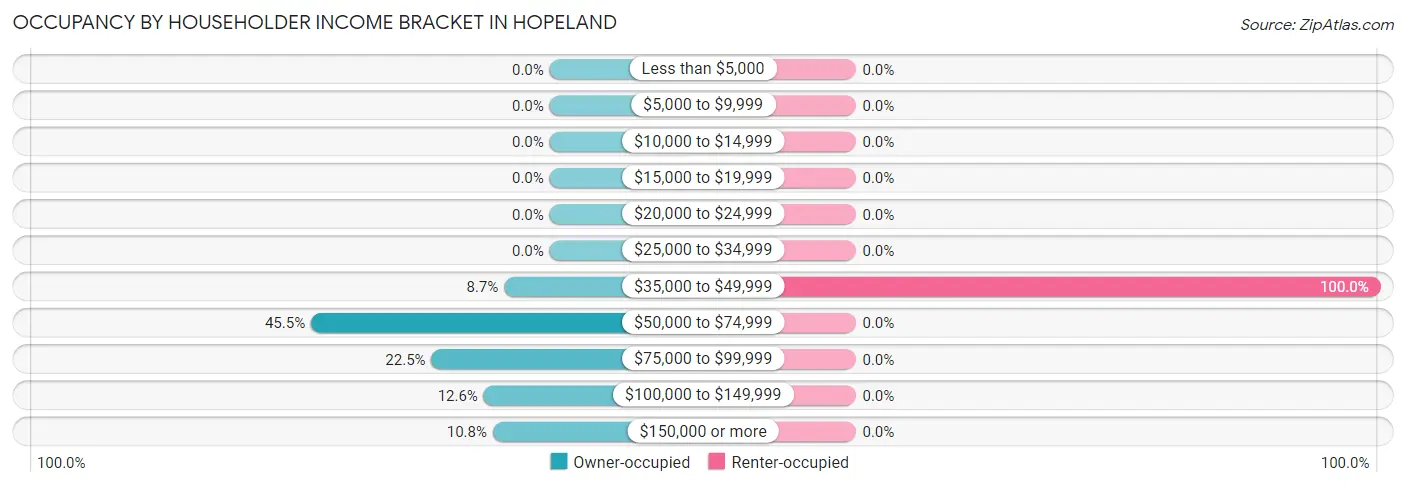
| Income Bracket | Owner-occupied | Renter-occupied |
| Less than $5,000 | 0 (0.0%) | 0 (0.0%) |
| $5,000 to $9,999 | 0 (0.0%) | 0 (0.0%) |
| $10,000 to $14,999 | 0 (0.0%) | 0 (0.0%) |
| $15,000 to $19,999 | 0 (0.0%) | 0 (0.0%) |
| $20,000 to $24,999 | 0 (0.0%) | 0 (0.0%) |
| $25,000 to $34,999 | 0 (0.0%) | 0 (0.0%) |
| $35,000 to $49,999 | 20 (8.7%) | 11 (100.0%) |
| $50,000 to $74,999 | 105 (45.5%) | 0 (0.0%) |
| $75,000 to $99,999 | 52 (22.5%) | 0 (0.0%) |
| $100,000 to $149,999 | 29 (12.6%) | 0 (0.0%) |
| $150,000 or more | 25 (10.8%) | 0 (0.0%) |
| Total | 231 (100.0%) | 11 (100.0%) |
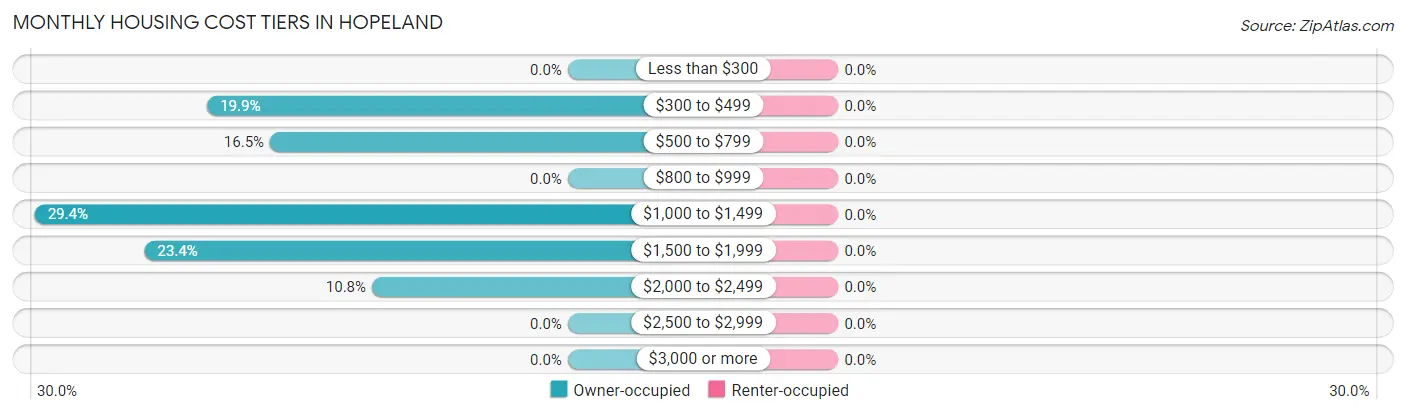
Monthly Housing Cost Tiers in Hopeland
| Monthly Cost | Owner-occupied | Renter-occupied |
| Less than $300 | 0 (0.0%) | 0 (0.0%) |
| $300 to $499 | 46 (19.9%) | 0 (0.0%) |
| $500 to $799 | 38 (16.5%) | 0 (0.0%) |
| $800 to $999 | 0 (0.0%) | 0 (0.0%) |
| $1,000 to $1,499 | 68 (29.4%) | 0 (0.0%) |
| $1,500 to $1,999 | 54 (23.4%) | 0 (0.0%) |
| $2,000 to $2,499 | 25 (10.8%) | 0 (0.0%) |
| $2,500 to $2,999 | 0 (0.0%) | 0 (0.0%) |
| $3,000 or more | 0 (0.0%) | 0 (0.0%) |
| Total | 231 (100.0%) | 11 (100.0%) |
Physical Housing Characteristics in Hopeland
Housing Structures in Hopeland
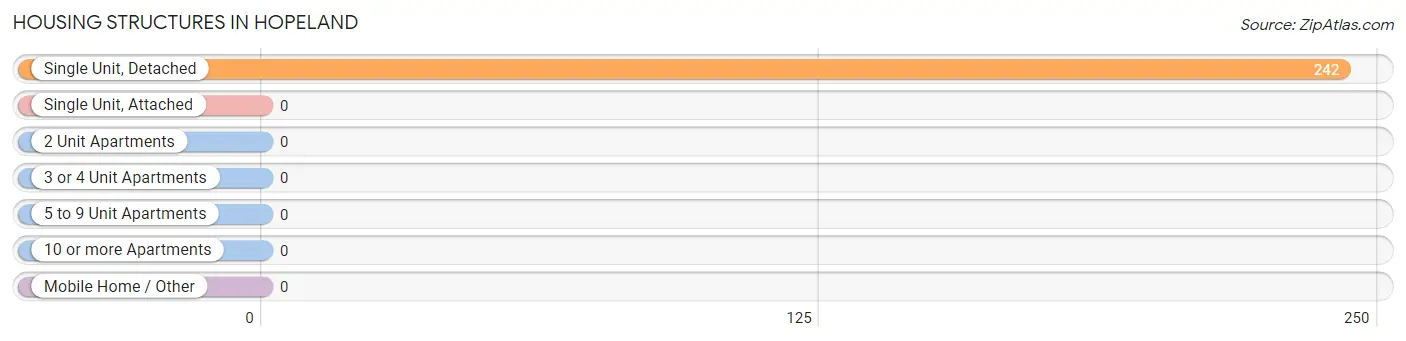
| Structure Type | # Housing Units | % Housing Units |
| Single Unit, Detached | 242 | 100.0% |
| Single Unit, Attached | 0 | 0.0% |
| 2 Unit Apartments | 0 | 0.0% |
| 3 or 4 Unit Apartments | 0 | 0.0% |
| 5 to 9 Unit Apartments | 0 | 0.0% |
| 10 or more Apartments | 0 | 0.0% |
| Mobile Home / Other | 0 | 0.0% |
| Total | 242 | 100.0% |
Housing Structures by Occupancy in Hopeland
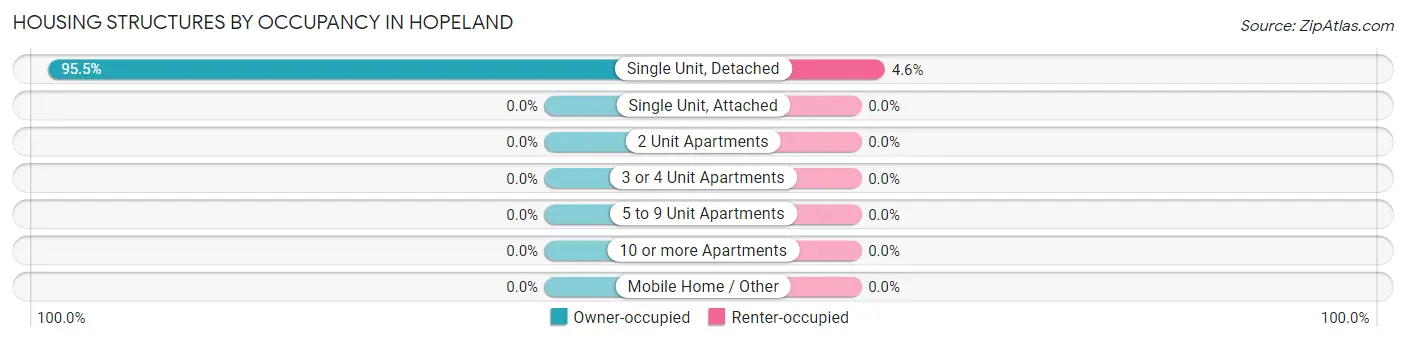
| Structure Type | Owner-occupied | Renter-occupied |
| Single Unit, Detached | 231 (95.5%) | 11 (4.5%) |
| Single Unit, Attached | 0 (0.0%) | 0 (0.0%) |
| 2 Unit Apartments | 0 (0.0%) | 0 (0.0%) |
| 3 or 4 Unit Apartments | 0 (0.0%) | 0 (0.0%) |
| 5 to 9 Unit Apartments | 0 (0.0%) | 0 (0.0%) |
| 10 or more Apartments | 0 (0.0%) | 0 (0.0%) |
| Mobile Home / Other | 0 (0.0%) | 0 (0.0%) |
| Total | 231 (95.5%) | 11 (4.5%) |
Housing Structures by Number of Rooms in Hopeland
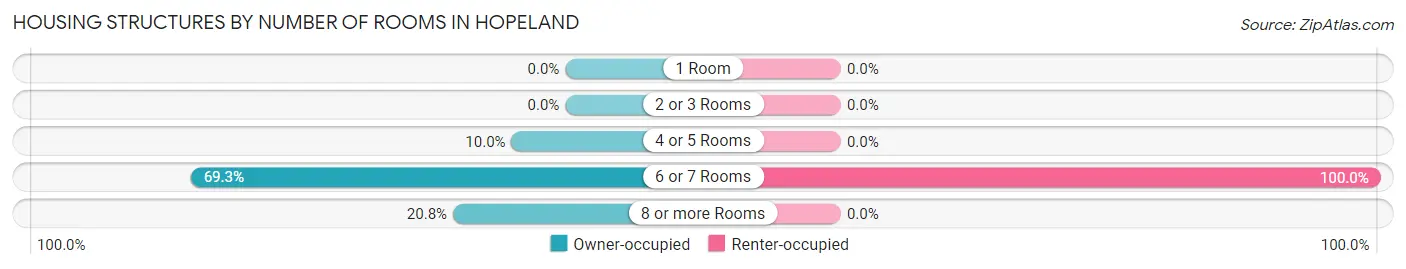
| Number of Rooms | Owner-occupied | Renter-occupied |
| 1 Room | 0 (0.0%) | 0 (0.0%) |
| 2 or 3 Rooms | 0 (0.0%) | 0 (0.0%) |
| 4 or 5 Rooms | 23 (10.0%) | 0 (0.0%) |
| 6 or 7 Rooms | 160 (69.3%) | 11 (100.0%) |
| 8 or more Rooms | 48 (20.8%) | 0 (0.0%) |
| Total | 231 (100.0%) | 11 (100.0%) |
Housing Structure by Heating Type in Hopeland
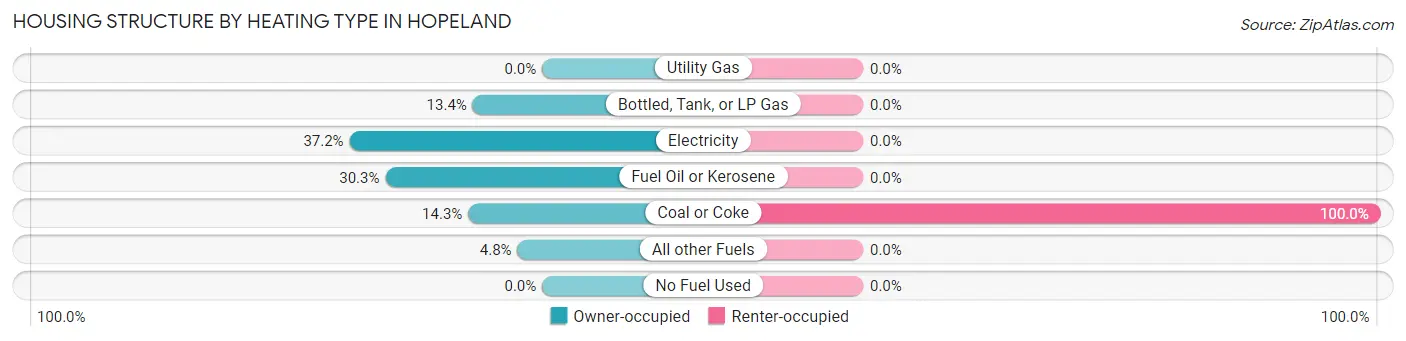
| Heating Type | Owner-occupied | Renter-occupied |
| Utility Gas | 0 (0.0%) | 0 (0.0%) |
| Bottled, Tank, or LP Gas | 31 (13.4%) | 0 (0.0%) |
| Electricity | 86 (37.2%) | 0 (0.0%) |
| Fuel Oil or Kerosene | 70 (30.3%) | 0 (0.0%) |
| Coal or Coke | 33 (14.3%) | 11 (100.0%) |
| All other Fuels | 11 (4.8%) | 0 (0.0%) |
| No Fuel Used | 0 (0.0%) | 0 (0.0%) |
| Total | 231 (100.0%) | 11 (100.0%) |
Household Vehicle Usage in Hopeland
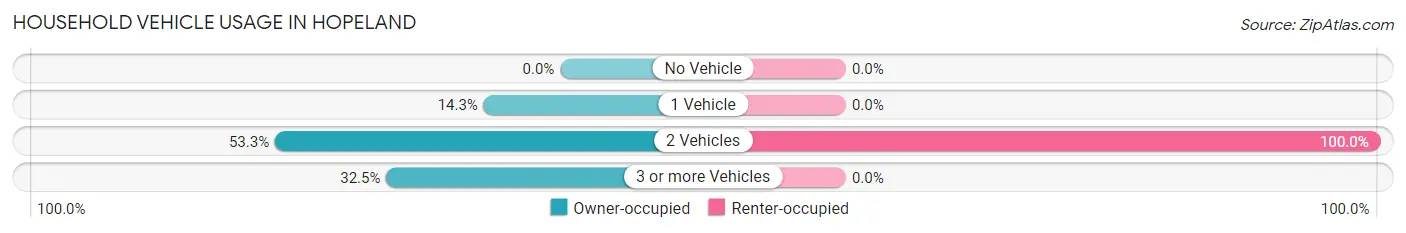
| Vehicles per Household | Owner-occupied | Renter-occupied |
| No Vehicle | 0 (0.0%) | 0 (0.0%) |
| 1 Vehicle | 33 (14.3%) | 0 (0.0%) |
| 2 Vehicles | 123 (53.2%) | 11 (100.0%) |
| 3 or more Vehicles | 75 (32.5%) | 0 (0.0%) |
| Total | 231 (100.0%) | 11 (100.0%) |
Real Estate & Mortgages in Hopeland
Real Estate and Mortgage Overview in Hopeland
| Characteristic | Without Mortgage | With Mortgage |
| Housing Units | 46 | 185 |
| Median Property Value | $278,800 | $199,200 |
| Median Household Income | $62,857 | $25 |
| Monthly Housing Costs | $640 | $0 |
| Real Estate Taxes | $3,561 | $0 |
Property Value by Mortgage Status in Hopeland
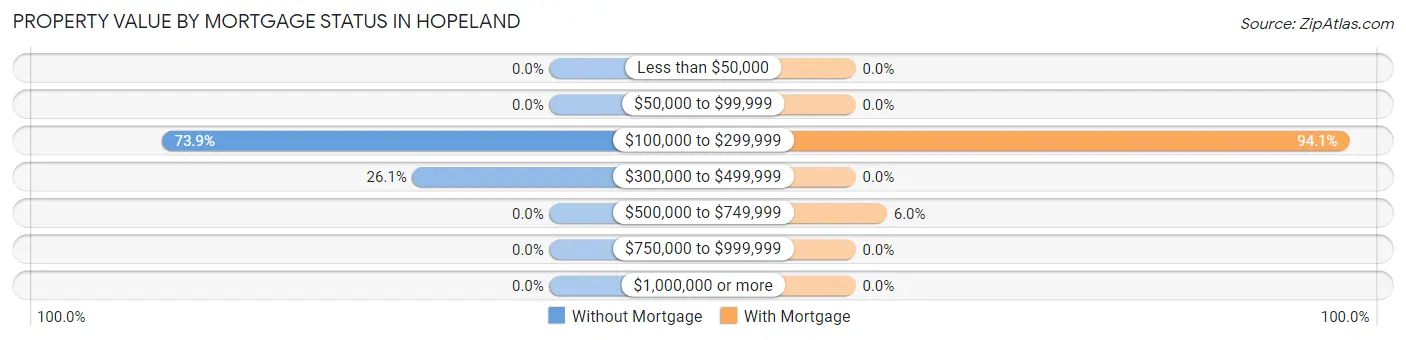
| Property Value | Without Mortgage | With Mortgage |
| Less than $50,000 | 0 (0.0%) | 0 (0.0%) |
| $50,000 to $99,999 | 0 (0.0%) | 0 (0.0%) |
| $100,000 to $299,999 | 34 (73.9%) | 174 (94.1%) |
| $300,000 to $499,999 | 12 (26.1%) | 0 (0.0%) |
| $500,000 to $749,999 | 0 (0.0%) | 11 (5.9%) |
| $750,000 to $999,999 | 0 (0.0%) | 0 (0.0%) |
| $1,000,000 or more | 0 (0.0%) | 0 (0.0%) |
| Total | 46 (100.0%) | 185 (100.0%) |
Household Income by Mortgage Status in Hopeland
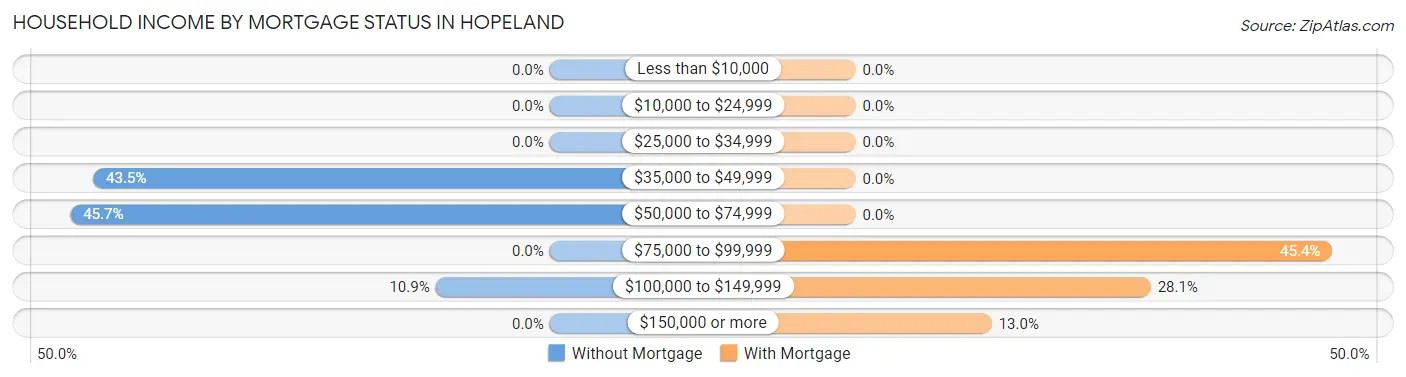
| Household Income | Without Mortgage | With Mortgage |
| Less than $10,000 | 0 (0.0%) | 0 (0.0%) |
| $10,000 to $24,999 | 0 (0.0%) | 0 (0.0%) |
| $25,000 to $34,999 | 0 (0.0%) | 0 (0.0%) |
| $35,000 to $49,999 | 20 (43.5%) | 0 (0.0%) |
| $50,000 to $74,999 | 21 (45.7%) | 0 (0.0%) |
| $75,000 to $99,999 | 0 (0.0%) | 84 (45.4%) |
| $100,000 to $149,999 | 5 (10.9%) | 52 (28.1%) |
| $150,000 or more | 0 (0.0%) | 24 (13.0%) |
| Total | 46 (100.0%) | 185 (100.0%) |
Property Value to Household Income Ratio in Hopeland
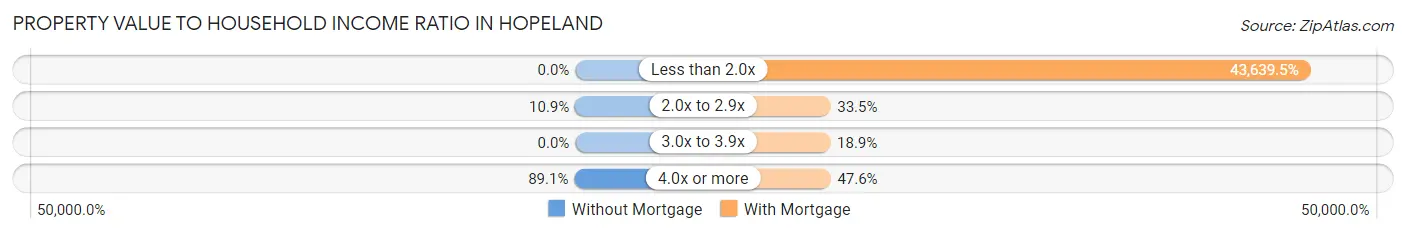
| Value-to-Income Ratio | Without Mortgage | With Mortgage |
| Less than 2.0x | 0 (0.0%) | 80,733 (43,639.5%) |
| 2.0x to 2.9x | 5 (10.9%) | 62 (33.5%) |
| 3.0x to 3.9x | 0 (0.0%) | 35 (18.9%) |
| 4.0x or more | 41 (89.1%) | 88 (47.6%) |
| Total | 46 (100.0%) | 185 (100.0%) |
Real Estate Taxes by Mortgage Status in Hopeland
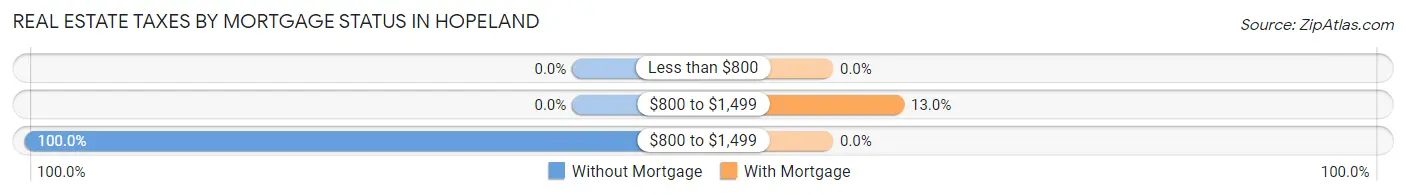
| Property Taxes | Without Mortgage | With Mortgage |
| Less than $800 | 0 (0.0%) | 0 (0.0%) |
| $800 to $1,499 | 0 (0.0%) | 24 (13.0%) |
| $800 to $1,499 | 46 (100.0%) | 0 (0.0%) |
| Total | 46 (100.0%) | 185 (100.0%) |
Health & Disability in Hopeland
Health Insurance Coverage by Age in Hopeland
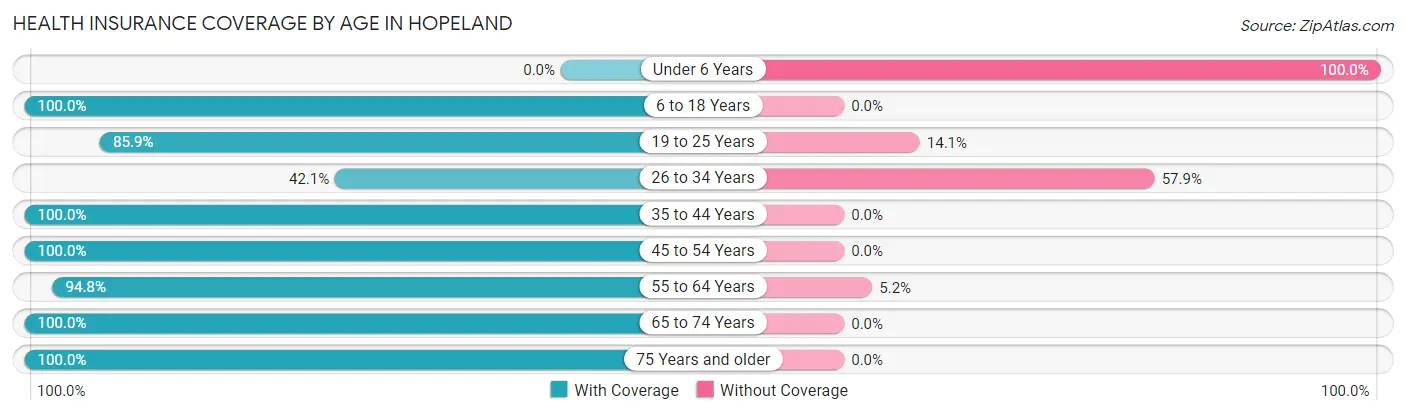
| Age Bracket | With Coverage | Without Coverage |
| Under 6 Years | 0 (0.0%) | 22 (100.0%) |
| 6 to 18 Years | 80 (100.0%) | 0 (0.0%) |
| 19 to 25 Years | 128 (85.9%) | 21 (14.1%) |
| 26 to 34 Years | 32 (42.1%) | 44 (57.9%) |
| 35 to 44 Years | 49 (100.0%) | 0 (0.0%) |
| 45 to 54 Years | 23 (100.0%) | 0 (0.0%) |
| 55 to 64 Years | 163 (94.8%) | 9 (5.2%) |
| 65 to 74 Years | 50 (100.0%) | 0 (0.0%) |
| 75 Years and older | 21 (100.0%) | 0 (0.0%) |
| Total | 546 (85.1%) | 96 (14.9%) |
Health Insurance Coverage by Citizenship Status in Hopeland
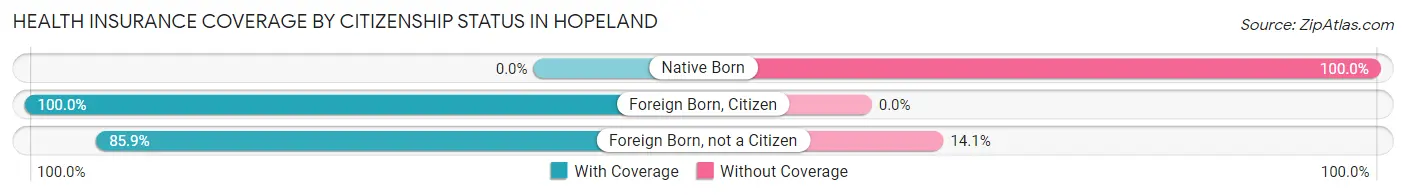
| Citizenship Status | With Coverage | Without Coverage |
| Native Born | 0 (0.0%) | 22 (100.0%) |
| Foreign Born, Citizen | 80 (100.0%) | 0 (0.0%) |
| Foreign Born, not a Citizen | 128 (85.9%) | 21 (14.1%) |
Health Insurance Coverage by Household Income in Hopeland
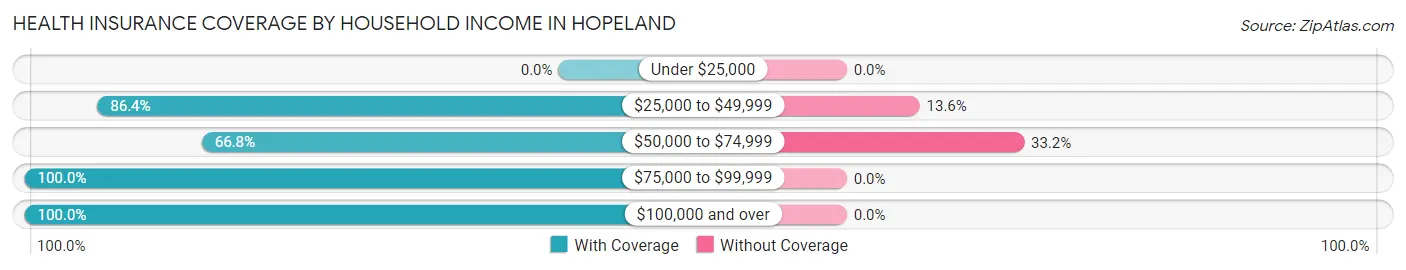
| Household Income | With Coverage | Without Coverage |
| Under $25,000 | 0 (0.0%) | 0 (0.0%) |
| $25,000 to $49,999 | 57 (86.4%) | 9 (13.6%) |
| $50,000 to $74,999 | 175 (66.8%) | 87 (33.2%) |
| $75,000 to $99,999 | 102 (100.0%) | 0 (0.0%) |
| $100,000 and over | 212 (100.0%) | 0 (0.0%) |
Public vs Private Health Insurance Coverage by Age in Hopeland
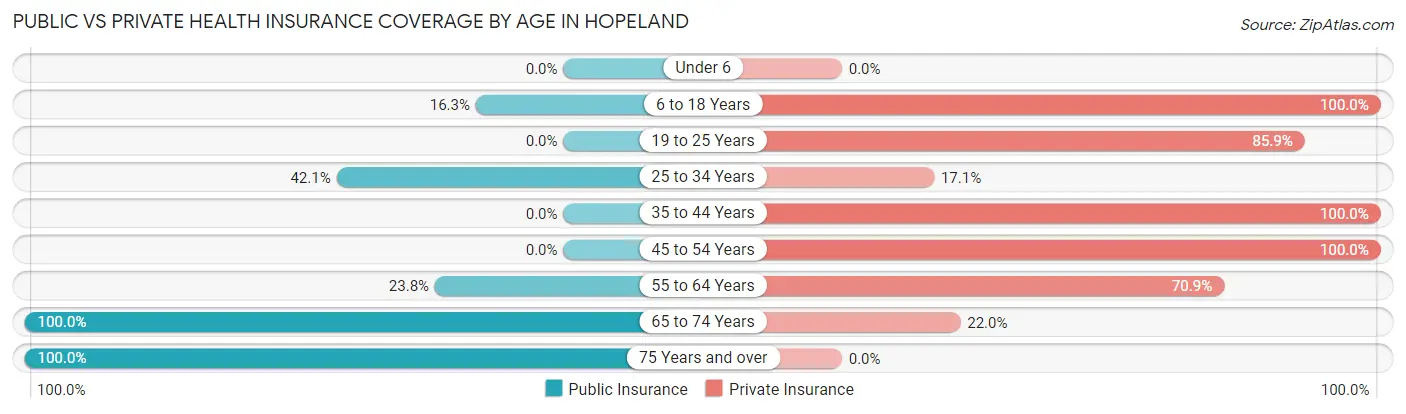
| Age Bracket | Public Insurance | Private Insurance |
| Under 6 | 0 (0.0%) | 0 (0.0%) |
| 6 to 18 Years | 13 (16.3%) | 80 (100.0%) |
| 19 to 25 Years | 0 (0.0%) | 128 (85.9%) |
| 25 to 34 Years | 32 (42.1%) | 13 (17.1%) |
| 35 to 44 Years | 0 (0.0%) | 49 (100.0%) |
| 45 to 54 Years | 0 (0.0%) | 23 (100.0%) |
| 55 to 64 Years | 41 (23.8%) | 122 (70.9%) |
| 65 to 74 Years | 50 (100.0%) | 11 (22.0%) |
| 75 Years and over | 21 (100.0%) | 0 (0.0%) |
| Total | 157 (24.4%) | 426 (66.4%) |
Disability Status by Sex by Age in Hopeland
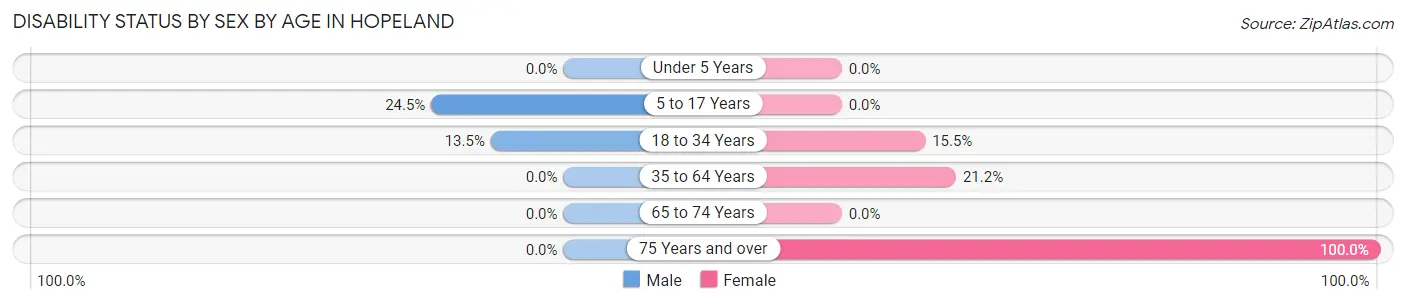
| Age Bracket | Male | Female |
| Under 5 Years | 0 (0.0%) | 0 (0.0%) |
| 5 to 17 Years | 13 (24.5%) | 0 (0.0%) |
| 18 to 34 Years | 19 (13.5%) | 13 (15.5%) |
| 35 to 64 Years | 0 (0.0%) | 25 (21.2%) |
| 65 to 74 Years | 0 (0.0%) | 0 (0.0%) |
| 75 Years and over | 0 (0.0%) | 8 (100.0%) |
Disability Class by Sex by Age in Hopeland
Disability Class: Hearing Difficulty
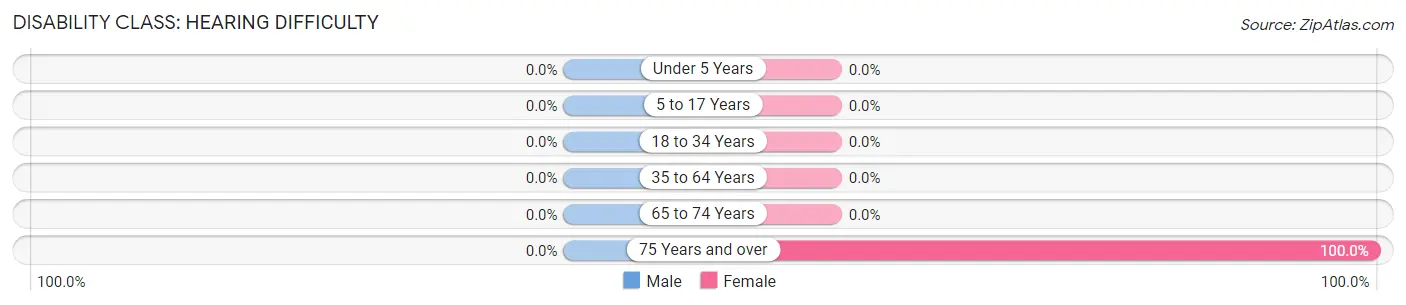
| Age Bracket | Male | Female |
| Under 5 Years | 0 (0.0%) | 0 (0.0%) |
| 5 to 17 Years | 0 (0.0%) | 0 (0.0%) |
| 18 to 34 Years | 0 (0.0%) | 0 (0.0%) |
| 35 to 64 Years | 0 (0.0%) | 0 (0.0%) |
| 65 to 74 Years | 0 (0.0%) | 0 (0.0%) |
| 75 Years and over | 0 (0.0%) | 8 (100.0%) |
Disability Class: Vision Difficulty
| Age Bracket | Male | Female |
| Under 5 Years | 0 (0.0%) | 0 (0.0%) |
| 5 to 17 Years | 0 (0.0%) | 0 (0.0%) |
| 18 to 34 Years | 0 (0.0%) | 0 (0.0%) |
| 35 to 64 Years | 0 (0.0%) | 0 (0.0%) |
| 65 to 74 Years | 0 (0.0%) | 0 (0.0%) |
| 75 Years and over | 0 (0.0%) | 0 (0.0%) |
Disability Class: Cognitive Difficulty
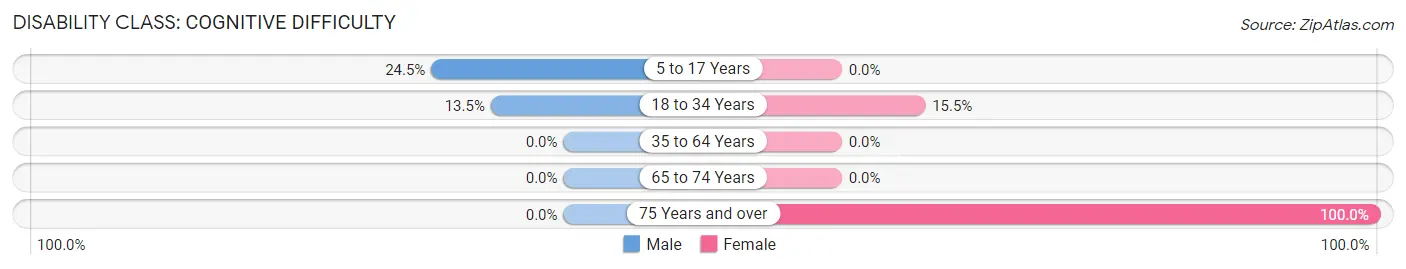
| Age Bracket | Male | Female |
| 5 to 17 Years | 13 (24.5%) | 0 (0.0%) |
| 18 to 34 Years | 19 (13.5%) | 13 (15.5%) |
| 35 to 64 Years | 0 (0.0%) | 0 (0.0%) |
| 65 to 74 Years | 0 (0.0%) | 0 (0.0%) |
| 75 Years and over | 0 (0.0%) | 8 (100.0%) |
Disability Class: Ambulatory Difficulty
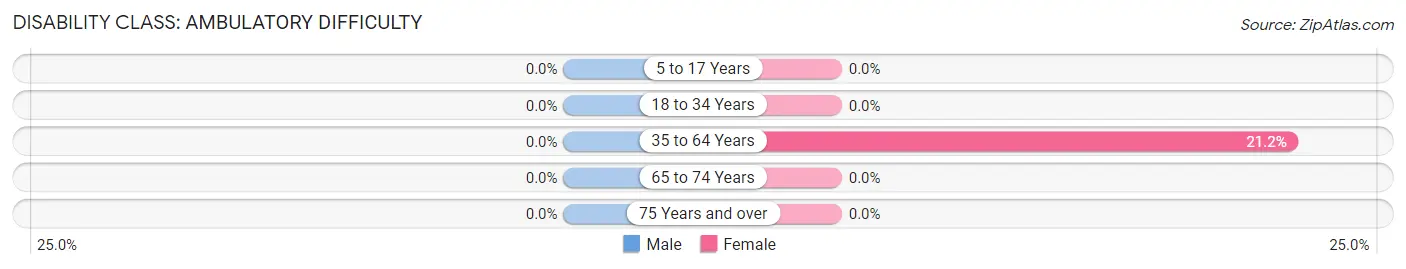
| Age Bracket | Male | Female |
| 5 to 17 Years | 0 (0.0%) | 0 (0.0%) |
| 18 to 34 Years | 0 (0.0%) | 0 (0.0%) |
| 35 to 64 Years | 0 (0.0%) | 25 (21.2%) |
| 65 to 74 Years | 0 (0.0%) | 0 (0.0%) |
| 75 Years and over | 0 (0.0%) | 0 (0.0%) |
Disability Class: Self-Care Difficulty
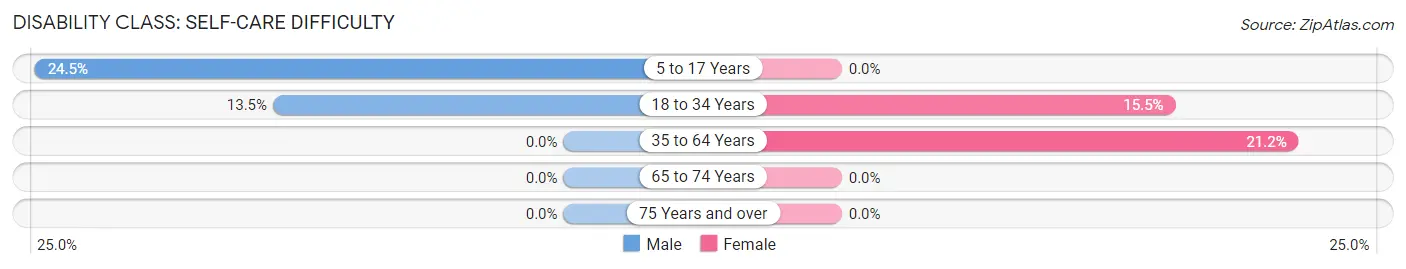
| Age Bracket | Male | Female |
| 5 to 17 Years | 13 (24.5%) | 0 (0.0%) |
| 18 to 34 Years | 19 (13.5%) | 13 (15.5%) |
| 35 to 64 Years | 0 (0.0%) | 25 (21.2%) |
| 65 to 74 Years | 0 (0.0%) | 0 (0.0%) |
| 75 Years and over | 0 (0.0%) | 0 (0.0%) |
Technology Access in Hopeland
Computing Device Access in Hopeland
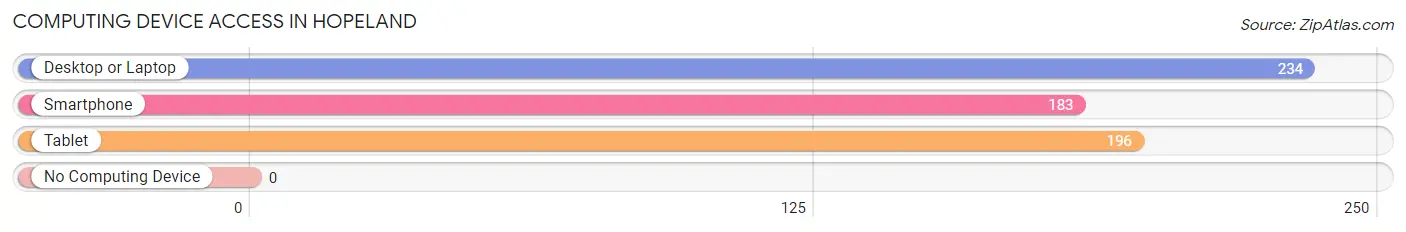
| Device Type | # Households | % Households |
| Desktop or Laptop | 234 | 96.7% |
| Smartphone | 183 | 75.6% |
| Tablet | 196 | 81.0% |
| No Computing Device | 0 | 0.0% |
| Total | 242 | 100.0% |
Internet Access in Hopeland
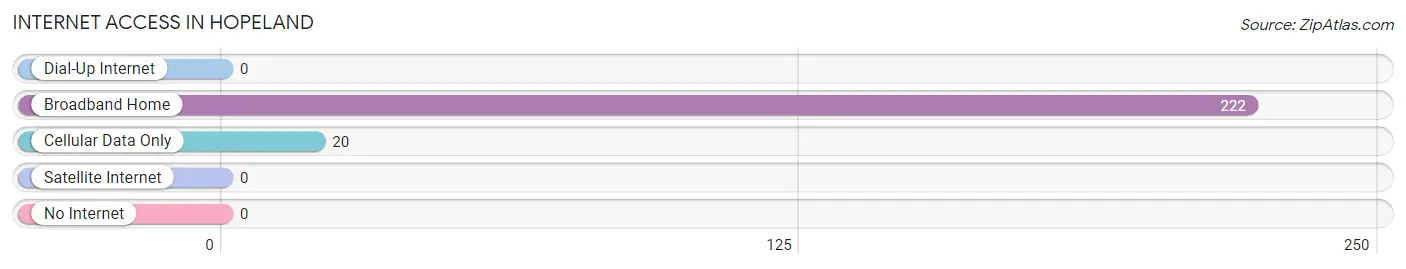
| Internet Type | # Households | % Households |
| Dial-Up Internet | 0 | 0.0% |
| Broadband Home | 222 | 91.7% |
| Cellular Data Only | 20 | 8.3% |
| Satellite Internet | 0 | 0.0% |
| No Internet | 0 | 0.0% |
| Total | 242 | 100.0% |
Hopeland Summary
HopeLand, Pennsylvania is a small borough located in the southeastern corner of the state. It is situated in the heart of the Susquehanna Valley, and is bordered by the Susquehanna River to the east and the Juniata River to the west. The borough is part of the Harrisburg-Carlisle Metropolitan Statistical Area, and is located approximately 25 miles south of Harrisburg.
History
HopeLand was founded in 1790 by a group of settlers from the nearby town of Carlisle. The settlers were looking for a place to settle and start a new life, and they chose the area that is now HopeLand. The town was named after the nearby Hope Creek, which was named by the settlers in honor of their new home.
The town quickly grew and prospered, and by the mid-1800s it was a thriving community. The town was home to a variety of businesses, including a grist mill, a saw mill, a tannery, and a blacksmith shop. The town also had a post office, a school, and several churches.
In the late 1800s, the town began to decline as the railroad bypassed it and the population began to move away. By the early 1900s, the town was nearly abandoned. However, in the 1950s, the town began to experience a resurgence as people began to move back to the area.
Geography
HopeLand is located in the southeastern corner of Pennsylvania, in the heart of the Susquehanna Valley. The borough is bordered by the Susquehanna River to the east and the Juniata River to the west. The borough is located approximately 25 miles south of Harrisburg.
The borough is situated on a flat plain, with an elevation of approximately 500 feet above sea level. The climate is temperate, with hot summers and cold winters. The average annual temperature is around 50 degrees Fahrenheit.
Economy
HopeLand’s economy is largely based on agriculture and tourism. The borough is home to several farms, which produce a variety of crops, including corn, soybeans, wheat, and hay. The borough also has several wineries, which produce a variety of wines.
The borough is also home to several small businesses, including restaurants, shops, and other services. The borough is also home to a small manufacturing sector, which produces a variety of products, including furniture, clothing, and electronics.
Demographics
As of the 2010 census, the population of HopeLand was 1,845. The population is predominantly white (94.3%), with a small percentage of African Americans (2.2%) and Hispanics (2.2%). The median household income is $45,000, and the median age is 43.
Conclusion
HopeLand, Pennsylvania is a small borough located in the southeastern corner of the state. It is situated in the heart of the Susquehanna Valley, and is bordered by the Susquehanna River to the east and the Juniata River to the west. The borough is part of the Harrisburg-Carlisle Metropolitan Statistical Area, and is located approximately 25 miles south of Harrisburg. The borough’s economy is largely based on agriculture and tourism, and the population is predominantly white.
Common Questions
What is Per Capita Income in Hopeland?
Per Capita income in Hopeland is $30,669.
What is the Median Family Income in Hopeland?
Median Family Income in Hopeland is $71,000.
What is the Median Household income in Hopeland?
Median Household Income in Hopeland is $71,000.
What is Income or Wage Gap in Hopeland?
Income or Wage Gap in Hopeland is 69.9%.
Women in Hopeland earn 30.1 cents for every dollar earned by a man.
What is Inequality or Gini Index in Hopeland?
Inequality or Gini Index in Hopeland is 0.24.
What is the Total Population of Hopeland?
Total Population of Hopeland is 642.
What is the Total Male Population of Hopeland?
Total Male Population of Hopeland is 346.
What is the Total Female Population of Hopeland?
Total Female Population of Hopeland is 296.
What is the Ratio of Males per 100 Females in Hopeland?
There are 116.89 Males per 100 Females in Hopeland.
What is the Ratio of Females per 100 Males in Hopeland?
There are 85.55 Females per 100 Males in Hopeland.
What is the Median Population Age in Hopeland?
Median Population Age in Hopeland is 33.7 Years.
What is the Average Family Size in Hopeland
Average Family Size in Hopeland is 2.6 People.
What is the Average Household Size in Hopeland
Average Household Size in Hopeland is 2.6 People.
How Large is the Labor Force in Hopeland?
There are 354 People in the Labor Forcein in Hopeland.
What is the Percentage of People in the Labor Force in Hopeland?
59.7% of People are in the Labor Force in Hopeland.