Zip Codes with the Highest Percentage of Population Employed in Installation, Maintenance & Repair in Lancaster, PA
RELATED REPORTS & OPTIONS
Installation, Maintenance & Repair
Lancaster
Compare Zip Codes
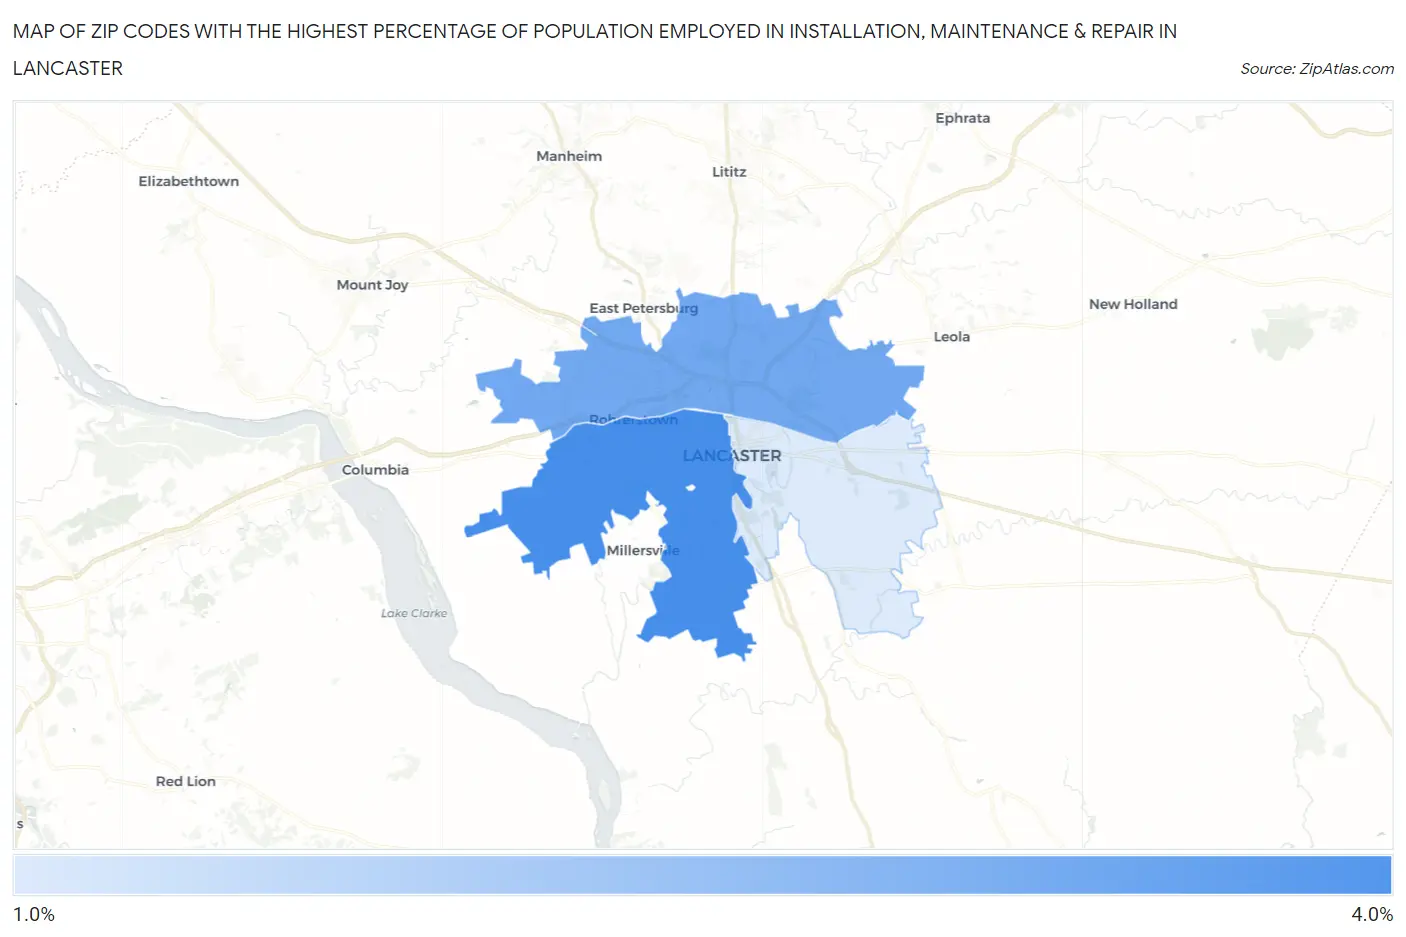
Map of Zip Codes with the Highest Percentage of Population Employed in Installation, Maintenance & Repair in Lancaster
1.9%
3.3%
Zip Codes with the Highest Percentage of Population Employed in Installation, Maintenance & Repair in Lancaster, PA
| Zip Code | % Employed | vs State | vs National | |
| 1. | 17603 | 3.3% | 3.1%(+0.238)#923 | 3.1%(+0.263)#15,415 |
| 2. | 17601 | 2.9% | 3.1%(-0.158)#1,006 | 3.1%(-0.134)#17,329 |
| 3. | 17602 | 1.9% | 3.1%(-1.20)#1,250 | 3.1%(-1.18)#22,503 |
1
Common Questions
What are the Top Zip Codes with the Highest Percentage of Population Employed in Installation, Maintenance & Repair in Lancaster, PA?
Top Zip Codes with the Highest Percentage of Population Employed in Installation, Maintenance & Repair in Lancaster, PA are:
What zip code has the Highest Percentage of Population Employed in Installation, Maintenance & Repair in Lancaster, PA?
17603 has the Highest Percentage of Population Employed in Installation, Maintenance & Repair in Lancaster, PA with 3.3%.
What is the Percentage of Population Employed in Installation, Maintenance & Repair in Lancaster, PA?
Percentage of Population Employed in Installation, Maintenance & Repair in Lancaster is 2.7%.
What is the Percentage of Population Employed in Installation, Maintenance & Repair in Pennsylvania?
Percentage of Population Employed in Installation, Maintenance & Repair in Pennsylvania is 3.1%.
What is the Percentage of Population Employed in Installation, Maintenance & Repair in the United States?
Percentage of Population Employed in Installation, Maintenance & Repair in the United States is 3.1%.