Shirleysburg borough, PA Map & Demographics
Shirleysburg borough Overview
$23,392
PER CAPITA INCOME
$61,750
AVG FAMILY INCOME
$61,000
AVG HOUSEHOLD INCOME
0.37
INEQUALITY / GINI INDEX
153
TOTAL POPULATION
87
MALE POPULATION
66
FEMALE POPULATION
131.82
MALES / 100 FEMALES
75.86
FEMALES / 100 MALES
39.6
MEDIAN AGE
3.7
AVG FAMILY SIZE
3.3
AVG HOUSEHOLD SIZE
63
LABOR FORCE [ PEOPLE ]
49.6%
PERCENT IN LABOR FORCE
9.5%
UNEMPLOYMENT RATE
Income in Shirleysburg borough
Income Overview in Shirleysburg borough
Per Capita Income in Shirleysburg borough is $23,392, while median incomes of families and households are $61,750 and $61,000 respectively.
| Characteristic | Number | Measure |
| Per Capita Income | 153 | $23,392 |
| Median Family Income | 39 | $61,750 |
| Mean Family Income | 39 | $73,908 |
| Median Household Income | 46 | $61,000 |
| Mean Household Income | 46 | $70,515 |
| Income Deficit | 39 | $0 |
| Wage / Income Gap (%) | 153 | 0.00% |
| Wage / Income Gap ($) | 153 | 100.00¢ per $1 |
| Gini / Inequality Index | 153 | 0.37 |
Earnings by Sex in Shirleysburg borough
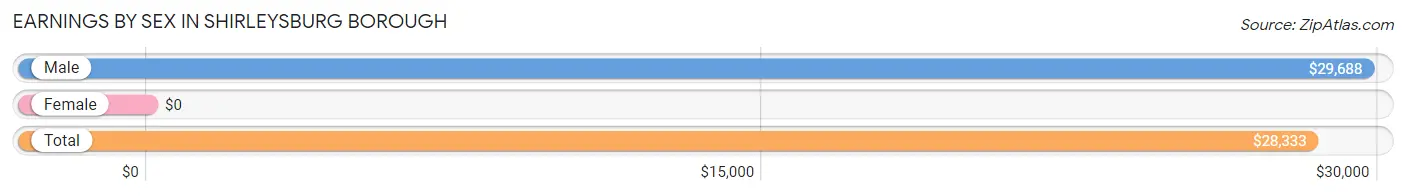
| Sex | Number | Average Earnings |
| Male | 41 (62.1%) | $29,688 |
| Female | 25 (37.9%) | $0 |
| Total | 66 (100.0%) | $28,333 |
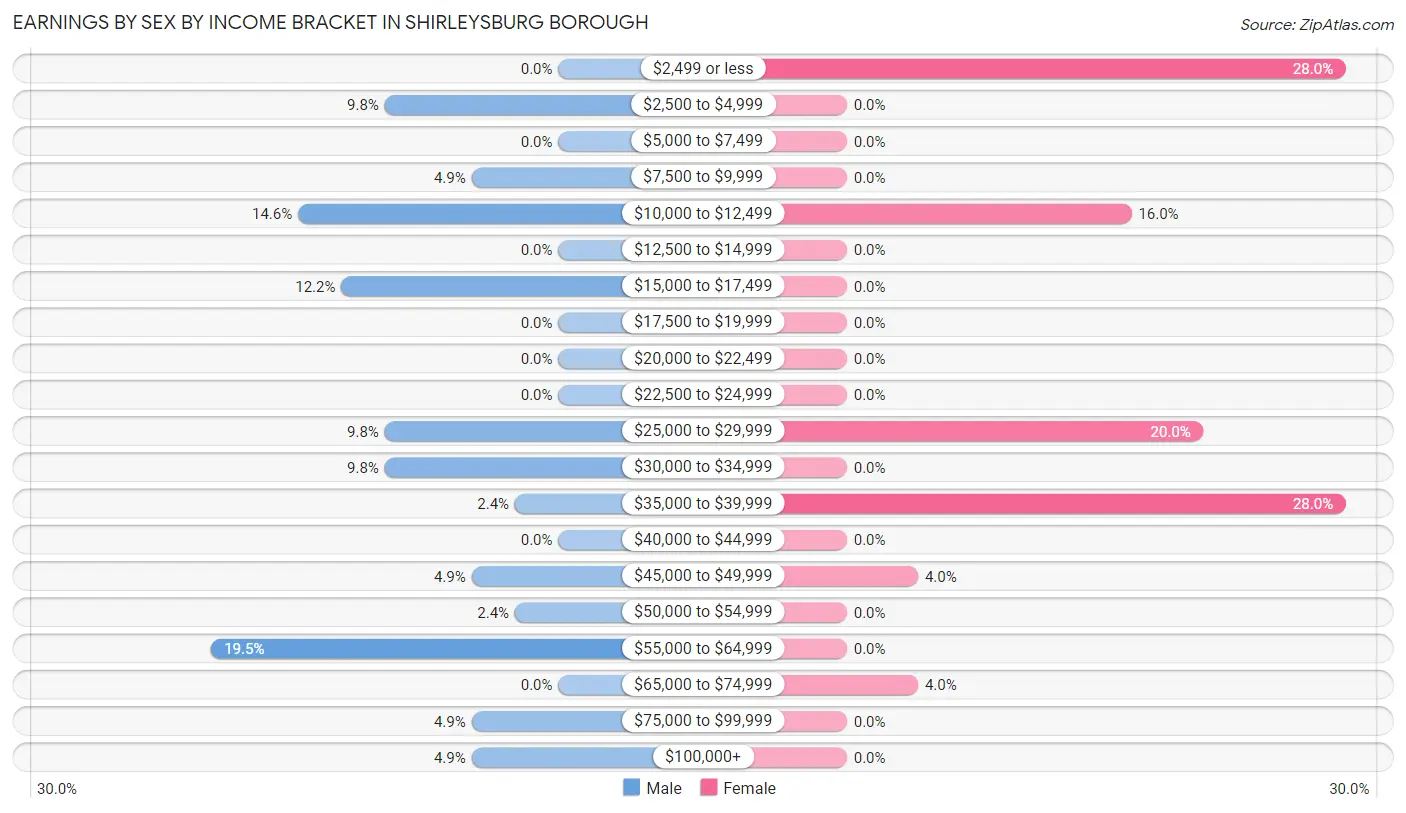
Earnings by Sex by Income Bracket in Shirleysburg borough
The most common earnings brackets in Shirleysburg borough are $55,000 to $64,999 for men (8 | 19.5%) and $2,499 or less for women (7 | 28.0%).
| Income | Male | Female |
| $2,499 or less | 0 (0.0%) | 7 (28.0%) |
| $2,500 to $4,999 | 4 (9.8%) | 0 (0.0%) |
| $5,000 to $7,499 | 0 (0.0%) | 0 (0.0%) |
| $7,500 to $9,999 | 2 (4.9%) | 0 (0.0%) |
| $10,000 to $12,499 | 6 (14.6%) | 4 (16.0%) |
| $12,500 to $14,999 | 0 (0.0%) | 0 (0.0%) |
| $15,000 to $17,499 | 5 (12.2%) | 0 (0.0%) |
| $17,500 to $19,999 | 0 (0.0%) | 0 (0.0%) |
| $20,000 to $22,499 | 0 (0.0%) | 0 (0.0%) |
| $22,500 to $24,999 | 0 (0.0%) | 0 (0.0%) |
| $25,000 to $29,999 | 4 (9.8%) | 5 (20.0%) |
| $30,000 to $34,999 | 4 (9.8%) | 0 (0.0%) |
| $35,000 to $39,999 | 1 (2.4%) | 7 (28.0%) |
| $40,000 to $44,999 | 0 (0.0%) | 0 (0.0%) |
| $45,000 to $49,999 | 2 (4.9%) | 1 (4.0%) |
| $50,000 to $54,999 | 1 (2.4%) | 0 (0.0%) |
| $55,000 to $64,999 | 8 (19.5%) | 0 (0.0%) |
| $65,000 to $74,999 | 0 (0.0%) | 1 (4.0%) |
| $75,000 to $99,999 | 2 (4.9%) | 0 (0.0%) |
| $100,000+ | 2 (4.9%) | 0 (0.0%) |
| Total | 41 (100.0%) | 25 (100.0%) |
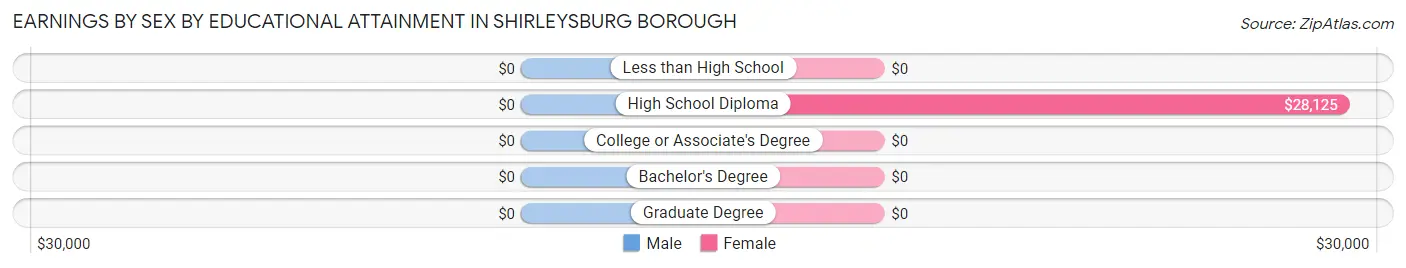
Earnings by Sex by Educational Attainment in Shirleysburg borough
| Educational Attainment | Male Income | Female Income |
| Less than High School | - | - |
| High School Diploma | - | - |
| College or Associate's Degree | - | - |
| Bachelor's Degree | - | - |
| Graduate Degree | - | - |
| Total | $45,625 | $32,500 |
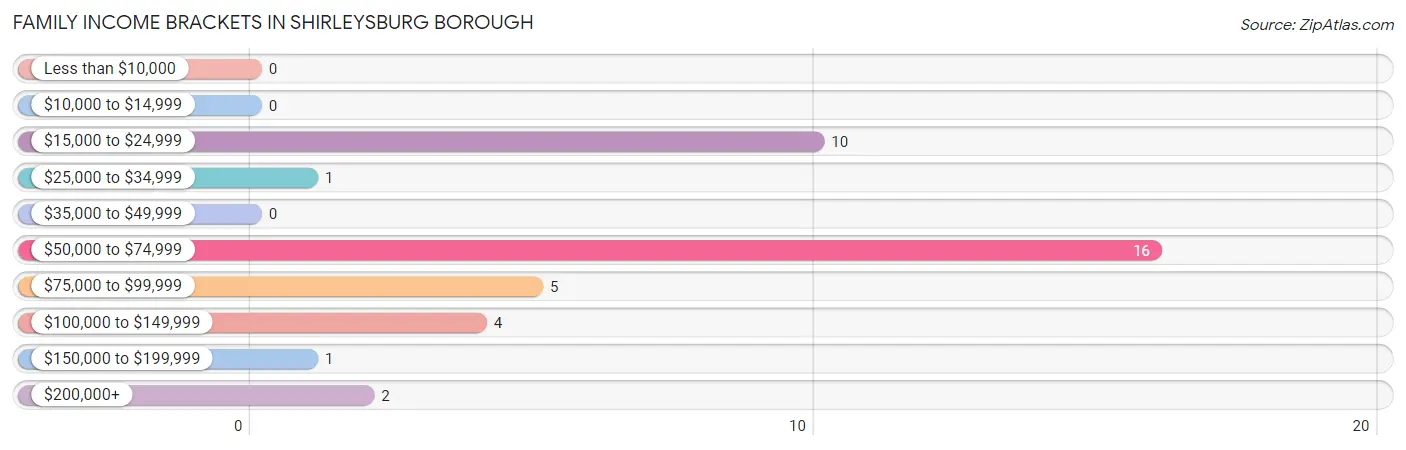
Family Income in Shirleysburg borough
Family Income Brackets in Shirleysburg borough
According to the Shirleysburg borough family income data, there are 16 families falling into the $50,000 to $74,999 income range, which is the most common income bracket and makes up 41.0% of all families.
| Income Bracket | # Families | % Families |
| Less than $10,000 | 0 | 0.0% |
| $10,000 to $14,999 | 0 | 0.0% |
| $15,000 to $24,999 | 10 | 25.6% |
| $25,000 to $34,999 | 1 | 2.6% |
| $35,000 to $49,999 | 0 | 0.0% |
| $50,000 to $74,999 | 16 | 41.0% |
| $75,000 to $99,999 | 5 | 12.8% |
| $100,000 to $149,999 | 4 | 10.3% |
| $150,000 to $199,999 | 1 | 2.6% |
| $200,000+ | 2 | 5.1% |
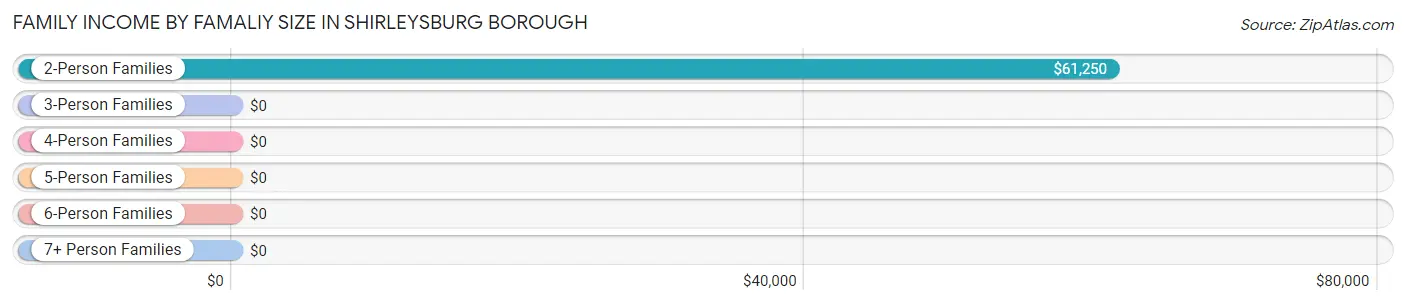
Family Income by Famaliy Size in Shirleysburg borough
2-person families (27 | 69.2%) account for the highest median family income in Shirleysburg borough with $61,250 per family, while 2-person families (27 | 69.2%) have the highest median income of $30,625 per family member.
| Income Bracket | # Families | Median Income |
| 2-Person Families | 27 (69.2%) | $61,250 |
| 3-Person Families | 1 (2.6%) | $0 |
| 4-Person Families | 3 (7.7%) | $0 |
| 5-Person Families | 2 (5.1%) | $0 |
| 6-Person Families | 2 (5.1%) | $0 |
| 7+ Person Families | 4 (10.3%) | $0 |
| Total | 39 (100.0%) | $61,750 |
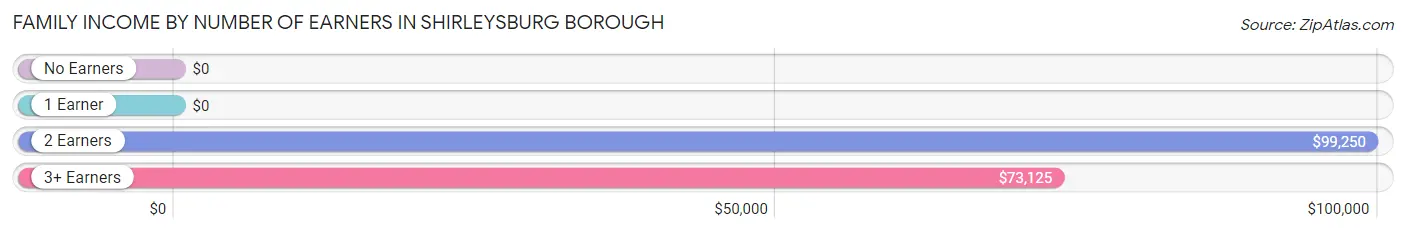
Family Income by Number of Earners in Shirleysburg borough
| Number of Earners | # Families | Median Income |
| No Earners | 20 (51.3%) | $0 |
| 1 Earner | 1 (2.6%) | $0 |
| 2 Earners | 9 (23.1%) | $99,250 |
| 3+ Earners | 9 (23.1%) | $73,125 |
| Total | 39 (100.0%) | $61,750 |
Household Income in Shirleysburg borough
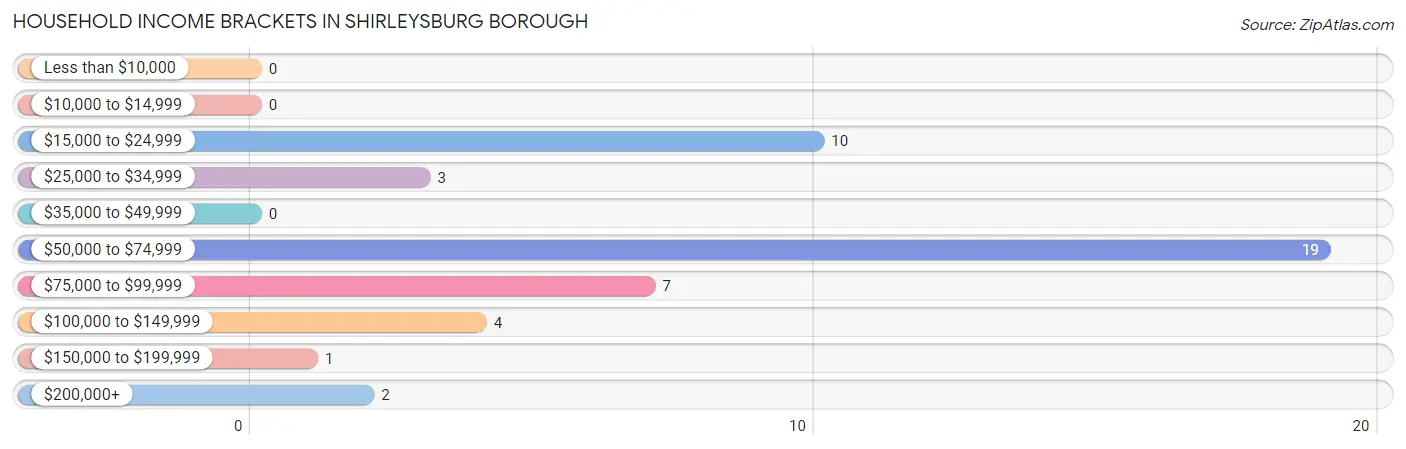
Household Income Brackets in Shirleysburg borough
With 19 households falling in the category, the $50,000 to $74,999 income range is the most frequent in Shirleysburg borough, accounting for 41.3% of all households.
| Income Bracket | # Households | % Households |
| Less than $10,000 | 0 | 0.0% |
| $10,000 to $14,999 | 0 | 0.0% |
| $15,000 to $24,999 | 10 | 21.7% |
| $25,000 to $34,999 | 3 | 6.5% |
| $35,000 to $49,999 | 0 | 0.0% |
| $50,000 to $74,999 | 19 | 41.3% |
| $75,000 to $99,999 | 7 | 15.2% |
| $100,000 to $149,999 | 4 | 8.7% |
| $150,000 to $199,999 | 1 | 2.2% |
| $200,000+ | 2 | 4.3% |
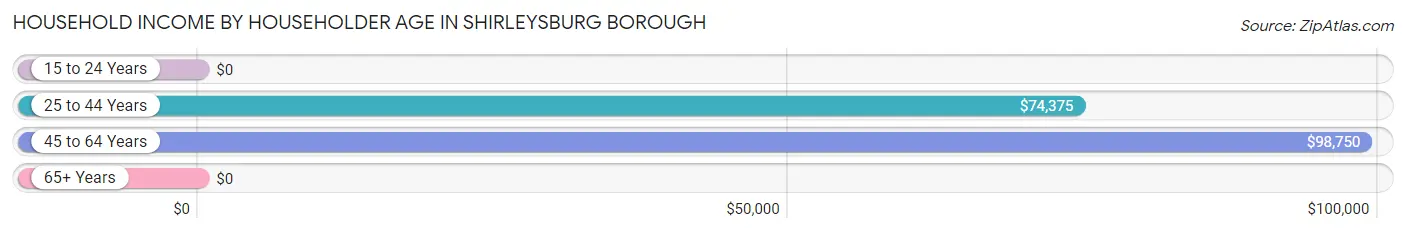
Household Income by Householder Age in Shirleysburg borough
The median household income in Shirleysburg borough is $61,000, with the highest median household income of $98,750 found in the 45 to 64 years age bracket for the primary householder. A total of 9 households (19.6%) fall into this category.
| Income Bracket | # Households | Median Income |
| 15 to 24 Years | 0 (0.0%) | $0 |
| 25 to 44 Years | 13 (28.3%) | $74,375 |
| 45 to 64 Years | 9 (19.6%) | $98,750 |
| 65+ Years | 24 (52.2%) | $0 |
| Total | 46 (100.0%) | $61,000 |
Poverty in Shirleysburg borough
Income Below Poverty by Sex and Age in Shirleysburg borough
With 1.1% poverty level for males and 6.1% for females among the residents of Shirleysburg borough, 65 to 74 year old males and 18 to 24 year old females are the most vulnerable to poverty, with 1 males (16.7%) and 2 females (33.3%) in their respective age groups living below the poverty level.
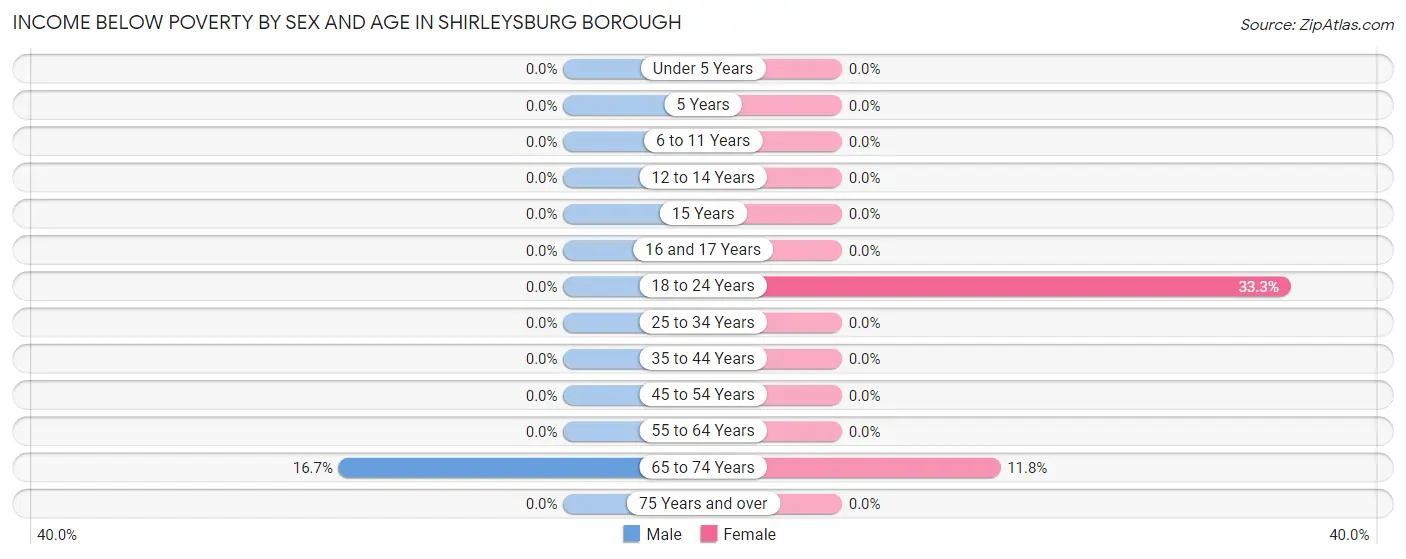
| Age Bracket | Male | Female |
| Under 5 Years | 0 (0.0%) | 0 (0.0%) |
| 5 Years | 0 (0.0%) | 0 (0.0%) |
| 6 to 11 Years | 0 (0.0%) | 0 (0.0%) |
| 12 to 14 Years | 0 (0.0%) | 0 (0.0%) |
| 15 Years | 0 (0.0%) | 0 (0.0%) |
| 16 and 17 Years | 0 (0.0%) | 0 (0.0%) |
| 18 to 24 Years | 0 (0.0%) | 2 (33.3%) |
| 25 to 34 Years | 0 (0.0%) | 0 (0.0%) |
| 35 to 44 Years | 0 (0.0%) | 0 (0.0%) |
| 45 to 54 Years | 0 (0.0%) | 0 (0.0%) |
| 55 to 64 Years | 0 (0.0%) | 0 (0.0%) |
| 65 to 74 Years | 1 (16.7%) | 2 (11.8%) |
| 75 Years and over | 0 (0.0%) | 0 (0.0%) |
| Total | 1 (1.1%) | 4 (6.1%) |
Income Above Poverty by Sex and Age in Shirleysburg borough
According to the poverty statistics in Shirleysburg borough, males aged under 5 years and females aged under 5 years are the age groups that are most secure financially, with 100.0% of males and 100.0% of females in these age groups living above the poverty line.
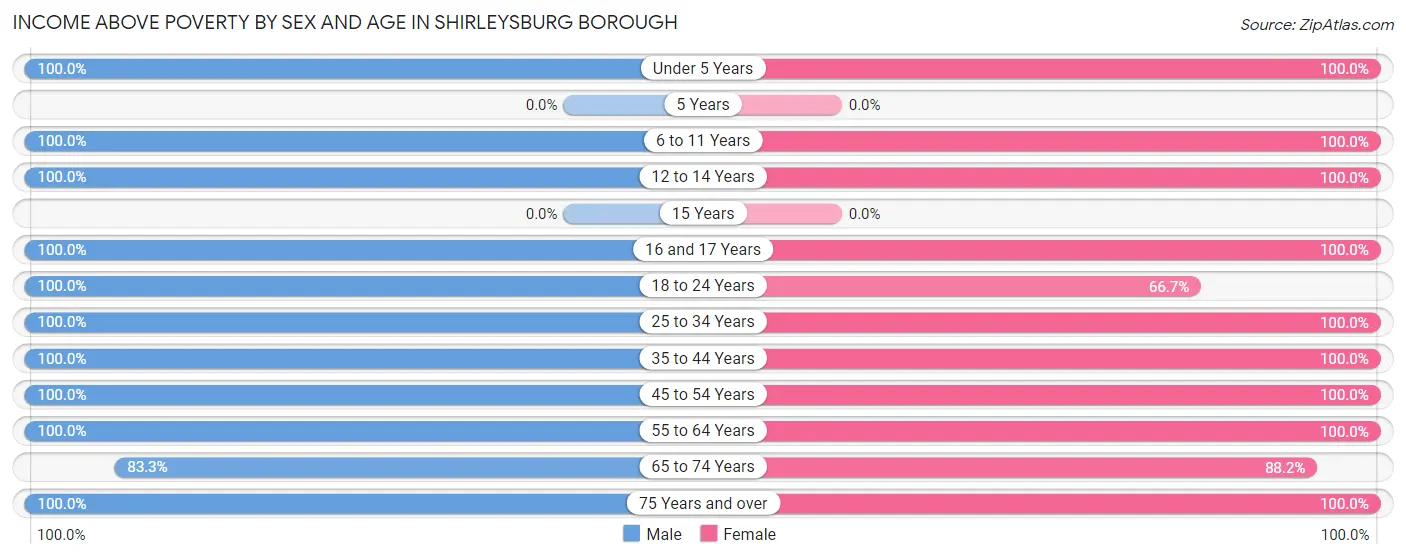
| Age Bracket | Male | Female |
| Under 5 Years | 5 (100.0%) | 2 (100.0%) |
| 5 Years | 0 (0.0%) | 0 (0.0%) |
| 6 to 11 Years | 6 (100.0%) | 2 (100.0%) |
| 12 to 14 Years | 5 (100.0%) | 6 (100.0%) |
| 15 Years | 0 (0.0%) | 0 (0.0%) |
| 16 and 17 Years | 4 (100.0%) | 3 (100.0%) |
| 18 to 24 Years | 8 (100.0%) | 4 (66.7%) |
| 25 to 34 Years | 12 (100.0%) | 2 (100.0%) |
| 35 to 44 Years | 12 (100.0%) | 8 (100.0%) |
| 45 to 54 Years | 6 (100.0%) | 3 (100.0%) |
| 55 to 64 Years | 7 (100.0%) | 9 (100.0%) |
| 65 to 74 Years | 5 (83.3%) | 15 (88.2%) |
| 75 Years and over | 16 (100.0%) | 8 (100.0%) |
| Total | 86 (98.9%) | 62 (93.9%) |
Income Below Poverty Among Married-Couple Families in Shirleysburg borough
The poverty statistics for married-couple families in Shirleysburg borough show that 3.1% or 1 of the total 32 families live below the poverty line. Families with no children have the highest poverty rate of 4.5%, comprising of 1 families. On the other hand, families with 1 or 2 children have the lowest poverty rate of 0.0%, which includes 0 families.
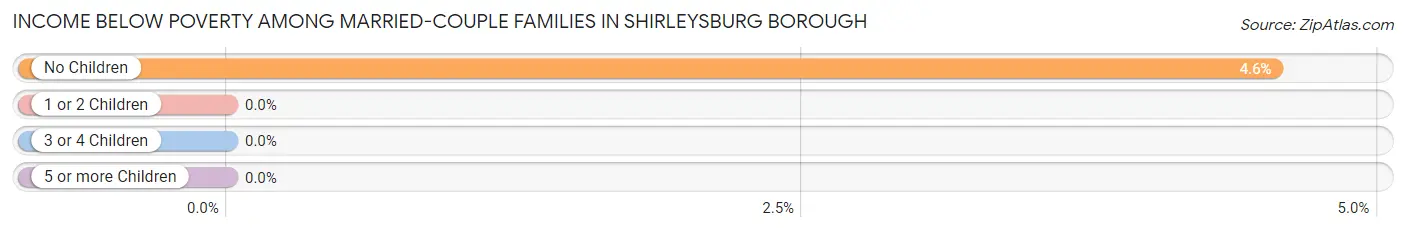
| Children | Above Poverty | Below Poverty |
| No Children | 21 (95.5%) | 1 (4.5%) |
| 1 or 2 Children | 4 (100.0%) | 0 (0.0%) |
| 3 or 4 Children | 6 (100.0%) | 0 (0.0%) |
| 5 or more Children | 0 (0.0%) | 0 (0.0%) |
| Total | 31 (96.9%) | 1 (3.1%) |
Income Below Poverty Among Single-Parent Households in Shirleysburg borough
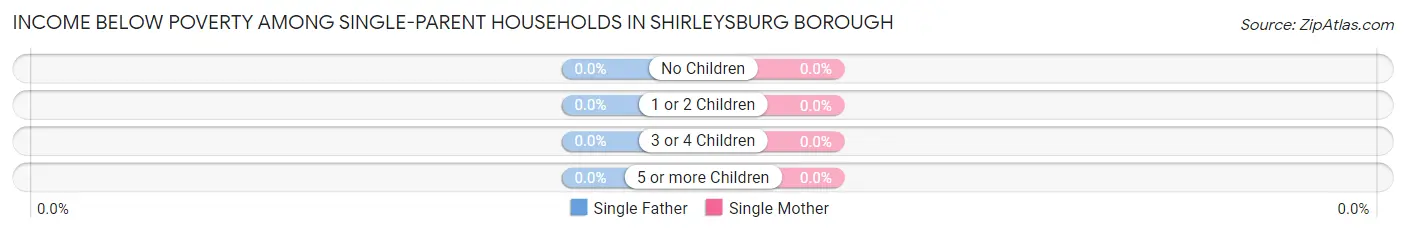
| Children | Single Father | Single Mother |
| No Children | 0 (0.0%) | 0 (0.0%) |
| 1 or 2 Children | 0 (0.0%) | 0 (0.0%) |
| 3 or 4 Children | 0 (0.0%) | 0 (0.0%) |
| 5 or more Children | 0 (0.0%) | 0 (0.0%) |
| Total | 0 (0.0%) | 0 (0.0%) |
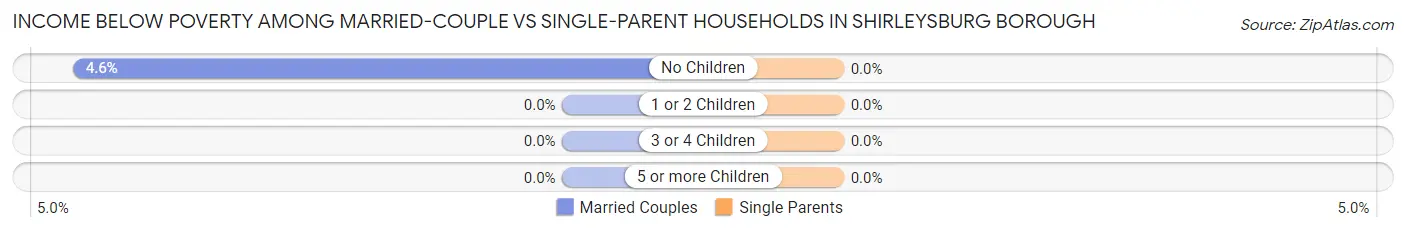
Income Below Poverty Among Married-Couple vs Single-Parent Households in Shirleysburg borough
| Children | Married-Couple Families | Single-Parent Households |
| No Children | 1 (4.5%) | 0 (0.0%) |
| 1 or 2 Children | 0 (0.0%) | 0 (0.0%) |
| 3 or 4 Children | 0 (0.0%) | 0 (0.0%) |
| 5 or more Children | 0 (0.0%) | 0 (0.0%) |
| Total | 1 (3.1%) | 0 (0.0%) |
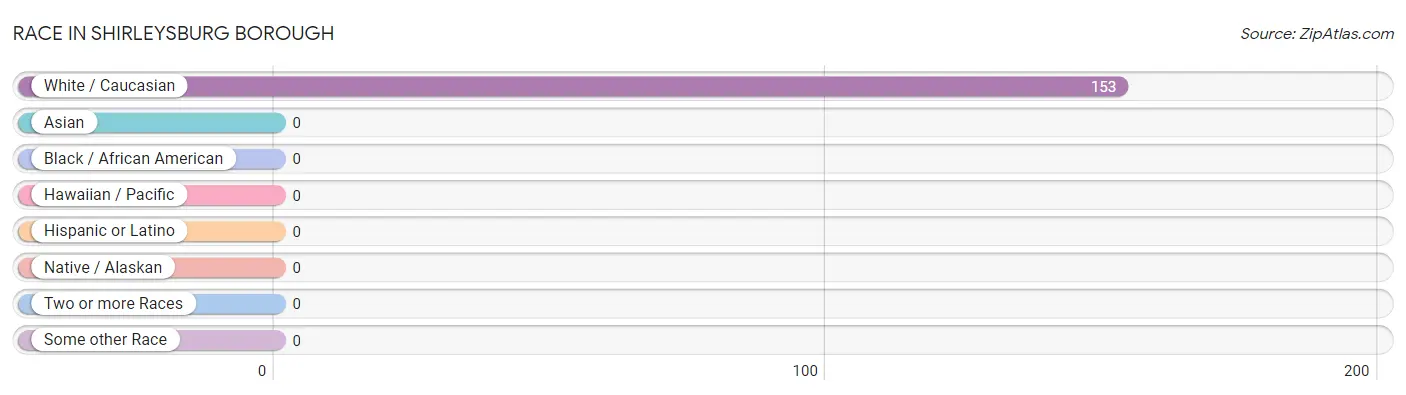
Race in Shirleysburg borough
The most populous races in Shirleysburg borough are , and White / Caucasian (153 | 100.0%).
| Race | # Population | % Population |
| Asian | 0 | 0.0% |
| Black / African American | 0 | 0.0% |
| Hawaiian / Pacific | 0 | 0.0% |
| Hispanic or Latino | 0 | 0.0% |
| Native / Alaskan | 0 | 0.0% |
| White / Caucasian | 153 | 100.0% |
| Two or more Races | 0 | 0.0% |
| Some other Race | 0 | 0.0% |
| Total | 153 | 100.0% |
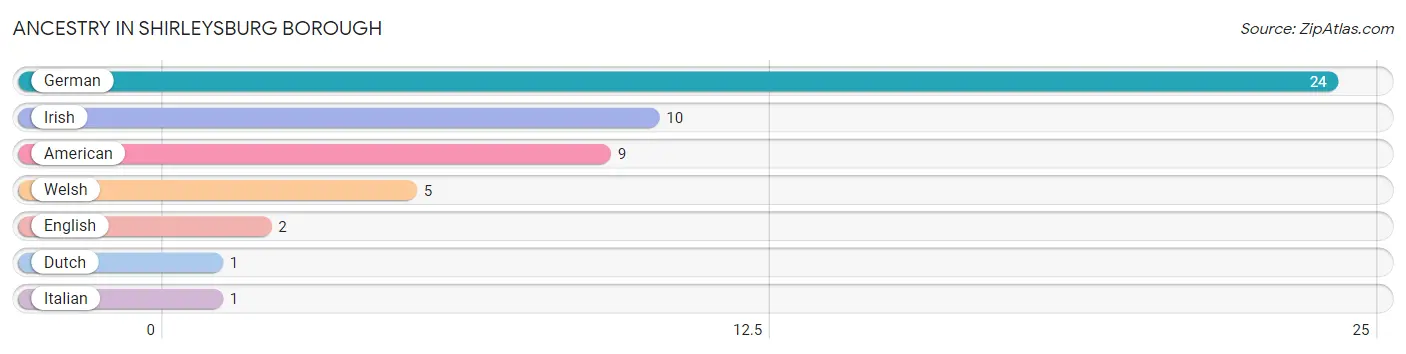
Ancestry in Shirleysburg borough
The most populous ancestries reported in Shirleysburg borough are German (24 | 15.7%), Irish (10 | 6.5%), American (9 | 5.9%), Welsh (5 | 3.3%), and English (2 | 1.3%), together accounting for 32.7% of all Shirleysburg borough residents.
| Ancestry | # Population | % Population |
| American | 9 | 5.9% |
| Dutch | 1 | 0.6% |
| English | 2 | 1.3% |
| German | 24 | 15.7% |
| Irish | 10 | 6.5% |
| Italian | 1 | 0.6% |
| Welsh | 5 | 3.3% | View All 7 Rows |
Immigrants in Shirleysburg borough

| Immigration Origin | # Population | % Population | View All 0 Rows |
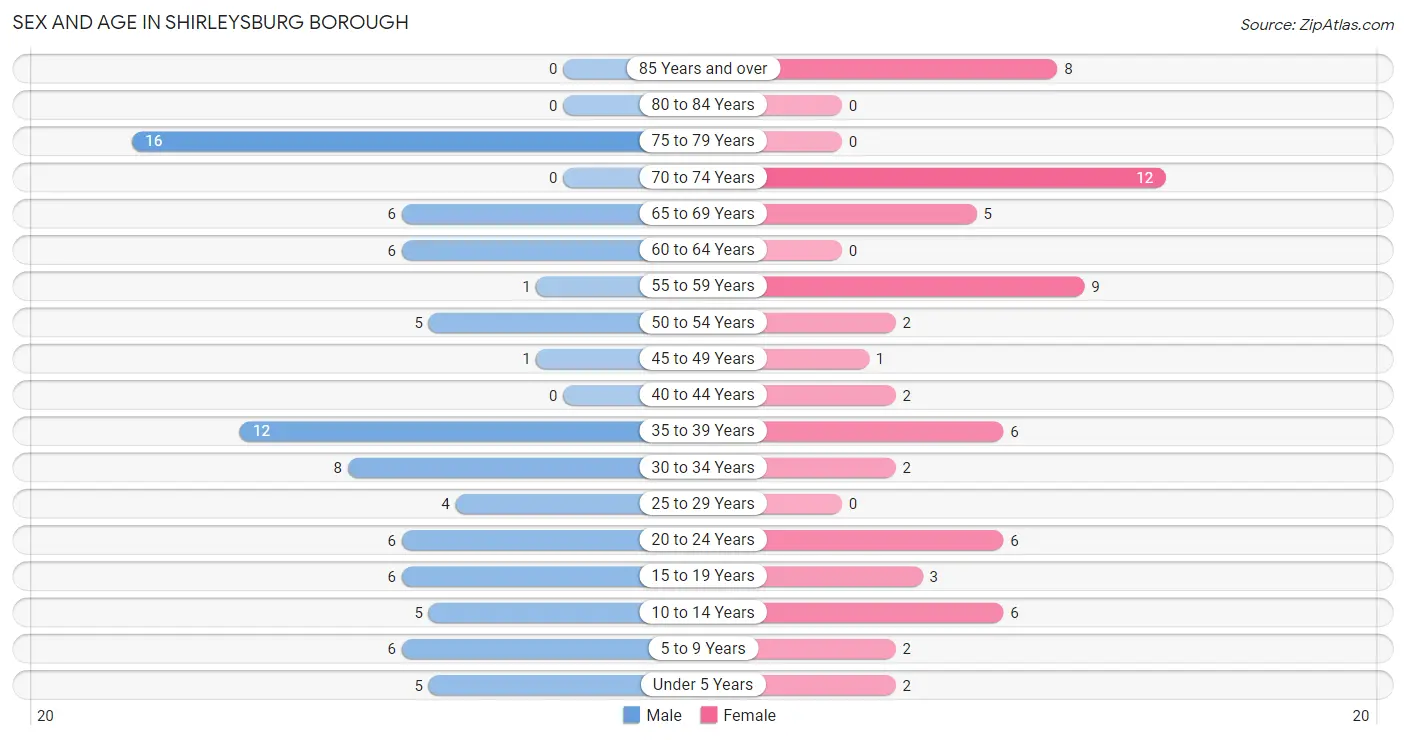
Sex and Age in Shirleysburg borough
Sex and Age in Shirleysburg borough
The most populous age groups in Shirleysburg borough are 75 to 79 Years (16 | 18.4%) for men and 70 to 74 Years (12 | 18.2%) for women.
| Age Bracket | Male | Female |
| Under 5 Years | 5 (5.8%) | 2 (3.0%) |
| 5 to 9 Years | 6 (6.9%) | 2 (3.0%) |
| 10 to 14 Years | 5 (5.8%) | 6 (9.1%) |
| 15 to 19 Years | 6 (6.9%) | 3 (4.5%) |
| 20 to 24 Years | 6 (6.9%) | 6 (9.1%) |
| 25 to 29 Years | 4 (4.6%) | 0 (0.0%) |
| 30 to 34 Years | 8 (9.2%) | 2 (3.0%) |
| 35 to 39 Years | 12 (13.8%) | 6 (9.1%) |
| 40 to 44 Years | 0 (0.0%) | 2 (3.0%) |
| 45 to 49 Years | 1 (1.1%) | 1 (1.5%) |
| 50 to 54 Years | 5 (5.8%) | 2 (3.0%) |
| 55 to 59 Years | 1 (1.1%) | 9 (13.6%) |
| 60 to 64 Years | 6 (6.9%) | 0 (0.0%) |
| 65 to 69 Years | 6 (6.9%) | 5 (7.6%) |
| 70 to 74 Years | 0 (0.0%) | 12 (18.2%) |
| 75 to 79 Years | 16 (18.4%) | 0 (0.0%) |
| 80 to 84 Years | 0 (0.0%) | 0 (0.0%) |
| 85 Years and over | 0 (0.0%) | 8 (12.1%) |
| Total | 87 (100.0%) | 66 (100.0%) |
Families and Households in Shirleysburg borough
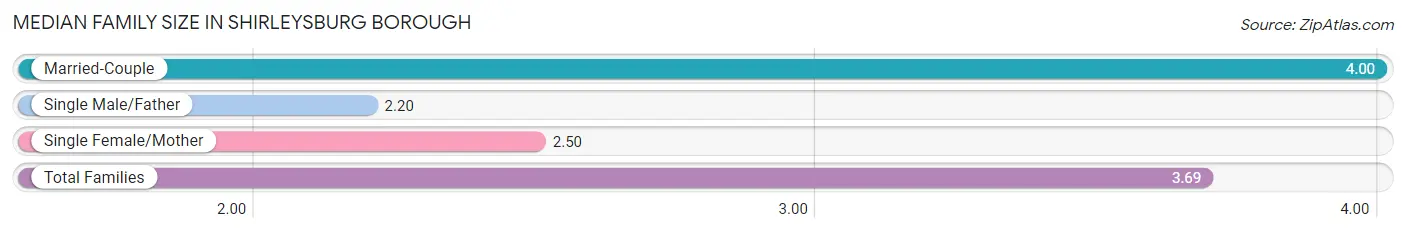
Median Family Size in Shirleysburg borough
The median family size in Shirleysburg borough is 3.69 persons per family, with married-couple families (32 | 82.1%) accounting for the largest median family size of 4 persons per family. On the other hand, single male/father families (5 | 12.8%) represent the smallest median family size with 2.20 persons per family.
| Family Type | # Families | Family Size |
| Married-Couple | 32 (82.1%) | 4.00 |
| Single Male/Father | 5 (12.8%) | 2.20 |
| Single Female/Mother | 2 (5.1%) | 2.50 |
| Total Families | 39 (100.0%) | 3.69 |
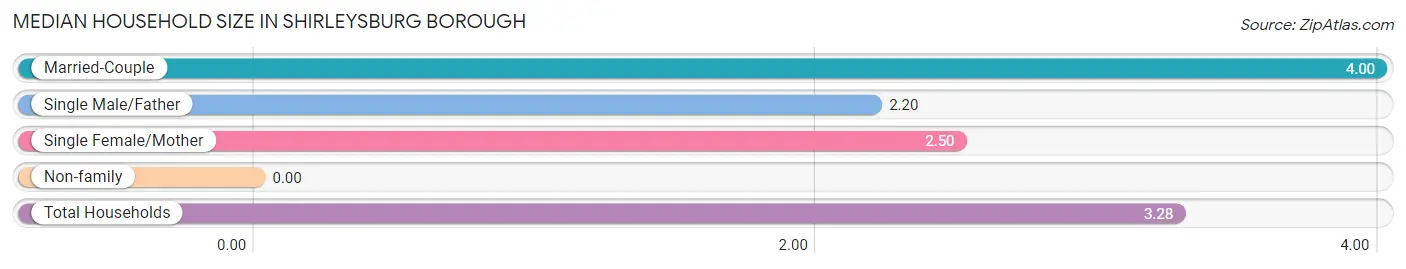
Median Household Size in Shirleysburg borough
| Household Type | # Households | Household Size |
| Married-Couple | 32 (69.6%) | 4.00 |
| Single Male/Father | 5 (10.9%) | 2.20 |
| Single Female/Mother | 2 (4.3%) | 2.50 |
| Non-family | 7 (15.2%) | - |
| Total Households | 46 (100.0%) | 3.28 |
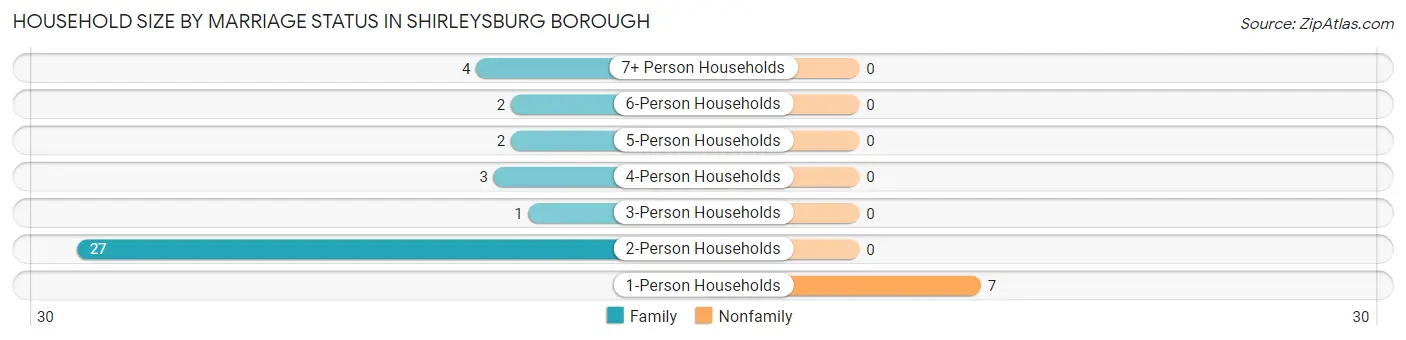
Household Size by Marriage Status in Shirleysburg borough
Out of a total of 46 households in Shirleysburg borough, 39 (84.8%) are family households, while 7 (15.2%) are nonfamily households. The most numerous type of family households are 2-person households, comprising 27, and the most common type of nonfamily households are 1-person households, comprising 7.
| Household Size | Family Households | Nonfamily Households |
| 1-Person Households | - | 7 (15.2%) |
| 2-Person Households | 27 (58.7%) | 0 (0.0%) |
| 3-Person Households | 1 (2.2%) | 0 (0.0%) |
| 4-Person Households | 3 (6.5%) | 0 (0.0%) |
| 5-Person Households | 2 (4.3%) | 0 (0.0%) |
| 6-Person Households | 2 (4.3%) | 0 (0.0%) |
| 7+ Person Households | 4 (8.7%) | 0 (0.0%) |
| Total | 39 (84.8%) | 7 (15.2%) |
Female Fertility in Shirleysburg borough
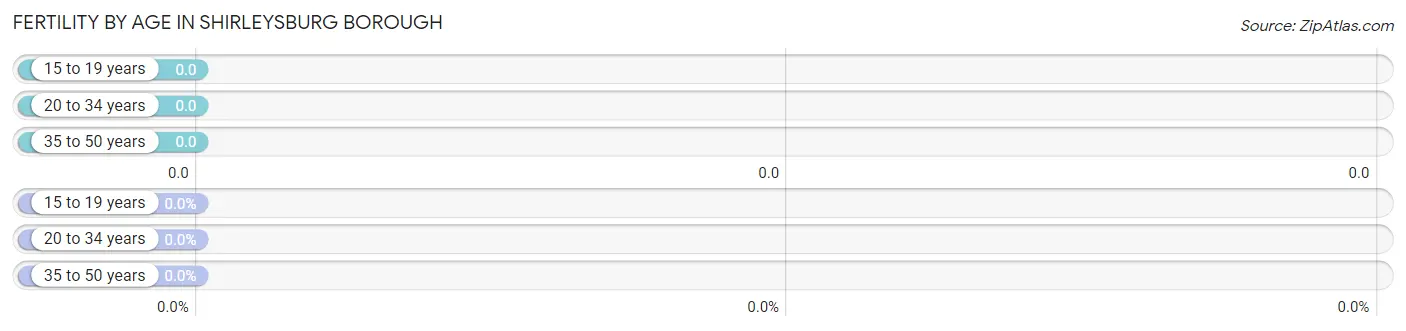
Fertility by Age in Shirleysburg borough
| Age Bracket | Women with Births | Births / 1,000 Women |
| 15 to 19 years | 0 (0.0%) | 0.0 |
| 20 to 34 years | 0 (0.0%) | 0.0 |
| 35 to 50 years | 0 (0.0%) | 0.0 |
| Total | 0 (0.0%) | 0.0 |
Fertility by Age by Marriage Status in Shirleysburg borough
| Age Bracket | Married | Unmarried |
| 15 to 19 years | 0 (0.0%) | 0 (0.0%) |
| 20 to 34 years | 0 (0.0%) | 0 (0.0%) |
| 35 to 50 years | 0 (0.0%) | 0 (0.0%) |
| Total | 0 (0.0%) | 0 (0.0%) |
Fertility by Education in Shirleysburg borough
| Educational Attainment | Women with Births | Births / 1,000 Women |
| Less than High School | 0 (0.0%) | 0.0 |
| High School Diploma | 0 (0.0%) | 0.0 |
| College or Associate's Degree | 0 (0.0%) | 0.0 |
| Bachelor's Degree | 0 (0.0%) | 0.0 |
| Graduate Degree | 0 (0.0%) | 0.0 |
| Total | 0 (0.0%) | 0.0 |
Fertility by Education by Marriage Status in Shirleysburg borough
| Educational Attainment | Married | Unmarried |
| Less than High School | 0 (0.0%) | 0 (0.0%) |
| High School Diploma | 0 (0.0%) | 0 (0.0%) |
| College or Associate's Degree | 0 (0.0%) | 0 (0.0%) |
| Bachelor's Degree | 0 (0.0%) | 0 (0.0%) |
| Graduate Degree | 0 (0.0%) | 0 (0.0%) |
| Total | 0 (0.0%) | 0 (0.0%) |
Employment Characteristics in Shirleysburg borough
Employment by Class of Employer in Shirleysburg borough
Among the 53 employed individuals in Shirleysburg borough, private company employees (48 | 90.6%), self-employed (not incorporated) (2 | 3.8%), and not-for-profit organizations (1 | 1.9%) make up the most common classes of employment.

| Employer Class | # Employees | % Employees |
| Private Company Employees | 48 | 90.6% |
| Self-Employed (Incorporated) | 0 | 0.0% |
| Self-Employed (Not Incorporated) | 2 | 3.8% |
| Not-for-profit Organizations | 1 | 1.9% |
| Local Government Employees | 1 | 1.9% |
| State Government Employees | 0 | 0.0% |
| Federal Government Employees | 1 | 1.9% |
| Unpaid Family Workers | 0 | 0.0% |
| Total | 53 | 100.0% |
Employment Status by Age in Shirleysburg borough
According to the labor force statistics for Shirleysburg borough, out of the total population over 16 years of age (127), 49.6% or 63 individuals are in the labor force, with 9.5% or 6 of them unemployed. The age group with the highest labor force participation rate is 25 to 29 years, with 100.0% or 4 individuals in the labor force. Within the labor force, the 20 to 24 years age range has the highest percentage of unemployed individuals, with 60.0% or 6 of them being unemployed.
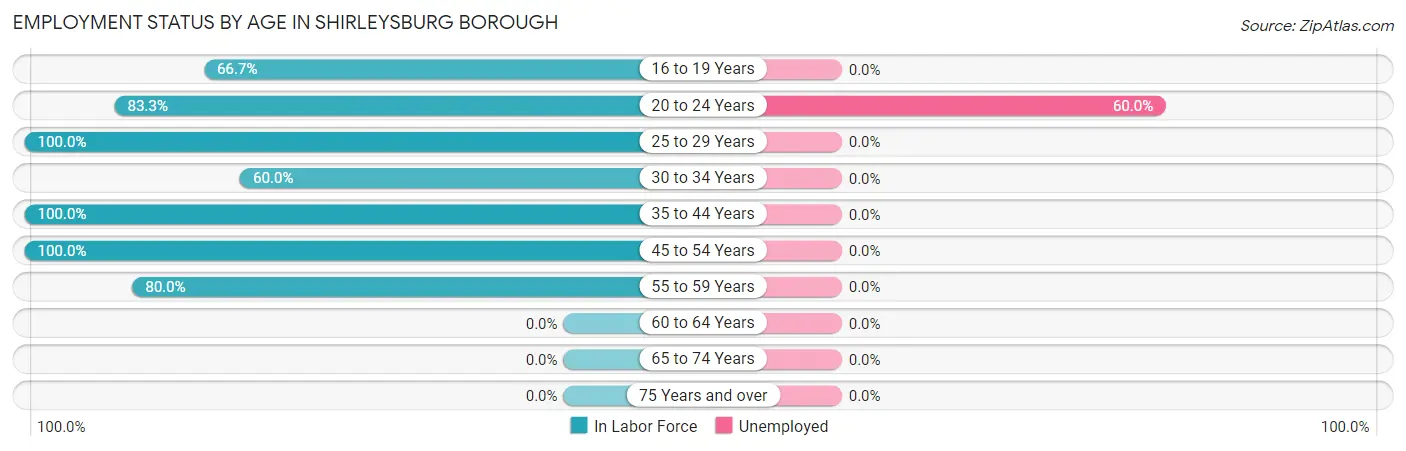
| Age Bracket | In Labor Force | Unemployed |
| 16 to 19 Years | 6 (66.7%) | 0 (0.0%) |
| 20 to 24 Years | 10 (83.3%) | 6 (60.0%) |
| 25 to 29 Years | 4 (100.0%) | 0 (0.0%) |
| 30 to 34 Years | 6 (60.0%) | 0 (0.0%) |
| 35 to 44 Years | 20 (100.0%) | 0 (0.0%) |
| 45 to 54 Years | 9 (100.0%) | 0 (0.0%) |
| 55 to 59 Years | 8 (80.0%) | 0 (0.0%) |
| 60 to 64 Years | 0 (0.0%) | 0 (0.0%) |
| 65 to 74 Years | 0 (0.0%) | 0 (0.0%) |
| 75 Years and over | 0 (0.0%) | 0 (0.0%) |
| Total | 63 (49.6%) | 6 (9.5%) |
Employment Status by Educational Attainment in Shirleysburg borough
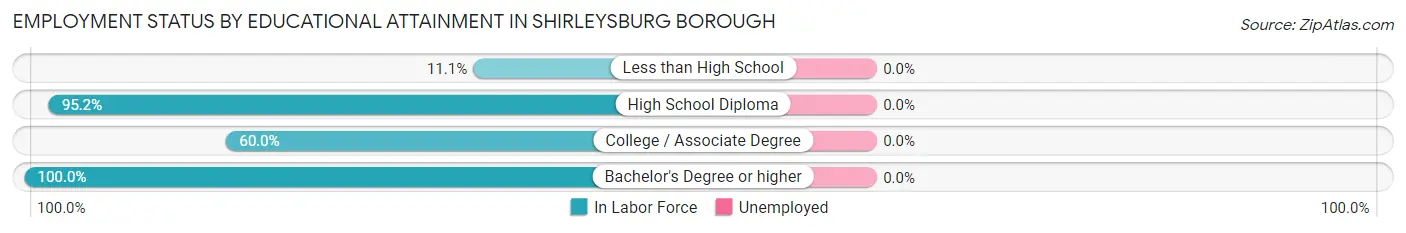
| Educational Attainment | In Labor Force | Unemployed |
| Less than High School | 1 (11.1%) | 0 (0.0%) |
| High School Diploma | 40 (95.2%) | 0 (0.0%) |
| College / Associate Degree | 3 (60.0%) | 0 (0.0%) |
| Bachelor's Degree or higher | 3 (100.0%) | 0 (0.0%) |
| Total | 47 (79.7%) | 0 (0.0%) |
Employment Occupations by Sex in Shirleysburg borough
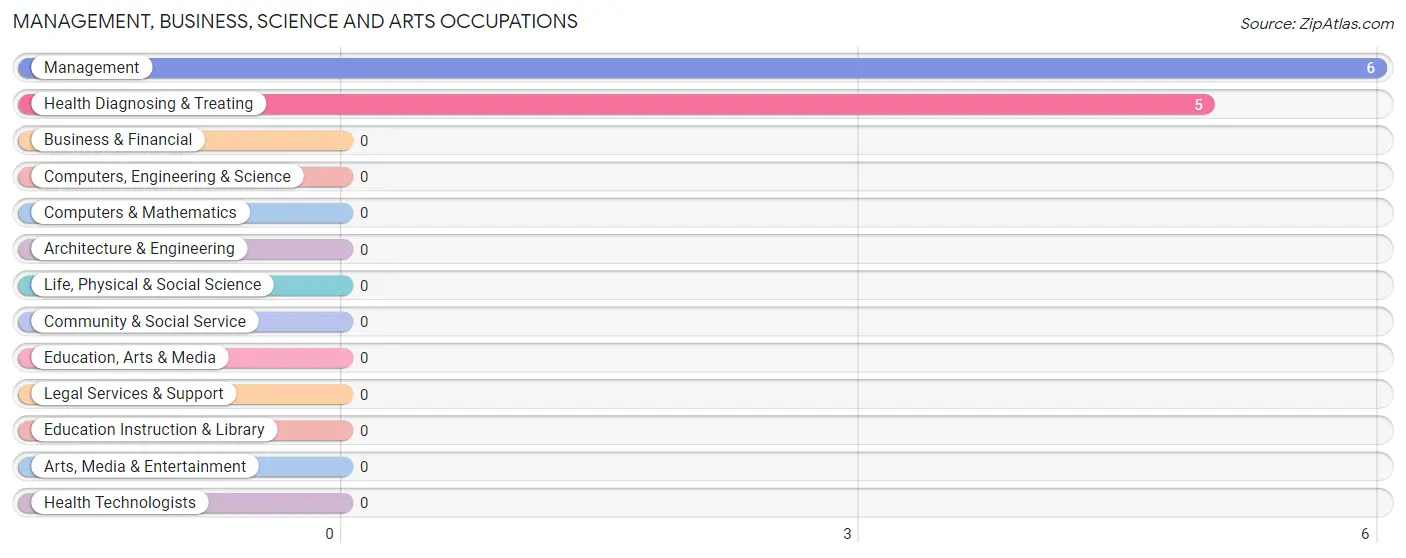
Management, Business, Science and Arts Occupations
The most common Management, Business, Science and Arts occupations in Shirleysburg borough are Management (6 | 10.5%), and Health Diagnosing & Treating (5 | 8.8%).
Management, Business, Science and Arts Occupations by Sex
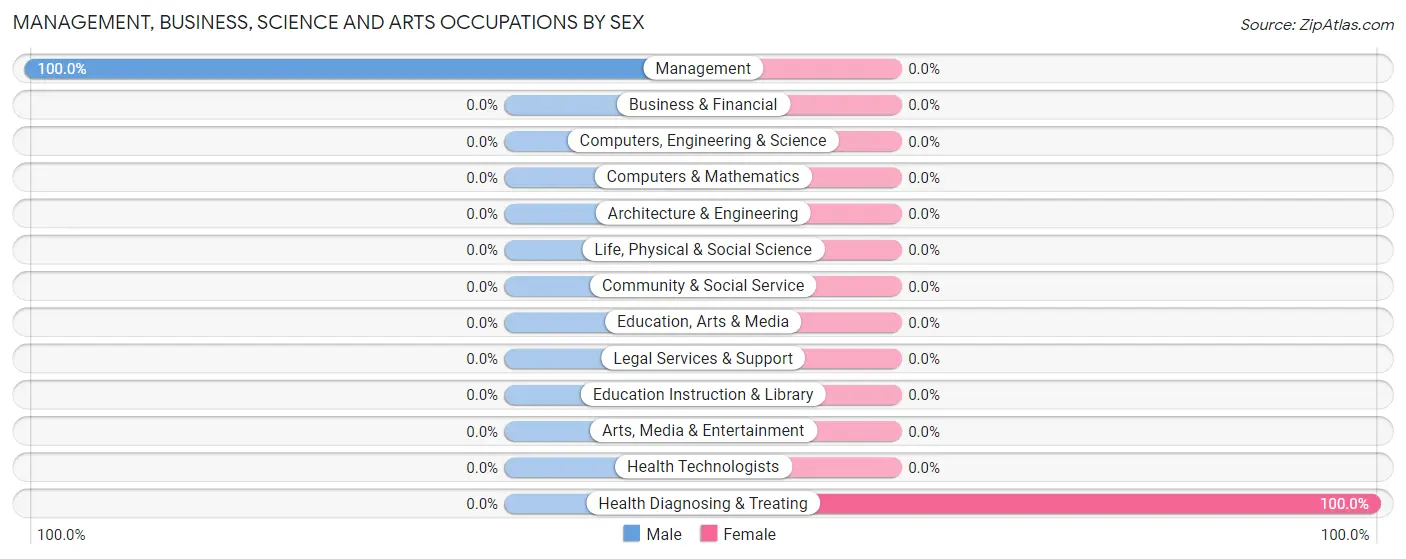
| Occupation | Male | Female |
| Management | 6 (100.0%) | 0 (0.0%) |
| Business & Financial | 0 (0.0%) | 0 (0.0%) |
| Computers, Engineering & Science | 0 (0.0%) | 0 (0.0%) |
| Computers & Mathematics | 0 (0.0%) | 0 (0.0%) |
| Architecture & Engineering | 0 (0.0%) | 0 (0.0%) |
| Life, Physical & Social Science | 0 (0.0%) | 0 (0.0%) |
| Community & Social Service | 0 (0.0%) | 0 (0.0%) |
| Education, Arts & Media | 0 (0.0%) | 0 (0.0%) |
| Legal Services & Support | 0 (0.0%) | 0 (0.0%) |
| Education Instruction & Library | 0 (0.0%) | 0 (0.0%) |
| Arts, Media & Entertainment | 0 (0.0%) | 0 (0.0%) |
| Health Diagnosing & Treating | 0 (0.0%) | 5 (100.0%) |
| Health Technologists | 0 (0.0%) | 0 (0.0%) |
| Total (Category) | 6 (54.5%) | 5 (45.5%) |
| Total (Overall) | 35 (61.4%) | 22 (38.6%) |
Services Occupations
The most common Services occupations in Shirleysburg borough are Healthcare Support (8 | 14.0%), and Food Preparation & Serving (3 | 5.3%).
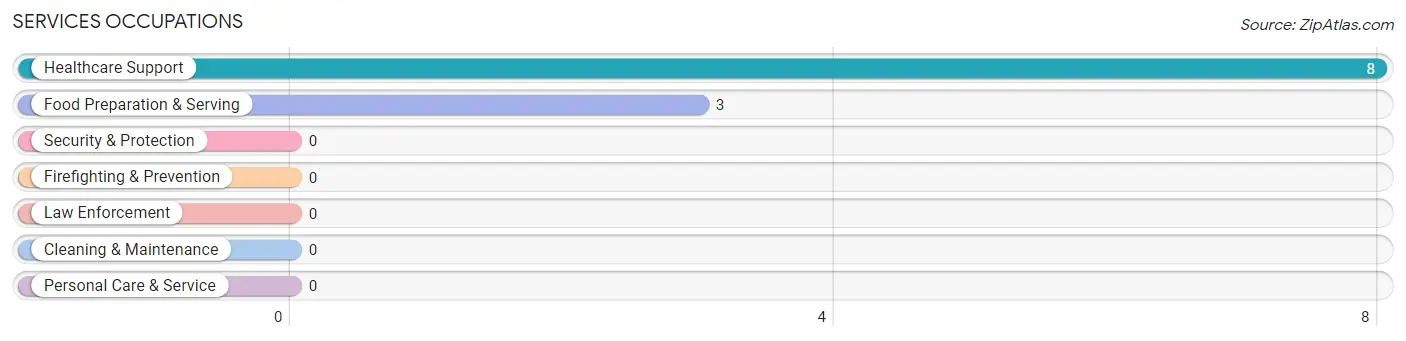
Services Occupations by Sex
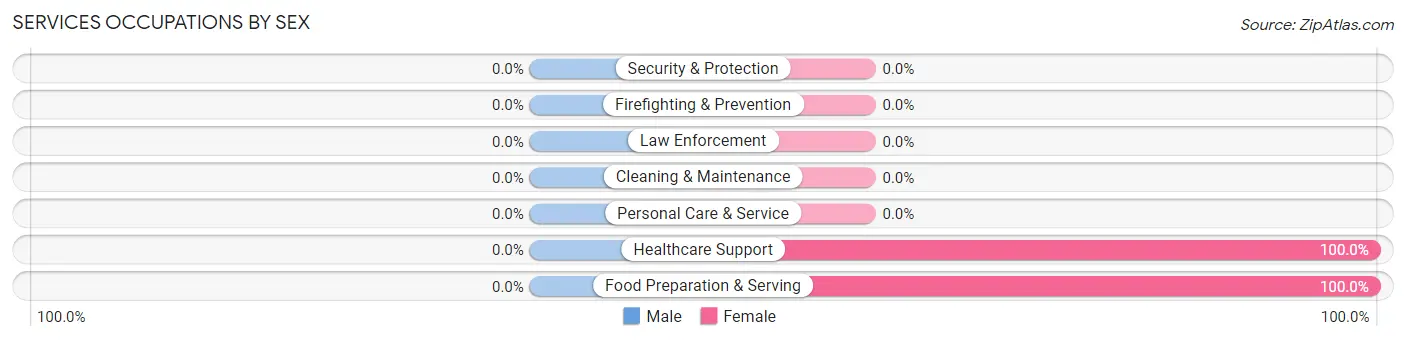
| Occupation | Male | Female |
| Healthcare Support | 0 (0.0%) | 8 (100.0%) |
| Security & Protection | 0 (0.0%) | 0 (0.0%) |
| Firefighting & Prevention | 0 (0.0%) | 0 (0.0%) |
| Law Enforcement | 0 (0.0%) | 0 (0.0%) |
| Food Preparation & Serving | 0 (0.0%) | 3 (100.0%) |
| Cleaning & Maintenance | 0 (0.0%) | 0 (0.0%) |
| Personal Care & Service | 0 (0.0%) | 0 (0.0%) |
| Total (Category) | 0 (0.0%) | 11 (100.0%) |
| Total (Overall) | 35 (61.4%) | 22 (38.6%) |
Sales and Office Occupations
Sales and Office Occupations by Sex
| Occupation | Male | Female |
| Sales & Related | 0 (0.0%) | 0 (0.0%) |
| Office & Administration | 0 (0.0%) | 0 (0.0%) |
| Total (Category) | 0 (0.0%) | 0 (0.0%) |
| Total (Overall) | 35 (61.4%) | 22 (38.6%) |
Natural Resources, Construction and Maintenance Occupations
The most common Natural Resources, Construction and Maintenance occupations in Shirleysburg borough are Installation, Maintenance & Repair (11 | 19.3%), and Construction & Extraction (5 | 8.8%).
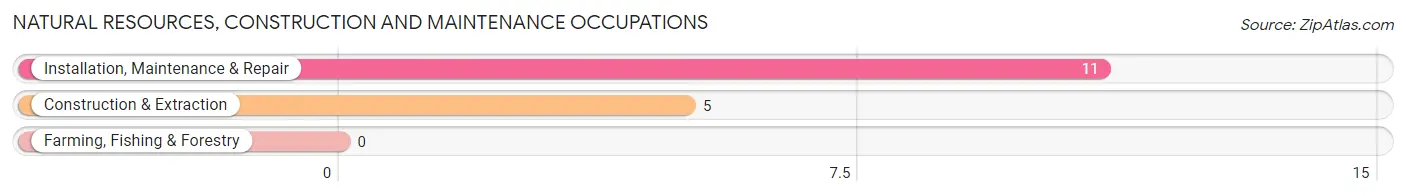
Natural Resources, Construction and Maintenance Occupations by Sex
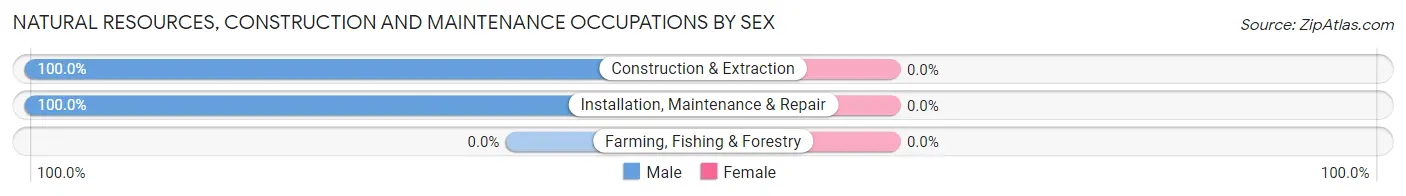
| Occupation | Male | Female |
| Farming, Fishing & Forestry | 0 (0.0%) | 0 (0.0%) |
| Construction & Extraction | 5 (100.0%) | 0 (0.0%) |
| Installation, Maintenance & Repair | 11 (100.0%) | 0 (0.0%) |
| Total (Category) | 16 (100.0%) | 0 (0.0%) |
| Total (Overall) | 35 (61.4%) | 22 (38.6%) |
Production, Transportation and Moving Occupations
The most common Production, Transportation and Moving occupations in Shirleysburg borough are Production (18 | 31.6%), and Transportation (1 | 1.8%).
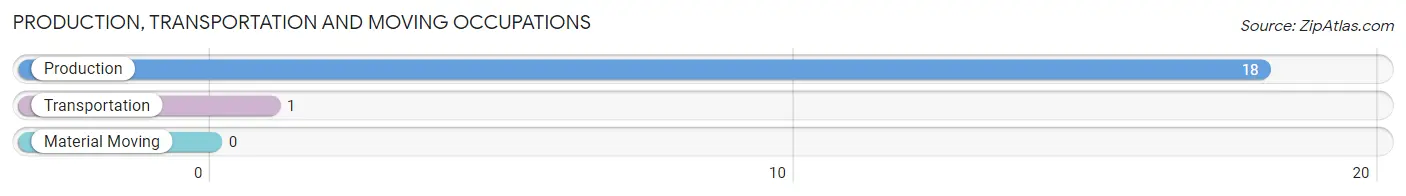
Production, Transportation and Moving Occupations by Sex
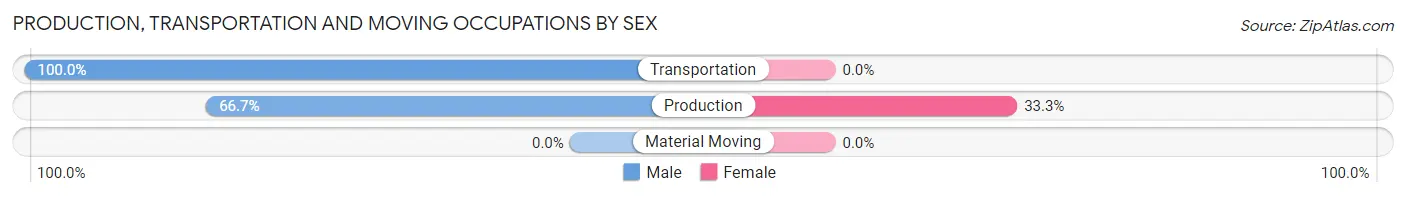
| Occupation | Male | Female |
| Production | 12 (66.7%) | 6 (33.3%) |
| Transportation | 1 (100.0%) | 0 (0.0%) |
| Material Moving | 0 (0.0%) | 0 (0.0%) |
| Total (Category) | 13 (68.4%) | 6 (31.6%) |
| Total (Overall) | 35 (61.4%) | 22 (38.6%) |
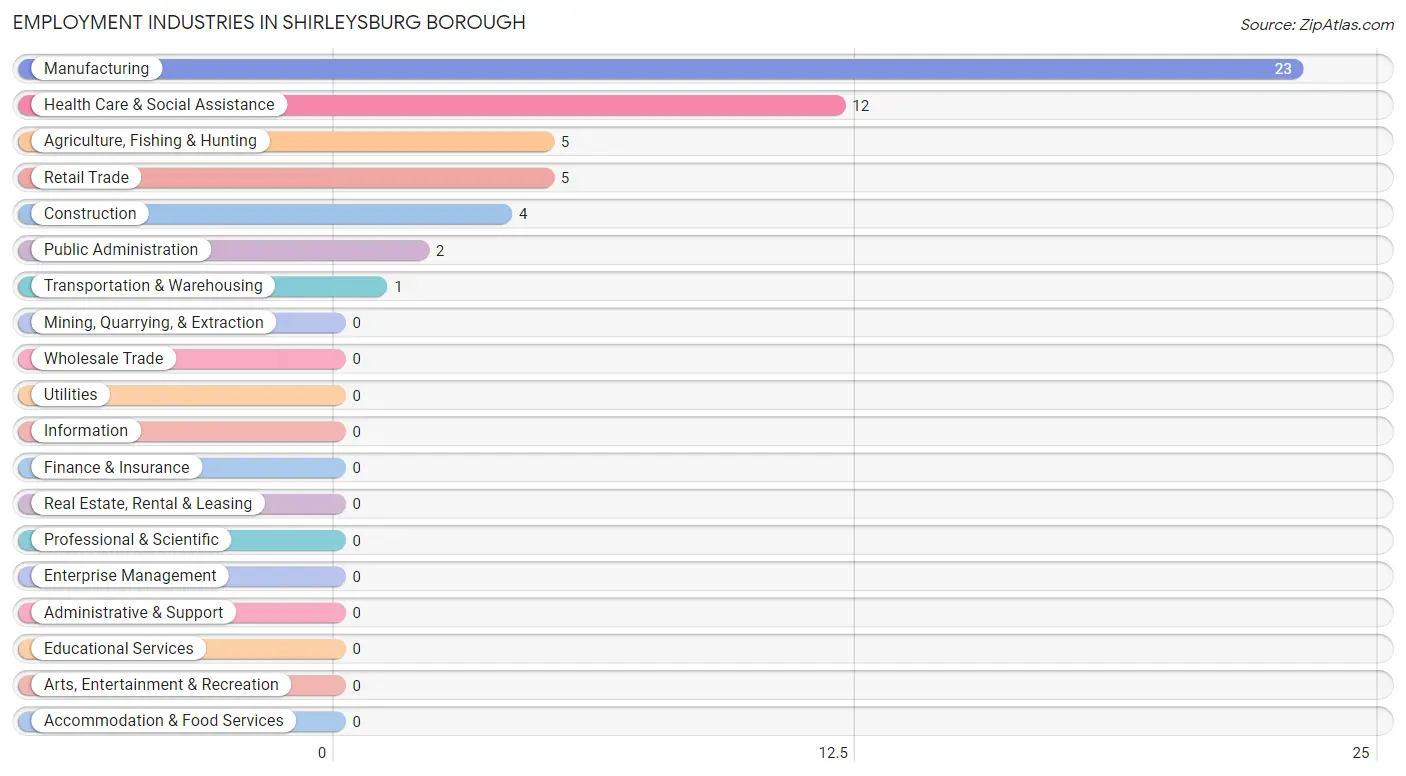
Employment Industries by Sex in Shirleysburg borough
Employment Industries in Shirleysburg borough
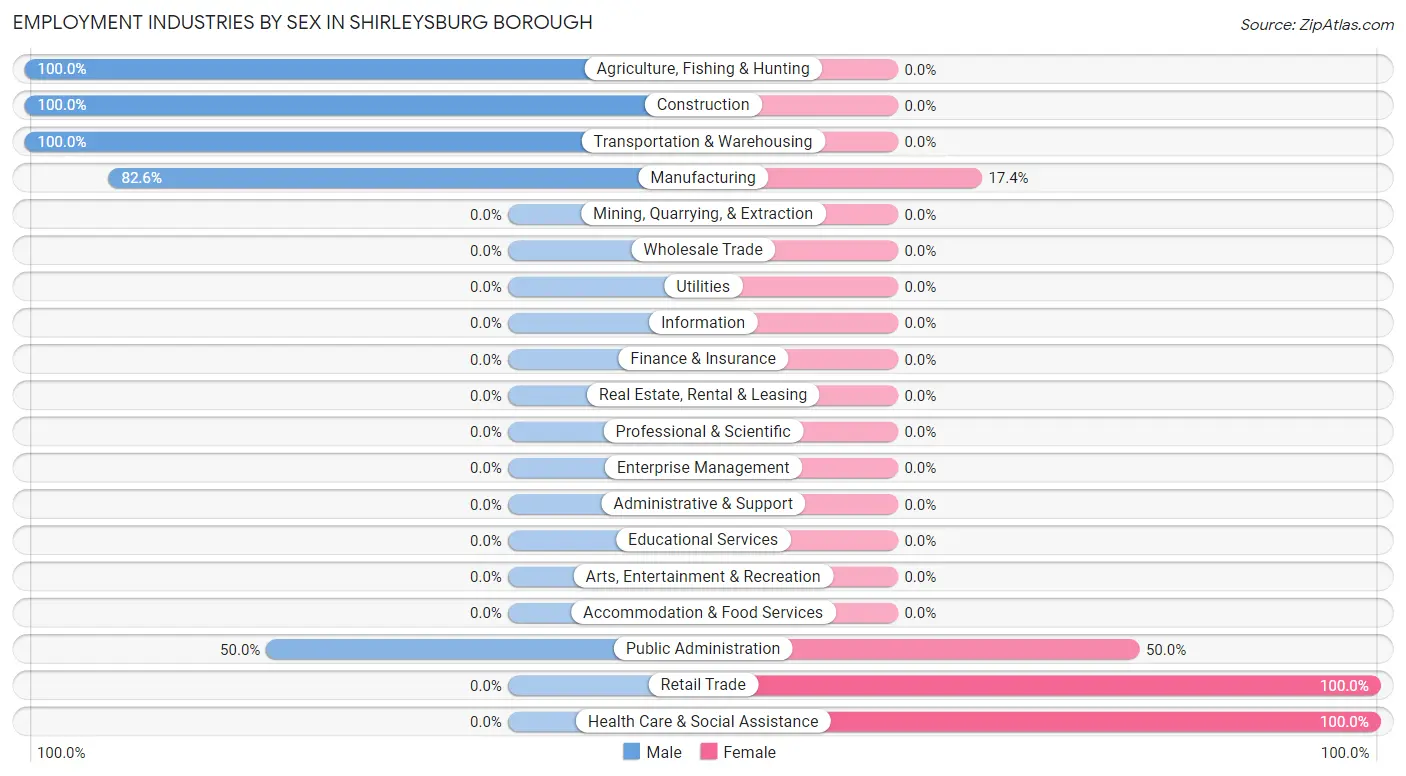
The major employment industries in Shirleysburg borough include Manufacturing (23 | 40.4%), Health Care & Social Assistance (12 | 21.0%), Agriculture, Fishing & Hunting (5 | 8.8%), Retail Trade (5 | 8.8%), and Construction (4 | 7.0%).
Employment Industries by Sex in Shirleysburg borough
The Shirleysburg borough industries that see more men than women are Agriculture, Fishing & Hunting (100.0%), Construction (100.0%), and Transportation & Warehousing (100.0%), whereas the industries that tend to have a higher number of women are Retail Trade (100.0%), Health Care & Social Assistance (100.0%), and Public Administration (50.0%).
| Industry | Male | Female |
| Agriculture, Fishing & Hunting | 5 (100.0%) | 0 (0.0%) |
| Mining, Quarrying, & Extraction | 0 (0.0%) | 0 (0.0%) |
| Construction | 4 (100.0%) | 0 (0.0%) |
| Manufacturing | 19 (82.6%) | 4 (17.4%) |
| Wholesale Trade | 0 (0.0%) | 0 (0.0%) |
| Retail Trade | 0 (0.0%) | 5 (100.0%) |
| Transportation & Warehousing | 1 (100.0%) | 0 (0.0%) |
| Utilities | 0 (0.0%) | 0 (0.0%) |
| Information | 0 (0.0%) | 0 (0.0%) |
| Finance & Insurance | 0 (0.0%) | 0 (0.0%) |
| Real Estate, Rental & Leasing | 0 (0.0%) | 0 (0.0%) |
| Professional & Scientific | 0 (0.0%) | 0 (0.0%) |
| Enterprise Management | 0 (0.0%) | 0 (0.0%) |
| Administrative & Support | 0 (0.0%) | 0 (0.0%) |
| Educational Services | 0 (0.0%) | 0 (0.0%) |
| Health Care & Social Assistance | 0 (0.0%) | 12 (100.0%) |
| Arts, Entertainment & Recreation | 0 (0.0%) | 0 (0.0%) |
| Accommodation & Food Services | 0 (0.0%) | 0 (0.0%) |
| Public Administration | 1 (50.0%) | 1 (50.0%) |
| Total | 35 (61.4%) | 22 (38.6%) |
Education in Shirleysburg borough
School Enrollment in Shirleysburg borough
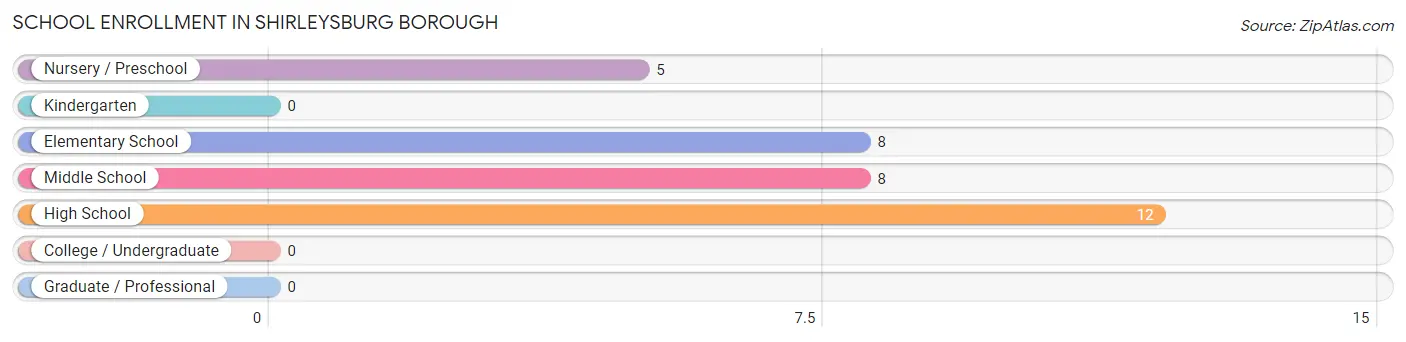
The most common levels of schooling among the 33 students in Shirleysburg borough are high school (12 | 36.4%), elementary school (8 | 24.2%), and middle school (8 | 24.2%).
| School Level | # Students | % Students |
| Nursery / Preschool | 5 | 15.1% |
| Kindergarten | 0 | 0.0% |
| Elementary School | 8 | 24.2% |
| Middle School | 8 | 24.2% |
| High School | 12 | 36.4% |
| College / Undergraduate | 0 | 0.0% |
| Graduate / Professional | 0 | 0.0% |
| Total | 33 | 100.0% |
School Enrollment by Age by Funding Source in Shirleysburg borough
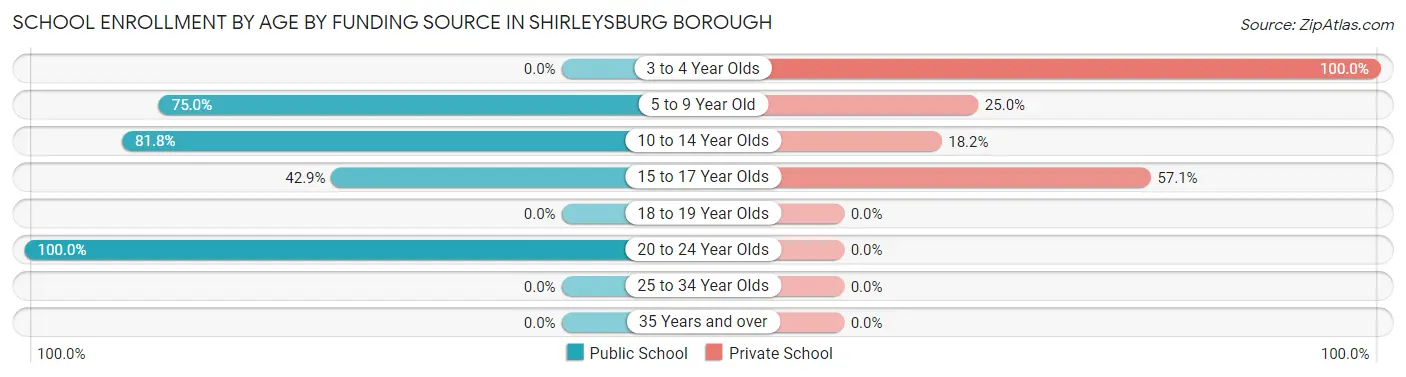
Out of a total of 33 students who are enrolled in schools in Shirleysburg borough, 13 (39.4%) attend a private institution, while the remaining 20 (60.6%) are enrolled in public schools. The age group of 3 to 4 year olds has the highest likelihood of being enrolled in private schools, with 5 (100.0% in the age bracket) enrolled. Conversely, the age group of 20 to 24 year olds has the lowest likelihood of being enrolled in a private school, with 2 (100.0% in the age bracket) attending a public institution.
| Age Bracket | Public School | Private School |
| 3 to 4 Year Olds | 0 (0.0%) | 5 (100.0%) |
| 5 to 9 Year Old | 6 (75.0%) | 2 (25.0%) |
| 10 to 14 Year Olds | 9 (81.8%) | 2 (18.2%) |
| 15 to 17 Year Olds | 3 (42.9%) | 4 (57.1%) |
| 18 to 19 Year Olds | 0 (0.0%) | 0 (0.0%) |
| 20 to 24 Year Olds | 2 (100.0%) | 0 (0.0%) |
| 25 to 34 Year Olds | 0 (0.0%) | 0 (0.0%) |
| 35 Years and over | 0 (0.0%) | 0 (0.0%) |
| Total | 20 (60.6%) | 13 (39.4%) |
Educational Attainment by Field of Study in Shirleysburg borough
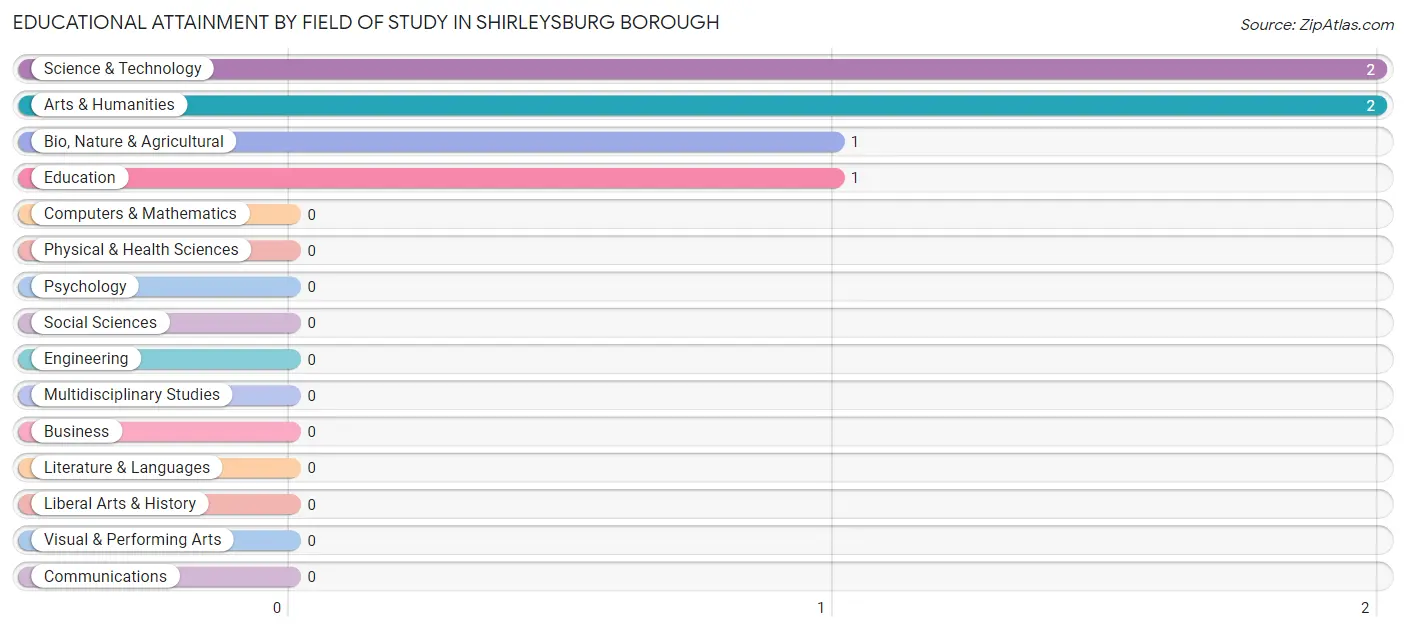
Science & technology (2 | 33.3%), arts & humanities (2 | 33.3%), bio, nature & agricultural (1 | 16.7%), and education (1 | 16.7%) are the most common fields of study among 6 individuals in Shirleysburg borough who have obtained a bachelor's degree or higher.
| Field of Study | # Graduates | % Graduates |
| Computers & Mathematics | 0 | 0.0% |
| Bio, Nature & Agricultural | 1 | 16.7% |
| Physical & Health Sciences | 0 | 0.0% |
| Psychology | 0 | 0.0% |
| Social Sciences | 0 | 0.0% |
| Engineering | 0 | 0.0% |
| Multidisciplinary Studies | 0 | 0.0% |
| Science & Technology | 2 | 33.3% |
| Business | 0 | 0.0% |
| Education | 1 | 16.7% |
| Literature & Languages | 0 | 0.0% |
| Liberal Arts & History | 0 | 0.0% |
| Visual & Performing Arts | 0 | 0.0% |
| Communications | 0 | 0.0% |
| Arts & Humanities | 2 | 33.3% |
| Total | 6 | 100.0% |
Transportation & Commute in Shirleysburg borough
Vehicle Availability by Sex in Shirleysburg borough
The most prevalent vehicle ownership categories in Shirleysburg borough are males with 1 vehicle (8, accounting for 25.8%) and females with 1 vehicle (5, making up 36.4%).
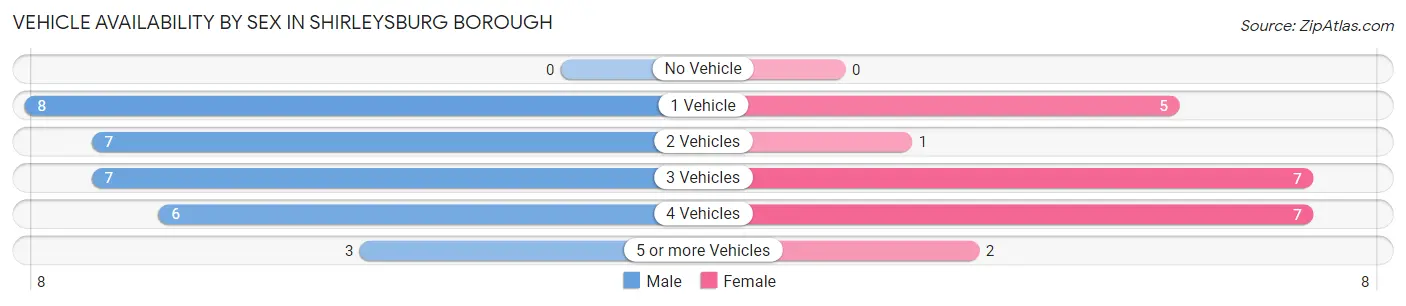
| Vehicles Available | Male | Female |
| No Vehicle | 0 (0.0%) | 0 (0.0%) |
| 1 Vehicle | 8 (25.8%) | 5 (22.7%) |
| 2 Vehicles | 7 (22.6%) | 1 (4.5%) |
| 3 Vehicles | 7 (22.6%) | 7 (31.8%) |
| 4 Vehicles | 6 (19.4%) | 7 (31.8%) |
| 5 or more Vehicles | 3 (9.7%) | 2 (9.1%) |
| Total | 31 (100.0%) | 22 (100.0%) |
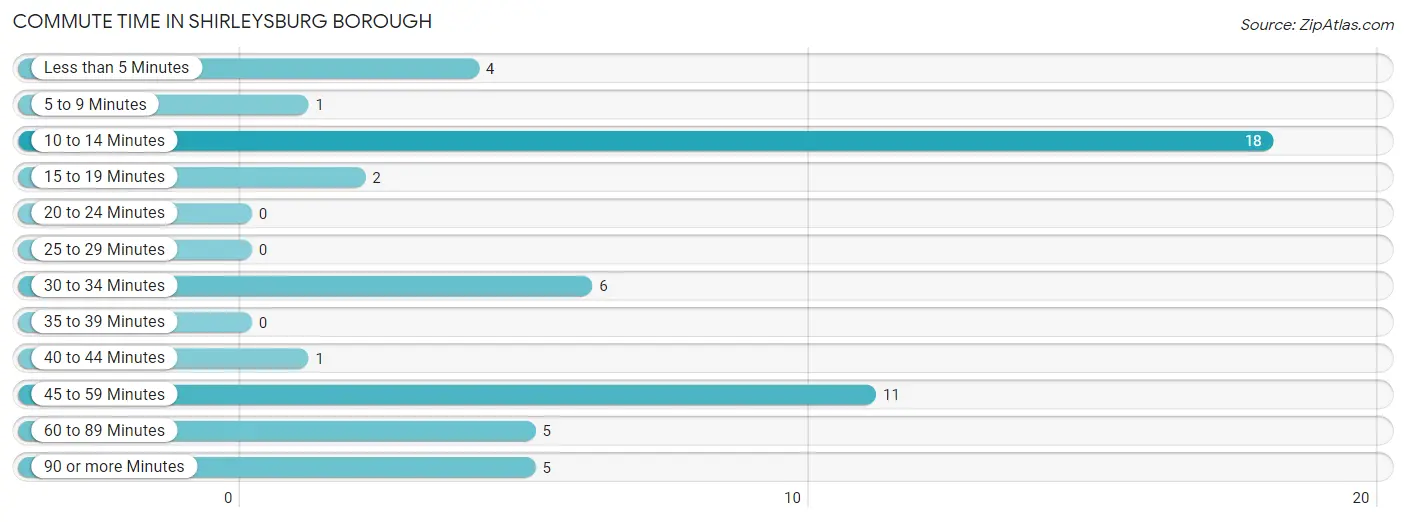
Commute Time in Shirleysburg borough
The most frequently occuring commute durations in Shirleysburg borough are 10 to 14 minutes (18 commuters, 34.0%), 45 to 59 minutes (11 commuters, 20.7%), and 30 to 34 minutes (6 commuters, 11.3%).
| Commute Time | # Commuters | % Commuters |
| Less than 5 Minutes | 4 | 7.5% |
| 5 to 9 Minutes | 1 | 1.9% |
| 10 to 14 Minutes | 18 | 34.0% |
| 15 to 19 Minutes | 2 | 3.8% |
| 20 to 24 Minutes | 0 | 0.0% |
| 25 to 29 Minutes | 0 | 0.0% |
| 30 to 34 Minutes | 6 | 11.3% |
| 35 to 39 Minutes | 0 | 0.0% |
| 40 to 44 Minutes | 1 | 1.9% |
| 45 to 59 Minutes | 11 | 20.7% |
| 60 to 89 Minutes | 5 | 9.4% |
| 90 or more Minutes | 5 | 9.4% |
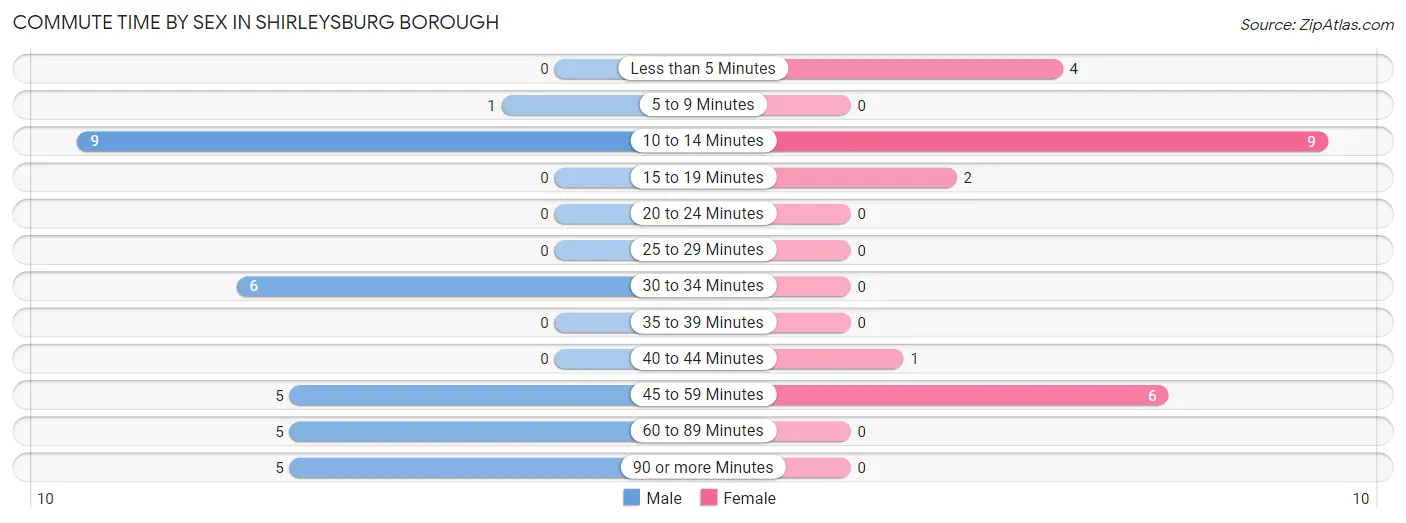
Commute Time by Sex in Shirleysburg borough
The most common commute times in Shirleysburg borough are 10 to 14 minutes (9 commuters, 29.0%) for males and 10 to 14 minutes (9 commuters, 40.9%) for females.
| Commute Time | Male | Female |
| Less than 5 Minutes | 0 (0.0%) | 4 (18.2%) |
| 5 to 9 Minutes | 1 (3.2%) | 0 (0.0%) |
| 10 to 14 Minutes | 9 (29.0%) | 9 (40.9%) |
| 15 to 19 Minutes | 0 (0.0%) | 2 (9.1%) |
| 20 to 24 Minutes | 0 (0.0%) | 0 (0.0%) |
| 25 to 29 Minutes | 0 (0.0%) | 0 (0.0%) |
| 30 to 34 Minutes | 6 (19.4%) | 0 (0.0%) |
| 35 to 39 Minutes | 0 (0.0%) | 0 (0.0%) |
| 40 to 44 Minutes | 0 (0.0%) | 1 (4.5%) |
| 45 to 59 Minutes | 5 (16.1%) | 6 (27.3%) |
| 60 to 89 Minutes | 5 (16.1%) | 0 (0.0%) |
| 90 or more Minutes | 5 (16.1%) | 0 (0.0%) |
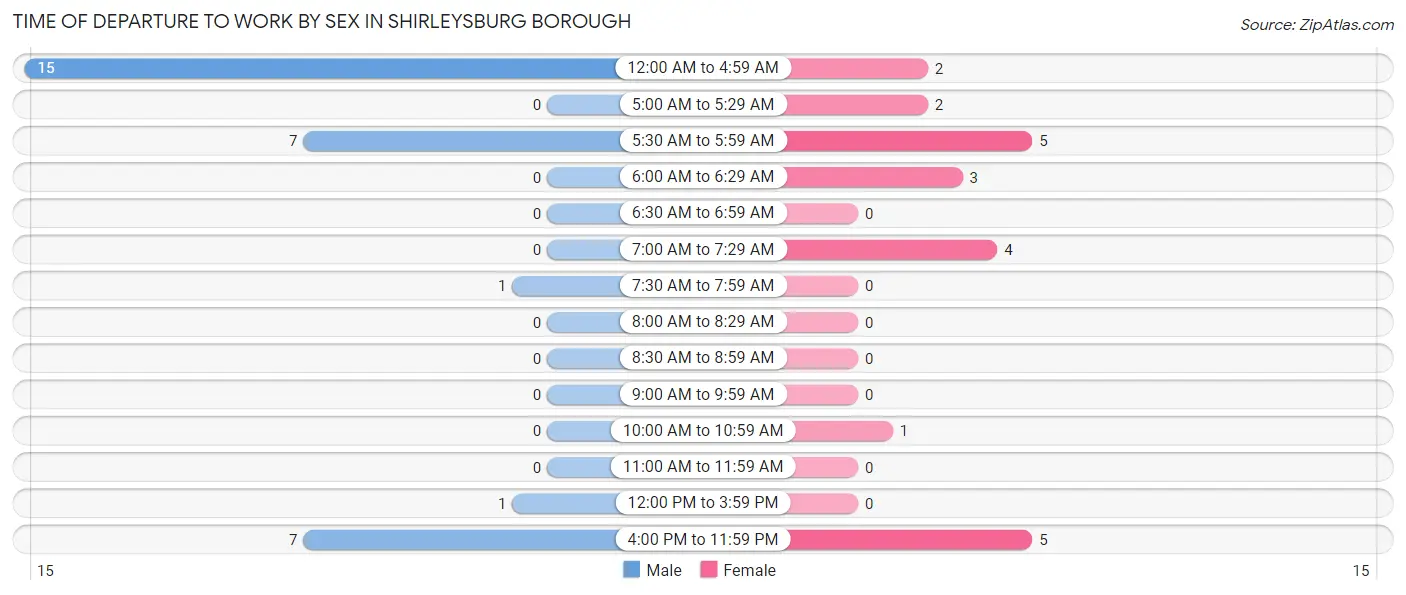
Time of Departure to Work by Sex in Shirleysburg borough
The most frequent times of departure to work in Shirleysburg borough are 12:00 AM to 4:59 AM (15, 48.4%) for males and 5:30 AM to 5:59 AM (5, 22.7%) for females.
| Time of Departure | Male | Female |
| 12:00 AM to 4:59 AM | 15 (48.4%) | 2 (9.1%) |
| 5:00 AM to 5:29 AM | 0 (0.0%) | 2 (9.1%) |
| 5:30 AM to 5:59 AM | 7 (22.6%) | 5 (22.7%) |
| 6:00 AM to 6:29 AM | 0 (0.0%) | 3 (13.6%) |
| 6:30 AM to 6:59 AM | 0 (0.0%) | 0 (0.0%) |
| 7:00 AM to 7:29 AM | 0 (0.0%) | 4 (18.2%) |
| 7:30 AM to 7:59 AM | 1 (3.2%) | 0 (0.0%) |
| 8:00 AM to 8:29 AM | 0 (0.0%) | 0 (0.0%) |
| 8:30 AM to 8:59 AM | 0 (0.0%) | 0 (0.0%) |
| 9:00 AM to 9:59 AM | 0 (0.0%) | 0 (0.0%) |
| 10:00 AM to 10:59 AM | 0 (0.0%) | 1 (4.5%) |
| 11:00 AM to 11:59 AM | 0 (0.0%) | 0 (0.0%) |
| 12:00 PM to 3:59 PM | 1 (3.2%) | 0 (0.0%) |
| 4:00 PM to 11:59 PM | 7 (22.6%) | 5 (22.7%) |
| Total | 31 (100.0%) | 22 (100.0%) |
Housing Occupancy in Shirleysburg borough
Occupancy by Ownership in Shirleysburg borough
Of the total 46 dwellings in Shirleysburg borough, owner-occupied units account for 41 (89.1%), while renter-occupied units make up 5 (10.9%).
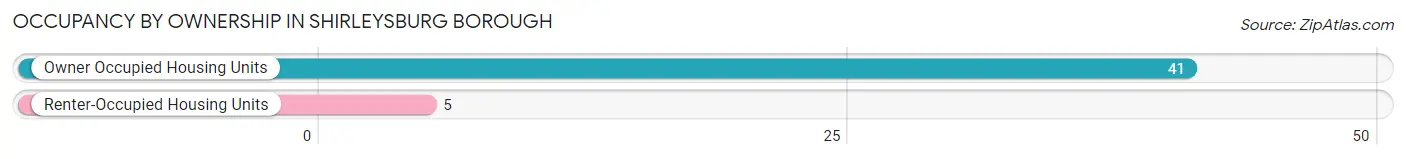
| Occupancy | # Housing Units | % Housing Units |
| Owner Occupied Housing Units | 41 | 89.1% |
| Renter-Occupied Housing Units | 5 | 10.9% |
| Total Occupied Housing Units | 46 | 100.0% |
Occupancy by Household Size in Shirleysburg borough
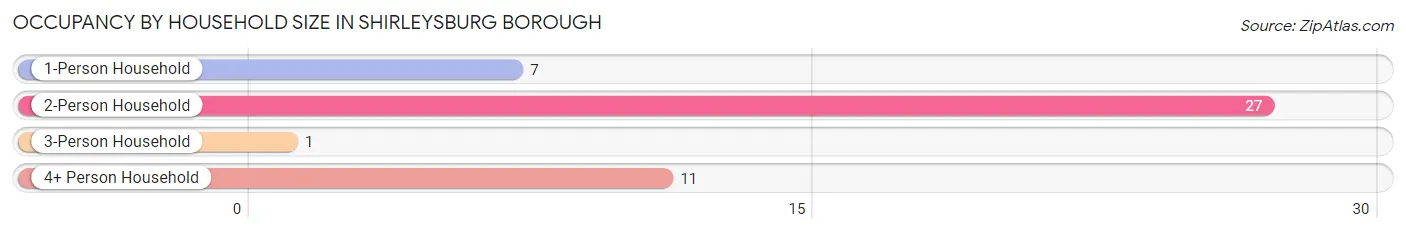
| Household Size | # Housing Units | % Housing Units |
| 1-Person Household | 7 | 15.2% |
| 2-Person Household | 27 | 58.7% |
| 3-Person Household | 1 | 2.2% |
| 4+ Person Household | 11 | 23.9% |
| Total Housing Units | 46 | 100.0% |
Occupancy by Ownership by Household Size in Shirleysburg borough
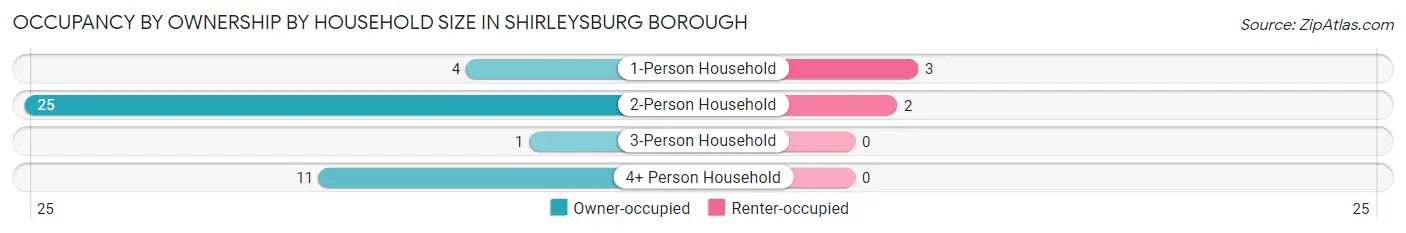
| Household Size | Owner-occupied | Renter-occupied |
| 1-Person Household | 4 (57.1%) | 3 (42.9%) |
| 2-Person Household | 25 (92.6%) | 2 (7.4%) |
| 3-Person Household | 1 (100.0%) | 0 (0.0%) |
| 4+ Person Household | 11 (100.0%) | 0 (0.0%) |
| Total Housing Units | 41 (89.1%) | 5 (10.9%) |
Occupancy by Educational Attainment in Shirleysburg borough
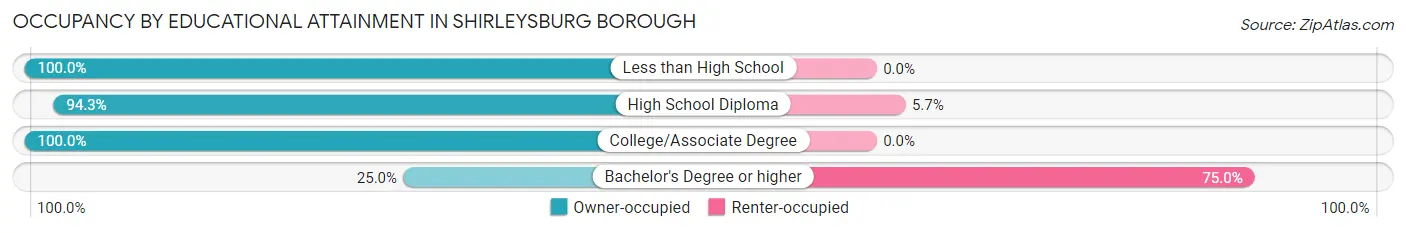
| Household Size | Owner-occupied | Renter-occupied |
| Less than High School | 4 (100.0%) | 0 (0.0%) |
| High School Diploma | 33 (94.3%) | 2 (5.7%) |
| College/Associate Degree | 3 (100.0%) | 0 (0.0%) |
| Bachelor's Degree or higher | 1 (25.0%) | 3 (75.0%) |
Occupancy by Age of Householder in Shirleysburg borough
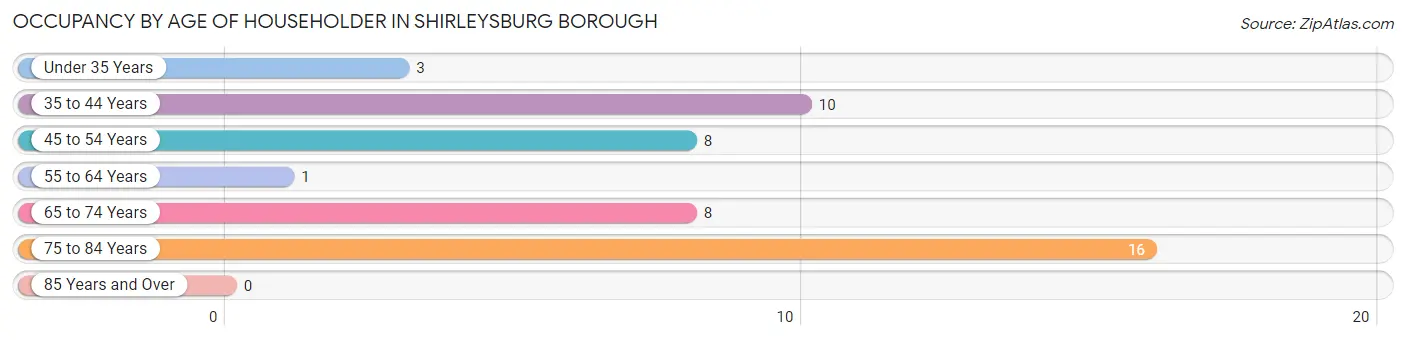
| Age Bracket | # Households | % Households |
| Under 35 Years | 3 | 6.5% |
| 35 to 44 Years | 10 | 21.7% |
| 45 to 54 Years | 8 | 17.4% |
| 55 to 64 Years | 1 | 2.2% |
| 65 to 74 Years | 8 | 17.4% |
| 75 to 84 Years | 16 | 34.8% |
| 85 Years and Over | 0 | 0.0% |
| Total | 46 | 100.0% |
Housing Finances in Shirleysburg borough
Median Income by Occupancy in Shirleysburg borough
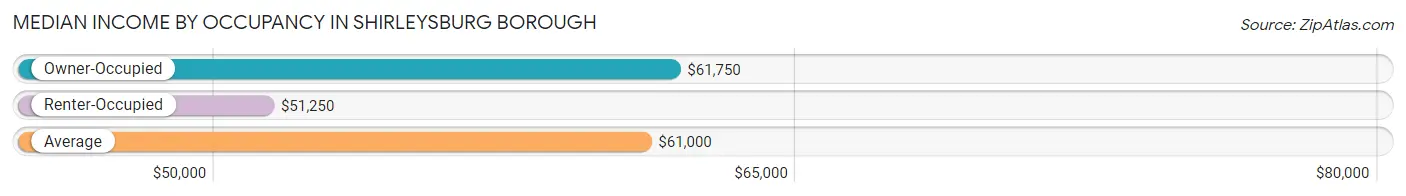
| Occupancy Type | # Households | Median Income |
| Owner-Occupied | 41 (89.1%) | $61,750 |
| Renter-Occupied | 5 (10.9%) | $51,250 |
| Average | 46 (100.0%) | $61,000 |
Occupancy by Householder Income Bracket in Shirleysburg borough
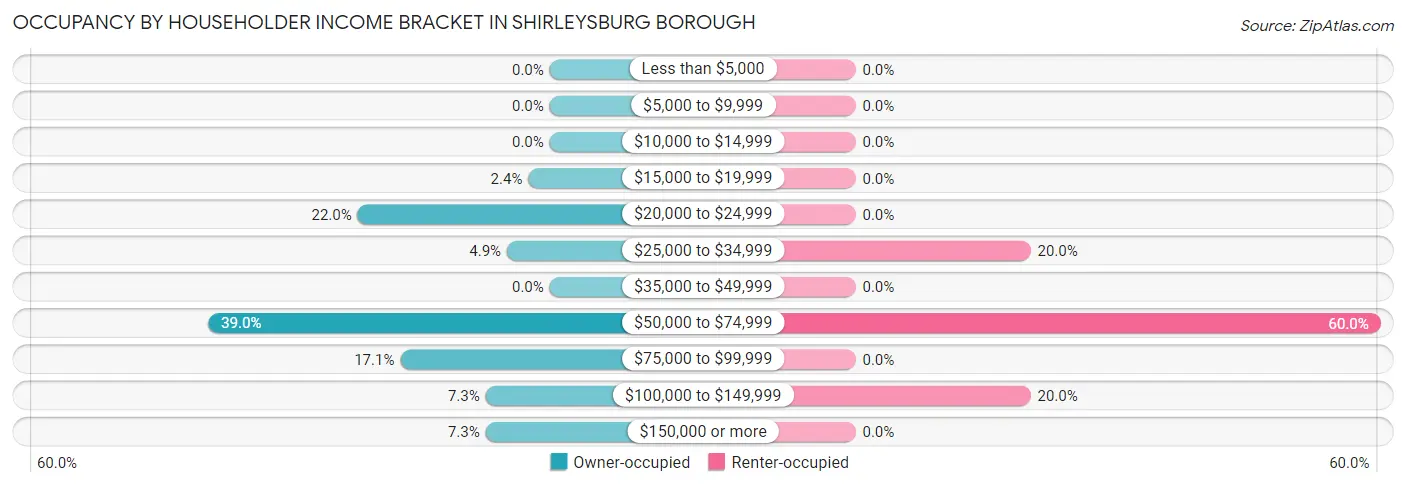
| Income Bracket | Owner-occupied | Renter-occupied |
| Less than $5,000 | 0 (0.0%) | 0 (0.0%) |
| $5,000 to $9,999 | 0 (0.0%) | 0 (0.0%) |
| $10,000 to $14,999 | 0 (0.0%) | 0 (0.0%) |
| $15,000 to $19,999 | 1 (2.4%) | 0 (0.0%) |
| $20,000 to $24,999 | 9 (22.0%) | 0 (0.0%) |
| $25,000 to $34,999 | 2 (4.9%) | 1 (20.0%) |
| $35,000 to $49,999 | 0 (0.0%) | 0 (0.0%) |
| $50,000 to $74,999 | 16 (39.0%) | 3 (60.0%) |
| $75,000 to $99,999 | 7 (17.1%) | 0 (0.0%) |
| $100,000 to $149,999 | 3 (7.3%) | 1 (20.0%) |
| $150,000 or more | 3 (7.3%) | 0 (0.0%) |
| Total | 41 (100.0%) | 5 (100.0%) |
Monthly Housing Cost Tiers in Shirleysburg borough
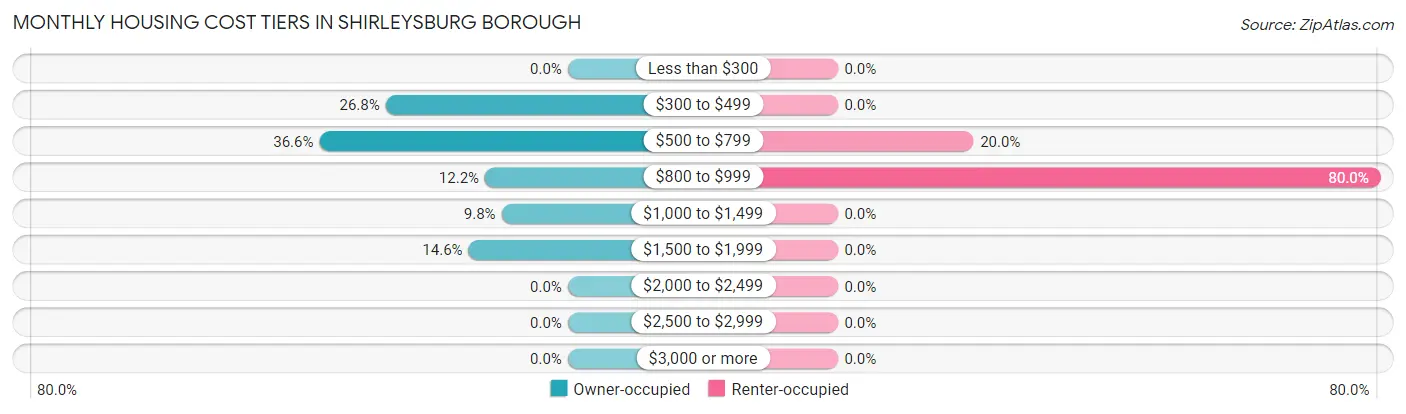
| Monthly Cost | Owner-occupied | Renter-occupied |
| Less than $300 | 0 (0.0%) | 0 (0.0%) |
| $300 to $499 | 11 (26.8%) | 0 (0.0%) |
| $500 to $799 | 15 (36.6%) | 1 (20.0%) |
| $800 to $999 | 5 (12.2%) | 4 (80.0%) |
| $1,000 to $1,499 | 4 (9.8%) | 0 (0.0%) |
| $1,500 to $1,999 | 6 (14.6%) | 0 (0.0%) |
| $2,000 to $2,499 | 0 (0.0%) | 0 (0.0%) |
| $2,500 to $2,999 | 0 (0.0%) | 0 (0.0%) |
| $3,000 or more | 0 (0.0%) | 0 (0.0%) |
| Total | 41 (100.0%) | 5 (100.0%) |
Physical Housing Characteristics in Shirleysburg borough
Housing Structures in Shirleysburg borough
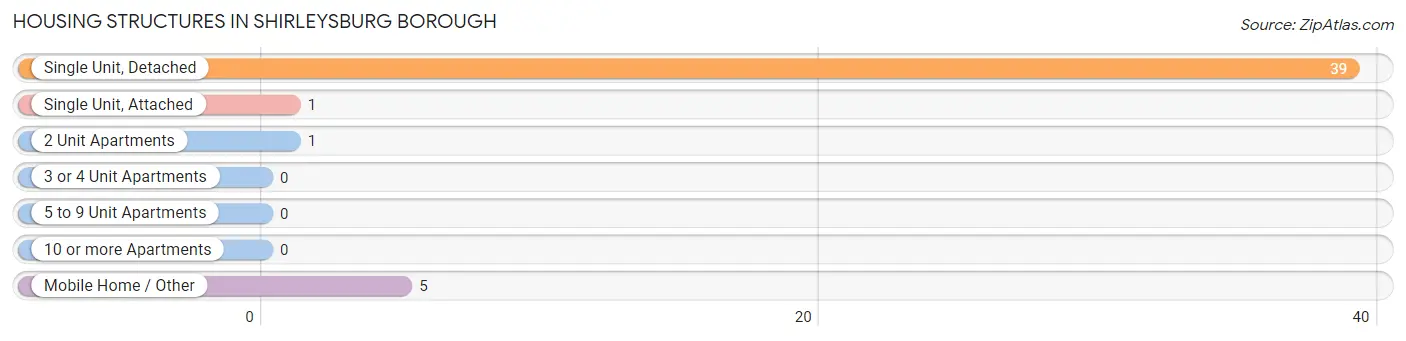
| Structure Type | # Housing Units | % Housing Units |
| Single Unit, Detached | 39 | 84.8% |
| Single Unit, Attached | 1 | 2.2% |
| 2 Unit Apartments | 1 | 2.2% |
| 3 or 4 Unit Apartments | 0 | 0.0% |
| 5 to 9 Unit Apartments | 0 | 0.0% |
| 10 or more Apartments | 0 | 0.0% |
| Mobile Home / Other | 5 | 10.9% |
| Total | 46 | 100.0% |
Housing Structures by Occupancy in Shirleysburg borough
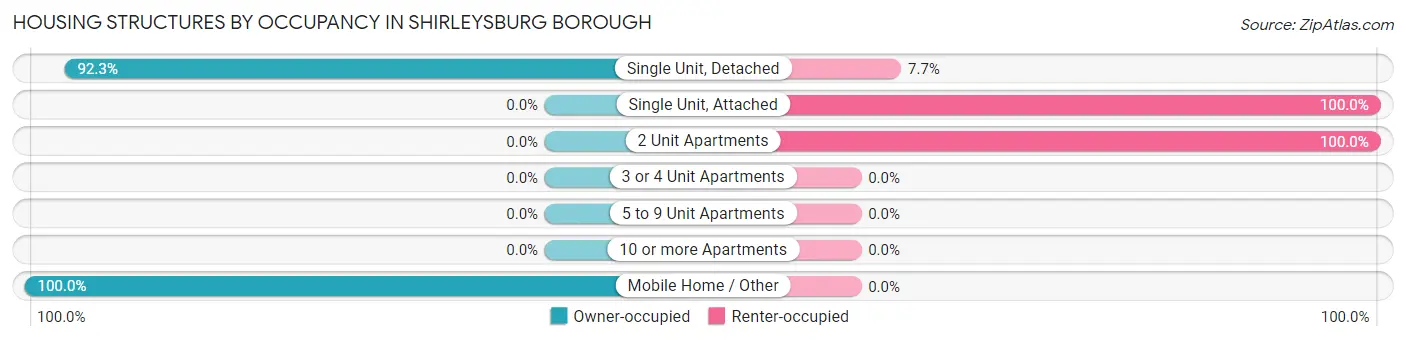
| Structure Type | Owner-occupied | Renter-occupied |
| Single Unit, Detached | 36 (92.3%) | 3 (7.7%) |
| Single Unit, Attached | 0 (0.0%) | 1 (100.0%) |
| 2 Unit Apartments | 0 (0.0%) | 1 (100.0%) |
| 3 or 4 Unit Apartments | 0 (0.0%) | 0 (0.0%) |
| 5 to 9 Unit Apartments | 0 (0.0%) | 0 (0.0%) |
| 10 or more Apartments | 0 (0.0%) | 0 (0.0%) |
| Mobile Home / Other | 5 (100.0%) | 0 (0.0%) |
| Total | 41 (89.1%) | 5 (10.9%) |
Housing Structures by Number of Rooms in Shirleysburg borough
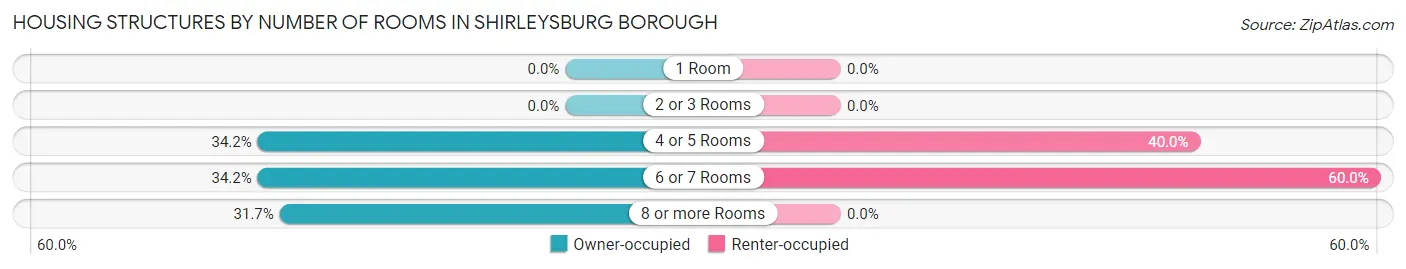
| Number of Rooms | Owner-occupied | Renter-occupied |
| 1 Room | 0 (0.0%) | 0 (0.0%) |
| 2 or 3 Rooms | 0 (0.0%) | 0 (0.0%) |
| 4 or 5 Rooms | 14 (34.2%) | 2 (40.0%) |
| 6 or 7 Rooms | 14 (34.2%) | 3 (60.0%) |
| 8 or more Rooms | 13 (31.7%) | 0 (0.0%) |
| Total | 41 (100.0%) | 5 (100.0%) |
Housing Structure by Heating Type in Shirleysburg borough
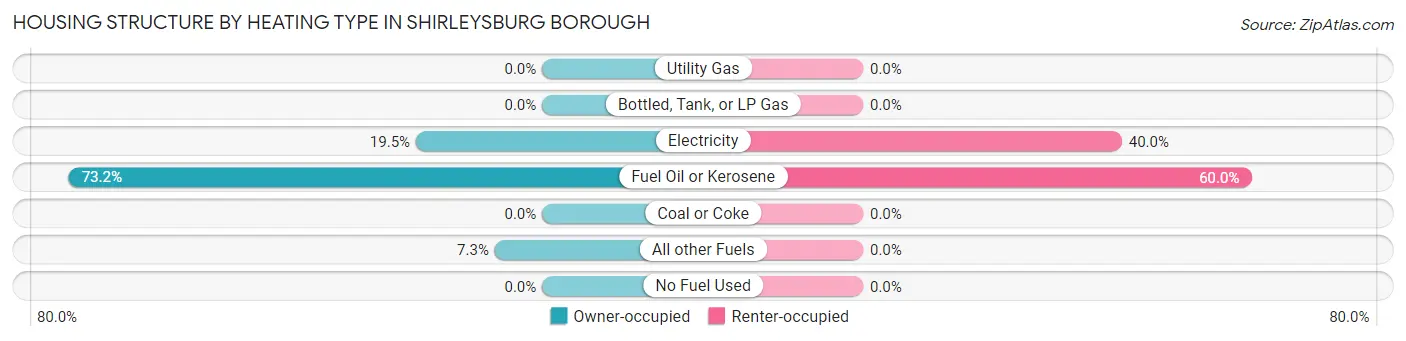
| Heating Type | Owner-occupied | Renter-occupied |
| Utility Gas | 0 (0.0%) | 0 (0.0%) |
| Bottled, Tank, or LP Gas | 0 (0.0%) | 0 (0.0%) |
| Electricity | 8 (19.5%) | 2 (40.0%) |
| Fuel Oil or Kerosene | 30 (73.2%) | 3 (60.0%) |
| Coal or Coke | 0 (0.0%) | 0 (0.0%) |
| All other Fuels | 3 (7.3%) | 0 (0.0%) |
| No Fuel Used | 0 (0.0%) | 0 (0.0%) |
| Total | 41 (100.0%) | 5 (100.0%) |
Household Vehicle Usage in Shirleysburg borough
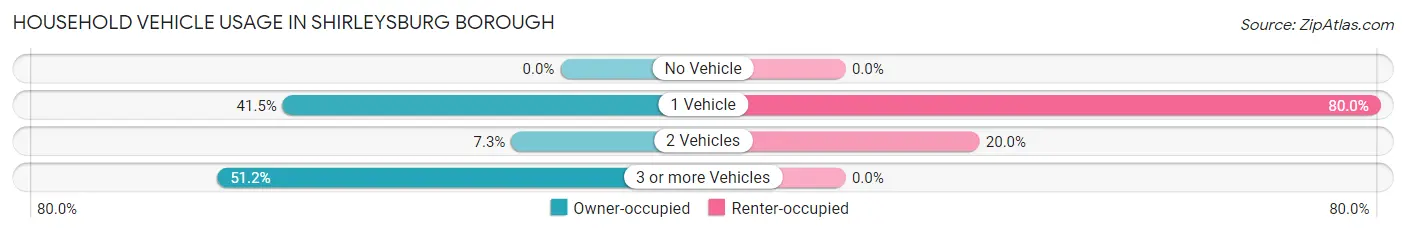
| Vehicles per Household | Owner-occupied | Renter-occupied |
| No Vehicle | 0 (0.0%) | 0 (0.0%) |
| 1 Vehicle | 17 (41.5%) | 4 (80.0%) |
| 2 Vehicles | 3 (7.3%) | 1 (20.0%) |
| 3 or more Vehicles | 21 (51.2%) | 0 (0.0%) |
| Total | 41 (100.0%) | 5 (100.0%) |
Real Estate & Mortgages in Shirleysburg borough
Real Estate and Mortgage Overview in Shirleysburg borough
| Characteristic | Without Mortgage | With Mortgage |
| Housing Units | 18 | 23 |
| Median Property Value | $138,900 | $80,800 |
| Median Household Income | - | - |
| Monthly Housing Costs | $391 | $0 |
| Real Estate Taxes | - | - |
Property Value by Mortgage Status in Shirleysburg borough
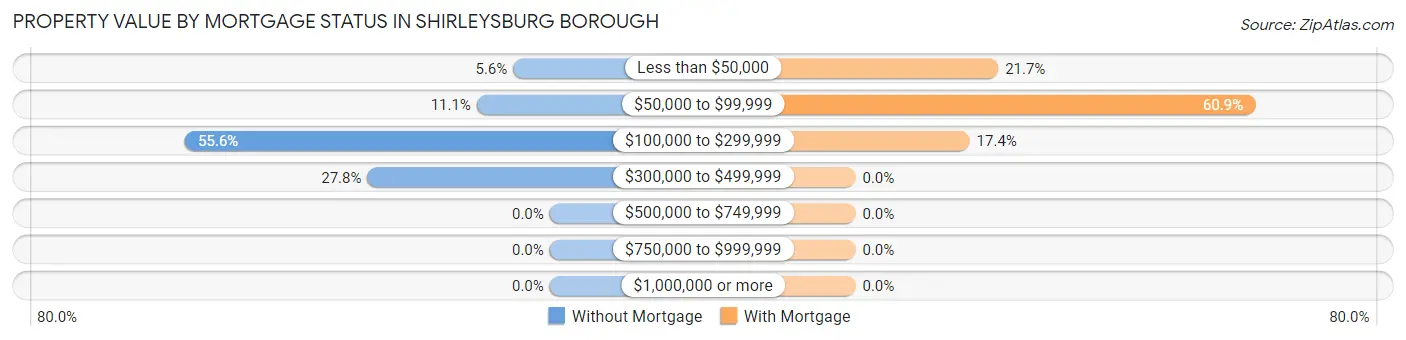
| Property Value | Without Mortgage | With Mortgage |
| Less than $50,000 | 1 (5.6%) | 5 (21.7%) |
| $50,000 to $99,999 | 2 (11.1%) | 14 (60.9%) |
| $100,000 to $299,999 | 10 (55.6%) | 4 (17.4%) |
| $300,000 to $499,999 | 5 (27.8%) | 0 (0.0%) |
| $500,000 to $749,999 | 0 (0.0%) | 0 (0.0%) |
| $750,000 to $999,999 | 0 (0.0%) | 0 (0.0%) |
| $1,000,000 or more | 0 (0.0%) | 0 (0.0%) |
| Total | 18 (100.0%) | 23 (100.0%) |
Household Income by Mortgage Status in Shirleysburg borough
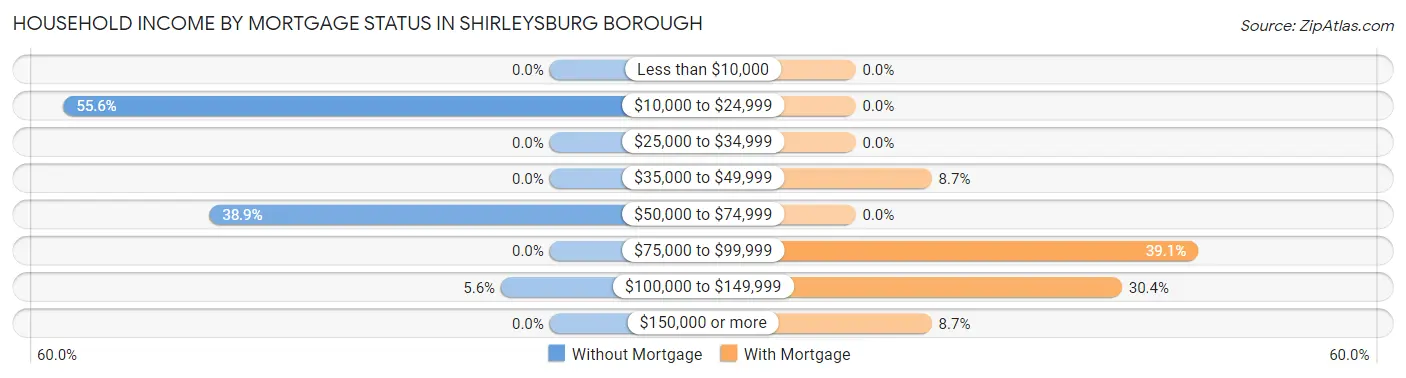
| Household Income | Without Mortgage | With Mortgage |
| Less than $10,000 | 0 (0.0%) | 0 (0.0%) |
| $10,000 to $24,999 | 10 (55.6%) | 0 (0.0%) |
| $25,000 to $34,999 | 0 (0.0%) | 0 (0.0%) |
| $35,000 to $49,999 | 0 (0.0%) | 2 (8.7%) |
| $50,000 to $74,999 | 7 (38.9%) | 0 (0.0%) |
| $75,000 to $99,999 | 0 (0.0%) | 9 (39.1%) |
| $100,000 to $149,999 | 1 (5.6%) | 7 (30.4%) |
| $150,000 or more | 0 (0.0%) | 2 (8.7%) |
| Total | 18 (100.0%) | 23 (100.0%) |
Property Value to Household Income Ratio in Shirleysburg borough
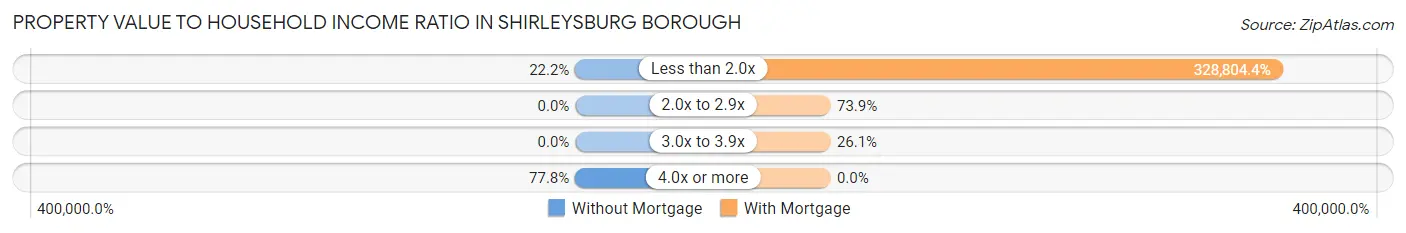
| Value-to-Income Ratio | Without Mortgage | With Mortgage |
| Less than 2.0x | 4 (22.2%) | 75,625 (328,804.4%) |
| 2.0x to 2.9x | 0 (0.0%) | 17 (73.9%) |
| 3.0x to 3.9x | 0 (0.0%) | 6 (26.1%) |
| 4.0x or more | 14 (77.8%) | 0 (0.0%) |
| Total | 18 (100.0%) | 23 (100.0%) |
Real Estate Taxes by Mortgage Status in Shirleysburg borough
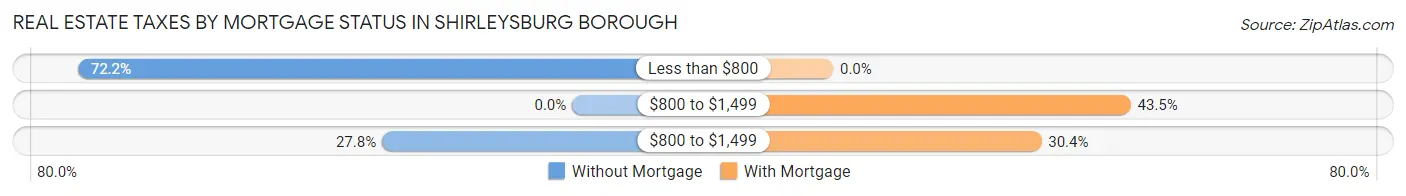
| Property Taxes | Without Mortgage | With Mortgage |
| Less than $800 | 13 (72.2%) | 0 (0.0%) |
| $800 to $1,499 | 0 (0.0%) | 10 (43.5%) |
| $800 to $1,499 | 5 (27.8%) | 7 (30.4%) |
| Total | 18 (100.0%) | 23 (100.0%) |
Health & Disability in Shirleysburg borough
Health Insurance Coverage by Age in Shirleysburg borough
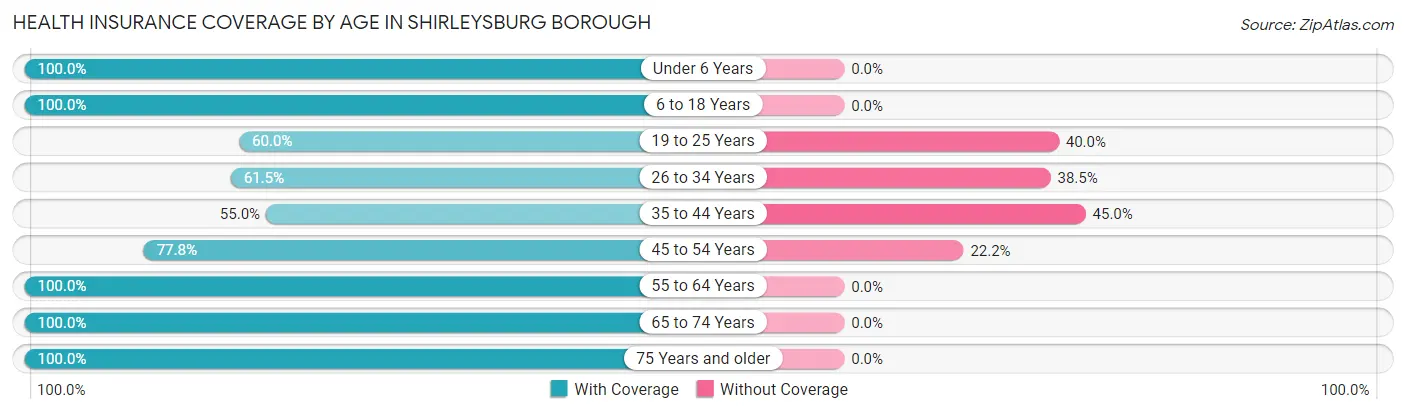
| Age Bracket | With Coverage | Without Coverage |
| Under 6 Years | 7 (100.0%) | 0 (0.0%) |
| 6 to 18 Years | 26 (100.0%) | 0 (0.0%) |
| 19 to 25 Years | 9 (60.0%) | 6 (40.0%) |
| 26 to 34 Years | 8 (61.5%) | 5 (38.5%) |
| 35 to 44 Years | 11 (55.0%) | 9 (45.0%) |
| 45 to 54 Years | 7 (77.8%) | 2 (22.2%) |
| 55 to 64 Years | 16 (100.0%) | 0 (0.0%) |
| 65 to 74 Years | 23 (100.0%) | 0 (0.0%) |
| 75 Years and older | 24 (100.0%) | 0 (0.0%) |
| Total | 131 (85.6%) | 22 (14.4%) |
Health Insurance Coverage by Citizenship Status in Shirleysburg borough
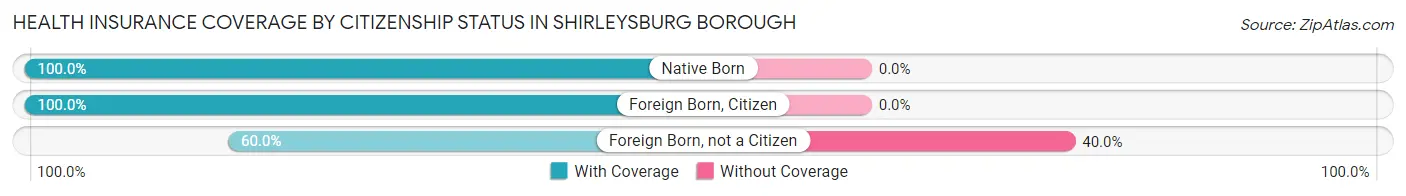
| Citizenship Status | With Coverage | Without Coverage |
| Native Born | 7 (100.0%) | 0 (0.0%) |
| Foreign Born, Citizen | 26 (100.0%) | 0 (0.0%) |
| Foreign Born, not a Citizen | 9 (60.0%) | 6 (40.0%) |
Health Insurance Coverage by Household Income in Shirleysburg borough
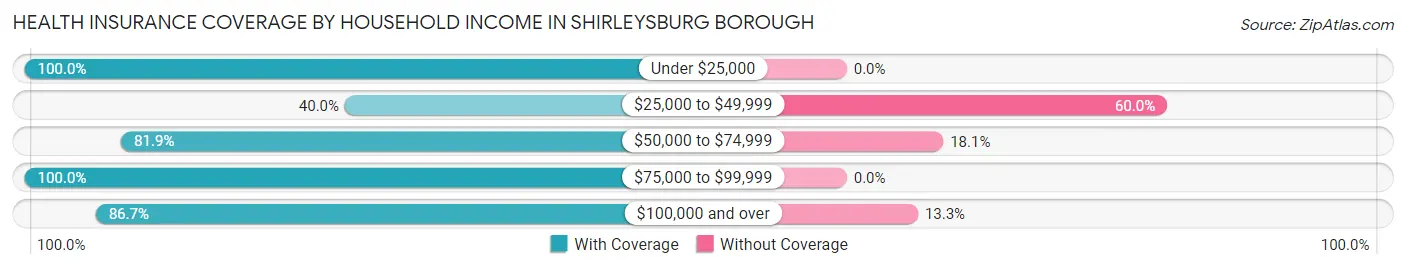
| Household Income | With Coverage | Without Coverage |
| Under $25,000 | 21 (100.0%) | 0 (0.0%) |
| $25,000 to $49,999 | 2 (40.0%) | 3 (60.0%) |
| $50,000 to $74,999 | 68 (81.9%) | 15 (18.1%) |
| $75,000 to $99,999 | 12 (100.0%) | 0 (0.0%) |
| $100,000 and over | 26 (86.7%) | 4 (13.3%) |
Public vs Private Health Insurance Coverage by Age in Shirleysburg borough
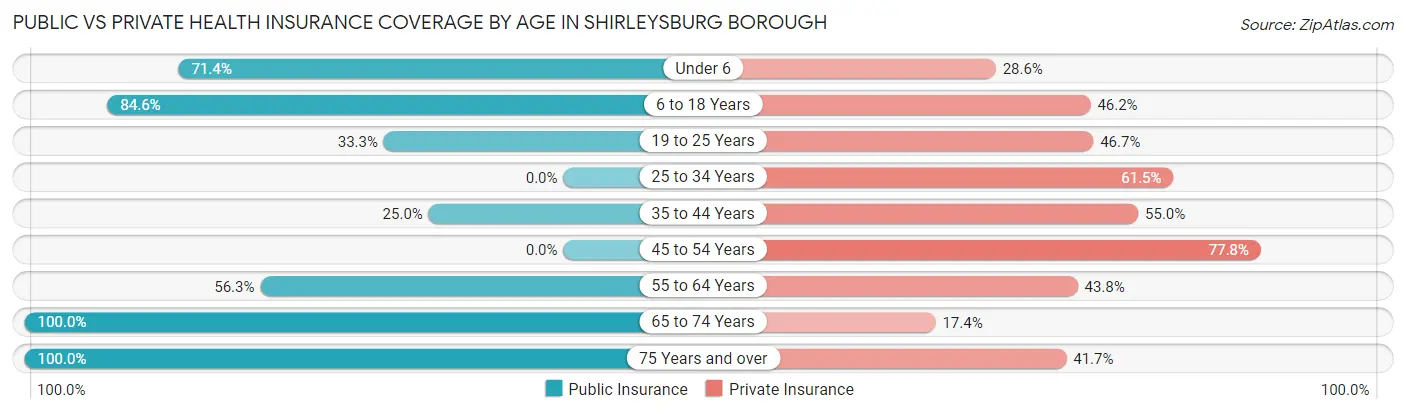
| Age Bracket | Public Insurance | Private Insurance |
| Under 6 | 5 (71.4%) | 2 (28.6%) |
| 6 to 18 Years | 22 (84.6%) | 12 (46.2%) |
| 19 to 25 Years | 5 (33.3%) | 7 (46.7%) |
| 25 to 34 Years | 0 (0.0%) | 8 (61.5%) |
| 35 to 44 Years | 5 (25.0%) | 11 (55.0%) |
| 45 to 54 Years | 0 (0.0%) | 7 (77.8%) |
| 55 to 64 Years | 9 (56.2%) | 7 (43.8%) |
| 65 to 74 Years | 23 (100.0%) | 4 (17.4%) |
| 75 Years and over | 24 (100.0%) | 10 (41.7%) |
| Total | 93 (60.8%) | 68 (44.4%) |
Disability Status by Sex by Age in Shirleysburg borough
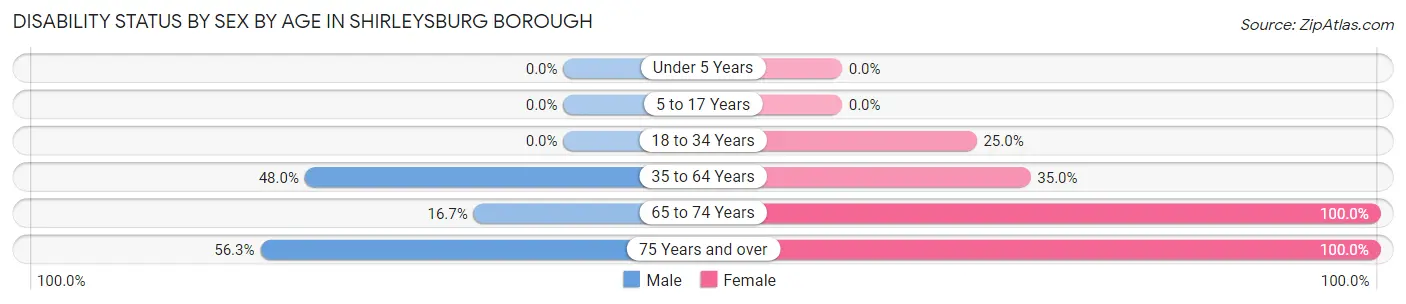
| Age Bracket | Male | Female |
| Under 5 Years | 0 (0.0%) | 0 (0.0%) |
| 5 to 17 Years | 0 (0.0%) | 0 (0.0%) |
| 18 to 34 Years | 0 (0.0%) | 2 (25.0%) |
| 35 to 64 Years | 12 (48.0%) | 7 (35.0%) |
| 65 to 74 Years | 1 (16.7%) | 17 (100.0%) |
| 75 Years and over | 9 (56.2%) | 8 (100.0%) |
Disability Class by Sex by Age in Shirleysburg borough
Disability Class: Hearing Difficulty
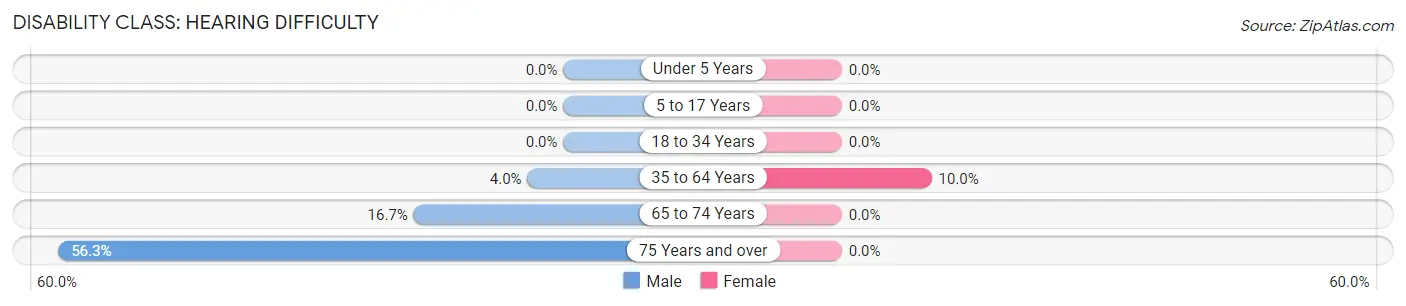
| Age Bracket | Male | Female |
| Under 5 Years | 0 (0.0%) | 0 (0.0%) |
| 5 to 17 Years | 0 (0.0%) | 0 (0.0%) |
| 18 to 34 Years | 0 (0.0%) | 0 (0.0%) |
| 35 to 64 Years | 1 (4.0%) | 2 (10.0%) |
| 65 to 74 Years | 1 (16.7%) | 0 (0.0%) |
| 75 Years and over | 9 (56.2%) | 0 (0.0%) |
Disability Class: Vision Difficulty
| Age Bracket | Male | Female |
| Under 5 Years | 0 (0.0%) | 0 (0.0%) |
| 5 to 17 Years | 0 (0.0%) | 0 (0.0%) |
| 18 to 34 Years | 0 (0.0%) | 0 (0.0%) |
| 35 to 64 Years | 0 (0.0%) | 0 (0.0%) |
| 65 to 74 Years | 0 (0.0%) | 0 (0.0%) |
| 75 Years and over | 0 (0.0%) | 0 (0.0%) |
Disability Class: Cognitive Difficulty
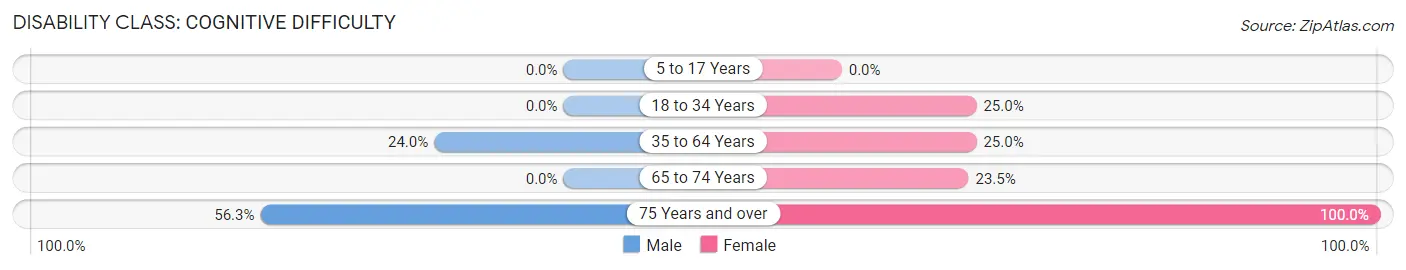
| Age Bracket | Male | Female |
| 5 to 17 Years | 0 (0.0%) | 0 (0.0%) |
| 18 to 34 Years | 0 (0.0%) | 2 (25.0%) |
| 35 to 64 Years | 6 (24.0%) | 5 (25.0%) |
| 65 to 74 Years | 0 (0.0%) | 4 (23.5%) |
| 75 Years and over | 9 (56.2%) | 8 (100.0%) |
Disability Class: Ambulatory Difficulty
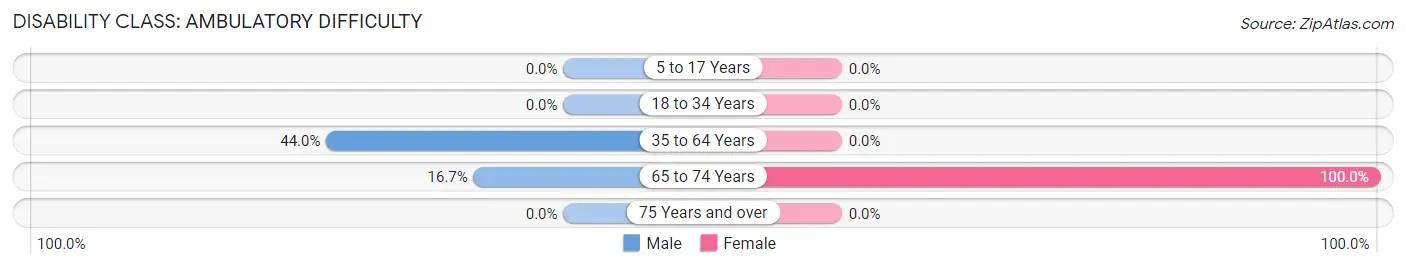
| Age Bracket | Male | Female |
| 5 to 17 Years | 0 (0.0%) | 0 (0.0%) |
| 18 to 34 Years | 0 (0.0%) | 0 (0.0%) |
| 35 to 64 Years | 11 (44.0%) | 0 (0.0%) |
| 65 to 74 Years | 1 (16.7%) | 17 (100.0%) |
| 75 Years and over | 0 (0.0%) | 0 (0.0%) |
Disability Class: Self-Care Difficulty
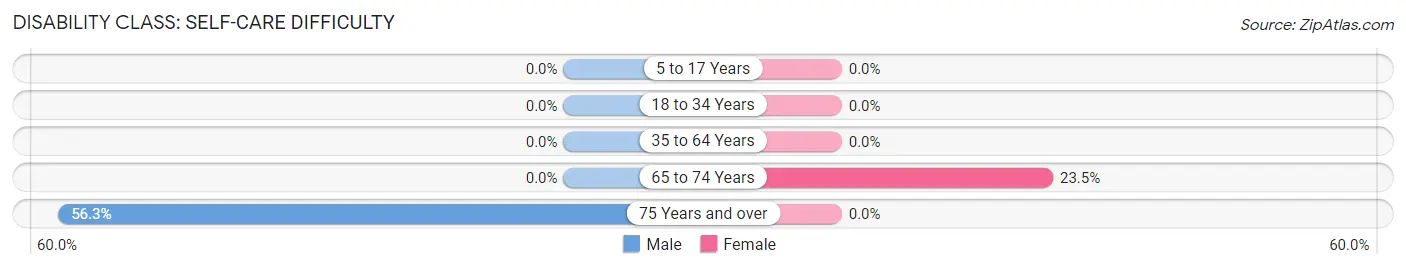
| Age Bracket | Male | Female |
| 5 to 17 Years | 0 (0.0%) | 0 (0.0%) |
| 18 to 34 Years | 0 (0.0%) | 0 (0.0%) |
| 35 to 64 Years | 0 (0.0%) | 0 (0.0%) |
| 65 to 74 Years | 0 (0.0%) | 4 (23.5%) |
| 75 Years and over | 9 (56.2%) | 0 (0.0%) |
Technology Access in Shirleysburg borough
Computing Device Access in Shirleysburg borough
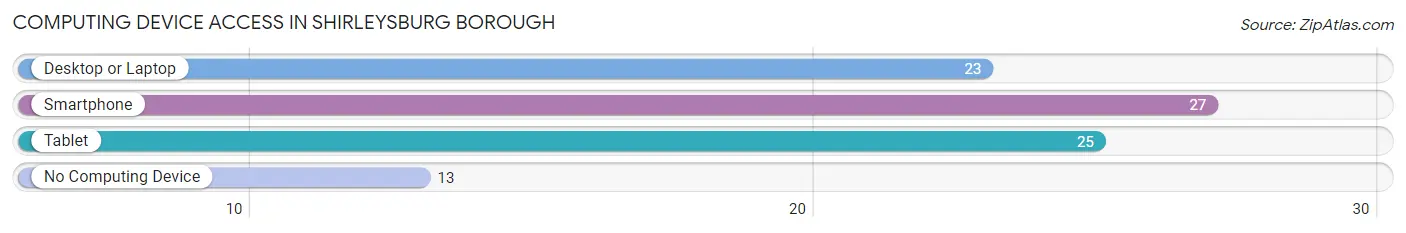
| Device Type | # Households | % Households |
| Desktop or Laptop | 23 | 50.0% |
| Smartphone | 27 | 58.7% |
| Tablet | 25 | 54.3% |
| No Computing Device | 13 | 28.3% |
| Total | 46 | 100.0% |
Internet Access in Shirleysburg borough
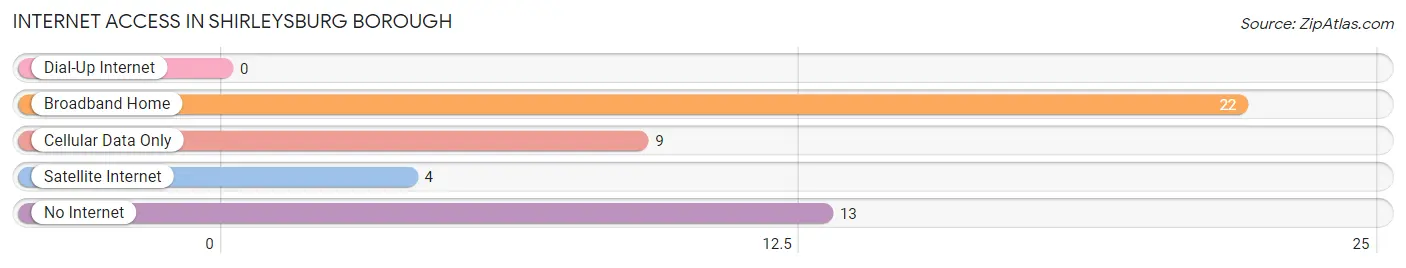
| Internet Type | # Households | % Households |
| Dial-Up Internet | 0 | 0.0% |
| Broadband Home | 22 | 47.8% |
| Cellular Data Only | 9 | 19.6% |
| Satellite Internet | 4 | 8.7% |
| No Internet | 13 | 28.3% |
| Total | 46 | 100.0% |
Shirleysburg borough Summary
Shirleysburg Borough is a small borough located in Huntingdon County, Pennsylvania. It is situated in the foothills of the Allegheny Mountains and is part of the Huntingdon Valley. The borough has a population of approximately 500 people and covers an area of 0.3 square miles.
History
Shirleysburg was founded in 1817 by John Shirley, a local landowner. The borough was named after him and was incorporated in 1845. The town was originally a farming community and was known for its production of apples, peaches, and other fruits. In the late 19th century, the town began to grow and develop as a commercial center. The town was home to several businesses, including a hotel, a general store, a blacksmith shop, and a sawmill.
In the early 20th century, the town began to decline as the local economy shifted away from agriculture and towards industry. The town was home to several factories, including a paper mill, a canning factory, and a furniture factory. However, these factories eventually closed and the town's population began to decline.
Geography
Shirleysburg is located in the foothills of the Allegheny Mountains in Huntingdon County, Pennsylvania. The borough is situated along the Juniata River and is surrounded by several small towns and villages. The borough covers an area of 0.3 square miles and has a population of approximately 500 people.
The borough is located in a rural area and is surrounded by rolling hills and forests. The climate is temperate and the average annual temperature is around 50 degrees Fahrenheit. The area receives an average of 40 inches of precipitation per year.
Economy
The economy of Shirleysburg is largely based on agriculture and tourism. The town is home to several farms that produce a variety of crops, including apples, peaches, and other fruits. The town is also home to several small businesses, including restaurants, shops, and a bed and breakfast.
The town is also a popular tourist destination. The town is home to several historic sites, including the Shirleysburg Historic District, which is listed on the National Register of Historic Places. The town is also home to several parks and recreational areas, including the Shirleysburg Nature Park.
Demographics
As of the 2010 census, the population of Shirleysburg was 498 people. The racial makeup of the borough was 97.2% White, 0.6% African American, 0.2% Native American, 0.2% Asian, 0.2% from other races, and 1.8% from two or more races. The median household income was $37,500 and the median family income was $45,000. The per capita income was $18,000.
Conclusion
Shirleysburg is a small borough located in Huntingdon County, Pennsylvania. It is situated in the foothills of the Allegheny Mountains and is part of the Huntingdon Valley. The borough has a population of approximately 500 people and covers an area of 0.3 square miles. The economy of Shirleysburg is largely based on agriculture and tourism. The town is home to several farms that produce a variety of crops, including apples, peaches, and other fruits. The town is also home to several small businesses, including restaurants, shops, and a bed and breakfast. As of the 2010 census, the population of Shirleysburg was 498 people. The racial makeup of the borough was 97.2% White, 0.6% African American, 0.2% Native American, 0.2% Asian, 0.2% from other races, and 1.8% from two or more races. The median household income was $37,500 and the median family income was $45,000. The per capita income was $18,000.
Common Questions
What is Per Capita Income in Shirleysburg borough?
Per Capita income in Shirleysburg borough is $23,392.
What is the Median Family Income in Shirleysburg borough?
Median Family Income in Shirleysburg borough is $61,750.
What is the Median Household income in Shirleysburg borough?
Median Household Income in Shirleysburg borough is $61,000.
What is Inequality or Gini Index in Shirleysburg borough?
Inequality or Gini Index in Shirleysburg borough is 0.37.
What is the Total Population of Shirleysburg borough?
Total Population of Shirleysburg borough is 153.
What is the Total Male Population of Shirleysburg borough?
Total Male Population of Shirleysburg borough is 87.
What is the Total Female Population of Shirleysburg borough?
Total Female Population of Shirleysburg borough is 66.
What is the Ratio of Males per 100 Females in Shirleysburg borough?
There are 131.82 Males per 100 Females in Shirleysburg borough.
What is the Ratio of Females per 100 Males in Shirleysburg borough?
There are 75.86 Females per 100 Males in Shirleysburg borough.
What is the Median Population Age in Shirleysburg borough?
Median Population Age in Shirleysburg borough is 39.6 Years.
What is the Average Family Size in Shirleysburg borough
Average Family Size in Shirleysburg borough is 3.7 People.
What is the Average Household Size in Shirleysburg borough
Average Household Size in Shirleysburg borough is 3.3 People.
How Large is the Labor Force in Shirleysburg borough?
There are 63 People in the Labor Forcein in Shirleysburg borough.
What is the Percentage of People in the Labor Force in Shirleysburg borough?
49.6% of People are in the Labor Force in Shirleysburg borough.
What is the Unemployment Rate in Shirleysburg borough?
Unemployment Rate in Shirleysburg borough is 9.5%.