Zip Codes with the Highest Percentage of Population Employed in Installation, Maintenance & Repair in New Castle, PA
RELATED REPORTS & OPTIONS
Installation, Maintenance & Repair
New Castle
Compare Zip Codes
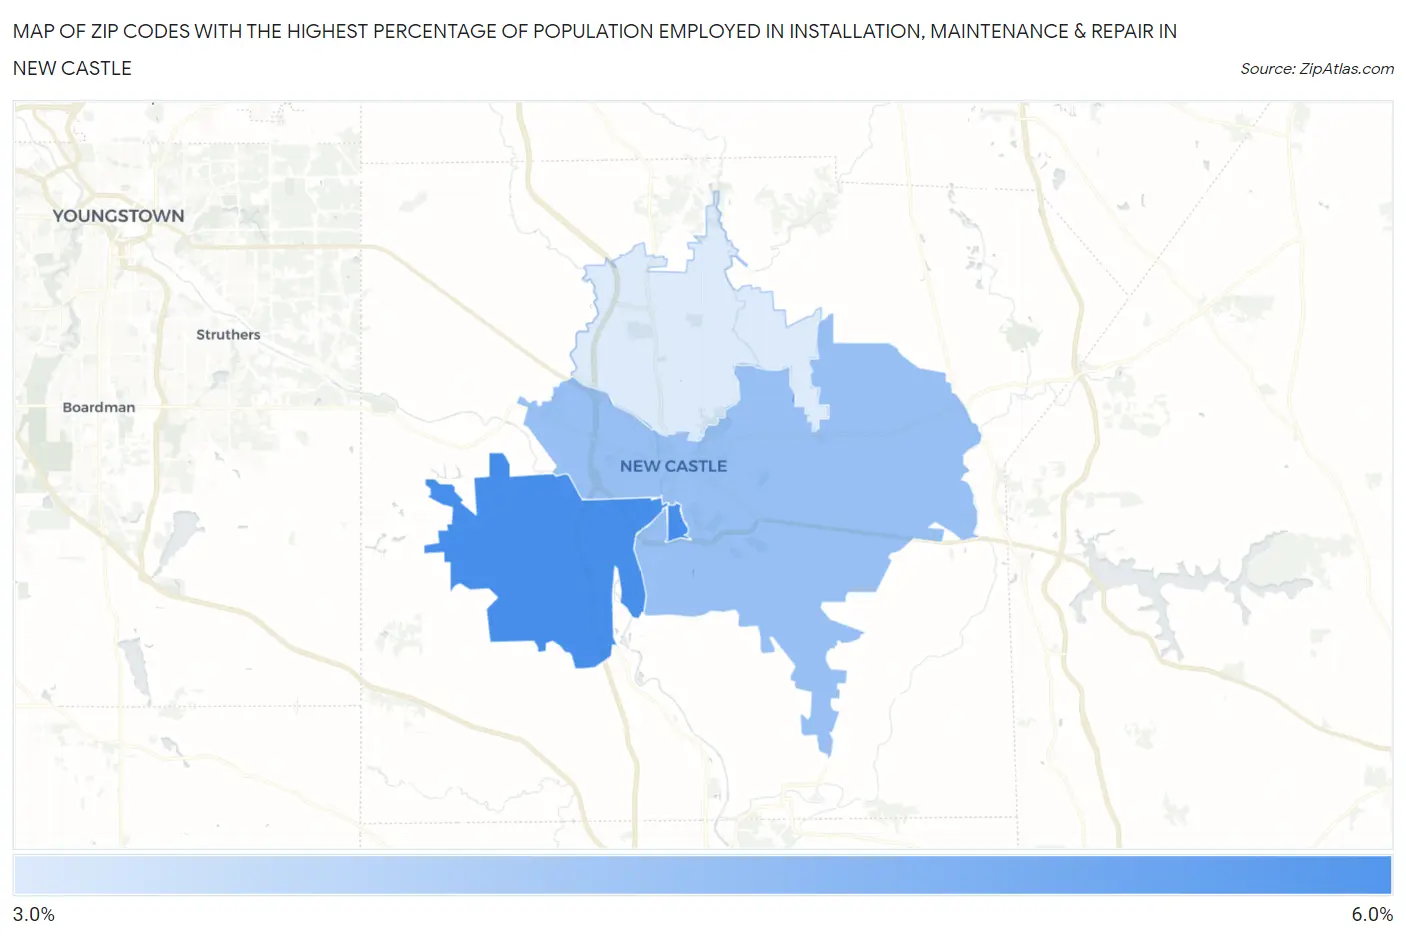
Map of Zip Codes with the Highest Percentage of Population Employed in Installation, Maintenance & Repair in New Castle
3.4%
5.9%
Zip Codes with the Highest Percentage of Population Employed in Installation, Maintenance & Repair in New Castle, PA
| Zip Code | % Employed | vs State | vs National | |
| 1. | 16102 | 5.9% | 3.1%(+2.85)#355 | 3.1%(+2.87)#6,273 |
| 2. | 16101 | 4.5% | 3.1%(+1.44)#601 | 3.1%(+1.46)#10,323 |
| 3. | 16105 | 3.4% | 3.1%(+0.271)#915 | 3.1%(+0.295)#15,272 |
1
Common Questions
What are the Top Zip Codes with the Highest Percentage of Population Employed in Installation, Maintenance & Repair in New Castle, PA?
Top Zip Codes with the Highest Percentage of Population Employed in Installation, Maintenance & Repair in New Castle, PA are:
What zip code has the Highest Percentage of Population Employed in Installation, Maintenance & Repair in New Castle, PA?
16102 has the Highest Percentage of Population Employed in Installation, Maintenance & Repair in New Castle, PA with 5.9%.
What is the Percentage of Population Employed in Installation, Maintenance & Repair in New Castle, PA?
Percentage of Population Employed in Installation, Maintenance & Repair in New Castle is 4.6%.
What is the Percentage of Population Employed in Installation, Maintenance & Repair in Pennsylvania?
Percentage of Population Employed in Installation, Maintenance & Repair in Pennsylvania is 3.1%.
What is the Percentage of Population Employed in Installation, Maintenance & Repair in the United States?
Percentage of Population Employed in Installation, Maintenance & Repair in the United States is 3.1%.