The Hideout, PA Map & Demographics
The Hideout Map
The Hideout Overview
$34,791
PER CAPITA INCOME
$75,399
AVG FAMILY INCOME
$52,854
AVG HOUSEHOLD INCOME
0.42
INEQUALITY / GINI INDEX
2,069
TOTAL POPULATION
1,016
MALE POPULATION
1,053
FEMALE POPULATION
96.49
MALES / 100 FEMALES
103.64
FEMALES / 100 MALES
61.5
MEDIAN AGE
2.6
AVG FAMILY SIZE
2.1
AVG HOUSEHOLD SIZE
603
LABOR FORCE [ PEOPLE ]
30.6%
PERCENT IN LABOR FORCE
6.8%
UNEMPLOYMENT RATE
Income in The Hideout
Income Overview in The Hideout
Per Capita Income in The Hideout is $34,791, while median incomes of families and households are $75,399 and $52,854 respectively.
| Characteristic | Number | Measure |
| Per Capita Income | 2,069 | $34,791 |
| Median Family Income | 642 | $75,399 |
| Mean Family Income | 642 | $74,460 |
| Median Household Income | 973 | $52,854 |
| Mean Household Income | 973 | $66,089 |
| Income Deficit | 642 | $0 |
| Wage / Income Gap (%) | 2,069 | 0.00% |
| Wage / Income Gap ($) | 2,069 | 100.00¢ per $1 |
| Gini / Inequality Index | 2,069 | 0.42 |
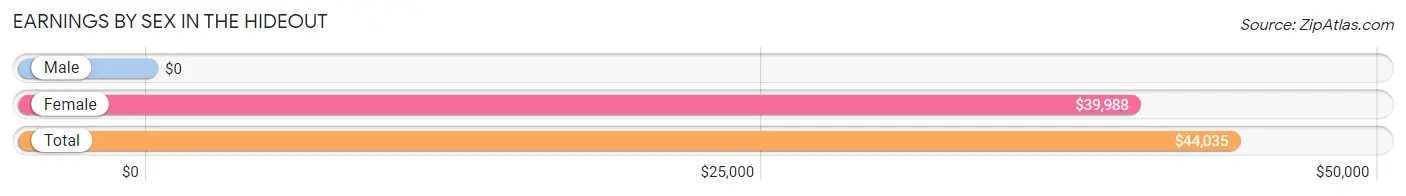
Earnings by Sex in The Hideout
| Sex | Number | Average Earnings |
| Male | 340 (48.2%) | $0 |
| Female | 365 (51.8%) | $39,988 |
| Total | 705 (100.0%) | $44,035 |
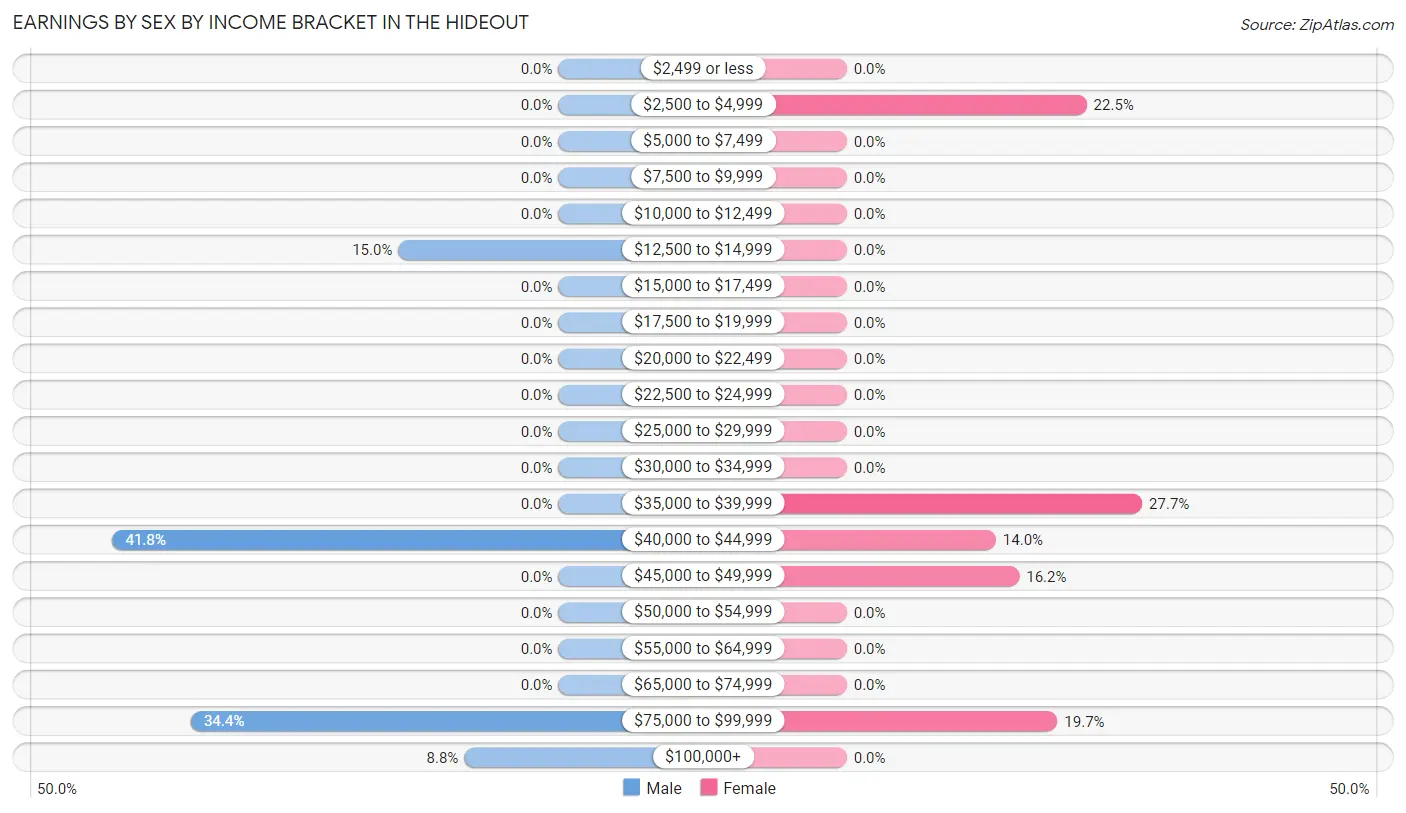
Earnings by Sex by Income Bracket in The Hideout
The most common earnings brackets in The Hideout are $40,000 to $44,999 for men (142 | 41.8%) and $35,000 to $39,999 for women (101 | 27.7%).
| Income | Male | Female |
| $2,499 or less | 0 (0.0%) | 0 (0.0%) |
| $2,500 to $4,999 | 0 (0.0%) | 82 (22.5%) |
| $5,000 to $7,499 | 0 (0.0%) | 0 (0.0%) |
| $7,500 to $9,999 | 0 (0.0%) | 0 (0.0%) |
| $10,000 to $12,499 | 0 (0.0%) | 0 (0.0%) |
| $12,500 to $14,999 | 51 (15.0%) | 0 (0.0%) |
| $15,000 to $17,499 | 0 (0.0%) | 0 (0.0%) |
| $17,500 to $19,999 | 0 (0.0%) | 0 (0.0%) |
| $20,000 to $22,499 | 0 (0.0%) | 0 (0.0%) |
| $22,500 to $24,999 | 0 (0.0%) | 0 (0.0%) |
| $25,000 to $29,999 | 0 (0.0%) | 0 (0.0%) |
| $30,000 to $34,999 | 0 (0.0%) | 0 (0.0%) |
| $35,000 to $39,999 | 0 (0.0%) | 101 (27.7%) |
| $40,000 to $44,999 | 142 (41.8%) | 51 (14.0%) |
| $45,000 to $49,999 | 0 (0.0%) | 59 (16.2%) |
| $50,000 to $54,999 | 0 (0.0%) | 0 (0.0%) |
| $55,000 to $64,999 | 0 (0.0%) | 0 (0.0%) |
| $65,000 to $74,999 | 0 (0.0%) | 0 (0.0%) |
| $75,000 to $99,999 | 117 (34.4%) | 72 (19.7%) |
| $100,000+ | 30 (8.8%) | 0 (0.0%) |
| Total | 340 (100.0%) | 365 (100.0%) |
Earnings by Sex by Educational Attainment in The Hideout
| Educational Attainment | Male Income | Female Income |
| Less than High School | - | - |
| High School Diploma | - | - |
| College or Associate's Degree | - | - |
| Bachelor's Degree | - | - |
| Graduate Degree | - | - |
| Total | - | - |
Family Income in The Hideout
Family Income Brackets in The Hideout
According to the The Hideout family income data, there are 180 families falling into the $75,000 to $99,999 income range, which is the most common income bracket and makes up 28.0% of all families.
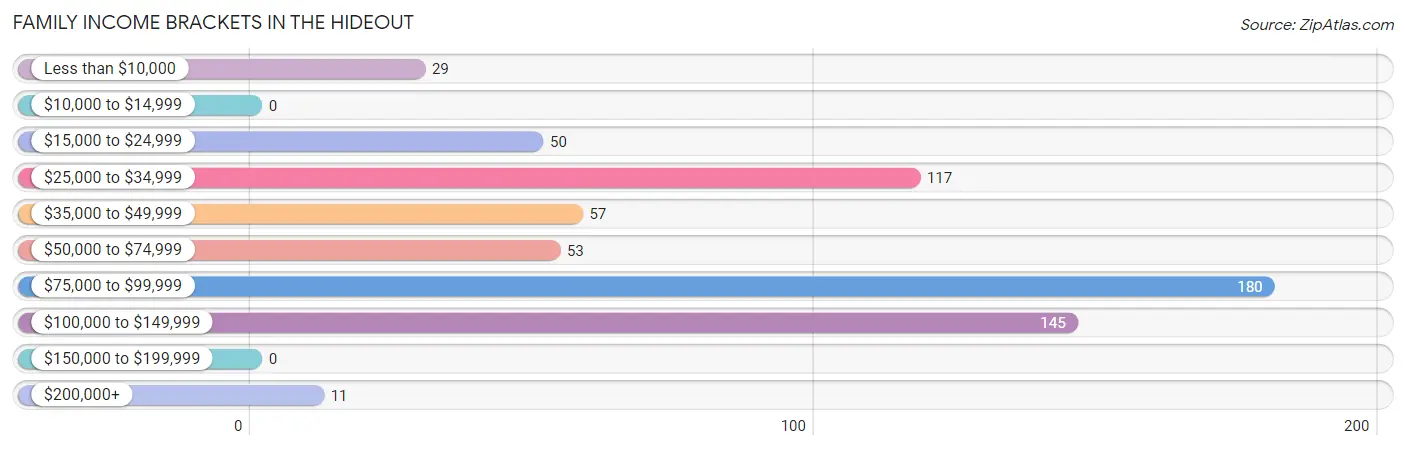
| Income Bracket | # Families | % Families |
| Less than $10,000 | 29 | 4.5% |
| $10,000 to $14,999 | 0 | 0.0% |
| $15,000 to $24,999 | 50 | 7.8% |
| $25,000 to $34,999 | 117 | 18.2% |
| $35,000 to $49,999 | 57 | 8.9% |
| $50,000 to $74,999 | 53 | 8.3% |
| $75,000 to $99,999 | 180 | 28.0% |
| $100,000 to $149,999 | 145 | 22.6% |
| $150,000 to $199,999 | 0 | 0.0% |
| $200,000+ | 11 | 1.7% |
Family Income by Famaliy Size in The Hideout
2-person families (459 | 71.5%) account for the highest median family income in The Hideout with $75,891 per family, while 2-person families (459 | 71.5%) have the highest median income of $37,946 per family member.
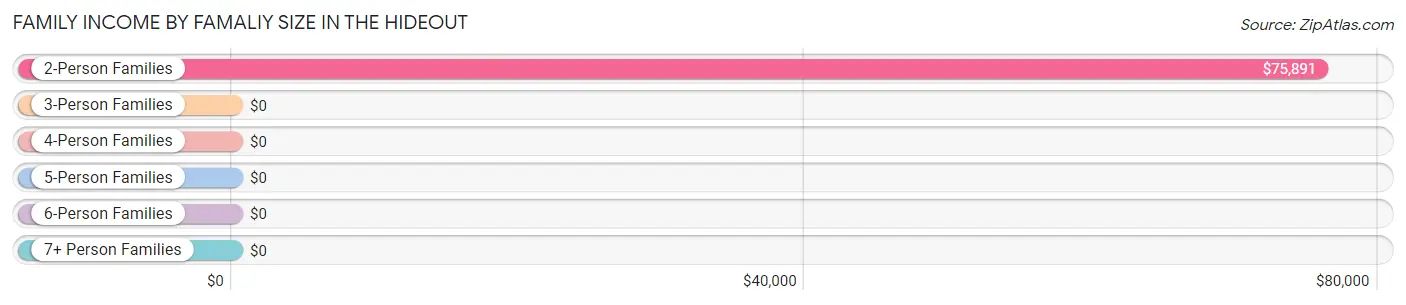
| Income Bracket | # Families | Median Income |
| 2-Person Families | 459 (71.5%) | $75,891 |
| 3-Person Families | 73 (11.4%) | $0 |
| 4-Person Families | 53 (8.3%) | $0 |
| 5-Person Families | 57 (8.9%) | $0 |
| 6-Person Families | 0 (0.0%) | $0 |
| 7+ Person Families | 0 (0.0%) | $0 |
| Total | 642 (100.0%) | $75,399 |
Family Income by Number of Earners in The Hideout
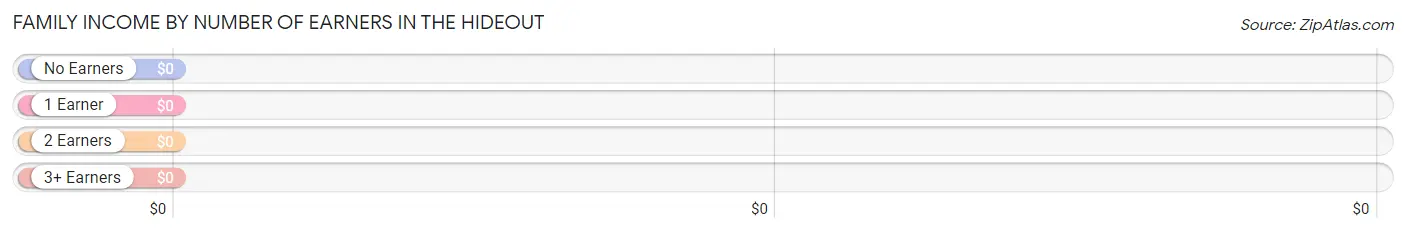
| Number of Earners | # Families | Median Income |
| No Earners | 336 (52.3%) | $0 |
| 1 Earner | 124 (19.3%) | $0 |
| 2 Earners | 182 (28.3%) | $0 |
| 3+ Earners | 0 (0.0%) | $0 |
| Total | 642 (100.0%) | $75,399 |
Household Income in The Hideout
Household Income Brackets in The Hideout
With 255 households falling in the category, the $75,000 to $99,999 income range is the most frequent in The Hideout, accounting for 26.2% of all households. In contrast, only 11 households (1.1%) fall into the $200,000+ income bracket, making it the least populous group.
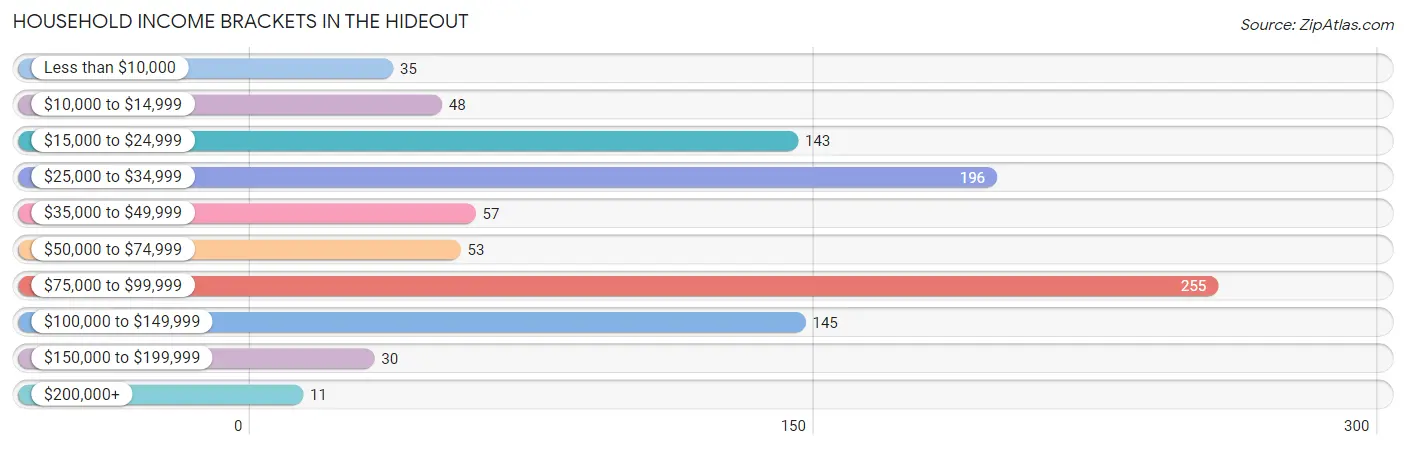
| Income Bracket | # Households | % Households |
| Less than $10,000 | 35 | 3.6% |
| $10,000 to $14,999 | 48 | 4.9% |
| $15,000 to $24,999 | 143 | 14.7% |
| $25,000 to $34,999 | 196 | 20.1% |
| $35,000 to $49,999 | 57 | 5.9% |
| $50,000 to $74,999 | 53 | 5.4% |
| $75,000 to $99,999 | 255 | 26.2% |
| $100,000 to $149,999 | 145 | 14.9% |
| $150,000 to $199,999 | 30 | 3.1% |
| $200,000+ | 11 | 1.1% |
Household Income by Householder Age in The Hideout
| Income Bracket | # Households | Median Income |
| 15 to 24 Years | 0 (0.0%) | $0 |
| 25 to 44 Years | 83 (8.5%) | $0 |
| 45 to 64 Years | 349 (35.9%) | $0 |
| 65+ Years | 541 (55.6%) | $0 |
| Total | 973 (100.0%) | $52,854 |
Poverty in The Hideout
Income Below Poverty by Sex and Age in The Hideout
With 10.5% poverty level for males and 22.9% for females among the residents of The Hideout, 6 to 11 year old males and 6 to 11 year old females are the most vulnerable to poverty, with 21 males (100.0%) and 76 females (100.0%) in their respective age groups living below the poverty level.
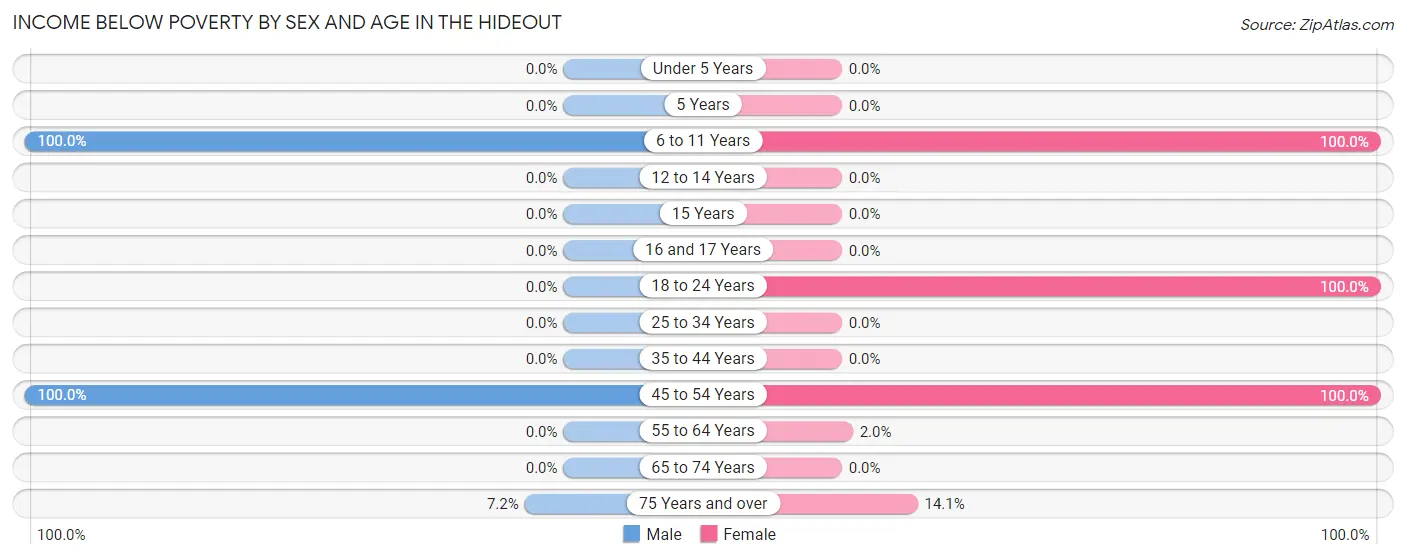
| Age Bracket | Male | Female |
| Under 5 Years | 0 (0.0%) | 0 (0.0%) |
| 5 Years | 0 (0.0%) | 0 (0.0%) |
| 6 to 11 Years | 21 (100.0%) | 76 (100.0%) |
| 12 to 14 Years | 0 (0.0%) | 0 (0.0%) |
| 15 Years | 0 (0.0%) | 0 (0.0%) |
| 16 and 17 Years | 0 (0.0%) | 0 (0.0%) |
| 18 to 24 Years | 0 (0.0%) | 82 (100.0%) |
| 25 to 34 Years | 0 (0.0%) | 0 (0.0%) |
| 35 to 44 Years | 0 (0.0%) | 0 (0.0%) |
| 45 to 54 Years | 57 (100.0%) | 50 (100.0%) |
| 55 to 64 Years | 0 (0.0%) | 6 (2.0%) |
| 65 to 74 Years | 0 (0.0%) | 0 (0.0%) |
| 75 Years and over | 29 (7.2%) | 27 (14.1%) |
| Total | 107 (10.5%) | 241 (22.9%) |
Income Above Poverty by Sex and Age in The Hideout
According to the poverty statistics in The Hideout, males aged 25 to 34 years and females aged 25 to 34 years are the age groups that are most secure financially, with 100.0% of males and 100.0% of females in these age groups living above the poverty line.
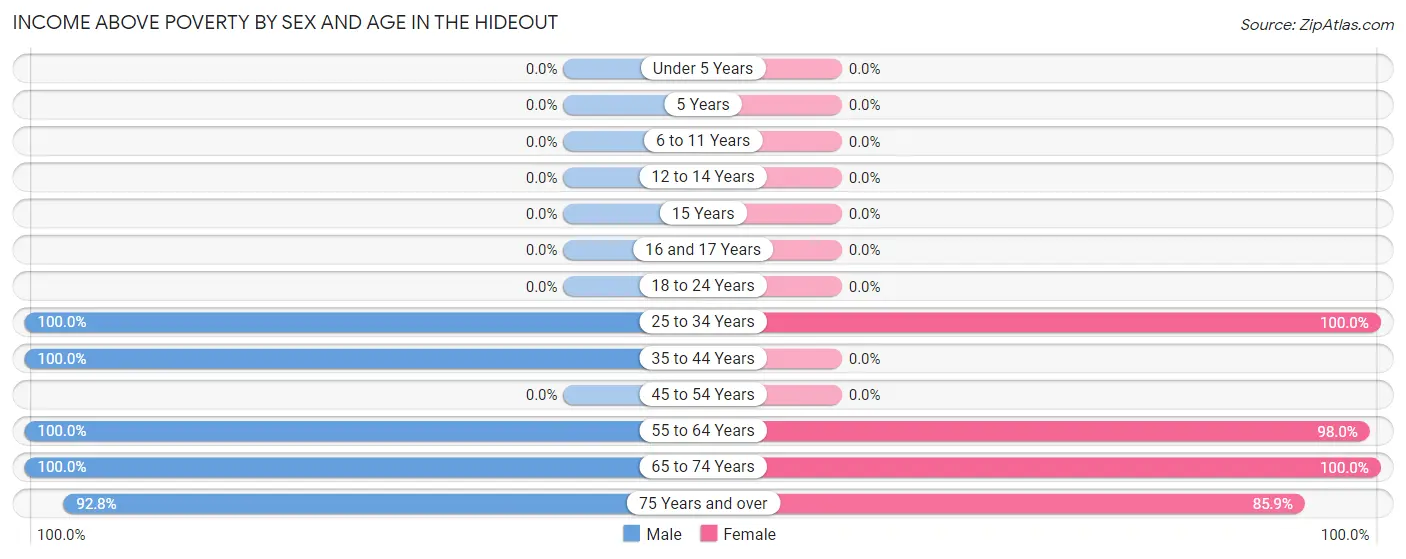
| Age Bracket | Male | Female |
| Under 5 Years | 0 (0.0%) | 0 (0.0%) |
| 5 Years | 0 (0.0%) | 0 (0.0%) |
| 6 to 11 Years | 0 (0.0%) | 0 (0.0%) |
| 12 to 14 Years | 0 (0.0%) | 0 (0.0%) |
| 15 Years | 0 (0.0%) | 0 (0.0%) |
| 16 and 17 Years | 0 (0.0%) | 0 (0.0%) |
| 18 to 24 Years | 0 (0.0%) | 0 (0.0%) |
| 25 to 34 Years | 117 (100.0%) | 154 (100.0%) |
| 35 to 44 Years | 81 (100.0%) | 0 (0.0%) |
| 45 to 54 Years | 0 (0.0%) | 0 (0.0%) |
| 55 to 64 Years | 254 (100.0%) | 290 (98.0%) |
| 65 to 74 Years | 83 (100.0%) | 203 (100.0%) |
| 75 Years and over | 374 (92.8%) | 165 (85.9%) |
| Total | 909 (89.5%) | 812 (77.1%) |
Income Below Poverty Among Married-Couple Families in The Hideout
The poverty statistics for married-couple families in The Hideout show that 5.4% or 29 of the total 535 families live below the poverty line. Families with no children have the highest poverty rate of 5.4%, comprising of 29 families. On the other hand, families with no children have the lowest poverty rate of 5.4%, which includes 29 families.
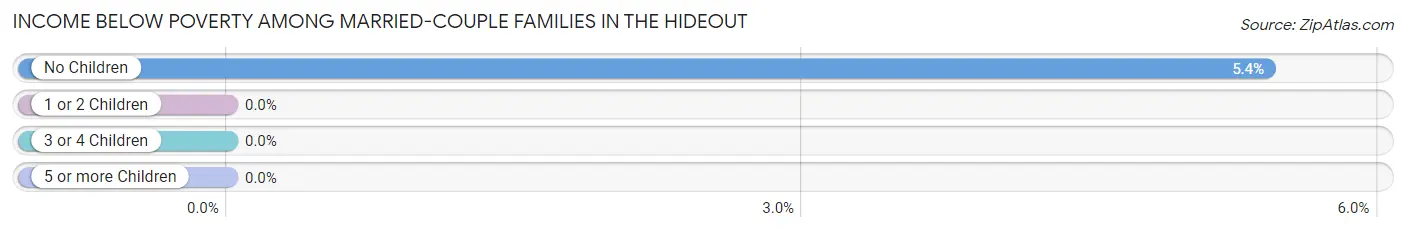
| Children | Above Poverty | Below Poverty |
| No Children | 506 (94.6%) | 29 (5.4%) |
| 1 or 2 Children | 0 (0.0%) | 0 (0.0%) |
| 3 or 4 Children | 0 (0.0%) | 0 (0.0%) |
| 5 or more Children | 0 (0.0%) | 0 (0.0%) |
| Total | 506 (94.6%) | 29 (5.4%) |
Income Below Poverty Among Single-Parent Households in The Hideout
According to the poverty data in The Hideout, 100.0% or 57 single-father households and 100.0% or 50 single-mother households are living below the poverty line. Among single-father households, those with 1 or 2 children have the highest poverty rate, with 57 households (100.0%) experiencing poverty. Likewise, among single-mother households, those with 1 or 2 children have the highest poverty rate, with 50 households (100.0%) falling below the poverty line.
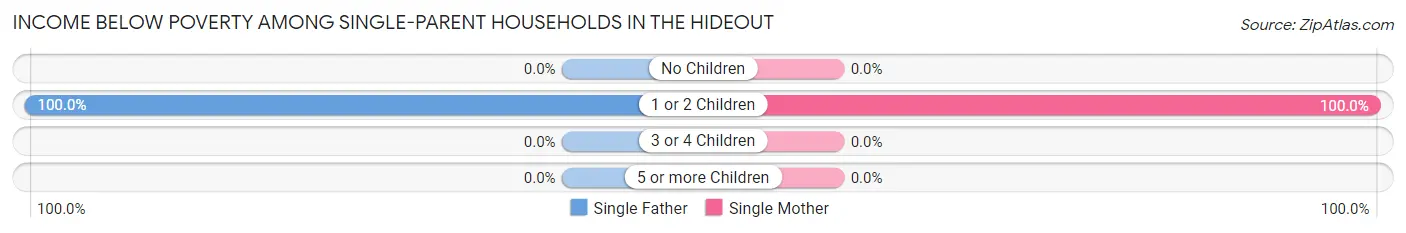
| Children | Single Father | Single Mother |
| No Children | 0 (0.0%) | 0 (0.0%) |
| 1 or 2 Children | 57 (100.0%) | 50 (100.0%) |
| 3 or 4 Children | 0 (0.0%) | 0 (0.0%) |
| 5 or more Children | 0 (0.0%) | 0 (0.0%) |
| Total | 57 (100.0%) | 50 (100.0%) |
Income Below Poverty Among Married-Couple vs Single-Parent Households in The Hideout
The poverty data for The Hideout shows that 29 of the married-couple family households (5.4%) and 107 of the single-parent households (100.0%) are living below the poverty level. Within the married-couple family households, those with no children have the highest poverty rate, with 29 households (5.4%) falling below the poverty line. Among the single-parent households, those with 1 or 2 children have the highest poverty rate, with 107 household (100.0%) living below poverty.
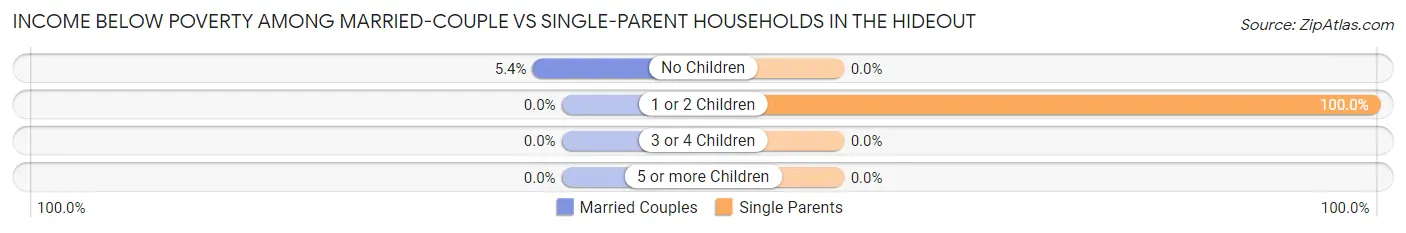
| Children | Married-Couple Families | Single-Parent Households |
| No Children | 29 (5.4%) | 0 (0.0%) |
| 1 or 2 Children | 0 (0.0%) | 107 (100.0%) |
| 3 or 4 Children | 0 (0.0%) | 0 (0.0%) |
| 5 or more Children | 0 (0.0%) | 0 (0.0%) |
| Total | 29 (5.4%) | 107 (100.0%) |
Race in The Hideout
The most populous races in The Hideout are White / Caucasian (2,026 | 97.9%), and Two or more Races (43 | 2.1%).
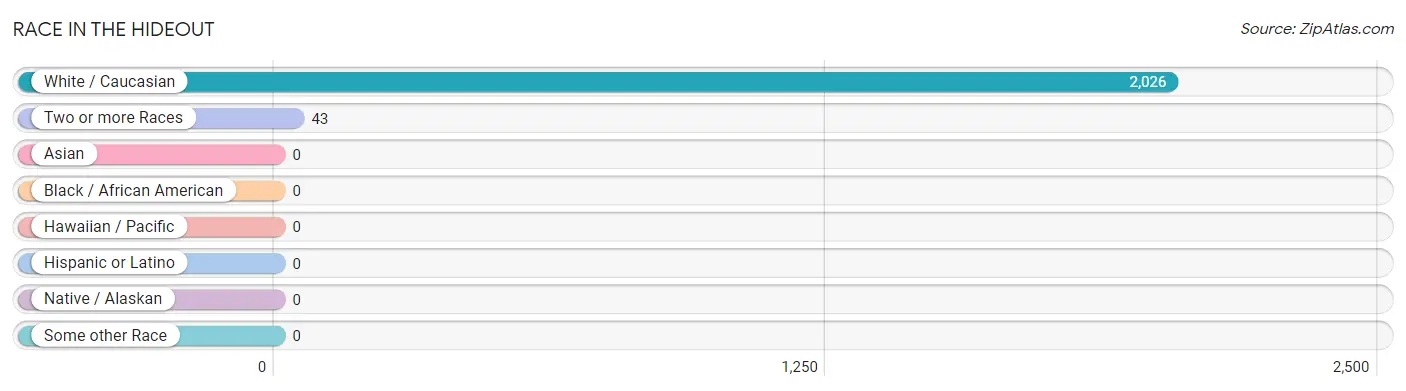
| Race | # Population | % Population |
| Asian | 0 | 0.0% |
| Black / African American | 0 | 0.0% |
| Hawaiian / Pacific | 0 | 0.0% |
| Hispanic or Latino | 0 | 0.0% |
| Native / Alaskan | 0 | 0.0% |
| White / Caucasian | 2,026 | 97.9% |
| Two or more Races | 43 | 2.1% |
| Some other Race | 0 | 0.0% |
| Total | 2,069 | 100.0% |
Ancestry in The Hideout
The most populous ancestries reported in The Hideout are Italian (620 | 30.0%), Irish (405 | 19.6%), American (403 | 19.5%), German (239 | 11.6%), and English (185 | 8.9%), together accounting for 89.5% of all The Hideout residents.
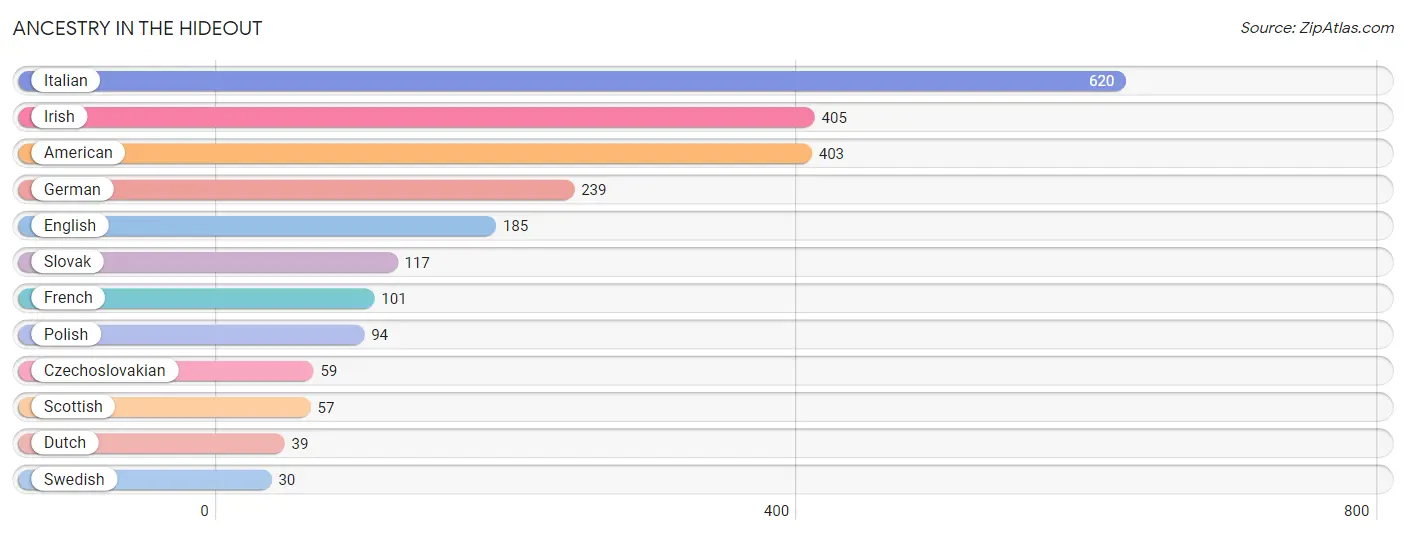
| Ancestry | # Population | % Population |
| American | 403 | 19.5% |
| Czechoslovakian | 59 | 2.9% |
| Dutch | 39 | 1.9% |
| English | 185 | 8.9% |
| French | 101 | 4.9% |
| German | 239 | 11.6% |
| Irish | 405 | 19.6% |
| Italian | 620 | 30.0% |
| Polish | 94 | 4.5% |
| Scottish | 57 | 2.8% |
| Slovak | 117 | 5.7% |
| Swedish | 30 | 1.5% | View All 12 Rows |
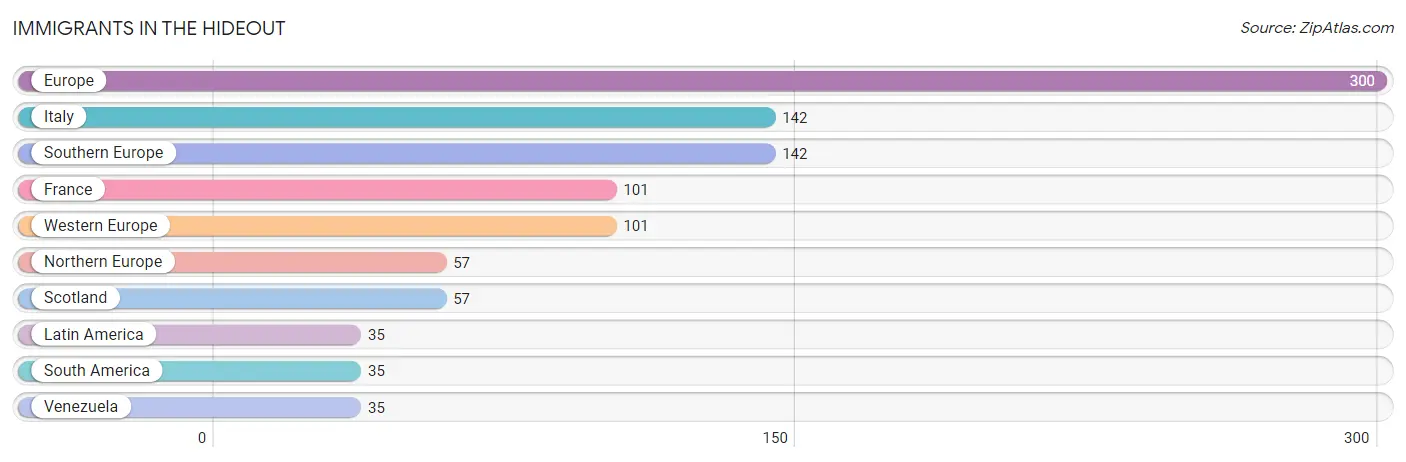
Immigrants in The Hideout
The most numerous immigrant groups reported in The Hideout came from Europe (300 | 14.5%), Italy (142 | 6.9%), Southern Europe (142 | 6.9%), France (101 | 4.9%), and Western Europe (101 | 4.9%), together accounting for 38.0% of all The Hideout residents.
| Immigration Origin | # Population | % Population |
| Europe | 300 | 14.5% |
| France | 101 | 4.9% |
| Italy | 142 | 6.9% |
| Latin America | 35 | 1.7% |
| Northern Europe | 57 | 2.8% |
| Scotland | 57 | 2.8% |
| South America | 35 | 1.7% |
| Southern Europe | 142 | 6.9% |
| Venezuela | 35 | 1.7% |
| Western Europe | 101 | 4.9% | View All 10 Rows |
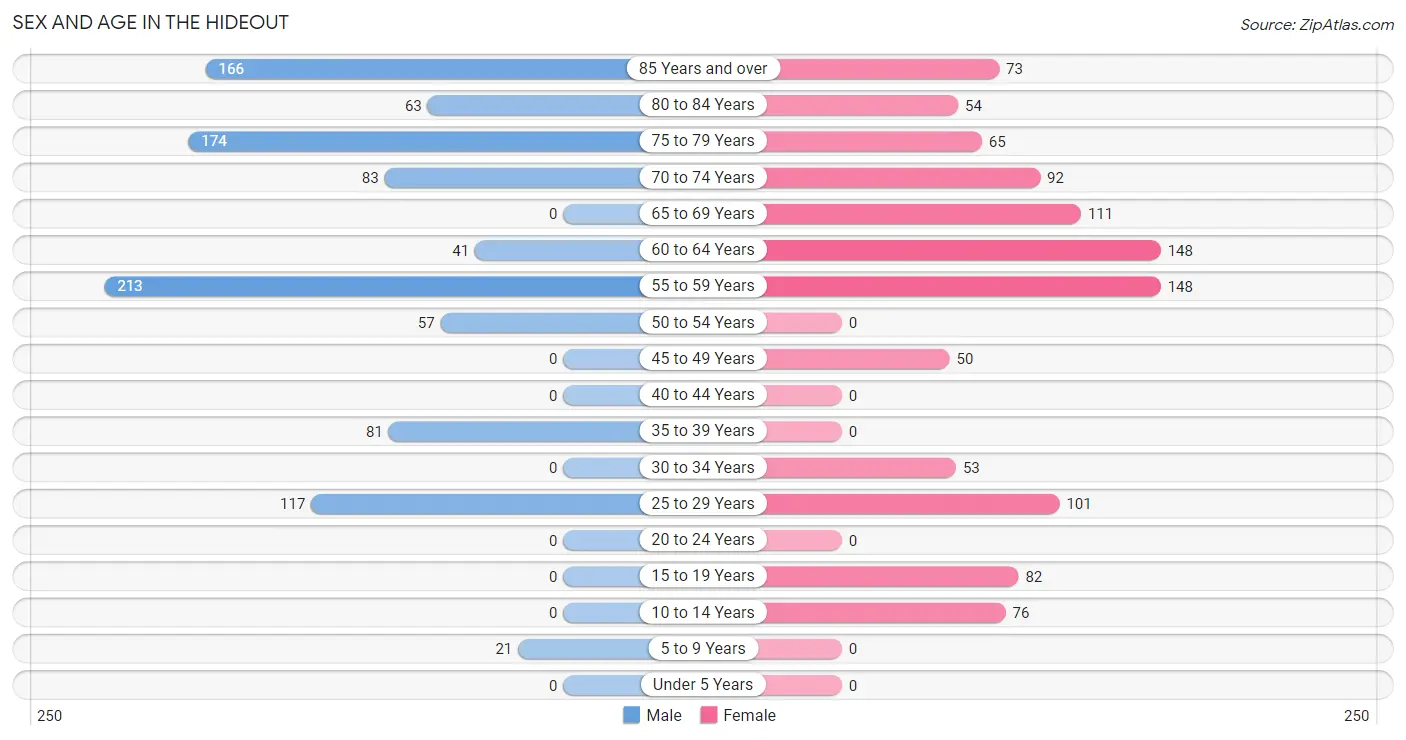
Sex and Age in The Hideout
Sex and Age in The Hideout
The most populous age groups in The Hideout are 55 to 59 Years (213 | 21.0%) for men and 55 to 59 Years (148 | 14.1%) for women.
| Age Bracket | Male | Female |
| Under 5 Years | 0 (0.0%) | 0 (0.0%) |
| 5 to 9 Years | 21 (2.1%) | 0 (0.0%) |
| 10 to 14 Years | 0 (0.0%) | 76 (7.2%) |
| 15 to 19 Years | 0 (0.0%) | 82 (7.8%) |
| 20 to 24 Years | 0 (0.0%) | 0 (0.0%) |
| 25 to 29 Years | 117 (11.5%) | 101 (9.6%) |
| 30 to 34 Years | 0 (0.0%) | 53 (5.0%) |
| 35 to 39 Years | 81 (8.0%) | 0 (0.0%) |
| 40 to 44 Years | 0 (0.0%) | 0 (0.0%) |
| 45 to 49 Years | 0 (0.0%) | 50 (4.8%) |
| 50 to 54 Years | 57 (5.6%) | 0 (0.0%) |
| 55 to 59 Years | 213 (21.0%) | 148 (14.1%) |
| 60 to 64 Years | 41 (4.0%) | 148 (14.1%) |
| 65 to 69 Years | 0 (0.0%) | 111 (10.5%) |
| 70 to 74 Years | 83 (8.2%) | 92 (8.7%) |
| 75 to 79 Years | 174 (17.1%) | 65 (6.2%) |
| 80 to 84 Years | 63 (6.2%) | 54 (5.1%) |
| 85 Years and over | 166 (16.3%) | 73 (6.9%) |
| Total | 1,016 (100.0%) | 1,053 (100.0%) |
Families and Households in The Hideout
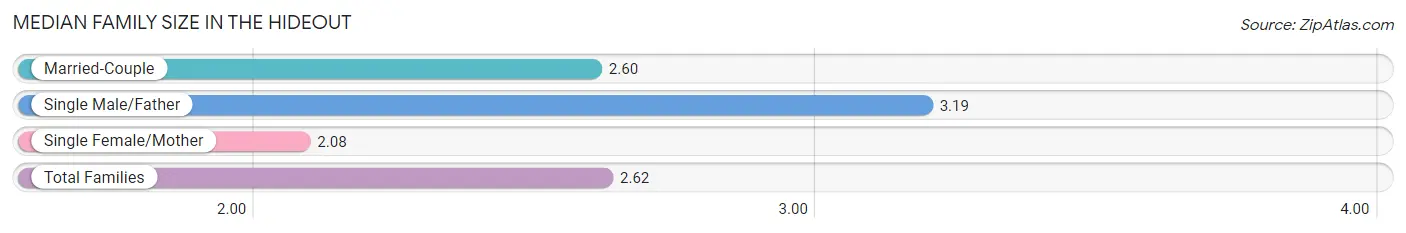
Median Family Size in The Hideout
The median family size in The Hideout is 2.62 persons per family, with single male/father families (57 | 8.9%) accounting for the largest median family size of 3.19 persons per family. On the other hand, single female/mother families (50 | 7.8%) represent the smallest median family size with 2.08 persons per family.
| Family Type | # Families | Family Size |
| Married-Couple | 535 (83.3%) | 2.60 |
| Single Male/Father | 57 (8.9%) | 3.19 |
| Single Female/Mother | 50 (7.8%) | 2.08 |
| Total Families | 642 (100.0%) | 2.62 |
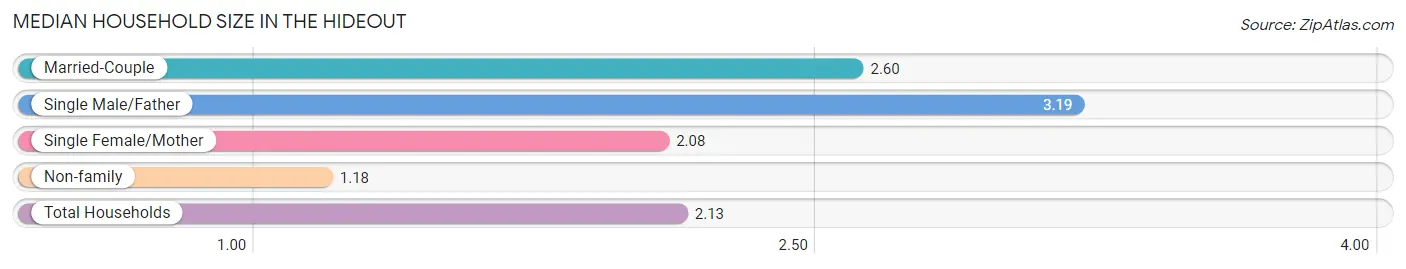
Median Household Size in The Hideout
The median household size in The Hideout is 2.13 persons per household, with single male/father households (57 | 5.9%) accounting for the largest median household size of 3.19 persons per household. non-family households (331 | 34.0%) represent the smallest median household size with 1.18 persons per household.
| Household Type | # Households | Household Size |
| Married-Couple | 535 (55.0%) | 2.60 |
| Single Male/Father | 57 (5.9%) | 3.19 |
| Single Female/Mother | 50 (5.1%) | 2.08 |
| Non-family | 331 (34.0%) | 1.18 |
| Total Households | 973 (100.0%) | 2.13 |
Household Size by Marriage Status in The Hideout
Out of a total of 973 households in The Hideout, 642 (66.0%) are family households, while 331 (34.0%) are nonfamily households. The most numerous type of family households are 2-person households, comprising 459, and the most common type of nonfamily households are 1-person households, comprising 290.
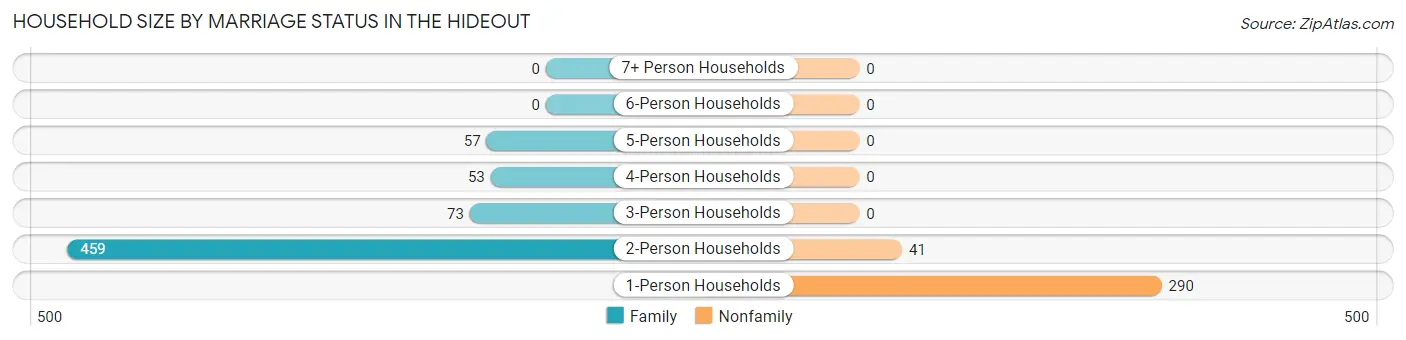
| Household Size | Family Households | Nonfamily Households |
| 1-Person Households | - | 290 (29.8%) |
| 2-Person Households | 459 (47.2%) | 41 (4.2%) |
| 3-Person Households | 73 (7.5%) | 0 (0.0%) |
| 4-Person Households | 53 (5.4%) | 0 (0.0%) |
| 5-Person Households | 57 (5.9%) | 0 (0.0%) |
| 6-Person Households | 0 (0.0%) | 0 (0.0%) |
| 7+ Person Households | 0 (0.0%) | 0 (0.0%) |
| Total | 642 (66.0%) | 331 (34.0%) |
Female Fertility in The Hideout
Fertility by Age in The Hideout
| Age Bracket | Women with Births | Births / 1,000 Women |
| 15 to 19 years | 0 (0.0%) | 0.0 |
| 20 to 34 years | 0 (0.0%) | 0.0 |
| 35 to 50 years | 0 (0.0%) | 0.0 |
| Total | 0 (0.0%) | 0.0 |
Fertility by Age by Marriage Status in The Hideout
| Age Bracket | Married | Unmarried |
| 15 to 19 years | 0 (0.0%) | 0 (0.0%) |
| 20 to 34 years | 0 (0.0%) | 0 (0.0%) |
| 35 to 50 years | 0 (0.0%) | 0 (0.0%) |
| Total | 0 (0.0%) | 0 (0.0%) |
Fertility by Education in The Hideout
| Educational Attainment | Women with Births | Births / 1,000 Women |
| Less than High School | 0 (0.0%) | 0.0 |
| High School Diploma | 0 (0.0%) | 0.0 |
| College or Associate's Degree | 0 (0.0%) | 0.0 |
| Bachelor's Degree | 0 (0.0%) | 0.0 |
| Graduate Degree | 0 (0.0%) | 0.0 |
| Total | 0 (0.0%) | 0.0 |
Fertility by Education by Marriage Status in The Hideout
| Educational Attainment | Married | Unmarried |
| Less than High School | 0 (0.0%) | 0 (0.0%) |
| High School Diploma | 0 (0.0%) | 0 (0.0%) |
| College or Associate's Degree | 0 (0.0%) | 0 (0.0%) |
| Bachelor's Degree | 0 (0.0%) | 0 (0.0%) |
| Graduate Degree | 0 (0.0%) | 0 (0.0%) |
| Total | 0 (0.0%) | 0 (0.0%) |
Employment Characteristics in The Hideout
Employment by Class of Employer in The Hideout
Among the 563 employed individuals in The Hideout, , and private company employees (563 | 100.0%) make up the most common classes of employment.
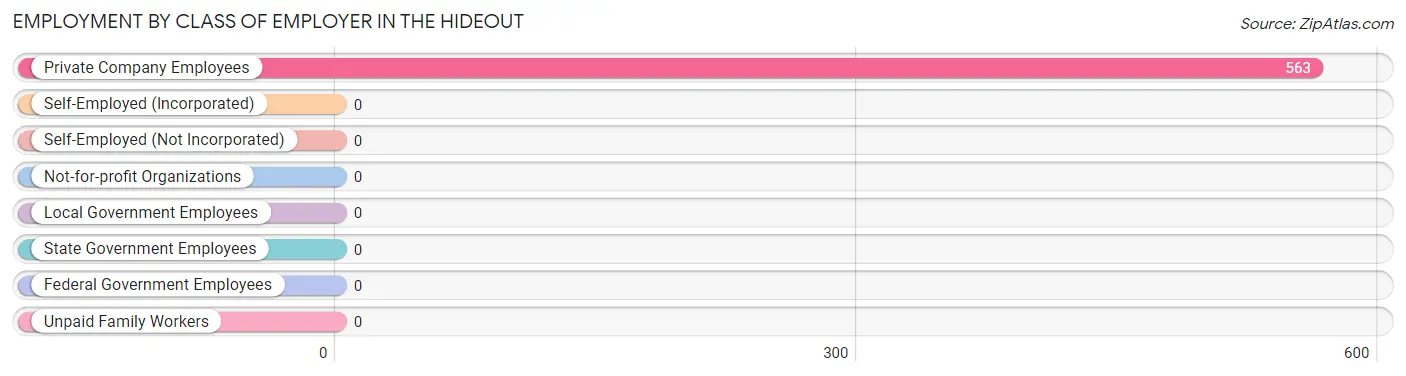
| Employer Class | # Employees | % Employees |
| Private Company Employees | 563 | 100.0% |
| Self-Employed (Incorporated) | 0 | 0.0% |
| Self-Employed (Not Incorporated) | 0 | 0.0% |
| Not-for-profit Organizations | 0 | 0.0% |
| Local Government Employees | 0 | 0.0% |
| State Government Employees | 0 | 0.0% |
| Federal Government Employees | 0 | 0.0% |
| Unpaid Family Workers | 0 | 0.0% |
| Total | 563 | 100.0% |
Employment Status by Age in The Hideout
According to the labor force statistics for The Hideout, out of the total population over 16 years of age (1,972), 30.6% or 603 individuals are in the labor force, with 6.8% or 41 of them unemployed. The age group with the highest labor force participation rate is 16 to 19 years, with 100.0% or 82 individuals in the labor force. Within the labor force, the 16 to 19 years age range has the highest percentage of unemployed individuals, with 50.0% or 41 of them being unemployed.
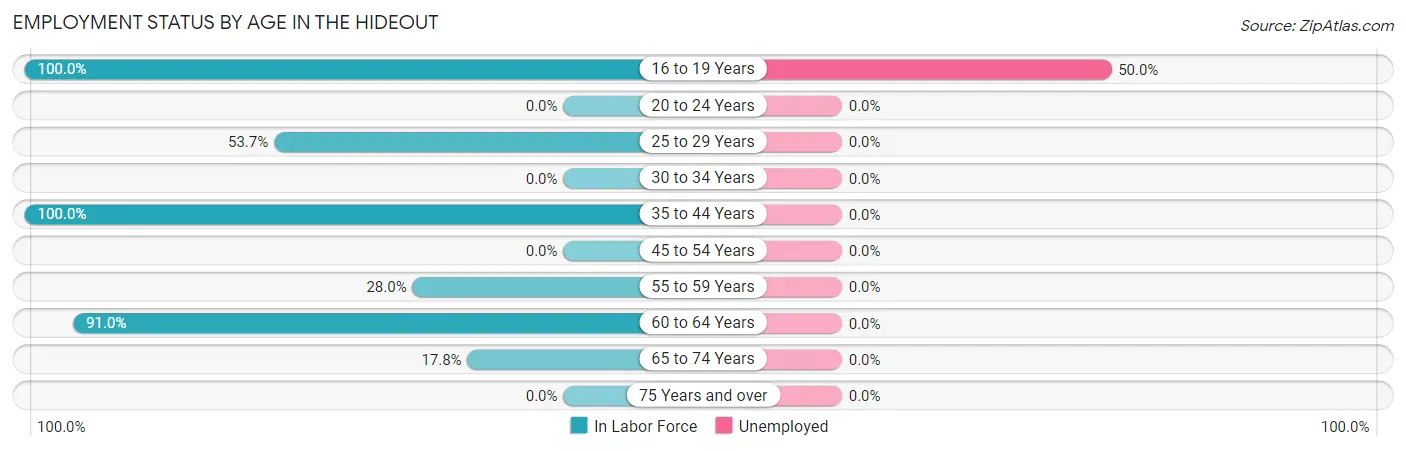
| Age Bracket | In Labor Force | Unemployed |
| 16 to 19 Years | 82 (100.0%) | 41 (50.0%) |
| 20 to 24 Years | 0 (0.0%) | 0 (0.0%) |
| 25 to 29 Years | 117 (53.7%) | 0 (0.0%) |
| 30 to 34 Years | 0 (0.0%) | 0 (0.0%) |
| 35 to 44 Years | 81 (100.0%) | 0 (0.0%) |
| 45 to 54 Years | 0 (0.0%) | 0 (0.0%) |
| 55 to 59 Years | 101 (28.0%) | 0 (0.0%) |
| 60 to 64 Years | 172 (91.0%) | 0 (0.0%) |
| 65 to 74 Years | 51 (17.8%) | 0 (0.0%) |
| 75 Years and over | 0 (0.0%) | 0 (0.0%) |
| Total | 603 (30.6%) | 41 (6.8%) |
Employment Status by Educational Attainment in The Hideout
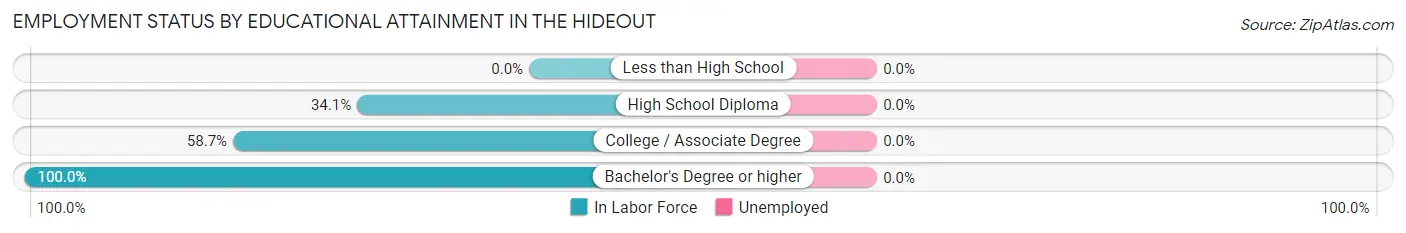
| Educational Attainment | In Labor Force | Unemployed |
| Less than High School | 0 (0.0%) | 0 (0.0%) |
| High School Diploma | 227 (34.1%) | 0 (0.0%) |
| College / Associate Degree | 142 (58.7%) | 0 (0.0%) |
| Bachelor's Degree or higher | 102 (100.0%) | 0 (0.0%) |
| Total | 471 (46.7%) | 0 (0.0%) |
Employment Occupations by Sex in The Hideout
Management, Business, Science and Arts Occupations
The most common Management, Business, Science and Arts occupations in The Hideout are , and Management (102 | 18.1%).
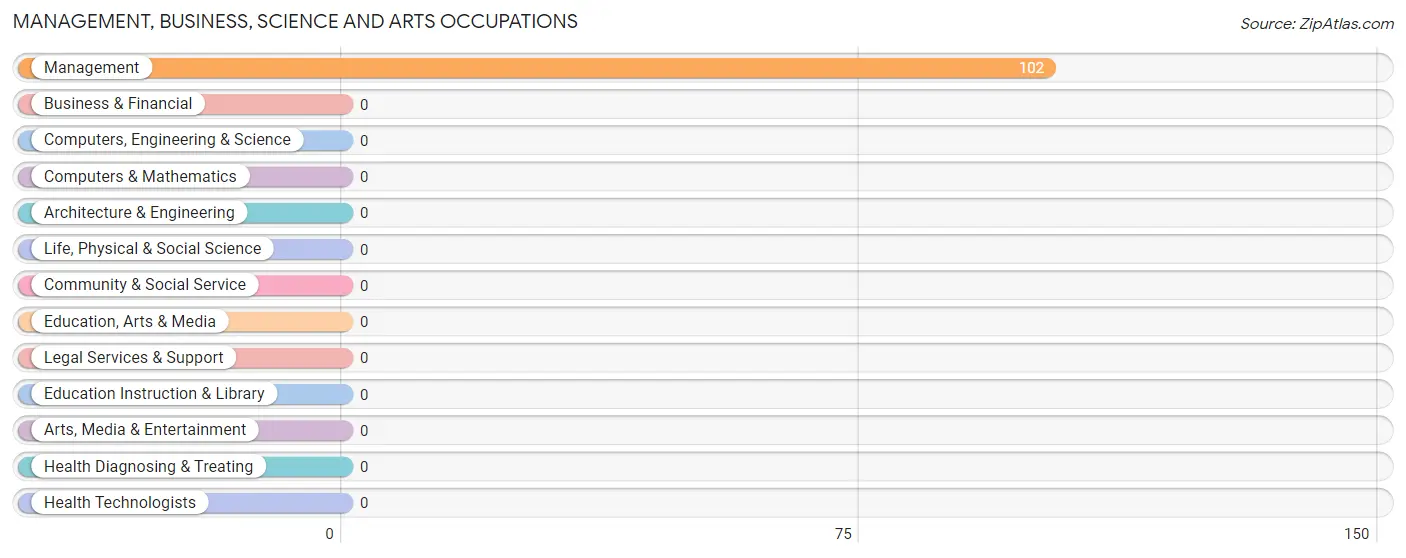
Management, Business, Science and Arts Occupations by Sex
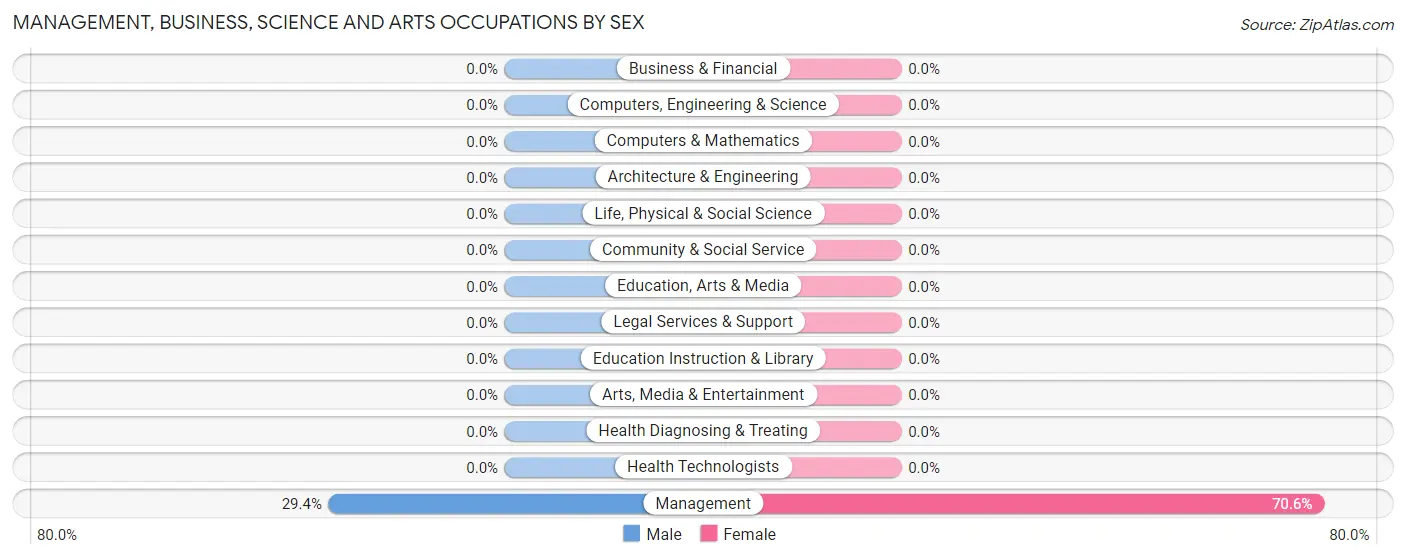
| Occupation | Male | Female |
| Management | 30 (29.4%) | 72 (70.6%) |
| Business & Financial | 0 (0.0%) | 0 (0.0%) |
| Computers, Engineering & Science | 0 (0.0%) | 0 (0.0%) |
| Computers & Mathematics | 0 (0.0%) | 0 (0.0%) |
| Architecture & Engineering | 0 (0.0%) | 0 (0.0%) |
| Life, Physical & Social Science | 0 (0.0%) | 0 (0.0%) |
| Community & Social Service | 0 (0.0%) | 0 (0.0%) |
| Education, Arts & Media | 0 (0.0%) | 0 (0.0%) |
| Legal Services & Support | 0 (0.0%) | 0 (0.0%) |
| Education Instruction & Library | 0 (0.0%) | 0 (0.0%) |
| Arts, Media & Entertainment | 0 (0.0%) | 0 (0.0%) |
| Health Diagnosing & Treating | 0 (0.0%) | 0 (0.0%) |
| Health Technologists | 0 (0.0%) | 0 (0.0%) |
| Total (Category) | 30 (29.4%) | 72 (70.6%) |
| Total (Overall) | 340 (60.4%) | 223 (39.6%) |
Services Occupations
The most common Services occupations in The Hideout are , and Cleaning & Maintenance (51 | 9.1%).
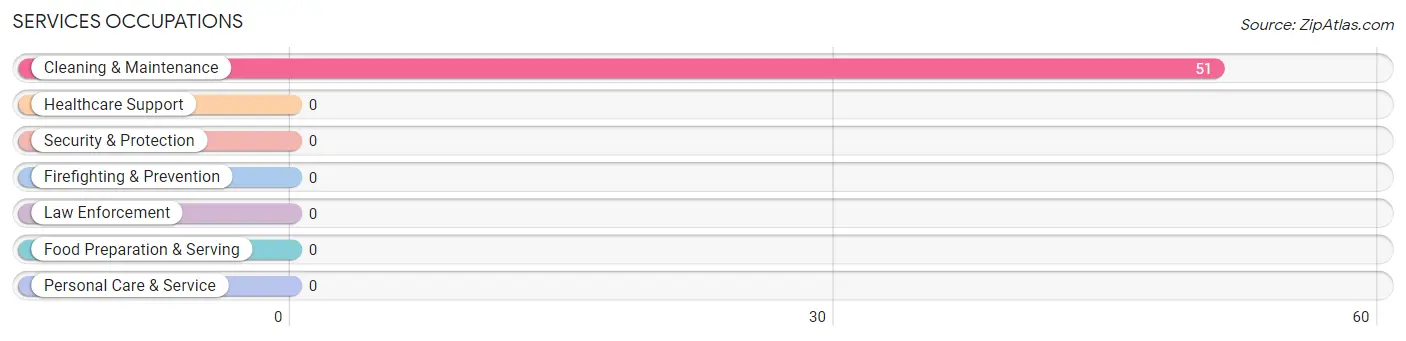
Services Occupations by Sex
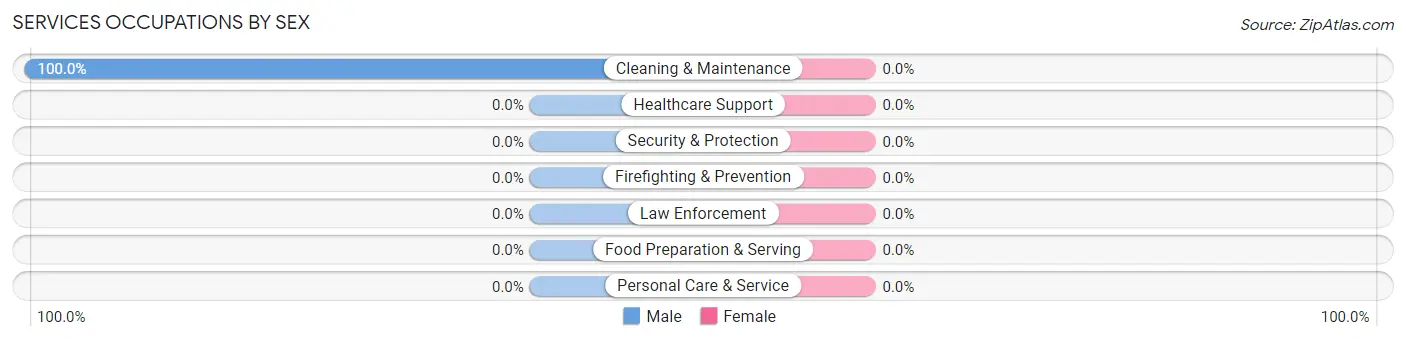
| Occupation | Male | Female |
| Healthcare Support | 0 (0.0%) | 0 (0.0%) |
| Security & Protection | 0 (0.0%) | 0 (0.0%) |
| Firefighting & Prevention | 0 (0.0%) | 0 (0.0%) |
| Law Enforcement | 0 (0.0%) | 0 (0.0%) |
| Food Preparation & Serving | 0 (0.0%) | 0 (0.0%) |
| Cleaning & Maintenance | 51 (100.0%) | 0 (0.0%) |
| Personal Care & Service | 0 (0.0%) | 0 (0.0%) |
| Total (Category) | 51 (100.0%) | 0 (0.0%) |
| Total (Overall) | 340 (60.4%) | 223 (39.6%) |
Sales and Office Occupations
The most common Sales and Office occupations in The Hideout are Office & Administration (110 | 19.5%), and Sales & Related (41 | 7.3%).
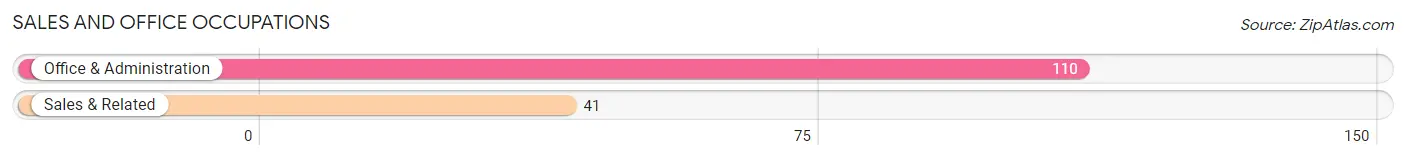
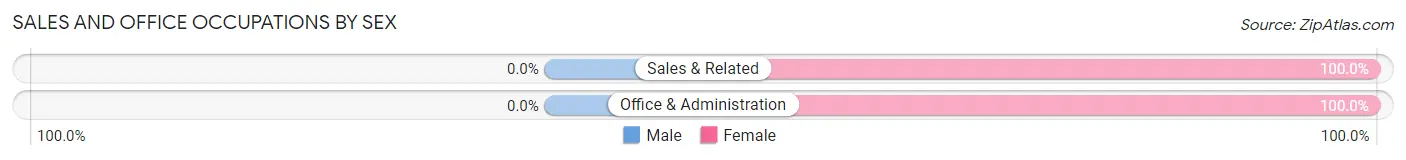
Sales and Office Occupations by Sex
| Occupation | Male | Female |
| Sales & Related | 0 (0.0%) | 41 (100.0%) |
| Office & Administration | 0 (0.0%) | 110 (100.0%) |
| Total (Category) | 0 (0.0%) | 151 (100.0%) |
| Total (Overall) | 340 (60.4%) | 223 (39.6%) |
Natural Resources, Construction and Maintenance Occupations
The most common Natural Resources, Construction and Maintenance occupations in The Hideout are , and Installation, Maintenance & Repair (117 | 20.8%).
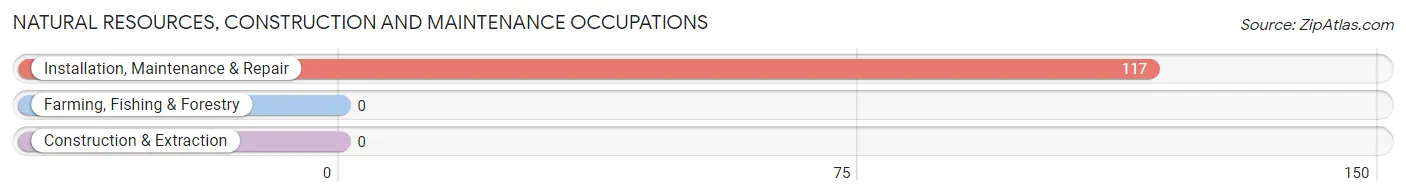
Natural Resources, Construction and Maintenance Occupations by Sex
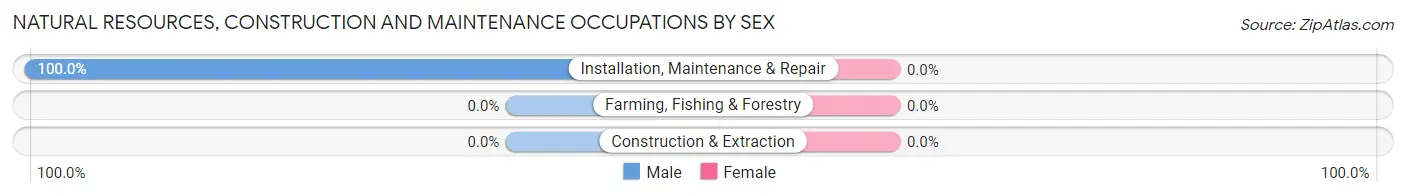
| Occupation | Male | Female |
| Farming, Fishing & Forestry | 0 (0.0%) | 0 (0.0%) |
| Construction & Extraction | 0 (0.0%) | 0 (0.0%) |
| Installation, Maintenance & Repair | 117 (100.0%) | 0 (0.0%) |
| Total (Category) | 117 (100.0%) | 0 (0.0%) |
| Total (Overall) | 340 (60.4%) | 223 (39.6%) |
Production, Transportation and Moving Occupations
The most common Production, Transportation and Moving occupations in The Hideout are Transportation (101 | 17.9%), and Production (41 | 7.3%).
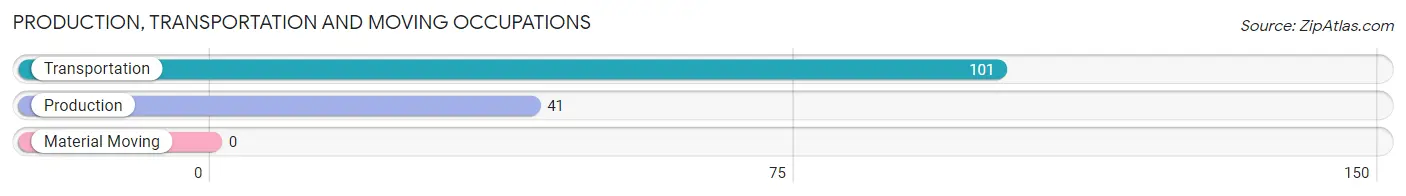
Production, Transportation and Moving Occupations by Sex
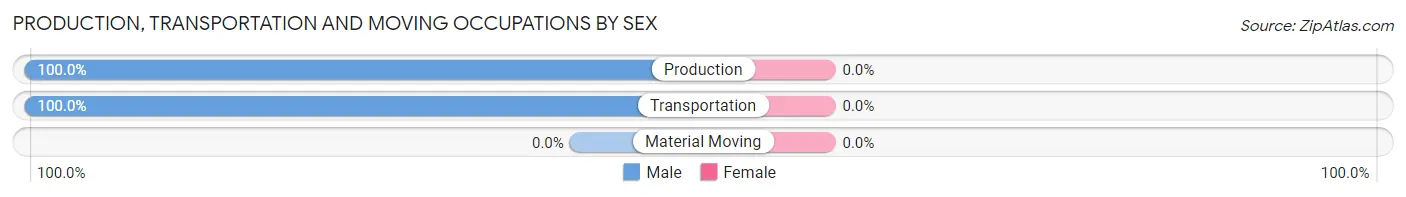
| Occupation | Male | Female |
| Production | 41 (100.0%) | 0 (0.0%) |
| Transportation | 101 (100.0%) | 0 (0.0%) |
| Material Moving | 0 (0.0%) | 0 (0.0%) |
| Total (Category) | 142 (100.0%) | 0 (0.0%) |
| Total (Overall) | 340 (60.4%) | 223 (39.6%) |
Employment Industries by Sex in The Hideout
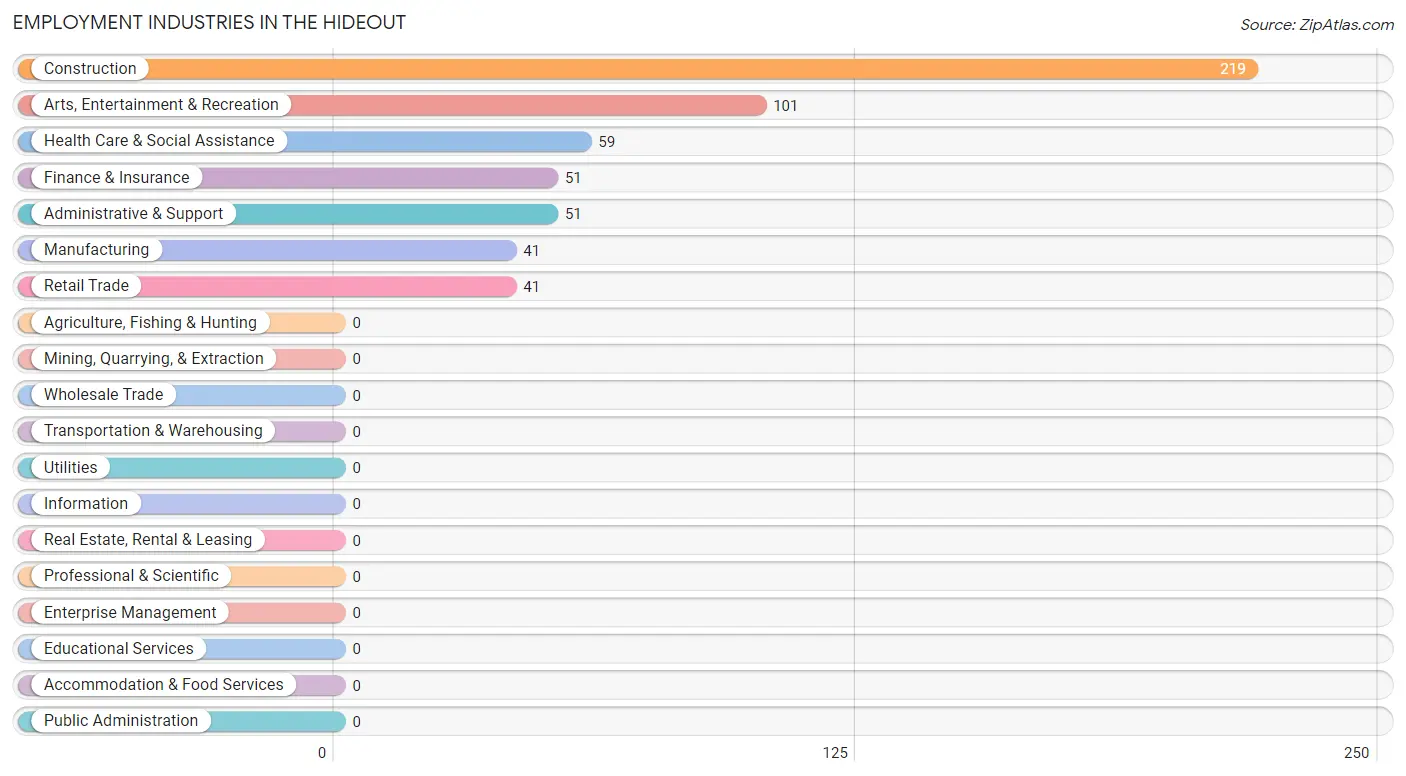
Employment Industries in The Hideout
The major employment industries in The Hideout include Construction (219 | 38.9%), Arts, Entertainment & Recreation (101 | 17.9%), Health Care & Social Assistance (59 | 10.5%), Finance & Insurance (51 | 9.1%), and Administrative & Support (51 | 9.1%).
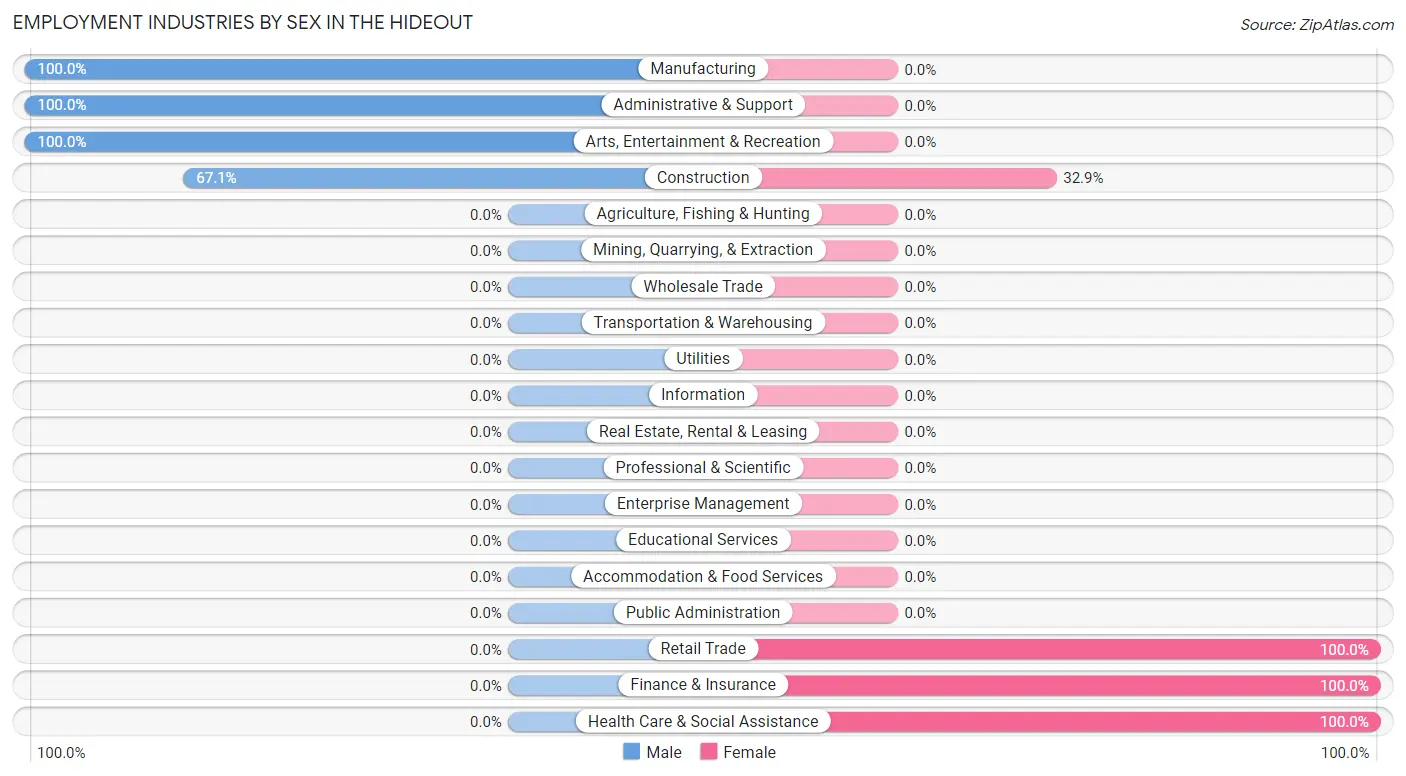
Employment Industries by Sex in The Hideout
The The Hideout industries that see more men than women are Manufacturing (100.0%), Administrative & Support (100.0%), and Arts, Entertainment & Recreation (100.0%), whereas the industries that tend to have a higher number of women are Retail Trade (100.0%), Finance & Insurance (100.0%), and Health Care & Social Assistance (100.0%).
| Industry | Male | Female |
| Agriculture, Fishing & Hunting | 0 (0.0%) | 0 (0.0%) |
| Mining, Quarrying, & Extraction | 0 (0.0%) | 0 (0.0%) |
| Construction | 147 (67.1%) | 72 (32.9%) |
| Manufacturing | 41 (100.0%) | 0 (0.0%) |
| Wholesale Trade | 0 (0.0%) | 0 (0.0%) |
| Retail Trade | 0 (0.0%) | 41 (100.0%) |
| Transportation & Warehousing | 0 (0.0%) | 0 (0.0%) |
| Utilities | 0 (0.0%) | 0 (0.0%) |
| Information | 0 (0.0%) | 0 (0.0%) |
| Finance & Insurance | 0 (0.0%) | 51 (100.0%) |
| Real Estate, Rental & Leasing | 0 (0.0%) | 0 (0.0%) |
| Professional & Scientific | 0 (0.0%) | 0 (0.0%) |
| Enterprise Management | 0 (0.0%) | 0 (0.0%) |
| Administrative & Support | 51 (100.0%) | 0 (0.0%) |
| Educational Services | 0 (0.0%) | 0 (0.0%) |
| Health Care & Social Assistance | 0 (0.0%) | 59 (100.0%) |
| Arts, Entertainment & Recreation | 101 (100.0%) | 0 (0.0%) |
| Accommodation & Food Services | 0 (0.0%) | 0 (0.0%) |
| Public Administration | 0 (0.0%) | 0 (0.0%) |
| Total | 340 (60.4%) | 223 (39.6%) |
Education in The Hideout
School Enrollment in The Hideout
The most common levels of schooling among the 138 students in The Hideout are elementary school (75 | 54.3%), high school (41 | 29.7%), and middle school (22 | 15.9%).
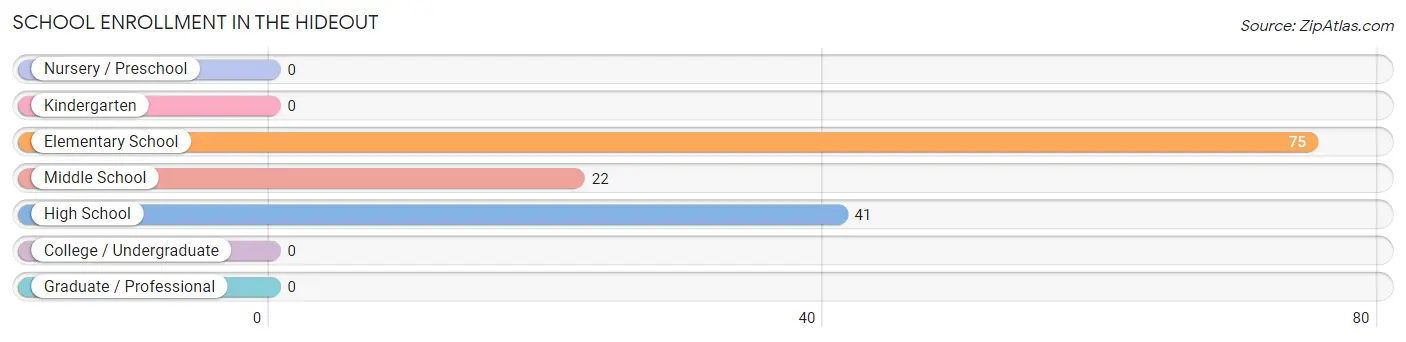
| School Level | # Students | % Students |
| Nursery / Preschool | 0 | 0.0% |
| Kindergarten | 0 | 0.0% |
| Elementary School | 75 | 54.3% |
| Middle School | 22 | 15.9% |
| High School | 41 | 29.7% |
| College / Undergraduate | 0 | 0.0% |
| Graduate / Professional | 0 | 0.0% |
| Total | 138 | 100.0% |
School Enrollment by Age by Funding Source in The Hideout
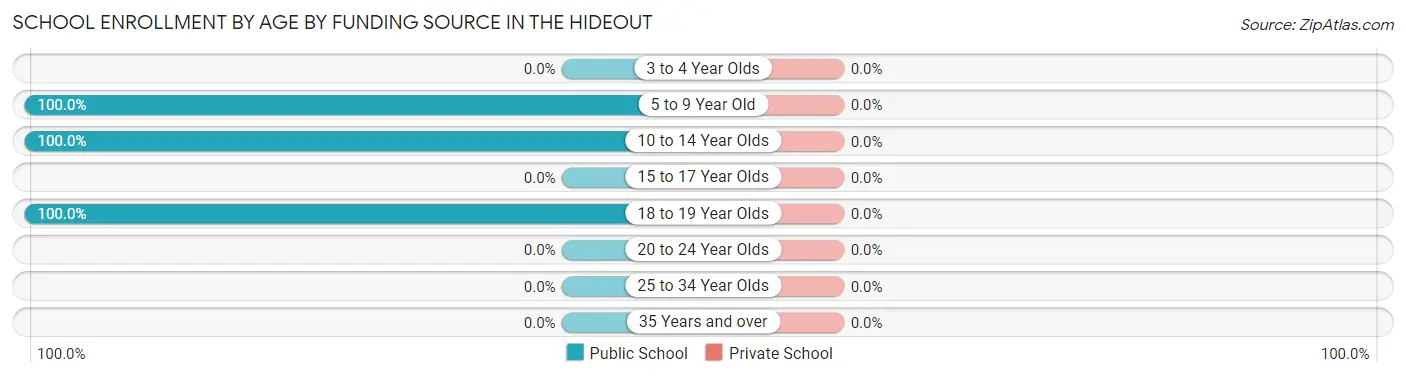
| Age Bracket | Public School | Private School |
| 3 to 4 Year Olds | 0 (0.0%) | 0 (0.0%) |
| 5 to 9 Year Old | 21 (100.0%) | 0 (0.0%) |
| 10 to 14 Year Olds | 76 (100.0%) | 0 (0.0%) |
| 15 to 17 Year Olds | 0 (0.0%) | 0 (0.0%) |
| 18 to 19 Year Olds | 41 (100.0%) | 0 (0.0%) |
| 20 to 24 Year Olds | 0 (0.0%) | 0 (0.0%) |
| 25 to 34 Year Olds | 0 (0.0%) | 0 (0.0%) |
| 35 Years and over | 0 (0.0%) | 0 (0.0%) |
| Total | 138 (100.0%) | 0 (0.0%) |
Educational Attainment by Field of Study in The Hideout
Business (165 | 37.8%), science & technology (124 | 28.4%), literature & languages (72 | 16.5%), social sciences (34 | 7.8%), and computers & mathematics (30 | 6.9%) are the most common fields of study among 437 individuals in The Hideout who have obtained a bachelor's degree or higher.
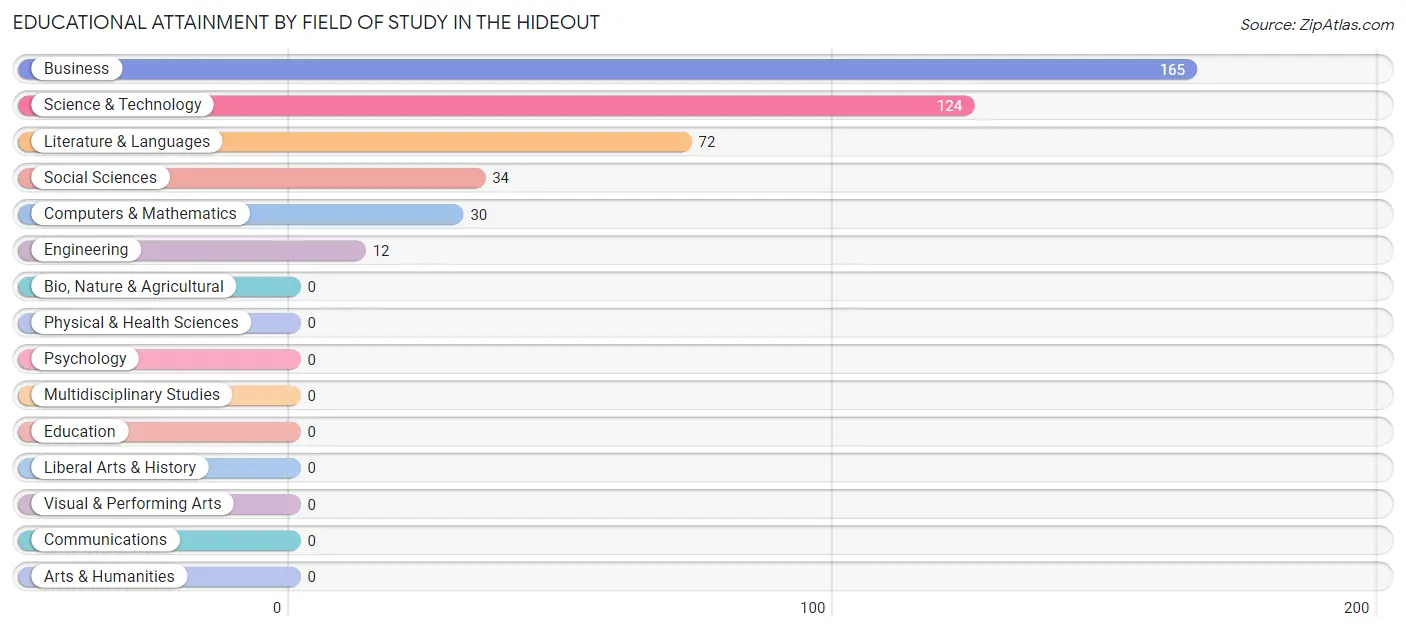
| Field of Study | # Graduates | % Graduates |
| Computers & Mathematics | 30 | 6.9% |
| Bio, Nature & Agricultural | 0 | 0.0% |
| Physical & Health Sciences | 0 | 0.0% |
| Psychology | 0 | 0.0% |
| Social Sciences | 34 | 7.8% |
| Engineering | 12 | 2.8% |
| Multidisciplinary Studies | 0 | 0.0% |
| Science & Technology | 124 | 28.4% |
| Business | 165 | 37.8% |
| Education | 0 | 0.0% |
| Literature & Languages | 72 | 16.5% |
| Liberal Arts & History | 0 | 0.0% |
| Visual & Performing Arts | 0 | 0.0% |
| Communications | 0 | 0.0% |
| Arts & Humanities | 0 | 0.0% |
| Total | 437 | 100.0% |
Transportation & Commute in The Hideout
Vehicle Availability by Sex in The Hideout
The most prevalent vehicle ownership categories in The Hideout are males with 2 vehicles (193, accounting for 56.8%) and females with 2 vehicles (223, making up 86.6%).
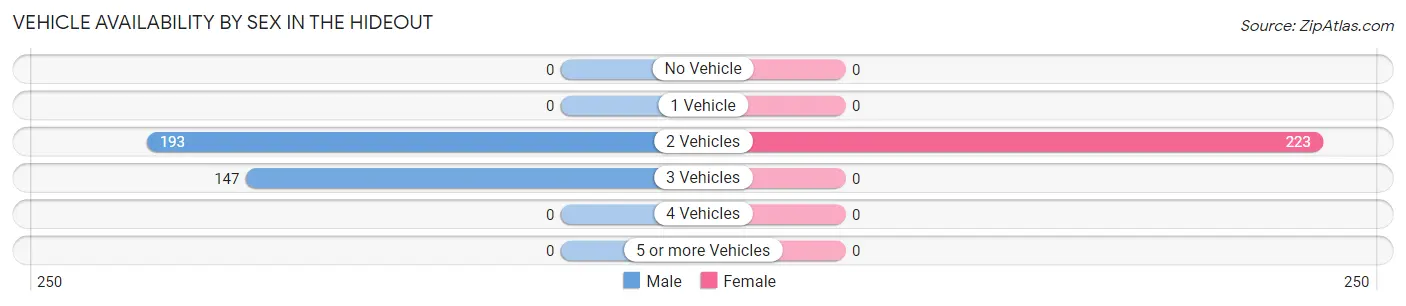
| Vehicles Available | Male | Female |
| No Vehicle | 0 (0.0%) | 0 (0.0%) |
| 1 Vehicle | 0 (0.0%) | 0 (0.0%) |
| 2 Vehicles | 193 (56.8%) | 223 (100.0%) |
| 3 Vehicles | 147 (43.2%) | 0 (0.0%) |
| 4 Vehicles | 0 (0.0%) | 0 (0.0%) |
| 5 or more Vehicles | 0 (0.0%) | 0 (0.0%) |
| Total | 340 (100.0%) | 223 (100.0%) |
Commute Time in The Hideout
The most frequently occuring commute durations in The Hideout are 15 to 19 minutes (152 commuters, 30.2%), 90 or more minutes (147 commuters, 29.2%), and 45 to 59 minutes (72 commuters, 14.3%).
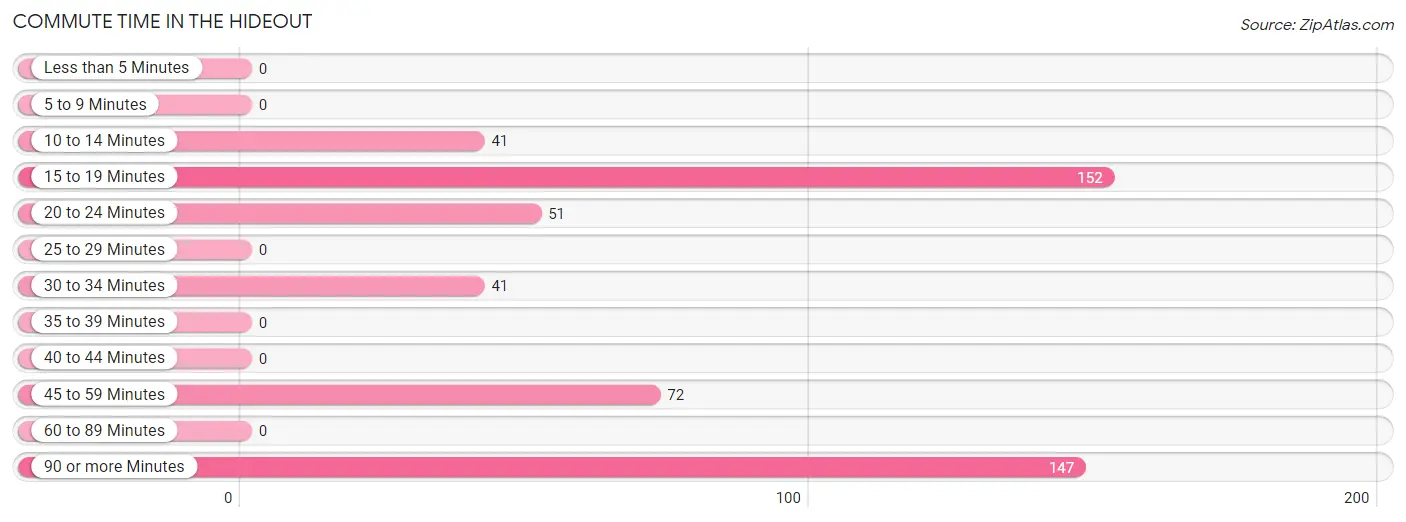
| Commute Time | # Commuters | % Commuters |
| Less than 5 Minutes | 0 | 0.0% |
| 5 to 9 Minutes | 0 | 0.0% |
| 10 to 14 Minutes | 41 | 8.1% |
| 15 to 19 Minutes | 152 | 30.2% |
| 20 to 24 Minutes | 51 | 10.1% |
| 25 to 29 Minutes | 0 | 0.0% |
| 30 to 34 Minutes | 41 | 8.1% |
| 35 to 39 Minutes | 0 | 0.0% |
| 40 to 44 Minutes | 0 | 0.0% |
| 45 to 59 Minutes | 72 | 14.3% |
| 60 to 89 Minutes | 0 | 0.0% |
| 90 or more Minutes | 147 | 29.2% |
Commute Time by Sex in The Hideout
The most common commute times in The Hideout are 90 or more minutes (147 commuters, 43.2%) for males and 45 to 59 minutes (72 commuters, 43.9%) for females.
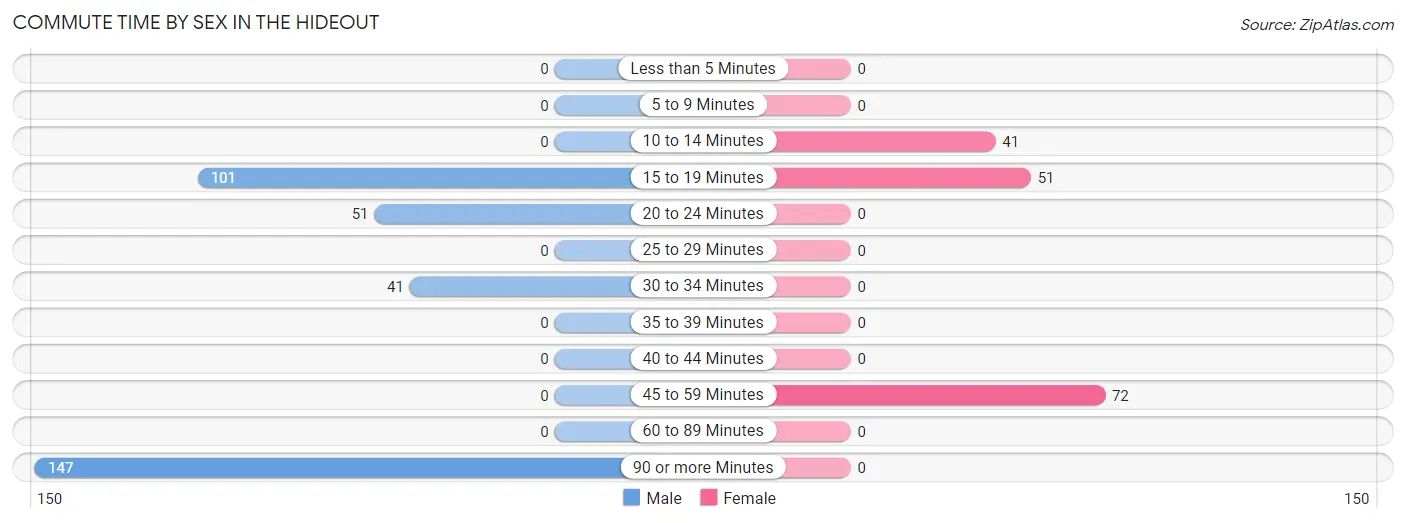
| Commute Time | Male | Female |
| Less than 5 Minutes | 0 (0.0%) | 0 (0.0%) |
| 5 to 9 Minutes | 0 (0.0%) | 0 (0.0%) |
| 10 to 14 Minutes | 0 (0.0%) | 41 (25.0%) |
| 15 to 19 Minutes | 101 (29.7%) | 51 (31.1%) |
| 20 to 24 Minutes | 51 (15.0%) | 0 (0.0%) |
| 25 to 29 Minutes | 0 (0.0%) | 0 (0.0%) |
| 30 to 34 Minutes | 41 (12.1%) | 0 (0.0%) |
| 35 to 39 Minutes | 0 (0.0%) | 0 (0.0%) |
| 40 to 44 Minutes | 0 (0.0%) | 0 (0.0%) |
| 45 to 59 Minutes | 0 (0.0%) | 72 (43.9%) |
| 60 to 89 Minutes | 0 (0.0%) | 0 (0.0%) |
| 90 or more Minutes | 147 (43.2%) | 0 (0.0%) |
Time of Departure to Work by Sex in The Hideout
The most frequent times of departure to work in The Hideout are 12:00 AM to 4:59 AM (117, 34.4%) for males and 7:30 AM to 7:59 AM (92, 56.1%) for females.
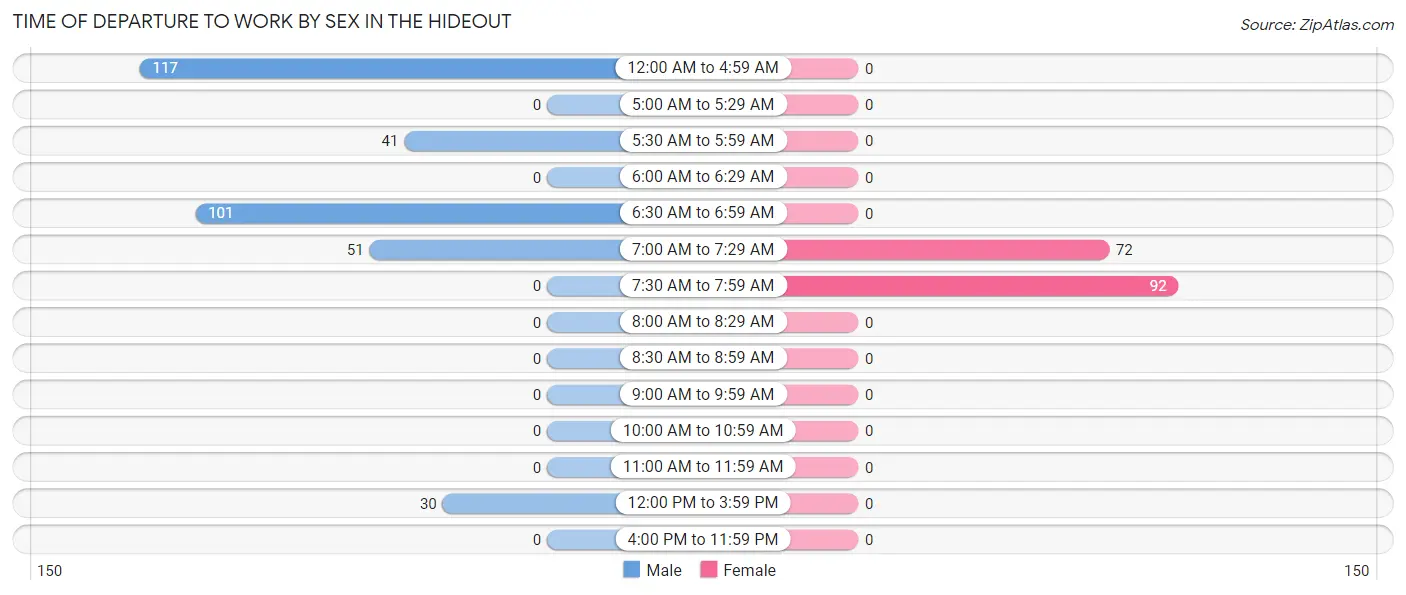
| Time of Departure | Male | Female |
| 12:00 AM to 4:59 AM | 117 (34.4%) | 0 (0.0%) |
| 5:00 AM to 5:29 AM | 0 (0.0%) | 0 (0.0%) |
| 5:30 AM to 5:59 AM | 41 (12.1%) | 0 (0.0%) |
| 6:00 AM to 6:29 AM | 0 (0.0%) | 0 (0.0%) |
| 6:30 AM to 6:59 AM | 101 (29.7%) | 0 (0.0%) |
| 7:00 AM to 7:29 AM | 51 (15.0%) | 72 (43.9%) |
| 7:30 AM to 7:59 AM | 0 (0.0%) | 92 (56.1%) |
| 8:00 AM to 8:29 AM | 0 (0.0%) | 0 (0.0%) |
| 8:30 AM to 8:59 AM | 0 (0.0%) | 0 (0.0%) |
| 9:00 AM to 9:59 AM | 0 (0.0%) | 0 (0.0%) |
| 10:00 AM to 10:59 AM | 0 (0.0%) | 0 (0.0%) |
| 11:00 AM to 11:59 AM | 0 (0.0%) | 0 (0.0%) |
| 12:00 PM to 3:59 PM | 30 (8.8%) | 0 (0.0%) |
| 4:00 PM to 11:59 PM | 0 (0.0%) | 0 (0.0%) |
| Total | 340 (100.0%) | 164 (100.0%) |
Housing Occupancy in The Hideout
Occupancy by Ownership in The Hideout
Of the total 973 dwellings in The Hideout, owner-occupied units account for 866 (89.0%), while renter-occupied units make up 107 (11.0%).
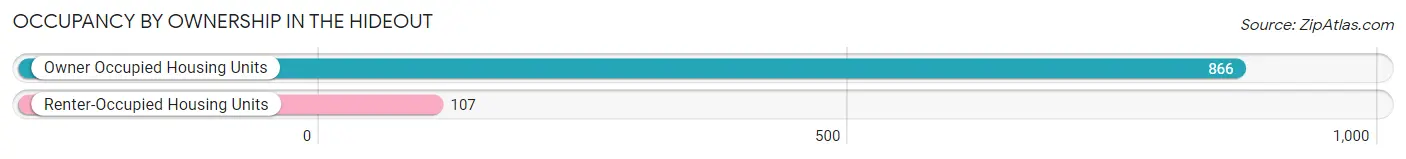
| Occupancy | # Housing Units | % Housing Units |
| Owner Occupied Housing Units | 866 | 89.0% |
| Renter-Occupied Housing Units | 107 | 11.0% |
| Total Occupied Housing Units | 973 | 100.0% |
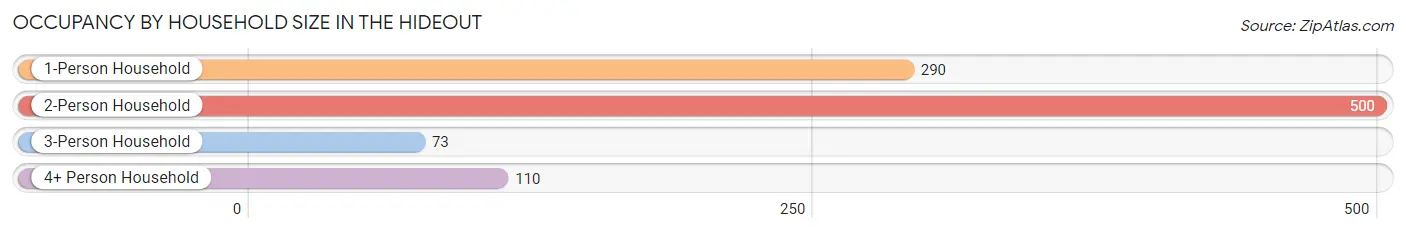
Occupancy by Household Size in The Hideout
| Household Size | # Housing Units | % Housing Units |
| 1-Person Household | 290 | 29.8% |
| 2-Person Household | 500 | 51.4% |
| 3-Person Household | 73 | 7.5% |
| 4+ Person Household | 110 | 11.3% |
| Total Housing Units | 973 | 100.0% |
Occupancy by Ownership by Household Size in The Hideout
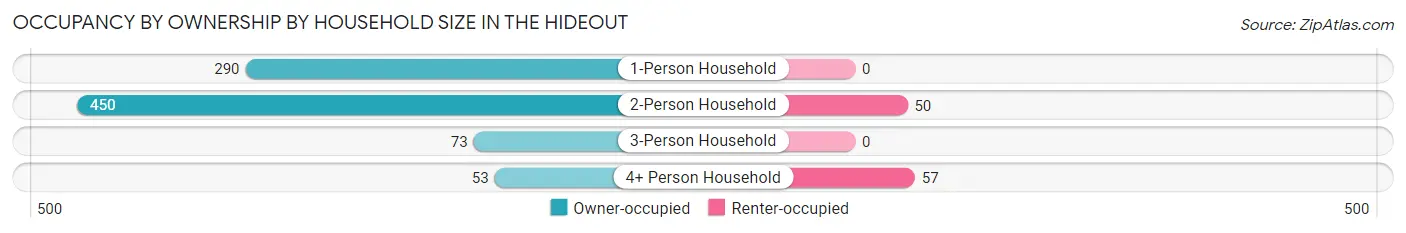
| Household Size | Owner-occupied | Renter-occupied |
| 1-Person Household | 290 (100.0%) | 0 (0.0%) |
| 2-Person Household | 450 (90.0%) | 50 (10.0%) |
| 3-Person Household | 73 (100.0%) | 0 (0.0%) |
| 4+ Person Household | 53 (48.2%) | 57 (51.8%) |
| Total Housing Units | 866 (89.0%) | 107 (11.0%) |
Occupancy by Educational Attainment in The Hideout
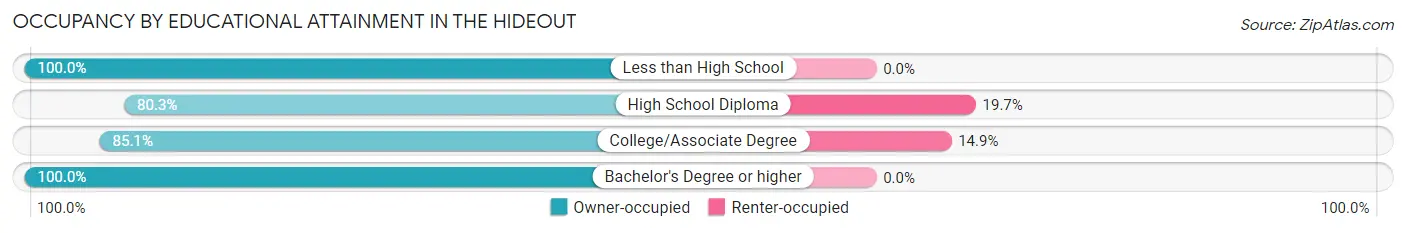
| Household Size | Owner-occupied | Renter-occupied |
| Less than High School | 85 (100.0%) | 0 (0.0%) |
| High School Diploma | 232 (80.3%) | 57 (19.7%) |
| College/Associate Degree | 286 (85.1%) | 50 (14.9%) |
| Bachelor's Degree or higher | 263 (100.0%) | 0 (0.0%) |
Occupancy by Age of Householder in The Hideout
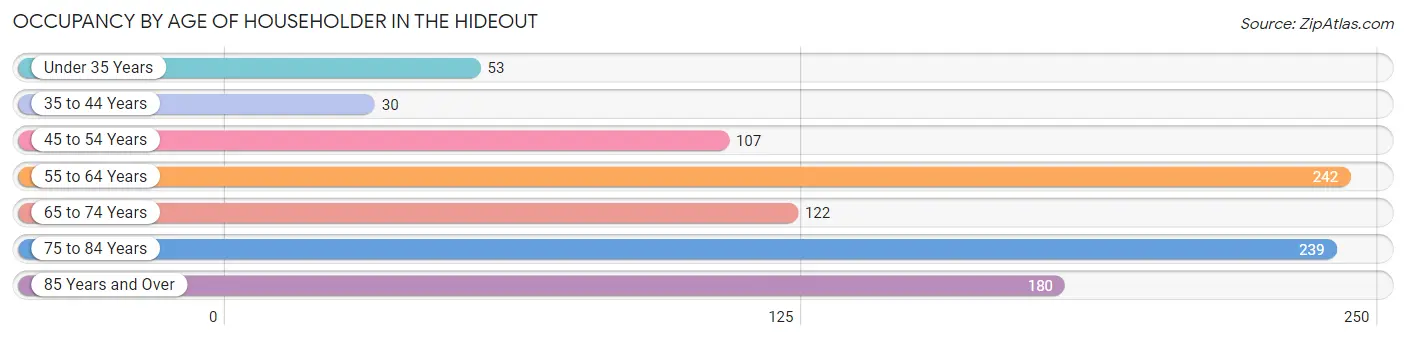
| Age Bracket | # Households | % Households |
| Under 35 Years | 53 | 5.4% |
| 35 to 44 Years | 30 | 3.1% |
| 45 to 54 Years | 107 | 11.0% |
| 55 to 64 Years | 242 | 24.9% |
| 65 to 74 Years | 122 | 12.5% |
| 75 to 84 Years | 239 | 24.6% |
| 85 Years and Over | 180 | 18.5% |
| Total | 973 | 100.0% |
Housing Finances in The Hideout
Median Income by Occupancy in The Hideout
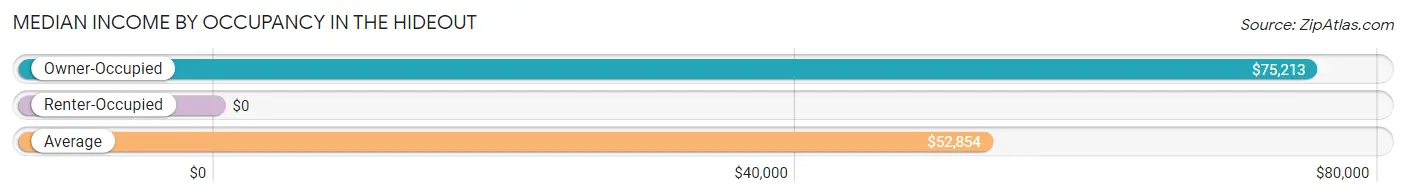
| Occupancy Type | # Households | Median Income |
| Owner-Occupied | 866 (89.0%) | $75,213 |
| Renter-Occupied | 107 (11.0%) | $0 |
| Average | 973 (100.0%) | $52,854 |
Occupancy by Householder Income Bracket in The Hideout
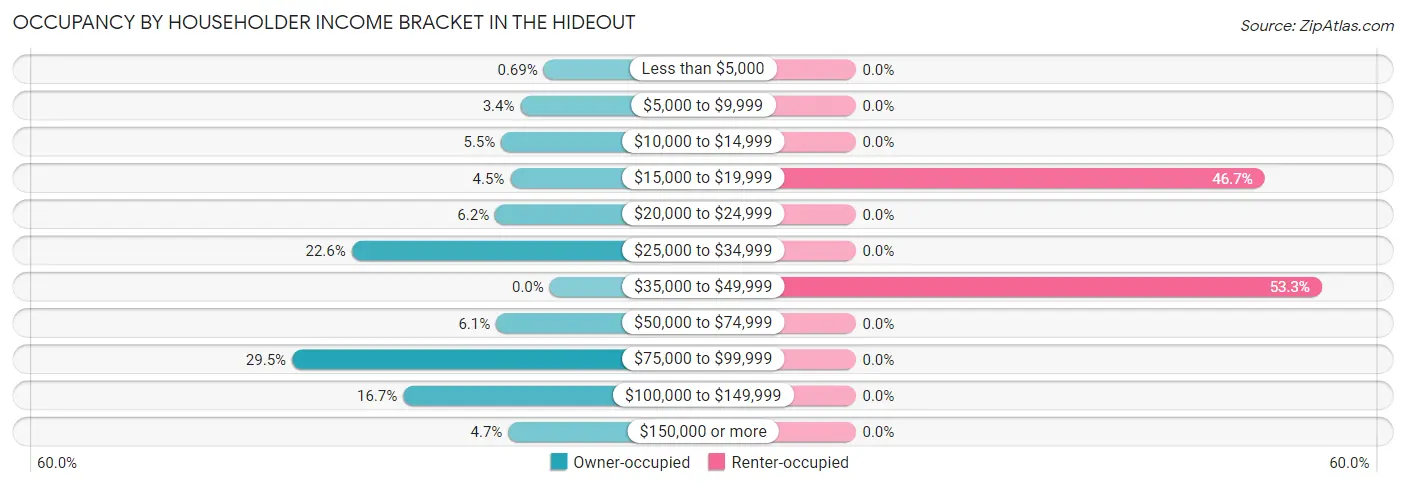
| Income Bracket | Owner-occupied | Renter-occupied |
| Less than $5,000 | 6 (0.7%) | 0 (0.0%) |
| $5,000 to $9,999 | 29 (3.4%) | 0 (0.0%) |
| $10,000 to $14,999 | 48 (5.5%) | 0 (0.0%) |
| $15,000 to $19,999 | 39 (4.5%) | 50 (46.7%) |
| $20,000 to $24,999 | 54 (6.2%) | 0 (0.0%) |
| $25,000 to $34,999 | 196 (22.6%) | 0 (0.0%) |
| $35,000 to $49,999 | 0 (0.0%) | 57 (53.3%) |
| $50,000 to $74,999 | 53 (6.1%) | 0 (0.0%) |
| $75,000 to $99,999 | 255 (29.4%) | 0 (0.0%) |
| $100,000 to $149,999 | 145 (16.7%) | 0 (0.0%) |
| $150,000 or more | 41 (4.7%) | 0 (0.0%) |
| Total | 866 (100.0%) | 107 (100.0%) |
Monthly Housing Cost Tiers in The Hideout
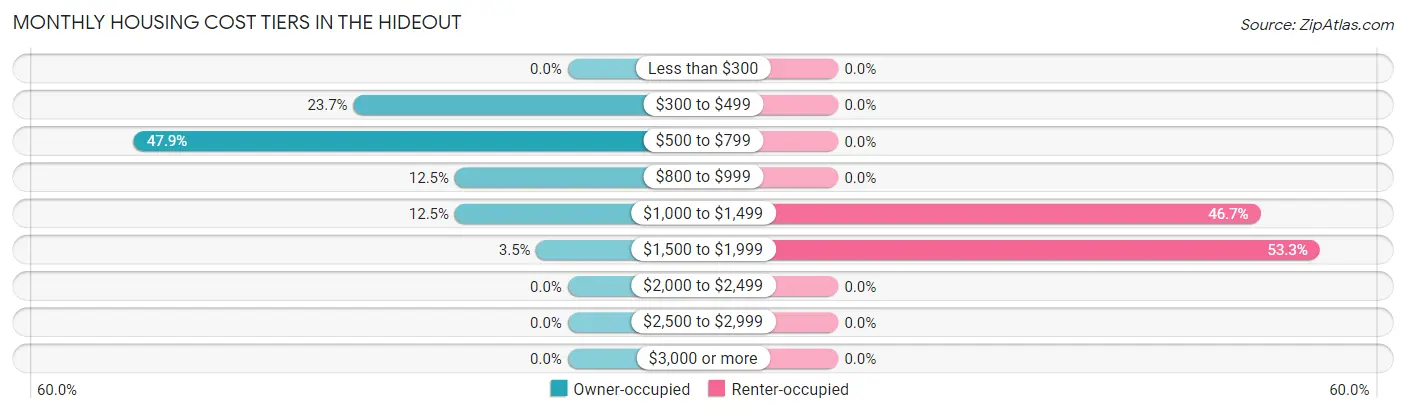
| Monthly Cost | Owner-occupied | Renter-occupied |
| Less than $300 | 0 (0.0%) | 0 (0.0%) |
| $300 to $499 | 205 (23.7%) | 0 (0.0%) |
| $500 to $799 | 415 (47.9%) | 0 (0.0%) |
| $800 to $999 | 108 (12.5%) | 0 (0.0%) |
| $1,000 to $1,499 | 108 (12.5%) | 50 (46.7%) |
| $1,500 to $1,999 | 30 (3.5%) | 57 (53.3%) |
| $2,000 to $2,499 | 0 (0.0%) | 0 (0.0%) |
| $2,500 to $2,999 | 0 (0.0%) | 0 (0.0%) |
| $3,000 or more | 0 (0.0%) | 0 (0.0%) |
| Total | 866 (100.0%) | 107 (100.0%) |
Physical Housing Characteristics in The Hideout
Housing Structures in The Hideout
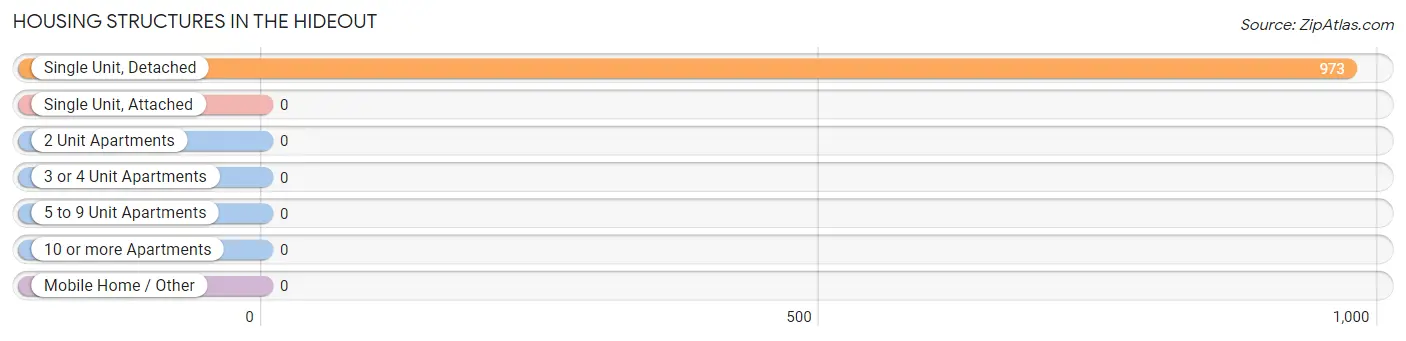
| Structure Type | # Housing Units | % Housing Units |
| Single Unit, Detached | 973 | 100.0% |
| Single Unit, Attached | 0 | 0.0% |
| 2 Unit Apartments | 0 | 0.0% |
| 3 or 4 Unit Apartments | 0 | 0.0% |
| 5 to 9 Unit Apartments | 0 | 0.0% |
| 10 or more Apartments | 0 | 0.0% |
| Mobile Home / Other | 0 | 0.0% |
| Total | 973 | 100.0% |
Housing Structures by Occupancy in The Hideout
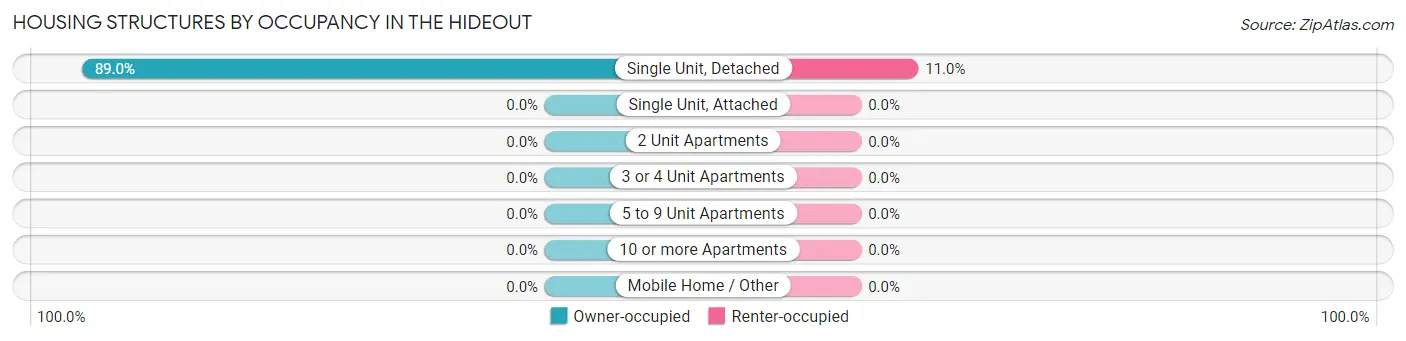
| Structure Type | Owner-occupied | Renter-occupied |
| Single Unit, Detached | 866 (89.0%) | 107 (11.0%) |
| Single Unit, Attached | 0 (0.0%) | 0 (0.0%) |
| 2 Unit Apartments | 0 (0.0%) | 0 (0.0%) |
| 3 or 4 Unit Apartments | 0 (0.0%) | 0 (0.0%) |
| 5 to 9 Unit Apartments | 0 (0.0%) | 0 (0.0%) |
| 10 or more Apartments | 0 (0.0%) | 0 (0.0%) |
| Mobile Home / Other | 0 (0.0%) | 0 (0.0%) |
| Total | 866 (89.0%) | 107 (11.0%) |
Housing Structures by Number of Rooms in The Hideout
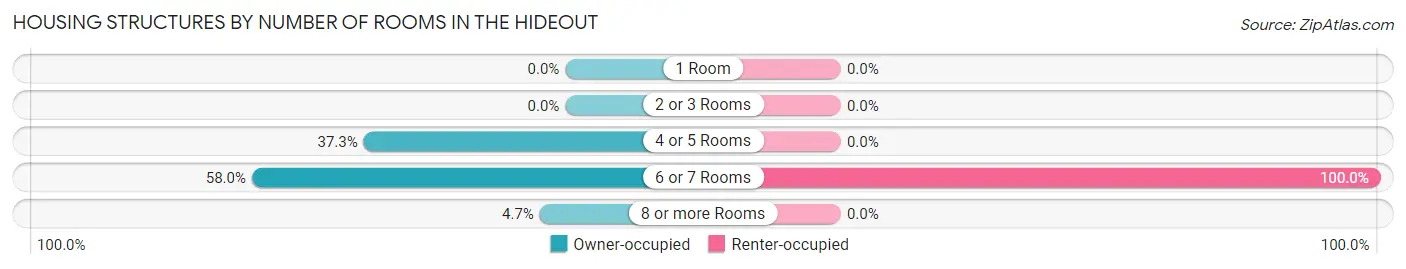
| Number of Rooms | Owner-occupied | Renter-occupied |
| 1 Room | 0 (0.0%) | 0 (0.0%) |
| 2 or 3 Rooms | 0 (0.0%) | 0 (0.0%) |
| 4 or 5 Rooms | 323 (37.3%) | 0 (0.0%) |
| 6 or 7 Rooms | 502 (58.0%) | 107 (100.0%) |
| 8 or more Rooms | 41 (4.7%) | 0 (0.0%) |
| Total | 866 (100.0%) | 107 (100.0%) |
Housing Structure by Heating Type in The Hideout
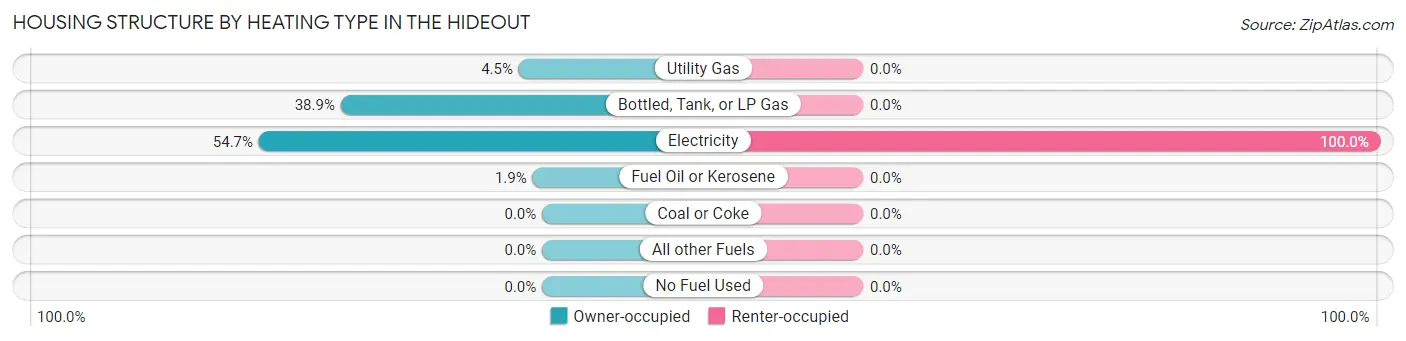
| Heating Type | Owner-occupied | Renter-occupied |
| Utility Gas | 39 (4.5%) | 0 (0.0%) |
| Bottled, Tank, or LP Gas | 337 (38.9%) | 0 (0.0%) |
| Electricity | 474 (54.7%) | 107 (100.0%) |
| Fuel Oil or Kerosene | 16 (1.8%) | 0 (0.0%) |
| Coal or Coke | 0 (0.0%) | 0 (0.0%) |
| All other Fuels | 0 (0.0%) | 0 (0.0%) |
| No Fuel Used | 0 (0.0%) | 0 (0.0%) |
| Total | 866 (100.0%) | 107 (100.0%) |
Household Vehicle Usage in The Hideout
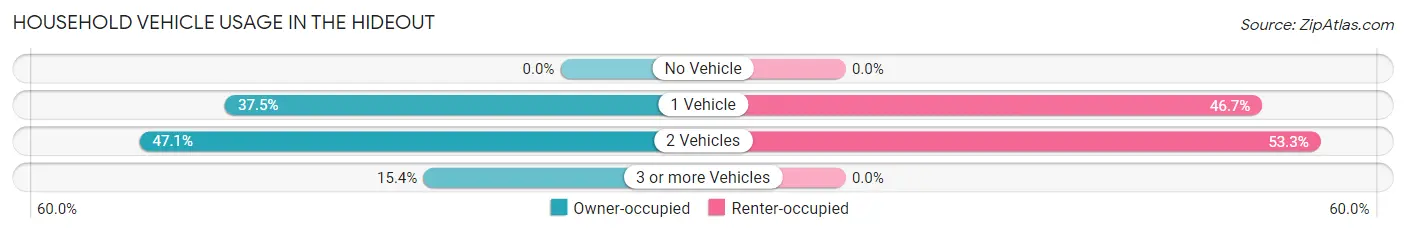
| Vehicles per Household | Owner-occupied | Renter-occupied |
| No Vehicle | 0 (0.0%) | 0 (0.0%) |
| 1 Vehicle | 325 (37.5%) | 50 (46.7%) |
| 2 Vehicles | 408 (47.1%) | 57 (53.3%) |
| 3 or more Vehicles | 133 (15.4%) | 0 (0.0%) |
| Total | 866 (100.0%) | 107 (100.0%) |
Real Estate & Mortgages in The Hideout
Real Estate and Mortgage Overview in The Hideout
| Characteristic | Without Mortgage | With Mortgage |
| Housing Units | 744 | 122 |
| Median Property Value | $149,700 | $212,200 |
| Median Household Income | $53,915 | $0 |
| Monthly Housing Costs | $630 | $0 |
| Real Estate Taxes | $2,164 | $0 |
Property Value by Mortgage Status in The Hideout
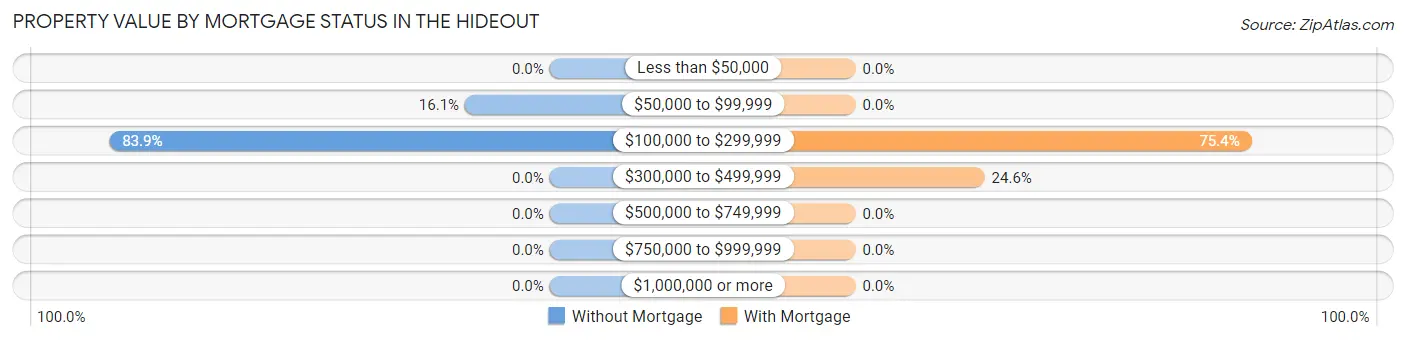
| Property Value | Without Mortgage | With Mortgage |
| Less than $50,000 | 0 (0.0%) | 0 (0.0%) |
| $50,000 to $99,999 | 120 (16.1%) | 0 (0.0%) |
| $100,000 to $299,999 | 624 (83.9%) | 92 (75.4%) |
| $300,000 to $499,999 | 0 (0.0%) | 30 (24.6%) |
| $500,000 to $749,999 | 0 (0.0%) | 0 (0.0%) |
| $750,000 to $999,999 | 0 (0.0%) | 0 (0.0%) |
| $1,000,000 or more | 0 (0.0%) | 0 (0.0%) |
| Total | 744 (100.0%) | 122 (100.0%) |
Household Income by Mortgage Status in The Hideout
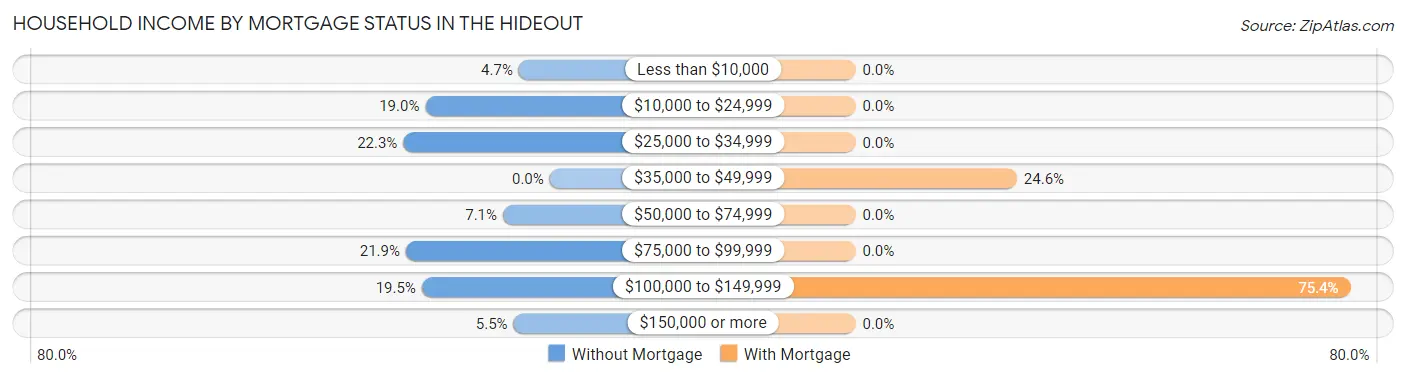
| Household Income | Without Mortgage | With Mortgage |
| Less than $10,000 | 35 (4.7%) | 0 (0.0%) |
| $10,000 to $24,999 | 141 (19.0%) | 0 (0.0%) |
| $25,000 to $34,999 | 166 (22.3%) | 0 (0.0%) |
| $35,000 to $49,999 | 0 (0.0%) | 30 (24.6%) |
| $50,000 to $74,999 | 53 (7.1%) | 0 (0.0%) |
| $75,000 to $99,999 | 163 (21.9%) | 0 (0.0%) |
| $100,000 to $149,999 | 145 (19.5%) | 92 (75.4%) |
| $150,000 or more | 41 (5.5%) | 0 (0.0%) |
| Total | 744 (100.0%) | 122 (100.0%) |
Property Value to Household Income Ratio in The Hideout
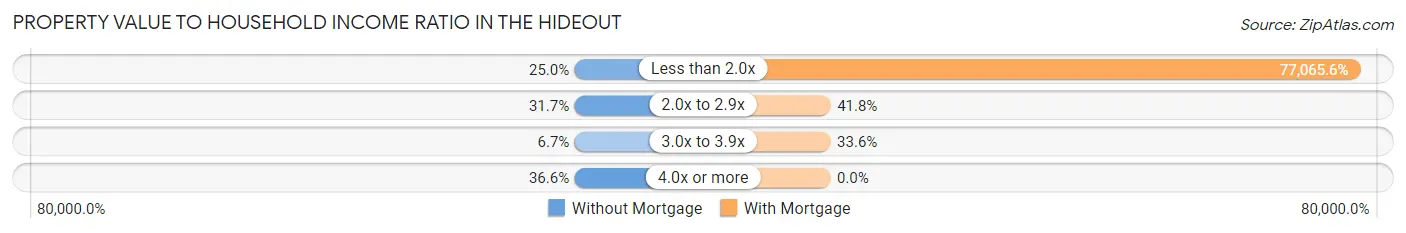
| Value-to-Income Ratio | Without Mortgage | With Mortgage |
| Less than 2.0x | 186 (25.0%) | 94,020 (77,065.6%) |
| 2.0x to 2.9x | 236 (31.7%) | 51 (41.8%) |
| 3.0x to 3.9x | 50 (6.7%) | 41 (33.6%) |
| 4.0x or more | 272 (36.6%) | 0 (0.0%) |
| Total | 744 (100.0%) | 122 (100.0%) |
Real Estate Taxes by Mortgage Status in The Hideout
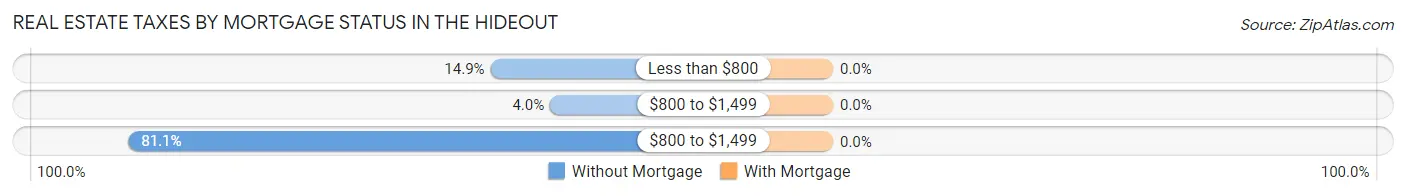
| Property Taxes | Without Mortgage | With Mortgage |
| Less than $800 | 111 (14.9%) | 0 (0.0%) |
| $800 to $1,499 | 30 (4.0%) | 0 (0.0%) |
| $800 to $1,499 | 603 (81.0%) | 0 (0.0%) |
| Total | 744 (100.0%) | 122 (100.0%) |
Health & Disability in The Hideout
Health Insurance Coverage by Age in The Hideout
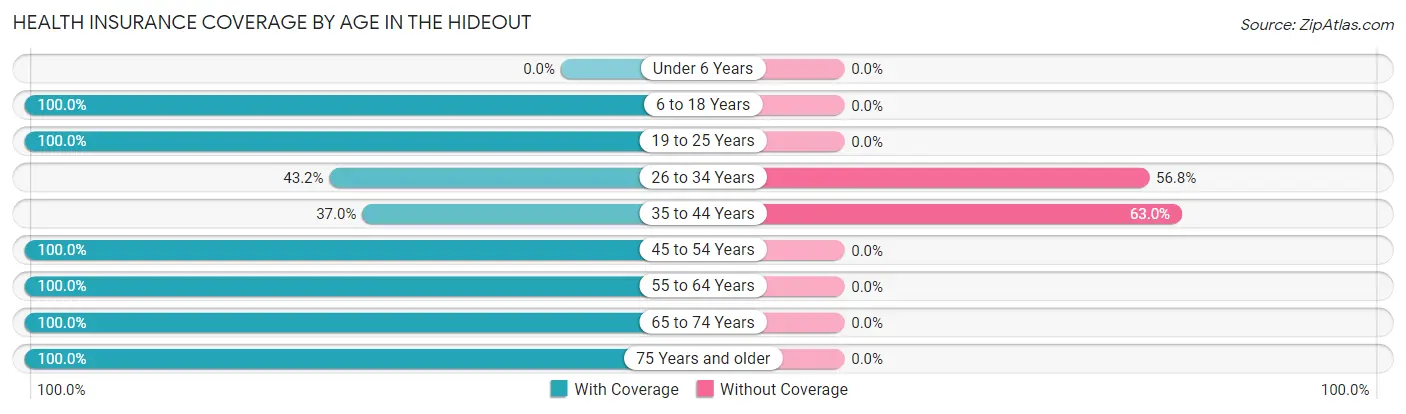
| Age Bracket | With Coverage | Without Coverage |
| Under 6 Years | 0 (0.0%) | 0 (0.0%) |
| 6 to 18 Years | 138 (100.0%) | 0 (0.0%) |
| 19 to 25 Years | 41 (100.0%) | 0 (0.0%) |
| 26 to 34 Years | 117 (43.2%) | 154 (56.8%) |
| 35 to 44 Years | 30 (37.0%) | 51 (63.0%) |
| 45 to 54 Years | 107 (100.0%) | 0 (0.0%) |
| 55 to 64 Years | 550 (100.0%) | 0 (0.0%) |
| 65 to 74 Years | 286 (100.0%) | 0 (0.0%) |
| 75 Years and older | 595 (100.0%) | 0 (0.0%) |
| Total | 1,864 (90.1%) | 205 (9.9%) |
Health Insurance Coverage by Citizenship Status in The Hideout
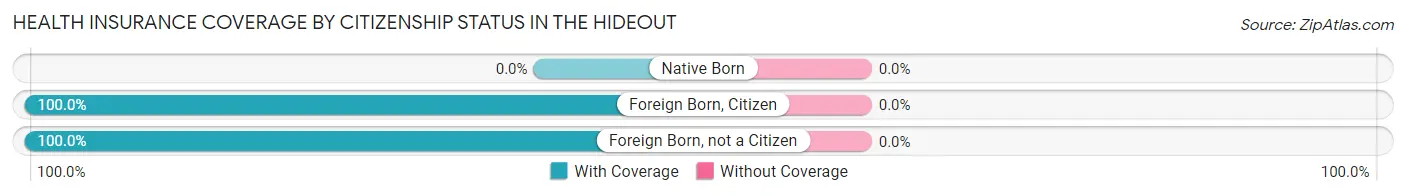
| Citizenship Status | With Coverage | Without Coverage |
| Native Born | 0 (0.0%) | 0 (0.0%) |
| Foreign Born, Citizen | 138 (100.0%) | 0 (0.0%) |
| Foreign Born, not a Citizen | 41 (100.0%) | 0 (0.0%) |
Health Insurance Coverage by Household Income in The Hideout
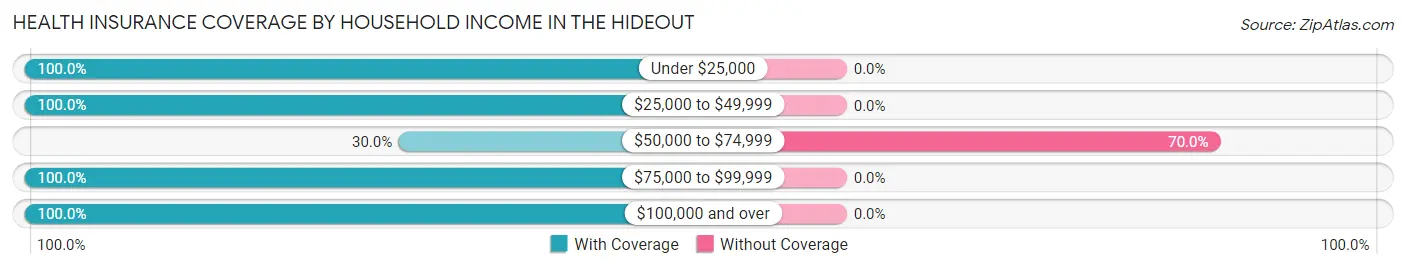
| Household Income | With Coverage | Without Coverage |
| Under $25,000 | 307 (100.0%) | 0 (0.0%) |
| $25,000 to $49,999 | 501 (100.0%) | 0 (0.0%) |
| $50,000 to $74,999 | 88 (30.0%) | 205 (70.0%) |
| $75,000 to $99,999 | 492 (100.0%) | 0 (0.0%) |
| $100,000 and over | 476 (100.0%) | 0 (0.0%) |
Public vs Private Health Insurance Coverage by Age in The Hideout
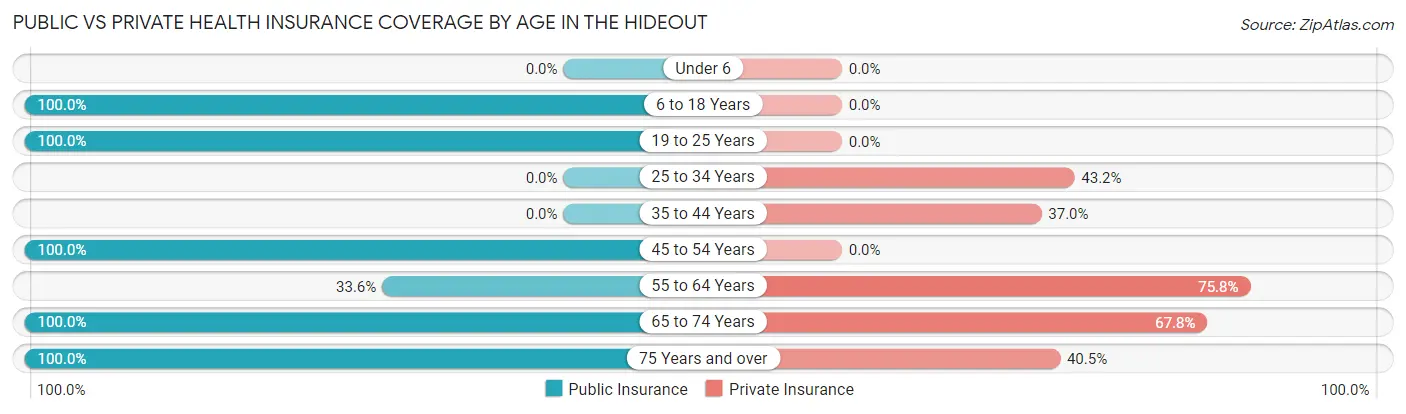
| Age Bracket | Public Insurance | Private Insurance |
| Under 6 | 0 (0.0%) | 0 (0.0%) |
| 6 to 18 Years | 138 (100.0%) | 0 (0.0%) |
| 19 to 25 Years | 41 (100.0%) | 0 (0.0%) |
| 25 to 34 Years | 0 (0.0%) | 117 (43.2%) |
| 35 to 44 Years | 0 (0.0%) | 30 (37.0%) |
| 45 to 54 Years | 107 (100.0%) | 0 (0.0%) |
| 55 to 64 Years | 185 (33.6%) | 417 (75.8%) |
| 65 to 74 Years | 286 (100.0%) | 194 (67.8%) |
| 75 Years and over | 595 (100.0%) | 241 (40.5%) |
| Total | 1,352 (65.3%) | 999 (48.3%) |
Disability Status by Sex by Age in The Hideout
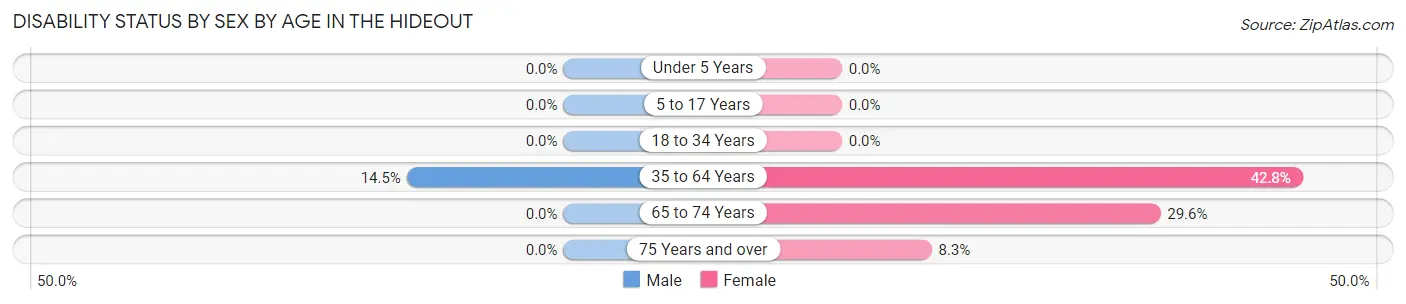
| Age Bracket | Male | Female |
| Under 5 Years | 0 (0.0%) | 0 (0.0%) |
| 5 to 17 Years | 0 (0.0%) | 0 (0.0%) |
| 18 to 34 Years | 0 (0.0%) | 0 (0.0%) |
| 35 to 64 Years | 57 (14.5%) | 148 (42.8%) |
| 65 to 74 Years | 0 (0.0%) | 60 (29.6%) |
| 75 Years and over | 0 (0.0%) | 16 (8.3%) |
Disability Class by Sex by Age in The Hideout
Disability Class: Hearing Difficulty
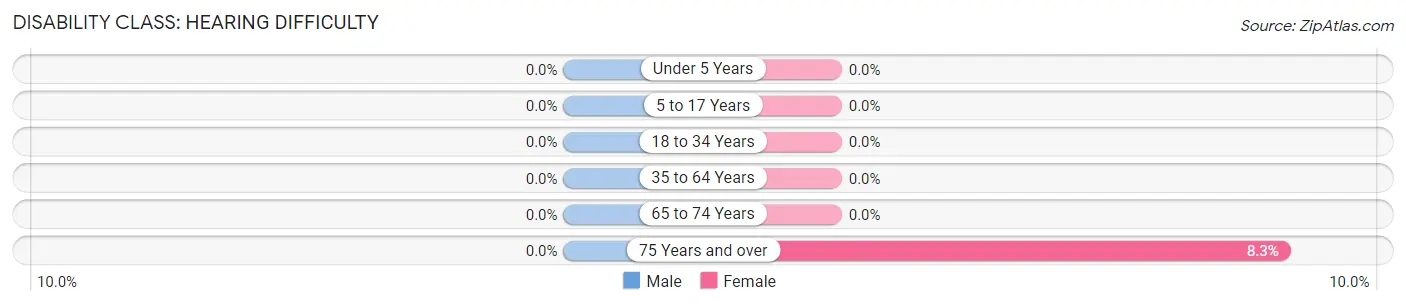
| Age Bracket | Male | Female |
| Under 5 Years | 0 (0.0%) | 0 (0.0%) |
| 5 to 17 Years | 0 (0.0%) | 0 (0.0%) |
| 18 to 34 Years | 0 (0.0%) | 0 (0.0%) |
| 35 to 64 Years | 0 (0.0%) | 0 (0.0%) |
| 65 to 74 Years | 0 (0.0%) | 0 (0.0%) |
| 75 Years and over | 0 (0.0%) | 16 (8.3%) |
Disability Class: Vision Difficulty
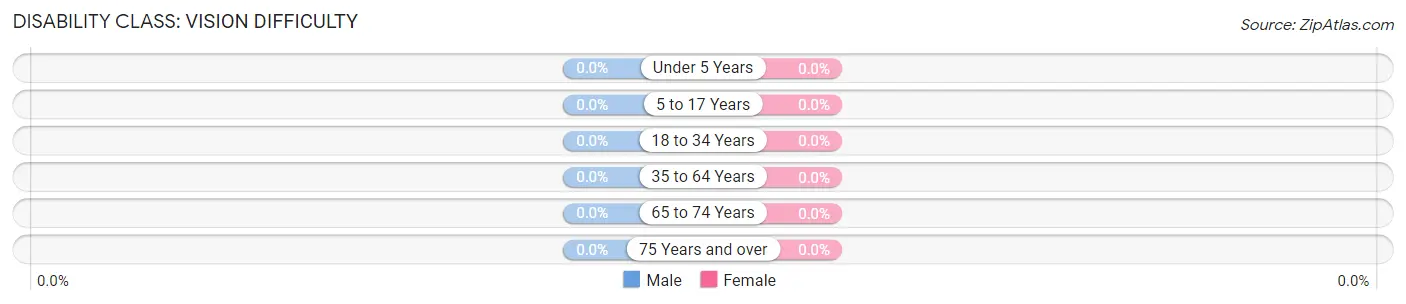
| Age Bracket | Male | Female |
| Under 5 Years | 0 (0.0%) | 0 (0.0%) |
| 5 to 17 Years | 0 (0.0%) | 0 (0.0%) |
| 18 to 34 Years | 0 (0.0%) | 0 (0.0%) |
| 35 to 64 Years | 0 (0.0%) | 0 (0.0%) |
| 65 to 74 Years | 0 (0.0%) | 0 (0.0%) |
| 75 Years and over | 0 (0.0%) | 0 (0.0%) |
Disability Class: Cognitive Difficulty
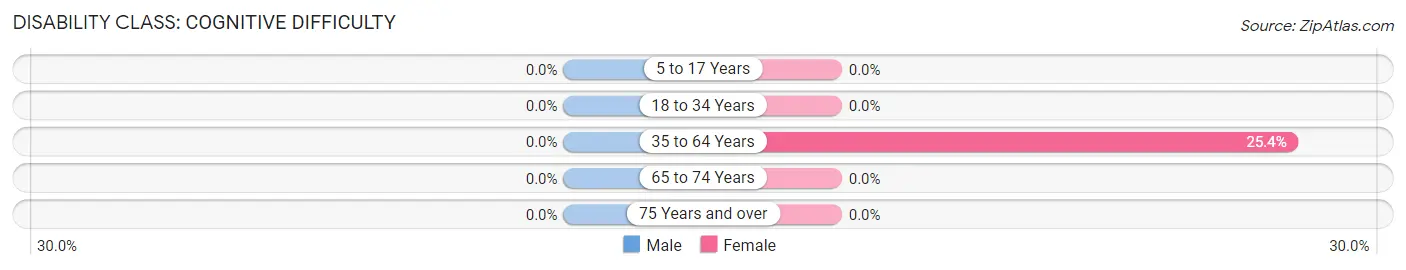
| Age Bracket | Male | Female |
| 5 to 17 Years | 0 (0.0%) | 0 (0.0%) |
| 18 to 34 Years | 0 (0.0%) | 0 (0.0%) |
| 35 to 64 Years | 0 (0.0%) | 88 (25.4%) |
| 65 to 74 Years | 0 (0.0%) | 0 (0.0%) |
| 75 Years and over | 0 (0.0%) | 0 (0.0%) |
Disability Class: Ambulatory Difficulty
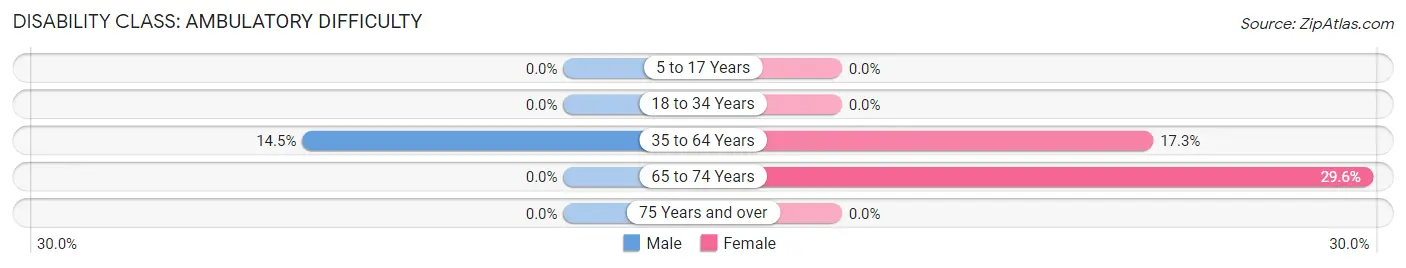
| Age Bracket | Male | Female |
| 5 to 17 Years | 0 (0.0%) | 0 (0.0%) |
| 18 to 34 Years | 0 (0.0%) | 0 (0.0%) |
| 35 to 64 Years | 57 (14.5%) | 60 (17.3%) |
| 65 to 74 Years | 0 (0.0%) | 60 (29.6%) |
| 75 Years and over | 0 (0.0%) | 0 (0.0%) |
Disability Class: Self-Care Difficulty
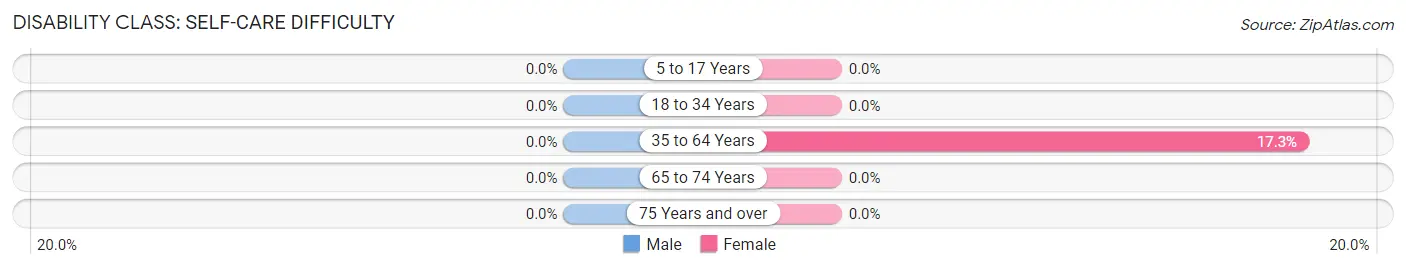
| Age Bracket | Male | Female |
| 5 to 17 Years | 0 (0.0%) | 0 (0.0%) |
| 18 to 34 Years | 0 (0.0%) | 0 (0.0%) |
| 35 to 64 Years | 0 (0.0%) | 60 (17.3%) |
| 65 to 74 Years | 0 (0.0%) | 0 (0.0%) |
| 75 Years and over | 0 (0.0%) | 0 (0.0%) |
Technology Access in The Hideout
Computing Device Access in The Hideout
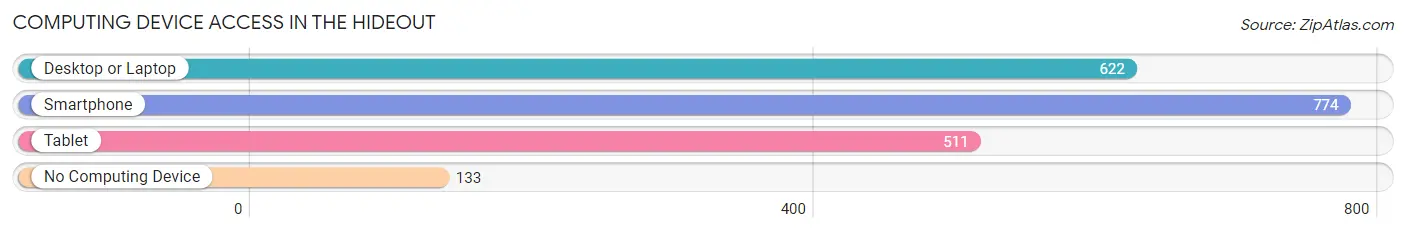
| Device Type | # Households | % Households |
| Desktop or Laptop | 622 | 63.9% |
| Smartphone | 774 | 79.5% |
| Tablet | 511 | 52.5% |
| No Computing Device | 133 | 13.7% |
| Total | 973 | 100.0% |
Internet Access in The Hideout
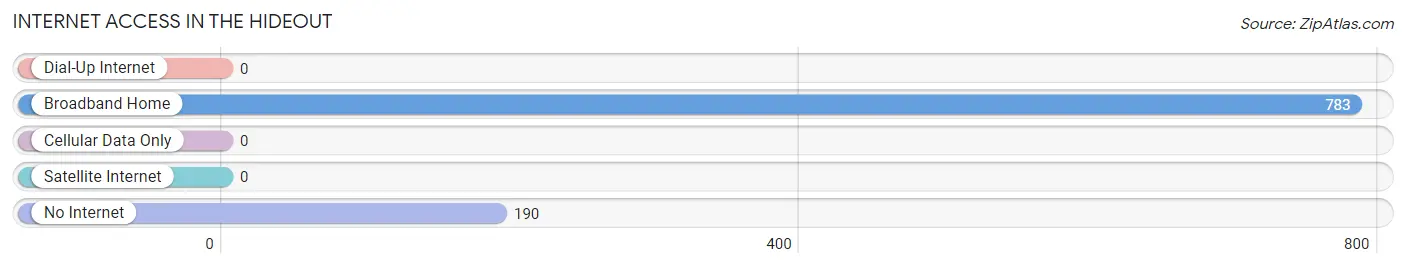
| Internet Type | # Households | % Households |
| Dial-Up Internet | 0 | 0.0% |
| Broadband Home | 783 | 80.5% |
| Cellular Data Only | 0 | 0.0% |
| Satellite Internet | 0 | 0.0% |
| No Internet | 190 | 19.5% |
| Total | 973 | 100.0% |
The Hideout Summary
The Hideout is a private residential community located in the Pocono Mountains of northeastern Pennsylvania. It is situated in the borough of Lake Ariel, Wayne County, and is bordered by the townships of Salem, Lake, and Paupack. The Hideout is a popular vacation destination for those seeking a peaceful and serene atmosphere.
History
The Hideout was founded in 1965 by a group of investors led by Robert and Mary Ann Smith. The Smiths purchased the land from the Pennsylvania Power and Light Company and began developing the area into a residential community. The Hideout was originally intended to be a summer vacation spot for the Smiths and their friends, but it quickly grew in popularity and became a full-time residential community.
The Hideout was officially incorporated in 1971 and has since grown to include over 3,000 homes and over 5,000 residents. The community is governed by a Board of Directors and is managed by a professional staff. The Hideout is a private, gated community and is not open to the public.
Geography
The Hideout is located in the Pocono Mountains of northeastern Pennsylvania. It is situated in the borough of Lake Ariel, Wayne County, and is bordered by the townships of Salem, Lake, and Paupack. The Hideout is located approximately 90 miles from New York City and 60 miles from Philadelphia.
The Hideout is situated on a plateau surrounded by the Pocono Mountains. The terrain is mostly flat with some rolling hills. The area is heavily forested and is home to a variety of wildlife, including deer, bear, and wild turkey.
Economy
The Hideout is a residential community and does not have a traditional economy. However, the community does have a variety of businesses and services that cater to the needs of its residents. These include restaurants, grocery stores, banks, and other retail establishments.
The Hideout also has a number of recreational activities and amenities, including golf courses, tennis courts, swimming pools, and a lake. The community also has a variety of parks and trails for hiking, biking, and other outdoor activities.
Demographics
As of the 2010 census, the Hideout had a population of 5,068. The population is predominantly white (94.3%) and the median age is 48. The median household income is $63,917 and the median home value is $220,000.
The Hideout is a popular vacation destination for those seeking a peaceful and serene atmosphere. The community is well-maintained and offers a variety of recreational activities and amenities. The Hideout is a great place to live, work, and play.
Common Questions
What is Per Capita Income in The Hideout?
Per Capita income in The Hideout is $34,791.
What is the Median Family Income in The Hideout?
Median Family Income in The Hideout is $75,399.
What is the Median Household income in The Hideout?
Median Household Income in The Hideout is $52,854.
What is Inequality or Gini Index in The Hideout?
Inequality or Gini Index in The Hideout is 0.42.
What is the Total Population of The Hideout?
Total Population of The Hideout is 2,069.
What is the Total Male Population of The Hideout?
Total Male Population of The Hideout is 1,016.
What is the Total Female Population of The Hideout?
Total Female Population of The Hideout is 1,053.
What is the Ratio of Males per 100 Females in The Hideout?
There are 96.49 Males per 100 Females in The Hideout.
What is the Ratio of Females per 100 Males in The Hideout?
There are 103.64 Females per 100 Males in The Hideout.
What is the Median Population Age in The Hideout?
Median Population Age in The Hideout is 61.5 Years.
What is the Average Family Size in The Hideout
Average Family Size in The Hideout is 2.6 People.
What is the Average Household Size in The Hideout
Average Household Size in The Hideout is 2.1 People.
How Large is the Labor Force in The Hideout?
There are 603 People in the Labor Forcein in The Hideout.
What is the Percentage of People in the Labor Force in The Hideout?
30.6% of People are in the Labor Force in The Hideout.
What is the Unemployment Rate in The Hideout?
Unemployment Rate in The Hideout is 6.8%.