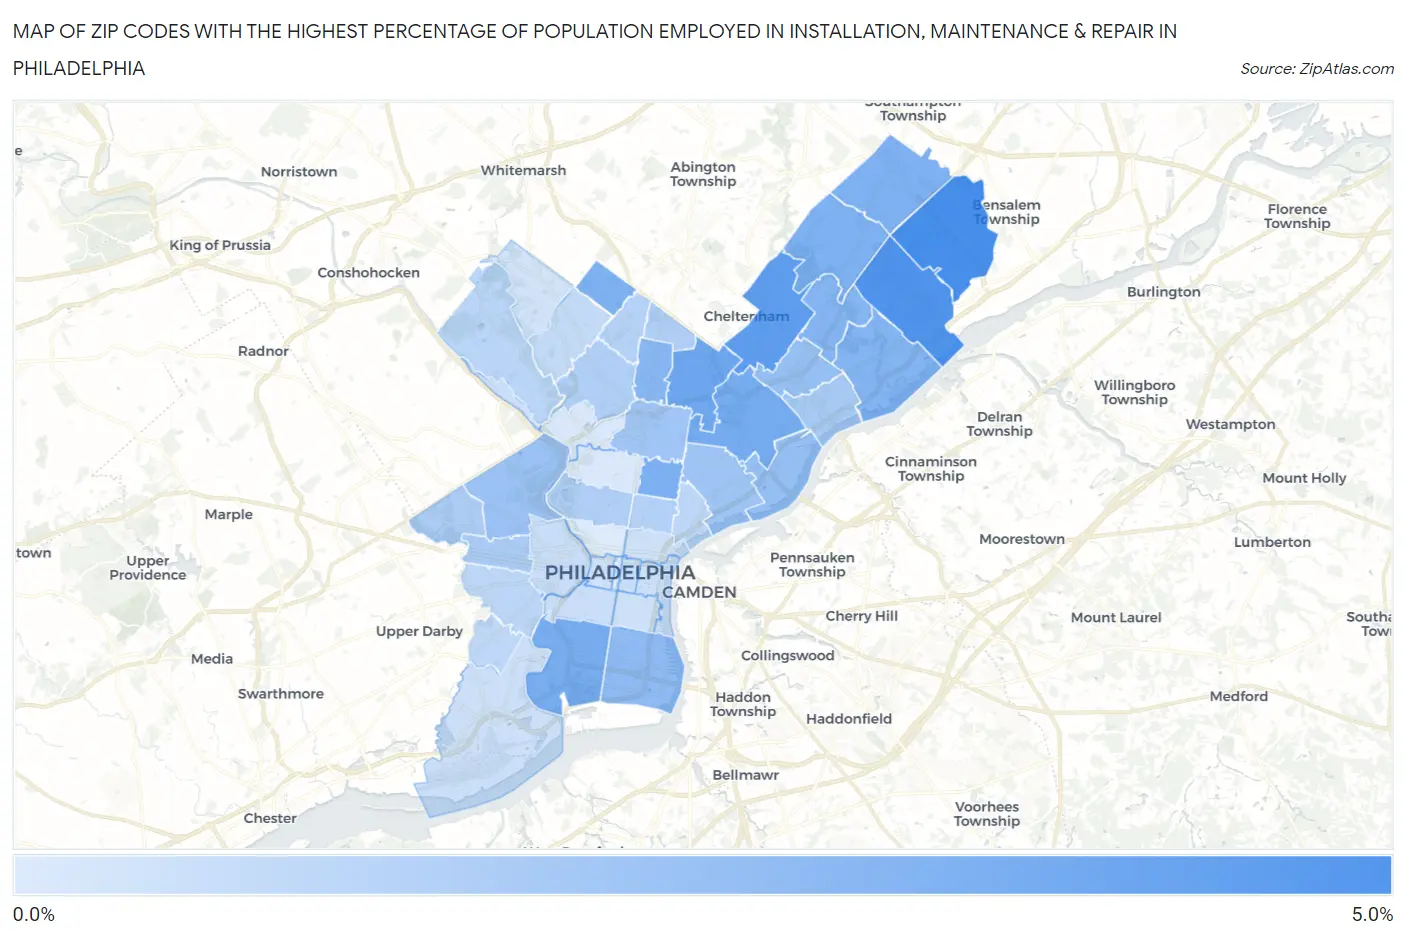
Zip Codes with the Highest Percentage of Population Employed in Installation, Maintenance & Repair in Philadelphia, PA
RELATED REPORTS & OPTIONS
Installation, Maintenance & Repair
Philadelphia
Compare Zip Codes
Map of Zip Codes with the Highest Percentage of Population Employed in Installation, Maintenance & Repair in Philadelphia
0.15%
4.2%

Zip Codes with the Highest Percentage of Population Employed in Installation, Maintenance & Repair in Philadelphia, PA
| Zip Code | % Employed | vs State | vs National | |
| 1. | 19154 | 4.2% | 3.1%(+1.09)#681 | 3.1%(+1.12)#11,576 |
| 2. | 19114 | 4.0% | 3.1%(+0.912)#732 | 3.1%(+0.936)#12,342 |
| 3. | 19111 | 3.5% | 3.1%(+0.442)#872 | 3.1%(+0.466)#14,472 |
| 4. | 19120 | 3.1% | 3.1%(-0.003)#968 | 3.1%(+0.021)#16,577 |
| 5. | 19124 | 2.9% | 3.1%(-0.181)#1,013 | 3.1%(-0.156)#17,439 |
| 6. | 19145 | 2.9% | 3.1%(-0.200)#1,017 | 3.1%(-0.175)#17,540 |
| 7. | 19133 | 2.8% | 3.1%(-0.326)#1,045 | 3.1%(-0.301)#18,178 |
| 8. | 19116 | 2.7% | 3.1%(-0.401)#1,073 | 3.1%(-0.377)#18,597 |
| 9. | 19150 | 2.7% | 3.1%(-0.409)#1,077 | 3.1%(-0.384)#18,642 |
| 10. | 19115 | 2.6% | 3.1%(-0.448)#1,084 | 3.1%(-0.423)#18,845 |
| 11. | 19136 | 2.5% | 3.1%(-0.573)#1,107 | 3.1%(-0.548)#19,452 |
| 12. | 19152 | 2.5% | 3.1%(-0.611)#1,116 | 3.1%(-0.586)#19,634 |
| 13. | 19141 | 2.4% | 3.1%(-0.696)#1,143 | 3.1%(-0.672)#20,080 |
| 14. | 19148 | 2.2% | 3.1%(-0.860)#1,178 | 3.1%(-0.835)#20,918 |
| 15. | 19149 | 2.1% | 3.1%(-1.02)#1,211 | 3.1%(-0.996)#21,688 |
| 16. | 19137 | 2.1% | 3.1%(-1.03)#1,212 | 3.1%(-1.00)#21,706 |
| 17. | 19131 | 1.9% | 3.1%(-1.17)#1,243 | 3.1%(-1.14)#22,358 |
| 18. | 19134 | 1.8% | 3.1%(-1.29)#1,267 | 3.1%(-1.27)#22,892 |
| 19. | 19140 | 1.8% | 3.1%(-1.32)#1,273 | 3.1%(-1.30)#23,041 |
| 20. | 19135 | 1.6% | 3.1%(-1.51)#1,302 | 3.1%(-1.48)#23,822 |
| 21. | 19139 | 1.5% | 3.1%(-1.60)#1,319 | 3.1%(-1.58)#24,201 |
| 22. | 19151 | 1.4% | 3.1%(-1.65)#1,334 | 3.1%(-1.62)#24,379 |
| 23. | 19126 | 1.4% | 3.1%(-1.74)#1,354 | 3.1%(-1.72)#24,721 |
| 24. | 19144 | 1.3% | 3.1%(-1.75)#1,359 | 3.1%(-1.73)#24,775 |
| 25. | 19121 | 1.3% | 3.1%(-1.81)#1,365 | 3.1%(-1.78)#24,932 |
| 26. | 19122 | 1.3% | 3.1%(-1.82)#1,372 | 3.1%(-1.80)#24,997 |
| 27. | 19138 | 1.2% | 3.1%(-1.89)#1,392 | 3.1%(-1.87)#25,272 |
| 28. | 19128 | 1.1% | 3.1%(-2.00)#1,404 | 3.1%(-1.98)#25,629 |
| 29. | 19125 | 1.0% | 3.1%(-2.08)#1,415 | 3.1%(-2.06)#25,904 |
| 30. | 19143 | 0.98% | 3.1%(-2.11)#1,420 | 3.1%(-2.09)#25,982 |
| 31. | 19142 | 0.95% | 3.1%(-2.14)#1,426 | 3.1%(-2.11)#26,048 |
| 32. | 19119 | 0.82% | 3.1%(-2.27)#1,439 | 3.1%(-2.25)#26,431 |
| 33. | 19104 | 0.69% | 3.1%(-2.40)#1,455 | 3.1%(-2.37)#26,796 |
| 34. | 19107 | 0.69% | 3.1%(-2.40)#1,456 | 3.1%(-2.38)#26,803 |
| 35. | 19146 | 0.64% | 3.1%(-2.45)#1,462 | 3.1%(-2.42)#26,917 |
| 36. | 19153 | 0.58% | 3.1%(-2.51)#1,470 | 3.1%(-2.49)#27,041 |
| 37. | 19127 | 0.55% | 3.1%(-2.54)#1,475 | 3.1%(-2.52)#27,108 |
| 38. | 19147 | 0.52% | 3.1%(-2.57)#1,477 | 3.1%(-2.55)#27,170 |
| 39. | 19103 | 0.52% | 3.1%(-2.57)#1,478 | 3.1%(-2.55)#27,180 |
| 40. | 19106 | 0.51% | 3.1%(-2.58)#1,479 | 3.1%(-2.56)#27,194 |
| 41. | 19123 | 0.50% | 3.1%(-2.59)#1,480 | 3.1%(-2.57)#27,213 |
| 42. | 19118 | 0.48% | 3.1%(-2.61)#1,481 | 3.1%(-2.59)#27,259 |
| 43. | 19129 | 0.22% | 3.1%(-2.87)#1,497 | 3.1%(-2.85)#27,665 |
| 44. | 19132 | 0.22% | 3.1%(-2.87)#1,498 | 3.1%(-2.85)#27,667 |
| 45. | 19102 | 0.17% | 3.1%(-2.93)#1,500 | 3.1%(-2.90)#27,718 |
| 46. | 19130 | 0.15% | 3.1%(-2.94)#1,503 | 3.1%(-2.92)#27,732 |
1
Common Questions
What are the Top 10 Zip Codes with the Highest Percentage of Population Employed in Installation, Maintenance & Repair in Philadelphia, PA?
Top 10 Zip Codes with the Highest Percentage of Population Employed in Installation, Maintenance & Repair in Philadelphia, PA are:
What zip code has the Highest Percentage of Population Employed in Installation, Maintenance & Repair in Philadelphia, PA?
19154 has the Highest Percentage of Population Employed in Installation, Maintenance & Repair in Philadelphia, PA with 4.2%.
What is the Percentage of Population Employed in Installation, Maintenance & Repair in Philadelphia, PA?
Percentage of Population Employed in Installation, Maintenance & Repair in Philadelphia is 1.7%.
What is the Percentage of Population Employed in Installation, Maintenance & Repair in Pennsylvania?
Percentage of Population Employed in Installation, Maintenance & Repair in Pennsylvania is 3.1%.
What is the Percentage of Population Employed in Installation, Maintenance & Repair in the United States?
Percentage of Population Employed in Installation, Maintenance & Repair in the United States is 3.1%.