Zip Codes with the Highest Percentage of Population Employed in Installation, Maintenance & Repair in Pennsylvania
RELATED REPORTS & OPTIONS
Installation, Maintenance & Repair
Pennsylvania
Compare Zip Codes
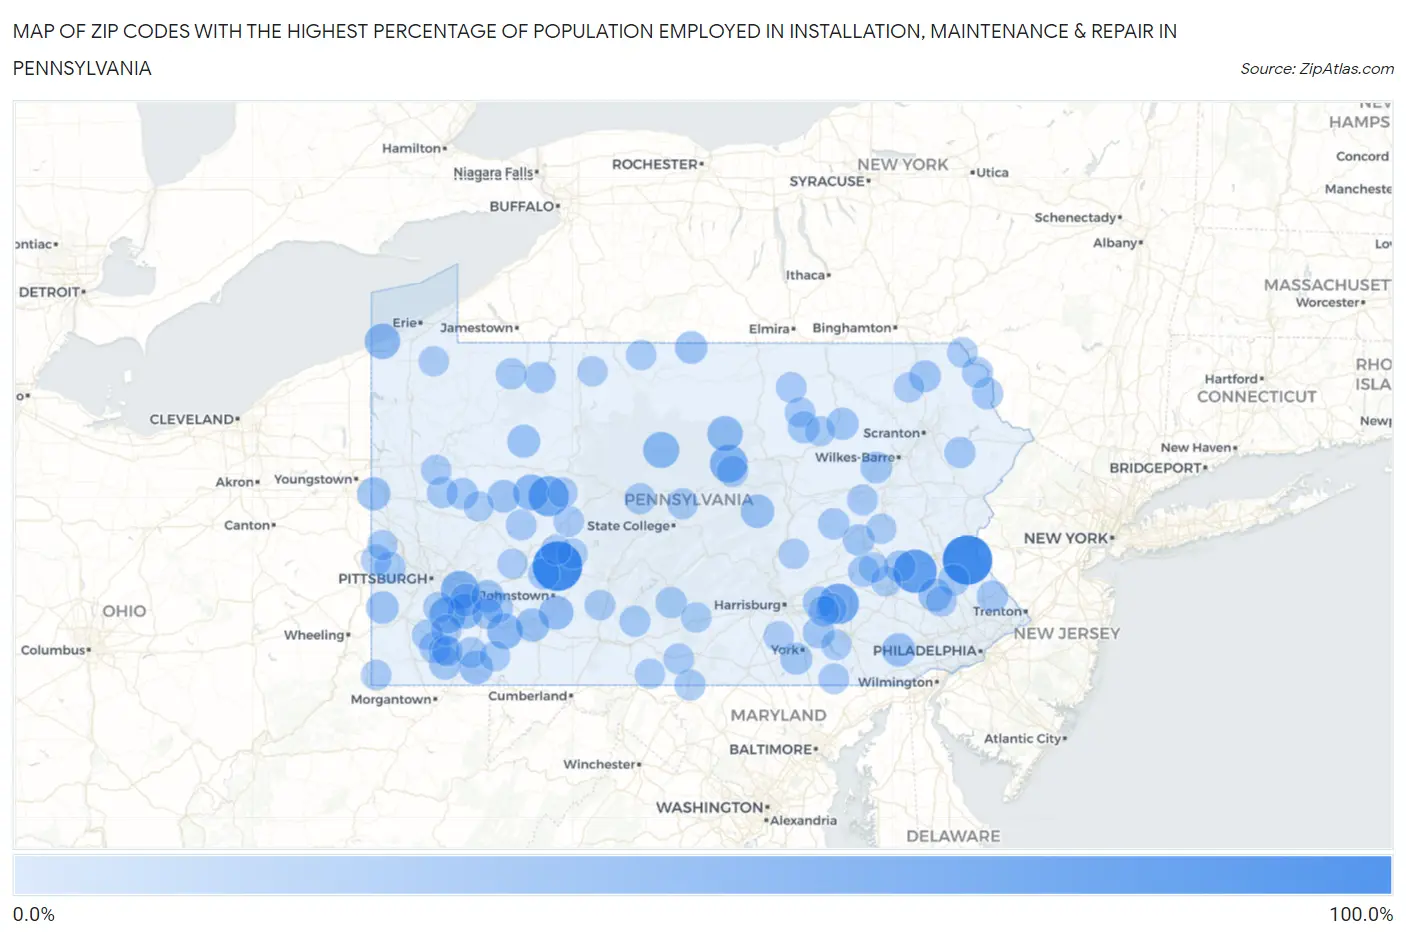
Map of Zip Codes with the Highest Percentage of Population Employed in Installation, Maintenance & Repair in Pennsylvania
0.0%
100.0%
Zip Codes with the Highest Percentage of Population Employed in Installation, Maintenance & Repair in Pennsylvania
| Zip Code | % Employed | vs State | vs National | |
| 1. | 18081 | 100.0% | 3.1%(+96.9)#1 | 3.1%(+96.9)#6 |
| 2. | 15922 | 100.0% | 3.1%(+96.9)#2 | 3.1%(+96.9)#7 |
| 3. | 19511 | 71.7% | 3.1%(+68.6)#3 | 3.1%(+68.6)#18 |
| 4. | 17016 | 56.6% | 3.1%(+53.6)#4 | 3.1%(+53.6)#37 |
| 5. | 15733 | 56.0% | 3.1%(+52.9)#5 | 3.1%(+52.9)#39 |
| 6. | 15615 | 46.0% | 3.1%(+42.9)#6 | 3.1%(+43.0)#58 |
| 7. | 17779 | 43.9% | 3.1%(+40.8)#7 | 3.1%(+40.8)#75 |
| 8. | 15087 | 37.9% | 3.1%(+34.8)#8 | 3.1%(+34.9)#106 |
| 9. | 17778 | 37.3% | 3.1%(+34.2)#9 | 3.1%(+34.2)#112 |
| 10. | 15776 | 36.4% | 3.1%(+33.3)#10 | 3.1%(+33.3)#117 |
| 11. | 15646 | 35.0% | 3.1%(+31.9)#11 | 3.1%(+31.9)#127 |
| 12. | 16430 | 34.1% | 3.1%(+31.0)#12 | 3.1%(+31.0)#130 |
| 13. | 17739 | 33.3% | 3.1%(+30.2)#13 | 3.1%(+30.3)#141 |
| 14. | 15698 | 32.8% | 3.1%(+29.8)#14 | 3.1%(+29.8)#144 |
| 15. | 15953 | 28.2% | 3.1%(+25.1)#15 | 3.1%(+25.1)#190 |
| 16. | 15544 | 25.4% | 3.1%(+22.4)#16 | 3.1%(+22.4)#235 |
| 17. | 19367 | 25.0% | 3.1%(+21.9)#17 | 3.1%(+21.9)#245 |
| 18. | 15421 | 25.0% | 3.1%(+21.9)#18 | 3.1%(+21.9)#248 |
| 19. | 17880 | 25.0% | 3.1%(+21.9)#19 | 3.1%(+21.9)#250 |
| 20. | 19435 | 24.4% | 3.1%(+21.3)#20 | 3.1%(+21.4)#257 |
| 21. | 16132 | 23.9% | 3.1%(+20.8)#21 | 3.1%(+20.8)#265 |
| 22. | 16217 | 22.9% | 3.1%(+19.8)#22 | 3.1%(+19.8)#298 |
| 23. | 15691 | 21.3% | 3.1%(+18.2)#23 | 3.1%(+18.2)#340 |
| 24. | 16223 | 21.3% | 3.1%(+18.2)#24 | 3.1%(+18.2)#341 |
| 25. | 16937 | 20.6% | 3.1%(+17.5)#25 | 3.1%(+17.5)#363 |
| 26. | 15379 | 20.6% | 3.1%(+17.5)#26 | 3.1%(+17.5)#365 |
| 27. | 15619 | 20.2% | 3.1%(+17.1)#27 | 3.1%(+17.1)#389 |
| 28. | 18632 | 18.7% | 3.1%(+15.6)#28 | 3.1%(+15.6)#461 |
| 29. | 17010 | 18.2% | 3.1%(+15.1)#29 | 3.1%(+15.1)#495 |
| 30. | 17371 | 18.1% | 3.1%(+15.0)#30 | 3.1%(+15.0)#511 |
| 31. | 15454 | 18.1% | 3.1%(+15.0)#31 | 3.1%(+15.0)#514 |
| 32. | 18820 | 17.6% | 3.1%(+14.6)#32 | 3.1%(+14.6)#544 |
| 33. | 17550 | 17.6% | 3.1%(+14.5)#33 | 3.1%(+14.5)#549 |
| 34. | 17974 | 17.2% | 3.1%(+14.1)#34 | 3.1%(+14.1)#574 |
| 35. | 18619 | 17.1% | 3.1%(+14.1)#35 | 3.1%(+14.1)#579 |
| 36. | 19564 | 16.8% | 3.1%(+13.7)#36 | 3.1%(+13.7)#597 |
| 37. | 18617 | 16.6% | 3.1%(+13.5)#37 | 3.1%(+13.6)#622 |
| 38. | 15433 | 16.5% | 3.1%(+13.4)#38 | 3.1%(+13.4)#636 |
| 39. | 16041 | 16.4% | 3.1%(+13.3)#39 | 3.1%(+13.4)#639 |
| 40. | 15929 | 16.3% | 3.1%(+13.2)#40 | 3.1%(+13.3)#650 |
| 41. | 18935 | 16.2% | 3.1%(+13.1)#41 | 3.1%(+13.2)#656 |
| 42. | 16352 | 15.6% | 3.1%(+12.5)#42 | 3.1%(+12.5)#726 |
| 43. | 18912 | 15.6% | 3.1%(+12.5)#43 | 3.1%(+12.5)#730 |
| 44. | 17748 | 15.3% | 3.1%(+12.2)#44 | 3.1%(+12.2)#754 |
| 45. | 19559 | 15.3% | 3.1%(+12.2)#45 | 3.1%(+12.2)#755 |
| 46. | 18443 | 15.1% | 3.1%(+12.0)#46 | 3.1%(+12.0)#771 |
| 47. | 18460 | 15.0% | 3.1%(+11.9)#47 | 3.1%(+11.9)#779 |
| 48. | 16329 | 14.7% | 3.1%(+11.6)#48 | 3.1%(+11.6)#819 |
| 49. | 17260 | 14.7% | 3.1%(+11.6)#49 | 3.1%(+11.6)#821 |
| 50. | 17832 | 14.6% | 3.1%(+11.6)#50 | 3.1%(+11.6)#825 |
| 51. | 15026 | 14.5% | 3.1%(+11.4)#51 | 3.1%(+11.5)#844 |
| 52. | 15693 | 14.4% | 3.1%(+11.3)#52 | 3.1%(+11.4)#863 |
| 53. | 15038 | 14.3% | 3.1%(+11.2)#53 | 3.1%(+11.2)#884 |
| 54. | 17064 | 14.1% | 3.1%(+11.0)#54 | 3.1%(+11.1)#909 |
| 55. | 16879 | 14.0% | 3.1%(+11.0)#55 | 3.1%(+11.0)#918 |
| 56. | 15313 | 14.0% | 3.1%(+10.9)#56 | 3.1%(+11.0)#920 |
| 57. | 16061 | 14.0% | 3.1%(+10.9)#57 | 3.1%(+10.9)#925 |
| 58. | 17041 | 14.0% | 3.1%(+10.9)#58 | 3.1%(+10.9)#929 |
| 59. | 18417 | 13.8% | 3.1%(+10.7)#59 | 3.1%(+10.7)#966 |
| 60. | 17263 | 13.7% | 3.1%(+10.6)#60 | 3.1%(+10.7)#970 |
| 61. | 16679 | 13.7% | 3.1%(+10.6)#61 | 3.1%(+10.7)#971 |
| 62. | 15465 | 13.3% | 3.1%(+10.2)#62 | 3.1%(+10.3)#1,036 |
| 63. | 15674 | 13.3% | 3.1%(+10.2)#63 | 3.1%(+10.2)#1,046 |
| 64. | 16853 | 13.2% | 3.1%(+10.1)#64 | 3.1%(+10.1)#1,067 |
| 65. | 15043 | 13.1% | 3.1%(+10.0)#65 | 3.1%(+10.1)#1,073 |
| 66. | 15475 | 12.9% | 3.1%(+9.81)#66 | 3.1%(+9.84)#1,115 |
| 67. | 16211 | 12.9% | 3.1%(+9.81)#67 | 3.1%(+9.84)#1,118 |
| 68. | 18246 | 12.8% | 3.1%(+9.69)#68 | 3.1%(+9.71)#1,142 |
| 69. | 15412 | 12.5% | 3.1%(+9.41)#69 | 3.1%(+9.43)#1,203 |
| 70. | 15721 | 12.5% | 3.1%(+9.41)#70 | 3.1%(+9.43)#1,206 |
| 71. | 19492 | 12.3% | 3.1%(+9.25)#71 | 3.1%(+9.27)#1,238 |
| 72. | 17321 | 12.2% | 3.1%(+9.10)#72 | 3.1%(+9.13)#1,269 |
| 73. | 17252 | 12.2% | 3.1%(+9.09)#73 | 3.1%(+9.11)#1,277 |
| 74. | 15468 | 12.2% | 3.1%(+9.06)#74 | 3.1%(+9.08)#1,282 |
| 75. | 16910 | 12.1% | 3.1%(+9.03)#75 | 3.1%(+9.05)#1,290 |
| 76. | 18461 | 12.0% | 3.1%(+8.94)#76 | 3.1%(+8.97)#1,312 |
| 77. | 16670 | 11.8% | 3.1%(+8.67)#77 | 3.1%(+8.70)#1,386 |
| 78. | 17768 | 11.7% | 3.1%(+8.64)#78 | 3.1%(+8.66)#1,392 |
| 79. | 17210 | 11.5% | 3.1%(+8.38)#79 | 3.1%(+8.41)#1,463 |
| 80. | 15737 | 11.3% | 3.1%(+8.23)#80 | 3.1%(+8.25)#1,515 |
| 81. | 15310 | 11.3% | 3.1%(+8.20)#81 | 3.1%(+8.22)#1,529 |
| 82. | 15761 | 11.3% | 3.1%(+8.20)#82 | 3.1%(+8.22)#1,530 |
| 83. | 16038 | 11.2% | 3.1%(+8.13)#83 | 3.1%(+8.15)#1,546 |
| 84. | 17582 | 11.2% | 3.1%(+8.07)#84 | 3.1%(+8.10)#1,564 |
| 85. | 15464 | 11.1% | 3.1%(+8.05)#85 | 3.1%(+8.07)#1,573 |
| 86. | 16748 | 11.0% | 3.1%(+7.94)#86 | 3.1%(+7.97)#1,617 |
| 87. | 17731 | 10.9% | 3.1%(+7.85)#87 | 3.1%(+7.87)#1,640 |
| 88. | 15863 | 10.9% | 3.1%(+7.82)#88 | 3.1%(+7.84)#1,652 |
| 89. | 17005 | 10.9% | 3.1%(+7.78)#89 | 3.1%(+7.80)#1,666 |
| 90. | 17365 | 10.8% | 3.1%(+7.73)#90 | 3.1%(+7.75)#1,684 |
| 91. | 16427 | 10.8% | 3.1%(+7.66)#91 | 3.1%(+7.69)#1,700 |
| 92. | 19533 | 10.7% | 3.1%(+7.65)#92 | 3.1%(+7.68)#1,701 |
| 93. | 15752 | 10.7% | 3.1%(+7.62)#93 | 3.1%(+7.65)#1,716 |
| 94. | 18824 | 10.6% | 3.1%(+7.53)#94 | 3.1%(+7.56)#1,752 |
| 95. | 16726 | 10.5% | 3.1%(+7.43)#95 | 3.1%(+7.46)#1,789 |
| 96. | 17982 | 10.5% | 3.1%(+7.43)#96 | 3.1%(+7.46)#1,790 |
| 97. | 16218 | 10.5% | 3.1%(+7.36)#97 | 3.1%(+7.39)#1,824 |
| 98. | 19554 | 10.4% | 3.1%(+7.28)#98 | 3.1%(+7.30)#1,857 |
| 99. | 15052 | 10.3% | 3.1%(+7.25)#99 | 3.1%(+7.27)#1,871 |
| 100. | 17212 | 10.3% | 3.1%(+7.20)#100 | 3.1%(+7.22)#1,893 |
Common Questions
What are the Top 10 Zip Codes with the Highest Percentage of Population Employed in Installation, Maintenance & Repair in Pennsylvania?
Top 10 Zip Codes with the Highest Percentage of Population Employed in Installation, Maintenance & Repair in Pennsylvania are:
What zip code has the Highest Percentage of Population Employed in Installation, Maintenance & Repair in Pennsylvania?
18081 has the Highest Percentage of Population Employed in Installation, Maintenance & Repair in Pennsylvania with 100.0%.
What is the Percentage of Population Employed in Installation, Maintenance & Repair in the State of Pennsylvania?
Percentage of Population Employed in Installation, Maintenance & Repair in Pennsylvania is 3.1%.
What is the Percentage of Population Employed in Installation, Maintenance & Repair in the United States?
Percentage of Population Employed in Installation, Maintenance & Repair in the United States is 3.1%.