Lincolnville, PA Map & Demographics
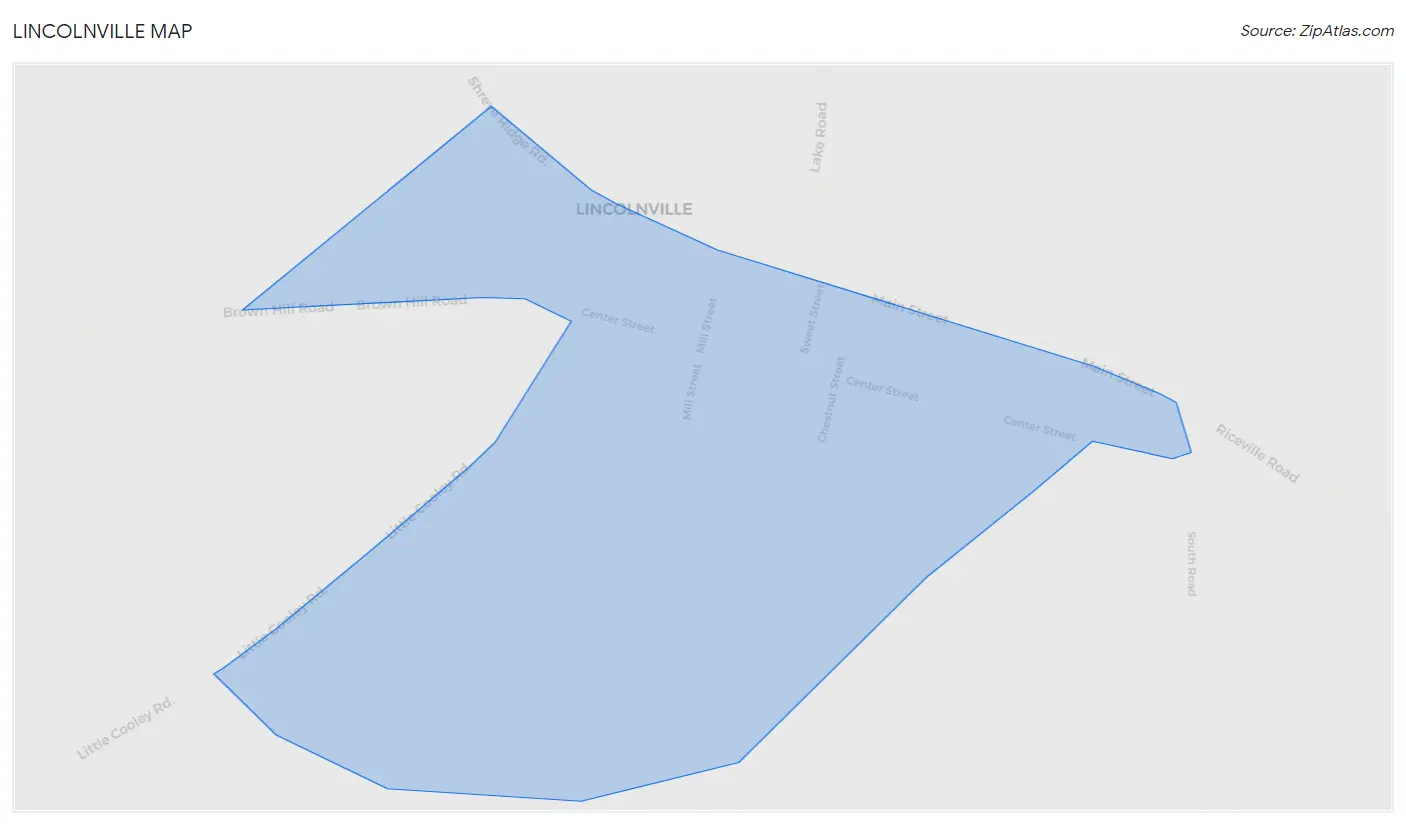
Lincolnville Map
Lincolnville Overview
$28,552
PER CAPITA INCOME
$51,250
AVG FAMILY INCOME
$49,219
AVG HOUSEHOLD INCOME
0.31
INEQUALITY / GINI INDEX
62
TOTAL POPULATION
39
MALE POPULATION
23
FEMALE POPULATION
169.57
MALES / 100 FEMALES
58.97
FEMALES / 100 MALES
64.3
MEDIAN AGE
2.7
AVG FAMILY SIZE
2.1
AVG HOUSEHOLD SIZE
26
LABOR FORCE [ PEOPLE ]
44.1%
PERCENT IN LABOR FORCE
Income in Lincolnville
Income Overview in Lincolnville
Per Capita Income in Lincolnville is $28,552, while median incomes of families and households are $51,250 and $49,219 respectively.
| Characteristic | Number | Measure |
| Per Capita Income | 62 | $28,552 |
| Median Family Income | 16 | $51,250 |
| Mean Family Income | 16 | $60,388 |
| Median Household Income | 29 | $49,219 |
| Mean Household Income | 29 | $53,490 |
| Income Deficit | 16 | $0 |
| Wage / Income Gap (%) | 62 | 0.00% |
| Wage / Income Gap ($) | 62 | 100.00¢ per $1 |
| Gini / Inequality Index | 62 | 0.31 |
Earnings by Sex in Lincolnville
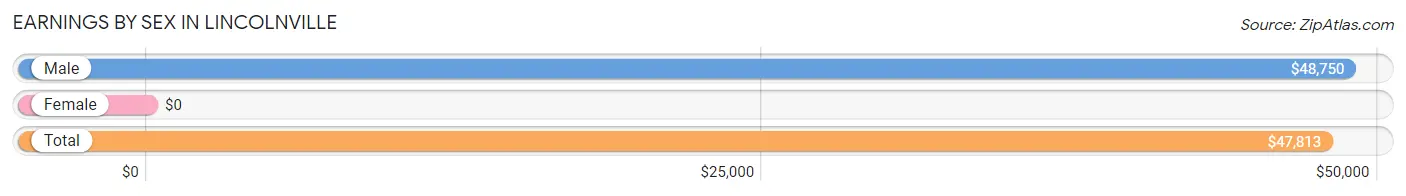
| Sex | Number | Average Earnings |
| Male | 16 (61.5%) | $48,750 |
| Female | 10 (38.5%) | $0 |
| Total | 26 (100.0%) | $47,813 |
Earnings by Sex by Income Bracket in Lincolnville
The most common earnings brackets in Lincolnville are $45,000 to $49,999 for men (8 | 50.0%) and $12,500 to $14,999 for women (5 | 50.0%).
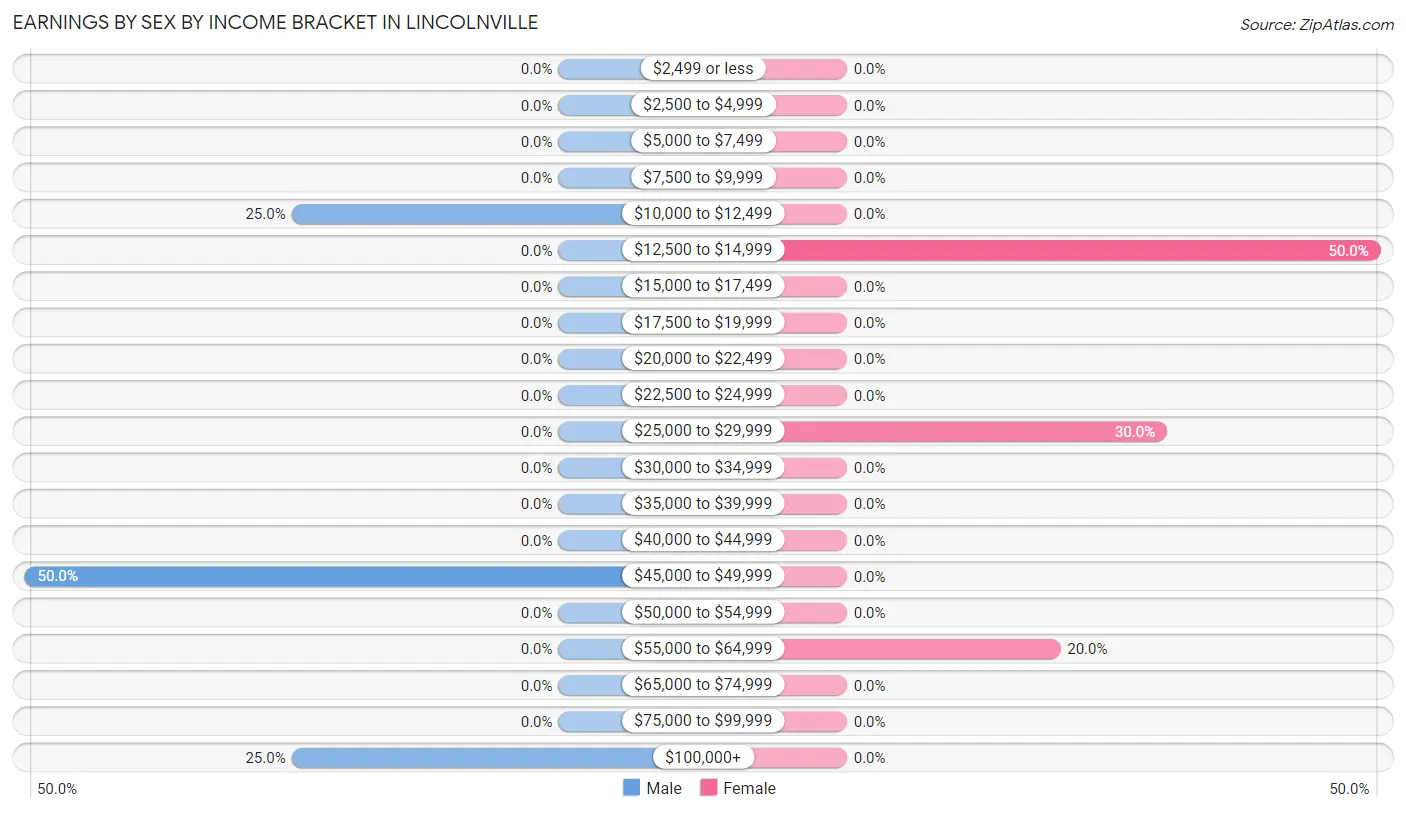
| Income | Male | Female |
| $2,499 or less | 0 (0.0%) | 0 (0.0%) |
| $2,500 to $4,999 | 0 (0.0%) | 0 (0.0%) |
| $5,000 to $7,499 | 0 (0.0%) | 0 (0.0%) |
| $7,500 to $9,999 | 0 (0.0%) | 0 (0.0%) |
| $10,000 to $12,499 | 4 (25.0%) | 0 (0.0%) |
| $12,500 to $14,999 | 0 (0.0%) | 5 (50.0%) |
| $15,000 to $17,499 | 0 (0.0%) | 0 (0.0%) |
| $17,500 to $19,999 | 0 (0.0%) | 0 (0.0%) |
| $20,000 to $22,499 | 0 (0.0%) | 0 (0.0%) |
| $22,500 to $24,999 | 0 (0.0%) | 0 (0.0%) |
| $25,000 to $29,999 | 0 (0.0%) | 3 (30.0%) |
| $30,000 to $34,999 | 0 (0.0%) | 0 (0.0%) |
| $35,000 to $39,999 | 0 (0.0%) | 0 (0.0%) |
| $40,000 to $44,999 | 0 (0.0%) | 0 (0.0%) |
| $45,000 to $49,999 | 8 (50.0%) | 0 (0.0%) |
| $50,000 to $54,999 | 0 (0.0%) | 0 (0.0%) |
| $55,000 to $64,999 | 0 (0.0%) | 2 (20.0%) |
| $65,000 to $74,999 | 0 (0.0%) | 0 (0.0%) |
| $75,000 to $99,999 | 0 (0.0%) | 0 (0.0%) |
| $100,000+ | 4 (25.0%) | 0 (0.0%) |
| Total | 16 (100.0%) | 10 (100.0%) |
Earnings by Sex by Educational Attainment in Lincolnville
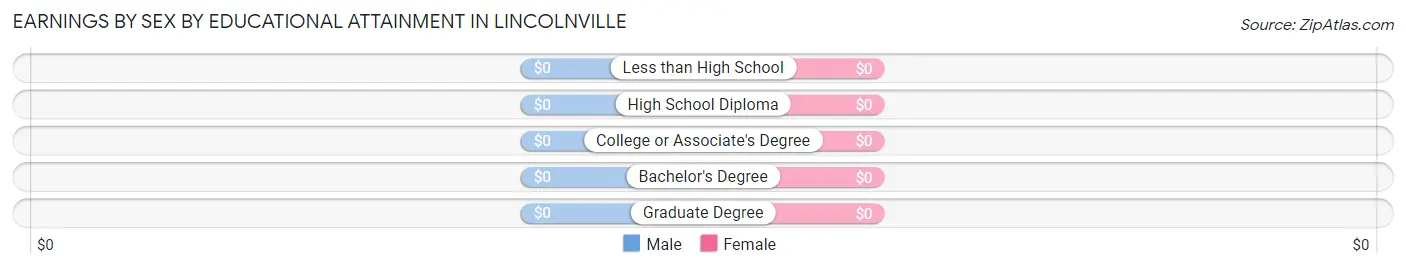
| Educational Attainment | Male Income | Female Income |
| Less than High School | - | - |
| High School Diploma | - | - |
| College or Associate's Degree | - | - |
| Bachelor's Degree | - | - |
| Graduate Degree | - | - |
| Total | $48,750 | $0 |
Family Income in Lincolnville
Family Income Brackets in Lincolnville
According to the Lincolnville family income data, there are 7 families falling into the $50,000 to $74,999 income range, which is the most common income bracket and makes up 43.8% of all families.
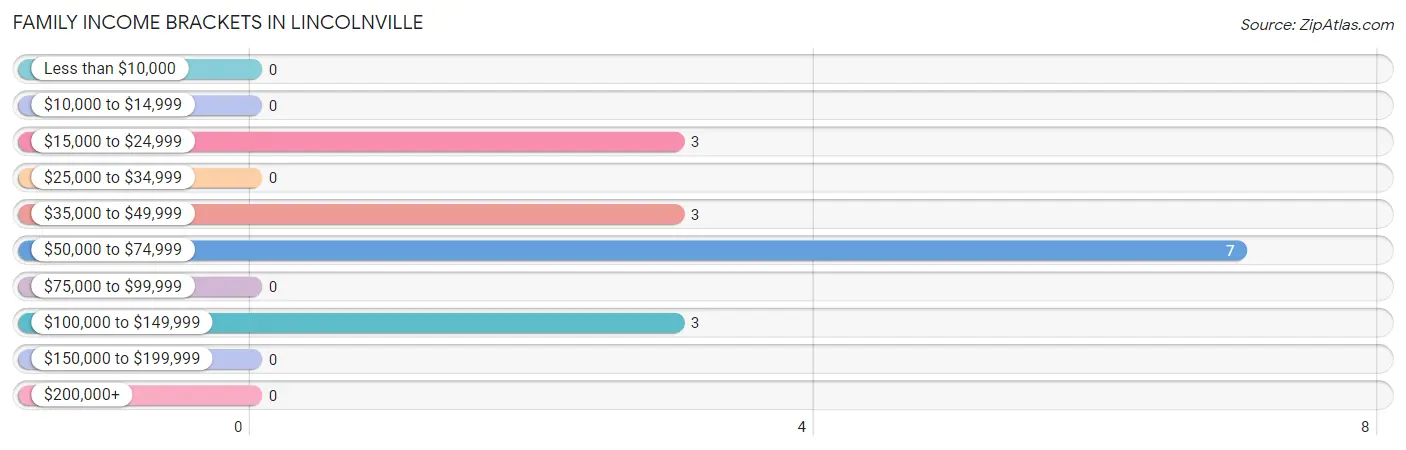
| Income Bracket | # Families | % Families |
| Less than $10,000 | 0 | 0.0% |
| $10,000 to $14,999 | 0 | 0.0% |
| $15,000 to $24,999 | 3 | 18.8% |
| $25,000 to $34,999 | 0 | 0.0% |
| $35,000 to $49,999 | 3 | 18.8% |
| $50,000 to $74,999 | 7 | 43.8% |
| $75,000 to $99,999 | 0 | 0.0% |
| $100,000 to $149,999 | 3 | 18.8% |
| $150,000 to $199,999 | 0 | 0.0% |
| $200,000+ | 0 | 0.0% |
Family Income by Famaliy Size in Lincolnville
2-person families (10 | 62.5%) account for the highest median family income in Lincolnville with $39,167 per family, while 2-person families (10 | 62.5%) have the highest median income of $19,584 per family member.
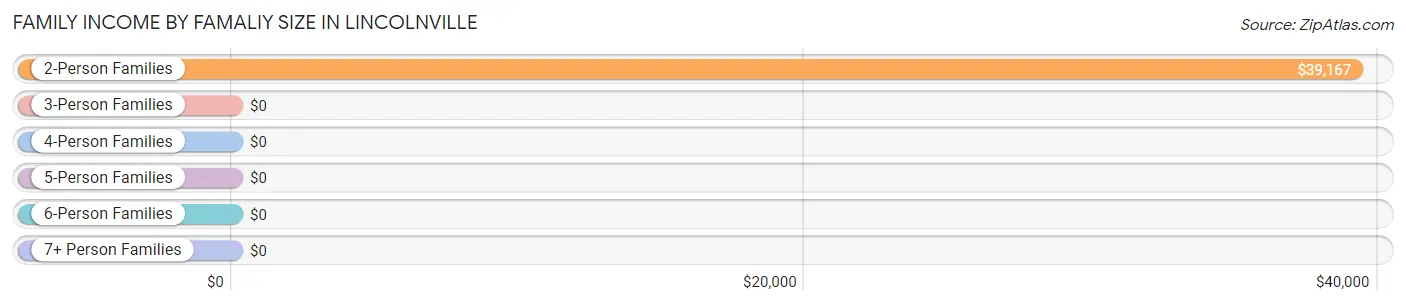
| Income Bracket | # Families | Median Income |
| 2-Person Families | 10 (62.5%) | $39,167 |
| 3-Person Families | 6 (37.5%) | $0 |
| 4-Person Families | 0 (0.0%) | $0 |
| 5-Person Families | 0 (0.0%) | $0 |
| 6-Person Families | 0 (0.0%) | $0 |
| 7+ Person Families | 0 (0.0%) | $0 |
| Total | 16 (100.0%) | $51,250 |
Family Income by Number of Earners in Lincolnville
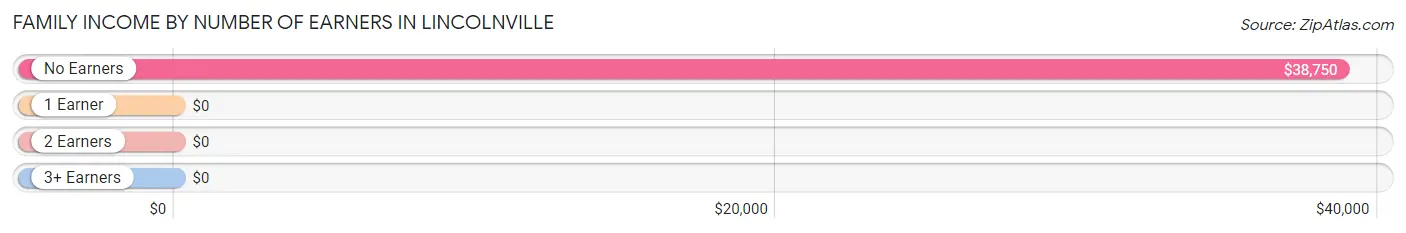
| Number of Earners | # Families | Median Income |
| No Earners | 9 (56.2%) | $38,750 |
| 1 Earner | 4 (25.0%) | $0 |
| 2 Earners | 3 (18.8%) | $0 |
| 3+ Earners | 0 (0.0%) | $0 |
| Total | 16 (100.0%) | $51,250 |
Household Income in Lincolnville
Household Income Brackets in Lincolnville
With 11 households falling in the category, the $35,000 to $49,999 income range is the most frequent in Lincolnville, accounting for 37.9% of all households.
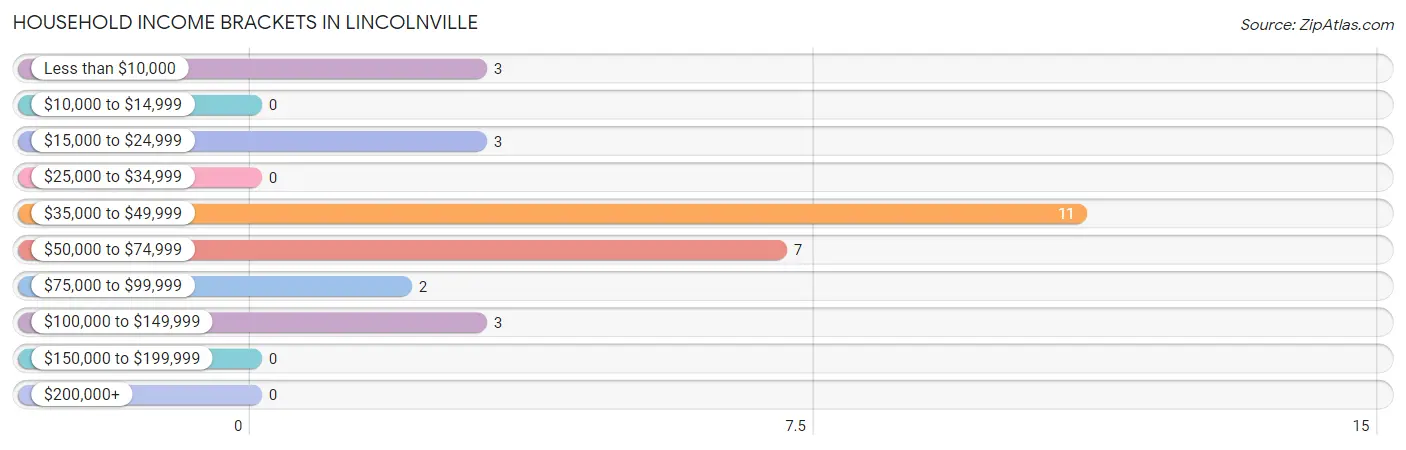
| Income Bracket | # Households | % Households |
| Less than $10,000 | 3 | 10.3% |
| $10,000 to $14,999 | 0 | 0.0% |
| $15,000 to $24,999 | 3 | 10.3% |
| $25,000 to $34,999 | 0 | 0.0% |
| $35,000 to $49,999 | 11 | 37.9% |
| $50,000 to $74,999 | 7 | 24.1% |
| $75,000 to $99,999 | 2 | 6.9% |
| $100,000 to $149,999 | 3 | 10.3% |
| $150,000 to $199,999 | 0 | 0.0% |
| $200,000+ | 0 | 0.0% |
Household Income by Householder Age in Lincolnville
The median household income in Lincolnville is $49,219, with the highest median household income of $49,531 found in the 45 to 64 years age bracket for the primary householder. A total of 13 households (44.8%) fall into this category.
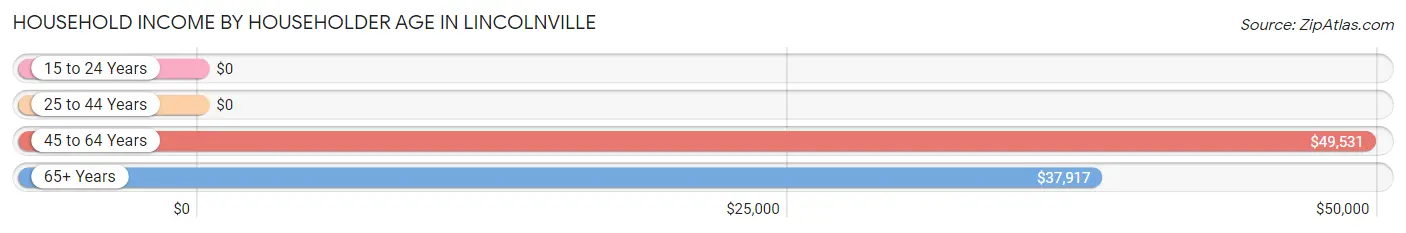
| Income Bracket | # Households | Median Income |
| 15 to 24 Years | 0 (0.0%) | $0 |
| 25 to 44 Years | 3 (10.3%) | $0 |
| 45 to 64 Years | 13 (44.8%) | $49,531 |
| 65+ Years | 13 (44.8%) | $37,917 |
| Total | 29 (100.0%) | $49,219 |
Poverty in Lincolnville
Income Below Poverty by Sex and Age in Lincolnville
With 15.4% poverty level for males and 13.0% for females among the residents of Lincolnville, 25 to 34 year old males and 65 to 74 year old females are the most vulnerable to poverty, with 4 males (50.0%) and 3 females (20.0%) in their respective age groups living below the poverty level.
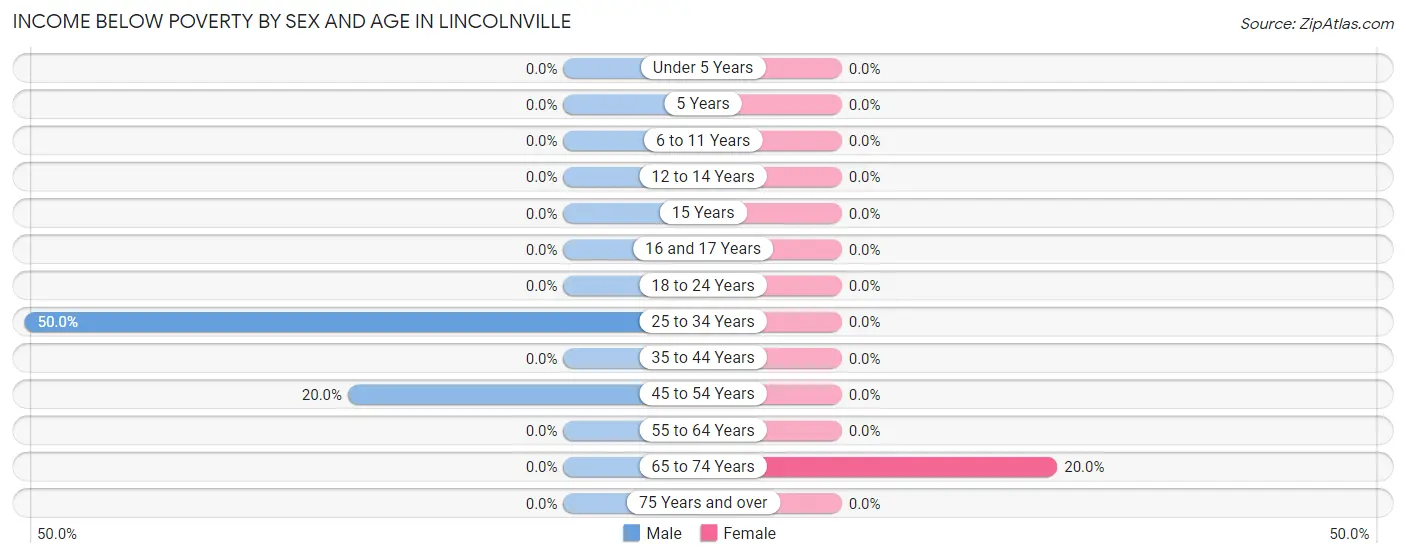
| Age Bracket | Male | Female |
| Under 5 Years | 0 (0.0%) | 0 (0.0%) |
| 5 Years | 0 (0.0%) | 0 (0.0%) |
| 6 to 11 Years | 0 (0.0%) | 0 (0.0%) |
| 12 to 14 Years | 0 (0.0%) | 0 (0.0%) |
| 15 Years | 0 (0.0%) | 0 (0.0%) |
| 16 and 17 Years | 0 (0.0%) | 0 (0.0%) |
| 18 to 24 Years | 0 (0.0%) | 0 (0.0%) |
| 25 to 34 Years | 4 (50.0%) | 0 (0.0%) |
| 35 to 44 Years | 0 (0.0%) | 0 (0.0%) |
| 45 to 54 Years | 2 (20.0%) | 0 (0.0%) |
| 55 to 64 Years | 0 (0.0%) | 0 (0.0%) |
| 65 to 74 Years | 0 (0.0%) | 3 (20.0%) |
| 75 Years and over | 0 (0.0%) | 0 (0.0%) |
| Total | 6 (15.4%) | 3 (13.0%) |
Income Above Poverty by Sex and Age in Lincolnville
According to the poverty statistics in Lincolnville, males aged 6 to 11 years and females aged 35 to 44 years are the age groups that are most secure financially, with 100.0% of males and 100.0% of females in these age groups living above the poverty line.
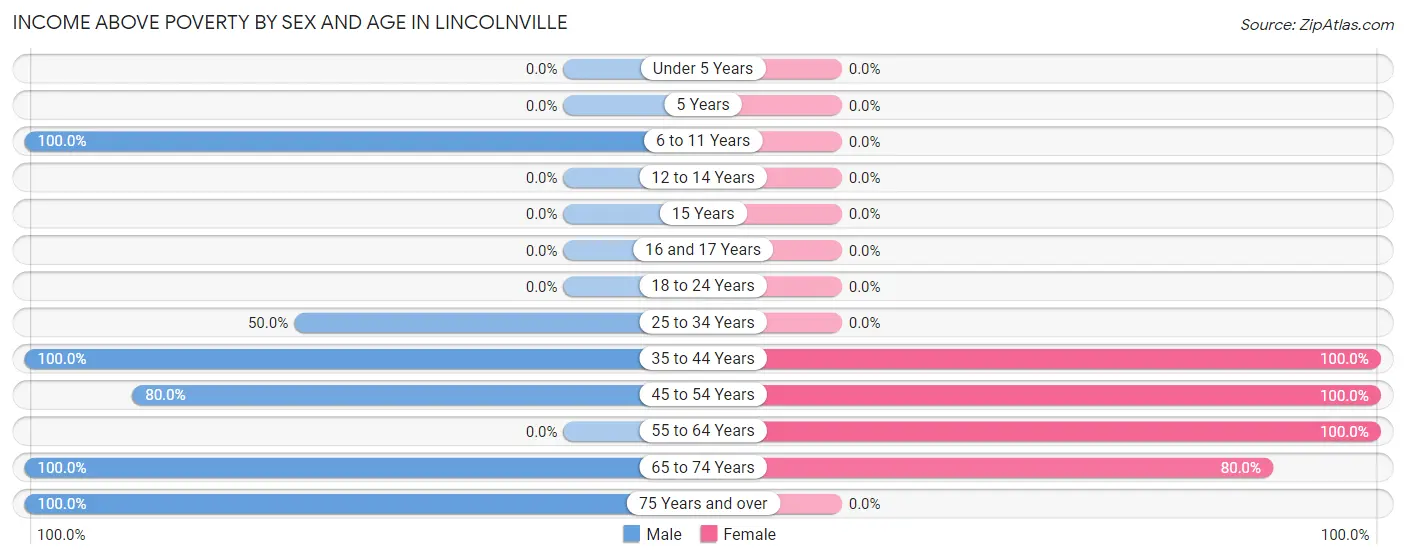
| Age Bracket | Male | Female |
| Under 5 Years | 0 (0.0%) | 0 (0.0%) |
| 5 Years | 0 (0.0%) | 0 (0.0%) |
| 6 to 11 Years | 3 (100.0%) | 0 (0.0%) |
| 12 to 14 Years | 0 (0.0%) | 0 (0.0%) |
| 15 Years | 0 (0.0%) | 0 (0.0%) |
| 16 and 17 Years | 0 (0.0%) | 0 (0.0%) |
| 18 to 24 Years | 0 (0.0%) | 0 (0.0%) |
| 25 to 34 Years | 4 (50.0%) | 0 (0.0%) |
| 35 to 44 Years | 4 (100.0%) | 3 (100.0%) |
| 45 to 54 Years | 8 (80.0%) | 2 (100.0%) |
| 55 to 64 Years | 0 (0.0%) | 3 (100.0%) |
| 65 to 74 Years | 7 (100.0%) | 12 (80.0%) |
| 75 Years and over | 7 (100.0%) | 0 (0.0%) |
| Total | 33 (84.6%) | 20 (87.0%) |
Income Below Poverty Among Married-Couple Families in Lincolnville
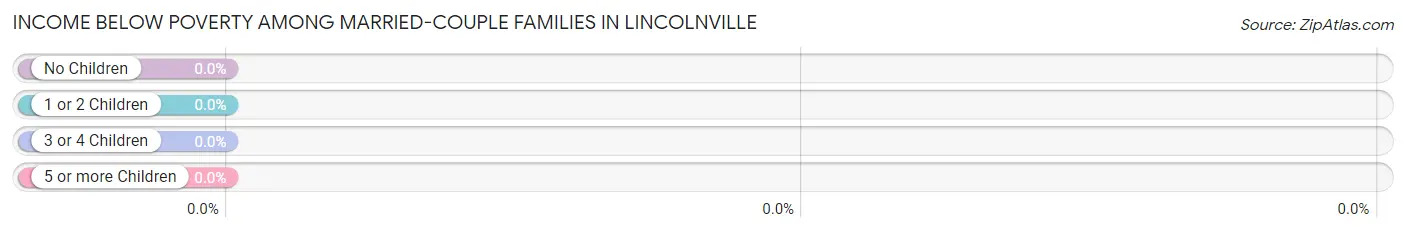
| Children | Above Poverty | Below Poverty |
| No Children | 13 (100.0%) | 0 (0.0%) |
| 1 or 2 Children | 3 (100.0%) | 0 (0.0%) |
| 3 or 4 Children | 0 (0.0%) | 0 (0.0%) |
| 5 or more Children | 0 (0.0%) | 0 (0.0%) |
| Total | 16 (100.0%) | 0 (0.0%) |
Income Below Poverty Among Single-Parent Households in Lincolnville
| Children | Single Father | Single Mother |
| No Children | 0 (0.0%) | 0 (0.0%) |
| 1 or 2 Children | 0 (0.0%) | 0 (0.0%) |
| 3 or 4 Children | 0 (0.0%) | 0 (0.0%) |
| 5 or more Children | 0 (0.0%) | 0 (0.0%) |
| Total | 0 (0.0%) | 0 (0.0%) |
Income Below Poverty Among Married-Couple vs Single-Parent Households in Lincolnville
| Children | Married-Couple Families | Single-Parent Households |
| No Children | 0 (0.0%) | 0 (0.0%) |
| 1 or 2 Children | 0 (0.0%) | 0 (0.0%) |
| 3 or 4 Children | 0 (0.0%) | 0 (0.0%) |
| 5 or more Children | 0 (0.0%) | 0 (0.0%) |
| Total | 0 (0.0%) | 0 (0.0%) |
Race in Lincolnville
The most populous races in Lincolnville are , and White / Caucasian (62 | 100.0%).
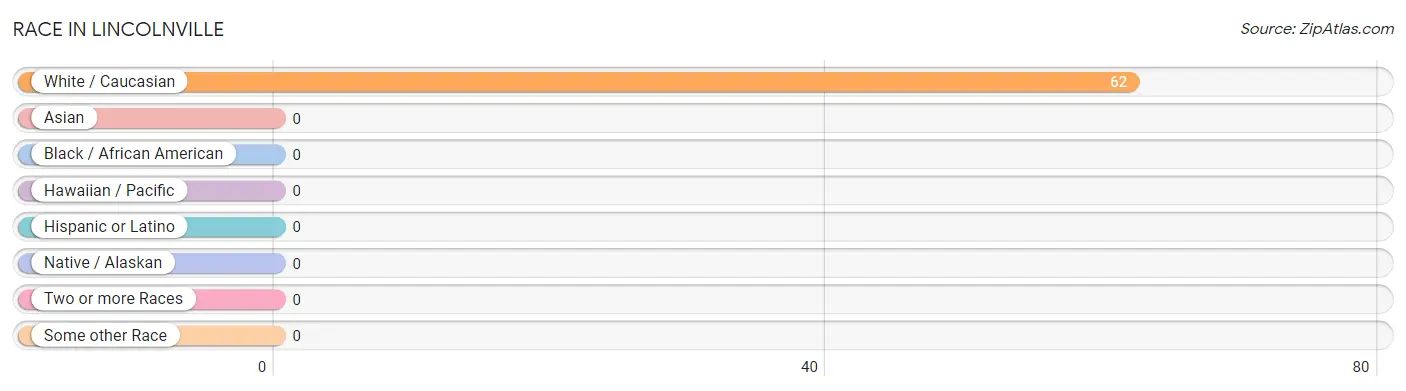
| Race | # Population | % Population |
| Asian | 0 | 0.0% |
| Black / African American | 0 | 0.0% |
| Hawaiian / Pacific | 0 | 0.0% |
| Hispanic or Latino | 0 | 0.0% |
| Native / Alaskan | 0 | 0.0% |
| White / Caucasian | 62 | 100.0% |
| Two or more Races | 0 | 0.0% |
| Some other Race | 0 | 0.0% |
| Total | 62 | 100.0% |
Ancestry in Lincolnville
The most populous ancestries reported in Lincolnville are English (25 | 40.3%), German (21 | 33.9%), American (15 | 24.2%), Polish (10 | 16.1%), and Scotch-Irish (8 | 12.9%), together accounting for 127.4% of all Lincolnville residents.
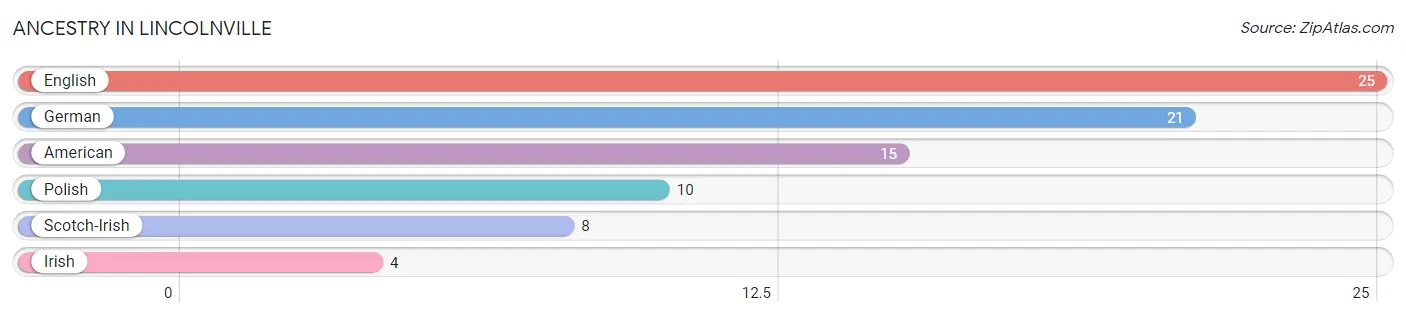
| Ancestry | # Population | % Population |
| American | 15 | 24.2% |
| English | 25 | 40.3% |
| German | 21 | 33.9% |
| Irish | 4 | 6.5% |
| Polish | 10 | 16.1% |
| Scotch-Irish | 8 | 12.9% | View All 6 Rows |
Immigrants in Lincolnville

| Immigration Origin | # Population | % Population | View All 0 Rows |
Sex and Age in Lincolnville
Sex and Age in Lincolnville
The most populous age groups in Lincolnville are 25 to 29 Years (8 | 20.5%) for men and 65 to 69 Years (11 | 47.8%) for women.
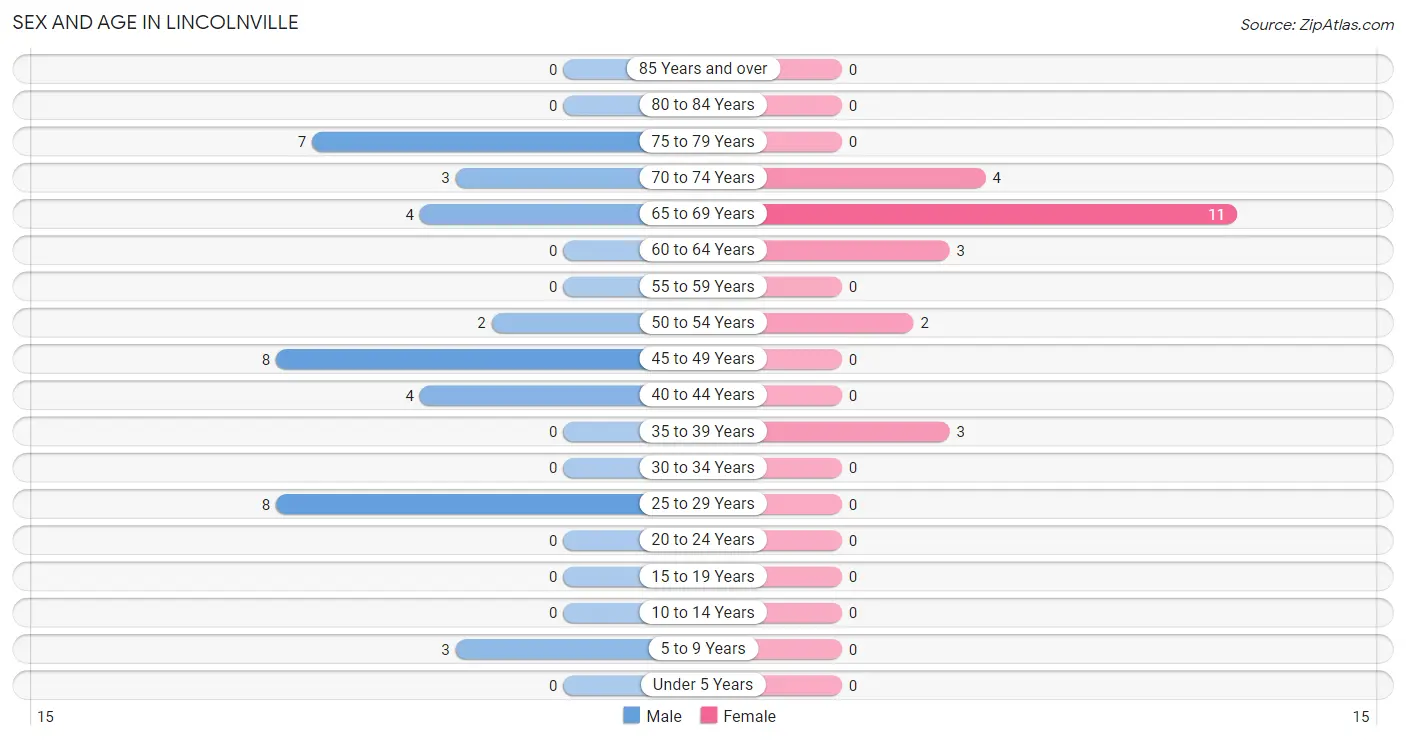
| Age Bracket | Male | Female |
| Under 5 Years | 0 (0.0%) | 0 (0.0%) |
| 5 to 9 Years | 3 (7.7%) | 0 (0.0%) |
| 10 to 14 Years | 0 (0.0%) | 0 (0.0%) |
| 15 to 19 Years | 0 (0.0%) | 0 (0.0%) |
| 20 to 24 Years | 0 (0.0%) | 0 (0.0%) |
| 25 to 29 Years | 8 (20.5%) | 0 (0.0%) |
| 30 to 34 Years | 0 (0.0%) | 0 (0.0%) |
| 35 to 39 Years | 0 (0.0%) | 3 (13.0%) |
| 40 to 44 Years | 4 (10.3%) | 0 (0.0%) |
| 45 to 49 Years | 8 (20.5%) | 0 (0.0%) |
| 50 to 54 Years | 2 (5.1%) | 2 (8.7%) |
| 55 to 59 Years | 0 (0.0%) | 0 (0.0%) |
| 60 to 64 Years | 0 (0.0%) | 3 (13.0%) |
| 65 to 69 Years | 4 (10.3%) | 11 (47.8%) |
| 70 to 74 Years | 3 (7.7%) | 4 (17.4%) |
| 75 to 79 Years | 7 (17.9%) | 0 (0.0%) |
| 80 to 84 Years | 0 (0.0%) | 0 (0.0%) |
| 85 Years and over | 0 (0.0%) | 0 (0.0%) |
| Total | 39 (100.0%) | 23 (100.0%) |
Families and Households in Lincolnville
Median Family Size in Lincolnville
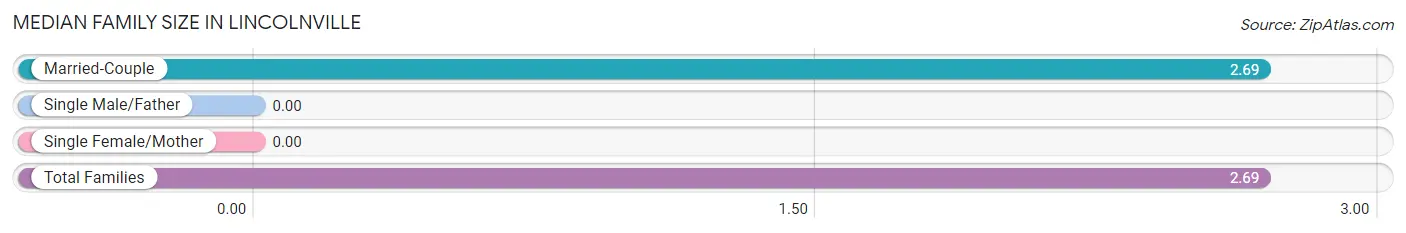
| Family Type | # Families | Family Size |
| Married-Couple | 16 (100.0%) | 2.69 |
| Single Male/Father | 0 (0.0%) | - |
| Single Female/Mother | 0 (0.0%) | - |
| Total Families | 16 (100.0%) | 2.69 |
Median Household Size in Lincolnville
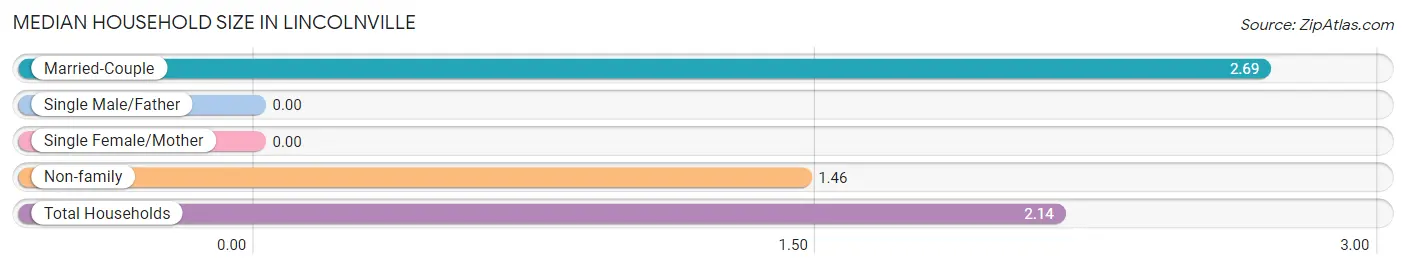
| Household Type | # Households | Household Size |
| Married-Couple | 16 (55.2%) | 2.69 |
| Single Male/Father | 0 (0.0%) | - |
| Single Female/Mother | 0 (0.0%) | - |
| Non-family | 13 (44.8%) | 1.46 |
| Total Households | 29 (100.0%) | 2.14 |
Household Size by Marriage Status in Lincolnville
Out of a total of 29 households in Lincolnville, 16 (55.2%) are family households, while 13 (44.8%) are nonfamily households. The most numerous type of family households are 2-person households, comprising 10, and the most common type of nonfamily households are 1-person households, comprising 11.
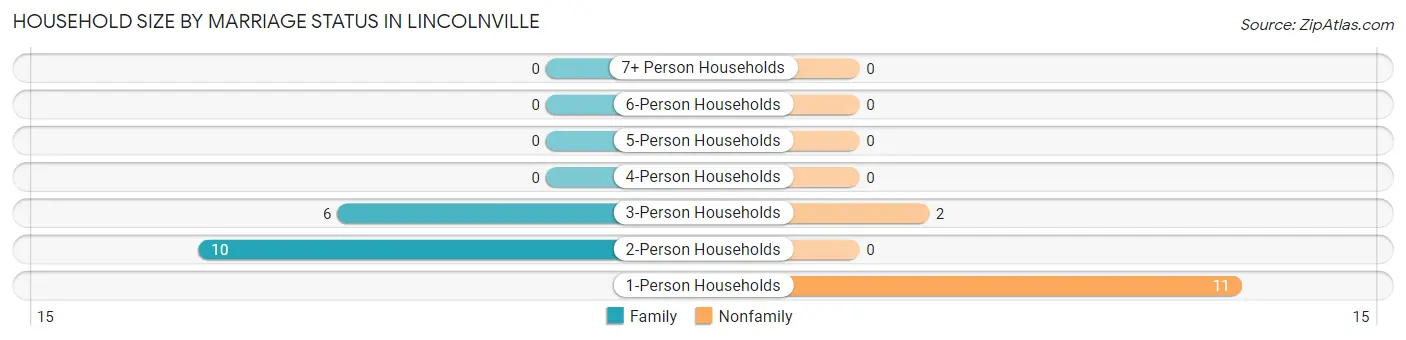
| Household Size | Family Households | Nonfamily Households |
| 1-Person Households | - | 11 (37.9%) |
| 2-Person Households | 10 (34.5%) | 0 (0.0%) |
| 3-Person Households | 6 (20.7%) | 2 (6.9%) |
| 4-Person Households | 0 (0.0%) | 0 (0.0%) |
| 5-Person Households | 0 (0.0%) | 0 (0.0%) |
| 6-Person Households | 0 (0.0%) | 0 (0.0%) |
| 7+ Person Households | 0 (0.0%) | 0 (0.0%) |
| Total | 16 (55.2%) | 13 (44.8%) |
Female Fertility in Lincolnville
Fertility by Age in Lincolnville
| Age Bracket | Women with Births | Births / 1,000 Women |
| 15 to 19 years | 0 (0.0%) | 0.0 |
| 20 to 34 years | 0 (0.0%) | 0.0 |
| 35 to 50 years | 0 (0.0%) | 0.0 |
| Total | 0 (0.0%) | 0.0 |
Fertility by Age by Marriage Status in Lincolnville
| Age Bracket | Married | Unmarried |
| 15 to 19 years | 0 (0.0%) | 0 (0.0%) |
| 20 to 34 years | 0 (0.0%) | 0 (0.0%) |
| 35 to 50 years | 0 (0.0%) | 0 (0.0%) |
| Total | 0 (0.0%) | 0 (0.0%) |
Fertility by Education in Lincolnville
| Educational Attainment | Women with Births | Births / 1,000 Women |
| Less than High School | 0 (0.0%) | 0.0 |
| High School Diploma | 0 (0.0%) | 0.0 |
| College or Associate's Degree | 0 (0.0%) | 0.0 |
| Bachelor's Degree | 0 (0.0%) | 0.0 |
| Graduate Degree | 0 (0.0%) | 0.0 |
| Total | 0 (0.0%) | 0.0 |
Fertility by Education by Marriage Status in Lincolnville
| Educational Attainment | Married | Unmarried |
| Less than High School | 0 (0.0%) | 0 (0.0%) |
| High School Diploma | 0 (0.0%) | 0 (0.0%) |
| College or Associate's Degree | 0 (0.0%) | 0 (0.0%) |
| Bachelor's Degree | 0 (0.0%) | 0 (0.0%) |
| Graduate Degree | 0 (0.0%) | 0 (0.0%) |
| Total | 0 (0.0%) | 0 (0.0%) |
Employment Characteristics in Lincolnville
Employment by Class of Employer in Lincolnville
Among the 26 employed individuals in Lincolnville, private company employees (17 | 65.4%), not-for-profit organizations (7 | 26.9%), and unpaid family workers (2 | 7.7%) make up the most common classes of employment.
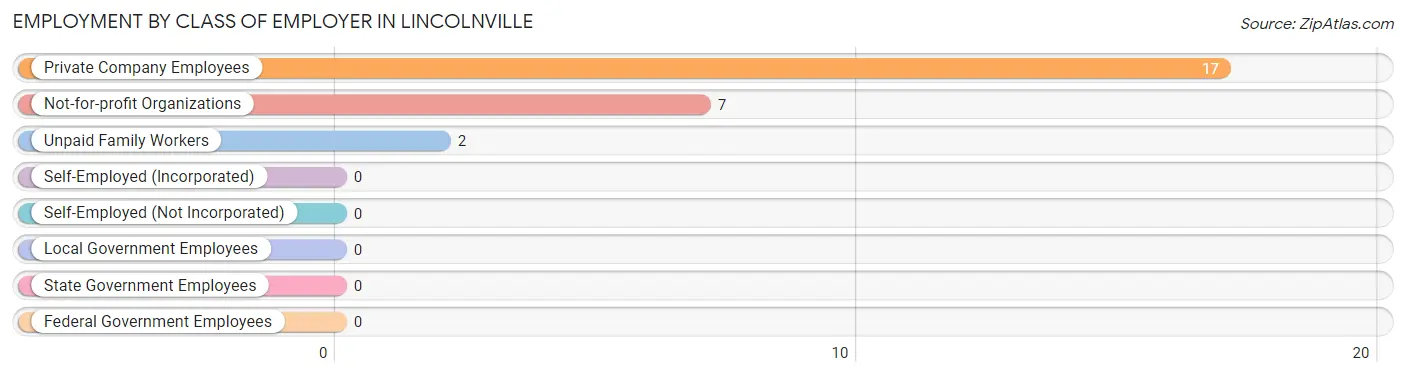
| Employer Class | # Employees | % Employees |
| Private Company Employees | 17 | 65.4% |
| Self-Employed (Incorporated) | 0 | 0.0% |
| Self-Employed (Not Incorporated) | 0 | 0.0% |
| Not-for-profit Organizations | 7 | 26.9% |
| Local Government Employees | 0 | 0.0% |
| State Government Employees | 0 | 0.0% |
| Federal Government Employees | 0 | 0.0% |
| Unpaid Family Workers | 2 | 7.7% |
| Total | 26 | 100.0% |
Employment Status by Age in Lincolnville
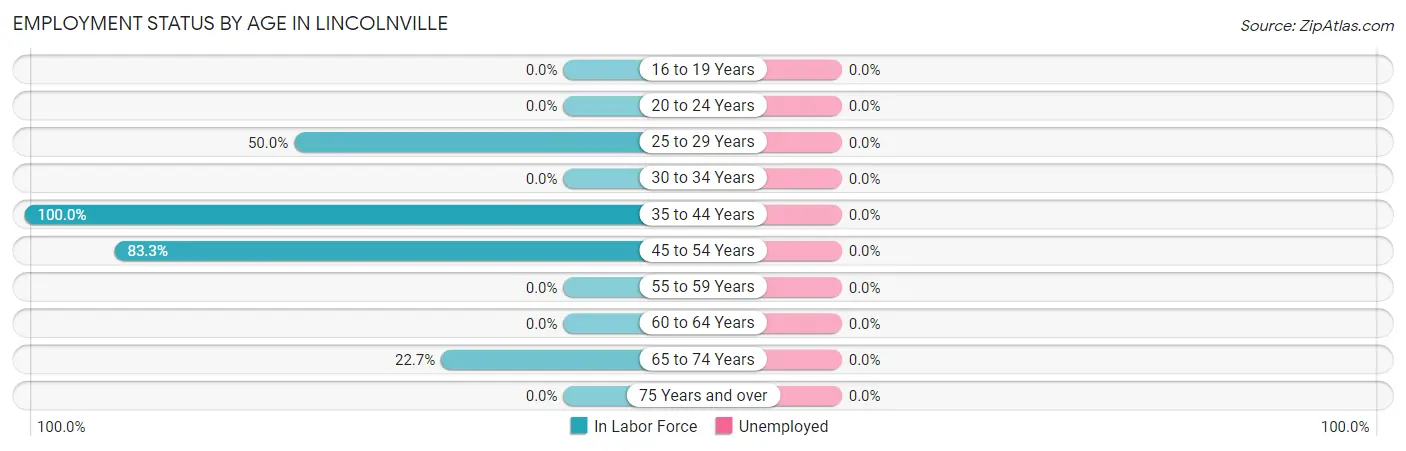
| Age Bracket | In Labor Force | Unemployed |
| 16 to 19 Years | 0 (0.0%) | 0 (0.0%) |
| 20 to 24 Years | 0 (0.0%) | 0 (0.0%) |
| 25 to 29 Years | 4 (50.0%) | 0 (0.0%) |
| 30 to 34 Years | 0 (0.0%) | 0 (0.0%) |
| 35 to 44 Years | 7 (100.0%) | 0 (0.0%) |
| 45 to 54 Years | 10 (83.3%) | 0 (0.0%) |
| 55 to 59 Years | 0 (0.0%) | 0 (0.0%) |
| 60 to 64 Years | 0 (0.0%) | 0 (0.0%) |
| 65 to 74 Years | 5 (22.7%) | 0 (0.0%) |
| 75 Years and over | 0 (0.0%) | 0 (0.0%) |
| Total | 26 (44.1%) | 0 (0.0%) |
Employment Status by Educational Attainment in Lincolnville
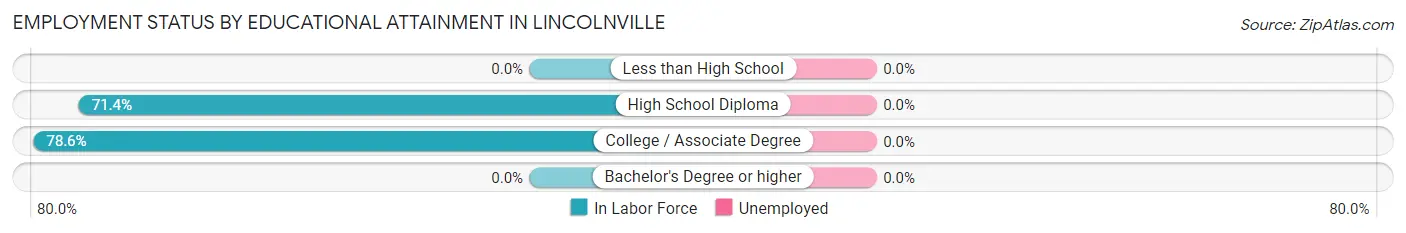
| Educational Attainment | In Labor Force | Unemployed |
| Less than High School | 0 (0.0%) | 0 (0.0%) |
| High School Diploma | 10 (71.4%) | 0 (0.0%) |
| College / Associate Degree | 11 (78.6%) | 0 (0.0%) |
| Bachelor's Degree or higher | 0 (0.0%) | 0 (0.0%) |
| Total | 21 (70.0%) | 0 (0.0%) |
Employment Occupations by Sex in Lincolnville
Management, Business, Science and Arts Occupations
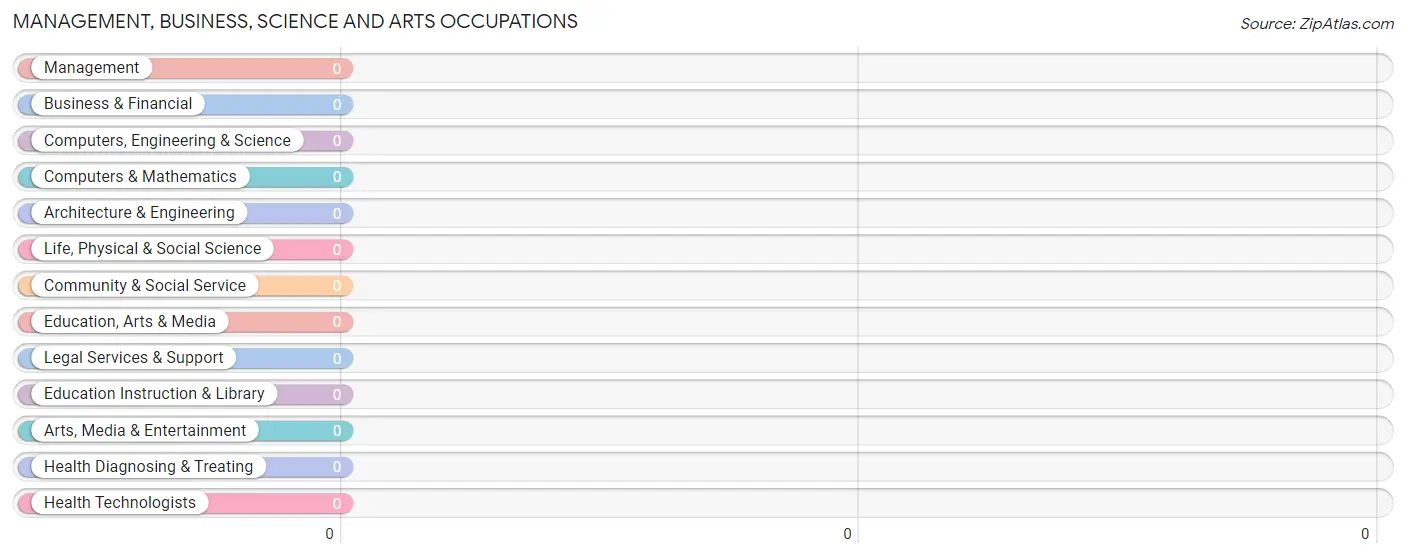
Management, Business, Science and Arts Occupations by Sex
| Occupation | Male | Female |
| Management | 0 (0.0%) | 0 (0.0%) |
| Business & Financial | 0 (0.0%) | 0 (0.0%) |
| Computers, Engineering & Science | 0 (0.0%) | 0 (0.0%) |
| Computers & Mathematics | 0 (0.0%) | 0 (0.0%) |
| Architecture & Engineering | 0 (0.0%) | 0 (0.0%) |
| Life, Physical & Social Science | 0 (0.0%) | 0 (0.0%) |
| Community & Social Service | 0 (0.0%) | 0 (0.0%) |
| Education, Arts & Media | 0 (0.0%) | 0 (0.0%) |
| Legal Services & Support | 0 (0.0%) | 0 (0.0%) |
| Education Instruction & Library | 0 (0.0%) | 0 (0.0%) |
| Arts, Media & Entertainment | 0 (0.0%) | 0 (0.0%) |
| Health Diagnosing & Treating | 0 (0.0%) | 0 (0.0%) |
| Health Technologists | 0 (0.0%) | 0 (0.0%) |
| Total (Category) | 0 (0.0%) | 0 (0.0%) |
| Total (Overall) | 16 (61.5%) | 10 (38.5%) |
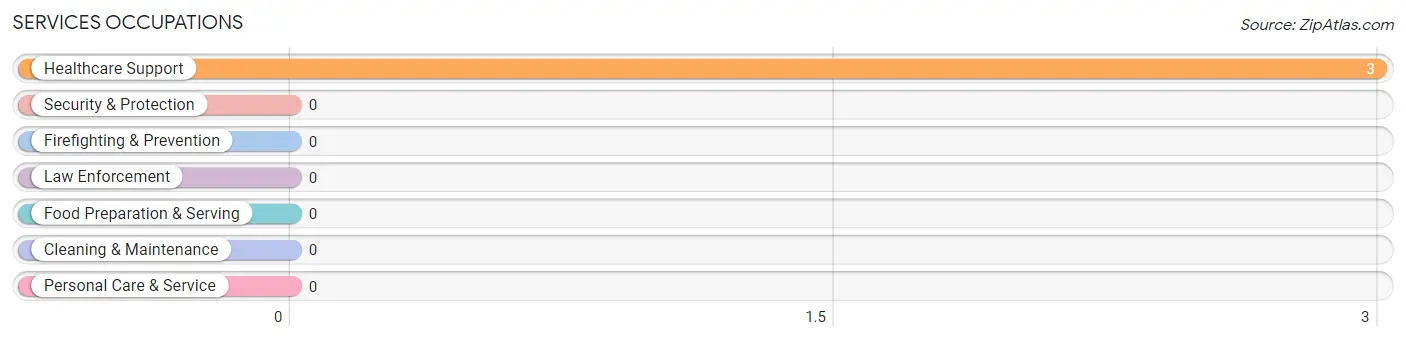
Services Occupations
The most common Services occupations in Lincolnville are , and Healthcare Support (3 | 11.5%).
Services Occupations by Sex
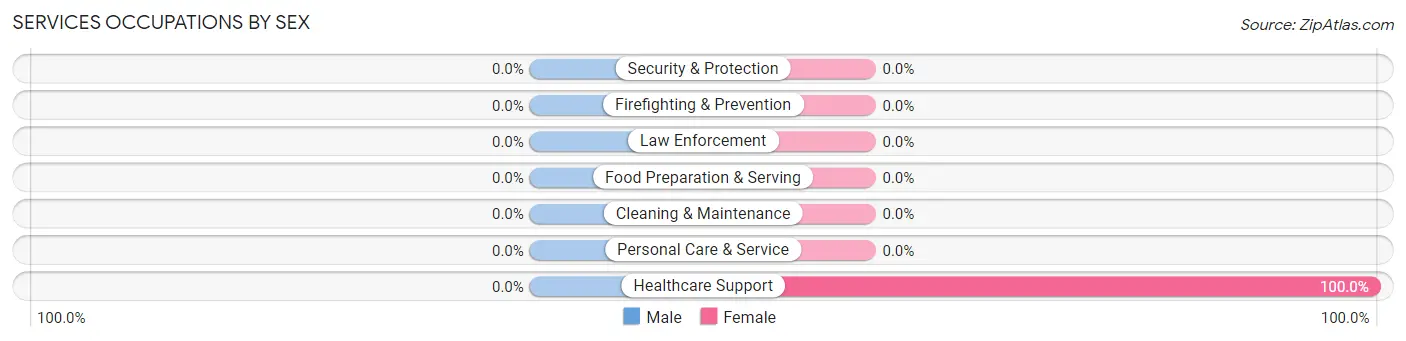
| Occupation | Male | Female |
| Healthcare Support | 0 (0.0%) | 3 (100.0%) |
| Security & Protection | 0 (0.0%) | 0 (0.0%) |
| Firefighting & Prevention | 0 (0.0%) | 0 (0.0%) |
| Law Enforcement | 0 (0.0%) | 0 (0.0%) |
| Food Preparation & Serving | 0 (0.0%) | 0 (0.0%) |
| Cleaning & Maintenance | 0 (0.0%) | 0 (0.0%) |
| Personal Care & Service | 0 (0.0%) | 0 (0.0%) |
| Total (Category) | 0 (0.0%) | 3 (100.0%) |
| Total (Overall) | 16 (61.5%) | 10 (38.5%) |
Sales and Office Occupations
Sales and Office Occupations by Sex
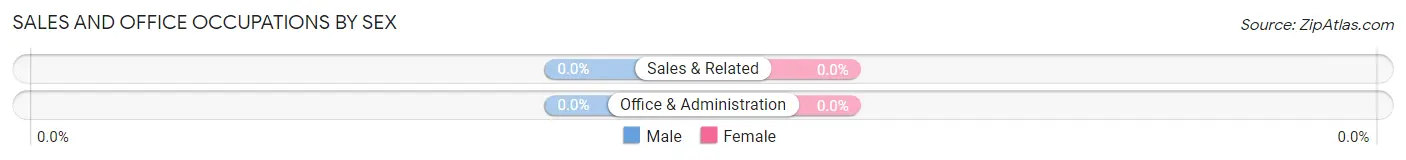
| Occupation | Male | Female |
| Sales & Related | 0 (0.0%) | 0 (0.0%) |
| Office & Administration | 0 (0.0%) | 0 (0.0%) |
| Total (Category) | 0 (0.0%) | 0 (0.0%) |
| Total (Overall) | 16 (61.5%) | 10 (38.5%) |
Natural Resources, Construction and Maintenance Occupations
The most common Natural Resources, Construction and Maintenance occupations in Lincolnville are , and Installation, Maintenance & Repair (4 | 15.4%).
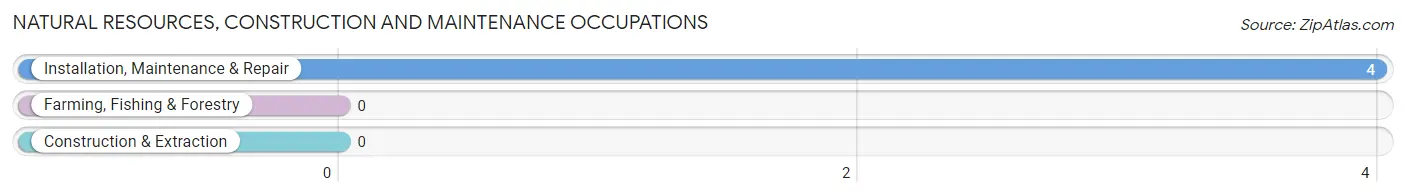
Natural Resources, Construction and Maintenance Occupations by Sex
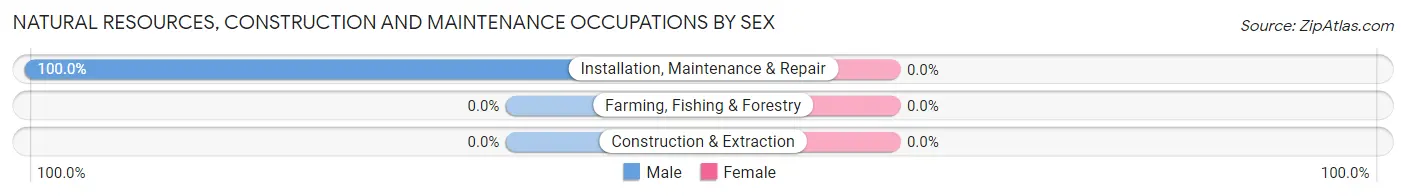
| Occupation | Male | Female |
| Farming, Fishing & Forestry | 0 (0.0%) | 0 (0.0%) |
| Construction & Extraction | 0 (0.0%) | 0 (0.0%) |
| Installation, Maintenance & Repair | 4 (100.0%) | 0 (0.0%) |
| Total (Category) | 4 (100.0%) | 0 (0.0%) |
| Total (Overall) | 16 (61.5%) | 10 (38.5%) |
Production, Transportation and Moving Occupations
The most common Production, Transportation and Moving occupations in Lincolnville are Material Moving (11 | 42.3%), and Production (8 | 30.8%).
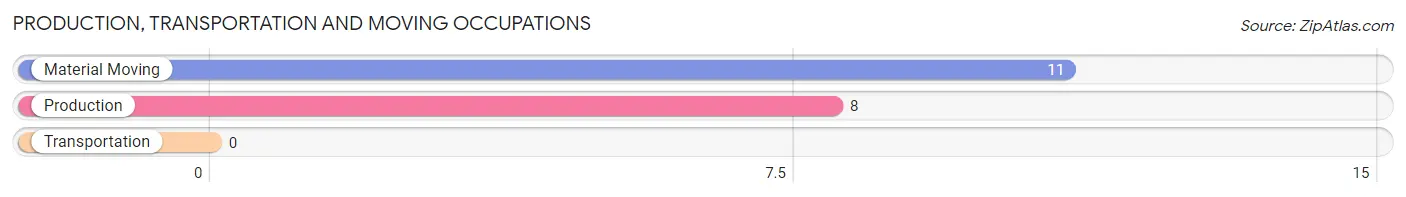
Production, Transportation and Moving Occupations by Sex
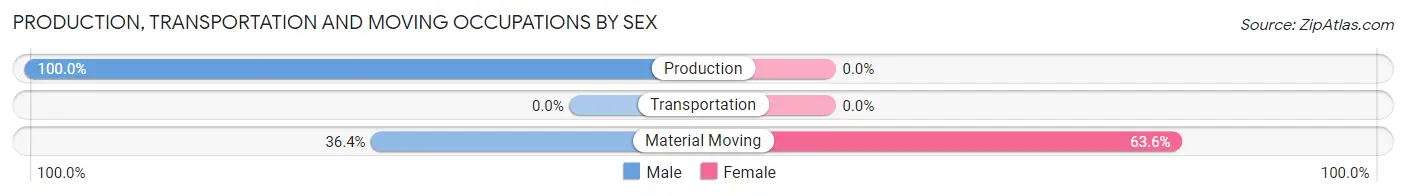
| Occupation | Male | Female |
| Production | 8 (100.0%) | 0 (0.0%) |
| Transportation | 0 (0.0%) | 0 (0.0%) |
| Material Moving | 4 (36.4%) | 7 (63.6%) |
| Total (Category) | 12 (63.2%) | 7 (36.8%) |
| Total (Overall) | 16 (61.5%) | 10 (38.5%) |
Employment Industries by Sex in Lincolnville
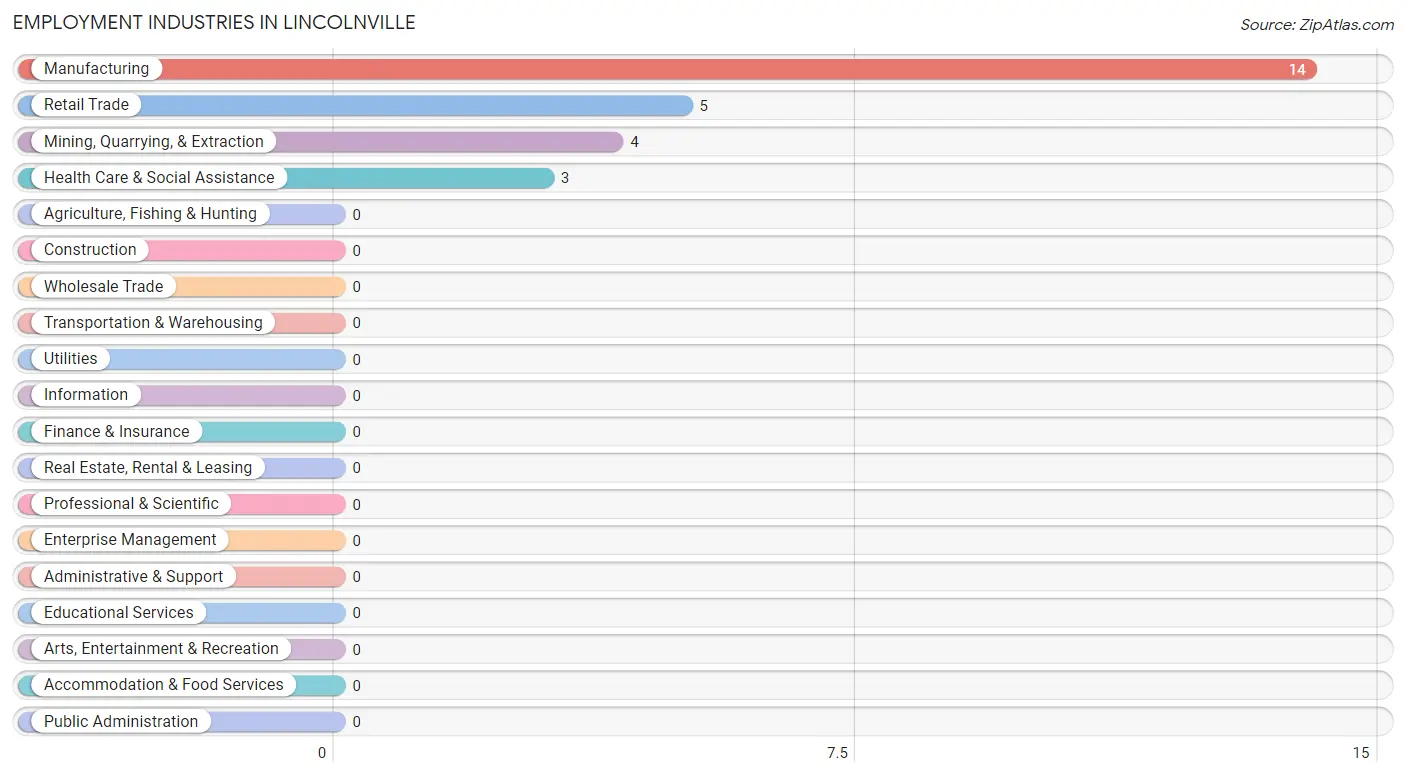
Employment Industries in Lincolnville
The major employment industries in Lincolnville include Manufacturing (14 | 53.8%), Retail Trade (5 | 19.2%), Mining, Quarrying, & Extraction (4 | 15.4%), and Health Care & Social Assistance (3 | 11.5%).
Employment Industries by Sex in Lincolnville
The Lincolnville industries that see more men than women are Mining, Quarrying, & Extraction (100.0%), and Manufacturing (85.7%), whereas the industries that tend to have a higher number of women are Retail Trade (100.0%), Health Care & Social Assistance (100.0%), and Manufacturing (14.3%).
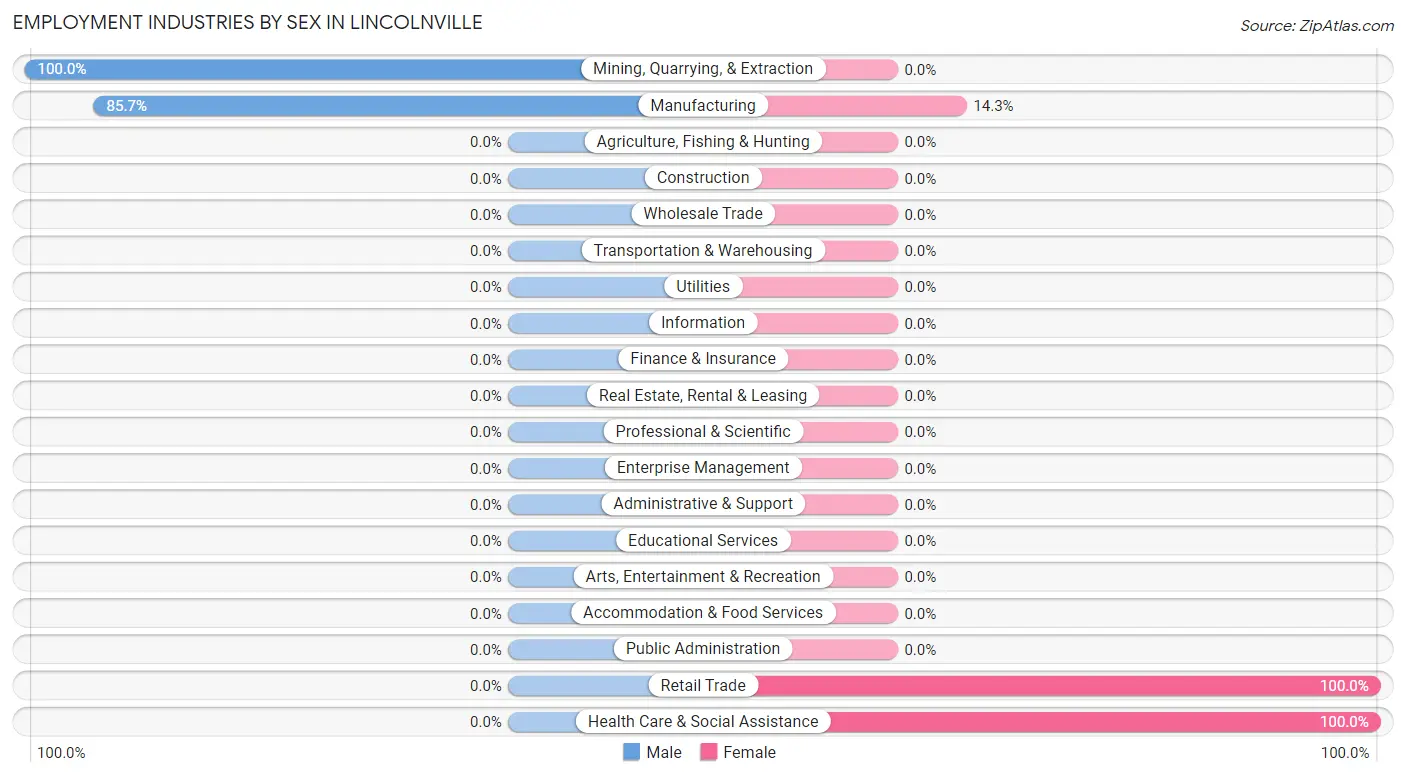
| Industry | Male | Female |
| Agriculture, Fishing & Hunting | 0 (0.0%) | 0 (0.0%) |
| Mining, Quarrying, & Extraction | 4 (100.0%) | 0 (0.0%) |
| Construction | 0 (0.0%) | 0 (0.0%) |
| Manufacturing | 12 (85.7%) | 2 (14.3%) |
| Wholesale Trade | 0 (0.0%) | 0 (0.0%) |
| Retail Trade | 0 (0.0%) | 5 (100.0%) |
| Transportation & Warehousing | 0 (0.0%) | 0 (0.0%) |
| Utilities | 0 (0.0%) | 0 (0.0%) |
| Information | 0 (0.0%) | 0 (0.0%) |
| Finance & Insurance | 0 (0.0%) | 0 (0.0%) |
| Real Estate, Rental & Leasing | 0 (0.0%) | 0 (0.0%) |
| Professional & Scientific | 0 (0.0%) | 0 (0.0%) |
| Enterprise Management | 0 (0.0%) | 0 (0.0%) |
| Administrative & Support | 0 (0.0%) | 0 (0.0%) |
| Educational Services | 0 (0.0%) | 0 (0.0%) |
| Health Care & Social Assistance | 0 (0.0%) | 3 (100.0%) |
| Arts, Entertainment & Recreation | 0 (0.0%) | 0 (0.0%) |
| Accommodation & Food Services | 0 (0.0%) | 0 (0.0%) |
| Public Administration | 0 (0.0%) | 0 (0.0%) |
| Total | 16 (61.5%) | 10 (38.5%) |
Education in Lincolnville
School Enrollment in Lincolnville
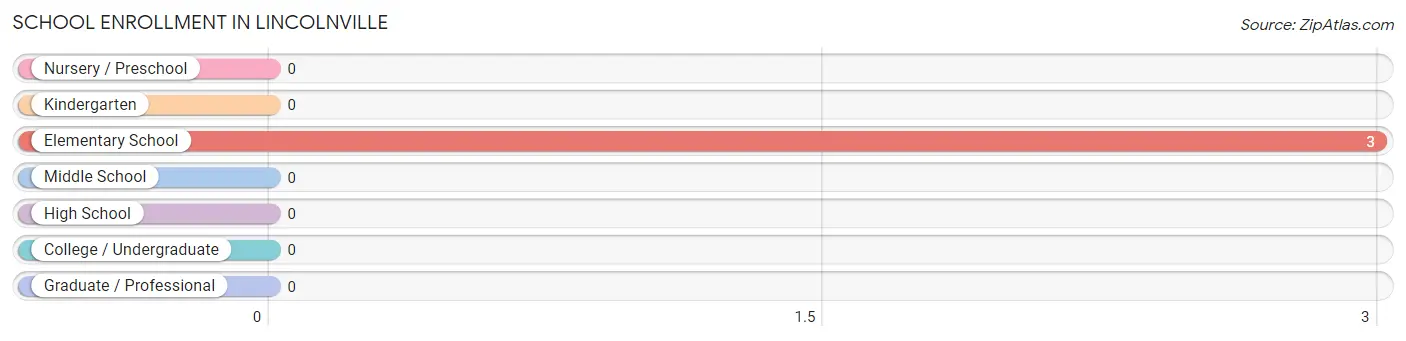
| School Level | # Students | % Students |
| Nursery / Preschool | 0 | 0.0% |
| Kindergarten | 0 | 0.0% |
| Elementary School | 3 | 100.0% |
| Middle School | 0 | 0.0% |
| High School | 0 | 0.0% |
| College / Undergraduate | 0 | 0.0% |
| Graduate / Professional | 0 | 0.0% |
| Total | 3 | 100.0% |
School Enrollment by Age by Funding Source in Lincolnville
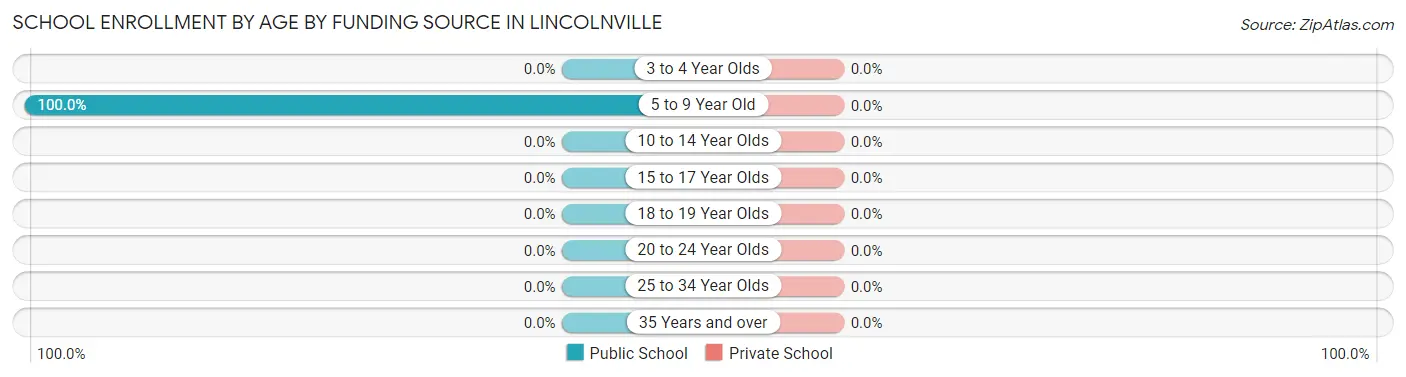
| Age Bracket | Public School | Private School |
| 3 to 4 Year Olds | 0 (0.0%) | 0 (0.0%) |
| 5 to 9 Year Old | 3 (100.0%) | 0 (0.0%) |
| 10 to 14 Year Olds | 0 (0.0%) | 0 (0.0%) |
| 15 to 17 Year Olds | 0 (0.0%) | 0 (0.0%) |
| 18 to 19 Year Olds | 0 (0.0%) | 0 (0.0%) |
| 20 to 24 Year Olds | 0 (0.0%) | 0 (0.0%) |
| 25 to 34 Year Olds | 0 (0.0%) | 0 (0.0%) |
| 35 Years and over | 0 (0.0%) | 0 (0.0%) |
| Total | 3 (100.0%) | 0 (0.0%) |
Educational Attainment by Field of Study in Lincolnville
| Field of Study | # Graduates | % Graduates |
| Computers & Mathematics | 0 | 0.0% |
| Bio, Nature & Agricultural | 0 | 0.0% |
| Physical & Health Sciences | 0 | 0.0% |
| Psychology | 0 | 0.0% |
| Social Sciences | 0 | 0.0% |
| Engineering | 0 | 0.0% |
| Multidisciplinary Studies | 0 | 0.0% |
| Science & Technology | 0 | 0.0% |
| Business | 0 | 0.0% |
| Education | 0 | 0.0% |
| Literature & Languages | 0 | 0.0% |
| Liberal Arts & History | 0 | 0.0% |
| Visual & Performing Arts | 0 | 0.0% |
| Communications | 0 | 0.0% |
| Arts & Humanities | 0 | 0.0% |
| Total | 0 | 0.0% |
Transportation & Commute in Lincolnville
Vehicle Availability by Sex in Lincolnville
The most prevalent vehicle ownership categories in Lincolnville are males with 1 vehicle (8, accounting for 50.0%) and females with 1 vehicle (0, making up 80.0%).
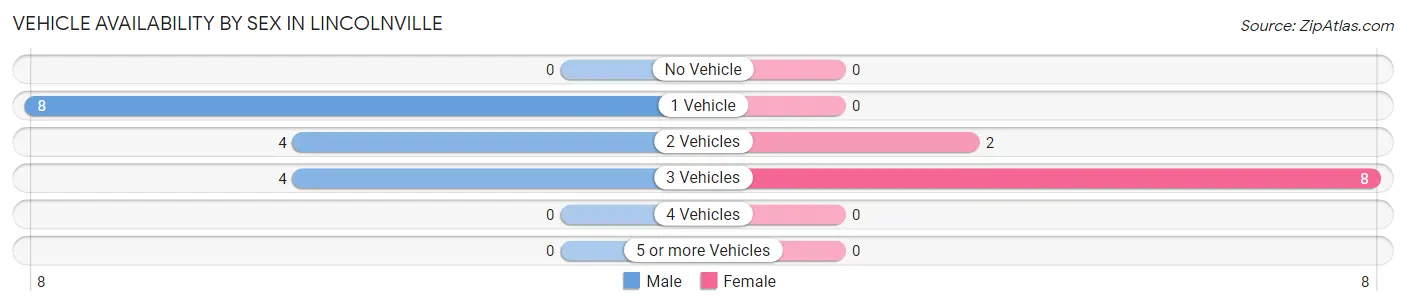
| Vehicles Available | Male | Female |
| No Vehicle | 0 (0.0%) | 0 (0.0%) |
| 1 Vehicle | 8 (50.0%) | 0 (0.0%) |
| 2 Vehicles | 4 (25.0%) | 2 (20.0%) |
| 3 Vehicles | 4 (25.0%) | 8 (80.0%) |
| 4 Vehicles | 0 (0.0%) | 0 (0.0%) |
| 5 or more Vehicles | 0 (0.0%) | 0 (0.0%) |
| Total | 16 (100.0%) | 10 (100.0%) |
Commute Time in Lincolnville
The most frequently occuring commute durations in Lincolnville are 40 to 44 minutes (8 commuters, 30.8%), 25 to 29 minutes (5 commuters, 19.2%), and 30 to 34 minutes (5 commuters, 19.2%).
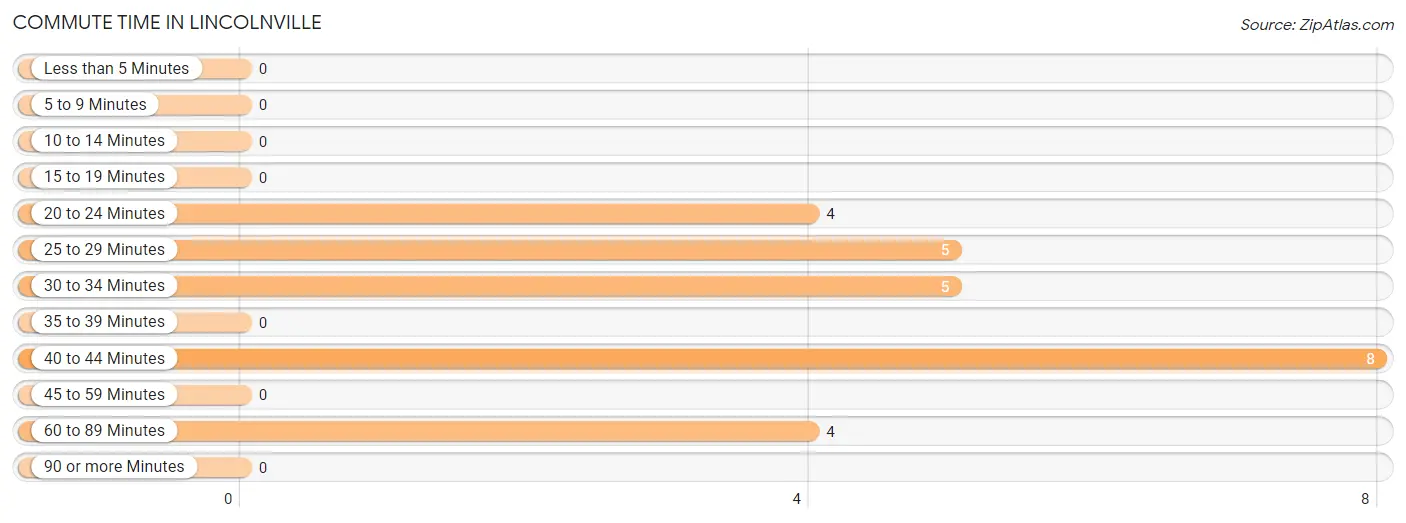
| Commute Time | # Commuters | % Commuters |
| Less than 5 Minutes | 0 | 0.0% |
| 5 to 9 Minutes | 0 | 0.0% |
| 10 to 14 Minutes | 0 | 0.0% |
| 15 to 19 Minutes | 0 | 0.0% |
| 20 to 24 Minutes | 4 | 15.4% |
| 25 to 29 Minutes | 5 | 19.2% |
| 30 to 34 Minutes | 5 | 19.2% |
| 35 to 39 Minutes | 0 | 0.0% |
| 40 to 44 Minutes | 8 | 30.8% |
| 45 to 59 Minutes | 0 | 0.0% |
| 60 to 89 Minutes | 4 | 15.4% |
| 90 or more Minutes | 0 | 0.0% |
Commute Time by Sex in Lincolnville
The most common commute times in Lincolnville are 40 to 44 minutes (8 commuters, 50.0%) for males and 25 to 29 minutes (5 commuters, 50.0%) for females.
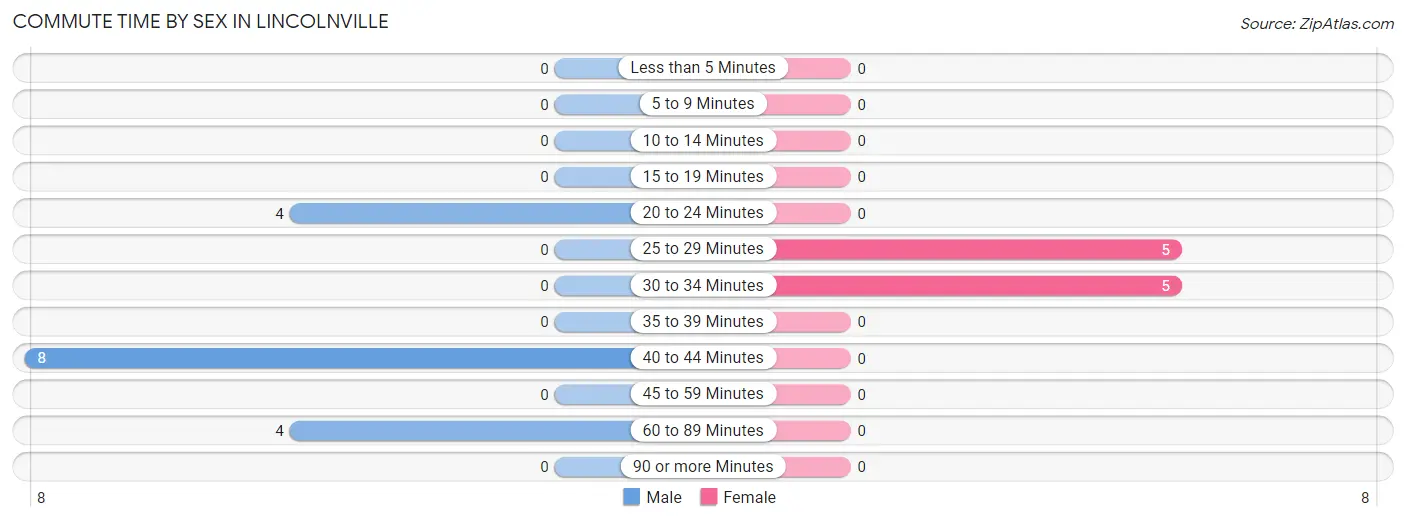
| Commute Time | Male | Female |
| Less than 5 Minutes | 0 (0.0%) | 0 (0.0%) |
| 5 to 9 Minutes | 0 (0.0%) | 0 (0.0%) |
| 10 to 14 Minutes | 0 (0.0%) | 0 (0.0%) |
| 15 to 19 Minutes | 0 (0.0%) | 0 (0.0%) |
| 20 to 24 Minutes | 4 (25.0%) | 0 (0.0%) |
| 25 to 29 Minutes | 0 (0.0%) | 5 (50.0%) |
| 30 to 34 Minutes | 0 (0.0%) | 5 (50.0%) |
| 35 to 39 Minutes | 0 (0.0%) | 0 (0.0%) |
| 40 to 44 Minutes | 8 (50.0%) | 0 (0.0%) |
| 45 to 59 Minutes | 0 (0.0%) | 0 (0.0%) |
| 60 to 89 Minutes | 4 (25.0%) | 0 (0.0%) |
| 90 or more Minutes | 0 (0.0%) | 0 (0.0%) |
Time of Departure to Work by Sex in Lincolnville
The most frequent times of departure to work in Lincolnville are 12:00 AM to 4:59 AM (12, 75.0%) for males and 7:30 AM to 7:59 AM (5, 50.0%) for females.
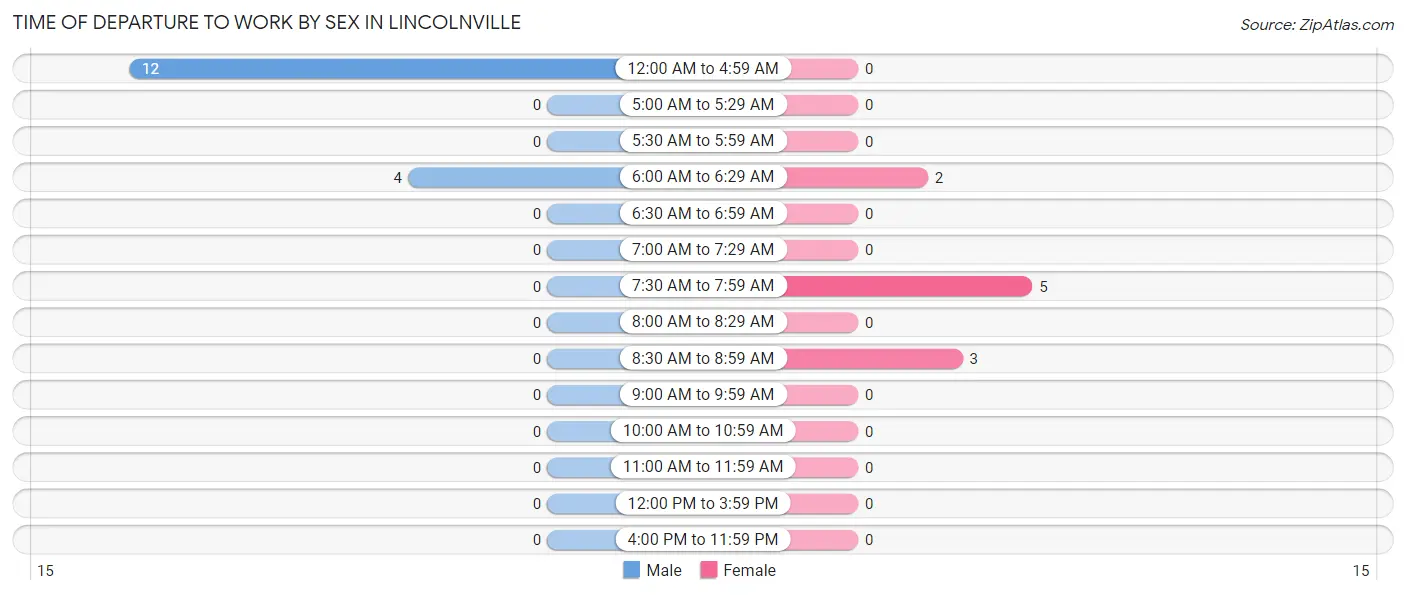
| Time of Departure | Male | Female |
| 12:00 AM to 4:59 AM | 12 (75.0%) | 0 (0.0%) |
| 5:00 AM to 5:29 AM | 0 (0.0%) | 0 (0.0%) |
| 5:30 AM to 5:59 AM | 0 (0.0%) | 0 (0.0%) |
| 6:00 AM to 6:29 AM | 4 (25.0%) | 2 (20.0%) |
| 6:30 AM to 6:59 AM | 0 (0.0%) | 0 (0.0%) |
| 7:00 AM to 7:29 AM | 0 (0.0%) | 0 (0.0%) |
| 7:30 AM to 7:59 AM | 0 (0.0%) | 5 (50.0%) |
| 8:00 AM to 8:29 AM | 0 (0.0%) | 0 (0.0%) |
| 8:30 AM to 8:59 AM | 0 (0.0%) | 3 (30.0%) |
| 9:00 AM to 9:59 AM | 0 (0.0%) | 0 (0.0%) |
| 10:00 AM to 10:59 AM | 0 (0.0%) | 0 (0.0%) |
| 11:00 AM to 11:59 AM | 0 (0.0%) | 0 (0.0%) |
| 12:00 PM to 3:59 PM | 0 (0.0%) | 0 (0.0%) |
| 4:00 PM to 11:59 PM | 0 (0.0%) | 0 (0.0%) |
| Total | 16 (100.0%) | 10 (100.0%) |
Housing Occupancy in Lincolnville
Occupancy by Ownership in Lincolnville
Of the total 29 dwellings in Lincolnville, owner-occupied units account for 18 (62.1%), while renter-occupied units make up 11 (37.9%).
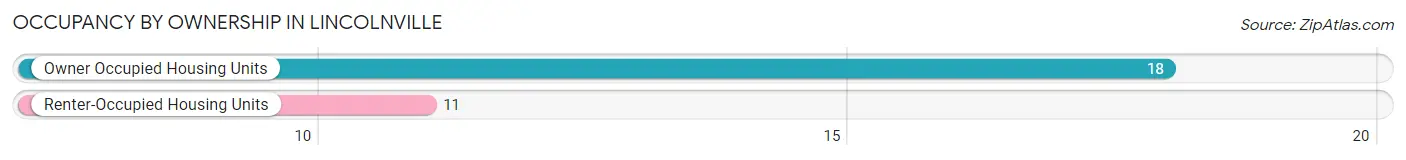
| Occupancy | # Housing Units | % Housing Units |
| Owner Occupied Housing Units | 18 | 62.1% |
| Renter-Occupied Housing Units | 11 | 37.9% |
| Total Occupied Housing Units | 29 | 100.0% |
Occupancy by Household Size in Lincolnville
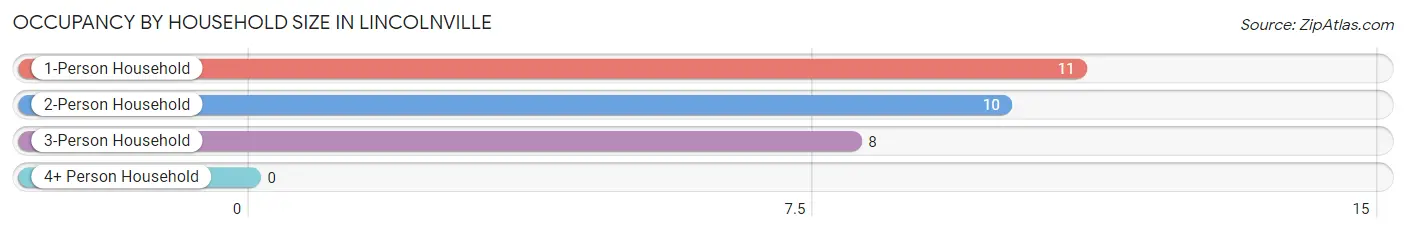
| Household Size | # Housing Units | % Housing Units |
| 1-Person Household | 11 | 37.9% |
| 2-Person Household | 10 | 34.5% |
| 3-Person Household | 8 | 27.6% |
| 4+ Person Household | 0 | 0.0% |
| Total Housing Units | 29 | 100.0% |
Occupancy by Ownership by Household Size in Lincolnville
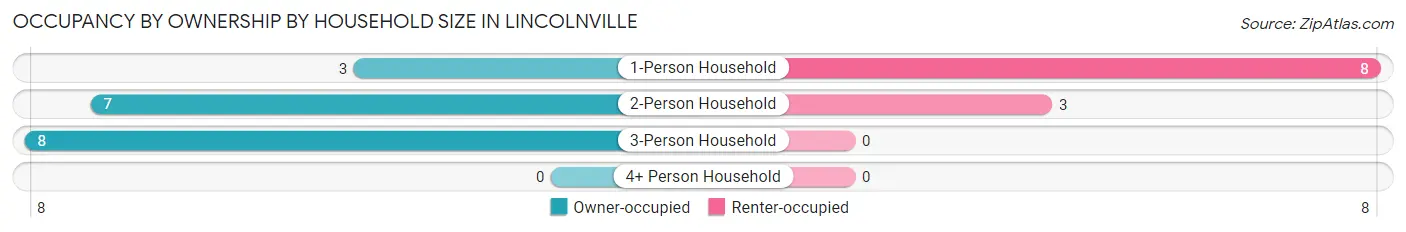
| Household Size | Owner-occupied | Renter-occupied |
| 1-Person Household | 3 (27.3%) | 8 (72.7%) |
| 2-Person Household | 7 (70.0%) | 3 (30.0%) |
| 3-Person Household | 8 (100.0%) | 0 (0.0%) |
| 4+ Person Household | 0 (0.0%) | 0 (0.0%) |
| Total Housing Units | 18 (62.1%) | 11 (37.9%) |
Occupancy by Educational Attainment in Lincolnville
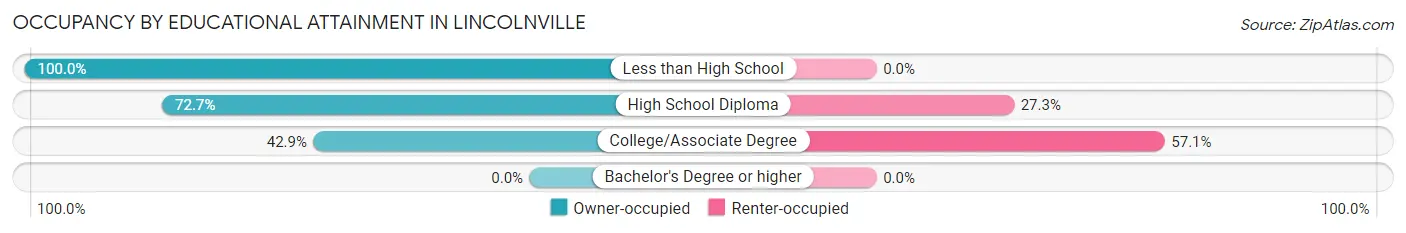
| Household Size | Owner-occupied | Renter-occupied |
| Less than High School | 4 (100.0%) | 0 (0.0%) |
| High School Diploma | 8 (72.7%) | 3 (27.3%) |
| College/Associate Degree | 6 (42.9%) | 8 (57.1%) |
| Bachelor's Degree or higher | 0 (0.0%) | 0 (0.0%) |
Occupancy by Age of Householder in Lincolnville
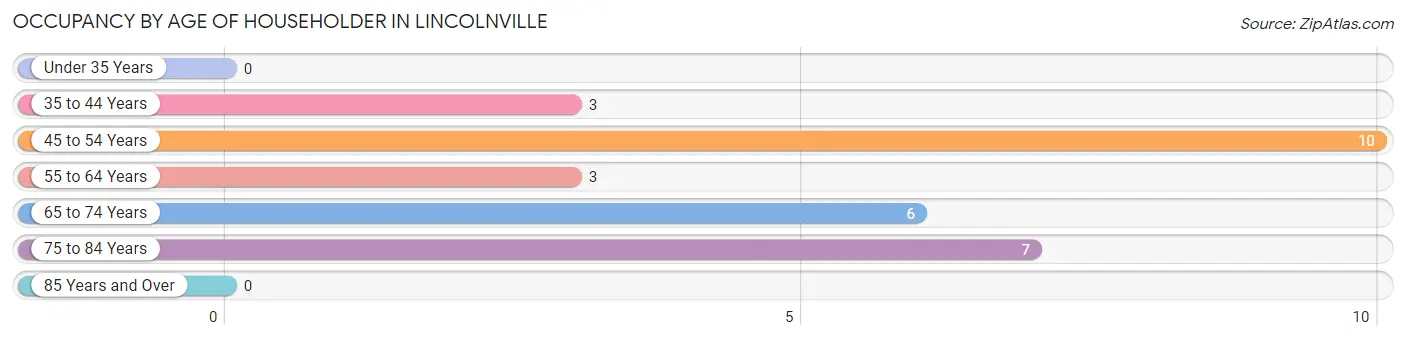
| Age Bracket | # Households | % Households |
| Under 35 Years | 0 | 0.0% |
| 35 to 44 Years | 3 | 10.3% |
| 45 to 54 Years | 10 | 34.5% |
| 55 to 64 Years | 3 | 10.3% |
| 65 to 74 Years | 6 | 20.7% |
| 75 to 84 Years | 7 | 24.1% |
| 85 Years and Over | 0 | 0.0% |
| Total | 29 | 100.0% |
Housing Finances in Lincolnville
Median Income by Occupancy in Lincolnville
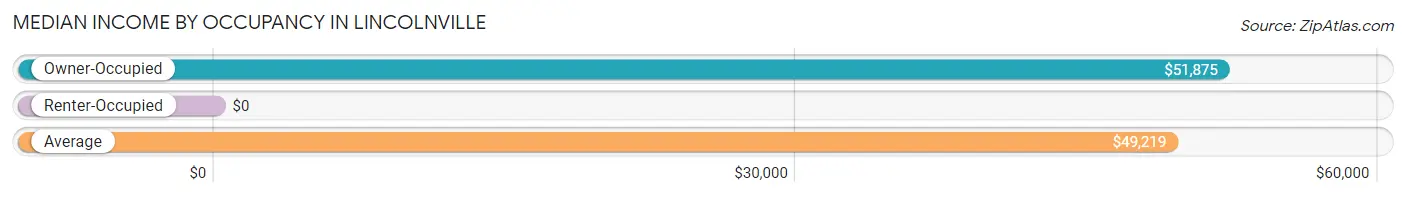
| Occupancy Type | # Households | Median Income |
| Owner-Occupied | 18 (62.1%) | $51,875 |
| Renter-Occupied | 11 (37.9%) | $0 |
| Average | 29 (100.0%) | $49,219 |
Occupancy by Householder Income Bracket in Lincolnville
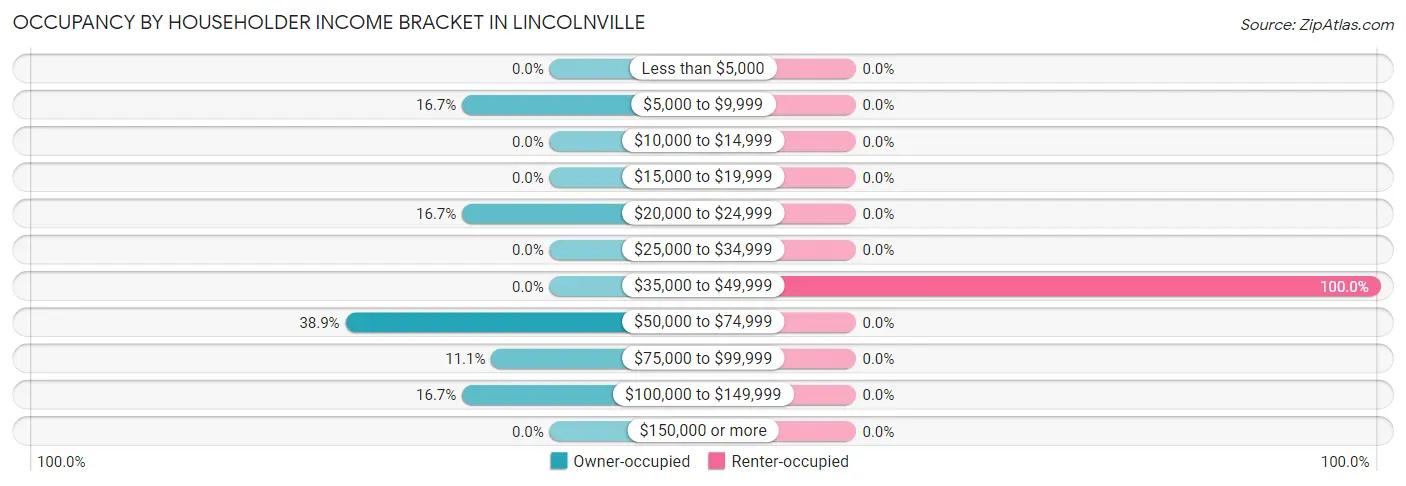
| Income Bracket | Owner-occupied | Renter-occupied |
| Less than $5,000 | 0 (0.0%) | 0 (0.0%) |
| $5,000 to $9,999 | 3 (16.7%) | 0 (0.0%) |
| $10,000 to $14,999 | 0 (0.0%) | 0 (0.0%) |
| $15,000 to $19,999 | 0 (0.0%) | 0 (0.0%) |
| $20,000 to $24,999 | 3 (16.7%) | 0 (0.0%) |
| $25,000 to $34,999 | 0 (0.0%) | 0 (0.0%) |
| $35,000 to $49,999 | 0 (0.0%) | 11 (100.0%) |
| $50,000 to $74,999 | 7 (38.9%) | 0 (0.0%) |
| $75,000 to $99,999 | 2 (11.1%) | 0 (0.0%) |
| $100,000 to $149,999 | 3 (16.7%) | 0 (0.0%) |
| $150,000 or more | 0 (0.0%) | 0 (0.0%) |
| Total | 18 (100.0%) | 11 (100.0%) |
Monthly Housing Cost Tiers in Lincolnville
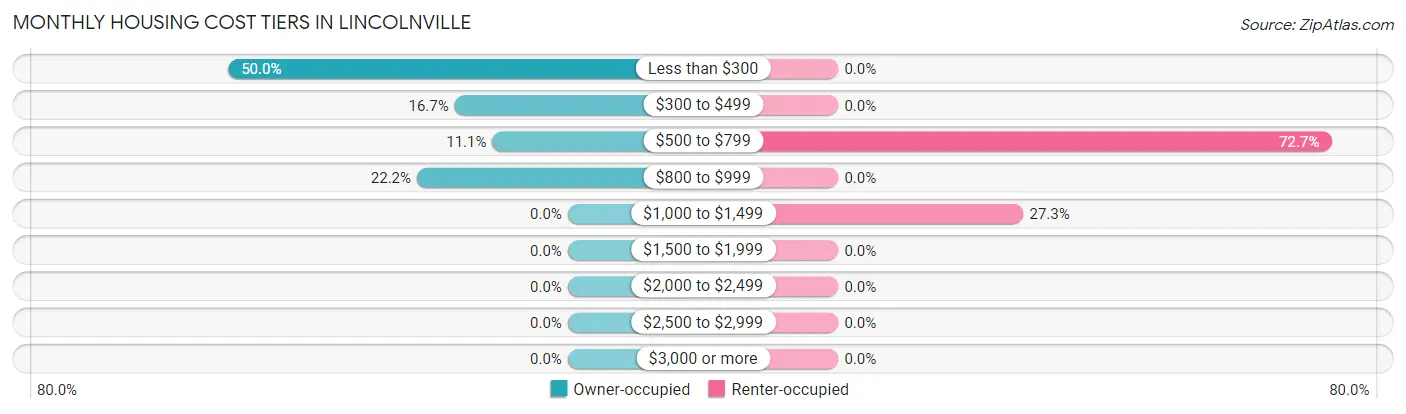
| Monthly Cost | Owner-occupied | Renter-occupied |
| Less than $300 | 9 (50.0%) | 0 (0.0%) |
| $300 to $499 | 3 (16.7%) | 0 (0.0%) |
| $500 to $799 | 2 (11.1%) | 8 (72.7%) |
| $800 to $999 | 4 (22.2%) | 0 (0.0%) |
| $1,000 to $1,499 | 0 (0.0%) | 3 (27.3%) |
| $1,500 to $1,999 | 0 (0.0%) | 0 (0.0%) |
| $2,000 to $2,499 | 0 (0.0%) | 0 (0.0%) |
| $2,500 to $2,999 | 0 (0.0%) | 0 (0.0%) |
| $3,000 or more | 0 (0.0%) | 0 (0.0%) |
| Total | 18 (100.0%) | 11 (100.0%) |
Physical Housing Characteristics in Lincolnville
Housing Structures in Lincolnville
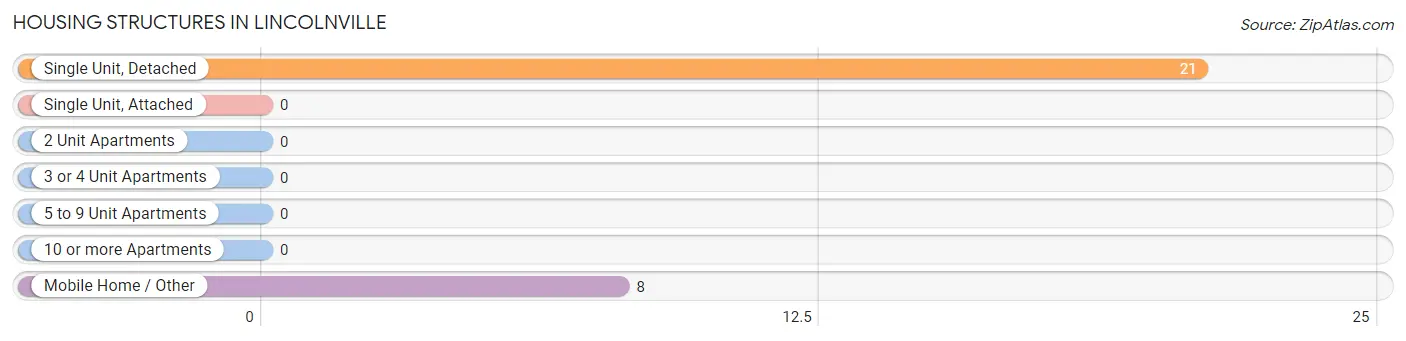
| Structure Type | # Housing Units | % Housing Units |
| Single Unit, Detached | 21 | 72.4% |
| Single Unit, Attached | 0 | 0.0% |
| 2 Unit Apartments | 0 | 0.0% |
| 3 or 4 Unit Apartments | 0 | 0.0% |
| 5 to 9 Unit Apartments | 0 | 0.0% |
| 10 or more Apartments | 0 | 0.0% |
| Mobile Home / Other | 8 | 27.6% |
| Total | 29 | 100.0% |
Housing Structures by Occupancy in Lincolnville
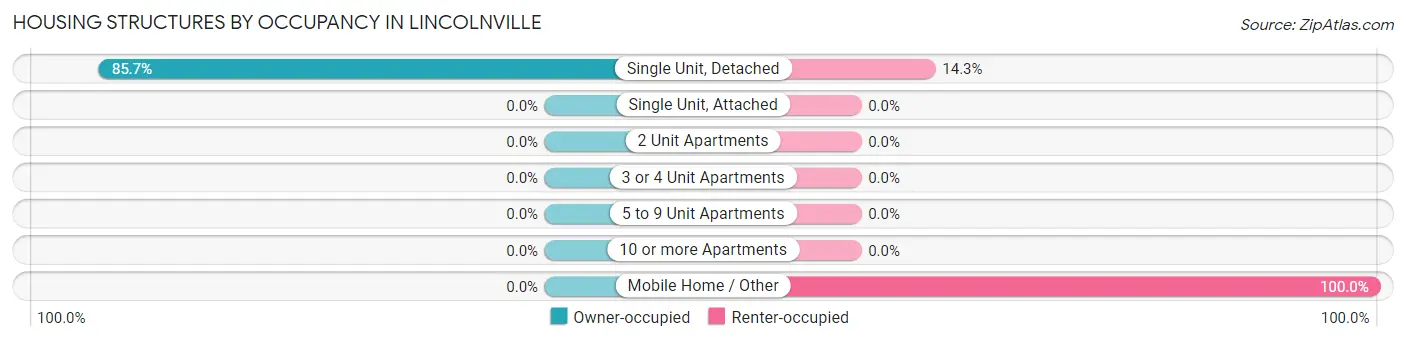
| Structure Type | Owner-occupied | Renter-occupied |
| Single Unit, Detached | 18 (85.7%) | 3 (14.3%) |
| Single Unit, Attached | 0 (0.0%) | 0 (0.0%) |
| 2 Unit Apartments | 0 (0.0%) | 0 (0.0%) |
| 3 or 4 Unit Apartments | 0 (0.0%) | 0 (0.0%) |
| 5 to 9 Unit Apartments | 0 (0.0%) | 0 (0.0%) |
| 10 or more Apartments | 0 (0.0%) | 0 (0.0%) |
| Mobile Home / Other | 0 (0.0%) | 8 (100.0%) |
| Total | 18 (62.1%) | 11 (37.9%) |
Housing Structures by Number of Rooms in Lincolnville
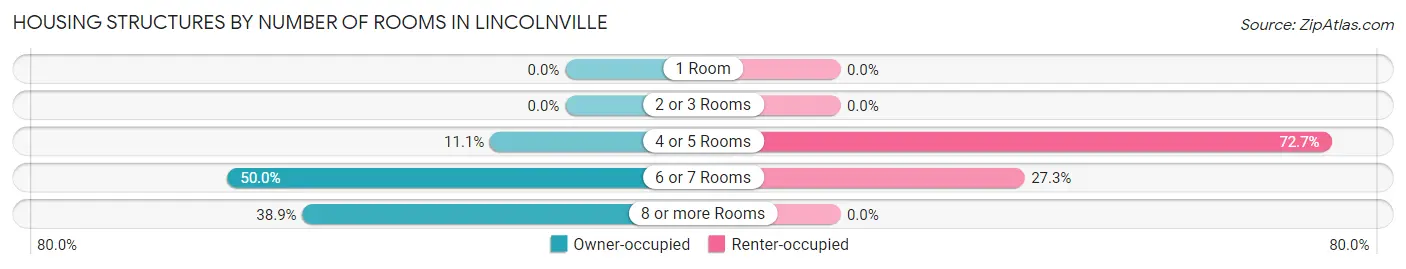
| Number of Rooms | Owner-occupied | Renter-occupied |
| 1 Room | 0 (0.0%) | 0 (0.0%) |
| 2 or 3 Rooms | 0 (0.0%) | 0 (0.0%) |
| 4 or 5 Rooms | 2 (11.1%) | 8 (72.7%) |
| 6 or 7 Rooms | 9 (50.0%) | 3 (27.3%) |
| 8 or more Rooms | 7 (38.9%) | 0 (0.0%) |
| Total | 18 (100.0%) | 11 (100.0%) |
Housing Structure by Heating Type in Lincolnville
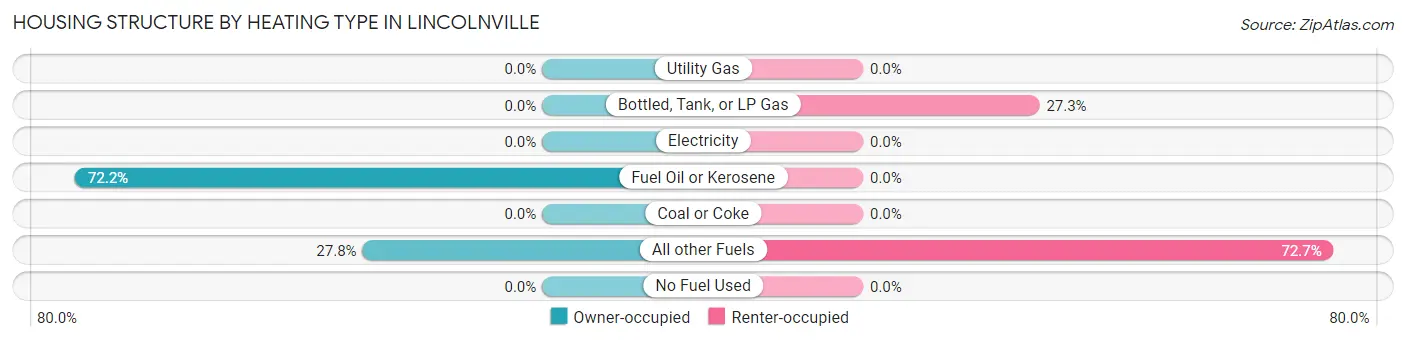
| Heating Type | Owner-occupied | Renter-occupied |
| Utility Gas | 0 (0.0%) | 0 (0.0%) |
| Bottled, Tank, or LP Gas | 0 (0.0%) | 3 (27.3%) |
| Electricity | 0 (0.0%) | 0 (0.0%) |
| Fuel Oil or Kerosene | 13 (72.2%) | 0 (0.0%) |
| Coal or Coke | 0 (0.0%) | 0 (0.0%) |
| All other Fuels | 5 (27.8%) | 8 (72.7%) |
| No Fuel Used | 0 (0.0%) | 0 (0.0%) |
| Total | 18 (100.0%) | 11 (100.0%) |
Household Vehicle Usage in Lincolnville
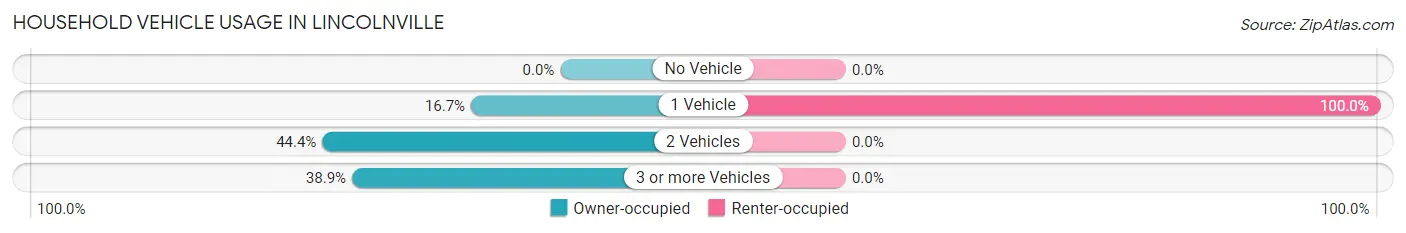
| Vehicles per Household | Owner-occupied | Renter-occupied |
| No Vehicle | 0 (0.0%) | 0 (0.0%) |
| 1 Vehicle | 3 (16.7%) | 11 (100.0%) |
| 2 Vehicles | 8 (44.4%) | 0 (0.0%) |
| 3 or more Vehicles | 7 (38.9%) | 0 (0.0%) |
| Total | 18 (100.0%) | 11 (100.0%) |
Real Estate & Mortgages in Lincolnville
Real Estate and Mortgage Overview in Lincolnville
| Characteristic | Without Mortgage | With Mortgage |
| Housing Units | 18 | 0 |
| Median Property Value | $70,000 | $0 |
| Median Household Income | $51,875 | $0 |
| Monthly Housing Costs | $350 | $0 |
| Real Estate Taxes | $1,200 | $0 |
Property Value by Mortgage Status in Lincolnville
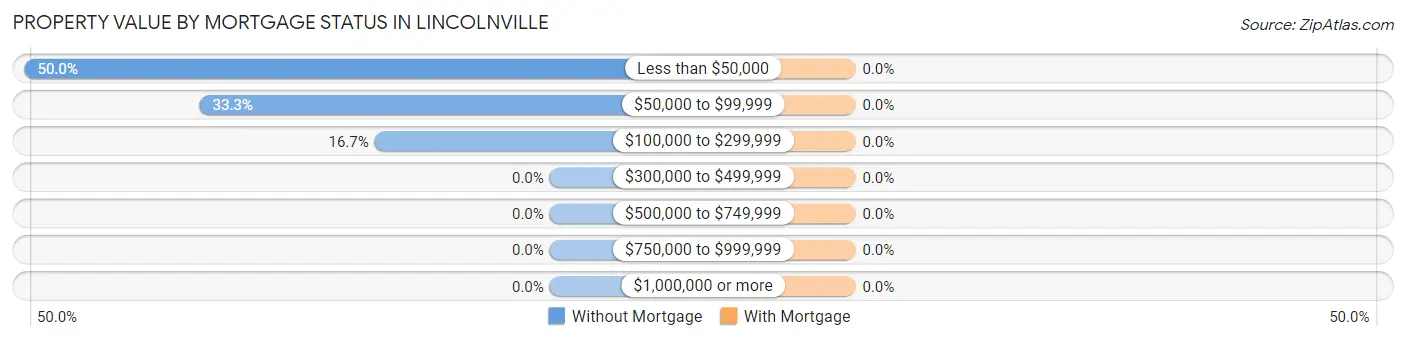
| Property Value | Without Mortgage | With Mortgage |
| Less than $50,000 | 9 (50.0%) | 0 (0.0%) |
| $50,000 to $99,999 | 6 (33.3%) | 0 (0.0%) |
| $100,000 to $299,999 | 3 (16.7%) | 0 (0.0%) |
| $300,000 to $499,999 | 0 (0.0%) | 0 (0.0%) |
| $500,000 to $749,999 | 0 (0.0%) | 0 (0.0%) |
| $750,000 to $999,999 | 0 (0.0%) | 0 (0.0%) |
| $1,000,000 or more | 0 (0.0%) | 0 (0.0%) |
| Total | 18 (100.0%) | 0 (0.0%) |
Household Income by Mortgage Status in Lincolnville
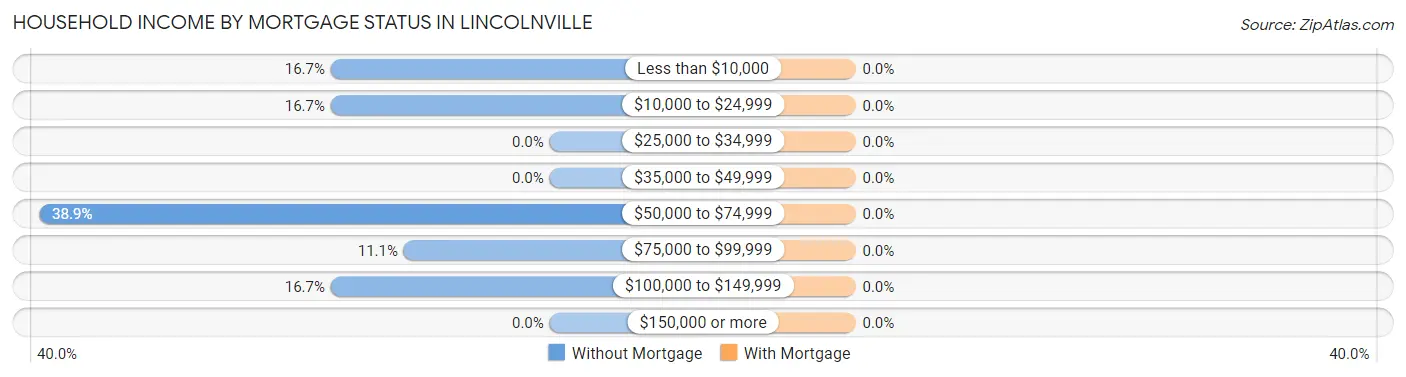
| Household Income | Without Mortgage | With Mortgage |
| Less than $10,000 | 3 (16.7%) | 0 (0.0%) |
| $10,000 to $24,999 | 3 (16.7%) | 0 (0.0%) |
| $25,000 to $34,999 | 0 (0.0%) | 0 (0.0%) |
| $35,000 to $49,999 | 0 (0.0%) | 0 (0.0%) |
| $50,000 to $74,999 | 7 (38.9%) | 0 (0.0%) |
| $75,000 to $99,999 | 2 (11.1%) | 0 (0.0%) |
| $100,000 to $149,999 | 3 (16.7%) | 0 (0.0%) |
| $150,000 or more | 0 (0.0%) | 0 (0.0%) |
| Total | 18 (100.0%) | 0 (0.0%) |
Property Value to Household Income Ratio in Lincolnville
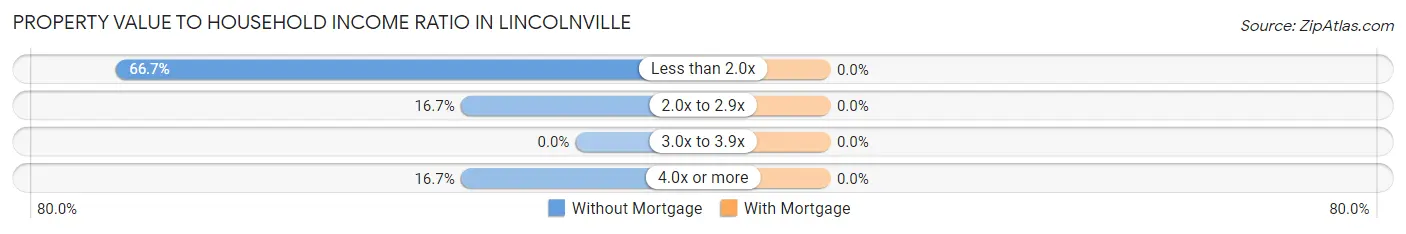
| Value-to-Income Ratio | Without Mortgage | With Mortgage |
| Less than 2.0x | 12 (66.7%) | 0 (0.0%) |
| 2.0x to 2.9x | 3 (16.7%) | 0 (0.0%) |
| 3.0x to 3.9x | 0 (0.0%) | 0 (0.0%) |
| 4.0x or more | 3 (16.7%) | 0 (0.0%) |
| Total | 18 (100.0%) | 0 (0.0%) |
Real Estate Taxes by Mortgage Status in Lincolnville
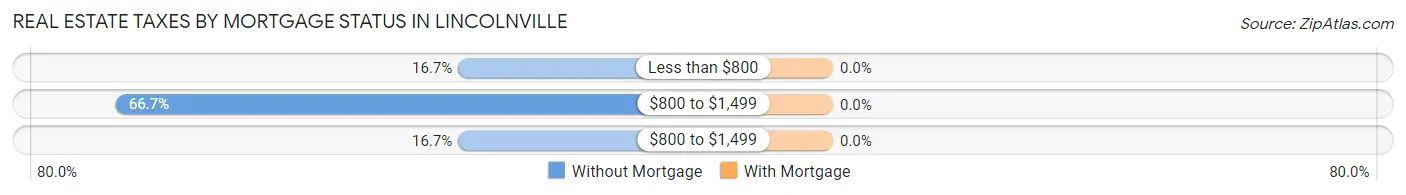
| Property Taxes | Without Mortgage | With Mortgage |
| Less than $800 | 3 (16.7%) | 0 (0.0%) |
| $800 to $1,499 | 12 (66.7%) | 0 (0.0%) |
| $800 to $1,499 | 3 (16.7%) | 0 (0.0%) |
| Total | 18 (100.0%) | 0 (0.0%) |
Health & Disability in Lincolnville
Health Insurance Coverage by Age in Lincolnville
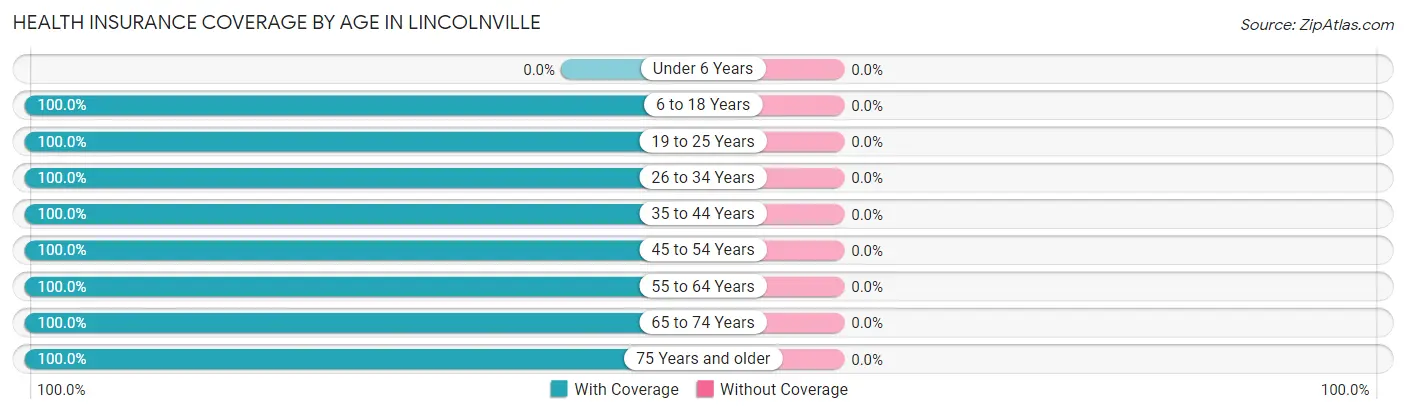
| Age Bracket | With Coverage | Without Coverage |
| Under 6 Years | 0 (0.0%) | 0 (0.0%) |
| 6 to 18 Years | 3 (100.0%) | 0 (0.0%) |
| 19 to 25 Years | 4 (100.0%) | 0 (0.0%) |
| 26 to 34 Years | 4 (100.0%) | 0 (0.0%) |
| 35 to 44 Years | 7 (100.0%) | 0 (0.0%) |
| 45 to 54 Years | 12 (100.0%) | 0 (0.0%) |
| 55 to 64 Years | 3 (100.0%) | 0 (0.0%) |
| 65 to 74 Years | 22 (100.0%) | 0 (0.0%) |
| 75 Years and older | 7 (100.0%) | 0 (0.0%) |
| Total | 62 (100.0%) | 0 (0.0%) |
Health Insurance Coverage by Citizenship Status in Lincolnville
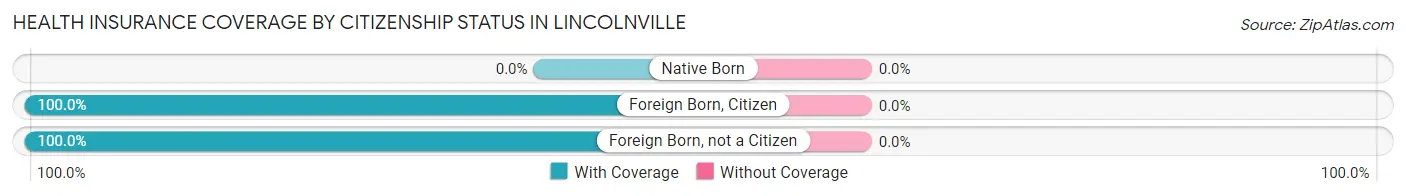
| Citizenship Status | With Coverage | Without Coverage |
| Native Born | 0 (0.0%) | 0 (0.0%) |
| Foreign Born, Citizen | 3 (100.0%) | 0 (0.0%) |
| Foreign Born, not a Citizen | 4 (100.0%) | 0 (0.0%) |
Health Insurance Coverage by Household Income in Lincolnville
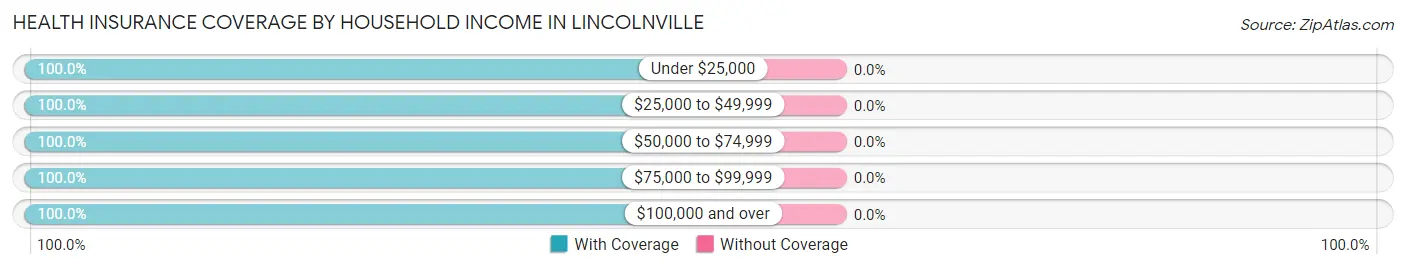
| Household Income | With Coverage | Without Coverage |
| Under $25,000 | 9 (100.0%) | 0 (0.0%) |
| $25,000 to $49,999 | 15 (100.0%) | 0 (0.0%) |
| $50,000 to $74,999 | 20 (100.0%) | 0 (0.0%) |
| $75,000 to $99,999 | 8 (100.0%) | 0 (0.0%) |
| $100,000 and over | 10 (100.0%) | 0 (0.0%) |
Public vs Private Health Insurance Coverage by Age in Lincolnville
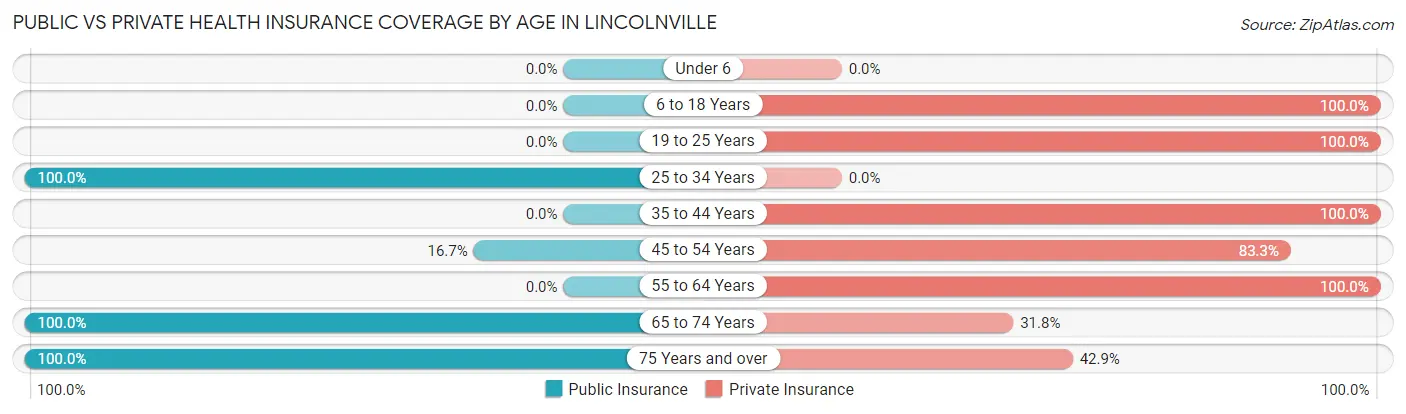
| Age Bracket | Public Insurance | Private Insurance |
| Under 6 | 0 (0.0%) | 0 (0.0%) |
| 6 to 18 Years | 0 (0.0%) | 3 (100.0%) |
| 19 to 25 Years | 0 (0.0%) | 4 (100.0%) |
| 25 to 34 Years | 4 (100.0%) | 0 (0.0%) |
| 35 to 44 Years | 0 (0.0%) | 7 (100.0%) |
| 45 to 54 Years | 2 (16.7%) | 10 (83.3%) |
| 55 to 64 Years | 0 (0.0%) | 3 (100.0%) |
| 65 to 74 Years | 22 (100.0%) | 7 (31.8%) |
| 75 Years and over | 7 (100.0%) | 3 (42.9%) |
| Total | 35 (56.5%) | 37 (59.7%) |
Disability Status by Sex by Age in Lincolnville
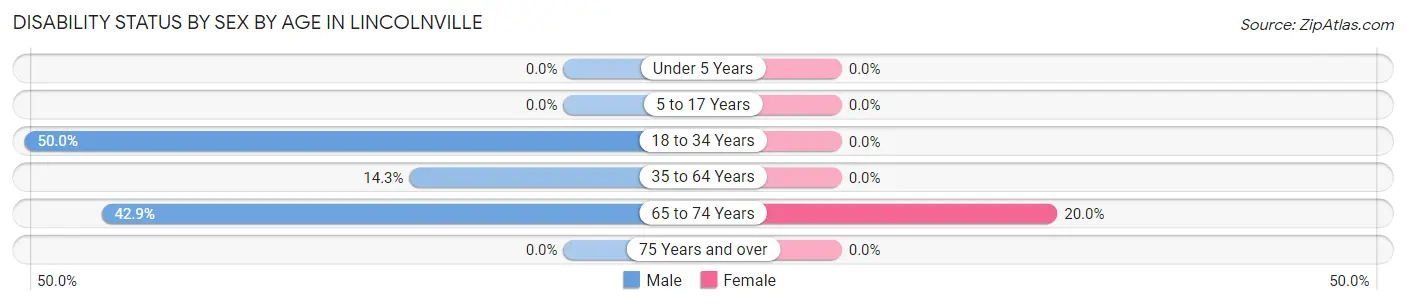
| Age Bracket | Male | Female |
| Under 5 Years | 0 (0.0%) | 0 (0.0%) |
| 5 to 17 Years | 0 (0.0%) | 0 (0.0%) |
| 18 to 34 Years | 4 (50.0%) | 0 (0.0%) |
| 35 to 64 Years | 2 (14.3%) | 0 (0.0%) |
| 65 to 74 Years | 3 (42.9%) | 3 (20.0%) |
| 75 Years and over | 0 (0.0%) | 0 (0.0%) |
Disability Class by Sex by Age in Lincolnville
Disability Class: Hearing Difficulty
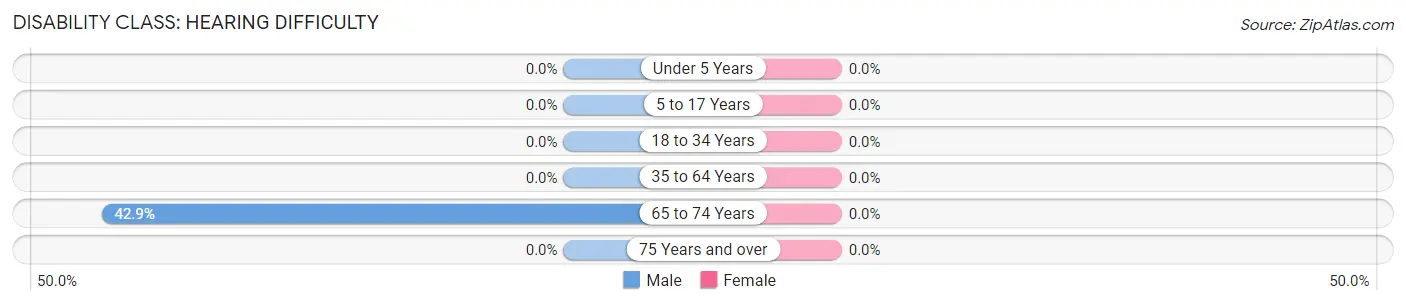
| Age Bracket | Male | Female |
| Under 5 Years | 0 (0.0%) | 0 (0.0%) |
| 5 to 17 Years | 0 (0.0%) | 0 (0.0%) |
| 18 to 34 Years | 0 (0.0%) | 0 (0.0%) |
| 35 to 64 Years | 0 (0.0%) | 0 (0.0%) |
| 65 to 74 Years | 3 (42.9%) | 0 (0.0%) |
| 75 Years and over | 0 (0.0%) | 0 (0.0%) |
Disability Class: Vision Difficulty
| Age Bracket | Male | Female |
| Under 5 Years | 0 (0.0%) | 0 (0.0%) |
| 5 to 17 Years | 0 (0.0%) | 0 (0.0%) |
| 18 to 34 Years | 0 (0.0%) | 0 (0.0%) |
| 35 to 64 Years | 0 (0.0%) | 0 (0.0%) |
| 65 to 74 Years | 0 (0.0%) | 0 (0.0%) |
| 75 Years and over | 0 (0.0%) | 0 (0.0%) |
Disability Class: Cognitive Difficulty
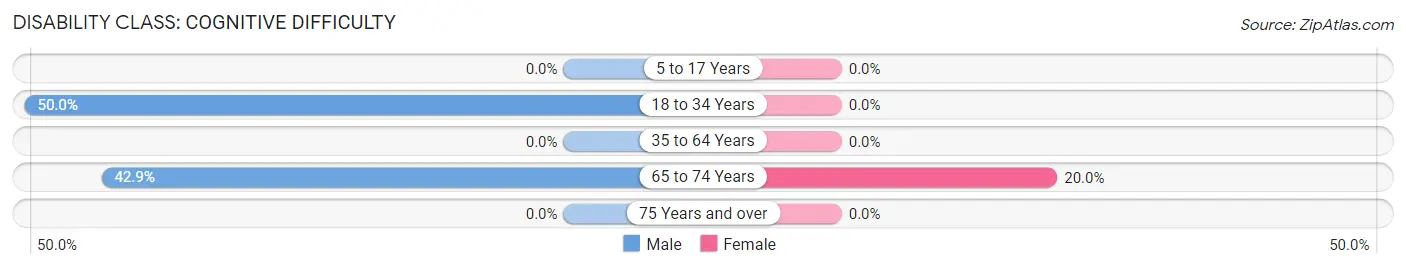
| Age Bracket | Male | Female |
| 5 to 17 Years | 0 (0.0%) | 0 (0.0%) |
| 18 to 34 Years | 4 (50.0%) | 0 (0.0%) |
| 35 to 64 Years | 0 (0.0%) | 0 (0.0%) |
| 65 to 74 Years | 3 (42.9%) | 3 (20.0%) |
| 75 Years and over | 0 (0.0%) | 0 (0.0%) |
Disability Class: Ambulatory Difficulty
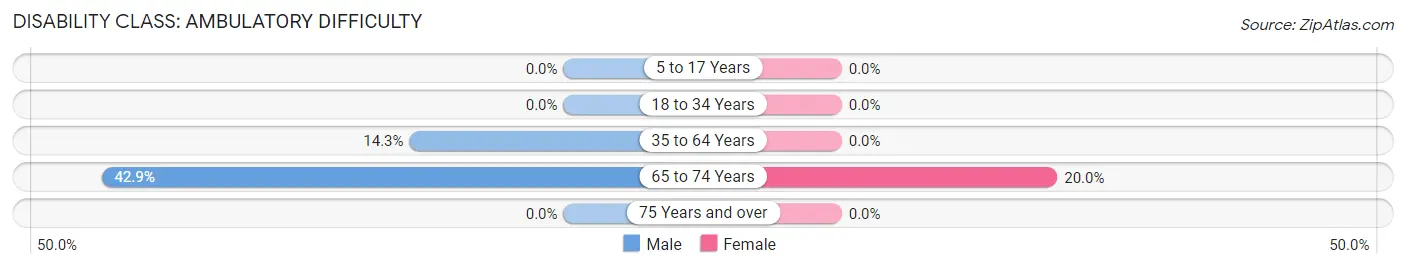
| Age Bracket | Male | Female |
| 5 to 17 Years | 0 (0.0%) | 0 (0.0%) |
| 18 to 34 Years | 0 (0.0%) | 0 (0.0%) |
| 35 to 64 Years | 2 (14.3%) | 0 (0.0%) |
| 65 to 74 Years | 3 (42.9%) | 3 (20.0%) |
| 75 Years and over | 0 (0.0%) | 0 (0.0%) |
Disability Class: Self-Care Difficulty
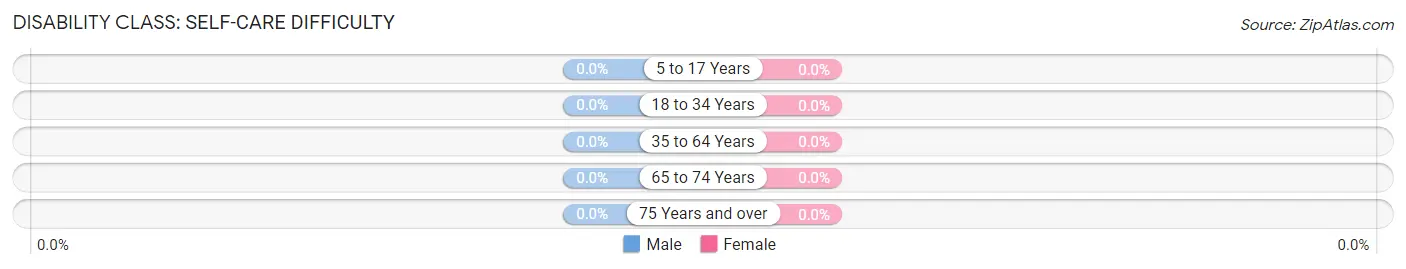
| Age Bracket | Male | Female |
| 5 to 17 Years | 0 (0.0%) | 0 (0.0%) |
| 18 to 34 Years | 0 (0.0%) | 0 (0.0%) |
| 35 to 64 Years | 0 (0.0%) | 0 (0.0%) |
| 65 to 74 Years | 0 (0.0%) | 0 (0.0%) |
| 75 Years and over | 0 (0.0%) | 0 (0.0%) |
Technology Access in Lincolnville
Computing Device Access in Lincolnville
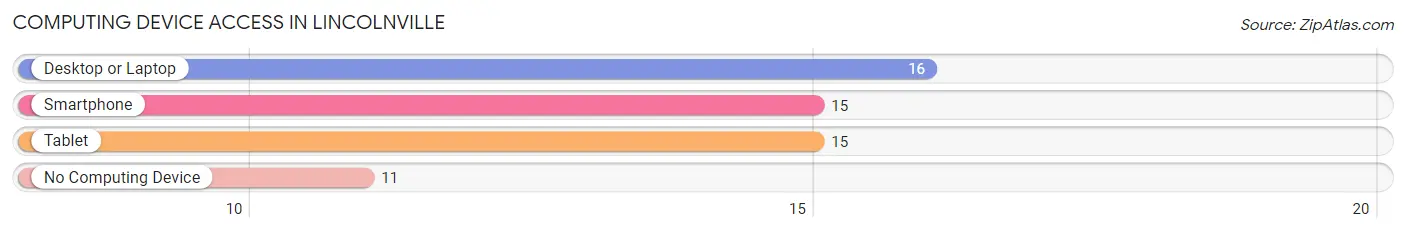
| Device Type | # Households | % Households |
| Desktop or Laptop | 16 | 55.2% |
| Smartphone | 15 | 51.7% |
| Tablet | 15 | 51.7% |
| No Computing Device | 11 | 37.9% |
| Total | 29 | 100.0% |
Internet Access in Lincolnville
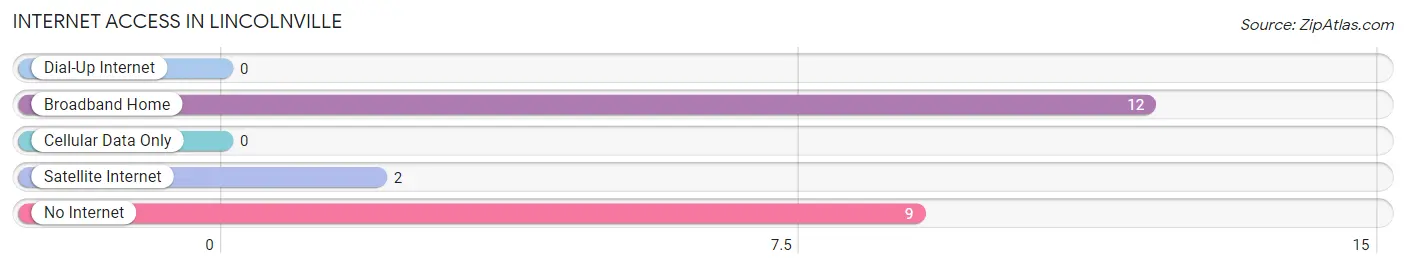
| Internet Type | # Households | % Households |
| Dial-Up Internet | 0 | 0.0% |
| Broadband Home | 12 | 41.4% |
| Cellular Data Only | 0 | 0.0% |
| Satellite Internet | 2 | 6.9% |
| No Internet | 9 | 31.0% |
| Total | 29 | 100.0% |
Lincolnville Summary
Lincolnville is a small borough located in Butler County, Pennsylvania. It is situated in the western part of the state, approximately 30 miles north of Pittsburgh. The borough was founded in 1876 and is named after President Abraham Lincoln. As of the 2010 census, the population of Lincolnville was 1,093.
History
Lincolnville was founded in 1876 by a group of settlers from the nearby town of Butler. The settlers were looking for a place to build a new community and chose the area that is now Lincolnville. The town was named after President Abraham Lincoln, who had recently been assassinated. The first settlers built a church, a school, and a few stores.
The town grew slowly over the years, but it was not until the early 1900s that it began to experience significant growth. This was due to the development of the oil and gas industry in the area. The town became a center for oil and gas production, and many of the residents found employment in the industry.
In the 1950s, the town experienced a period of decline as the oil and gas industry began to decline. However, the town was able to rebound in the 1960s and 1970s due to the development of the nearby Pittsburgh International Airport. The airport brought new jobs and businesses to the area, and the town experienced a period of growth.
Geography
Lincolnville is located in western Pennsylvania, approximately 30 miles north of Pittsburgh. The borough is situated in the Allegheny Plateau region of the state, and is surrounded by rolling hills and forests. The borough is located on the banks of the Connoquenessing Creek, which flows through the town.
The borough covers an area of 1.2 square miles, and is home to a variety of wildlife, including deer, foxes, and turkeys. The climate in Lincolnville is generally mild, with temperatures ranging from the low 30s in the winter to the mid-80s in the summer.
Economy
The economy of Lincolnville is largely based on the oil and gas industry. The town is home to several oil and gas companies, and many of the residents are employed in the industry. In addition, the town is home to several small businesses, including restaurants, retail stores, and service providers.
The town is also home to the Pittsburgh International Airport, which is located just outside of the borough. The airport provides employment for many of the residents, and is a major source of revenue for the town.
Demographics
As of the 2010 census, the population of Lincolnville was 1,093. The population is largely white (94.3%), with small percentages of African American (2.2%), Asian (1.2%), and Hispanic (1.2%) residents. The median household income in the borough is $45,000, and the median age is 43.
The town is home to a variety of religious denominations, including Catholic (44.3%), Protestant (25.2%), and other (30.5%). The town is served by the Butler Area School District, which includes two elementary schools, one middle school, and one high school.
Conclusion
Lincolnville is a small borough located in Butler County, Pennsylvania. It was founded in 1876 and is named after President Abraham Lincoln. The town is situated in the Allegheny Plateau region of the state, and is surrounded by rolling hills and forests. The economy of Lincolnville is largely based on the oil and gas industry, and the town is also home to the Pittsburgh International Airport. As of the 2010 census, the population of Lincolnville was 1,093. The town is home to a variety of religious denominations, and is served by the Butler Area School District.
Common Questions
What is Per Capita Income in Lincolnville?
Per Capita income in Lincolnville is $28,552.
What is the Median Family Income in Lincolnville?
Median Family Income in Lincolnville is $51,250.
What is the Median Household income in Lincolnville?
Median Household Income in Lincolnville is $49,219.
What is Inequality or Gini Index in Lincolnville?
Inequality or Gini Index in Lincolnville is 0.31.
What is the Total Population of Lincolnville?
Total Population of Lincolnville is 62.
What is the Total Male Population of Lincolnville?
Total Male Population of Lincolnville is 39.
What is the Total Female Population of Lincolnville?
Total Female Population of Lincolnville is 23.
What is the Ratio of Males per 100 Females in Lincolnville?
There are 169.57 Males per 100 Females in Lincolnville.
What is the Ratio of Females per 100 Males in Lincolnville?
There are 58.97 Females per 100 Males in Lincolnville.
What is the Median Population Age in Lincolnville?
Median Population Age in Lincolnville is 64.3 Years.
What is the Average Family Size in Lincolnville
Average Family Size in Lincolnville is 2.7 People.
What is the Average Household Size in Lincolnville
Average Household Size in Lincolnville is 2.1 People.
How Large is the Labor Force in Lincolnville?
There are 26 People in the Labor Forcein in Lincolnville.
What is the Percentage of People in the Labor Force in Lincolnville?
44.1% of People are in the Labor Force in Lincolnville.