Cochranville, PA Map & Demographics
Cochranville Map
Cochranville Overview
$54,223
PER CAPITA INCOME
$77,470
AVG FAMILY INCOME
$92,292
AVG HOUSEHOLD INCOME
58.9%
WAGE / INCOME GAP [ % ]
41.1¢/ $1
WAGE / INCOME GAP [ $ ]
0.32
INEQUALITY / GINI INDEX
488
TOTAL POPULATION
261
MALE POPULATION
227
FEMALE POPULATION
114.98
MALES / 100 FEMALES
86.97
FEMALES / 100 MALES
49.6
MEDIAN AGE
2.6
AVG FAMILY SIZE
2.1
AVG HOUSEHOLD SIZE
245
LABOR FORCE [ PEOPLE ]
58.2%
PERCENT IN LABOR FORCE
2.9%
UNEMPLOYMENT RATE
Cochranville Zip Codes
Income in Cochranville
Income Overview in Cochranville
Per Capita Income in Cochranville is $54,223, while median incomes of families and households are $77,470 and $92,292 respectively.
| Characteristic | Number | Measure |
| Per Capita Income | 488 | $54,223 |
| Median Family Income | 149 | $77,470 |
| Mean Family Income | 149 | $104,524 |
| Median Household Income | 235 | $92,292 |
| Mean Household Income | 235 | $112,337 |
| Income Deficit | 149 | $0 |
| Wage / Income Gap (%) | 488 | 58.91% |
| Wage / Income Gap ($) | 488 | 41.09¢ per $1 |
| Gini / Inequality Index | 488 | 0.32 |
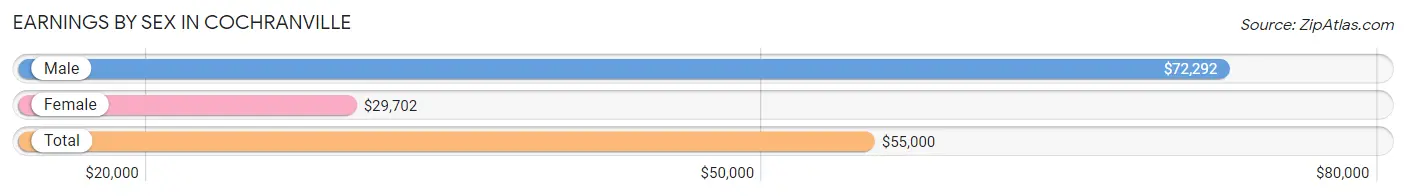
Earnings by Sex in Cochranville
Average Earnings in Cochranville are $55,000, $72,292 for men and $29,702 for women, a difference of 58.9%.
| Sex | Number | Average Earnings |
| Male | 167 (60.1%) | $72,292 |
| Female | 111 (39.9%) | $29,702 |
| Total | 278 (100.0%) | $55,000 |
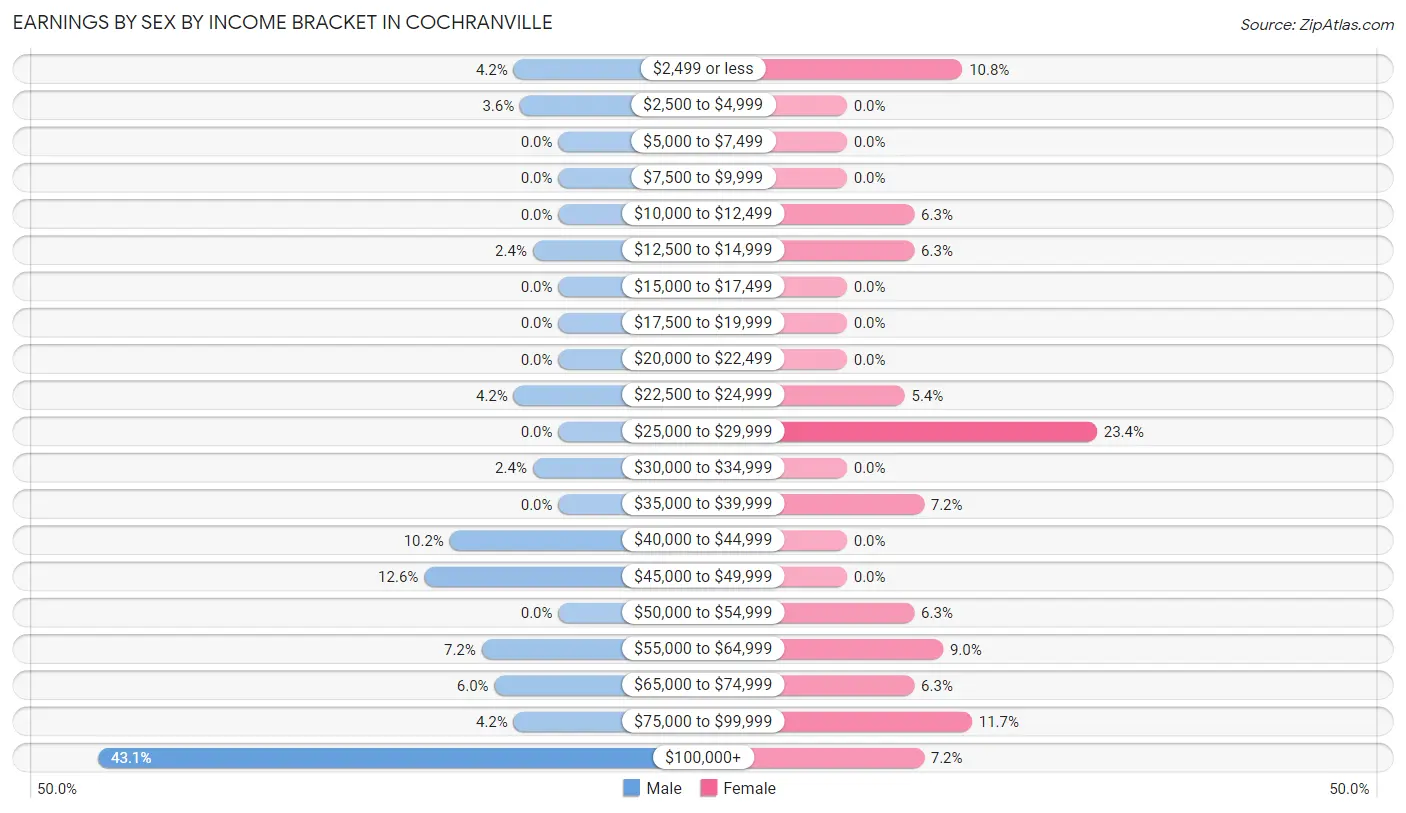
Earnings by Sex by Income Bracket in Cochranville
The most common earnings brackets in Cochranville are $100,000+ for men (72 | 43.1%) and $25,000 to $29,999 for women (26 | 23.4%).
| Income | Male | Female |
| $2,499 or less | 7 (4.2%) | 12 (10.8%) |
| $2,500 to $4,999 | 6 (3.6%) | 0 (0.0%) |
| $5,000 to $7,499 | 0 (0.0%) | 0 (0.0%) |
| $7,500 to $9,999 | 0 (0.0%) | 0 (0.0%) |
| $10,000 to $12,499 | 0 (0.0%) | 7 (6.3%) |
| $12,500 to $14,999 | 4 (2.4%) | 7 (6.3%) |
| $15,000 to $17,499 | 0 (0.0%) | 0 (0.0%) |
| $17,500 to $19,999 | 0 (0.0%) | 0 (0.0%) |
| $20,000 to $22,499 | 0 (0.0%) | 0 (0.0%) |
| $22,500 to $24,999 | 7 (4.2%) | 6 (5.4%) |
| $25,000 to $29,999 | 0 (0.0%) | 26 (23.4%) |
| $30,000 to $34,999 | 4 (2.4%) | 0 (0.0%) |
| $35,000 to $39,999 | 0 (0.0%) | 8 (7.2%) |
| $40,000 to $44,999 | 17 (10.2%) | 0 (0.0%) |
| $45,000 to $49,999 | 21 (12.6%) | 0 (0.0%) |
| $50,000 to $54,999 | 0 (0.0%) | 7 (6.3%) |
| $55,000 to $64,999 | 12 (7.2%) | 10 (9.0%) |
| $65,000 to $74,999 | 10 (6.0%) | 7 (6.3%) |
| $75,000 to $99,999 | 7 (4.2%) | 13 (11.7%) |
| $100,000+ | 72 (43.1%) | 8 (7.2%) |
| Total | 167 (100.0%) | 111 (100.0%) |
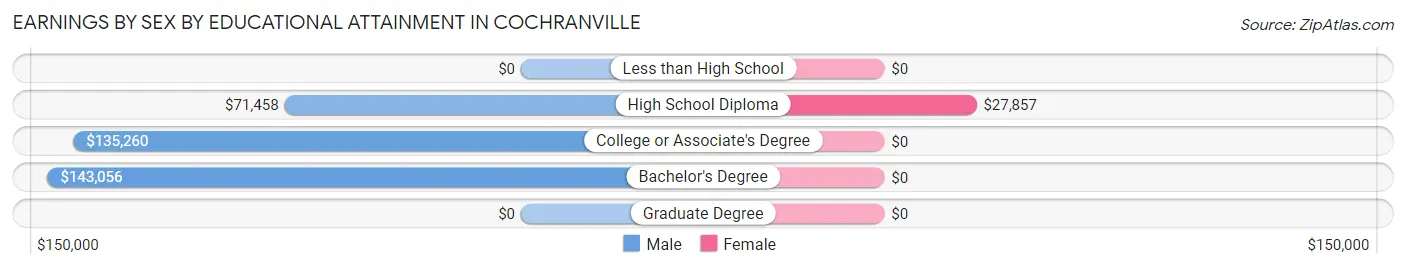
Earnings by Sex by Educational Attainment in Cochranville
Average earnings in Cochranville are $81,607 for men and $36,406 for women, a difference of 55.4%. Men with an educational attainment of bachelor's degree enjoy the highest average annual earnings of $143,056, while those with high school diploma education earn the least with $71,458. Women with an educational attainment of high school diploma earn the most with the average annual earnings of $27,857, while those with high school diploma education have the smallest earnings of $27,857.
| Educational Attainment | Male Income | Female Income |
| Less than High School | - | - |
| High School Diploma | $71,458 | $27,857 |
| College or Associate's Degree | $135,260 | $0 |
| Bachelor's Degree | $143,056 | $0 |
| Graduate Degree | - | - |
| Total | $81,607 | $36,406 |
Family Income in Cochranville
Family Income Brackets in Cochranville
According to the Cochranville family income data, there are 53 families falling into the $75,000 to $99,999 income range, which is the most common income bracket and makes up 35.6% of all families.
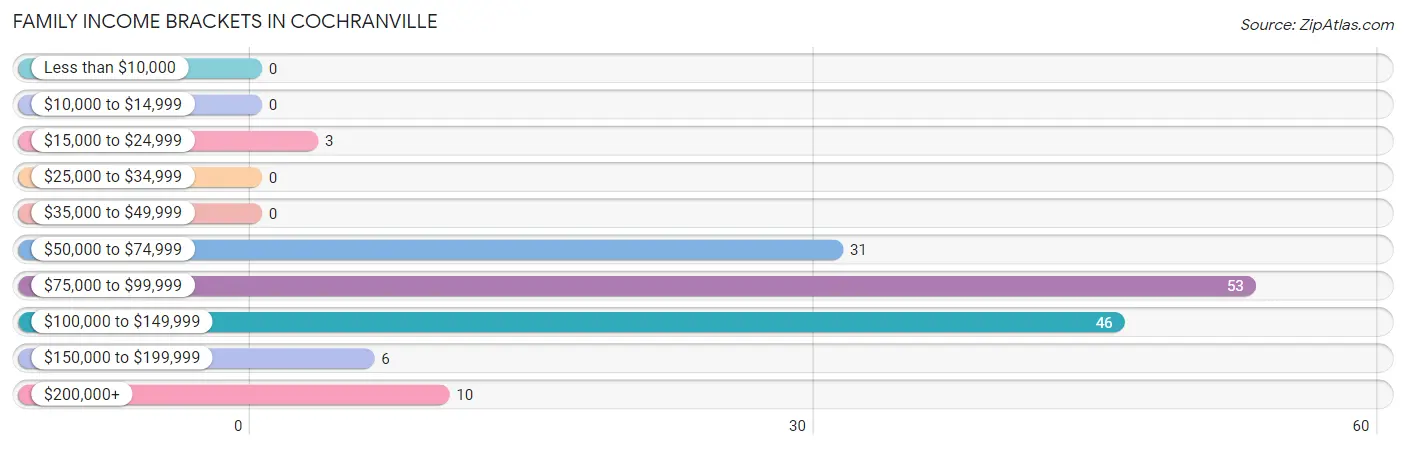
| Income Bracket | # Families | % Families |
| Less than $10,000 | 0 | 0.0% |
| $10,000 to $14,999 | 0 | 0.0% |
| $15,000 to $24,999 | 3 | 2.0% |
| $25,000 to $34,999 | 0 | 0.0% |
| $35,000 to $49,999 | 0 | 0.0% |
| $50,000 to $74,999 | 31 | 20.8% |
| $75,000 to $99,999 | 53 | 35.6% |
| $100,000 to $149,999 | 46 | 30.9% |
| $150,000 to $199,999 | 6 | 4.0% |
| $200,000+ | 10 | 6.7% |
Family Income by Famaliy Size in Cochranville
3-person families (26 | 17.4%) account for the highest median family income in Cochranville with $121,250 per family, while 3-person families (26 | 17.4%) have the highest median income of $40,417 per family member.
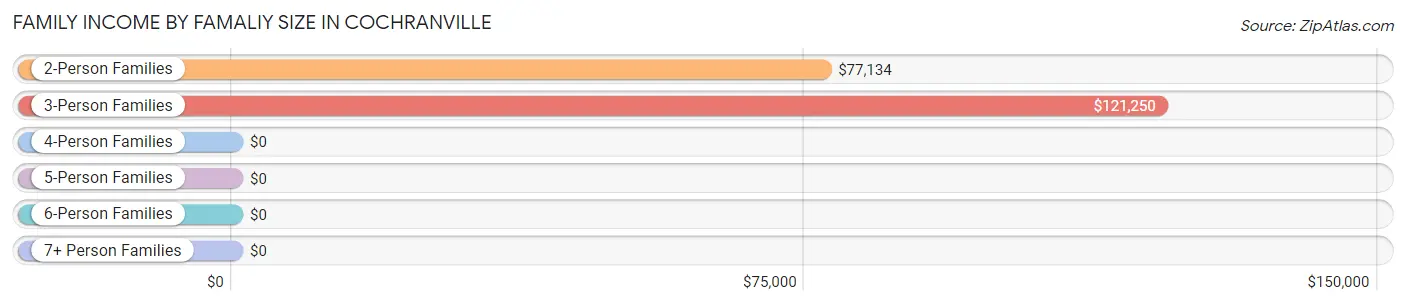
| Income Bracket | # Families | Median Income |
| 2-Person Families | 100 (67.1%) | $77,134 |
| 3-Person Families | 26 (17.4%) | $121,250 |
| 4-Person Families | 17 (11.4%) | $0 |
| 5-Person Families | 6 (4.0%) | $0 |
| 6-Person Families | 0 (0.0%) | $0 |
| 7+ Person Families | 0 (0.0%) | $0 |
| Total | 149 (100.0%) | $77,470 |
Family Income by Number of Earners in Cochranville
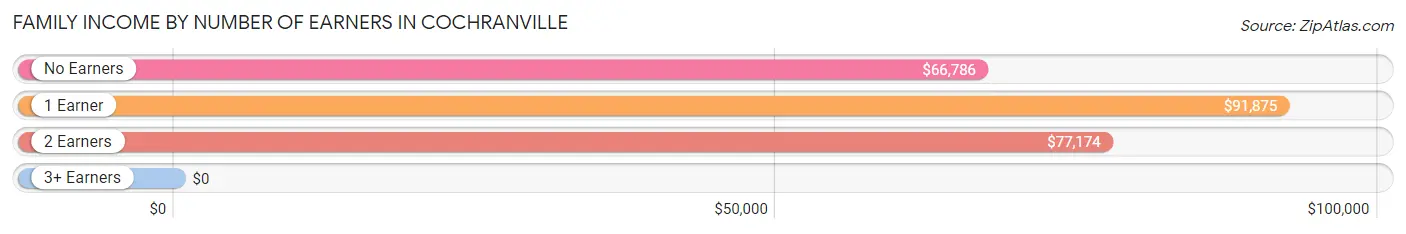
| Number of Earners | # Families | Median Income |
| No Earners | 26 (17.4%) | $66,786 |
| 1 Earner | 49 (32.9%) | $91,875 |
| 2 Earners | 64 (42.9%) | $77,174 |
| 3+ Earners | 10 (6.7%) | $0 |
| Total | 149 (100.0%) | $77,470 |
Household Income in Cochranville
Household Income Brackets in Cochranville
With 71 households falling in the category, the $100,000 to $149,999 income range is the most frequent in Cochranville, accounting for 30.2% of all households.
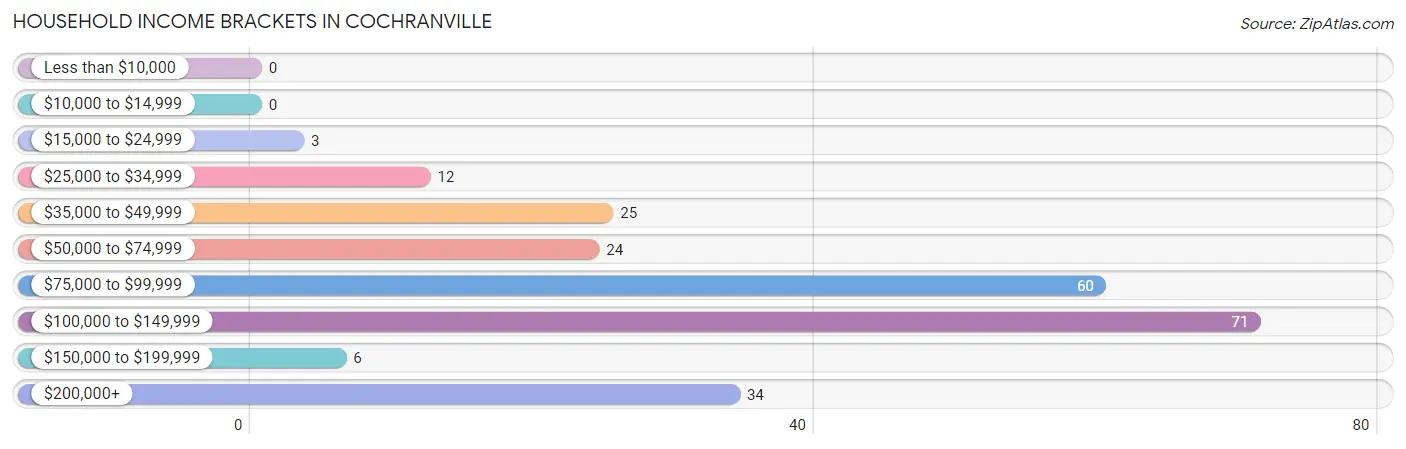
| Income Bracket | # Households | % Households |
| Less than $10,000 | 0 | 0.0% |
| $10,000 to $14,999 | 0 | 0.0% |
| $15,000 to $24,999 | 3 | 1.3% |
| $25,000 to $34,999 | 12 | 5.1% |
| $35,000 to $49,999 | 25 | 10.6% |
| $50,000 to $74,999 | 24 | 10.2% |
| $75,000 to $99,999 | 60 | 25.5% |
| $100,000 to $149,999 | 71 | 30.2% |
| $150,000 to $199,999 | 6 | 2.6% |
| $200,000+ | 34 | 14.5% |
Household Income by Householder Age in Cochranville
The median household income in Cochranville is $92,292, with the highest median household income of $134,286 found in the 45 to 64 years age bracket for the primary householder. A total of 72 households (30.6%) fall into this category. Meanwhile, the 15 to 24 years age bracket for the primary householder has the lowest median household income of $0, with 7 households (3.0%) in this group.
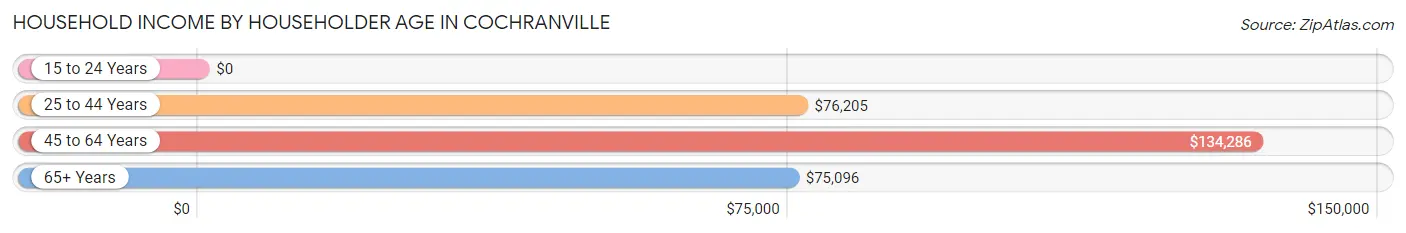
| Income Bracket | # Households | Median Income |
| 15 to 24 Years | 7 (3.0%) | $0 |
| 25 to 44 Years | 51 (21.7%) | $76,205 |
| 45 to 64 Years | 72 (30.6%) | $134,286 |
| 65+ Years | 105 (44.7%) | $75,096 |
| Total | 235 (100.0%) | $92,292 |
Poverty in Cochranville
Income Below Poverty by Sex and Age in Cochranville
With 2.7% poverty level for males and 6.2% for females among the residents of Cochranville, 18 to 24 year old males and 15 year old females are the most vulnerable to poverty, with 7 males (20.6%) and 11 females (64.7%) in their respective age groups living below the poverty level.
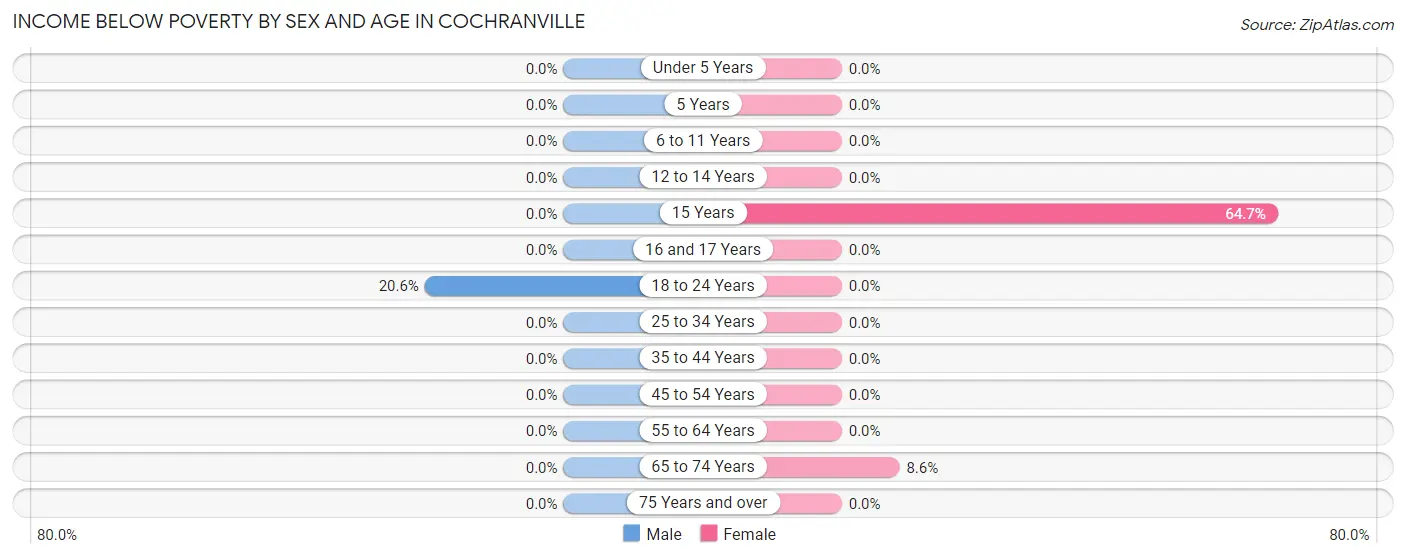
| Age Bracket | Male | Female |
| Under 5 Years | 0 (0.0%) | 0 (0.0%) |
| 5 Years | 0 (0.0%) | 0 (0.0%) |
| 6 to 11 Years | 0 (0.0%) | 0 (0.0%) |
| 12 to 14 Years | 0 (0.0%) | 0 (0.0%) |
| 15 Years | 0 (0.0%) | 11 (64.7%) |
| 16 and 17 Years | 0 (0.0%) | 0 (0.0%) |
| 18 to 24 Years | 7 (20.6%) | 0 (0.0%) |
| 25 to 34 Years | 0 (0.0%) | 0 (0.0%) |
| 35 to 44 Years | 0 (0.0%) | 0 (0.0%) |
| 45 to 54 Years | 0 (0.0%) | 0 (0.0%) |
| 55 to 64 Years | 0 (0.0%) | 0 (0.0%) |
| 65 to 74 Years | 0 (0.0%) | 3 (8.6%) |
| 75 Years and over | 0 (0.0%) | 0 (0.0%) |
| Total | 7 (2.7%) | 14 (6.2%) |
Income Above Poverty by Sex and Age in Cochranville
According to the poverty statistics in Cochranville, males aged under 5 years and females aged 5 years are the age groups that are most secure financially, with 100.0% of males and 100.0% of females in these age groups living above the poverty line.
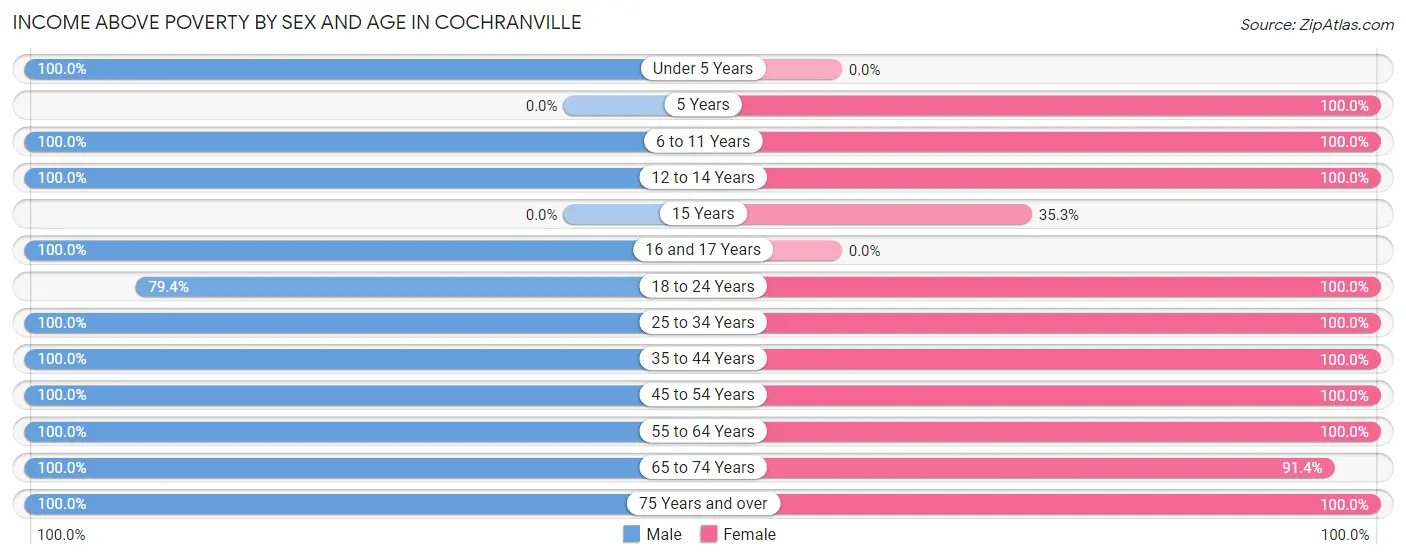
| Age Bracket | Male | Female |
| Under 5 Years | 5 (100.0%) | 0 (0.0%) |
| 5 Years | 0 (0.0%) | 5 (100.0%) |
| 6 to 11 Years | 6 (100.0%) | 26 (100.0%) |
| 12 to 14 Years | 2 (100.0%) | 6 (100.0%) |
| 15 Years | 0 (0.0%) | 6 (35.3%) |
| 16 and 17 Years | 17 (100.0%) | 0 (0.0%) |
| 18 to 24 Years | 27 (79.4%) | 28 (100.0%) |
| 25 to 34 Years | 21 (100.0%) | 9 (100.0%) |
| 35 to 44 Years | 18 (100.0%) | 29 (100.0%) |
| 45 to 54 Years | 34 (100.0%) | 16 (100.0%) |
| 55 to 64 Years | 48 (100.0%) | 27 (100.0%) |
| 65 to 74 Years | 47 (100.0%) | 32 (91.4%) |
| 75 Years and over | 29 (100.0%) | 29 (100.0%) |
| Total | 254 (97.3%) | 213 (93.8%) |
Income Below Poverty Among Married-Couple Families in Cochranville
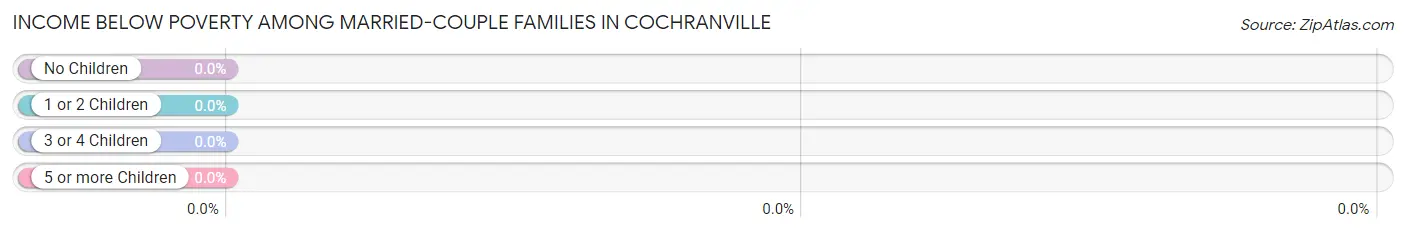
| Children | Above Poverty | Below Poverty |
| No Children | 92 (100.0%) | 0 (0.0%) |
| 1 or 2 Children | 26 (100.0%) | 0 (0.0%) |
| 3 or 4 Children | 6 (100.0%) | 0 (0.0%) |
| 5 or more Children | 0 (0.0%) | 0 (0.0%) |
| Total | 124 (100.0%) | 0 (0.0%) |
Income Below Poverty Among Single-Parent Households in Cochranville
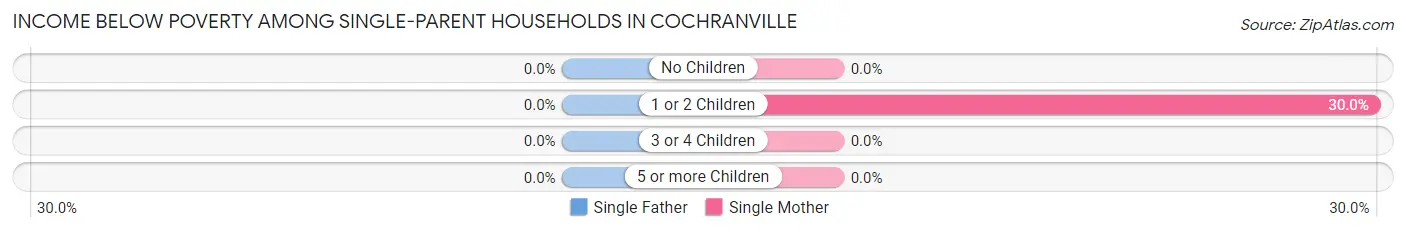
| Children | Single Father | Single Mother |
| No Children | 0 (0.0%) | 0 (0.0%) |
| 1 or 2 Children | 0 (0.0%) | 3 (30.0%) |
| 3 or 4 Children | 0 (0.0%) | 0 (0.0%) |
| 5 or more Children | 0 (0.0%) | 0 (0.0%) |
| Total | 0 (0.0%) | 3 (13.0%) |
Income Below Poverty Among Married-Couple vs Single-Parent Households in Cochranville
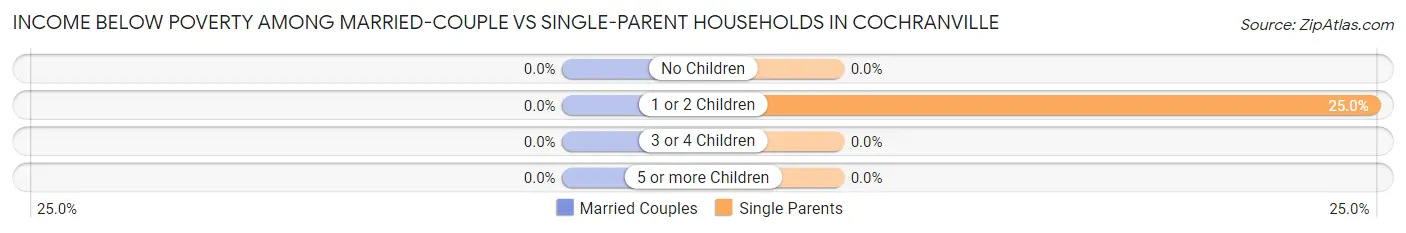
| Children | Married-Couple Families | Single-Parent Households |
| No Children | 0 (0.0%) | 0 (0.0%) |
| 1 or 2 Children | 0 (0.0%) | 3 (25.0%) |
| 3 or 4 Children | 0 (0.0%) | 0 (0.0%) |
| 5 or more Children | 0 (0.0%) | 0 (0.0%) |
| Total | 0 (0.0%) | 3 (12.0%) |
Race in Cochranville
The most populous races in Cochranville are White / Caucasian (470 | 96.3%), Hispanic or Latino (29 | 5.9%), and Two or more Races (18 | 3.7%).
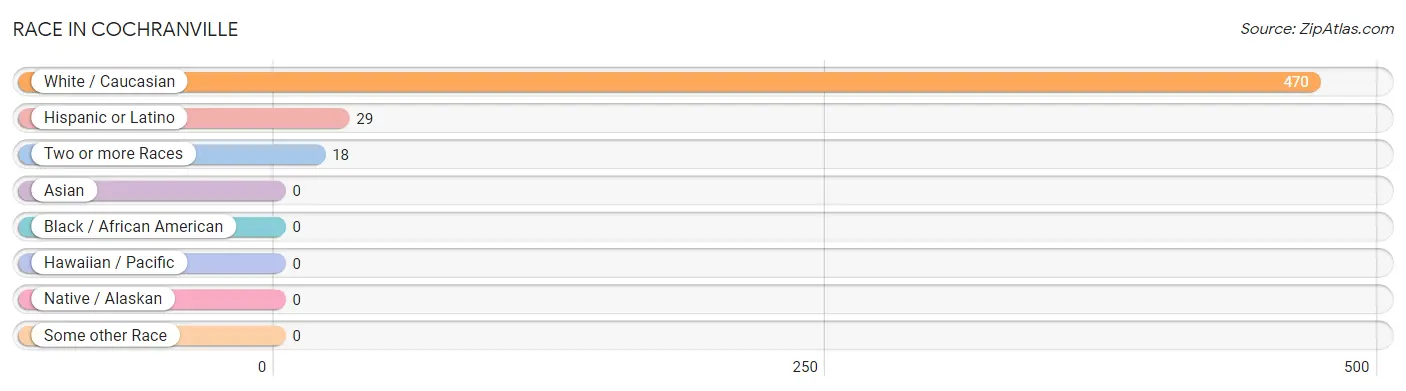
| Race | # Population | % Population |
| Asian | 0 | 0.0% |
| Black / African American | 0 | 0.0% |
| Hawaiian / Pacific | 0 | 0.0% |
| Hispanic or Latino | 29 | 5.9% |
| Native / Alaskan | 0 | 0.0% |
| White / Caucasian | 470 | 96.3% |
| Two or more Races | 18 | 3.7% |
| Some other Race | 0 | 0.0% |
| Total | 488 | 100.0% |
Ancestry in Cochranville
The most populous ancestries reported in Cochranville are German (143 | 29.3%), Irish (129 | 26.4%), French (68 | 13.9%), English (56 | 11.5%), and Italian (46 | 9.4%), together accounting for 90.6% of all Cochranville residents.
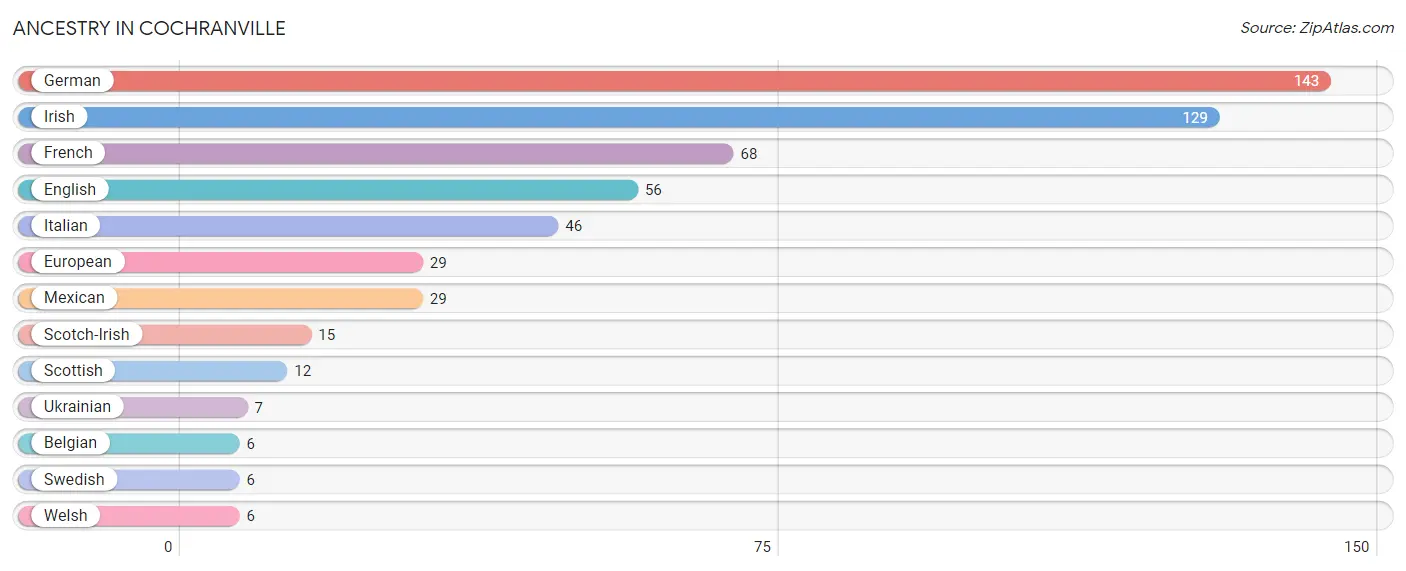
| Ancestry | # Population | % Population |
| Belgian | 6 | 1.2% |
| English | 56 | 11.5% |
| European | 29 | 5.9% |
| French | 68 | 13.9% |
| German | 143 | 29.3% |
| Irish | 129 | 26.4% |
| Italian | 46 | 9.4% |
| Mexican | 29 | 5.9% |
| Scotch-Irish | 15 | 3.1% |
| Scottish | 12 | 2.5% |
| Swedish | 6 | 1.2% |
| Ukrainian | 7 | 1.4% |
| Welsh | 6 | 1.2% | View All 13 Rows |
Immigrants in Cochranville
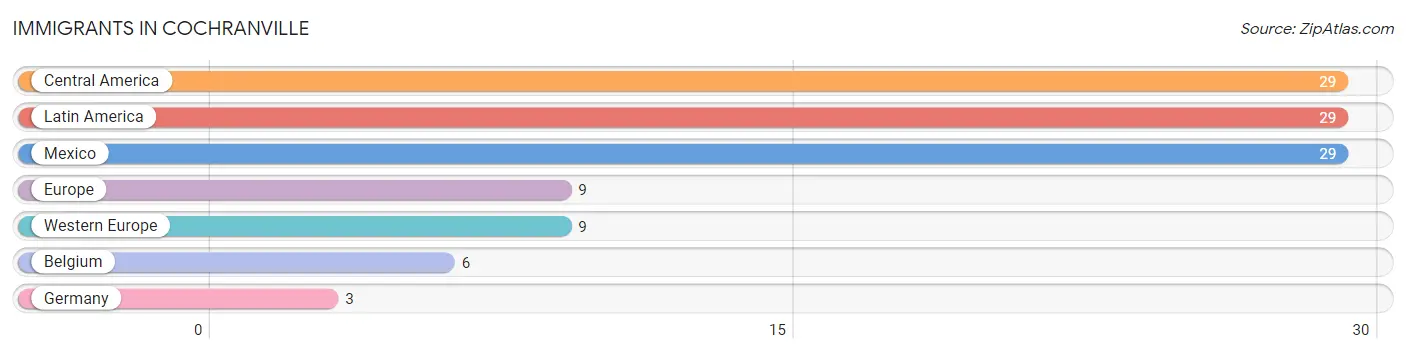
The most numerous immigrant groups reported in Cochranville came from Central America (29 | 5.9%), Latin America (29 | 5.9%), Mexico (29 | 5.9%), Europe (9 | 1.8%), and Western Europe (9 | 1.8%), together accounting for 21.5% of all Cochranville residents.
| Immigration Origin | # Population | % Population |
| Belgium | 6 | 1.2% |
| Central America | 29 | 5.9% |
| Europe | 9 | 1.8% |
| Germany | 3 | 0.6% |
| Latin America | 29 | 5.9% |
| Mexico | 29 | 5.9% |
| Western Europe | 9 | 1.8% | View All 7 Rows |
Sex and Age in Cochranville
Sex and Age in Cochranville
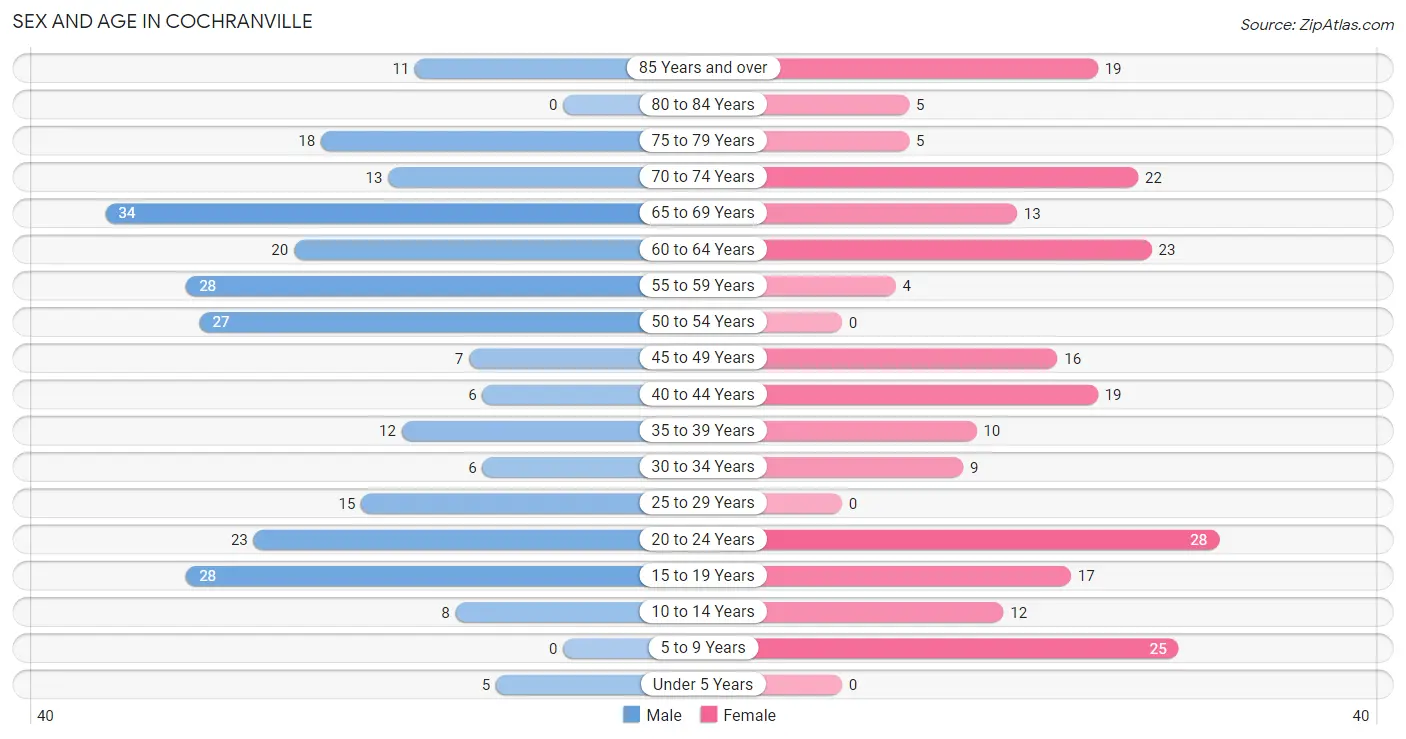
The most populous age groups in Cochranville are 65 to 69 Years (34 | 13.0%) for men and 20 to 24 Years (28 | 12.3%) for women.
| Age Bracket | Male | Female |
| Under 5 Years | 5 (1.9%) | 0 (0.0%) |
| 5 to 9 Years | 0 (0.0%) | 25 (11.0%) |
| 10 to 14 Years | 8 (3.1%) | 12 (5.3%) |
| 15 to 19 Years | 28 (10.7%) | 17 (7.5%) |
| 20 to 24 Years | 23 (8.8%) | 28 (12.3%) |
| 25 to 29 Years | 15 (5.8%) | 0 (0.0%) |
| 30 to 34 Years | 6 (2.3%) | 9 (4.0%) |
| 35 to 39 Years | 12 (4.6%) | 10 (4.4%) |
| 40 to 44 Years | 6 (2.3%) | 19 (8.4%) |
| 45 to 49 Years | 7 (2.7%) | 16 (7.0%) |
| 50 to 54 Years | 27 (10.3%) | 0 (0.0%) |
| 55 to 59 Years | 28 (10.7%) | 4 (1.8%) |
| 60 to 64 Years | 20 (7.7%) | 23 (10.1%) |
| 65 to 69 Years | 34 (13.0%) | 13 (5.7%) |
| 70 to 74 Years | 13 (5.0%) | 22 (9.7%) |
| 75 to 79 Years | 18 (6.9%) | 5 (2.2%) |
| 80 to 84 Years | 0 (0.0%) | 5 (2.2%) |
| 85 Years and over | 11 (4.2%) | 19 (8.4%) |
| Total | 261 (100.0%) | 227 (100.0%) |
Families and Households in Cochranville
Median Family Size in Cochranville
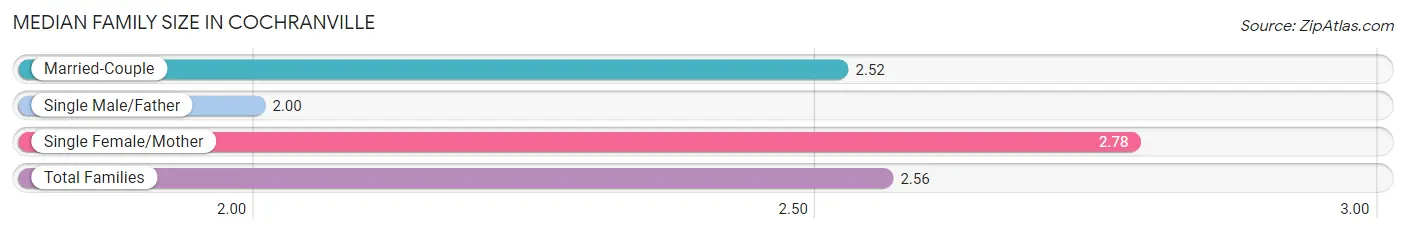
The median family size in Cochranville is 2.56 persons per family, with single female/mother families (23 | 15.4%) accounting for the largest median family size of 2.78 persons per family. On the other hand, single male/father families (2 | 1.3%) represent the smallest median family size with 2.00 persons per family.
| Family Type | # Families | Family Size |
| Married-Couple | 124 (83.2%) | 2.52 |
| Single Male/Father | 2 (1.3%) | 2.00 |
| Single Female/Mother | 23 (15.4%) | 2.78 |
| Total Families | 149 (100.0%) | 2.56 |
Median Household Size in Cochranville
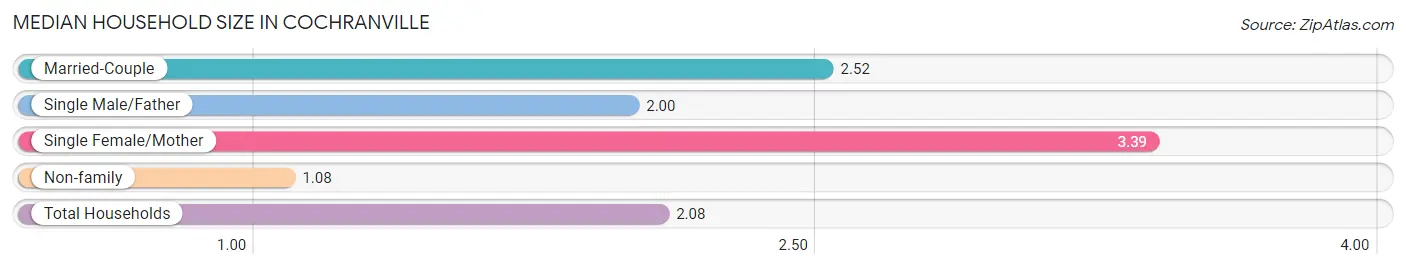
The median household size in Cochranville is 2.08 persons per household, with single female/mother households (23 | 9.8%) accounting for the largest median household size of 3.39 persons per household. non-family households (86 | 36.6%) represent the smallest median household size with 1.08 persons per household.
| Household Type | # Households | Household Size |
| Married-Couple | 124 (52.8%) | 2.52 |
| Single Male/Father | 2 (0.9%) | 2.00 |
| Single Female/Mother | 23 (9.8%) | 3.39 |
| Non-family | 86 (36.6%) | 1.08 |
| Total Households | 235 (100.0%) | 2.08 |
Household Size by Marriage Status in Cochranville
Out of a total of 235 households in Cochranville, 149 (63.4%) are family households, while 86 (36.6%) are nonfamily households. The most numerous type of family households are 2-person households, comprising 97, and the most common type of nonfamily households are 1-person households, comprising 79.
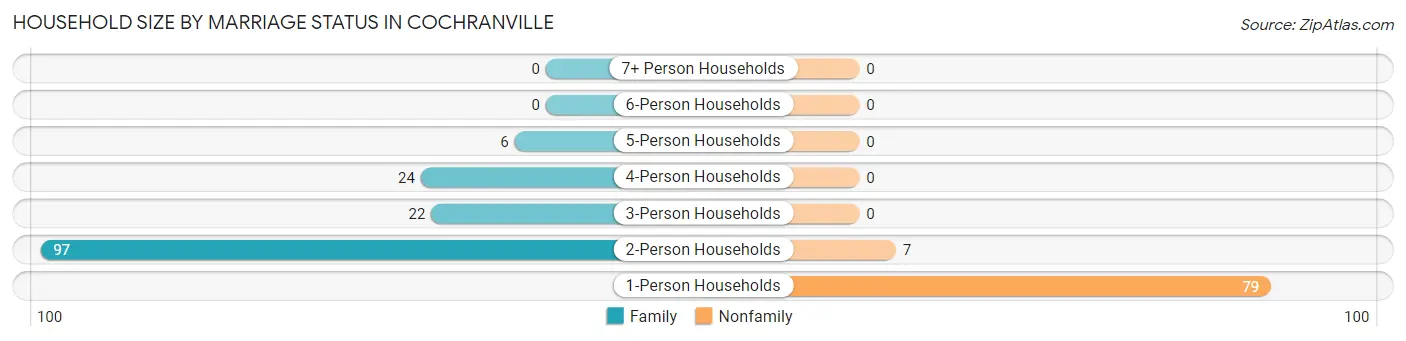
| Household Size | Family Households | Nonfamily Households |
| 1-Person Households | - | 79 (33.6%) |
| 2-Person Households | 97 (41.3%) | 7 (3.0%) |
| 3-Person Households | 22 (9.4%) | 0 (0.0%) |
| 4-Person Households | 24 (10.2%) | 0 (0.0%) |
| 5-Person Households | 6 (2.5%) | 0 (0.0%) |
| 6-Person Households | 0 (0.0%) | 0 (0.0%) |
| 7+ Person Households | 0 (0.0%) | 0 (0.0%) |
| Total | 149 (63.4%) | 86 (36.6%) |
Female Fertility in Cochranville
Fertility by Age in Cochranville
| Age Bracket | Women with Births | Births / 1,000 Women |
| 15 to 19 years | 0 (0.0%) | 0.0 |
| 20 to 34 years | 0 (0.0%) | 0.0 |
| 35 to 50 years | 0 (0.0%) | 0.0 |
| Total | 0 (0.0%) | 0.0 |
Fertility by Age by Marriage Status in Cochranville
| Age Bracket | Married | Unmarried |
| 15 to 19 years | 0 (0.0%) | 0 (0.0%) |
| 20 to 34 years | 0 (0.0%) | 0 (0.0%) |
| 35 to 50 years | 0 (0.0%) | 0 (0.0%) |
| Total | 0 (0.0%) | 0 (0.0%) |
Fertility by Education in Cochranville
| Educational Attainment | Women with Births | Births / 1,000 Women |
| Less than High School | 0 (0.0%) | 0.0 |
| High School Diploma | 0 (0.0%) | 0.0 |
| College or Associate's Degree | 0 (0.0%) | 0.0 |
| Bachelor's Degree | 0 (0.0%) | 0.0 |
| Graduate Degree | 0 (0.0%) | 0.0 |
| Total | 0 (0.0%) | 0.0 |
Fertility by Education by Marriage Status in Cochranville
| Educational Attainment | Married | Unmarried |
| Less than High School | 0 (0.0%) | 0 (0.0%) |
| High School Diploma | 0 (0.0%) | 0 (0.0%) |
| College or Associate's Degree | 0 (0.0%) | 0 (0.0%) |
| Bachelor's Degree | 0 (0.0%) | 0 (0.0%) |
| Graduate Degree | 0 (0.0%) | 0 (0.0%) |
| Total | 0 (0.0%) | 0 (0.0%) |
Employment Characteristics in Cochranville
Employment by Class of Employer in Cochranville
Among the 234 employed individuals in Cochranville, private company employees (193 | 82.5%), local government employees (21 | 9.0%), and not-for-profit organizations (13 | 5.6%) make up the most common classes of employment.
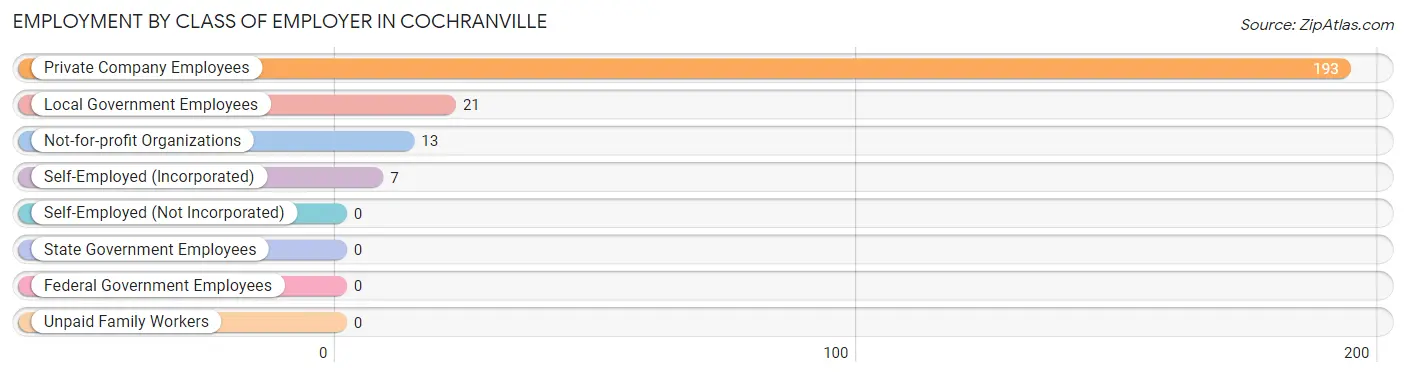
| Employer Class | # Employees | % Employees |
| Private Company Employees | 193 | 82.5% |
| Self-Employed (Incorporated) | 7 | 3.0% |
| Self-Employed (Not Incorporated) | 0 | 0.0% |
| Not-for-profit Organizations | 13 | 5.6% |
| Local Government Employees | 21 | 9.0% |
| State Government Employees | 0 | 0.0% |
| Federal Government Employees | 0 | 0.0% |
| Unpaid Family Workers | 0 | 0.0% |
| Total | 234 | 100.0% |
Employment Status by Age in Cochranville
According to the labor force statistics for Cochranville, out of the total population over 16 years of age (421), 58.2% or 245 individuals are in the labor force, with 2.9% or 7 of them unemployed. The age group with the highest labor force participation rate is 25 to 29 years, with 100.0% or 15 individuals in the labor force. Within the labor force, the 20 to 24 years age range has the highest percentage of unemployed individuals, with 25.0% or 7 of them being unemployed.
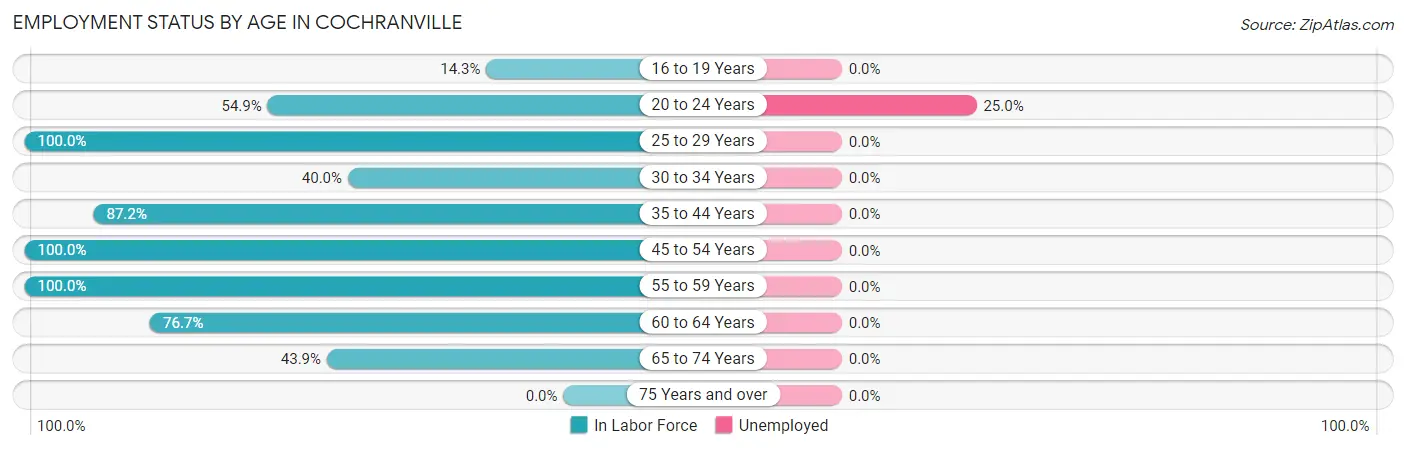
| Age Bracket | In Labor Force | Unemployed |
| 16 to 19 Years | 4 (14.3%) | 0 (0.0%) |
| 20 to 24 Years | 28 (54.9%) | 7 (25.0%) |
| 25 to 29 Years | 15 (100.0%) | 0 (0.0%) |
| 30 to 34 Years | 6 (40.0%) | 0 (0.0%) |
| 35 to 44 Years | 41 (87.2%) | 0 (0.0%) |
| 45 to 54 Years | 50 (100.0%) | 0 (0.0%) |
| 55 to 59 Years | 32 (100.0%) | 0 (0.0%) |
| 60 to 64 Years | 33 (76.7%) | 0 (0.0%) |
| 65 to 74 Years | 36 (43.9%) | 0 (0.0%) |
| 75 Years and over | 0 (0.0%) | 0 (0.0%) |
| Total | 245 (58.2%) | 7 (2.9%) |
Employment Status by Educational Attainment in Cochranville
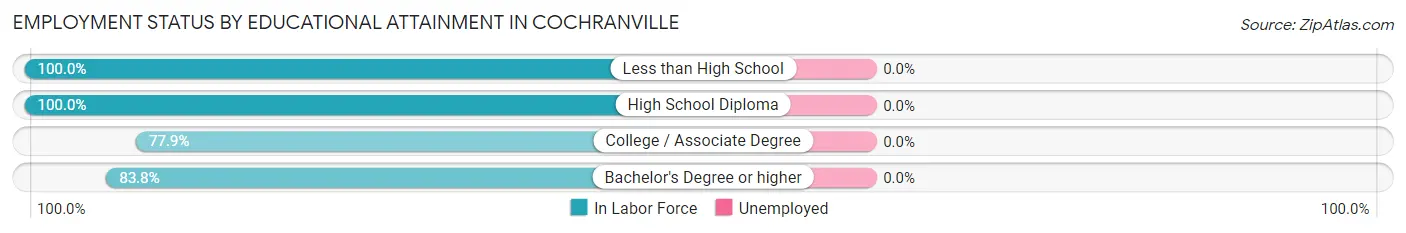
| Educational Attainment | In Labor Force | Unemployed |
| Less than High School | 21 (100.0%) | 0 (0.0%) |
| High School Diploma | 58 (100.0%) | 0 (0.0%) |
| College / Associate Degree | 67 (77.9%) | 0 (0.0%) |
| Bachelor's Degree or higher | 31 (83.8%) | 0 (0.0%) |
| Total | 177 (87.6%) | 0 (0.0%) |
Employment Occupations by Sex in Cochranville
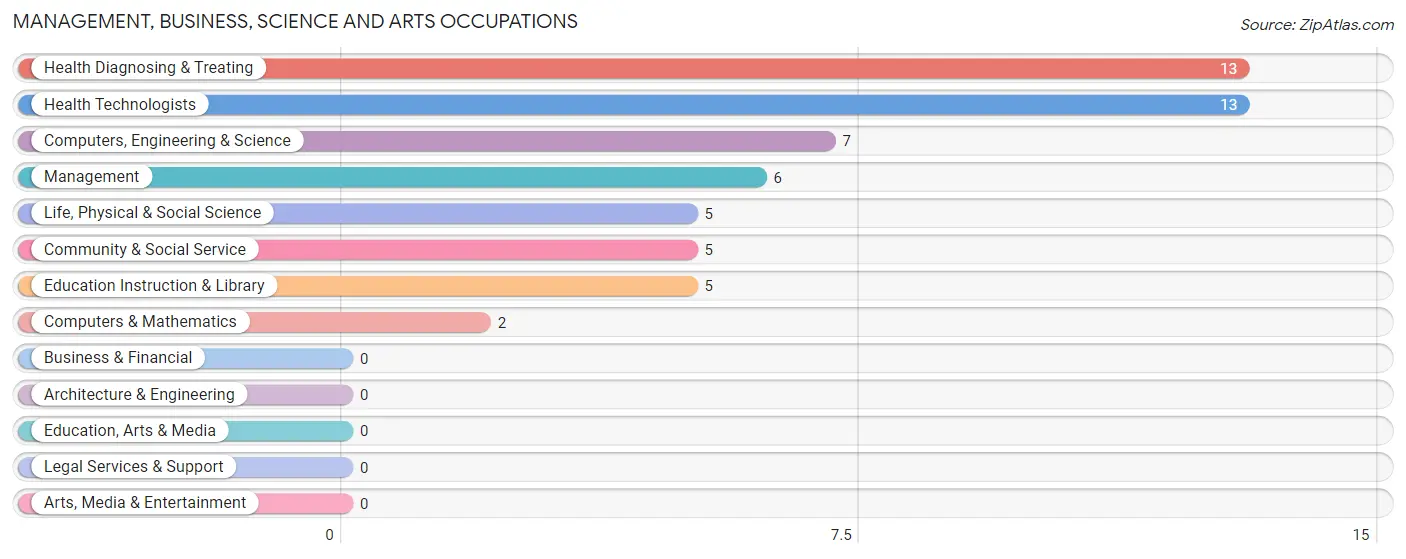
Management, Business, Science and Arts Occupations
The most common Management, Business, Science and Arts occupations in Cochranville are Health Diagnosing & Treating (13 | 5.5%), Health Technologists (13 | 5.5%), Computers, Engineering & Science (7 | 2.9%), Management (6 | 2.5%), and Life, Physical & Social Science (5 | 2.1%).
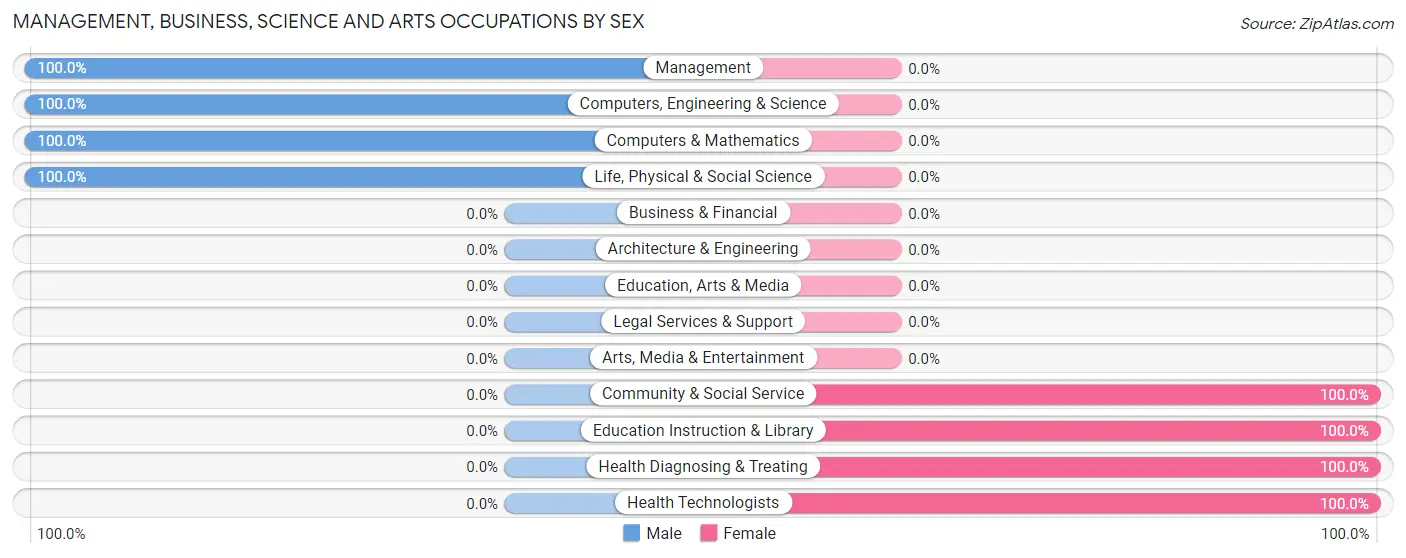
Management, Business, Science and Arts Occupations by Sex
Within the Management, Business, Science and Arts occupations in Cochranville, the most male-oriented occupations are Management (100.0%), Computers, Engineering & Science (100.0%), and Computers & Mathematics (100.0%), while the most female-oriented occupations are Community & Social Service (100.0%), Education Instruction & Library (100.0%), and Health Diagnosing & Treating (100.0%).
| Occupation | Male | Female |
| Management | 6 (100.0%) | 0 (0.0%) |
| Business & Financial | 0 (0.0%) | 0 (0.0%) |
| Computers, Engineering & Science | 7 (100.0%) | 0 (0.0%) |
| Computers & Mathematics | 2 (100.0%) | 0 (0.0%) |
| Architecture & Engineering | 0 (0.0%) | 0 (0.0%) |
| Life, Physical & Social Science | 5 (100.0%) | 0 (0.0%) |
| Community & Social Service | 0 (0.0%) | 5 (100.0%) |
| Education, Arts & Media | 0 (0.0%) | 0 (0.0%) |
| Legal Services & Support | 0 (0.0%) | 0 (0.0%) |
| Education Instruction & Library | 0 (0.0%) | 5 (100.0%) |
| Arts, Media & Entertainment | 0 (0.0%) | 0 (0.0%) |
| Health Diagnosing & Treating | 0 (0.0%) | 13 (100.0%) |
| Health Technologists | 0 (0.0%) | 13 (100.0%) |
| Total (Category) | 13 (41.9%) | 18 (58.1%) |
| Total (Overall) | 160 (67.2%) | 78 (32.8%) |
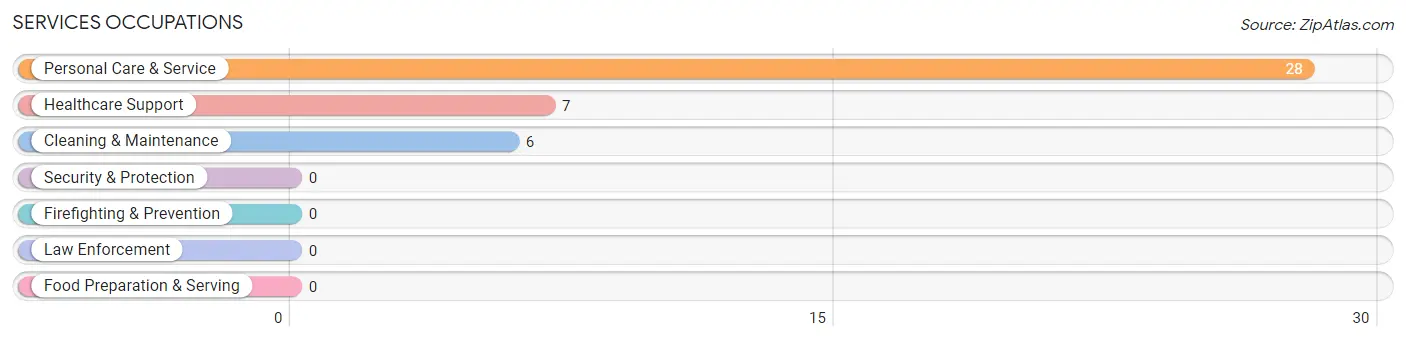
Services Occupations
The most common Services occupations in Cochranville are Personal Care & Service (28 | 11.8%), Healthcare Support (7 | 2.9%), and Cleaning & Maintenance (6 | 2.5%).
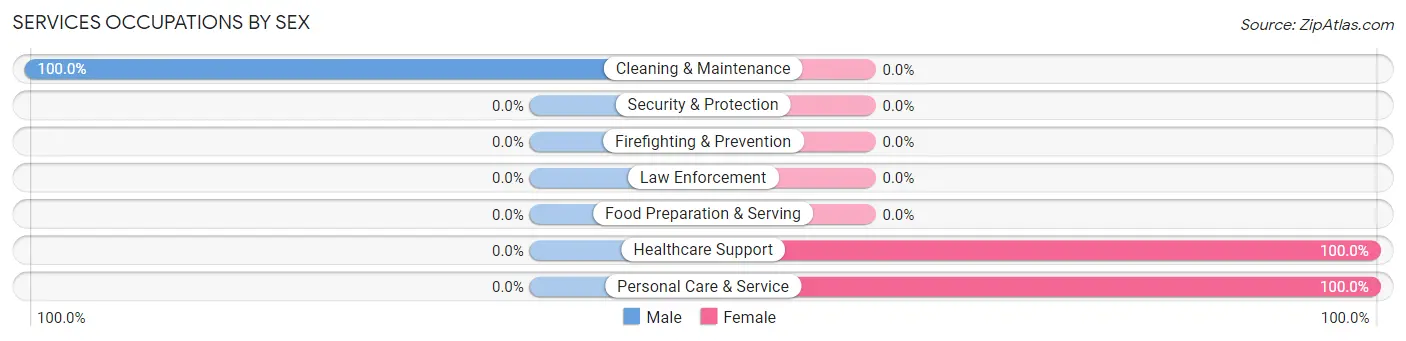
Services Occupations by Sex
| Occupation | Male | Female |
| Healthcare Support | 0 (0.0%) | 7 (100.0%) |
| Security & Protection | 0 (0.0%) | 0 (0.0%) |
| Firefighting & Prevention | 0 (0.0%) | 0 (0.0%) |
| Law Enforcement | 0 (0.0%) | 0 (0.0%) |
| Food Preparation & Serving | 0 (0.0%) | 0 (0.0%) |
| Cleaning & Maintenance | 6 (100.0%) | 0 (0.0%) |
| Personal Care & Service | 0 (0.0%) | 28 (100.0%) |
| Total (Category) | 6 (14.6%) | 35 (85.4%) |
| Total (Overall) | 160 (67.2%) | 78 (32.8%) |
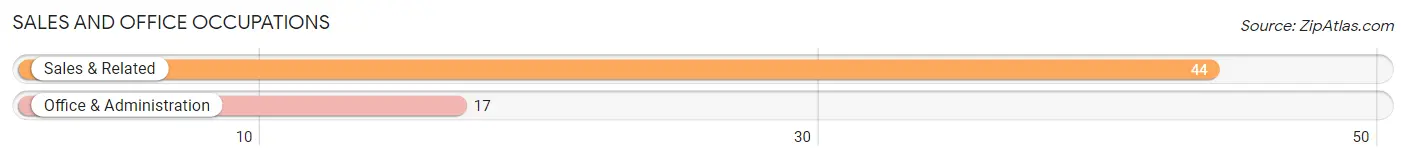
Sales and Office Occupations
The most common Sales and Office occupations in Cochranville are Sales & Related (44 | 18.5%), and Office & Administration (17 | 7.1%).
Sales and Office Occupations by Sex
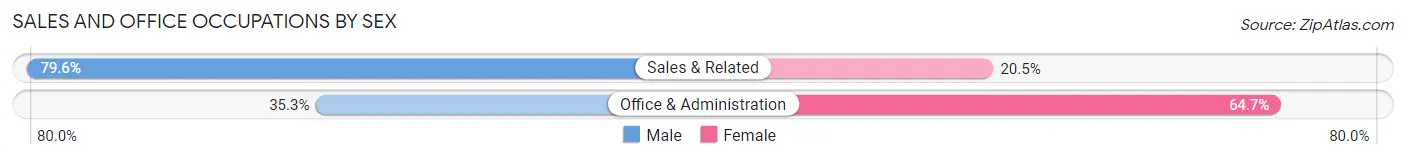
| Occupation | Male | Female |
| Sales & Related | 35 (79.5%) | 9 (20.4%) |
| Office & Administration | 6 (35.3%) | 11 (64.7%) |
| Total (Category) | 41 (67.2%) | 20 (32.8%) |
| Total (Overall) | 160 (67.2%) | 78 (32.8%) |
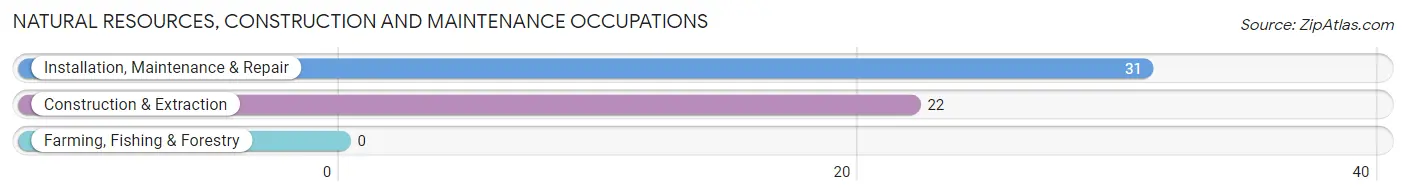
Natural Resources, Construction and Maintenance Occupations
The most common Natural Resources, Construction and Maintenance occupations in Cochranville are Installation, Maintenance & Repair (31 | 13.0%), and Construction & Extraction (22 | 9.2%).
Natural Resources, Construction and Maintenance Occupations by Sex
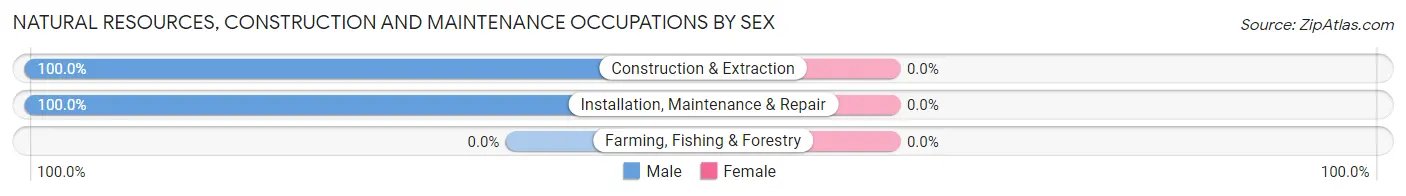
| Occupation | Male | Female |
| Farming, Fishing & Forestry | 0 (0.0%) | 0 (0.0%) |
| Construction & Extraction | 22 (100.0%) | 0 (0.0%) |
| Installation, Maintenance & Repair | 31 (100.0%) | 0 (0.0%) |
| Total (Category) | 53 (100.0%) | 0 (0.0%) |
| Total (Overall) | 160 (67.2%) | 78 (32.8%) |
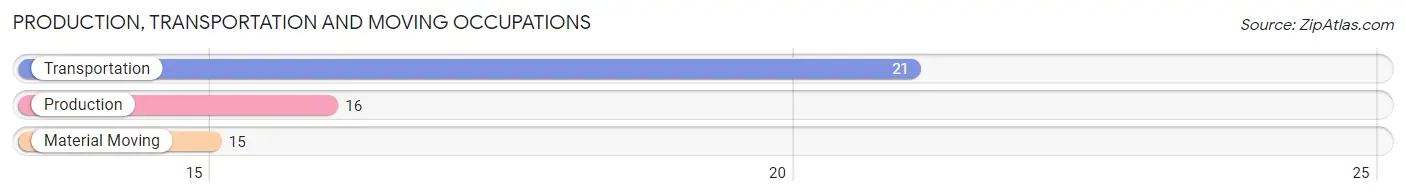
Production, Transportation and Moving Occupations
The most common Production, Transportation and Moving occupations in Cochranville are Transportation (21 | 8.8%), Production (16 | 6.7%), and Material Moving (15 | 6.3%).
Production, Transportation and Moving Occupations by Sex
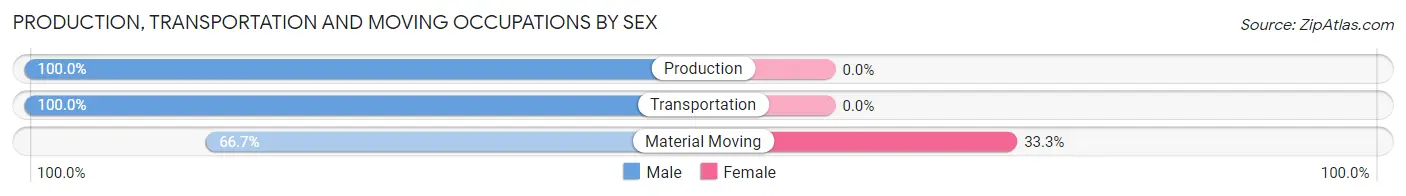
| Occupation | Male | Female |
| Production | 16 (100.0%) | 0 (0.0%) |
| Transportation | 21 (100.0%) | 0 (0.0%) |
| Material Moving | 10 (66.7%) | 5 (33.3%) |
| Total (Category) | 47 (90.4%) | 5 (9.6%) |
| Total (Overall) | 160 (67.2%) | 78 (32.8%) |
Employment Industries by Sex in Cochranville
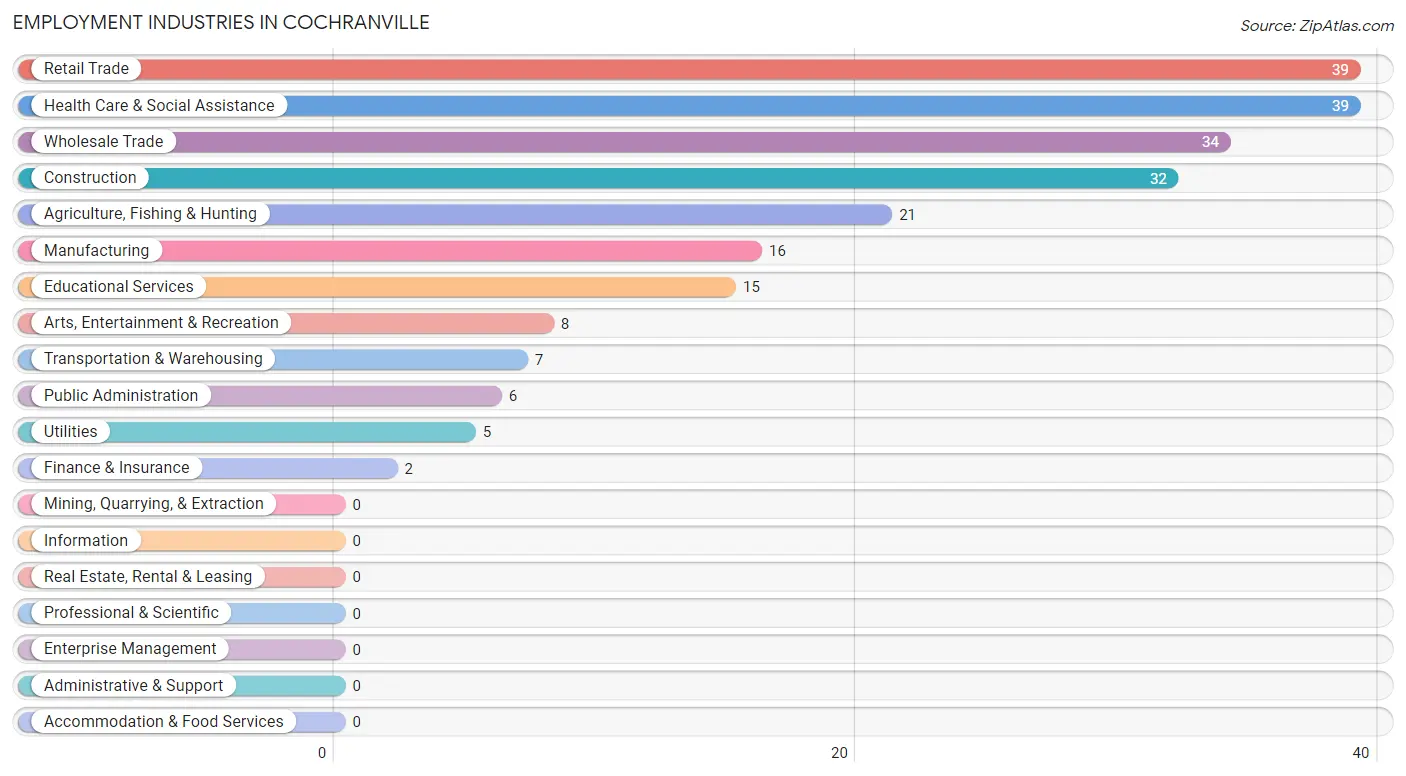
Employment Industries in Cochranville
The major employment industries in Cochranville include Retail Trade (39 | 16.4%), Health Care & Social Assistance (39 | 16.4%), Wholesale Trade (34 | 14.3%), Construction (32 | 13.5%), and Agriculture, Fishing & Hunting (21 | 8.8%).
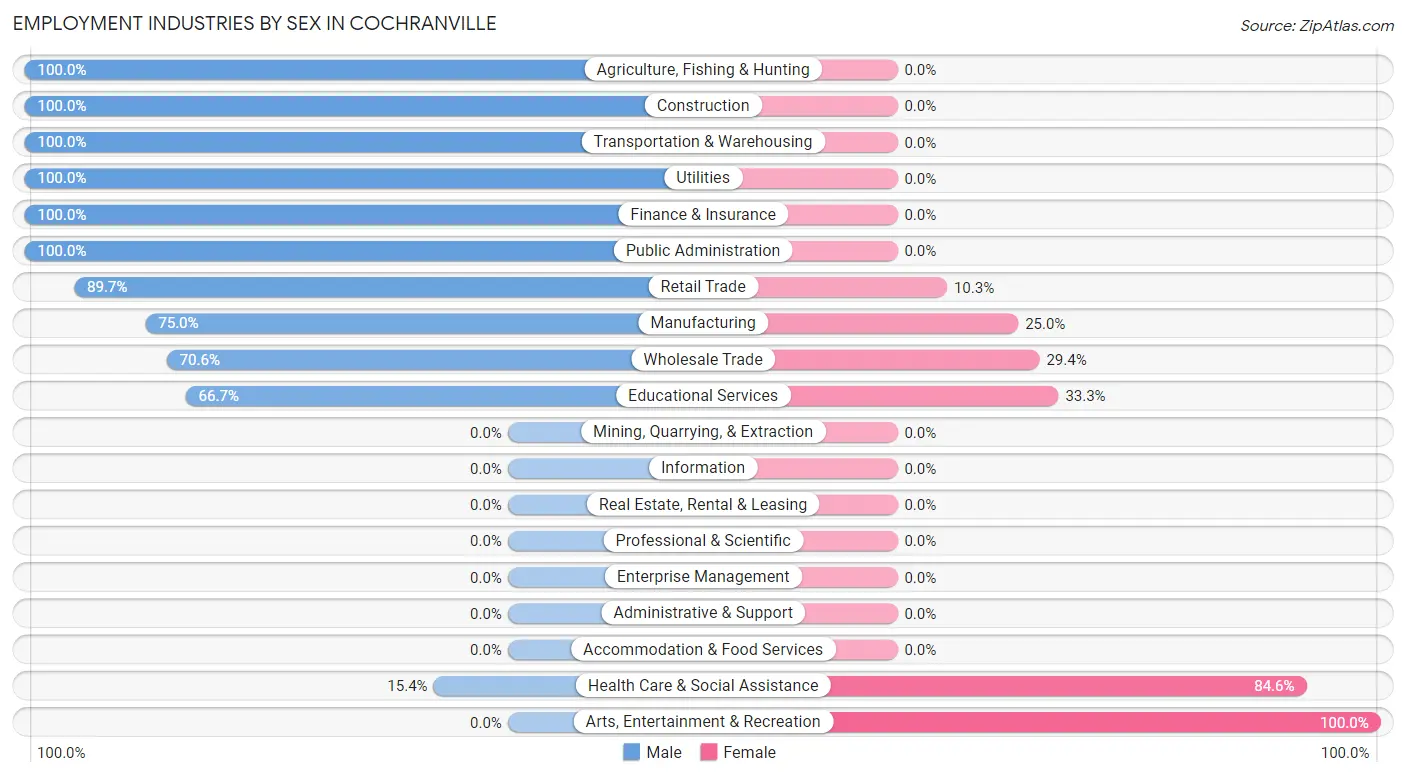
Employment Industries by Sex in Cochranville
The Cochranville industries that see more men than women are Agriculture, Fishing & Hunting (100.0%), Construction (100.0%), and Transportation & Warehousing (100.0%), whereas the industries that tend to have a higher number of women are Arts, Entertainment & Recreation (100.0%), Health Care & Social Assistance (84.6%), and Educational Services (33.3%).
| Industry | Male | Female |
| Agriculture, Fishing & Hunting | 21 (100.0%) | 0 (0.0%) |
| Mining, Quarrying, & Extraction | 0 (0.0%) | 0 (0.0%) |
| Construction | 32 (100.0%) | 0 (0.0%) |
| Manufacturing | 12 (75.0%) | 4 (25.0%) |
| Wholesale Trade | 24 (70.6%) | 10 (29.4%) |
| Retail Trade | 35 (89.7%) | 4 (10.3%) |
| Transportation & Warehousing | 7 (100.0%) | 0 (0.0%) |
| Utilities | 5 (100.0%) | 0 (0.0%) |
| Information | 0 (0.0%) | 0 (0.0%) |
| Finance & Insurance | 2 (100.0%) | 0 (0.0%) |
| Real Estate, Rental & Leasing | 0 (0.0%) | 0 (0.0%) |
| Professional & Scientific | 0 (0.0%) | 0 (0.0%) |
| Enterprise Management | 0 (0.0%) | 0 (0.0%) |
| Administrative & Support | 0 (0.0%) | 0 (0.0%) |
| Educational Services | 10 (66.7%) | 5 (33.3%) |
| Health Care & Social Assistance | 6 (15.4%) | 33 (84.6%) |
| Arts, Entertainment & Recreation | 0 (0.0%) | 8 (100.0%) |
| Accommodation & Food Services | 0 (0.0%) | 0 (0.0%) |
| Public Administration | 6 (100.0%) | 0 (0.0%) |
| Total | 160 (67.2%) | 78 (32.8%) |
Education in Cochranville
School Enrollment in Cochranville
The most common levels of schooling among the 109 students in Cochranville are high school (41 | 37.6%), elementary school (26 | 23.8%), and college / undergraduate (23 | 21.1%).
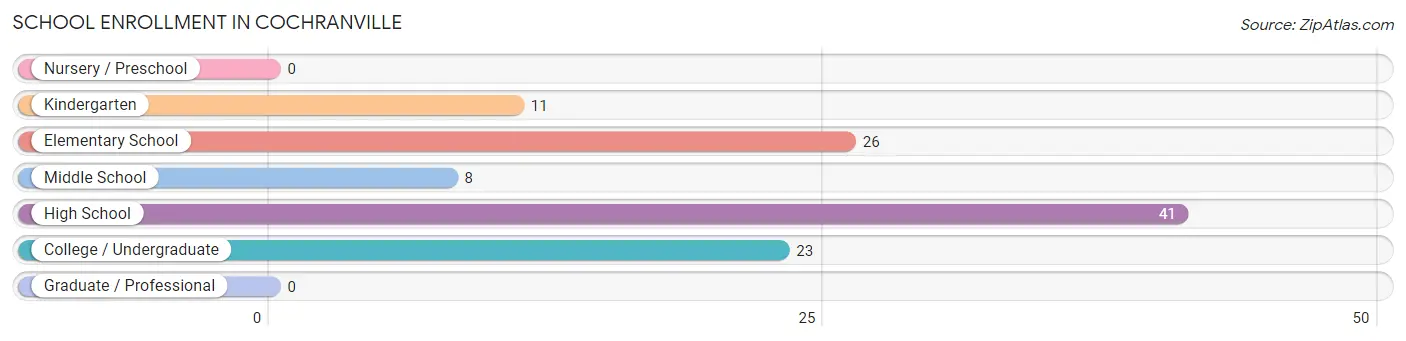
| School Level | # Students | % Students |
| Nursery / Preschool | 0 | 0.0% |
| Kindergarten | 11 | 10.1% |
| Elementary School | 26 | 23.8% |
| Middle School | 8 | 7.3% |
| High School | 41 | 37.6% |
| College / Undergraduate | 23 | 21.1% |
| Graduate / Professional | 0 | 0.0% |
| Total | 109 | 100.0% |
School Enrollment by Age by Funding Source in Cochranville
Out of a total of 109 students who are enrolled in schools in Cochranville, 36 (33.0%) attend a private institution, while the remaining 73 (67.0%) are enrolled in public schools. The age group of 5 to 9 year old has the highest likelihood of being enrolled in private schools, with 17 (68.0% in the age bracket) enrolled. Conversely, the age group of 18 to 19 year olds has the lowest likelihood of being enrolled in a private school, with 7 (100.0% in the age bracket) attending a public institution.
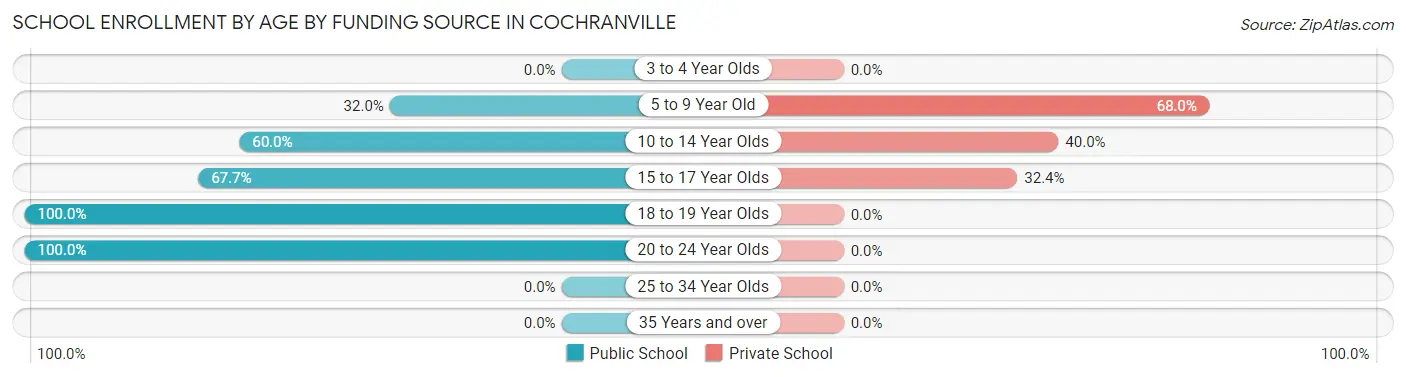
| Age Bracket | Public School | Private School |
| 3 to 4 Year Olds | 0 (0.0%) | 0 (0.0%) |
| 5 to 9 Year Old | 8 (32.0%) | 17 (68.0%) |
| 10 to 14 Year Olds | 12 (60.0%) | 8 (40.0%) |
| 15 to 17 Year Olds | 23 (67.6%) | 11 (32.4%) |
| 18 to 19 Year Olds | 7 (100.0%) | 0 (0.0%) |
| 20 to 24 Year Olds | 23 (100.0%) | 0 (0.0%) |
| 25 to 34 Year Olds | 0 (0.0%) | 0 (0.0%) |
| 35 Years and over | 0 (0.0%) | 0 (0.0%) |
| Total | 73 (67.0%) | 36 (33.0%) |
Educational Attainment by Field of Study in Cochranville
Education (29 | 39.7%), business (22 | 30.1%), psychology (6 | 8.2%), social sciences (6 | 8.2%), and science & technology (6 | 8.2%) are the most common fields of study among 73 individuals in Cochranville who have obtained a bachelor's degree or higher.
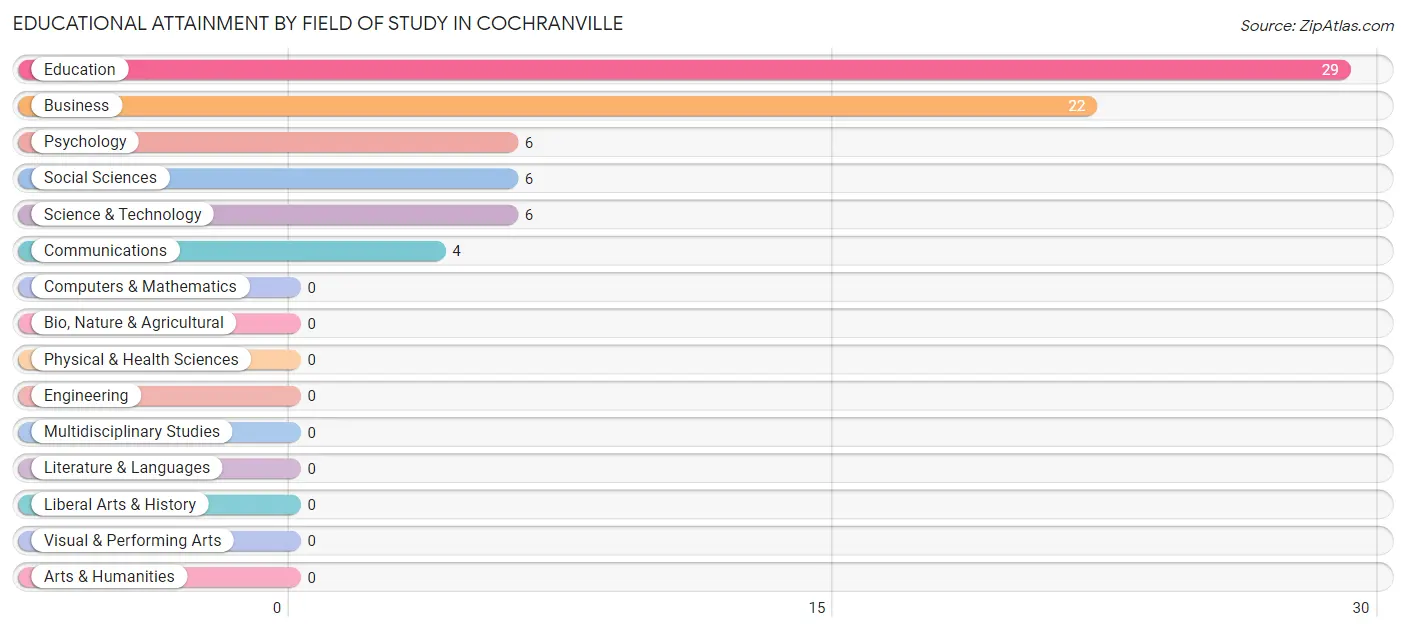
| Field of Study | # Graduates | % Graduates |
| Computers & Mathematics | 0 | 0.0% |
| Bio, Nature & Agricultural | 0 | 0.0% |
| Physical & Health Sciences | 0 | 0.0% |
| Psychology | 6 | 8.2% |
| Social Sciences | 6 | 8.2% |
| Engineering | 0 | 0.0% |
| Multidisciplinary Studies | 0 | 0.0% |
| Science & Technology | 6 | 8.2% |
| Business | 22 | 30.1% |
| Education | 29 | 39.7% |
| Literature & Languages | 0 | 0.0% |
| Liberal Arts & History | 0 | 0.0% |
| Visual & Performing Arts | 0 | 0.0% |
| Communications | 4 | 5.5% |
| Arts & Humanities | 0 | 0.0% |
| Total | 73 | 100.0% |
Transportation & Commute in Cochranville
Vehicle Availability by Sex in Cochranville
The most prevalent vehicle ownership categories in Cochranville are males with 2 vehicles (96, accounting for 61.5%) and females with 2 vehicles (53, making up 123.1%).
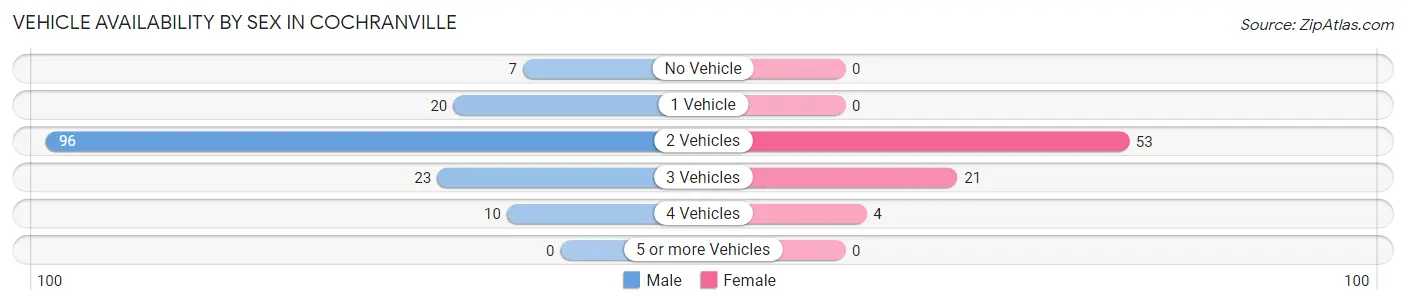
| Vehicles Available | Male | Female |
| No Vehicle | 7 (4.5%) | 0 (0.0%) |
| 1 Vehicle | 20 (12.8%) | 0 (0.0%) |
| 2 Vehicles | 96 (61.5%) | 53 (67.9%) |
| 3 Vehicles | 23 (14.7%) | 21 (26.9%) |
| 4 Vehicles | 10 (6.4%) | 4 (5.1%) |
| 5 or more Vehicles | 0 (0.0%) | 0 (0.0%) |
| Total | 156 (100.0%) | 78 (100.0%) |
Commute Time in Cochranville
The most frequently occuring commute durations in Cochranville are 45 to 59 minutes (44 commuters, 19.6%), 20 to 24 minutes (36 commuters, 16.1%), and 30 to 34 minutes (34 commuters, 15.2%).
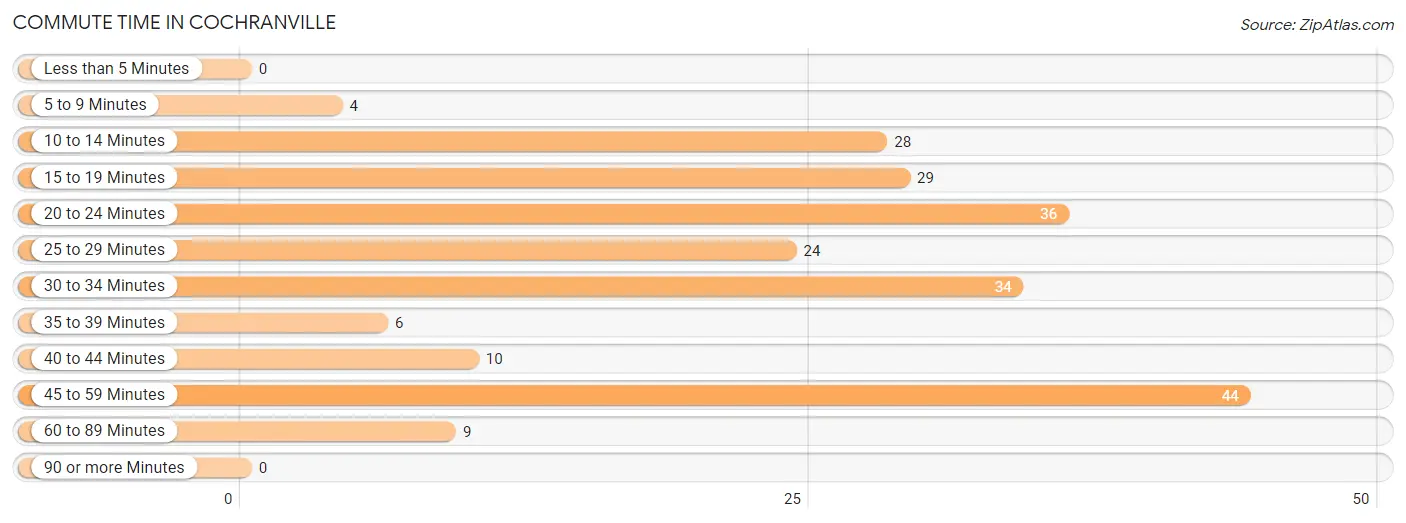
| Commute Time | # Commuters | % Commuters |
| Less than 5 Minutes | 0 | 0.0% |
| 5 to 9 Minutes | 4 | 1.8% |
| 10 to 14 Minutes | 28 | 12.5% |
| 15 to 19 Minutes | 29 | 13.0% |
| 20 to 24 Minutes | 36 | 16.1% |
| 25 to 29 Minutes | 24 | 10.7% |
| 30 to 34 Minutes | 34 | 15.2% |
| 35 to 39 Minutes | 6 | 2.7% |
| 40 to 44 Minutes | 10 | 4.5% |
| 45 to 59 Minutes | 44 | 19.6% |
| 60 to 89 Minutes | 9 | 4.0% |
| 90 or more Minutes | 0 | 0.0% |
Commute Time by Sex in Cochranville
The most common commute times in Cochranville are 45 to 59 minutes (36 commuters, 24.0%) for males and 20 to 24 minutes (32 commuters, 43.2%) for females.
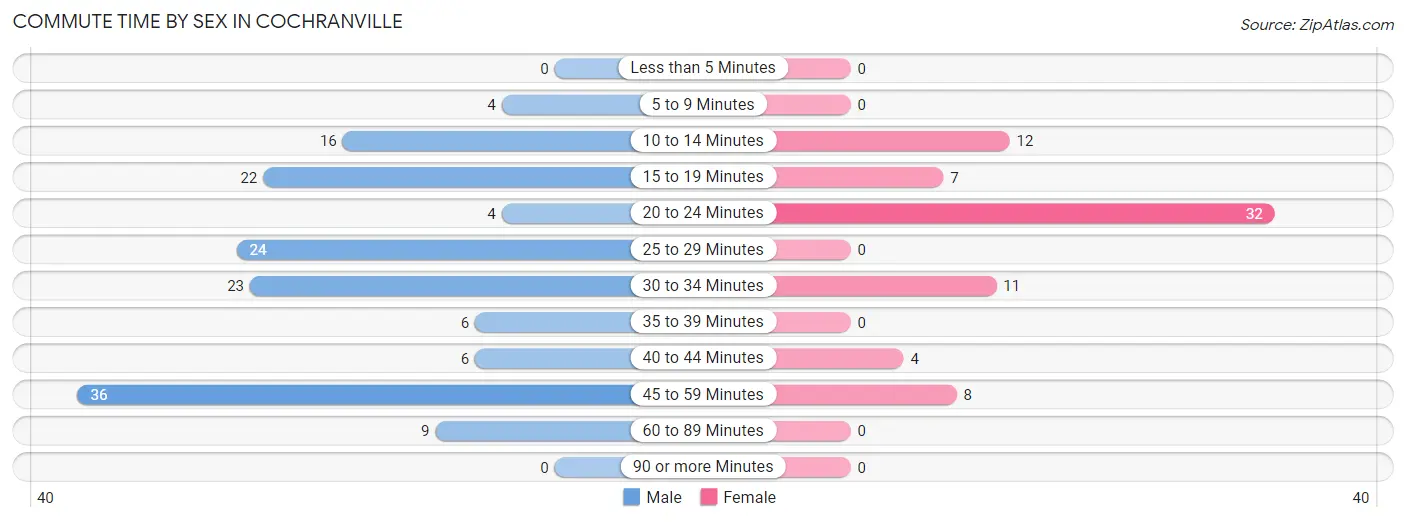
| Commute Time | Male | Female |
| Less than 5 Minutes | 0 (0.0%) | 0 (0.0%) |
| 5 to 9 Minutes | 4 (2.7%) | 0 (0.0%) |
| 10 to 14 Minutes | 16 (10.7%) | 12 (16.2%) |
| 15 to 19 Minutes | 22 (14.7%) | 7 (9.5%) |
| 20 to 24 Minutes | 4 (2.7%) | 32 (43.2%) |
| 25 to 29 Minutes | 24 (16.0%) | 0 (0.0%) |
| 30 to 34 Minutes | 23 (15.3%) | 11 (14.9%) |
| 35 to 39 Minutes | 6 (4.0%) | 0 (0.0%) |
| 40 to 44 Minutes | 6 (4.0%) | 4 (5.4%) |
| 45 to 59 Minutes | 36 (24.0%) | 8 (10.8%) |
| 60 to 89 Minutes | 9 (6.0%) | 0 (0.0%) |
| 90 or more Minutes | 0 (0.0%) | 0 (0.0%) |
Time of Departure to Work by Sex in Cochranville
The most frequent times of departure to work in Cochranville are 5:00 AM to 5:29 AM (57, 38.0%) for males and 8:30 AM to 8:59 AM (28, 37.8%) for females.
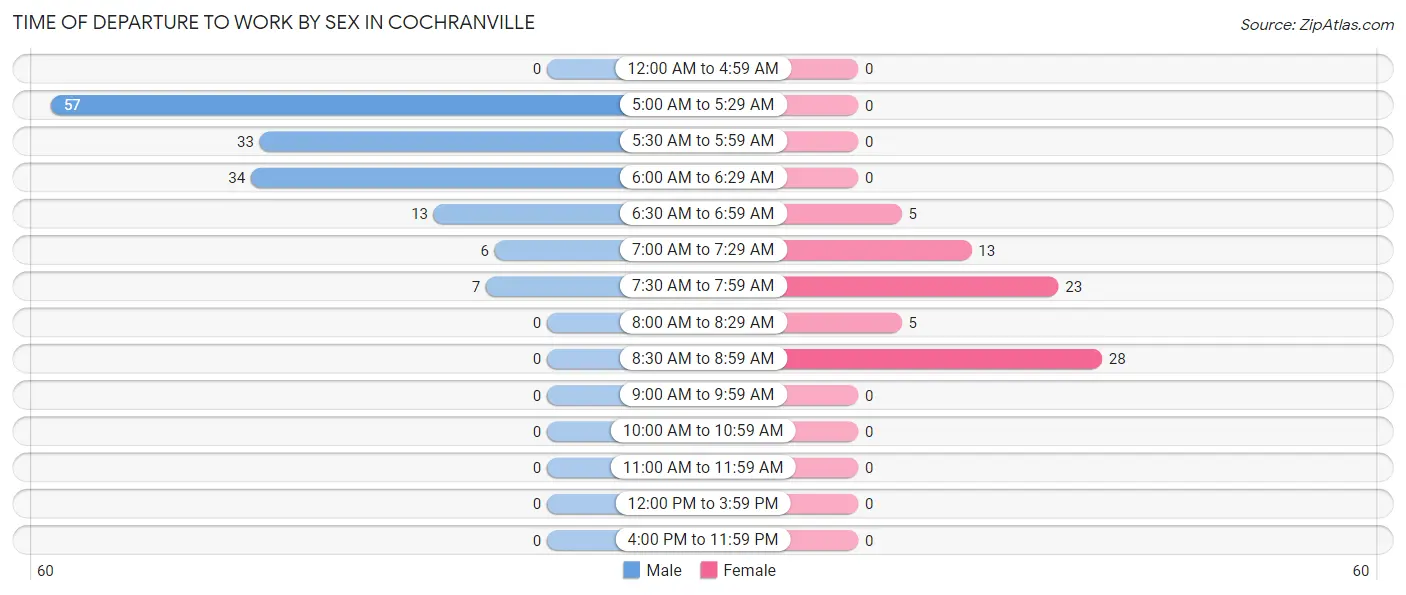
| Time of Departure | Male | Female |
| 12:00 AM to 4:59 AM | 0 (0.0%) | 0 (0.0%) |
| 5:00 AM to 5:29 AM | 57 (38.0%) | 0 (0.0%) |
| 5:30 AM to 5:59 AM | 33 (22.0%) | 0 (0.0%) |
| 6:00 AM to 6:29 AM | 34 (22.7%) | 0 (0.0%) |
| 6:30 AM to 6:59 AM | 13 (8.7%) | 5 (6.8%) |
| 7:00 AM to 7:29 AM | 6 (4.0%) | 13 (17.6%) |
| 7:30 AM to 7:59 AM | 7 (4.7%) | 23 (31.1%) |
| 8:00 AM to 8:29 AM | 0 (0.0%) | 5 (6.8%) |
| 8:30 AM to 8:59 AM | 0 (0.0%) | 28 (37.8%) |
| 9:00 AM to 9:59 AM | 0 (0.0%) | 0 (0.0%) |
| 10:00 AM to 10:59 AM | 0 (0.0%) | 0 (0.0%) |
| 11:00 AM to 11:59 AM | 0 (0.0%) | 0 (0.0%) |
| 12:00 PM to 3:59 PM | 0 (0.0%) | 0 (0.0%) |
| 4:00 PM to 11:59 PM | 0 (0.0%) | 0 (0.0%) |
| Total | 150 (100.0%) | 74 (100.0%) |
Housing Occupancy in Cochranville
Occupancy by Ownership in Cochranville
Of the total 235 dwellings in Cochranville, owner-occupied units account for 201 (85.5%), while renter-occupied units make up 34 (14.5%).
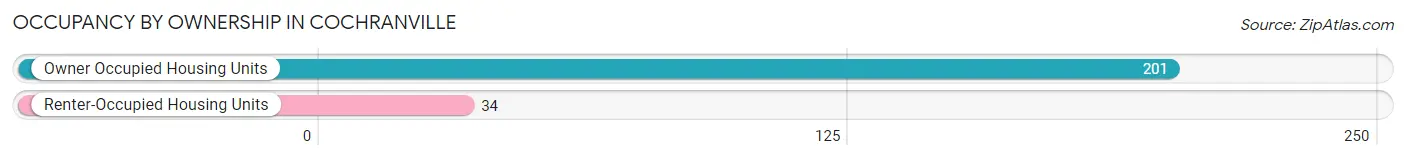
| Occupancy | # Housing Units | % Housing Units |
| Owner Occupied Housing Units | 201 | 85.5% |
| Renter-Occupied Housing Units | 34 | 14.5% |
| Total Occupied Housing Units | 235 | 100.0% |
Occupancy by Household Size in Cochranville
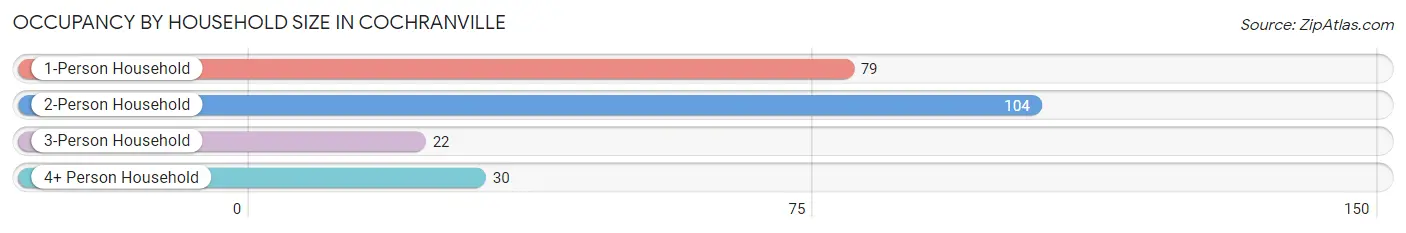
| Household Size | # Housing Units | % Housing Units |
| 1-Person Household | 79 | 33.6% |
| 2-Person Household | 104 | 44.3% |
| 3-Person Household | 22 | 9.4% |
| 4+ Person Household | 30 | 12.8% |
| Total Housing Units | 235 | 100.0% |
Occupancy by Ownership by Household Size in Cochranville
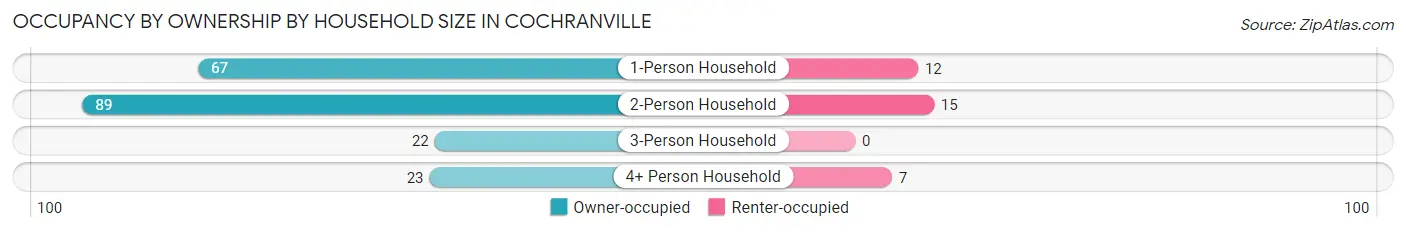
| Household Size | Owner-occupied | Renter-occupied |
| 1-Person Household | 67 (84.8%) | 12 (15.2%) |
| 2-Person Household | 89 (85.6%) | 15 (14.4%) |
| 3-Person Household | 22 (100.0%) | 0 (0.0%) |
| 4+ Person Household | 23 (76.7%) | 7 (23.3%) |
| Total Housing Units | 201 (85.5%) | 34 (14.5%) |
Occupancy by Educational Attainment in Cochranville
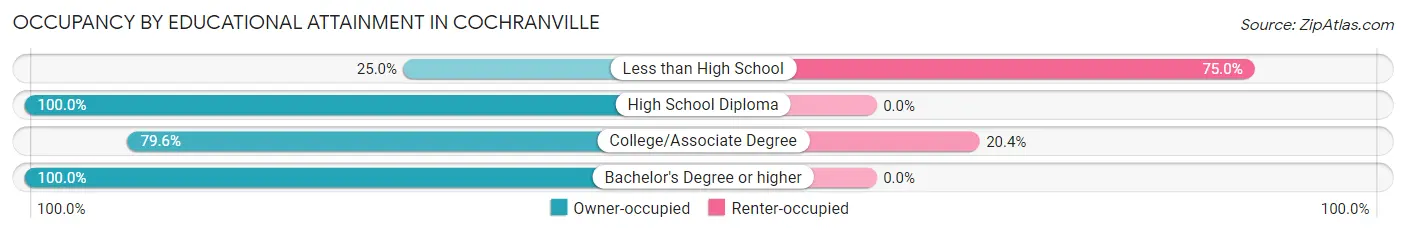
| Household Size | Owner-occupied | Renter-occupied |
| Less than High School | 5 (25.0%) | 15 (75.0%) |
| High School Diploma | 77 (100.0%) | 0 (0.0%) |
| College/Associate Degree | 74 (79.6%) | 19 (20.4%) |
| Bachelor's Degree or higher | 45 (100.0%) | 0 (0.0%) |
Occupancy by Age of Householder in Cochranville
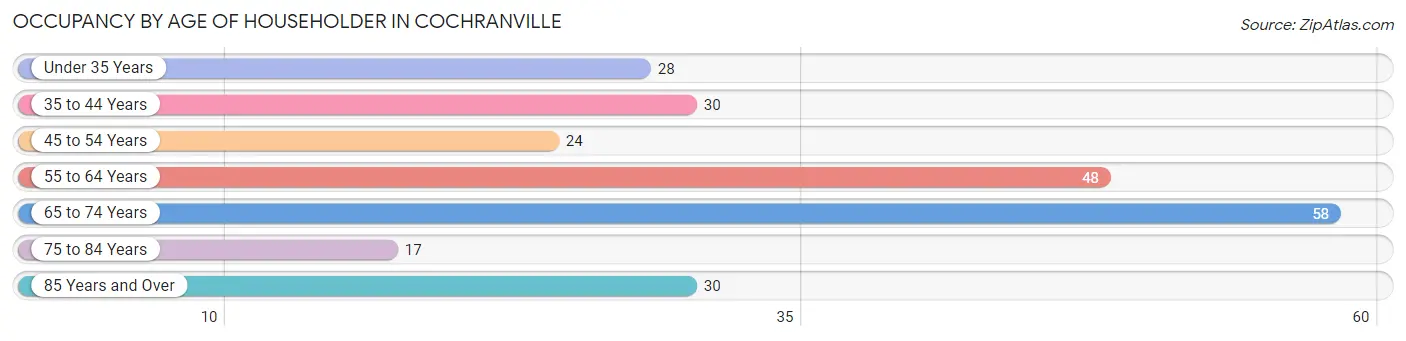
| Age Bracket | # Households | % Households |
| Under 35 Years | 28 | 11.9% |
| 35 to 44 Years | 30 | 12.8% |
| 45 to 54 Years | 24 | 10.2% |
| 55 to 64 Years | 48 | 20.4% |
| 65 to 74 Years | 58 | 24.7% |
| 75 to 84 Years | 17 | 7.2% |
| 85 Years and Over | 30 | 12.8% |
| Total | 235 | 100.0% |
Housing Finances in Cochranville
Median Income by Occupancy in Cochranville
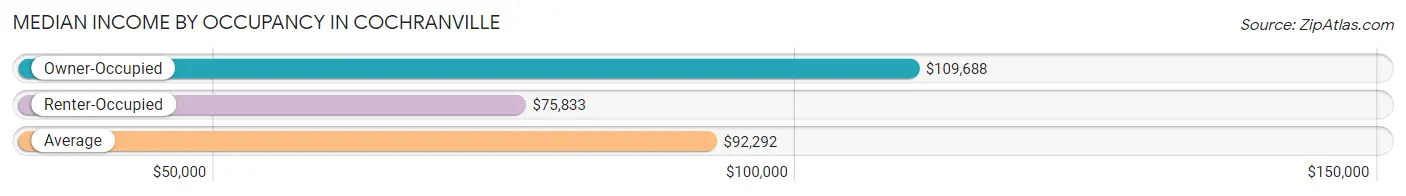
| Occupancy Type | # Households | Median Income |
| Owner-Occupied | 201 (85.5%) | $109,688 |
| Renter-Occupied | 34 (14.5%) | $75,833 |
| Average | 235 (100.0%) | $92,292 |
Occupancy by Householder Income Bracket in Cochranville
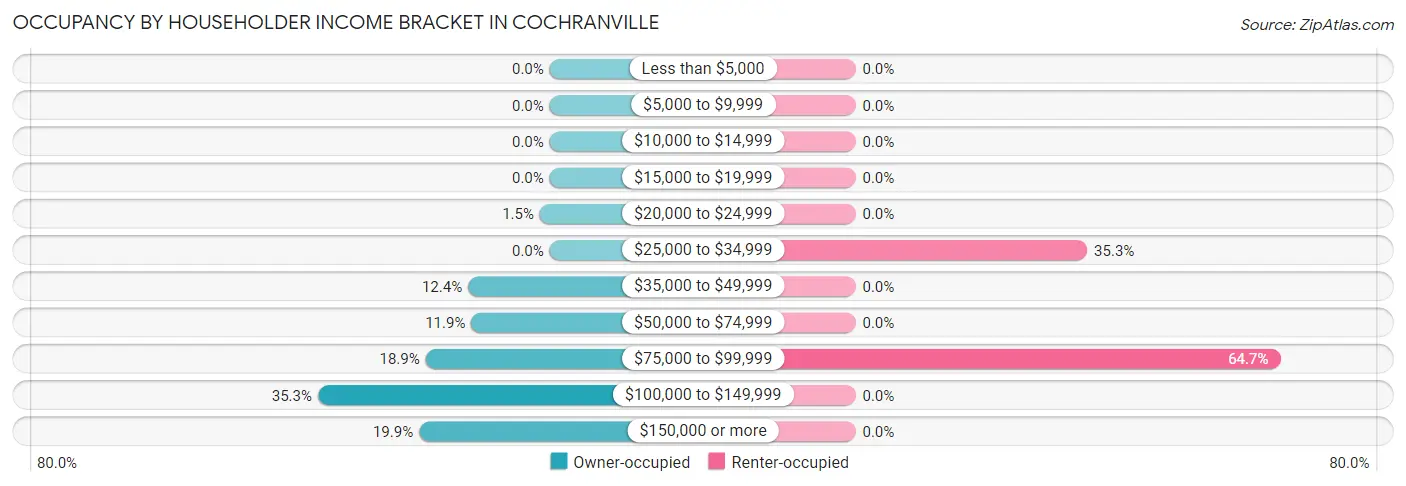
| Income Bracket | Owner-occupied | Renter-occupied |
| Less than $5,000 | 0 (0.0%) | 0 (0.0%) |
| $5,000 to $9,999 | 0 (0.0%) | 0 (0.0%) |
| $10,000 to $14,999 | 0 (0.0%) | 0 (0.0%) |
| $15,000 to $19,999 | 0 (0.0%) | 0 (0.0%) |
| $20,000 to $24,999 | 3 (1.5%) | 0 (0.0%) |
| $25,000 to $34,999 | 0 (0.0%) | 12 (35.3%) |
| $35,000 to $49,999 | 25 (12.4%) | 0 (0.0%) |
| $50,000 to $74,999 | 24 (11.9%) | 0 (0.0%) |
| $75,000 to $99,999 | 38 (18.9%) | 22 (64.7%) |
| $100,000 to $149,999 | 71 (35.3%) | 0 (0.0%) |
| $150,000 or more | 40 (19.9%) | 0 (0.0%) |
| Total | 201 (100.0%) | 34 (100.0%) |
Monthly Housing Cost Tiers in Cochranville
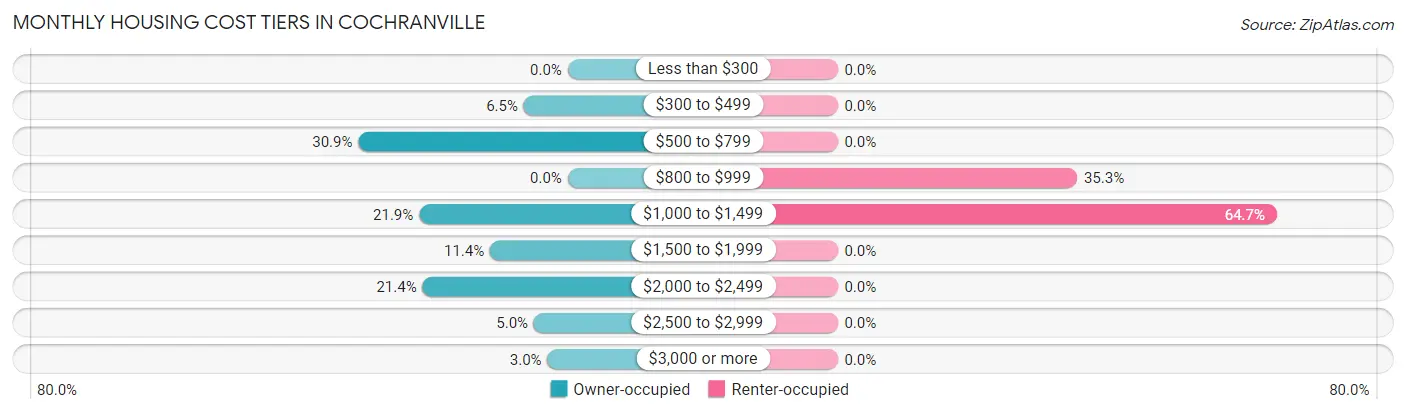
| Monthly Cost | Owner-occupied | Renter-occupied |
| Less than $300 | 0 (0.0%) | 0 (0.0%) |
| $300 to $499 | 13 (6.5%) | 0 (0.0%) |
| $500 to $799 | 62 (30.8%) | 0 (0.0%) |
| $800 to $999 | 0 (0.0%) | 12 (35.3%) |
| $1,000 to $1,499 | 44 (21.9%) | 22 (64.7%) |
| $1,500 to $1,999 | 23 (11.4%) | 0 (0.0%) |
| $2,000 to $2,499 | 43 (21.4%) | 0 (0.0%) |
| $2,500 to $2,999 | 10 (5.0%) | 0 (0.0%) |
| $3,000 or more | 6 (3.0%) | 0 (0.0%) |
| Total | 201 (100.0%) | 34 (100.0%) |
Physical Housing Characteristics in Cochranville
Housing Structures in Cochranville
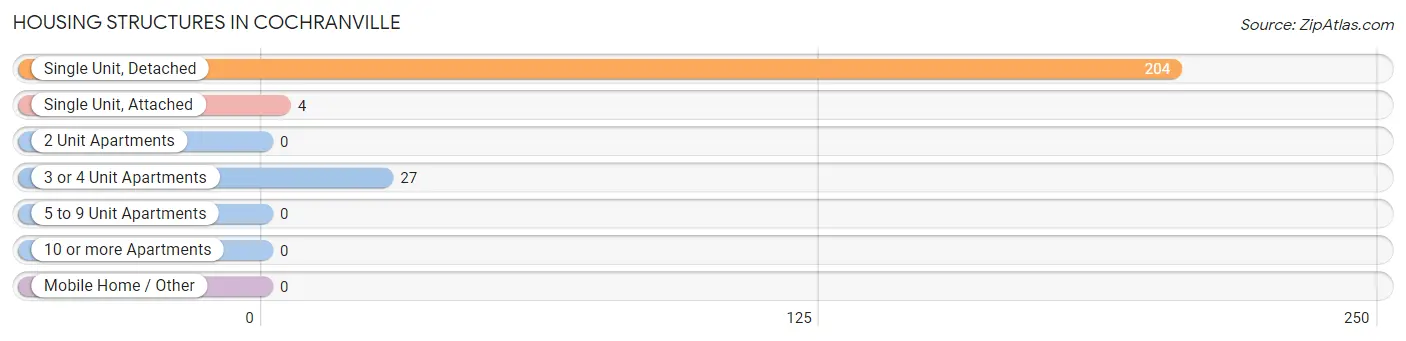
| Structure Type | # Housing Units | % Housing Units |
| Single Unit, Detached | 204 | 86.8% |
| Single Unit, Attached | 4 | 1.7% |
| 2 Unit Apartments | 0 | 0.0% |
| 3 or 4 Unit Apartments | 27 | 11.5% |
| 5 to 9 Unit Apartments | 0 | 0.0% |
| 10 or more Apartments | 0 | 0.0% |
| Mobile Home / Other | 0 | 0.0% |
| Total | 235 | 100.0% |
Housing Structures by Occupancy in Cochranville
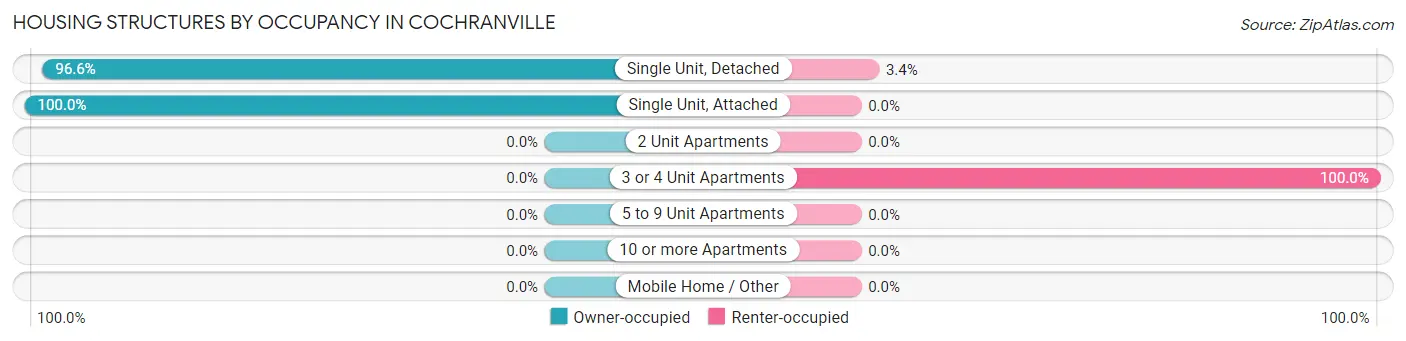
| Structure Type | Owner-occupied | Renter-occupied |
| Single Unit, Detached | 197 (96.6%) | 7 (3.4%) |
| Single Unit, Attached | 4 (100.0%) | 0 (0.0%) |
| 2 Unit Apartments | 0 (0.0%) | 0 (0.0%) |
| 3 or 4 Unit Apartments | 0 (0.0%) | 27 (100.0%) |
| 5 to 9 Unit Apartments | 0 (0.0%) | 0 (0.0%) |
| 10 or more Apartments | 0 (0.0%) | 0 (0.0%) |
| Mobile Home / Other | 0 (0.0%) | 0 (0.0%) |
| Total | 201 (85.5%) | 34 (14.5%) |
Housing Structures by Number of Rooms in Cochranville
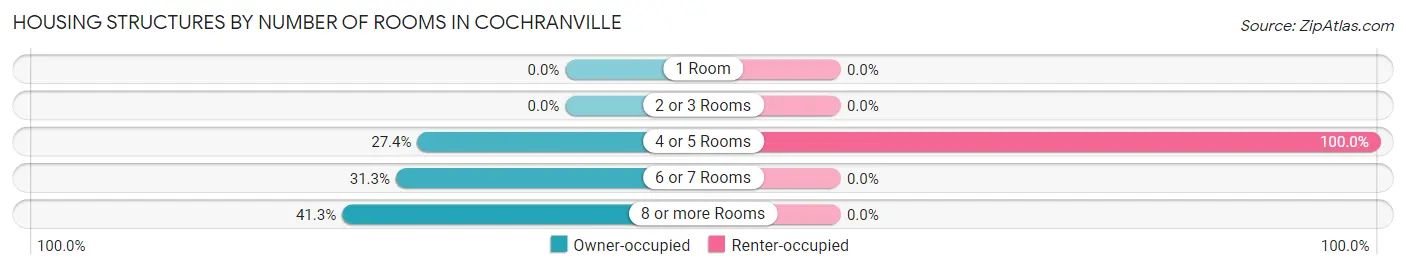
| Number of Rooms | Owner-occupied | Renter-occupied |
| 1 Room | 0 (0.0%) | 0 (0.0%) |
| 2 or 3 Rooms | 0 (0.0%) | 0 (0.0%) |
| 4 or 5 Rooms | 55 (27.4%) | 34 (100.0%) |
| 6 or 7 Rooms | 63 (31.3%) | 0 (0.0%) |
| 8 or more Rooms | 83 (41.3%) | 0 (0.0%) |
| Total | 201 (100.0%) | 34 (100.0%) |
Housing Structure by Heating Type in Cochranville
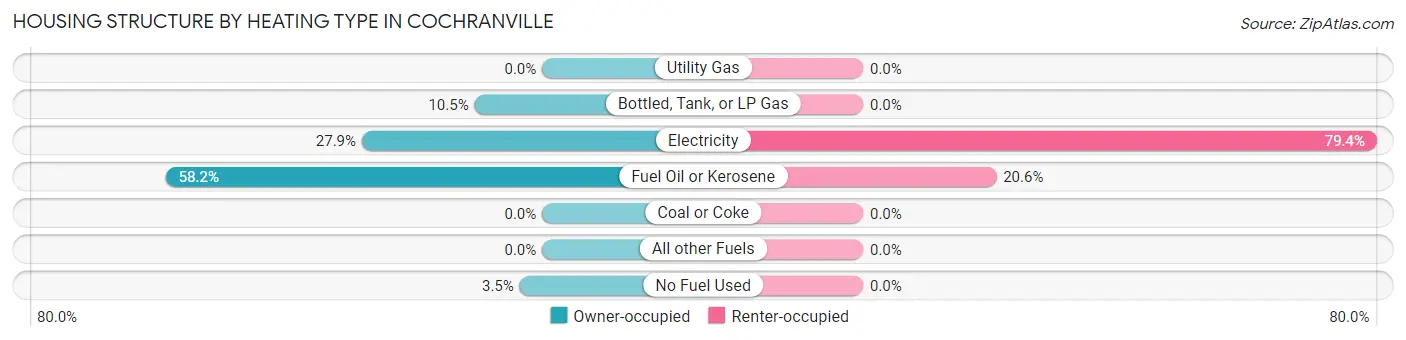
| Heating Type | Owner-occupied | Renter-occupied |
| Utility Gas | 0 (0.0%) | 0 (0.0%) |
| Bottled, Tank, or LP Gas | 21 (10.4%) | 0 (0.0%) |
| Electricity | 56 (27.9%) | 27 (79.4%) |
| Fuel Oil or Kerosene | 117 (58.2%) | 7 (20.6%) |
| Coal or Coke | 0 (0.0%) | 0 (0.0%) |
| All other Fuels | 0 (0.0%) | 0 (0.0%) |
| No Fuel Used | 7 (3.5%) | 0 (0.0%) |
| Total | 201 (100.0%) | 34 (100.0%) |
Household Vehicle Usage in Cochranville
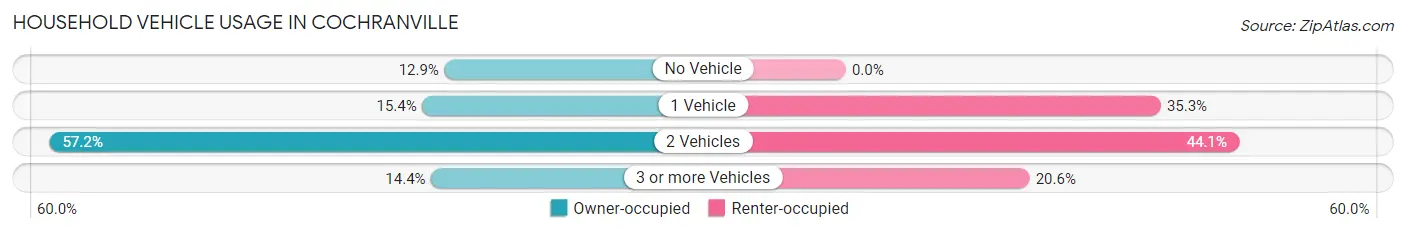
| Vehicles per Household | Owner-occupied | Renter-occupied |
| No Vehicle | 26 (12.9%) | 0 (0.0%) |
| 1 Vehicle | 31 (15.4%) | 12 (35.3%) |
| 2 Vehicles | 115 (57.2%) | 15 (44.1%) |
| 3 or more Vehicles | 29 (14.4%) | 7 (20.6%) |
| Total | 201 (100.0%) | 34 (100.0%) |
Real Estate & Mortgages in Cochranville
Real Estate and Mortgage Overview in Cochranville
| Characteristic | Without Mortgage | With Mortgage |
| Housing Units | 70 | 131 |
| Median Property Value | $284,000 | $251,600 |
| Median Household Income | $65,714 | $40 |
| Monthly Housing Costs | $689 | $6 |
| Real Estate Taxes | $4,588 | $0 |
Property Value by Mortgage Status in Cochranville
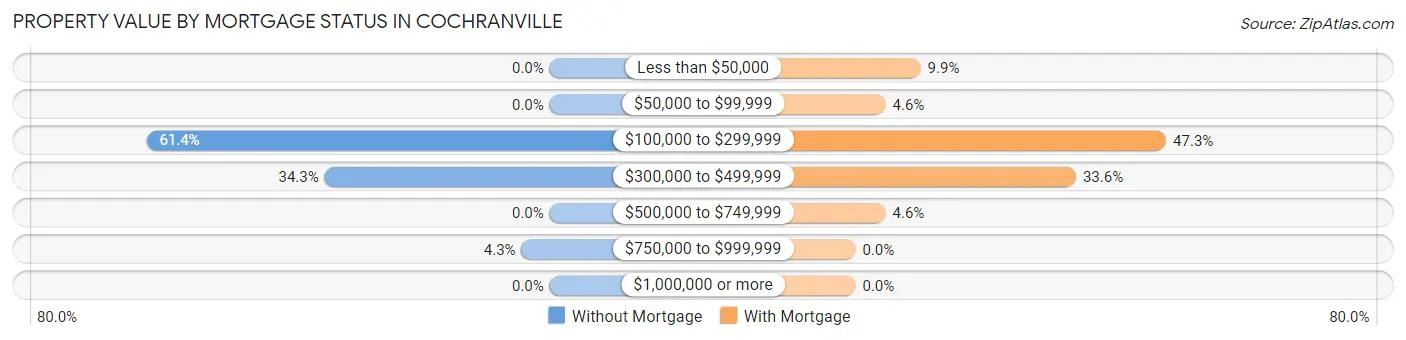
| Property Value | Without Mortgage | With Mortgage |
| Less than $50,000 | 0 (0.0%) | 13 (9.9%) |
| $50,000 to $99,999 | 0 (0.0%) | 6 (4.6%) |
| $100,000 to $299,999 | 43 (61.4%) | 62 (47.3%) |
| $300,000 to $499,999 | 24 (34.3%) | 44 (33.6%) |
| $500,000 to $749,999 | 0 (0.0%) | 6 (4.6%) |
| $750,000 to $999,999 | 3 (4.3%) | 0 (0.0%) |
| $1,000,000 or more | 0 (0.0%) | 0 (0.0%) |
| Total | 70 (100.0%) | 131 (100.0%) |
Household Income by Mortgage Status in Cochranville
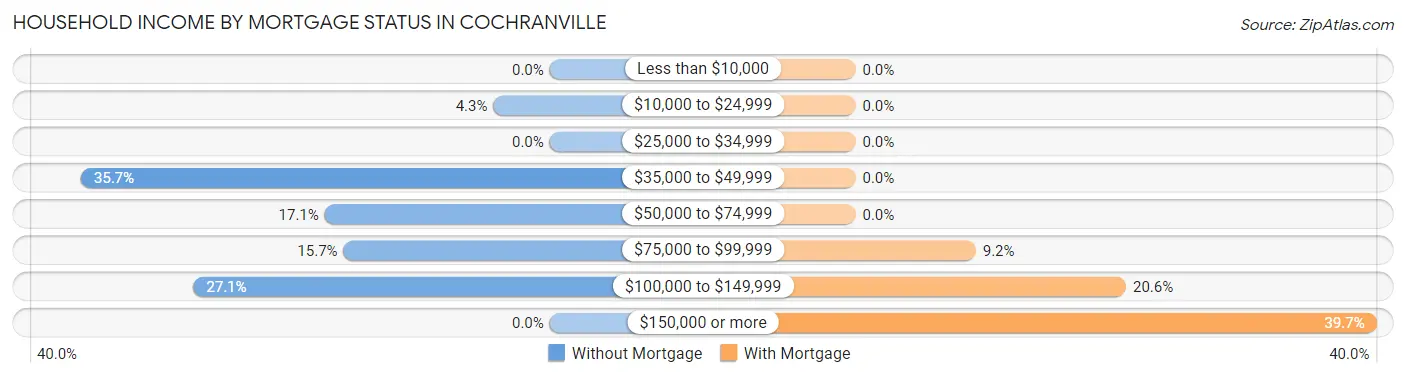
| Household Income | Without Mortgage | With Mortgage |
| Less than $10,000 | 0 (0.0%) | 0 (0.0%) |
| $10,000 to $24,999 | 3 (4.3%) | 0 (0.0%) |
| $25,000 to $34,999 | 0 (0.0%) | 0 (0.0%) |
| $35,000 to $49,999 | 25 (35.7%) | 0 (0.0%) |
| $50,000 to $74,999 | 12 (17.1%) | 0 (0.0%) |
| $75,000 to $99,999 | 11 (15.7%) | 12 (9.2%) |
| $100,000 to $149,999 | 19 (27.1%) | 27 (20.6%) |
| $150,000 or more | 0 (0.0%) | 52 (39.7%) |
| Total | 70 (100.0%) | 131 (100.0%) |
Property Value to Household Income Ratio in Cochranville
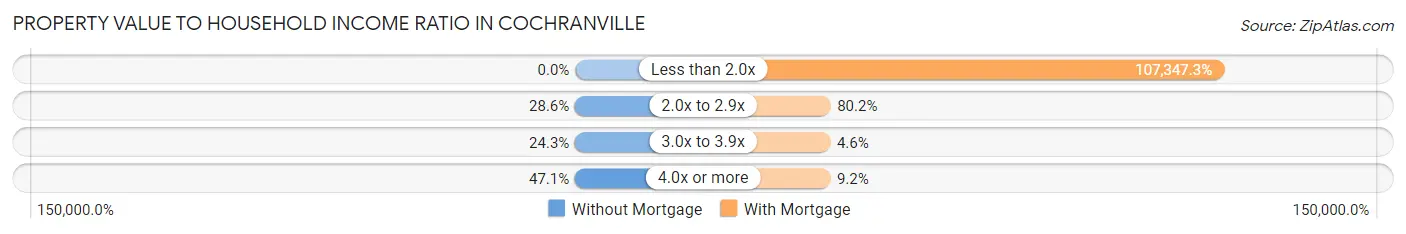
| Value-to-Income Ratio | Without Mortgage | With Mortgage |
| Less than 2.0x | 0 (0.0%) | 140,625 (107,347.3%) |
| 2.0x to 2.9x | 20 (28.6%) | 105 (80.1%) |
| 3.0x to 3.9x | 17 (24.3%) | 6 (4.6%) |
| 4.0x or more | 33 (47.1%) | 12 (9.2%) |
| Total | 70 (100.0%) | 131 (100.0%) |
Real Estate Taxes by Mortgage Status in Cochranville
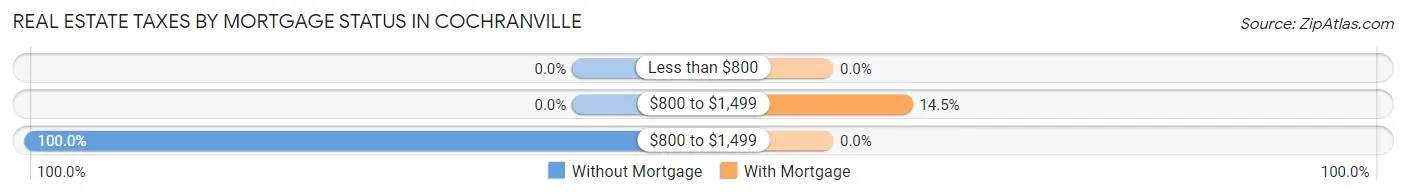
| Property Taxes | Without Mortgage | With Mortgage |
| Less than $800 | 0 (0.0%) | 0 (0.0%) |
| $800 to $1,499 | 0 (0.0%) | 19 (14.5%) |
| $800 to $1,499 | 70 (100.0%) | 0 (0.0%) |
| Total | 70 (100.0%) | 131 (100.0%) |
Health & Disability in Cochranville
Health Insurance Coverage by Age in Cochranville
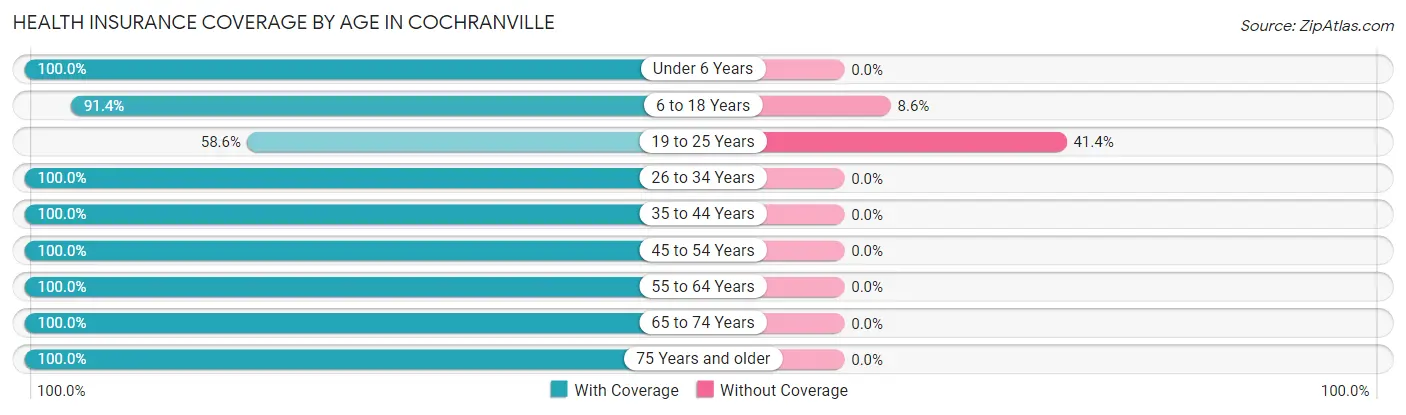
| Age Bracket | With Coverage | Without Coverage |
| Under 6 Years | 10 (100.0%) | 0 (0.0%) |
| 6 to 18 Years | 74 (91.4%) | 7 (8.6%) |
| 19 to 25 Years | 41 (58.6%) | 29 (41.4%) |
| 26 to 34 Years | 15 (100.0%) | 0 (0.0%) |
| 35 to 44 Years | 47 (100.0%) | 0 (0.0%) |
| 45 to 54 Years | 50 (100.0%) | 0 (0.0%) |
| 55 to 64 Years | 75 (100.0%) | 0 (0.0%) |
| 65 to 74 Years | 82 (100.0%) | 0 (0.0%) |
| 75 Years and older | 58 (100.0%) | 0 (0.0%) |
| Total | 452 (92.6%) | 36 (7.4%) |
Health Insurance Coverage by Citizenship Status in Cochranville
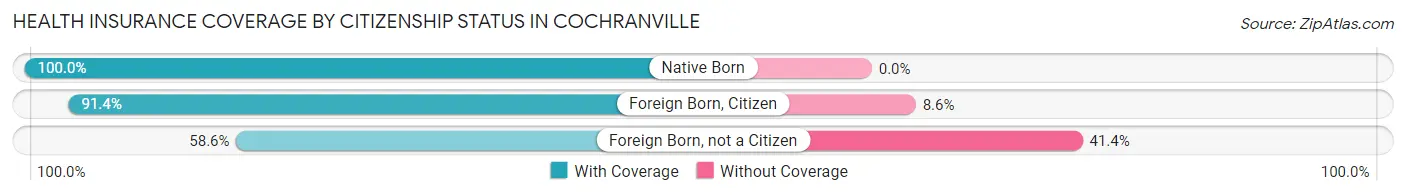
| Citizenship Status | With Coverage | Without Coverage |
| Native Born | 10 (100.0%) | 0 (0.0%) |
| Foreign Born, Citizen | 74 (91.4%) | 7 (8.6%) |
| Foreign Born, not a Citizen | 41 (58.6%) | 29 (41.4%) |
Health Insurance Coverage by Household Income in Cochranville
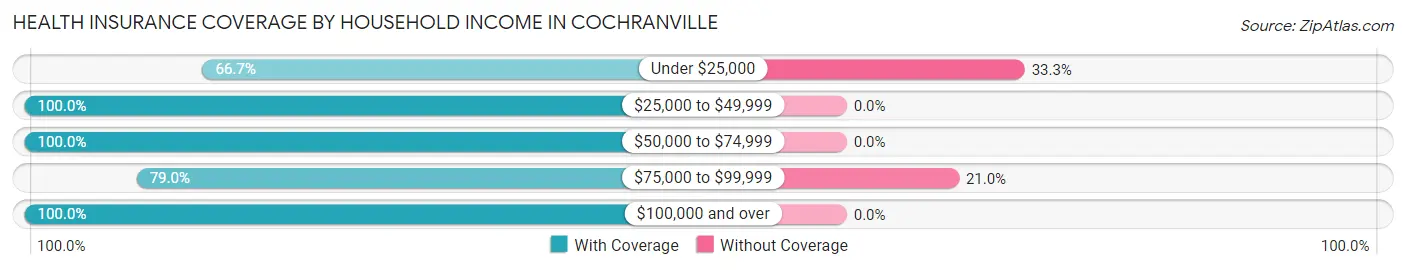
| Household Income | With Coverage | Without Coverage |
| Under $25,000 | 14 (66.7%) | 7 (33.3%) |
| $25,000 to $49,999 | 37 (100.0%) | 0 (0.0%) |
| $50,000 to $74,999 | 76 (100.0%) | 0 (0.0%) |
| $75,000 to $99,999 | 109 (79.0%) | 29 (21.0%) |
| $100,000 and over | 216 (100.0%) | 0 (0.0%) |
Public vs Private Health Insurance Coverage by Age in Cochranville
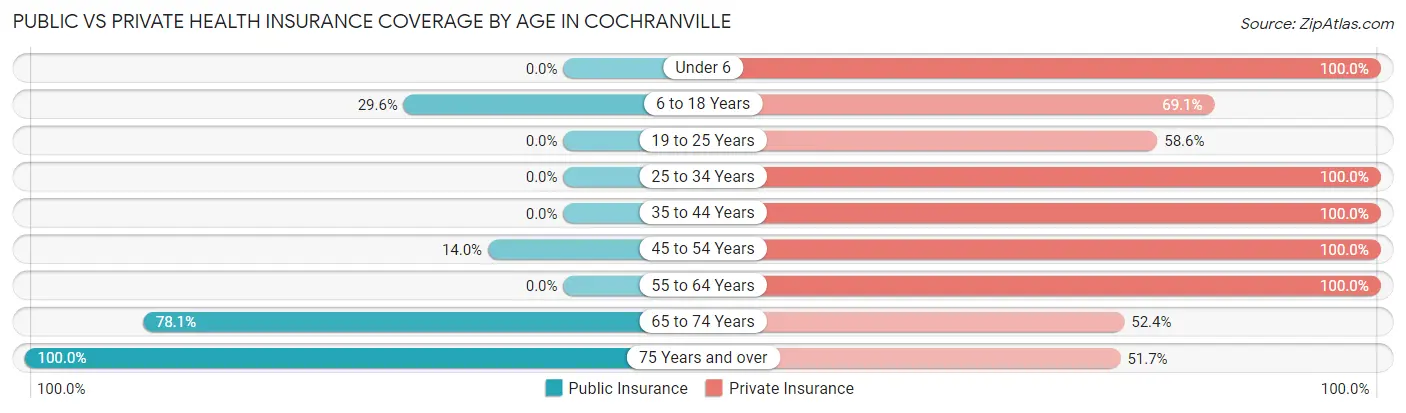
| Age Bracket | Public Insurance | Private Insurance |
| Under 6 | 0 (0.0%) | 10 (100.0%) |
| 6 to 18 Years | 24 (29.6%) | 56 (69.1%) |
| 19 to 25 Years | 0 (0.0%) | 41 (58.6%) |
| 25 to 34 Years | 0 (0.0%) | 15 (100.0%) |
| 35 to 44 Years | 0 (0.0%) | 47 (100.0%) |
| 45 to 54 Years | 7 (14.0%) | 50 (100.0%) |
| 55 to 64 Years | 0 (0.0%) | 75 (100.0%) |
| 65 to 74 Years | 64 (78.0%) | 43 (52.4%) |
| 75 Years and over | 58 (100.0%) | 30 (51.7%) |
| Total | 153 (31.4%) | 367 (75.2%) |
Disability Status by Sex by Age in Cochranville
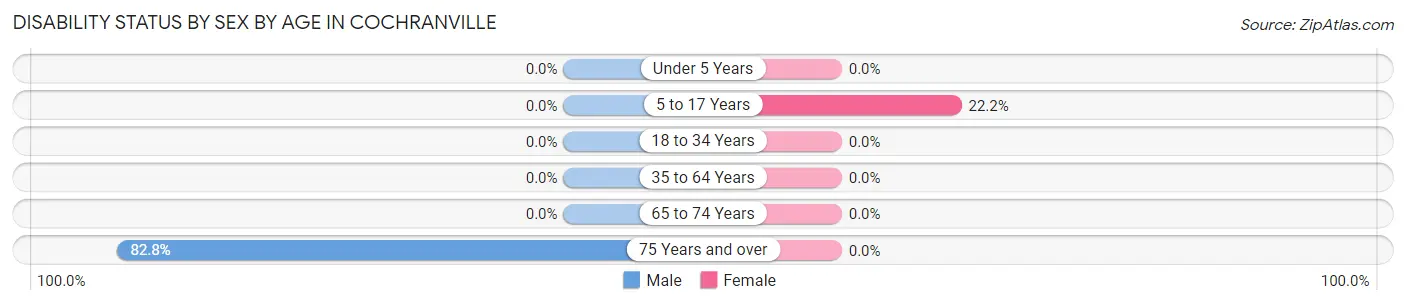
| Age Bracket | Male | Female |
| Under 5 Years | 0 (0.0%) | 0 (0.0%) |
| 5 to 17 Years | 0 (0.0%) | 12 (22.2%) |
| 18 to 34 Years | 0 (0.0%) | 0 (0.0%) |
| 35 to 64 Years | 0 (0.0%) | 0 (0.0%) |
| 65 to 74 Years | 0 (0.0%) | 0 (0.0%) |
| 75 Years and over | 24 (82.8%) | 0 (0.0%) |
Disability Class by Sex by Age in Cochranville
Disability Class: Hearing Difficulty
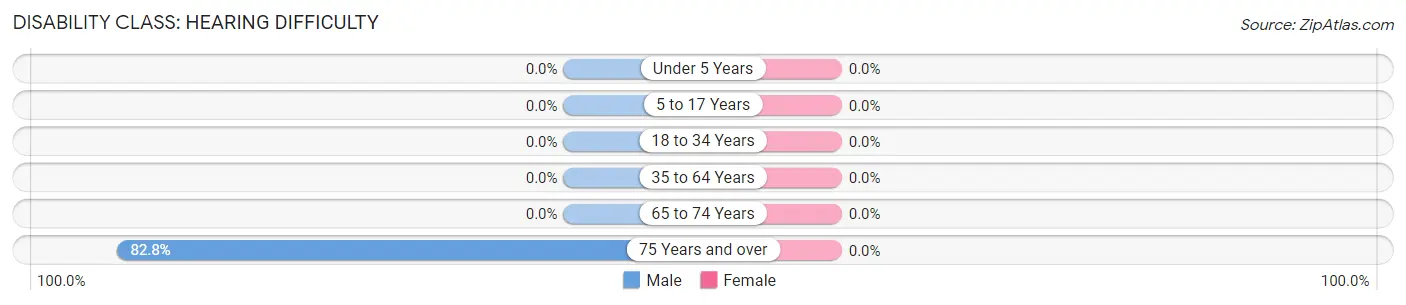
| Age Bracket | Male | Female |
| Under 5 Years | 0 (0.0%) | 0 (0.0%) |
| 5 to 17 Years | 0 (0.0%) | 0 (0.0%) |
| 18 to 34 Years | 0 (0.0%) | 0 (0.0%) |
| 35 to 64 Years | 0 (0.0%) | 0 (0.0%) |
| 65 to 74 Years | 0 (0.0%) | 0 (0.0%) |
| 75 Years and over | 24 (82.8%) | 0 (0.0%) |
Disability Class: Vision Difficulty
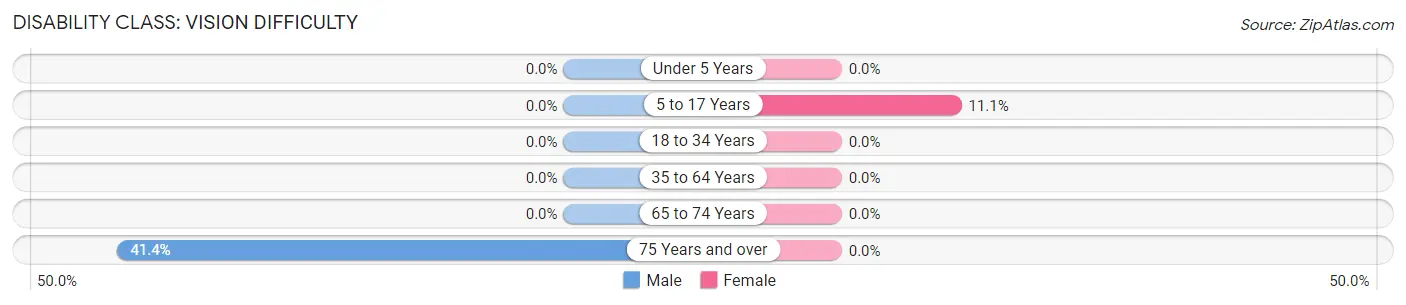
| Age Bracket | Male | Female |
| Under 5 Years | 0 (0.0%) | 0 (0.0%) |
| 5 to 17 Years | 0 (0.0%) | 6 (11.1%) |
| 18 to 34 Years | 0 (0.0%) | 0 (0.0%) |
| 35 to 64 Years | 0 (0.0%) | 0 (0.0%) |
| 65 to 74 Years | 0 (0.0%) | 0 (0.0%) |
| 75 Years and over | 12 (41.4%) | 0 (0.0%) |
Disability Class: Cognitive Difficulty
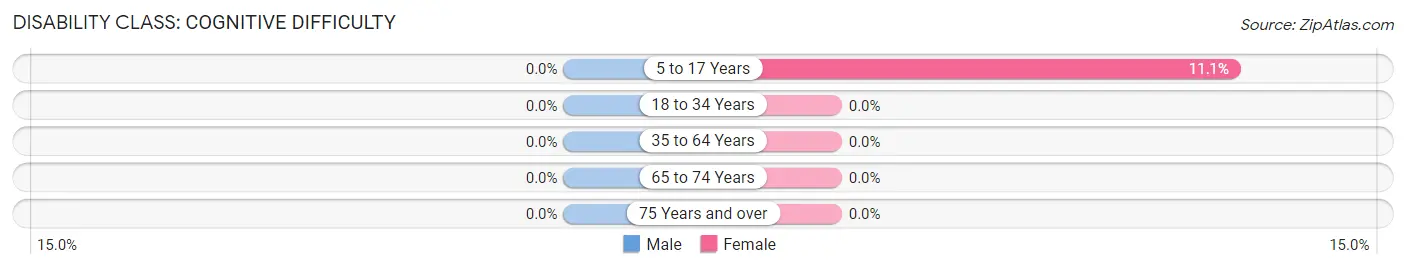
| Age Bracket | Male | Female |
| 5 to 17 Years | 0 (0.0%) | 6 (11.1%) |
| 18 to 34 Years | 0 (0.0%) | 0 (0.0%) |
| 35 to 64 Years | 0 (0.0%) | 0 (0.0%) |
| 65 to 74 Years | 0 (0.0%) | 0 (0.0%) |
| 75 Years and over | 0 (0.0%) | 0 (0.0%) |
Disability Class: Ambulatory Difficulty
| Age Bracket | Male | Female |
| 5 to 17 Years | 0 (0.0%) | 0 (0.0%) |
| 18 to 34 Years | 0 (0.0%) | 0 (0.0%) |
| 35 to 64 Years | 0 (0.0%) | 0 (0.0%) |
| 65 to 74 Years | 0 (0.0%) | 0 (0.0%) |
| 75 Years and over | 0 (0.0%) | 0 (0.0%) |
Disability Class: Self-Care Difficulty
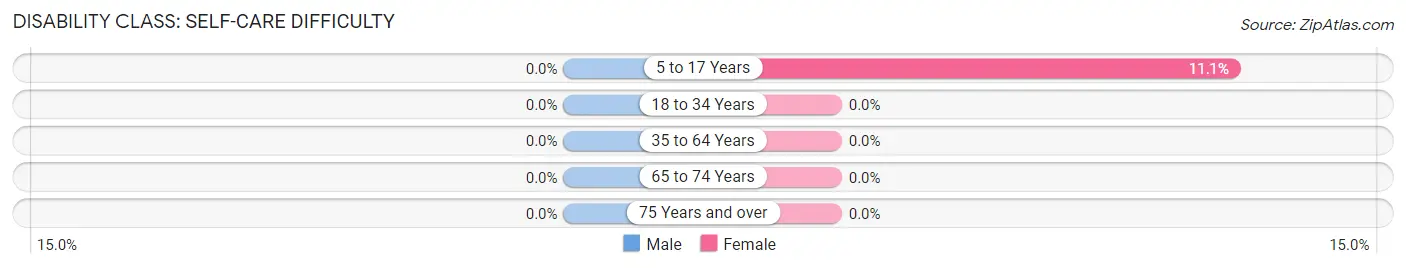
| Age Bracket | Male | Female |
| 5 to 17 Years | 0 (0.0%) | 6 (11.1%) |
| 18 to 34 Years | 0 (0.0%) | 0 (0.0%) |
| 35 to 64 Years | 0 (0.0%) | 0 (0.0%) |
| 65 to 74 Years | 0 (0.0%) | 0 (0.0%) |
| 75 Years and over | 0 (0.0%) | 0 (0.0%) |
Technology Access in Cochranville
Computing Device Access in Cochranville
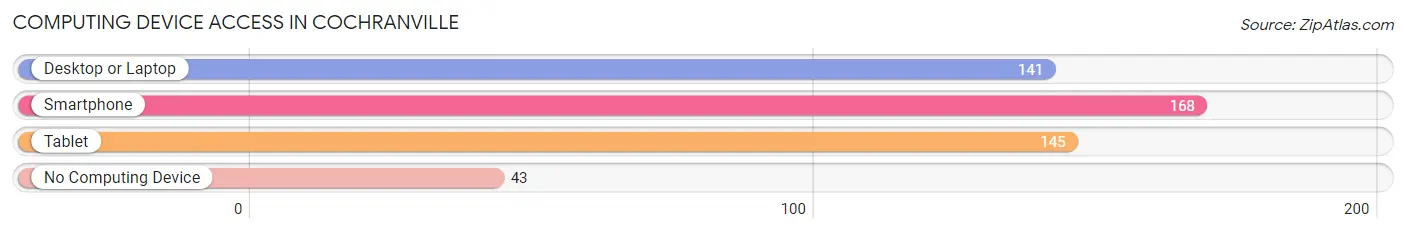
| Device Type | # Households | % Households |
| Desktop or Laptop | 141 | 60.0% |
| Smartphone | 168 | 71.5% |
| Tablet | 145 | 61.7% |
| No Computing Device | 43 | 18.3% |
| Total | 235 | 100.0% |
Internet Access in Cochranville
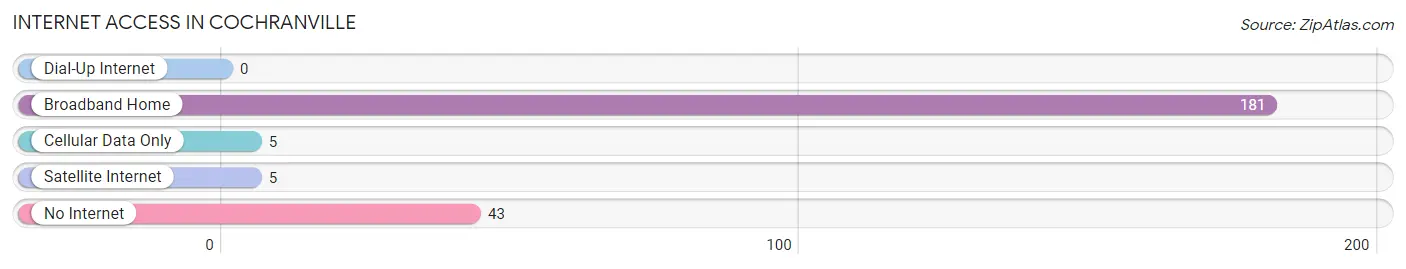
| Internet Type | # Households | % Households |
| Dial-Up Internet | 0 | 0.0% |
| Broadband Home | 181 | 77.0% |
| Cellular Data Only | 5 | 2.1% |
| Satellite Internet | 5 | 2.1% |
| No Internet | 43 | 18.3% |
| Total | 235 | 100.0% |
Cochranville Summary
Cochranville is a small unincorporated community located in the southern part of Chester County, Pennsylvania. It is situated in the southeastern corner of the county, near the border with Lancaster County. The community is located along the banks of the Octoraro Creek, which is a tributary of the Susquehanna River. The population of Cochranville was estimated to be 1,845 in 2019.
History
Cochranville was founded in 1737 by William Cochran, a Quaker from Ireland. He purchased a large tract of land in the area and built a mill on the Octoraro Creek. The mill was used to grind grain and produce flour. The town was named after Cochran and was originally known as Cochran's Mill.
In the late 19th century, the town was a popular stop on the Philadelphia and Baltimore Central Railroad. The railroad brought many visitors to the area, and the town grew in size and prosperity.
Geography
Cochranville is located in the southeastern corner of Chester County, Pennsylvania. It is situated along the banks of the Octoraro Creek, which is a tributary of the Susquehanna River. The town is located approximately 25 miles west of Philadelphia and 40 miles east of Lancaster.
The town is located in a rural area and is surrounded by farmland. The terrain is mostly flat, with some rolling hills. The climate is temperate, with hot summers and cold winters.
Economy
Cochranville is a small, rural community with a limited economy. The town is home to several small businesses, including a grocery store, a hardware store, and a few restaurants. The town is also home to a few small manufacturing companies.
The town is also home to a large Amish community, which contributes to the local economy. The Amish are known for their traditional farming practices and produce a variety of goods, including furniture, quilts, and baked goods.
Demographics
As of 2019, the population of Cochranville was estimated to be 1,845. The town is predominantly white, with a small African American population. The median household income is $63,000, and the median home value is $250,000.
The town is home to a large Amish community, which makes up approximately 10% of the population. The Amish are known for their traditional lifestyle and values, and they are a major part of the local culture.
Conclusion
Cochranville is a small, rural community located in the southeastern corner of Chester County, Pennsylvania. The town was founded in 1737 by William Cochran, a Quaker from Ireland. The town is home to a few small businesses, as well as a large Amish community. The population of Cochranville was estimated to be 1,845 in 2019. The town is predominantly white, with a small African American population. The median household income is $63,000, and the median home value is $250,000.
Common Questions
What is Per Capita Income in Cochranville?
Per Capita income in Cochranville is $54,223.
What is the Median Family Income in Cochranville?
Median Family Income in Cochranville is $77,470.
What is the Median Household income in Cochranville?
Median Household Income in Cochranville is $92,292.
What is Income or Wage Gap in Cochranville?
Income or Wage Gap in Cochranville is 58.9%.
Women in Cochranville earn 41.1 cents for every dollar earned by a man.
What is Inequality or Gini Index in Cochranville?
Inequality or Gini Index in Cochranville is 0.32.
What is the Total Population of Cochranville?
Total Population of Cochranville is 488.
What is the Total Male Population of Cochranville?
Total Male Population of Cochranville is 261.
What is the Total Female Population of Cochranville?
Total Female Population of Cochranville is 227.
What is the Ratio of Males per 100 Females in Cochranville?
There are 114.98 Males per 100 Females in Cochranville.
What is the Ratio of Females per 100 Males in Cochranville?
There are 86.97 Females per 100 Males in Cochranville.
What is the Median Population Age in Cochranville?
Median Population Age in Cochranville is 49.6 Years.
What is the Average Family Size in Cochranville
Average Family Size in Cochranville is 2.6 People.
What is the Average Household Size in Cochranville
Average Household Size in Cochranville is 2.1 People.
How Large is the Labor Force in Cochranville?
There are 245 People in the Labor Forcein in Cochranville.
What is the Percentage of People in the Labor Force in Cochranville?
58.2% of People are in the Labor Force in Cochranville.
What is the Unemployment Rate in Cochranville?
Unemployment Rate in Cochranville is 2.9%.