Vintondale borough, PA Map & Demographics
Vintondale borough Overview
$25,121
PER CAPITA INCOME
$55,938
AVG FAMILY INCOME
$41,964
AVG HOUSEHOLD INCOME
33.1%
WAGE / INCOME GAP [ % ]
66.9¢/ $1
WAGE / INCOME GAP [ $ ]
0.46
INEQUALITY / GINI INDEX
455
TOTAL POPULATION
216
MALE POPULATION
239
FEMALE POPULATION
90.38
MALES / 100 FEMALES
110.65
FEMALES / 100 MALES
41.6
MEDIAN AGE
3.0
AVG FAMILY SIZE
2.4
AVG HOUSEHOLD SIZE
188
LABOR FORCE [ PEOPLE ]
51.8%
PERCENT IN LABOR FORCE
13.3%
UNEMPLOYMENT RATE
Income in Vintondale borough
Income Overview in Vintondale borough
Per Capita Income in Vintondale borough is $25,121, while median incomes of families and households are $55,938 and $41,964 respectively.
| Characteristic | Number | Measure |
| Per Capita Income | 455 | $25,121 |
| Median Family Income | 119 | $55,938 |
| Mean Family Income | 119 | $67,394 |
| Median Household Income | 189 | $41,964 |
| Mean Household Income | 189 | $58,350 |
| Income Deficit | 119 | $0 |
| Wage / Income Gap (%) | 455 | 33.13% |
| Wage / Income Gap ($) | 455 | 66.87¢ per $1 |
| Gini / Inequality Index | 455 | 0.46 |
Earnings by Sex in Vintondale borough
Average Earnings in Vintondale borough are $33,214, $41,875 for men and $28,000 for women, a difference of 33.1%.
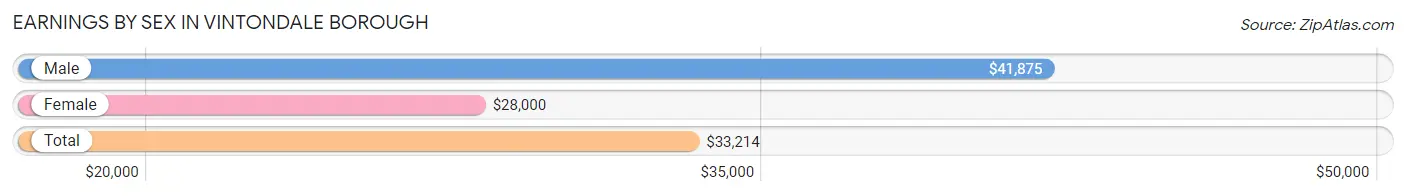
| Sex | Number | Average Earnings |
| Male | 102 (48.6%) | $41,875 |
| Female | 108 (51.4%) | $28,000 |
| Total | 210 (100.0%) | $33,214 |
Earnings by Sex by Income Bracket in Vintondale borough
The most common earnings brackets in Vintondale borough are $55,000 to $64,999 for men (16 | 15.7%) and $30,000 to $34,999 for women (18 | 16.7%).
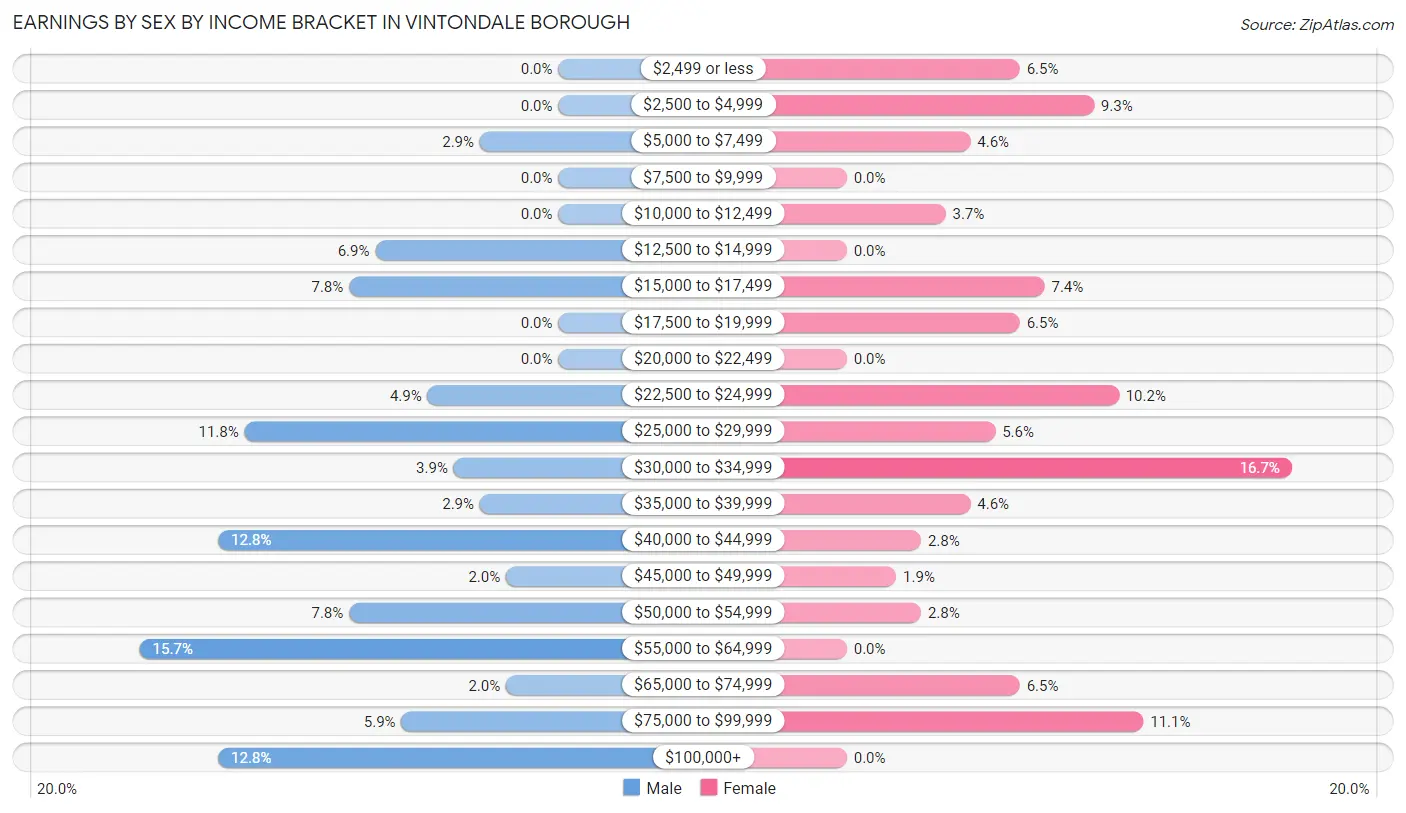
| Income | Male | Female |
| $2,499 or less | 0 (0.0%) | 7 (6.5%) |
| $2,500 to $4,999 | 0 (0.0%) | 10 (9.3%) |
| $5,000 to $7,499 | 3 (2.9%) | 5 (4.6%) |
| $7,500 to $9,999 | 0 (0.0%) | 0 (0.0%) |
| $10,000 to $12,499 | 0 (0.0%) | 4 (3.7%) |
| $12,500 to $14,999 | 7 (6.9%) | 0 (0.0%) |
| $15,000 to $17,499 | 8 (7.8%) | 8 (7.4%) |
| $17,500 to $19,999 | 0 (0.0%) | 7 (6.5%) |
| $20,000 to $22,499 | 0 (0.0%) | 0 (0.0%) |
| $22,500 to $24,999 | 5 (4.9%) | 11 (10.2%) |
| $25,000 to $29,999 | 12 (11.8%) | 6 (5.6%) |
| $30,000 to $34,999 | 4 (3.9%) | 18 (16.7%) |
| $35,000 to $39,999 | 3 (2.9%) | 5 (4.6%) |
| $40,000 to $44,999 | 13 (12.8%) | 3 (2.8%) |
| $45,000 to $49,999 | 2 (2.0%) | 2 (1.8%) |
| $50,000 to $54,999 | 8 (7.8%) | 3 (2.8%) |
| $55,000 to $64,999 | 16 (15.7%) | 0 (0.0%) |
| $65,000 to $74,999 | 2 (2.0%) | 7 (6.5%) |
| $75,000 to $99,999 | 6 (5.9%) | 12 (11.1%) |
| $100,000+ | 13 (12.8%) | 0 (0.0%) |
| Total | 102 (100.0%) | 108 (100.0%) |
Earnings by Sex by Educational Attainment in Vintondale borough
Average earnings in Vintondale borough are $51,500 for men and $31,875 for women, a difference of 38.1%. Men with an educational attainment of college or associate's degree enjoy the highest average annual earnings of $83,750, while those with high school diploma education earn the least with $42,031. Women with an educational attainment of college or associate's degree earn the most with the average annual earnings of $40,833, while those with high school diploma education have the smallest earnings of $31,406.
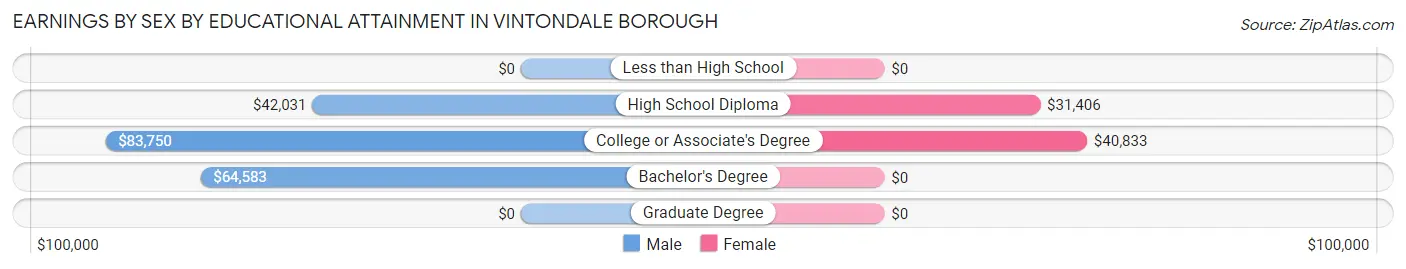
| Educational Attainment | Male Income | Female Income |
| Less than High School | - | - |
| High School Diploma | $42,031 | $31,406 |
| College or Associate's Degree | $83,750 | $40,833 |
| Bachelor's Degree | $64,583 | $0 |
| Graduate Degree | - | - |
| Total | $51,500 | $31,875 |
Family Income in Vintondale borough
Family Income Brackets in Vintondale borough
According to the Vintondale borough family income data, there are 22 families falling into the $35,000 to $49,999 income range, which is the most common income bracket and makes up 18.5% of all families.
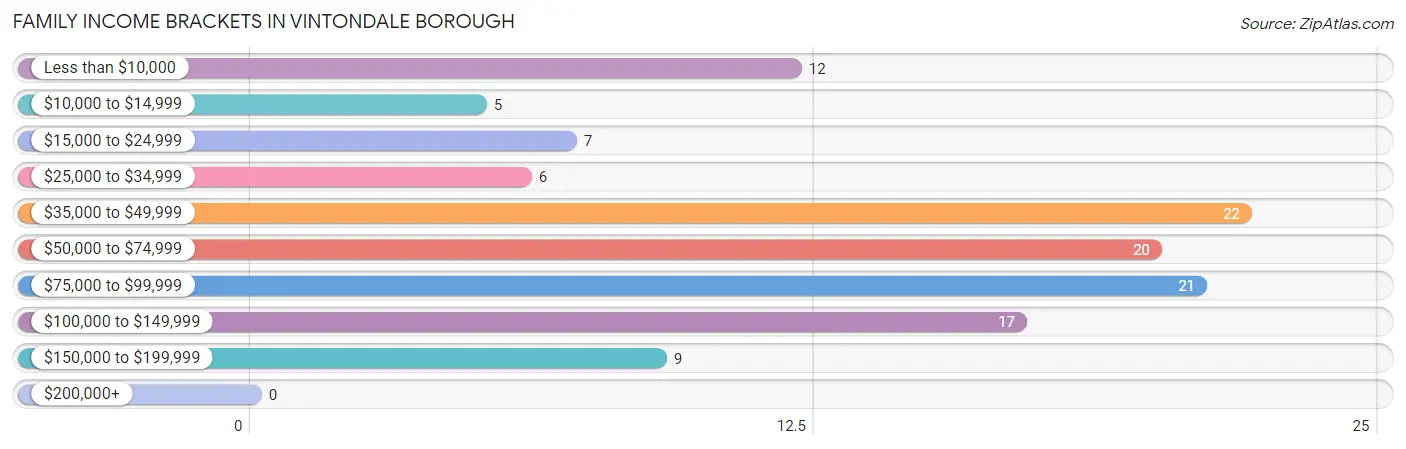
| Income Bracket | # Families | % Families |
| Less than $10,000 | 12 | 10.1% |
| $10,000 to $14,999 | 5 | 4.2% |
| $15,000 to $24,999 | 7 | 5.9% |
| $25,000 to $34,999 | 6 | 5.0% |
| $35,000 to $49,999 | 22 | 18.5% |
| $50,000 to $74,999 | 20 | 16.8% |
| $75,000 to $99,999 | 21 | 17.6% |
| $100,000 to $149,999 | 17 | 14.3% |
| $150,000 to $199,999 | 9 | 7.6% |
| $200,000+ | 0 | 0.0% |
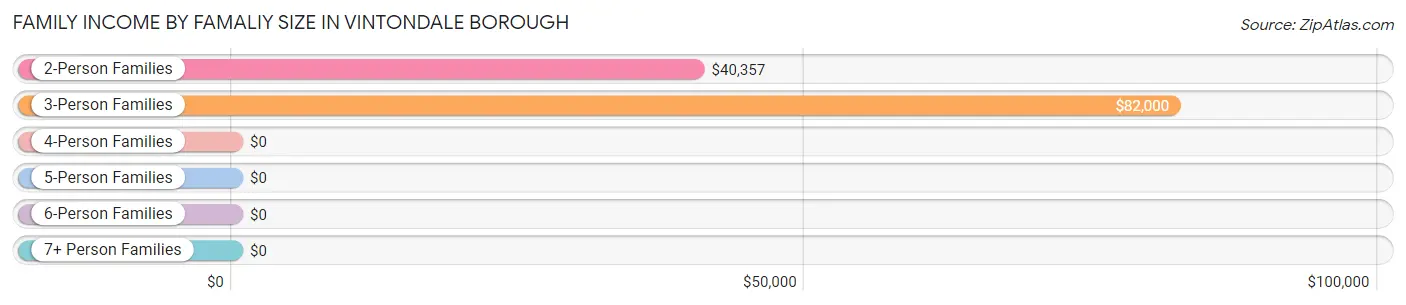
Family Income by Famaliy Size in Vintondale borough
3-person families (30 | 25.2%) account for the highest median family income in Vintondale borough with $82,000 per family, while 3-person families (30 | 25.2%) have the highest median income of $27,333 per family member.
| Income Bracket | # Families | Median Income |
| 2-Person Families | 60 (50.4%) | $40,357 |
| 3-Person Families | 30 (25.2%) | $82,000 |
| 4-Person Families | 16 (13.5%) | $0 |
| 5-Person Families | 6 (5.0%) | $0 |
| 6-Person Families | 6 (5.0%) | $0 |
| 7+ Person Families | 1 (0.8%) | $0 |
| Total | 119 (100.0%) | $55,938 |
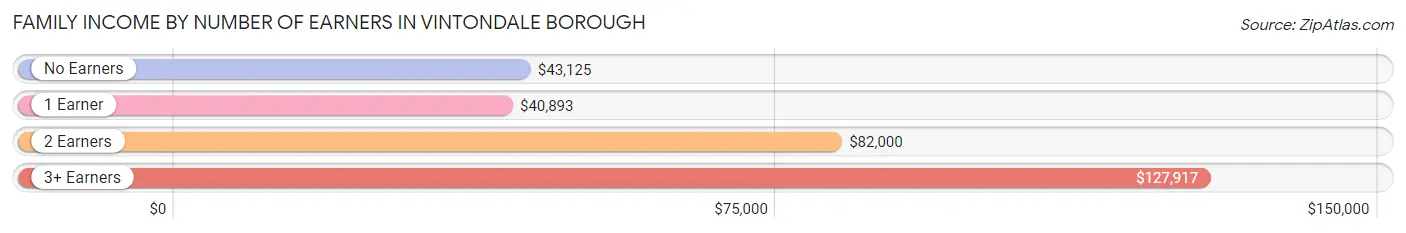
Family Income by Number of Earners in Vintondale borough
The median family income in Vintondale borough is $55,938, with families comprising 3+ earners (16) having the highest median family income of $127,917, while families with 1 earner (49) have the lowest median family income of $40,893, accounting for 13.5% and 41.2% of families, respectively.
| Number of Earners | # Families | Median Income |
| No Earners | 24 (20.2%) | $43,125 |
| 1 Earner | 49 (41.2%) | $40,893 |
| 2 Earners | 30 (25.2%) | $82,000 |
| 3+ Earners | 16 (13.5%) | $127,917 |
| Total | 119 (100.0%) | $55,938 |
Household Income in Vintondale borough
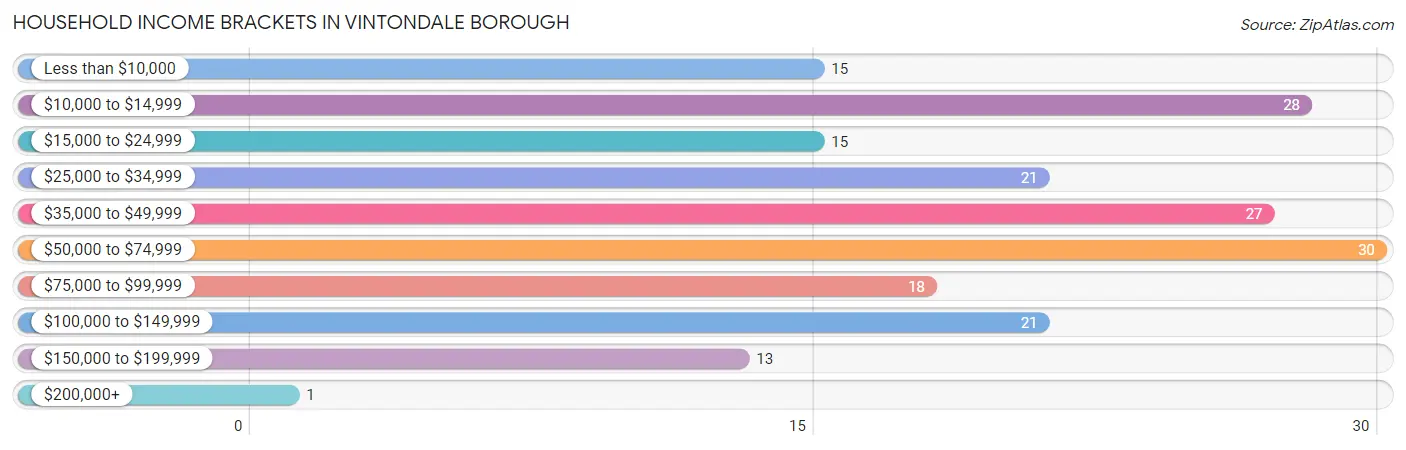
Household Income Brackets in Vintondale borough
With 30 households falling in the category, the $50,000 to $74,999 income range is the most frequent in Vintondale borough, accounting for 15.9% of all households. In contrast, only 1 households (0.5%) fall into the $200,000+ income bracket, making it the least populous group.
| Income Bracket | # Households | % Households |
| Less than $10,000 | 15 | 7.9% |
| $10,000 to $14,999 | 28 | 14.8% |
| $15,000 to $24,999 | 15 | 7.9% |
| $25,000 to $34,999 | 21 | 11.1% |
| $35,000 to $49,999 | 27 | 14.3% |
| $50,000 to $74,999 | 30 | 15.9% |
| $75,000 to $99,999 | 18 | 9.5% |
| $100,000 to $149,999 | 21 | 11.1% |
| $150,000 to $199,999 | 13 | 6.9% |
| $200,000+ | 1 | 0.5% |
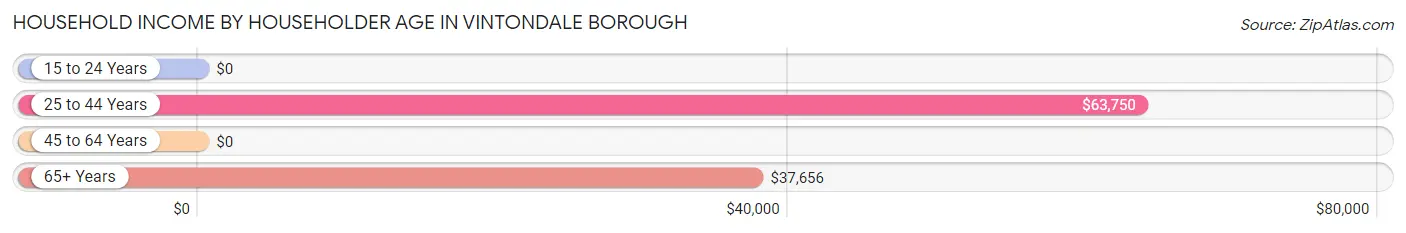
Household Income by Householder Age in Vintondale borough
The median household income in Vintondale borough is $41,964, with the highest median household income of $63,750 found in the 25 to 44 years age bracket for the primary householder. A total of 50 households (26.5%) fall into this category. Meanwhile, the 15 to 24 years age bracket for the primary householder has the lowest median household income of $0, with 4 households (2.1%) in this group.
| Income Bracket | # Households | Median Income |
| 15 to 24 Years | 4 (2.1%) | $0 |
| 25 to 44 Years | 50 (26.5%) | $63,750 |
| 45 to 64 Years | 76 (40.2%) | $0 |
| 65+ Years | 59 (31.2%) | $37,656 |
| Total | 189 (100.0%) | $41,964 |
Poverty in Vintondale borough
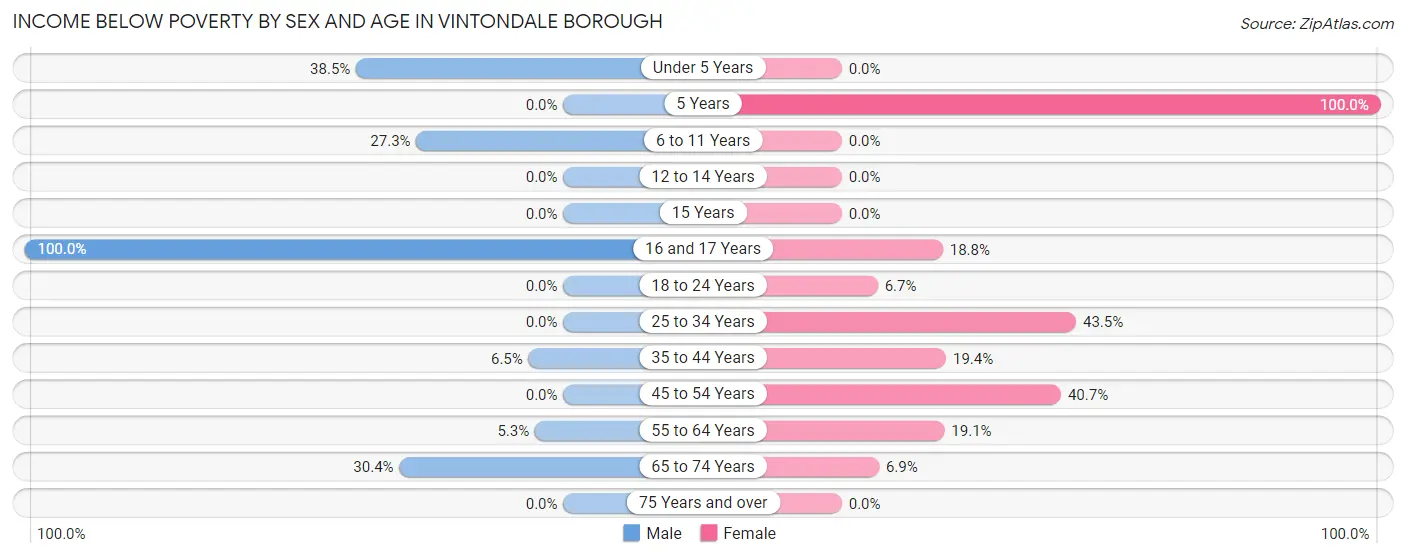
Income Below Poverty by Sex and Age in Vintondale borough
With 10.6% poverty level for males and 22.6% for females among the residents of Vintondale borough, 16 and 17 year old males and 5 year old females are the most vulnerable to poverty, with 2 males (100.0%) and 4 females (100.0%) in their respective age groups living below the poverty level.
| Age Bracket | Male | Female |
| Under 5 Years | 5 (38.5%) | 0 (0.0%) |
| 5 Years | 0 (0.0%) | 4 (100.0%) |
| 6 to 11 Years | 6 (27.3%) | 0 (0.0%) |
| 12 to 14 Years | 0 (0.0%) | 0 (0.0%) |
| 15 Years | 0 (0.0%) | 0 (0.0%) |
| 16 and 17 Years | 2 (100.0%) | 3 (18.8%) |
| 18 to 24 Years | 0 (0.0%) | 1 (6.7%) |
| 25 to 34 Years | 0 (0.0%) | 10 (43.5%) |
| 35 to 44 Years | 2 (6.5%) | 6 (19.4%) |
| 45 to 54 Years | 0 (0.0%) | 24 (40.7%) |
| 55 to 64 Years | 1 (5.3%) | 4 (19.1%) |
| 65 to 74 Years | 7 (30.4%) | 2 (6.9%) |
| 75 Years and over | 0 (0.0%) | 0 (0.0%) |
| Total | 23 (10.6%) | 54 (22.6%) |
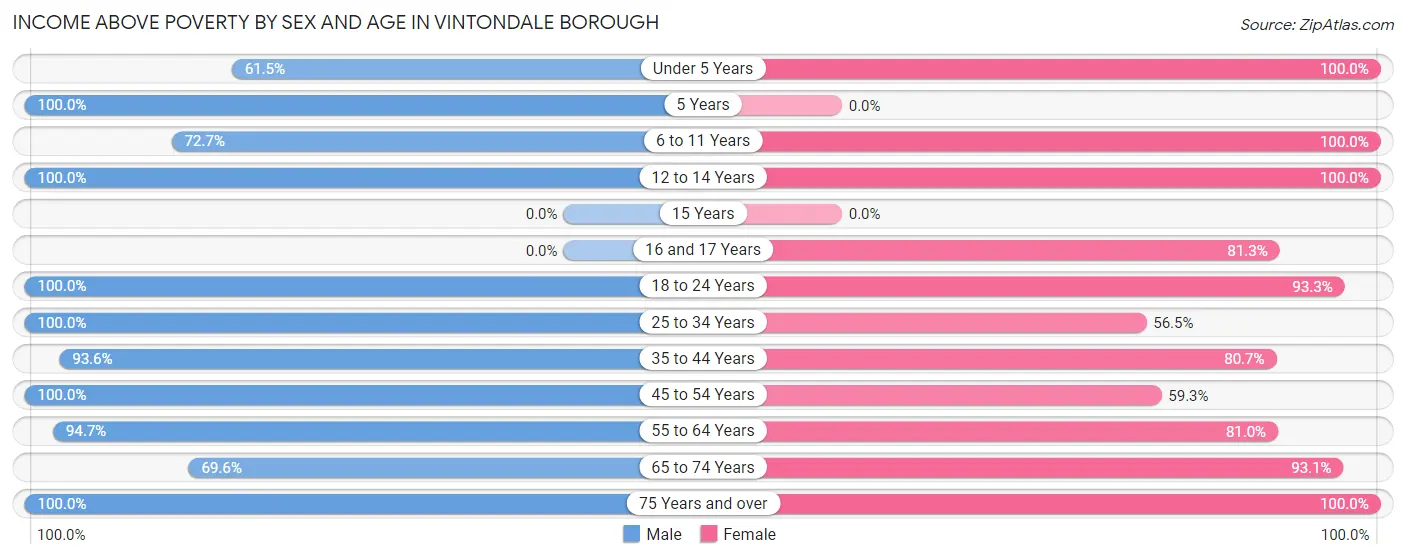
Income Above Poverty by Sex and Age in Vintondale borough
According to the poverty statistics in Vintondale borough, males aged 5 years and females aged under 5 years are the age groups that are most secure financially, with 100.0% of males and 100.0% of females in these age groups living above the poverty line.
| Age Bracket | Male | Female |
| Under 5 Years | 8 (61.5%) | 10 (100.0%) |
| 5 Years | 6 (100.0%) | 0 (0.0%) |
| 6 to 11 Years | 16 (72.7%) | 10 (100.0%) |
| 12 to 14 Years | 24 (100.0%) | 3 (100.0%) |
| 15 Years | 0 (0.0%) | 0 (0.0%) |
| 16 and 17 Years | 0 (0.0%) | 13 (81.2%) |
| 18 to 24 Years | 20 (100.0%) | 14 (93.3%) |
| 25 to 34 Years | 26 (100.0%) | 13 (56.5%) |
| 35 to 44 Years | 29 (93.5%) | 25 (80.6%) |
| 45 to 54 Years | 16 (100.0%) | 35 (59.3%) |
| 55 to 64 Years | 18 (94.7%) | 17 (80.9%) |
| 65 to 74 Years | 16 (69.6%) | 27 (93.1%) |
| 75 Years and over | 14 (100.0%) | 18 (100.0%) |
| Total | 193 (89.3%) | 185 (77.4%) |
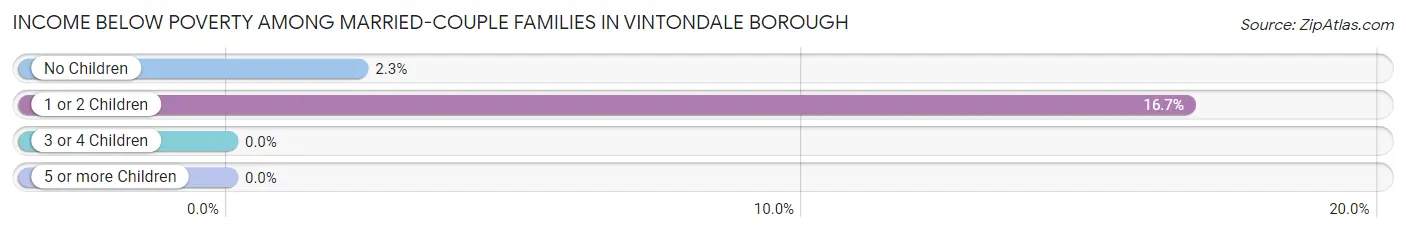
Income Below Poverty Among Married-Couple Families in Vintondale borough
The poverty statistics for married-couple families in Vintondale borough show that 6.7% or 5 of the total 75 families live below the poverty line. Families with 1 or 2 children have the highest poverty rate of 16.7%, comprising of 4 families. On the other hand, families with 3 or 4 children have the lowest poverty rate of 0.0%, which includes 0 families.
| Children | Above Poverty | Below Poverty |
| No Children | 43 (97.7%) | 1 (2.3%) |
| 1 or 2 Children | 20 (83.3%) | 4 (16.7%) |
| 3 or 4 Children | 6 (100.0%) | 0 (0.0%) |
| 5 or more Children | 1 (100.0%) | 0 (0.0%) |
| Total | 70 (93.3%) | 5 (6.7%) |
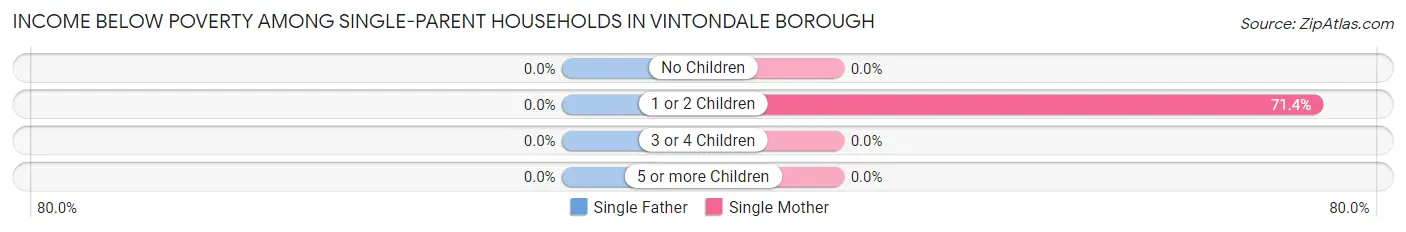
Income Below Poverty Among Single-Parent Households in Vintondale borough
| Children | Single Father | Single Mother |
| No Children | 0 (0.0%) | 0 (0.0%) |
| 1 or 2 Children | 0 (0.0%) | 15 (71.4%) |
| 3 or 4 Children | 0 (0.0%) | 0 (0.0%) |
| 5 or more Children | 0 (0.0%) | 0 (0.0%) |
| Total | 0 (0.0%) | 15 (46.9%) |
Income Below Poverty Among Married-Couple vs Single-Parent Households in Vintondale borough
The poverty data for Vintondale borough shows that 5 of the married-couple family households (6.7%) and 15 of the single-parent households (34.1%) are living below the poverty level. Within the married-couple family households, those with 1 or 2 children have the highest poverty rate, with 4 households (16.7%) falling below the poverty line. Among the single-parent households, those with 1 or 2 children have the highest poverty rate, with 15 household (57.7%) living below poverty.
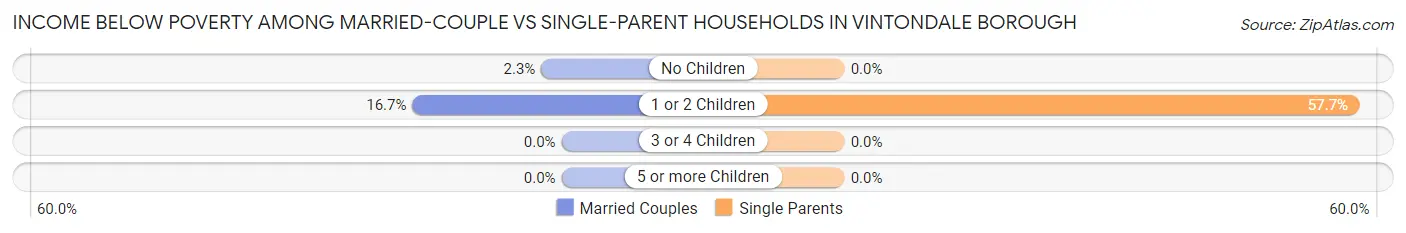
| Children | Married-Couple Families | Single-Parent Households |
| No Children | 1 (2.3%) | 0 (0.0%) |
| 1 or 2 Children | 4 (16.7%) | 15 (57.7%) |
| 3 or 4 Children | 0 (0.0%) | 0 (0.0%) |
| 5 or more Children | 0 (0.0%) | 0 (0.0%) |
| Total | 5 (6.7%) | 15 (34.1%) |
Race in Vintondale borough
The most populous races in Vintondale borough are White / Caucasian (446 | 98.0%), Two or more Races (7 | 1.5%), and Black / African American (2 | 0.4%).
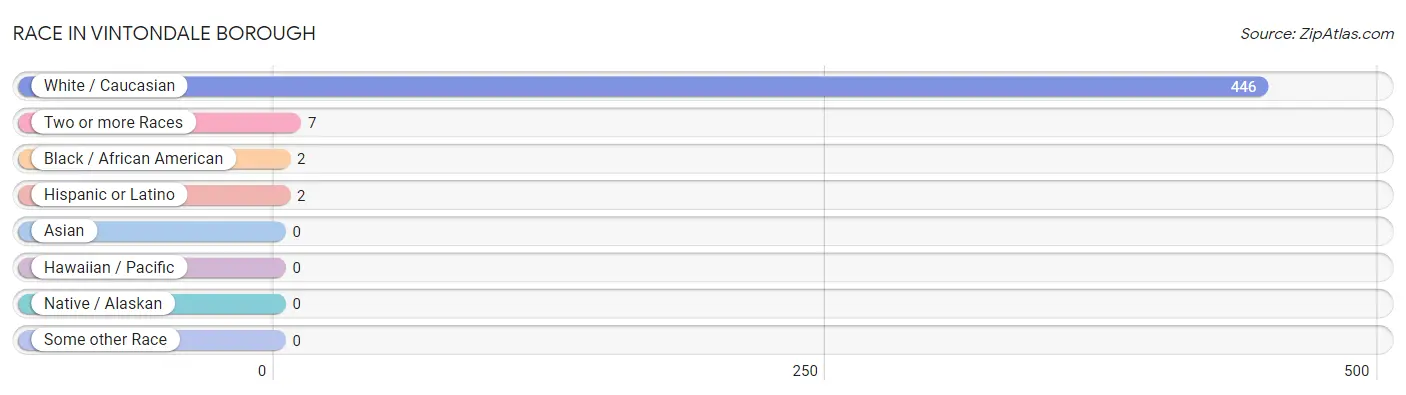
| Race | # Population | % Population |
| Asian | 0 | 0.0% |
| Black / African American | 2 | 0.4% |
| Hawaiian / Pacific | 0 | 0.0% |
| Hispanic or Latino | 2 | 0.4% |
| Native / Alaskan | 0 | 0.0% |
| White / Caucasian | 446 | 98.0% |
| Two or more Races | 7 | 1.5% |
| Some other Race | 0 | 0.0% |
| Total | 455 | 100.0% |
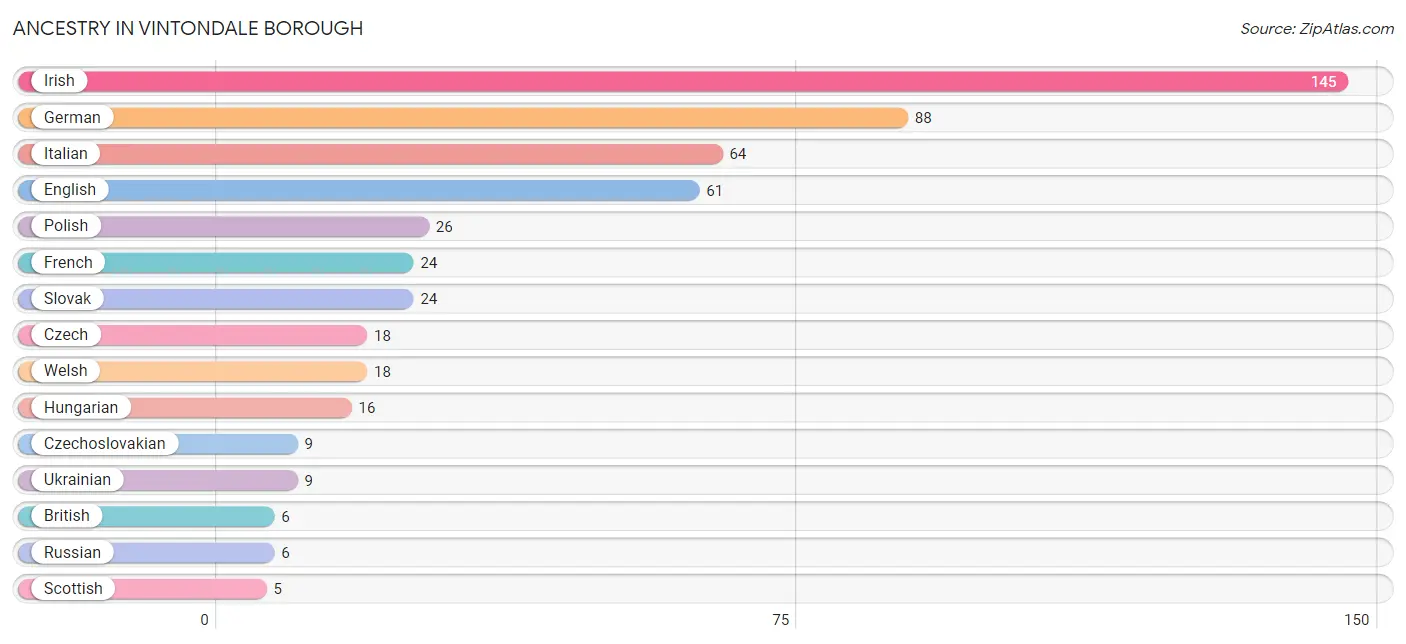
Ancestry in Vintondale borough
The most populous ancestries reported in Vintondale borough are Irish (145 | 31.9%), German (88 | 19.3%), Italian (64 | 14.1%), English (61 | 13.4%), and Polish (26 | 5.7%), together accounting for 84.4% of all Vintondale borough residents.
| Ancestry | # Population | % Population |
| American | 4 | 0.9% |
| British | 6 | 1.3% |
| Cherokee | 2 | 0.4% |
| Cuban | 2 | 0.4% |
| Czech | 18 | 4.0% |
| Czechoslovakian | 9 | 2.0% |
| Dutch | 1 | 0.2% |
| English | 61 | 13.4% |
| Finnish | 1 | 0.2% |
| French | 24 | 5.3% |
| German | 88 | 19.3% |
| Hungarian | 16 | 3.5% |
| Indian (Asian) | 1 | 0.2% |
| Irish | 145 | 31.9% |
| Israeli | 2 | 0.4% |
| Italian | 64 | 14.1% |
| Jamaican | 1 | 0.2% |
| Lithuanian | 2 | 0.4% |
| Northern European | 1 | 0.2% |
| Polish | 26 | 5.7% |
| Russian | 6 | 1.3% |
| Scottish | 5 | 1.1% |
| Serbian | 1 | 0.2% |
| Slavic | 2 | 0.4% |
| Slovak | 24 | 5.3% |
| Swedish | 1 | 0.2% |
| Ukrainian | 9 | 2.0% |
| Welsh | 18 | 4.0% | View All 28 Rows |
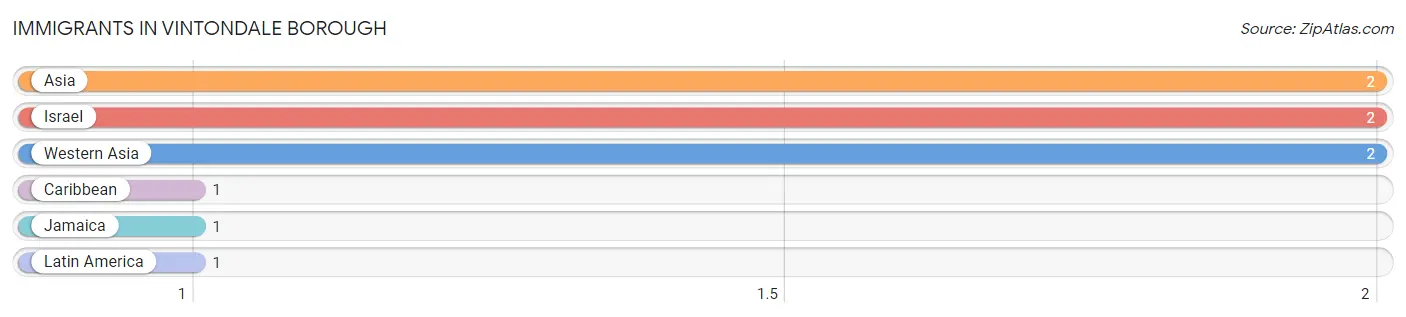
Immigrants in Vintondale borough
The most numerous immigrant groups reported in Vintondale borough came from Asia (2 | 0.4%), Israel (2 | 0.4%), Western Asia (2 | 0.4%), Caribbean (1 | 0.2%), and Jamaica (1 | 0.2%), together accounting for 1.8% of all Vintondale borough residents.
| Immigration Origin | # Population | % Population |
| Asia | 2 | 0.4% |
| Caribbean | 1 | 0.2% |
| Israel | 2 | 0.4% |
| Jamaica | 1 | 0.2% |
| Latin America | 1 | 0.2% |
| Western Asia | 2 | 0.4% | View All 6 Rows |
Sex and Age in Vintondale borough
Sex and Age in Vintondale borough
The most populous age groups in Vintondale borough are 10 to 14 Years (28 | 13.0%) for men and 50 to 54 Years (39 | 16.3%) for women.
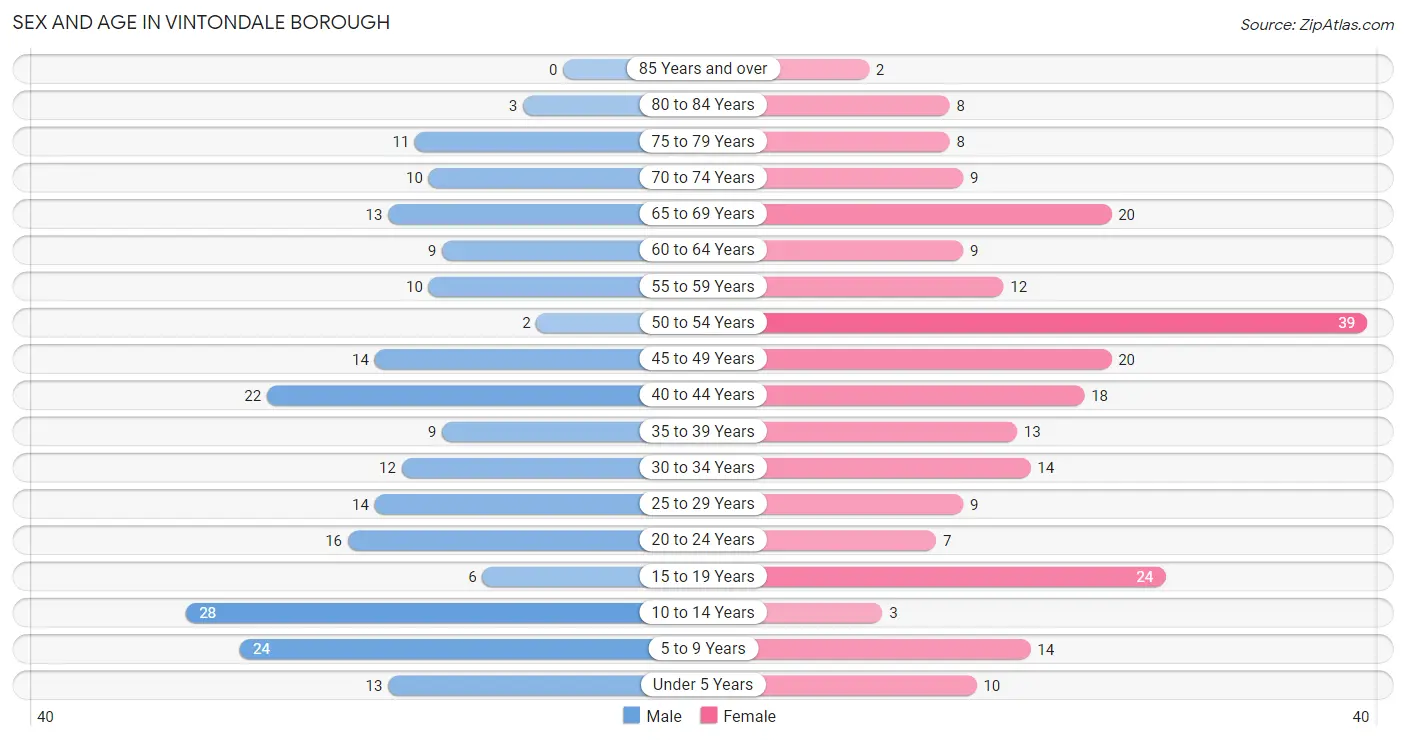
| Age Bracket | Male | Female |
| Under 5 Years | 13 (6.0%) | 10 (4.2%) |
| 5 to 9 Years | 24 (11.1%) | 14 (5.9%) |
| 10 to 14 Years | 28 (13.0%) | 3 (1.3%) |
| 15 to 19 Years | 6 (2.8%) | 24 (10.0%) |
| 20 to 24 Years | 16 (7.4%) | 7 (2.9%) |
| 25 to 29 Years | 14 (6.5%) | 9 (3.8%) |
| 30 to 34 Years | 12 (5.6%) | 14 (5.9%) |
| 35 to 39 Years | 9 (4.2%) | 13 (5.4%) |
| 40 to 44 Years | 22 (10.2%) | 18 (7.5%) |
| 45 to 49 Years | 14 (6.5%) | 20 (8.4%) |
| 50 to 54 Years | 2 (0.9%) | 39 (16.3%) |
| 55 to 59 Years | 10 (4.6%) | 12 (5.0%) |
| 60 to 64 Years | 9 (4.2%) | 9 (3.8%) |
| 65 to 69 Years | 13 (6.0%) | 20 (8.4%) |
| 70 to 74 Years | 10 (4.6%) | 9 (3.8%) |
| 75 to 79 Years | 11 (5.1%) | 8 (3.4%) |
| 80 to 84 Years | 3 (1.4%) | 8 (3.4%) |
| 85 Years and over | 0 (0.0%) | 2 (0.8%) |
| Total | 216 (100.0%) | 239 (100.0%) |
Families and Households in Vintondale borough
Median Family Size in Vintondale borough
The median family size in Vintondale borough is 2.99 persons per family, with single male/father families (12 | 10.1%) accounting for the largest median family size of 3.58 persons per family. On the other hand, single female/mother families (32 | 26.9%) represent the smallest median family size with 2.72 persons per family.
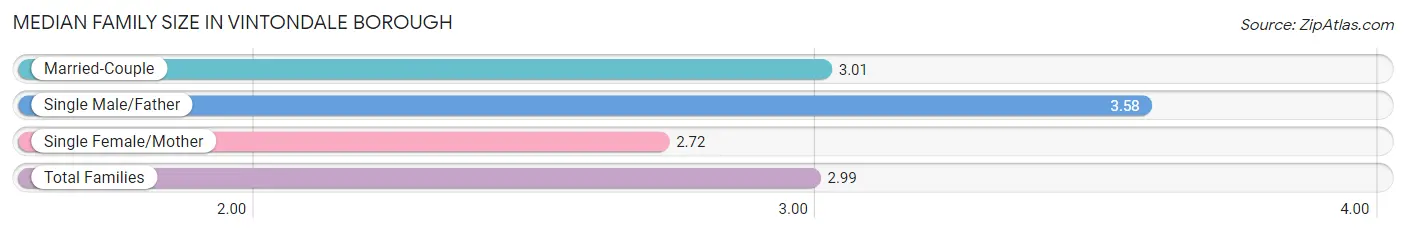
| Family Type | # Families | Family Size |
| Married-Couple | 75 (63.0%) | 3.01 |
| Single Male/Father | 12 (10.1%) | 3.58 |
| Single Female/Mother | 32 (26.9%) | 2.72 |
| Total Families | 119 (100.0%) | 2.99 |
Median Household Size in Vintondale borough
The median household size in Vintondale borough is 2.41 persons per household, with single male/father households (12 | 6.4%) accounting for the largest median household size of 3.83 persons per household. non-family households (70 | 37.0%) represent the smallest median household size with 1.19 persons per household.
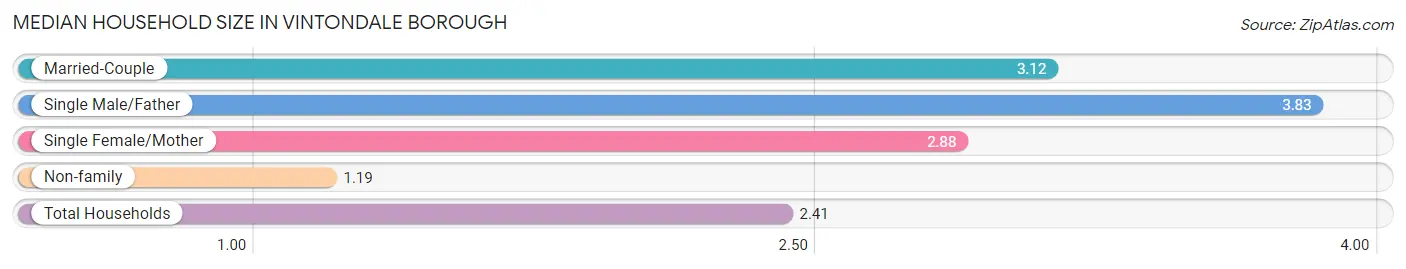
| Household Type | # Households | Household Size |
| Married-Couple | 75 (39.7%) | 3.12 |
| Single Male/Father | 12 (6.4%) | 3.83 |
| Single Female/Mother | 32 (16.9%) | 2.88 |
| Non-family | 70 (37.0%) | 1.19 |
| Total Households | 189 (100.0%) | 2.41 |
Household Size by Marriage Status in Vintondale borough
Out of a total of 189 households in Vintondale borough, 119 (63.0%) are family households, while 70 (37.0%) are nonfamily households. The most numerous type of family households are 2-person households, comprising 55, and the most common type of nonfamily households are 1-person households, comprising 57.
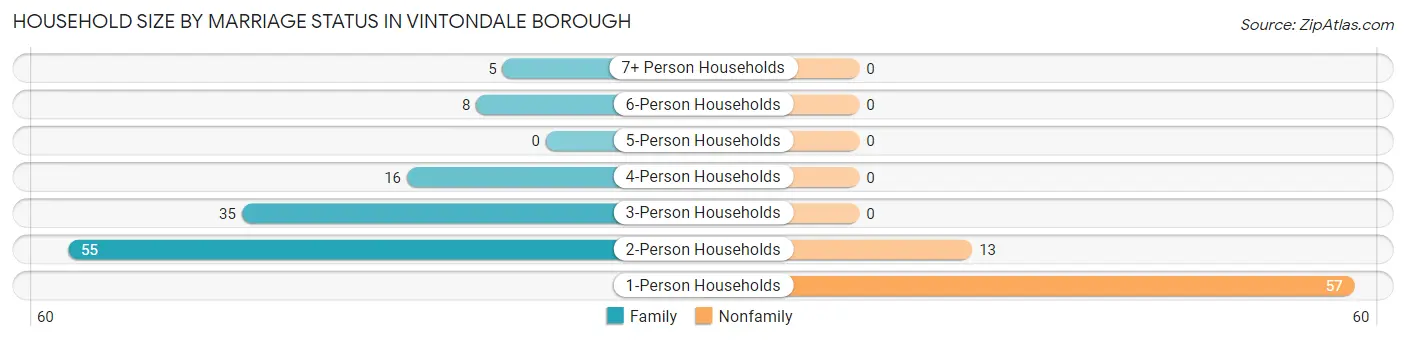
| Household Size | Family Households | Nonfamily Households |
| 1-Person Households | - | 57 (30.2%) |
| 2-Person Households | 55 (29.1%) | 13 (6.9%) |
| 3-Person Households | 35 (18.5%) | 0 (0.0%) |
| 4-Person Households | 16 (8.5%) | 0 (0.0%) |
| 5-Person Households | 0 (0.0%) | 0 (0.0%) |
| 6-Person Households | 8 (4.2%) | 0 (0.0%) |
| 7+ Person Households | 5 (2.6%) | 0 (0.0%) |
| Total | 119 (63.0%) | 70 (37.0%) |
Female Fertility in Vintondale borough
Fertility by Age in Vintondale borough
Average fertility rate in Vintondale borough is 99.0 births per 1,000 women. Women in the age bracket of 20 to 34 years have the highest fertility rate with 267.0 births per 1,000 women. Women in the age bracket of 20 to 34 years acount for 72.7% of all women with births.
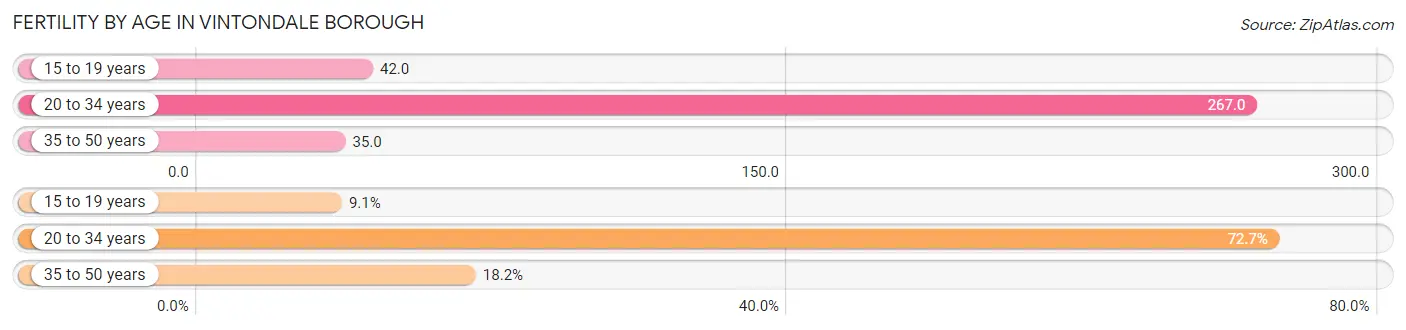
| Age Bracket | Women with Births | Births / 1,000 Women |
| 15 to 19 years | 1 (9.1%) | 42.0 |
| 20 to 34 years | 8 (72.7%) | 267.0 |
| 35 to 50 years | 2 (18.2%) | 35.0 |
| Total | 11 (100.0%) | 99.0 |
Fertility by Age by Marriage Status in Vintondale borough
18.2% of women with births (11) in Vintondale borough are married. The highest percentage of unmarried women with births falls into 15 to 19 years age bracket with 100.0% of them unmarried at the time of birth, while the lowest percentage of unmarried women with births belong to 35 to 50 years age bracket with 0.0% of them unmarried.
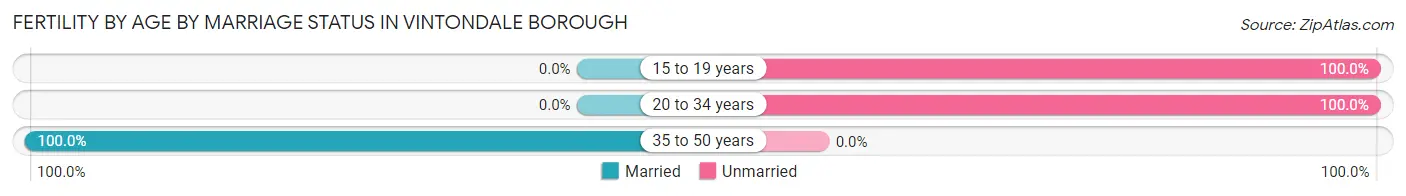
| Age Bracket | Married | Unmarried |
| 15 to 19 years | 0 (0.0%) | 1 (100.0%) |
| 20 to 34 years | 0 (0.0%) | 8 (100.0%) |
| 35 to 50 years | 2 (100.0%) | 0 (0.0%) |
| Total | 2 (18.2%) | 9 (81.8%) |
Fertility by Education in Vintondale borough
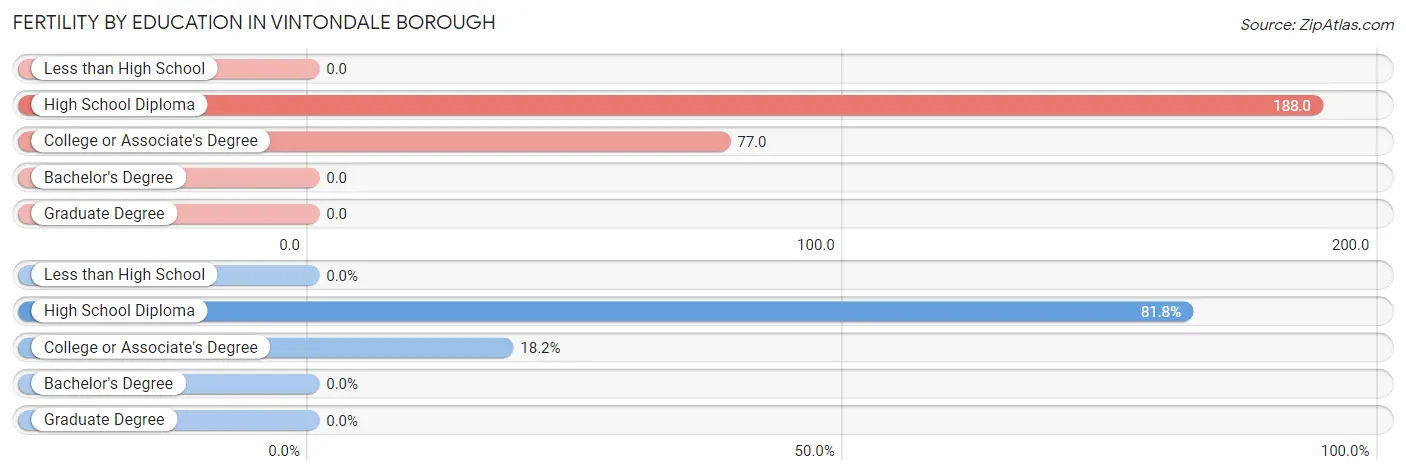
| Educational Attainment | Women with Births | Births / 1,000 Women |
| Less than High School | 0 (0.0%) | 0.0 |
| High School Diploma | 9 (81.8%) | 188.0 |
| College or Associate's Degree | 2 (18.2%) | 77.0 |
| Bachelor's Degree | 0 (0.0%) | 0.0 |
| Graduate Degree | 0 (0.0%) | 0.0 |
| Total | 11 (100.0%) | 99.0 |
Fertility by Education by Marriage Status in Vintondale borough
81.8% of women with births in Vintondale borough are unmarried. Women with the educational attainment of high school diploma are most likely to be married with 22.2% of them married at childbirth, while women with the educational attainment of college or associate's degree are least likely to be married with 100.0% of them unmarried at childbirth.
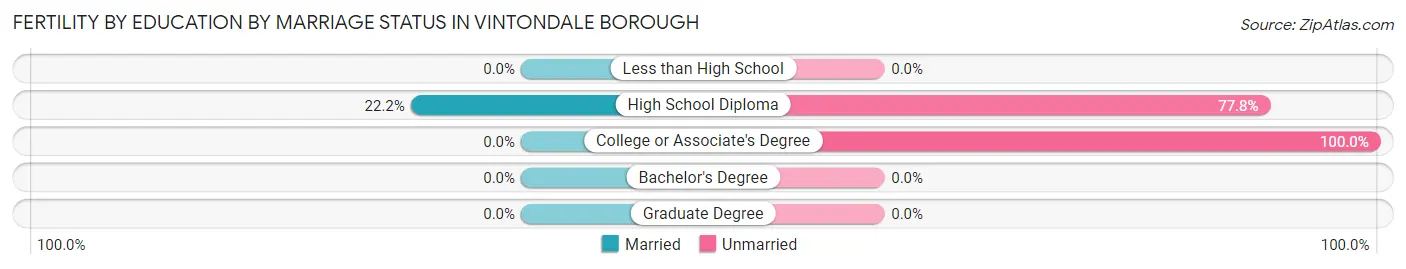
| Educational Attainment | Married | Unmarried |
| Less than High School | 0 (0.0%) | 0 (0.0%) |
| High School Diploma | 2 (22.2%) | 7 (77.8%) |
| College or Associate's Degree | 0 (0.0%) | 2 (100.0%) |
| Bachelor's Degree | 0 (0.0%) | 0 (0.0%) |
| Graduate Degree | 0 (0.0%) | 0 (0.0%) |
| Total | 2 (18.2%) | 9 (81.8%) |
Employment Characteristics in Vintondale borough
Employment by Class of Employer in Vintondale borough
Among the 162 employed individuals in Vintondale borough, private company employees (127 | 78.4%), local government employees (15 | 9.3%), and self-employed (not incorporated) (10 | 6.2%) make up the most common classes of employment.
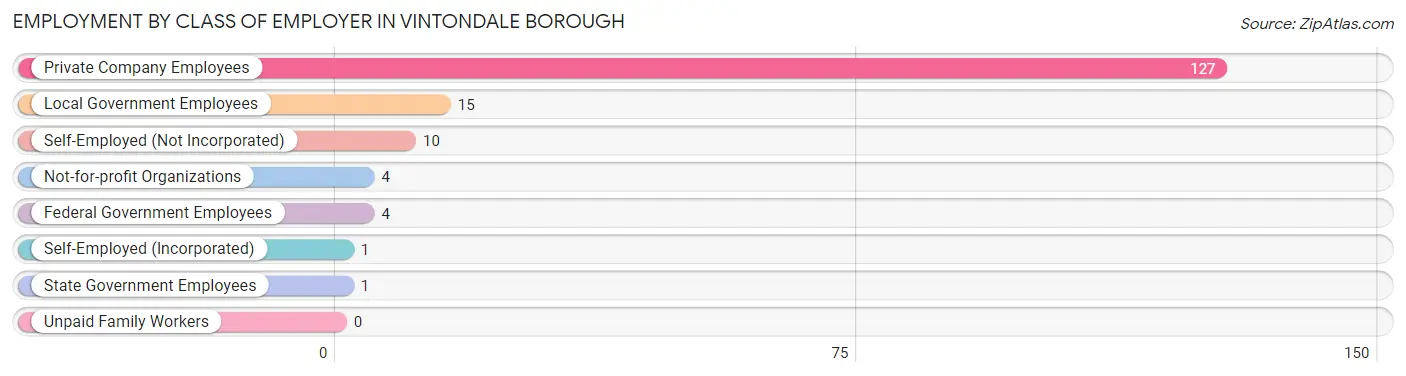
| Employer Class | # Employees | % Employees |
| Private Company Employees | 127 | 78.4% |
| Self-Employed (Incorporated) | 1 | 0.6% |
| Self-Employed (Not Incorporated) | 10 | 6.2% |
| Not-for-profit Organizations | 4 | 2.5% |
| Local Government Employees | 15 | 9.3% |
| State Government Employees | 1 | 0.6% |
| Federal Government Employees | 4 | 2.5% |
| Unpaid Family Workers | 0 | 0.0% |
| Total | 162 | 100.0% |
Employment Status by Age in Vintondale borough
According to the labor force statistics for Vintondale borough, out of the total population over 16 years of age (363), 51.8% or 188 individuals are in the labor force, with 13.3% or 25 of them unemployed. The age group with the highest labor force participation rate is 20 to 24 years, with 100.0% or 23 individuals in the labor force. Within the labor force, the 45 to 54 years age range has the highest percentage of unemployed individuals, with 35.0% or 14 of them being unemployed.
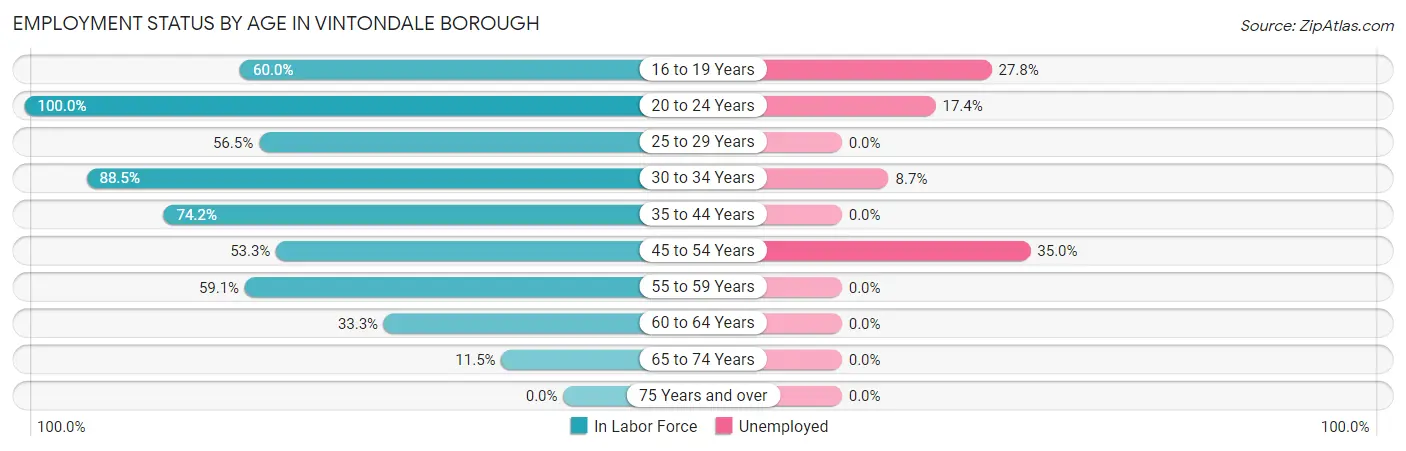
| Age Bracket | In Labor Force | Unemployed |
| 16 to 19 Years | 18 (60.0%) | 5 (27.8%) |
| 20 to 24 Years | 23 (100.0%) | 4 (17.4%) |
| 25 to 29 Years | 13 (56.5%) | 0 (0.0%) |
| 30 to 34 Years | 23 (88.5%) | 2 (8.7%) |
| 35 to 44 Years | 46 (74.2%) | 0 (0.0%) |
| 45 to 54 Years | 40 (53.3%) | 14 (35.0%) |
| 55 to 59 Years | 13 (59.1%) | 0 (0.0%) |
| 60 to 64 Years | 6 (33.3%) | 0 (0.0%) |
| 65 to 74 Years | 6 (11.5%) | 0 (0.0%) |
| 75 Years and over | 0 (0.0%) | 0 (0.0%) |
| Total | 188 (51.8%) | 25 (13.3%) |
Employment Status by Educational Attainment in Vintondale borough
According to labor force statistics for Vintondale borough, 62.4% of individuals (141) out of the total population between 25 and 64 years of age (226) are in the labor force, with 11.3% or 16 of them being unemployed. The group with the highest labor force participation rate are those with the educational attainment of college / associate degree, with 76.4% or 42 individuals in the labor force. Within the labor force, individuals with high school diploma education have the highest percentage of unemployment, with 19.8% or 16 of them being unemployed.
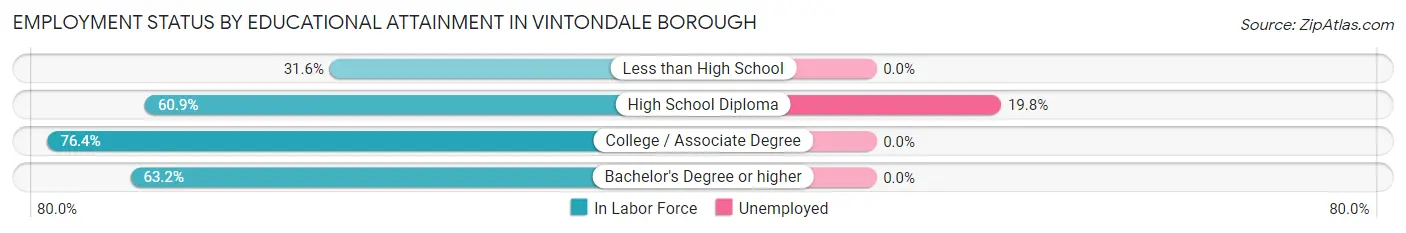
| Educational Attainment | In Labor Force | Unemployed |
| Less than High School | 6 (31.6%) | 0 (0.0%) |
| High School Diploma | 81 (60.9%) | 26 (19.8%) |
| College / Associate Degree | 42 (76.4%) | 0 (0.0%) |
| Bachelor's Degree or higher | 12 (63.2%) | 0 (0.0%) |
| Total | 141 (62.4%) | 26 (11.3%) |
Employment Occupations by Sex in Vintondale borough
Management, Business, Science and Arts Occupations
The most common Management, Business, Science and Arts occupations in Vintondale borough are Health Diagnosing & Treating (12 | 7.4%), Business & Financial (10 | 6.1%), Management (9 | 5.5%), Computers, Engineering & Science (5 | 3.1%), and Architecture & Engineering (5 | 3.1%).
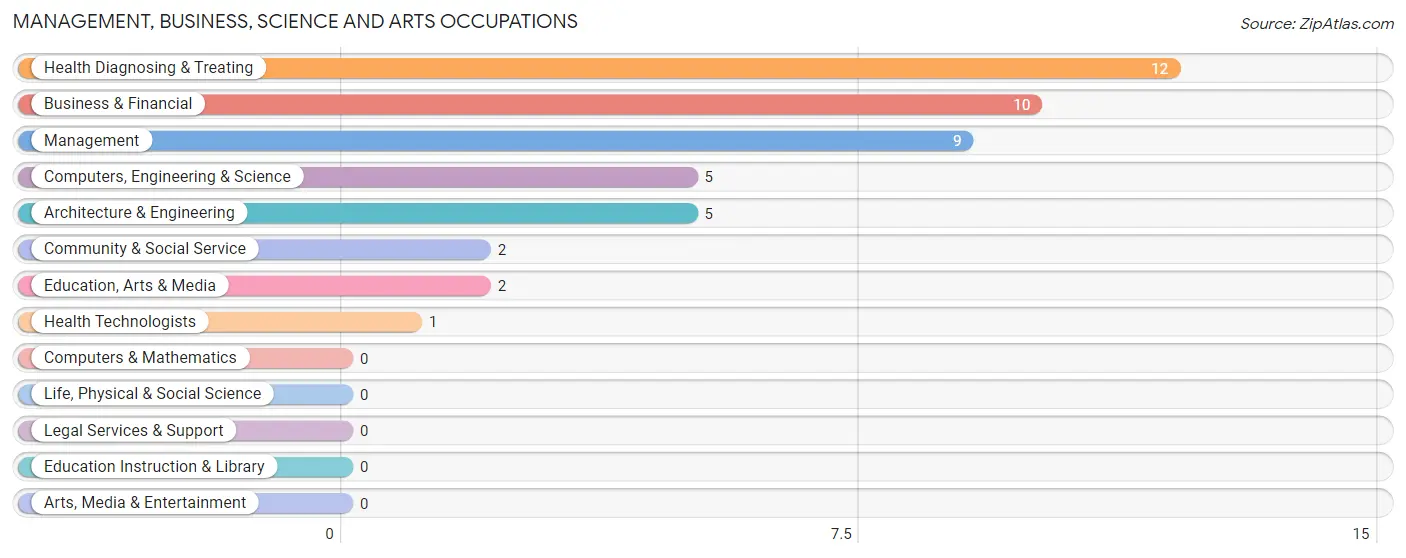
Management, Business, Science and Arts Occupations by Sex
Within the Management, Business, Science and Arts occupations in Vintondale borough, the most male-oriented occupations are Computers, Engineering & Science (100.0%), Architecture & Engineering (100.0%), and Business & Financial (70.0%), while the most female-oriented occupations are Community & Social Service (100.0%), Education, Arts & Media (100.0%), and Health Diagnosing & Treating (100.0%).
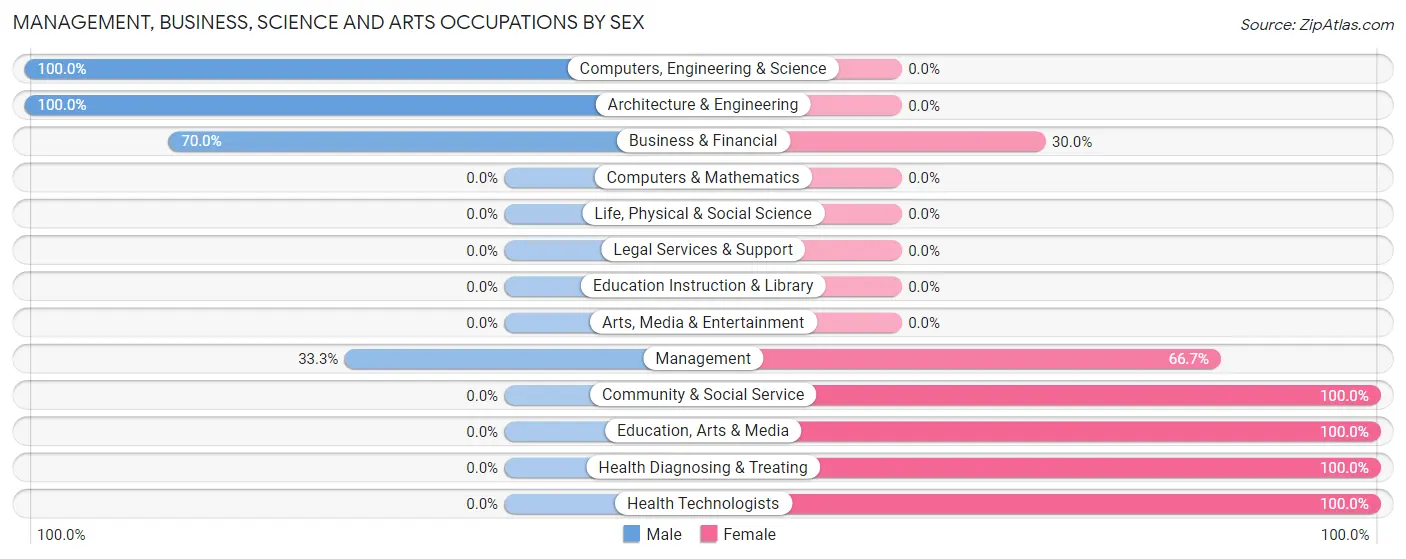
| Occupation | Male | Female |
| Management | 3 (33.3%) | 6 (66.7%) |
| Business & Financial | 7 (70.0%) | 3 (30.0%) |
| Computers, Engineering & Science | 5 (100.0%) | 0 (0.0%) |
| Computers & Mathematics | 0 (0.0%) | 0 (0.0%) |
| Architecture & Engineering | 5 (100.0%) | 0 (0.0%) |
| Life, Physical & Social Science | 0 (0.0%) | 0 (0.0%) |
| Community & Social Service | 0 (0.0%) | 2 (100.0%) |
| Education, Arts & Media | 0 (0.0%) | 2 (100.0%) |
| Legal Services & Support | 0 (0.0%) | 0 (0.0%) |
| Education Instruction & Library | 0 (0.0%) | 0 (0.0%) |
| Arts, Media & Entertainment | 0 (0.0%) | 0 (0.0%) |
| Health Diagnosing & Treating | 0 (0.0%) | 12 (100.0%) |
| Health Technologists | 0 (0.0%) | 1 (100.0%) |
| Total (Category) | 15 (39.5%) | 23 (60.5%) |
| Total (Overall) | 87 (53.4%) | 76 (46.6%) |
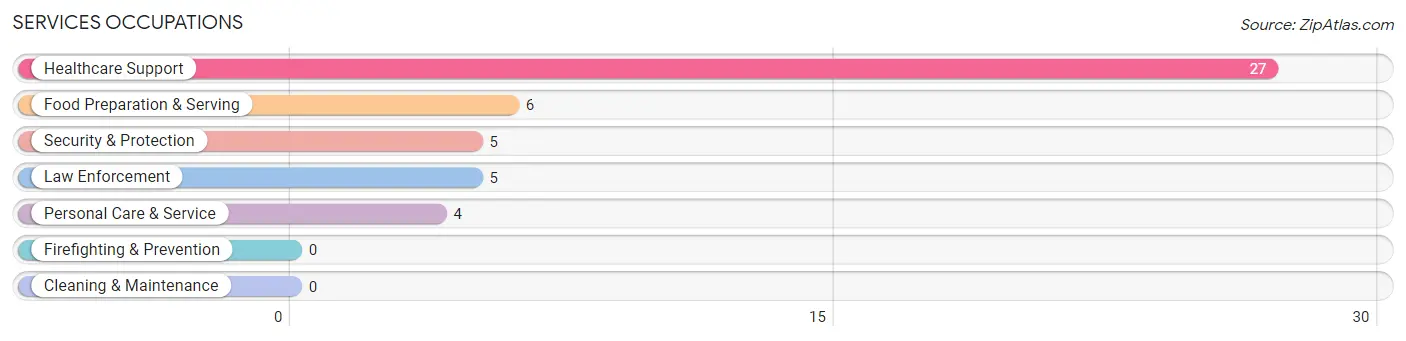
Services Occupations
The most common Services occupations in Vintondale borough are Healthcare Support (27 | 16.6%), Food Preparation & Serving (6 | 3.7%), Security & Protection (5 | 3.1%), Law Enforcement (5 | 3.1%), and Personal Care & Service (4 | 2.5%).
Services Occupations by Sex
Within the Services occupations in Vintondale borough, the most male-oriented occupations are Healthcare Support (48.1%), and Food Preparation & Serving (33.3%), while the most female-oriented occupations are Security & Protection (100.0%), Law Enforcement (100.0%), and Personal Care & Service (100.0%).
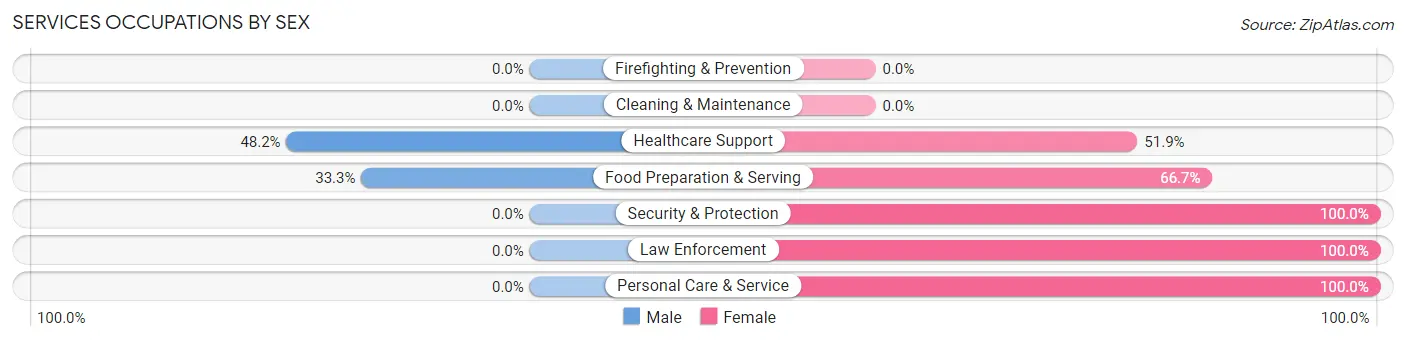
| Occupation | Male | Female |
| Healthcare Support | 13 (48.1%) | 14 (51.8%) |
| Security & Protection | 0 (0.0%) | 5 (100.0%) |
| Firefighting & Prevention | 0 (0.0%) | 0 (0.0%) |
| Law Enforcement | 0 (0.0%) | 5 (100.0%) |
| Food Preparation & Serving | 2 (33.3%) | 4 (66.7%) |
| Cleaning & Maintenance | 0 (0.0%) | 0 (0.0%) |
| Personal Care & Service | 0 (0.0%) | 4 (100.0%) |
| Total (Category) | 15 (35.7%) | 27 (64.3%) |
| Total (Overall) | 87 (53.4%) | 76 (46.6%) |
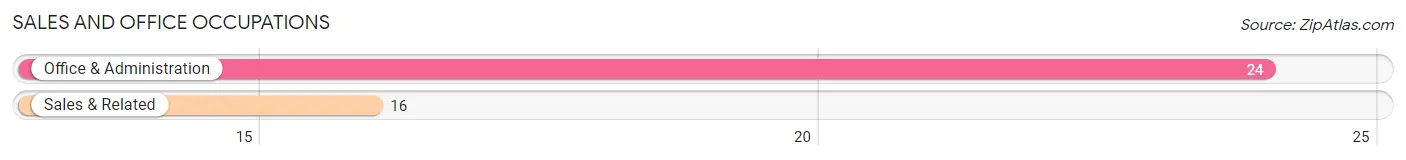
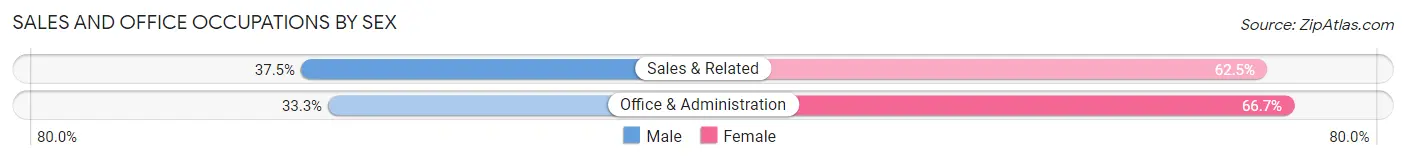
Sales and Office Occupations
The most common Sales and Office occupations in Vintondale borough are Office & Administration (24 | 14.7%), and Sales & Related (16 | 9.8%).
Sales and Office Occupations by Sex
| Occupation | Male | Female |
| Sales & Related | 6 (37.5%) | 10 (62.5%) |
| Office & Administration | 8 (33.3%) | 16 (66.7%) |
| Total (Category) | 14 (35.0%) | 26 (65.0%) |
| Total (Overall) | 87 (53.4%) | 76 (46.6%) |
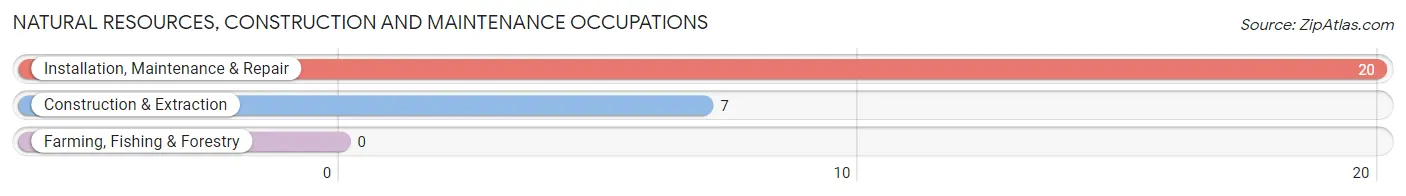
Natural Resources, Construction and Maintenance Occupations
The most common Natural Resources, Construction and Maintenance occupations in Vintondale borough are Installation, Maintenance & Repair (20 | 12.3%), and Construction & Extraction (7 | 4.3%).
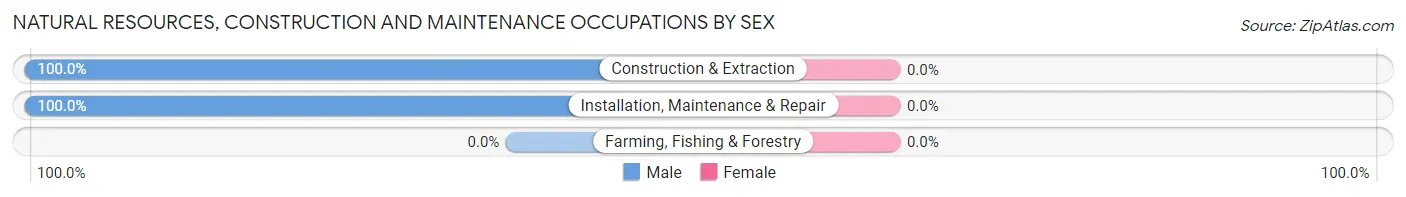
Natural Resources, Construction and Maintenance Occupations by Sex
| Occupation | Male | Female |
| Farming, Fishing & Forestry | 0 (0.0%) | 0 (0.0%) |
| Construction & Extraction | 7 (100.0%) | 0 (0.0%) |
| Installation, Maintenance & Repair | 20 (100.0%) | 0 (0.0%) |
| Total (Category) | 27 (100.0%) | 0 (0.0%) |
| Total (Overall) | 87 (53.4%) | 76 (46.6%) |
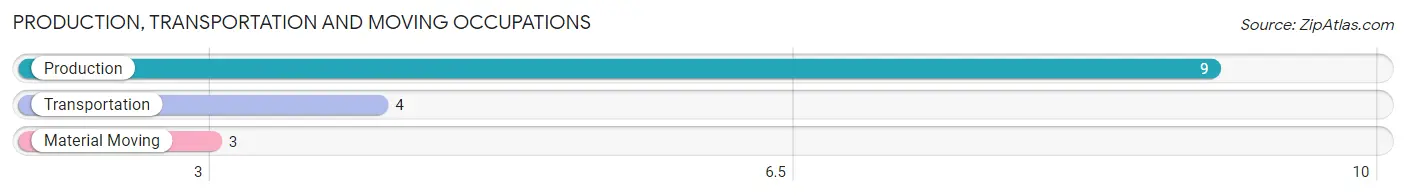
Production, Transportation and Moving Occupations
The most common Production, Transportation and Moving occupations in Vintondale borough are Production (9 | 5.5%), Transportation (4 | 2.5%), and Material Moving (3 | 1.8%).
Production, Transportation and Moving Occupations by Sex
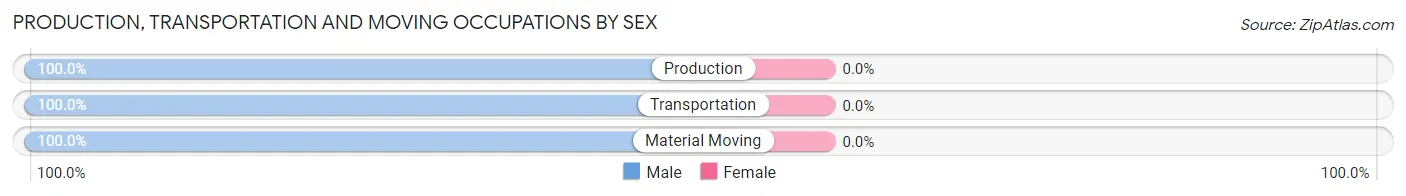
| Occupation | Male | Female |
| Production | 9 (100.0%) | 0 (0.0%) |
| Transportation | 4 (100.0%) | 0 (0.0%) |
| Material Moving | 3 (100.0%) | 0 (0.0%) |
| Total (Category) | 16 (100.0%) | 0 (0.0%) |
| Total (Overall) | 87 (53.4%) | 76 (46.6%) |
Employment Industries by Sex in Vintondale borough
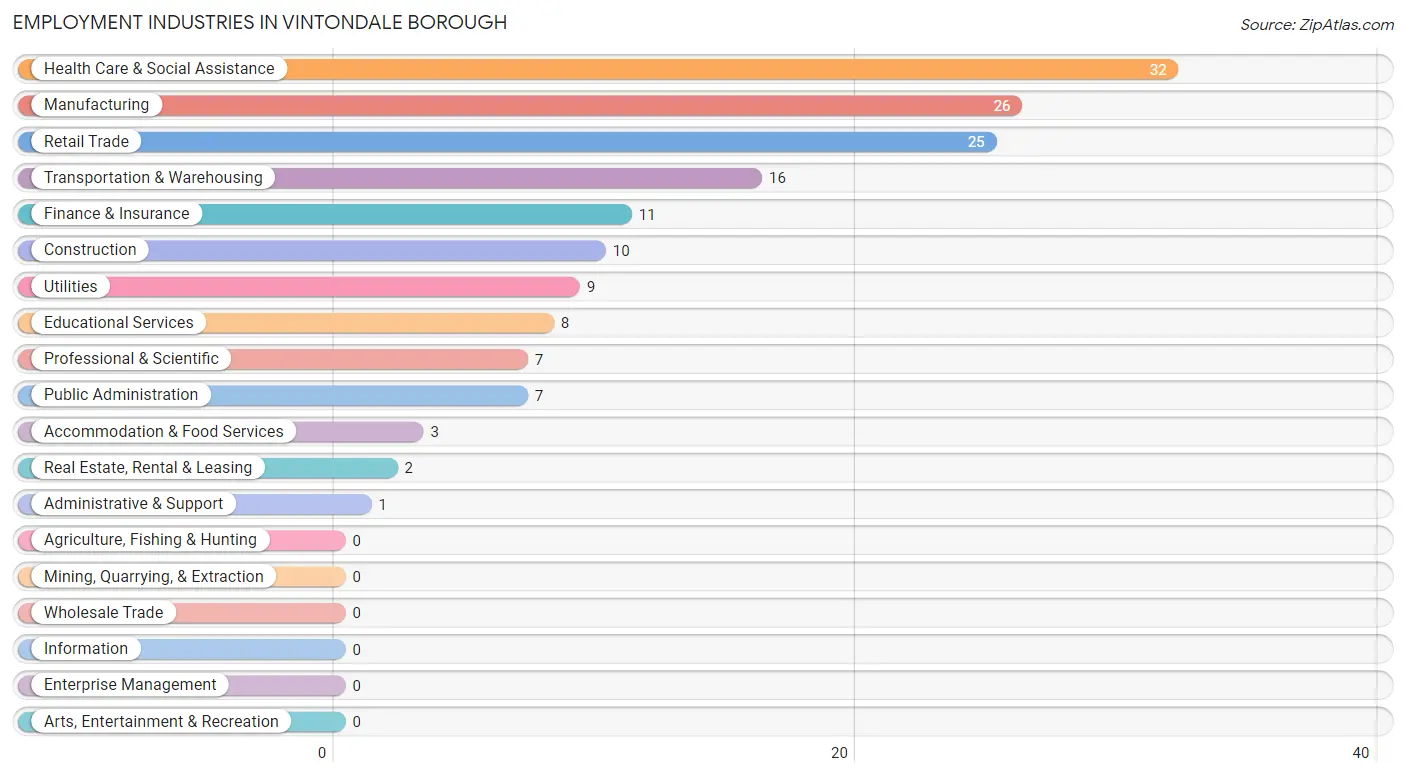
Employment Industries in Vintondale borough
The major employment industries in Vintondale borough include Health Care & Social Assistance (32 | 19.6%), Manufacturing (26 | 16.0%), Retail Trade (25 | 15.3%), Transportation & Warehousing (16 | 9.8%), and Finance & Insurance (11 | 6.8%).
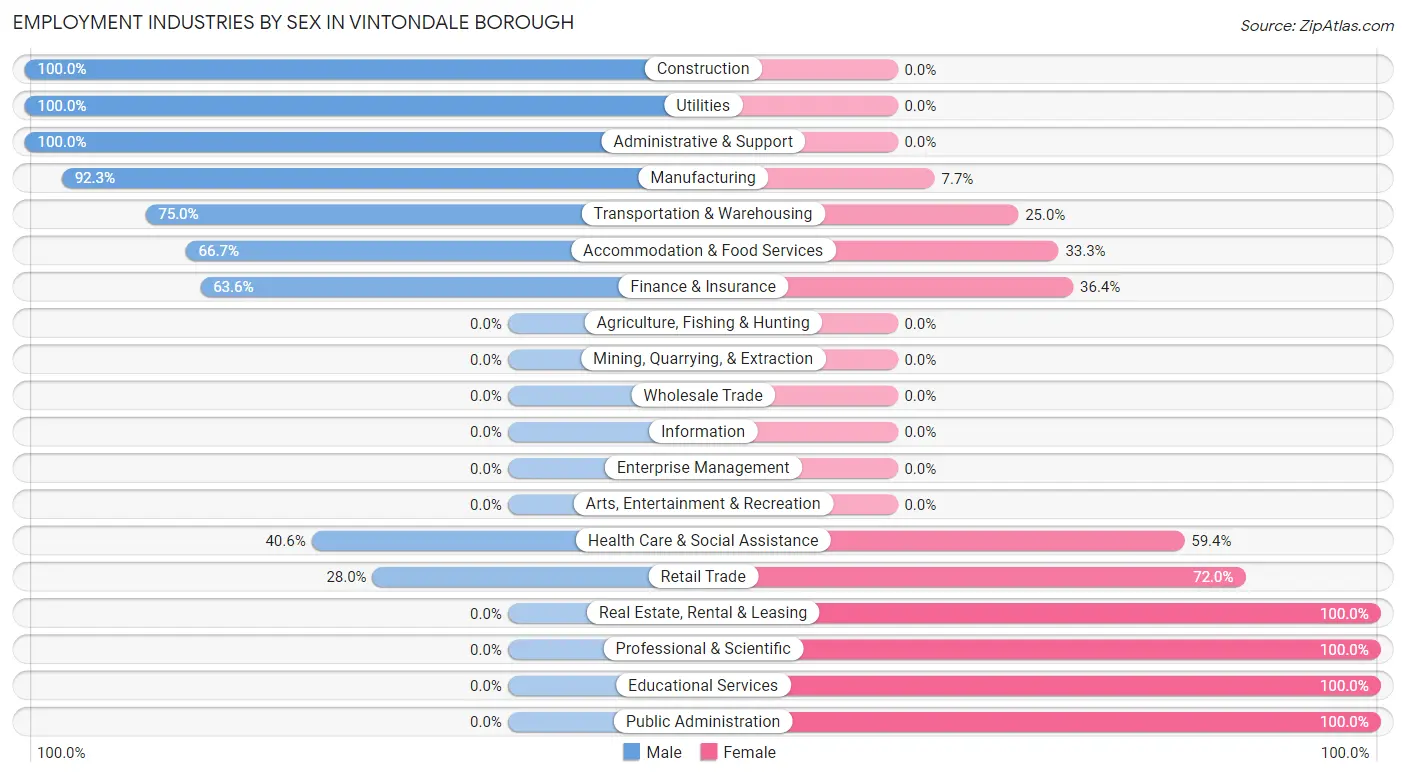
Employment Industries by Sex in Vintondale borough
The Vintondale borough industries that see more men than women are Construction (100.0%), Utilities (100.0%), and Administrative & Support (100.0%), whereas the industries that tend to have a higher number of women are Real Estate, Rental & Leasing (100.0%), Professional & Scientific (100.0%), and Educational Services (100.0%).
| Industry | Male | Female |
| Agriculture, Fishing & Hunting | 0 (0.0%) | 0 (0.0%) |
| Mining, Quarrying, & Extraction | 0 (0.0%) | 0 (0.0%) |
| Construction | 10 (100.0%) | 0 (0.0%) |
| Manufacturing | 24 (92.3%) | 2 (7.7%) |
| Wholesale Trade | 0 (0.0%) | 0 (0.0%) |
| Retail Trade | 7 (28.0%) | 18 (72.0%) |
| Transportation & Warehousing | 12 (75.0%) | 4 (25.0%) |
| Utilities | 9 (100.0%) | 0 (0.0%) |
| Information | 0 (0.0%) | 0 (0.0%) |
| Finance & Insurance | 7 (63.6%) | 4 (36.4%) |
| Real Estate, Rental & Leasing | 0 (0.0%) | 2 (100.0%) |
| Professional & Scientific | 0 (0.0%) | 7 (100.0%) |
| Enterprise Management | 0 (0.0%) | 0 (0.0%) |
| Administrative & Support | 1 (100.0%) | 0 (0.0%) |
| Educational Services | 0 (0.0%) | 8 (100.0%) |
| Health Care & Social Assistance | 13 (40.6%) | 19 (59.4%) |
| Arts, Entertainment & Recreation | 0 (0.0%) | 0 (0.0%) |
| Accommodation & Food Services | 2 (66.7%) | 1 (33.3%) |
| Public Administration | 0 (0.0%) | 7 (100.0%) |
| Total | 87 (53.4%) | 76 (46.6%) |
Education in Vintondale borough
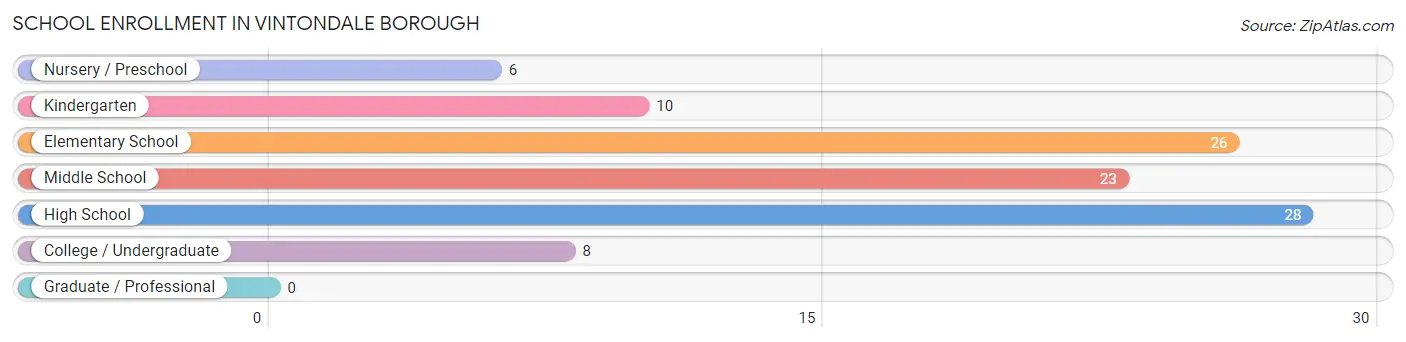
School Enrollment in Vintondale borough
The most common levels of schooling among the 101 students in Vintondale borough are high school (28 | 27.7%), elementary school (26 | 25.7%), and middle school (23 | 22.8%).
| School Level | # Students | % Students |
| Nursery / Preschool | 6 | 5.9% |
| Kindergarten | 10 | 9.9% |
| Elementary School | 26 | 25.7% |
| Middle School | 23 | 22.8% |
| High School | 28 | 27.7% |
| College / Undergraduate | 8 | 7.9% |
| Graduate / Professional | 0 | 0.0% |
| Total | 101 | 100.0% |
School Enrollment by Age by Funding Source in Vintondale borough
Out of a total of 101 students who are enrolled in schools in Vintondale borough, 9 (8.9%) attend a private institution, while the remaining 92 (91.1%) are enrolled in public schools. The age group of 5 to 9 year old has the highest likelihood of being enrolled in private schools, with 9 (23.7% in the age bracket) enrolled. Conversely, the age group of 3 to 4 year olds has the lowest likelihood of being enrolled in a private school, with 2 (100.0% in the age bracket) attending a public institution.
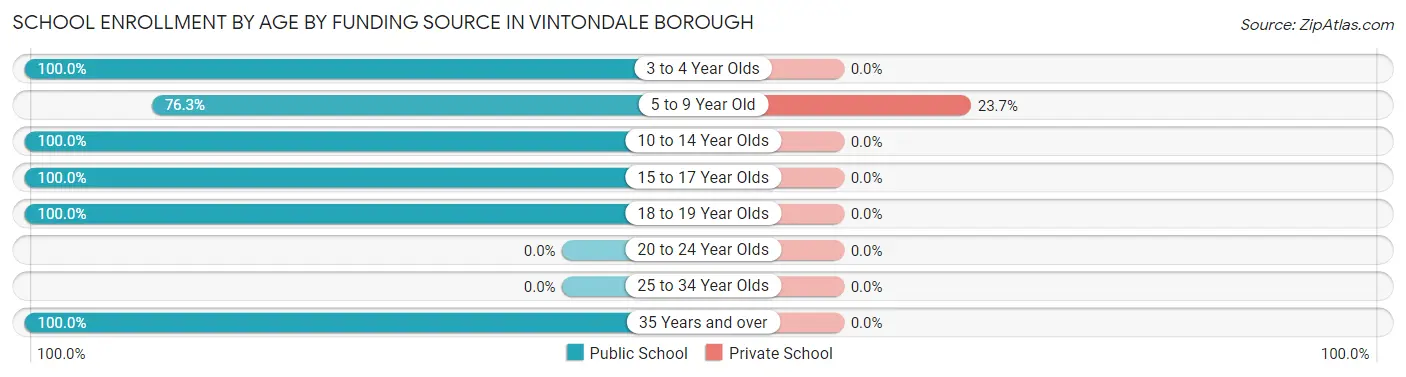
| Age Bracket | Public School | Private School |
| 3 to 4 Year Olds | 2 (100.0%) | 0 (0.0%) |
| 5 to 9 Year Old | 29 (76.3%) | 9 (23.7%) |
| 10 to 14 Year Olds | 31 (100.0%) | 0 (0.0%) |
| 15 to 17 Year Olds | 18 (100.0%) | 0 (0.0%) |
| 18 to 19 Year Olds | 6 (100.0%) | 0 (0.0%) |
| 20 to 24 Year Olds | 0 (0.0%) | 0 (0.0%) |
| 25 to 34 Year Olds | 0 (0.0%) | 0 (0.0%) |
| 35 Years and over | 6 (100.0%) | 0 (0.0%) |
| Total | 92 (91.1%) | 9 (8.9%) |
Educational Attainment by Field of Study in Vintondale borough
Business (8 | 29.6%), science & technology (6 | 22.2%), education (5 | 18.5%), arts & humanities (4 | 14.8%), and bio, nature & agricultural (3 | 11.1%) are the most common fields of study among 27 individuals in Vintondale borough who have obtained a bachelor's degree or higher.
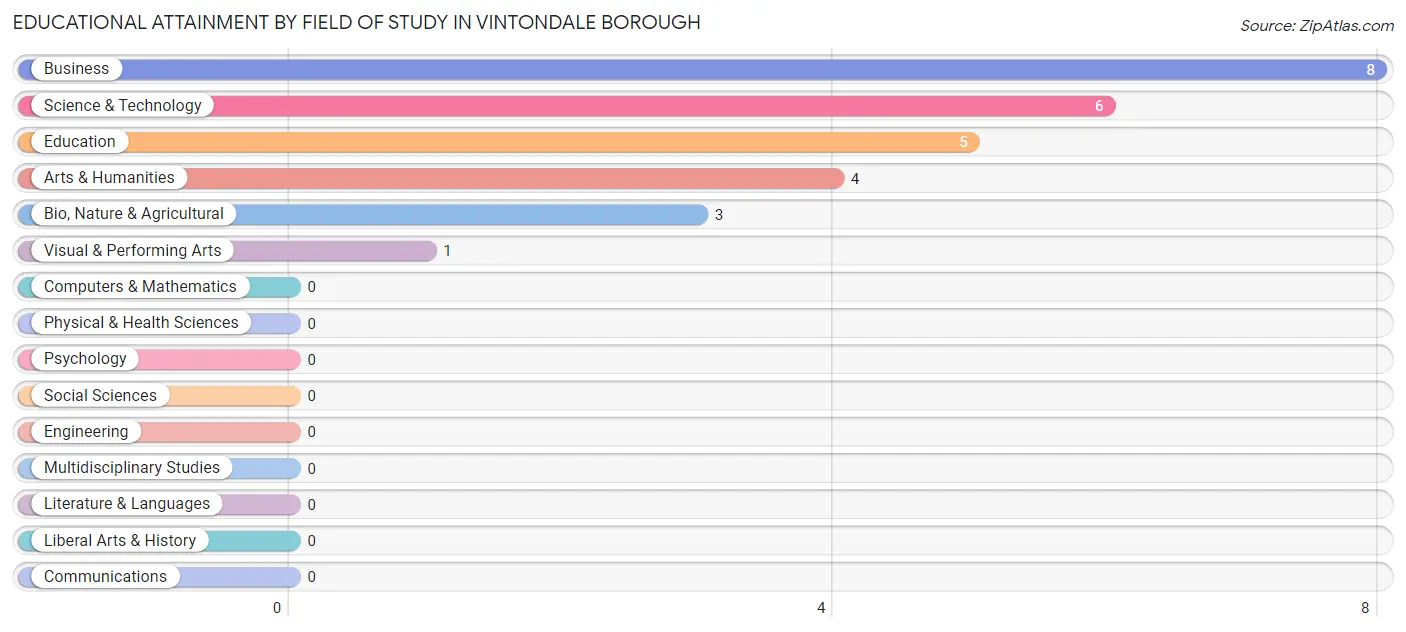
| Field of Study | # Graduates | % Graduates |
| Computers & Mathematics | 0 | 0.0% |
| Bio, Nature & Agricultural | 3 | 11.1% |
| Physical & Health Sciences | 0 | 0.0% |
| Psychology | 0 | 0.0% |
| Social Sciences | 0 | 0.0% |
| Engineering | 0 | 0.0% |
| Multidisciplinary Studies | 0 | 0.0% |
| Science & Technology | 6 | 22.2% |
| Business | 8 | 29.6% |
| Education | 5 | 18.5% |
| Literature & Languages | 0 | 0.0% |
| Liberal Arts & History | 0 | 0.0% |
| Visual & Performing Arts | 1 | 3.7% |
| Communications | 0 | 0.0% |
| Arts & Humanities | 4 | 14.8% |
| Total | 27 | 100.0% |
Transportation & Commute in Vintondale borough
Vehicle Availability by Sex in Vintondale borough
The most prevalent vehicle ownership categories in Vintondale borough are males with 5 or more vehicles (24, accounting for 27.9%) and females with 5 or more vehicles (19, making up 31.6%).
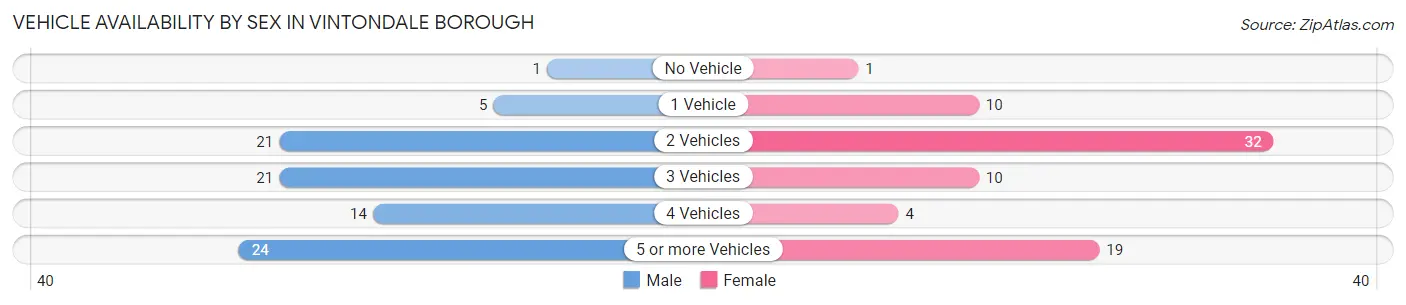
| Vehicles Available | Male | Female |
| No Vehicle | 1 (1.2%) | 1 (1.3%) |
| 1 Vehicle | 5 (5.8%) | 10 (13.2%) |
| 2 Vehicles | 21 (24.4%) | 32 (42.1%) |
| 3 Vehicles | 21 (24.4%) | 10 (13.2%) |
| 4 Vehicles | 14 (16.3%) | 4 (5.3%) |
| 5 or more Vehicles | 24 (27.9%) | 19 (25.0%) |
| Total | 86 (100.0%) | 76 (100.0%) |
Commute Time in Vintondale borough
The most frequently occuring commute durations in Vintondale borough are 15 to 19 minutes (26 commuters, 17.1%), 30 to 34 minutes (26 commuters, 17.1%), and 45 to 59 minutes (24 commuters, 15.8%).
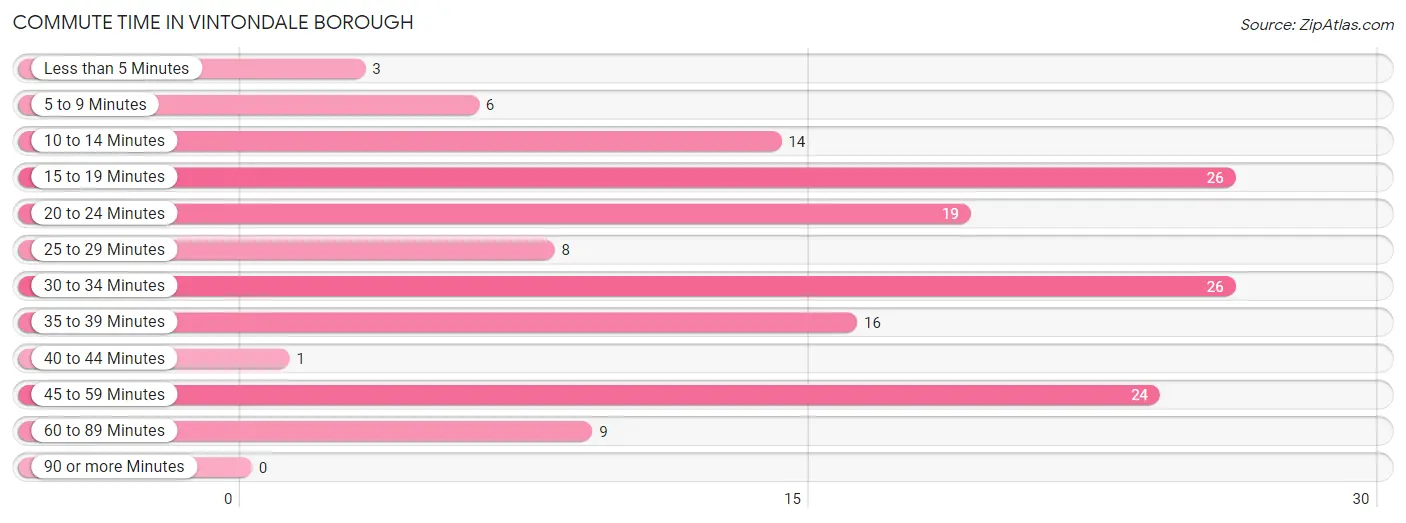
| Commute Time | # Commuters | % Commuters |
| Less than 5 Minutes | 3 | 2.0% |
| 5 to 9 Minutes | 6 | 4.0% |
| 10 to 14 Minutes | 14 | 9.2% |
| 15 to 19 Minutes | 26 | 17.1% |
| 20 to 24 Minutes | 19 | 12.5% |
| 25 to 29 Minutes | 8 | 5.3% |
| 30 to 34 Minutes | 26 | 17.1% |
| 35 to 39 Minutes | 16 | 10.5% |
| 40 to 44 Minutes | 1 | 0.7% |
| 45 to 59 Minutes | 24 | 15.8% |
| 60 to 89 Minutes | 9 | 5.9% |
| 90 or more Minutes | 0 | 0.0% |
Commute Time by Sex in Vintondale borough
The most common commute times in Vintondale borough are 30 to 34 minutes (20 commuters, 23.8%) for males and 15 to 19 minutes (17 commuters, 25.0%) for females.
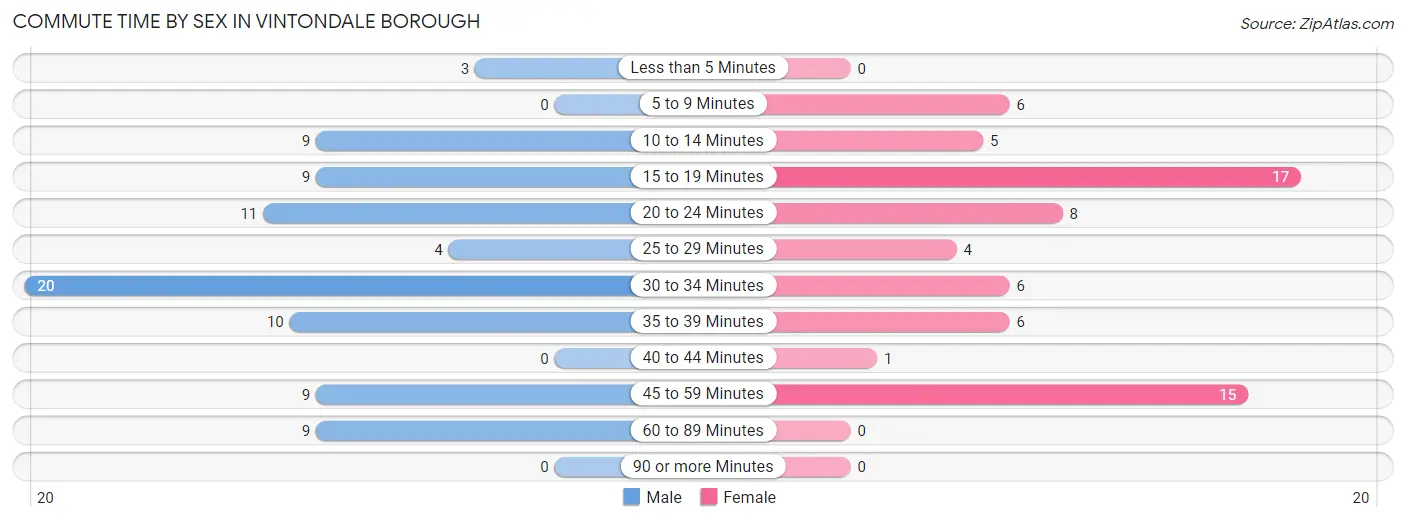
| Commute Time | Male | Female |
| Less than 5 Minutes | 3 (3.6%) | 0 (0.0%) |
| 5 to 9 Minutes | 0 (0.0%) | 6 (8.8%) |
| 10 to 14 Minutes | 9 (10.7%) | 5 (7.3%) |
| 15 to 19 Minutes | 9 (10.7%) | 17 (25.0%) |
| 20 to 24 Minutes | 11 (13.1%) | 8 (11.8%) |
| 25 to 29 Minutes | 4 (4.8%) | 4 (5.9%) |
| 30 to 34 Minutes | 20 (23.8%) | 6 (8.8%) |
| 35 to 39 Minutes | 10 (11.9%) | 6 (8.8%) |
| 40 to 44 Minutes | 0 (0.0%) | 1 (1.5%) |
| 45 to 59 Minutes | 9 (10.7%) | 15 (22.1%) |
| 60 to 89 Minutes | 9 (10.7%) | 0 (0.0%) |
| 90 or more Minutes | 0 (0.0%) | 0 (0.0%) |
Time of Departure to Work by Sex in Vintondale borough
The most frequent times of departure to work in Vintondale borough are 12:00 PM to 3:59 PM (18, 21.4%) for males and 6:30 AM to 6:59 AM (13, 19.1%) for females.
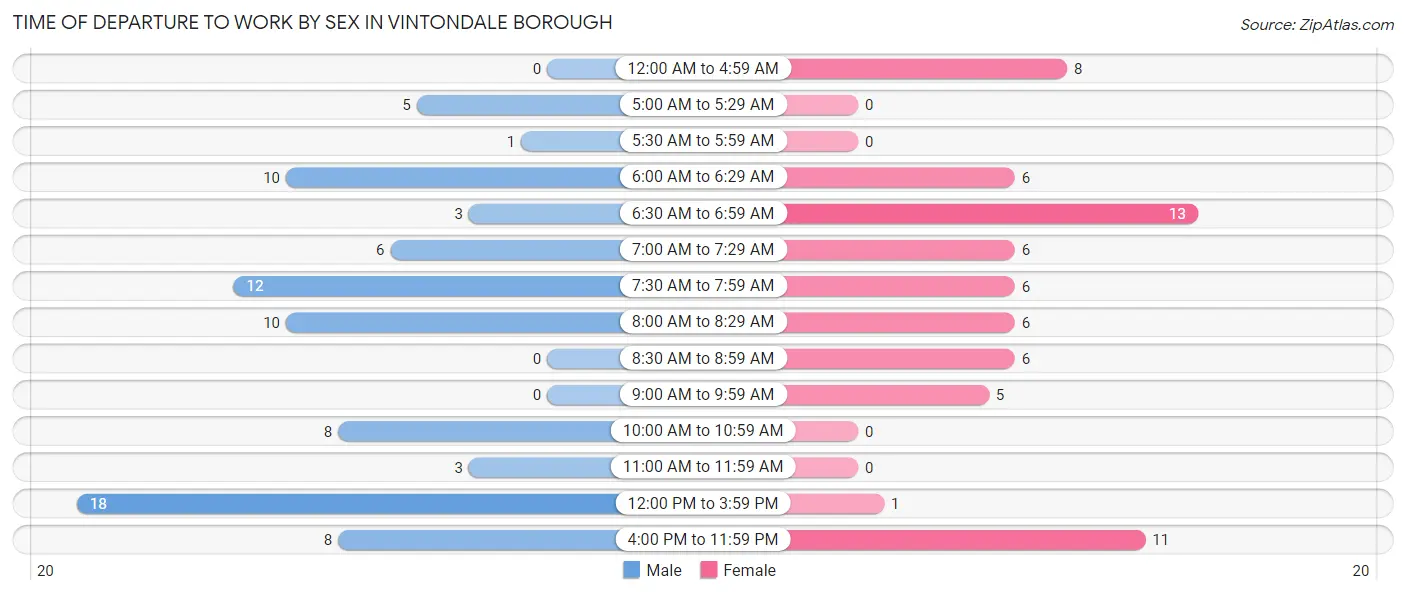
| Time of Departure | Male | Female |
| 12:00 AM to 4:59 AM | 0 (0.0%) | 8 (11.8%) |
| 5:00 AM to 5:29 AM | 5 (5.9%) | 0 (0.0%) |
| 5:30 AM to 5:59 AM | 1 (1.2%) | 0 (0.0%) |
| 6:00 AM to 6:29 AM | 10 (11.9%) | 6 (8.8%) |
| 6:30 AM to 6:59 AM | 3 (3.6%) | 13 (19.1%) |
| 7:00 AM to 7:29 AM | 6 (7.1%) | 6 (8.8%) |
| 7:30 AM to 7:59 AM | 12 (14.3%) | 6 (8.8%) |
| 8:00 AM to 8:29 AM | 10 (11.9%) | 6 (8.8%) |
| 8:30 AM to 8:59 AM | 0 (0.0%) | 6 (8.8%) |
| 9:00 AM to 9:59 AM | 0 (0.0%) | 5 (7.3%) |
| 10:00 AM to 10:59 AM | 8 (9.5%) | 0 (0.0%) |
| 11:00 AM to 11:59 AM | 3 (3.6%) | 0 (0.0%) |
| 12:00 PM to 3:59 PM | 18 (21.4%) | 1 (1.5%) |
| 4:00 PM to 11:59 PM | 8 (9.5%) | 11 (16.2%) |
| Total | 84 (100.0%) | 68 (100.0%) |
Housing Occupancy in Vintondale borough
Occupancy by Ownership in Vintondale borough
Of the total 189 dwellings in Vintondale borough, owner-occupied units account for 134 (70.9%), while renter-occupied units make up 55 (29.1%).
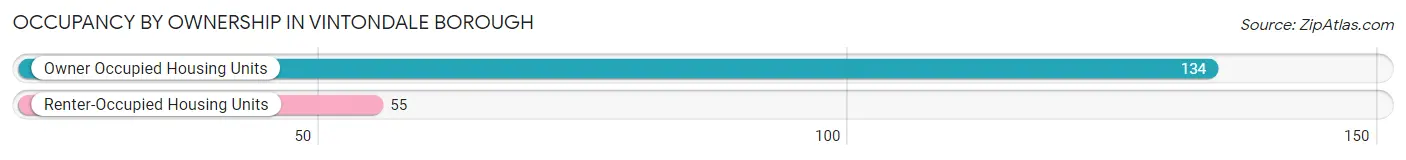
| Occupancy | # Housing Units | % Housing Units |
| Owner Occupied Housing Units | 134 | 70.9% |
| Renter-Occupied Housing Units | 55 | 29.1% |
| Total Occupied Housing Units | 189 | 100.0% |
Occupancy by Household Size in Vintondale borough
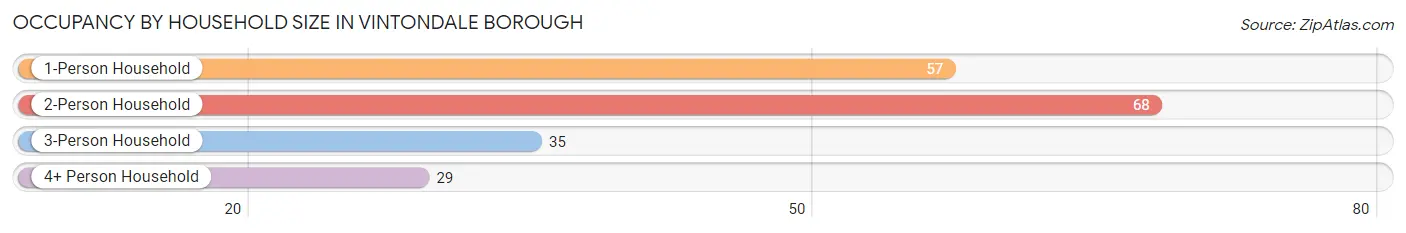
| Household Size | # Housing Units | % Housing Units |
| 1-Person Household | 57 | 30.2% |
| 2-Person Household | 68 | 36.0% |
| 3-Person Household | 35 | 18.5% |
| 4+ Person Household | 29 | 15.3% |
| Total Housing Units | 189 | 100.0% |
Occupancy by Ownership by Household Size in Vintondale borough
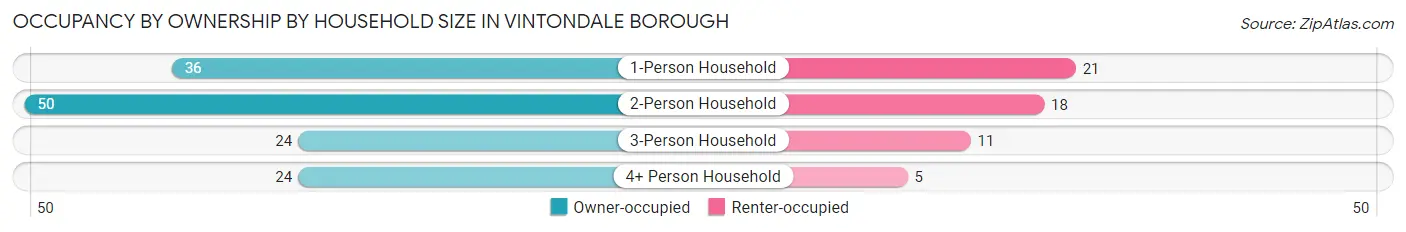
| Household Size | Owner-occupied | Renter-occupied |
| 1-Person Household | 36 (63.2%) | 21 (36.8%) |
| 2-Person Household | 50 (73.5%) | 18 (26.5%) |
| 3-Person Household | 24 (68.6%) | 11 (31.4%) |
| 4+ Person Household | 24 (82.8%) | 5 (17.2%) |
| Total Housing Units | 134 (70.9%) | 55 (29.1%) |
Occupancy by Educational Attainment in Vintondale borough
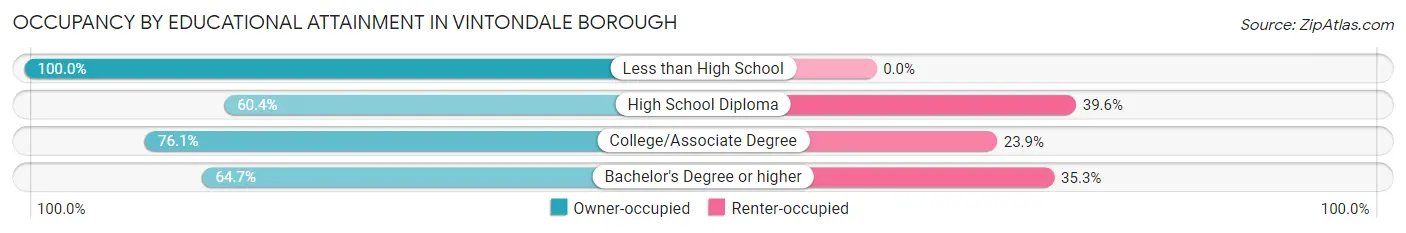
| Household Size | Owner-occupied | Renter-occupied |
| Less than High School | 30 (100.0%) | 0 (0.0%) |
| High School Diploma | 58 (60.4%) | 38 (39.6%) |
| College/Associate Degree | 35 (76.1%) | 11 (23.9%) |
| Bachelor's Degree or higher | 11 (64.7%) | 6 (35.3%) |
Occupancy by Age of Householder in Vintondale borough
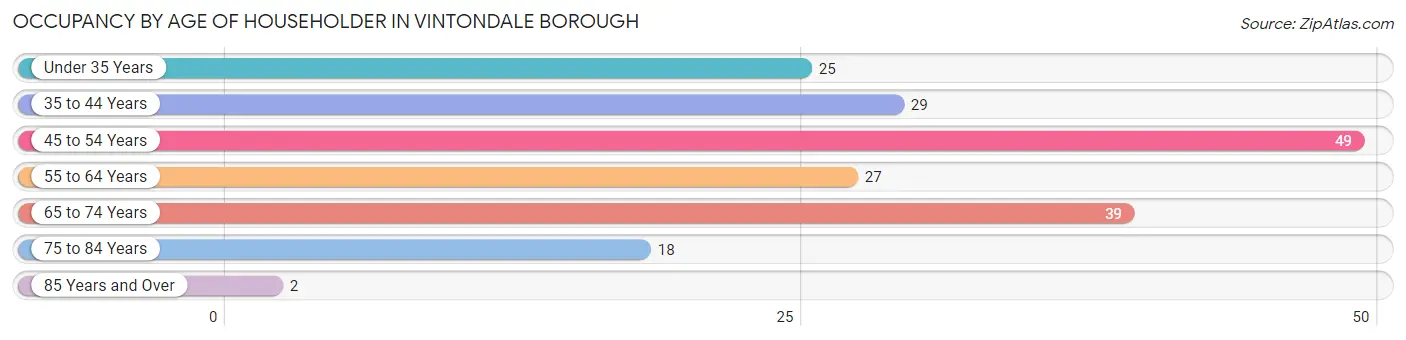
| Age Bracket | # Households | % Households |
| Under 35 Years | 25 | 13.2% |
| 35 to 44 Years | 29 | 15.3% |
| 45 to 54 Years | 49 | 25.9% |
| 55 to 64 Years | 27 | 14.3% |
| 65 to 74 Years | 39 | 20.6% |
| 75 to 84 Years | 18 | 9.5% |
| 85 Years and Over | 2 | 1.1% |
| Total | 189 | 100.0% |
Housing Finances in Vintondale borough
Median Income by Occupancy in Vintondale borough
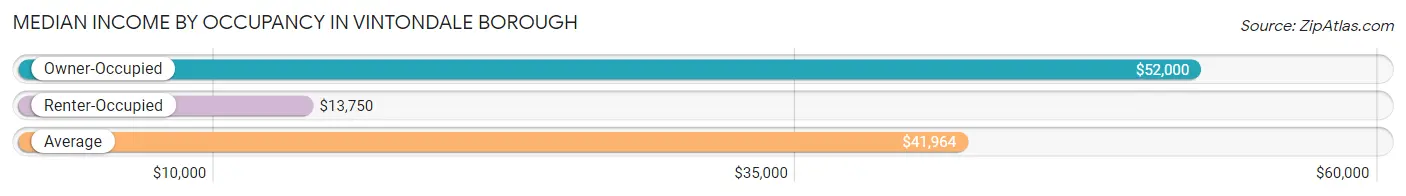
| Occupancy Type | # Households | Median Income |
| Owner-Occupied | 134 (70.9%) | $52,000 |
| Renter-Occupied | 55 (29.1%) | $13,750 |
| Average | 189 (100.0%) | $41,964 |
Occupancy by Householder Income Bracket in Vintondale borough
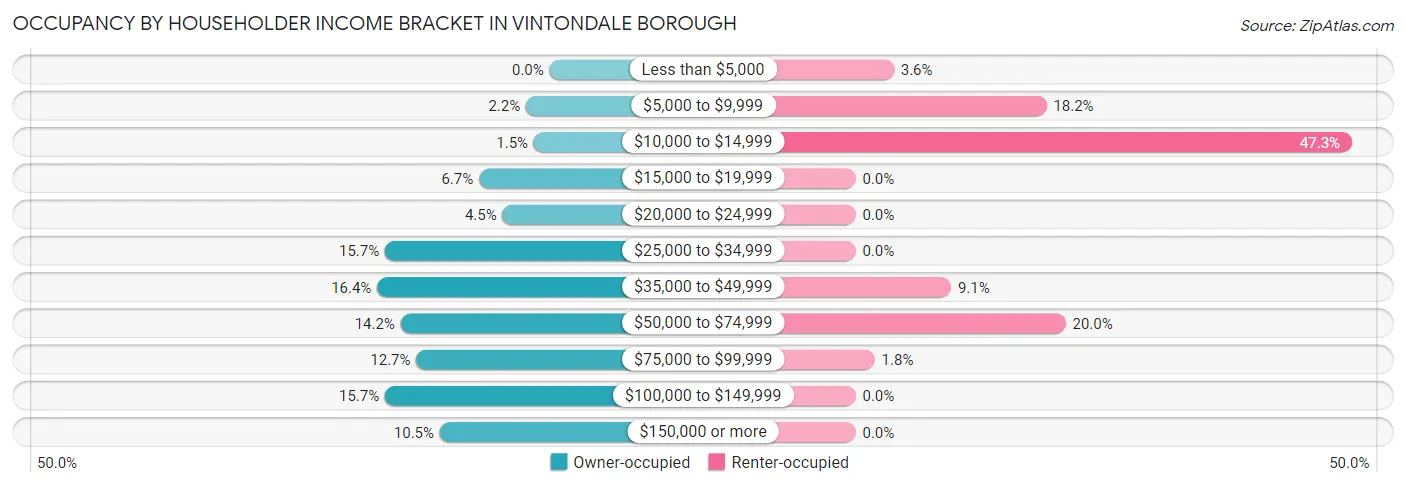
| Income Bracket | Owner-occupied | Renter-occupied |
| Less than $5,000 | 0 (0.0%) | 2 (3.6%) |
| $5,000 to $9,999 | 3 (2.2%) | 10 (18.2%) |
| $10,000 to $14,999 | 2 (1.5%) | 26 (47.3%) |
| $15,000 to $19,999 | 9 (6.7%) | 0 (0.0%) |
| $20,000 to $24,999 | 6 (4.5%) | 0 (0.0%) |
| $25,000 to $34,999 | 21 (15.7%) | 0 (0.0%) |
| $35,000 to $49,999 | 22 (16.4%) | 5 (9.1%) |
| $50,000 to $74,999 | 19 (14.2%) | 11 (20.0%) |
| $75,000 to $99,999 | 17 (12.7%) | 1 (1.8%) |
| $100,000 to $149,999 | 21 (15.7%) | 0 (0.0%) |
| $150,000 or more | 14 (10.4%) | 0 (0.0%) |
| Total | 134 (100.0%) | 55 (100.0%) |
Monthly Housing Cost Tiers in Vintondale borough
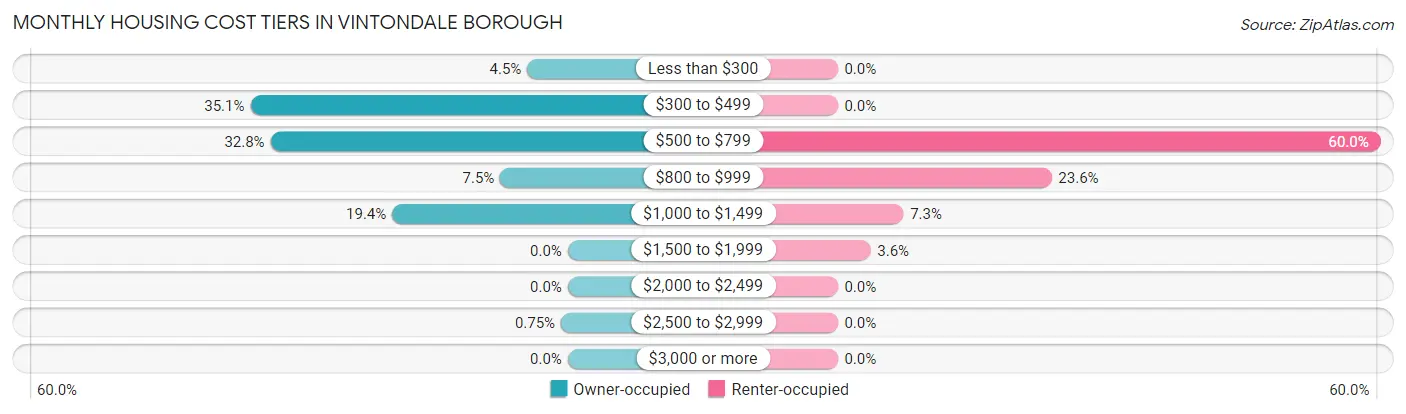
| Monthly Cost | Owner-occupied | Renter-occupied |
| Less than $300 | 6 (4.5%) | 0 (0.0%) |
| $300 to $499 | 47 (35.1%) | 0 (0.0%) |
| $500 to $799 | 44 (32.8%) | 33 (60.0%) |
| $800 to $999 | 10 (7.5%) | 13 (23.6%) |
| $1,000 to $1,499 | 26 (19.4%) | 4 (7.3%) |
| $1,500 to $1,999 | 0 (0.0%) | 2 (3.6%) |
| $2,000 to $2,499 | 0 (0.0%) | 0 (0.0%) |
| $2,500 to $2,999 | 1 (0.7%) | 0 (0.0%) |
| $3,000 or more | 0 (0.0%) | 0 (0.0%) |
| Total | 134 (100.0%) | 55 (100.0%) |
Physical Housing Characteristics in Vintondale borough
Housing Structures in Vintondale borough
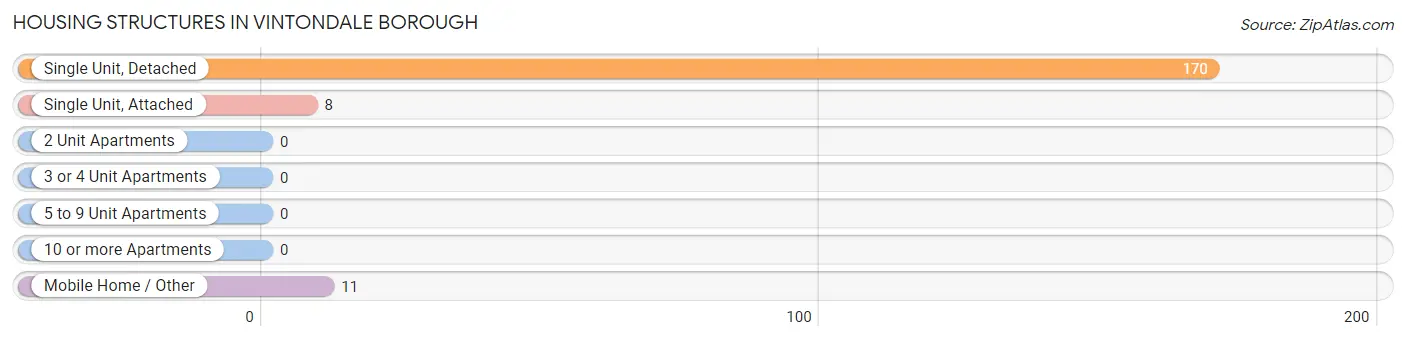
| Structure Type | # Housing Units | % Housing Units |
| Single Unit, Detached | 170 | 89.9% |
| Single Unit, Attached | 8 | 4.2% |
| 2 Unit Apartments | 0 | 0.0% |
| 3 or 4 Unit Apartments | 0 | 0.0% |
| 5 to 9 Unit Apartments | 0 | 0.0% |
| 10 or more Apartments | 0 | 0.0% |
| Mobile Home / Other | 11 | 5.8% |
| Total | 189 | 100.0% |
Housing Structures by Occupancy in Vintondale borough
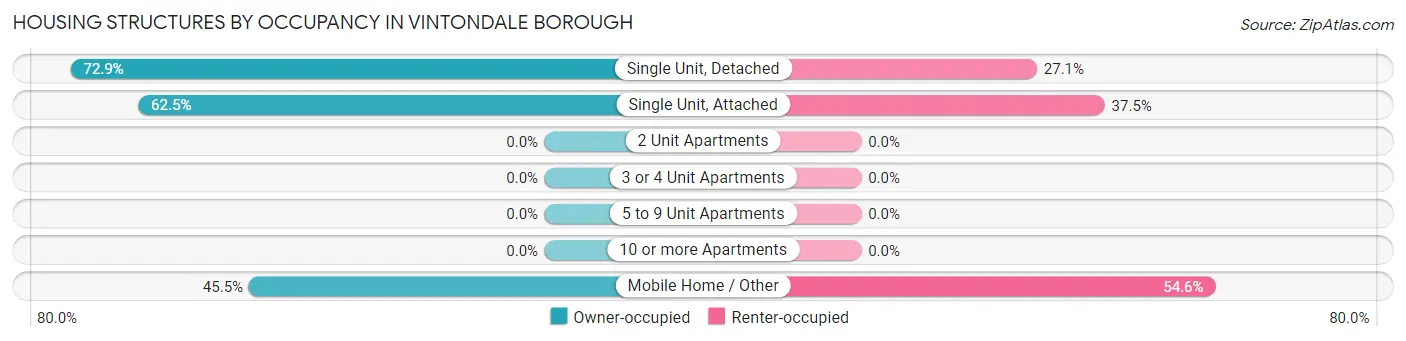
| Structure Type | Owner-occupied | Renter-occupied |
| Single Unit, Detached | 124 (72.9%) | 46 (27.1%) |
| Single Unit, Attached | 5 (62.5%) | 3 (37.5%) |
| 2 Unit Apartments | 0 (0.0%) | 0 (0.0%) |
| 3 or 4 Unit Apartments | 0 (0.0%) | 0 (0.0%) |
| 5 to 9 Unit Apartments | 0 (0.0%) | 0 (0.0%) |
| 10 or more Apartments | 0 (0.0%) | 0 (0.0%) |
| Mobile Home / Other | 5 (45.5%) | 6 (54.5%) |
| Total | 134 (70.9%) | 55 (29.1%) |
Housing Structures by Number of Rooms in Vintondale borough
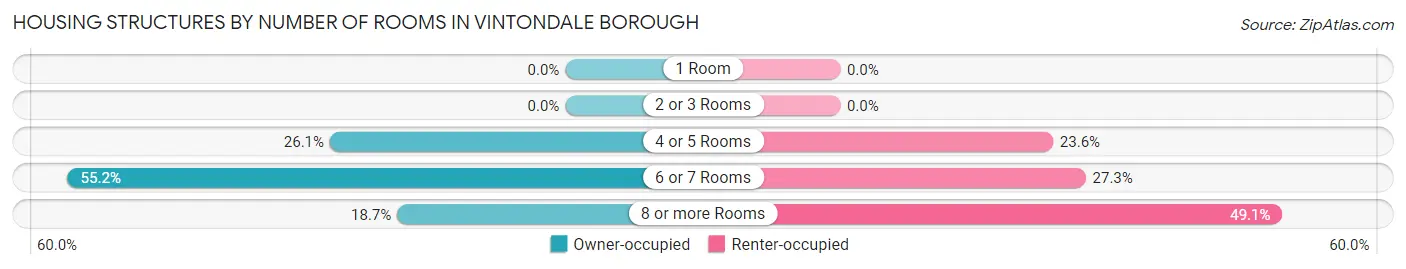
| Number of Rooms | Owner-occupied | Renter-occupied |
| 1 Room | 0 (0.0%) | 0 (0.0%) |
| 2 or 3 Rooms | 0 (0.0%) | 0 (0.0%) |
| 4 or 5 Rooms | 35 (26.1%) | 13 (23.6%) |
| 6 or 7 Rooms | 74 (55.2%) | 15 (27.3%) |
| 8 or more Rooms | 25 (18.7%) | 27 (49.1%) |
| Total | 134 (100.0%) | 55 (100.0%) |
Housing Structure by Heating Type in Vintondale borough
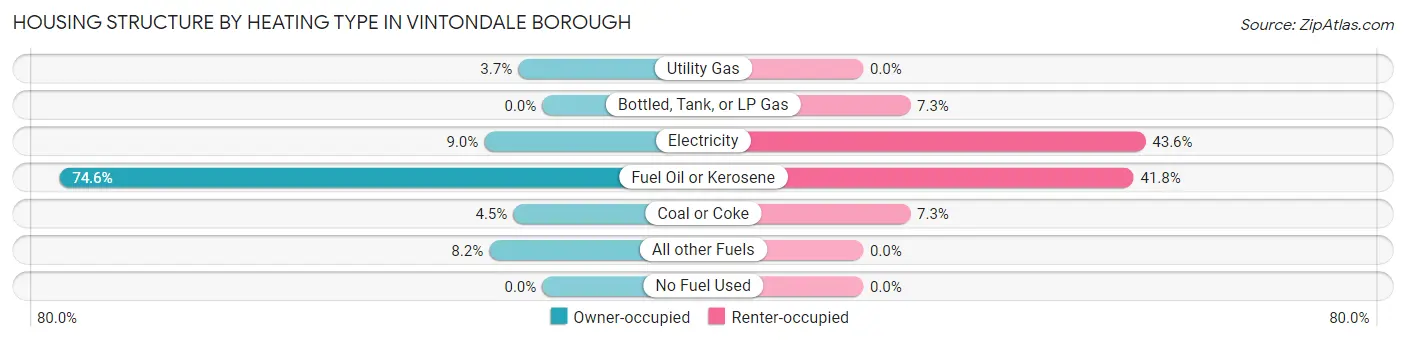
| Heating Type | Owner-occupied | Renter-occupied |
| Utility Gas | 5 (3.7%) | 0 (0.0%) |
| Bottled, Tank, or LP Gas | 0 (0.0%) | 4 (7.3%) |
| Electricity | 12 (9.0%) | 24 (43.6%) |
| Fuel Oil or Kerosene | 100 (74.6%) | 23 (41.8%) |
| Coal or Coke | 6 (4.5%) | 4 (7.3%) |
| All other Fuels | 11 (8.2%) | 0 (0.0%) |
| No Fuel Used | 0 (0.0%) | 0 (0.0%) |
| Total | 134 (100.0%) | 55 (100.0%) |
Household Vehicle Usage in Vintondale borough
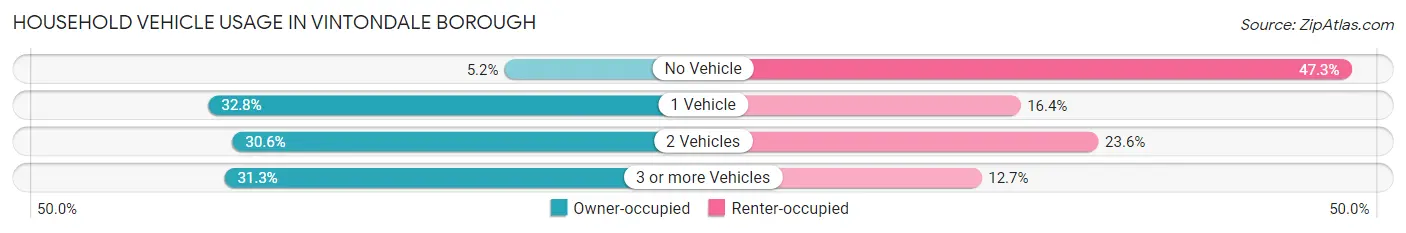
| Vehicles per Household | Owner-occupied | Renter-occupied |
| No Vehicle | 7 (5.2%) | 26 (47.3%) |
| 1 Vehicle | 44 (32.8%) | 9 (16.4%) |
| 2 Vehicles | 41 (30.6%) | 13 (23.6%) |
| 3 or more Vehicles | 42 (31.3%) | 7 (12.7%) |
| Total | 134 (100.0%) | 55 (100.0%) |
Real Estate & Mortgages in Vintondale borough
Real Estate and Mortgage Overview in Vintondale borough
| Characteristic | Without Mortgage | With Mortgage |
| Housing Units | 87 | 47 |
| Median Property Value | $47,400 | $65,400 |
| Median Household Income | $39,844 | $8 |
| Monthly Housing Costs | $463 | $0 |
| Real Estate Taxes | $700 | $0 |
Property Value by Mortgage Status in Vintondale borough
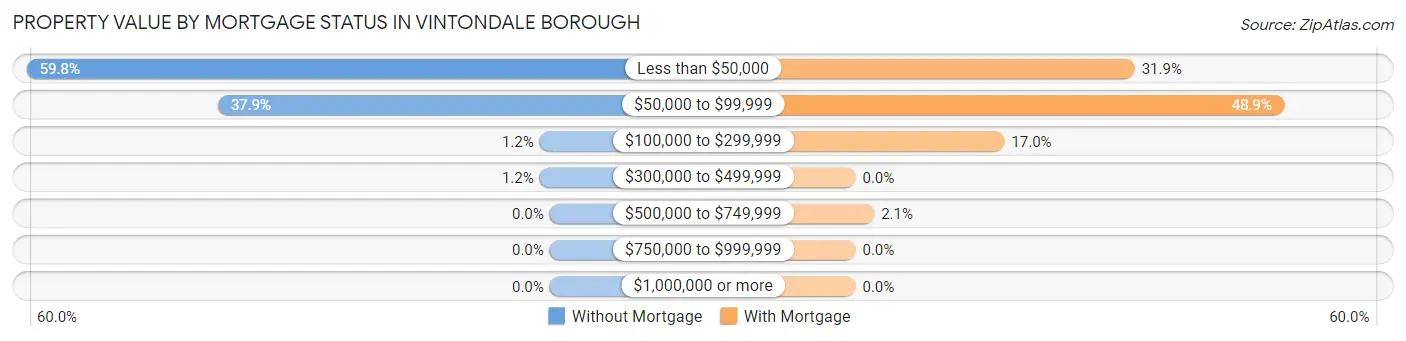
| Property Value | Without Mortgage | With Mortgage |
| Less than $50,000 | 52 (59.8%) | 15 (31.9%) |
| $50,000 to $99,999 | 33 (37.9%) | 23 (48.9%) |
| $100,000 to $299,999 | 1 (1.1%) | 8 (17.0%) |
| $300,000 to $499,999 | 1 (1.1%) | 0 (0.0%) |
| $500,000 to $749,999 | 0 (0.0%) | 1 (2.1%) |
| $750,000 to $999,999 | 0 (0.0%) | 0 (0.0%) |
| $1,000,000 or more | 0 (0.0%) | 0 (0.0%) |
| Total | 87 (100.0%) | 47 (100.0%) |
Household Income by Mortgage Status in Vintondale borough
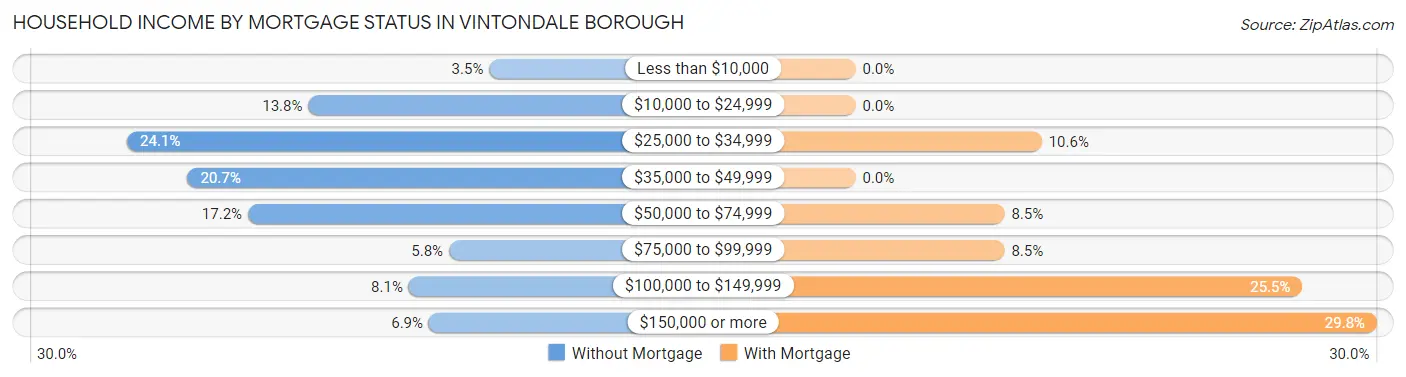
| Household Income | Without Mortgage | With Mortgage |
| Less than $10,000 | 3 (3.5%) | 0 (0.0%) |
| $10,000 to $24,999 | 12 (13.8%) | 0 (0.0%) |
| $25,000 to $34,999 | 21 (24.1%) | 5 (10.6%) |
| $35,000 to $49,999 | 18 (20.7%) | 0 (0.0%) |
| $50,000 to $74,999 | 15 (17.2%) | 4 (8.5%) |
| $75,000 to $99,999 | 5 (5.8%) | 4 (8.5%) |
| $100,000 to $149,999 | 7 (8.1%) | 12 (25.5%) |
| $150,000 or more | 6 (6.9%) | 14 (29.8%) |
| Total | 87 (100.0%) | 47 (100.0%) |
Property Value to Household Income Ratio in Vintondale borough
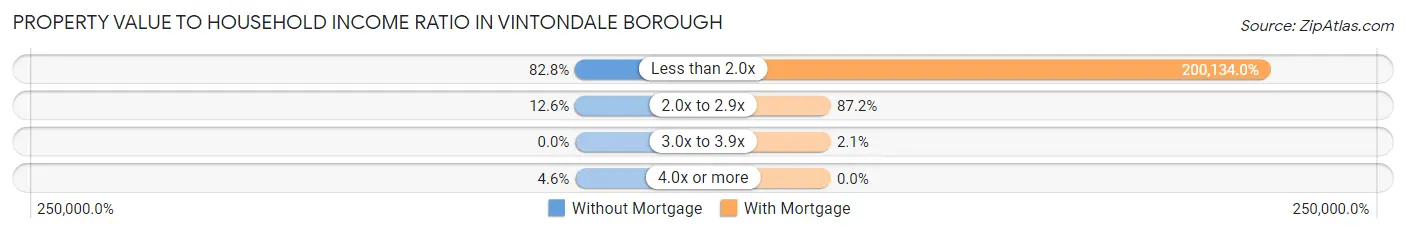
| Value-to-Income Ratio | Without Mortgage | With Mortgage |
| Less than 2.0x | 72 (82.8%) | 94,063 (200,134.0%) |
| 2.0x to 2.9x | 11 (12.6%) | 41 (87.2%) |
| 3.0x to 3.9x | 0 (0.0%) | 1 (2.1%) |
| 4.0x or more | 4 (4.6%) | 0 (0.0%) |
| Total | 87 (100.0%) | 47 (100.0%) |
Real Estate Taxes by Mortgage Status in Vintondale borough
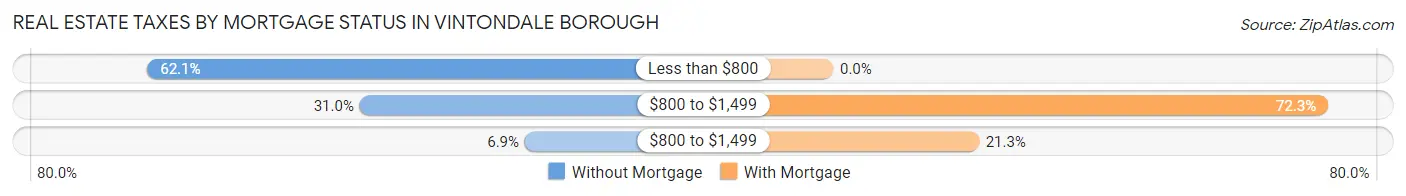
| Property Taxes | Without Mortgage | With Mortgage |
| Less than $800 | 54 (62.1%) | 0 (0.0%) |
| $800 to $1,499 | 27 (31.0%) | 34 (72.3%) |
| $800 to $1,499 | 6 (6.9%) | 10 (21.3%) |
| Total | 87 (100.0%) | 47 (100.0%) |
Health & Disability in Vintondale borough
Health Insurance Coverage by Age in Vintondale borough
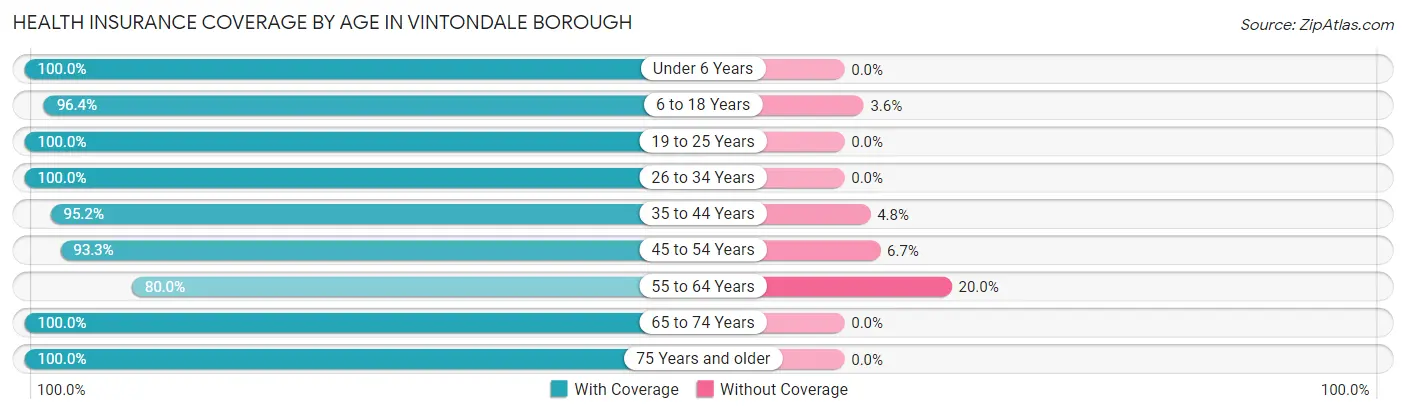
| Age Bracket | With Coverage | Without Coverage |
| Under 6 Years | 33 (100.0%) | 0 (0.0%) |
| 6 to 18 Years | 81 (96.4%) | 3 (3.6%) |
| 19 to 25 Years | 29 (100.0%) | 0 (0.0%) |
| 26 to 34 Years | 48 (100.0%) | 0 (0.0%) |
| 35 to 44 Years | 59 (95.2%) | 3 (4.8%) |
| 45 to 54 Years | 70 (93.3%) | 5 (6.7%) |
| 55 to 64 Years | 32 (80.0%) | 8 (20.0%) |
| 65 to 74 Years | 52 (100.0%) | 0 (0.0%) |
| 75 Years and older | 32 (100.0%) | 0 (0.0%) |
| Total | 436 (95.8%) | 19 (4.2%) |
Health Insurance Coverage by Citizenship Status in Vintondale borough
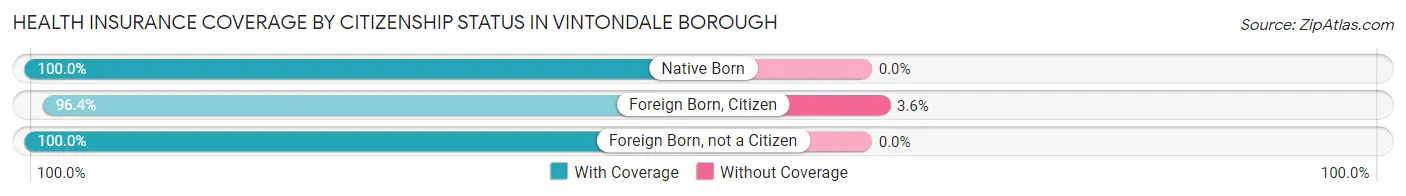
| Citizenship Status | With Coverage | Without Coverage |
| Native Born | 33 (100.0%) | 0 (0.0%) |
| Foreign Born, Citizen | 81 (96.4%) | 3 (3.6%) |
| Foreign Born, not a Citizen | 29 (100.0%) | 0 (0.0%) |
Health Insurance Coverage by Household Income in Vintondale borough
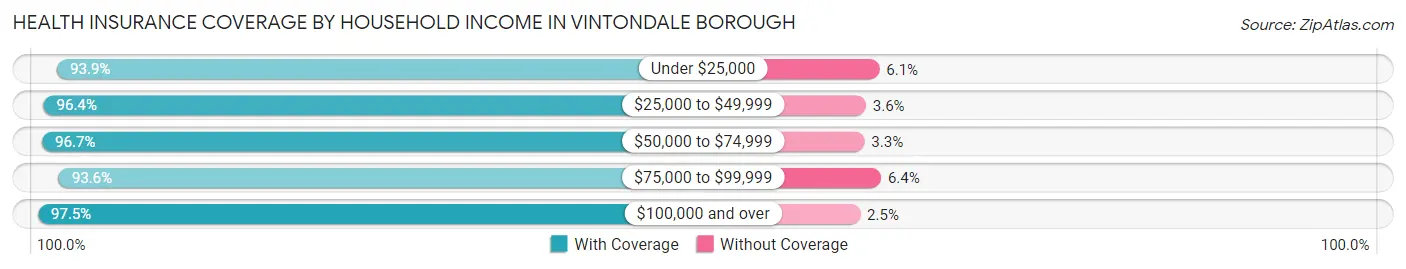
| Household Income | With Coverage | Without Coverage |
| Under $25,000 | 77 (93.9%) | 5 (6.1%) |
| $25,000 to $49,999 | 81 (96.4%) | 3 (3.6%) |
| $50,000 to $74,999 | 88 (96.7%) | 3 (3.3%) |
| $75,000 to $99,999 | 73 (93.6%) | 5 (6.4%) |
| $100,000 and over | 117 (97.5%) | 3 (2.5%) |
Public vs Private Health Insurance Coverage by Age in Vintondale borough
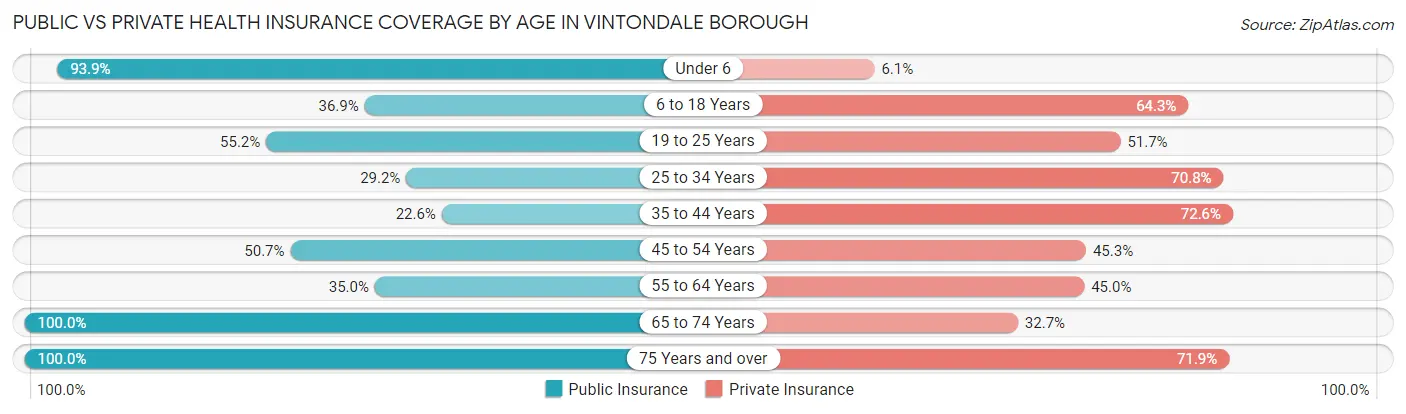
| Age Bracket | Public Insurance | Private Insurance |
| Under 6 | 31 (93.9%) | 2 (6.1%) |
| 6 to 18 Years | 31 (36.9%) | 54 (64.3%) |
| 19 to 25 Years | 16 (55.2%) | 15 (51.7%) |
| 25 to 34 Years | 14 (29.2%) | 34 (70.8%) |
| 35 to 44 Years | 14 (22.6%) | 45 (72.6%) |
| 45 to 54 Years | 38 (50.7%) | 34 (45.3%) |
| 55 to 64 Years | 14 (35.0%) | 18 (45.0%) |
| 65 to 74 Years | 52 (100.0%) | 17 (32.7%) |
| 75 Years and over | 32 (100.0%) | 23 (71.9%) |
| Total | 242 (53.2%) | 242 (53.2%) |
Disability Status by Sex by Age in Vintondale borough
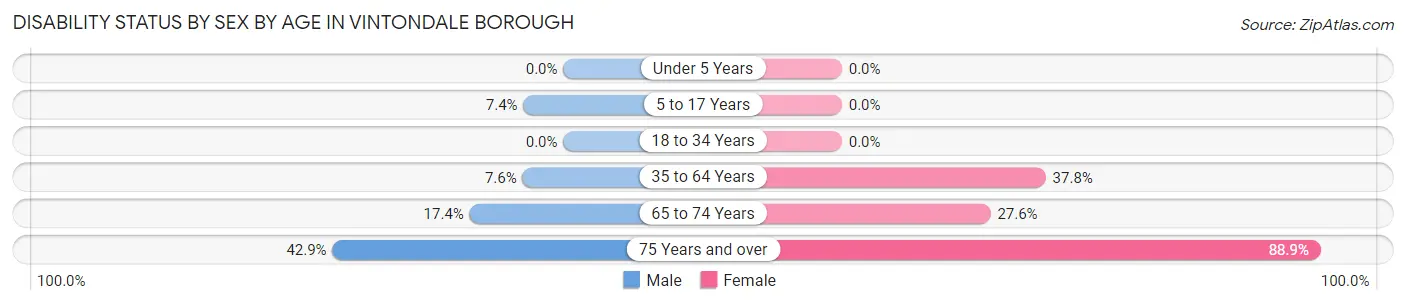
| Age Bracket | Male | Female |
| Under 5 Years | 0 (0.0%) | 0 (0.0%) |
| 5 to 17 Years | 4 (7.4%) | 0 (0.0%) |
| 18 to 34 Years | 0 (0.0%) | 0 (0.0%) |
| 35 to 64 Years | 5 (7.6%) | 42 (37.8%) |
| 65 to 74 Years | 4 (17.4%) | 8 (27.6%) |
| 75 Years and over | 6 (42.9%) | 16 (88.9%) |
Disability Class by Sex by Age in Vintondale borough
Disability Class: Hearing Difficulty
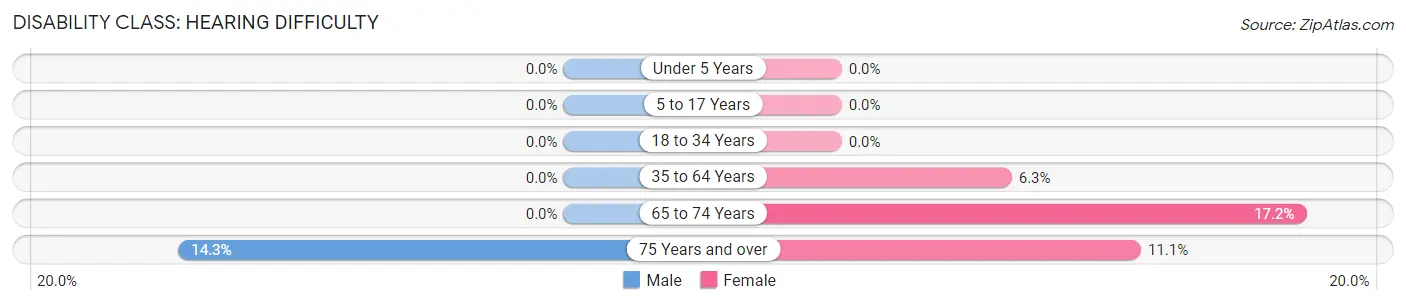
| Age Bracket | Male | Female |
| Under 5 Years | 0 (0.0%) | 0 (0.0%) |
| 5 to 17 Years | 0 (0.0%) | 0 (0.0%) |
| 18 to 34 Years | 0 (0.0%) | 0 (0.0%) |
| 35 to 64 Years | 0 (0.0%) | 7 (6.3%) |
| 65 to 74 Years | 0 (0.0%) | 5 (17.2%) |
| 75 Years and over | 2 (14.3%) | 2 (11.1%) |
Disability Class: Vision Difficulty
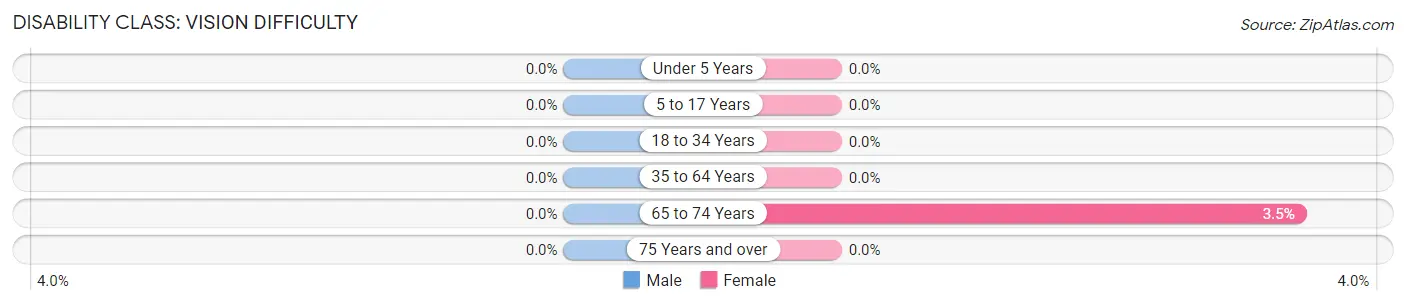
| Age Bracket | Male | Female |
| Under 5 Years | 0 (0.0%) | 0 (0.0%) |
| 5 to 17 Years | 0 (0.0%) | 0 (0.0%) |
| 18 to 34 Years | 0 (0.0%) | 0 (0.0%) |
| 35 to 64 Years | 0 (0.0%) | 0 (0.0%) |
| 65 to 74 Years | 0 (0.0%) | 1 (3.5%) |
| 75 Years and over | 0 (0.0%) | 0 (0.0%) |
Disability Class: Cognitive Difficulty
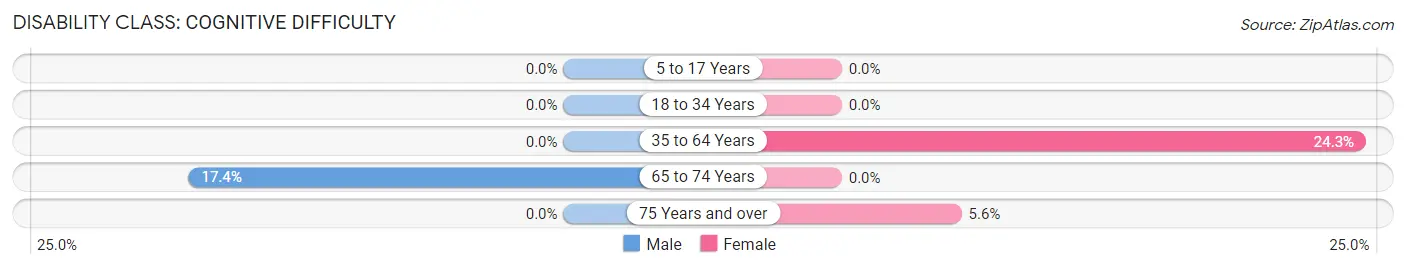
| Age Bracket | Male | Female |
| 5 to 17 Years | 0 (0.0%) | 0 (0.0%) |
| 18 to 34 Years | 0 (0.0%) | 0 (0.0%) |
| 35 to 64 Years | 0 (0.0%) | 27 (24.3%) |
| 65 to 74 Years | 4 (17.4%) | 0 (0.0%) |
| 75 Years and over | 0 (0.0%) | 1 (5.6%) |
Disability Class: Ambulatory Difficulty
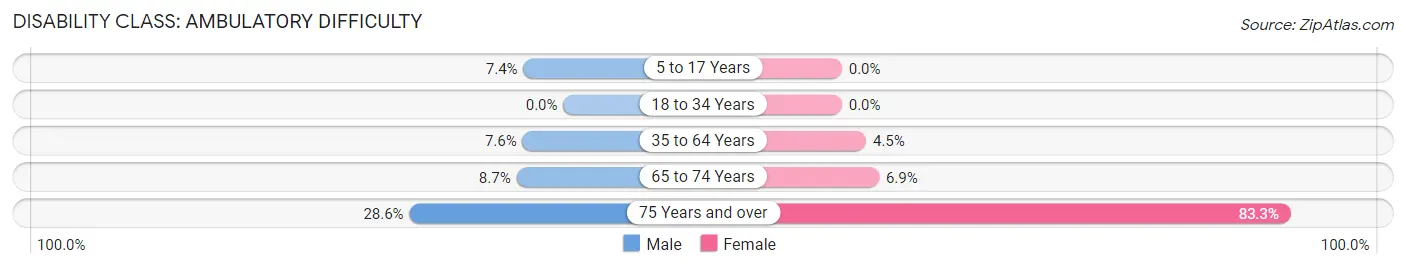
| Age Bracket | Male | Female |
| 5 to 17 Years | 4 (7.4%) | 0 (0.0%) |
| 18 to 34 Years | 0 (0.0%) | 0 (0.0%) |
| 35 to 64 Years | 5 (7.6%) | 5 (4.5%) |
| 65 to 74 Years | 2 (8.7%) | 2 (6.9%) |
| 75 Years and over | 4 (28.6%) | 15 (83.3%) |
Disability Class: Self-Care Difficulty
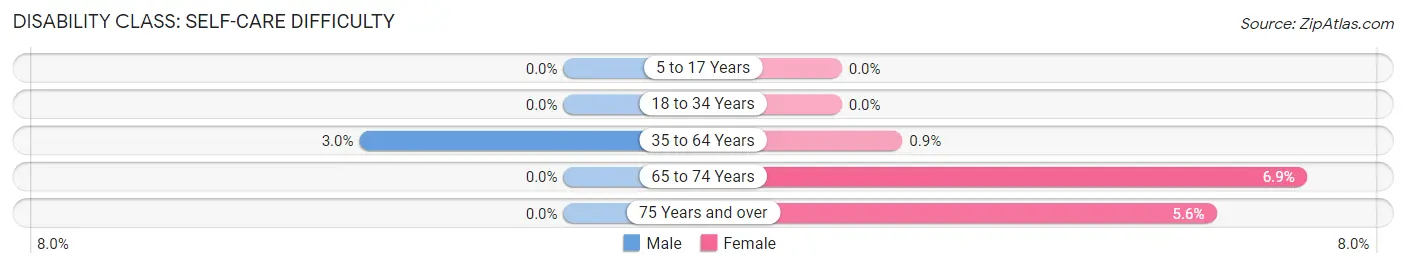
| Age Bracket | Male | Female |
| 5 to 17 Years | 0 (0.0%) | 0 (0.0%) |
| 18 to 34 Years | 0 (0.0%) | 0 (0.0%) |
| 35 to 64 Years | 2 (3.0%) | 1 (0.9%) |
| 65 to 74 Years | 0 (0.0%) | 2 (6.9%) |
| 75 Years and over | 0 (0.0%) | 1 (5.6%) |
Technology Access in Vintondale borough
Computing Device Access in Vintondale borough
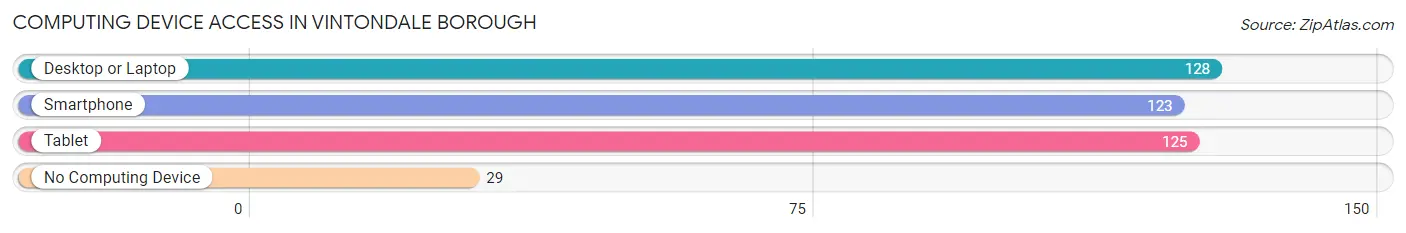
| Device Type | # Households | % Households |
| Desktop or Laptop | 128 | 67.7% |
| Smartphone | 123 | 65.1% |
| Tablet | 125 | 66.1% |
| No Computing Device | 29 | 15.3% |
| Total | 189 | 100.0% |
Internet Access in Vintondale borough
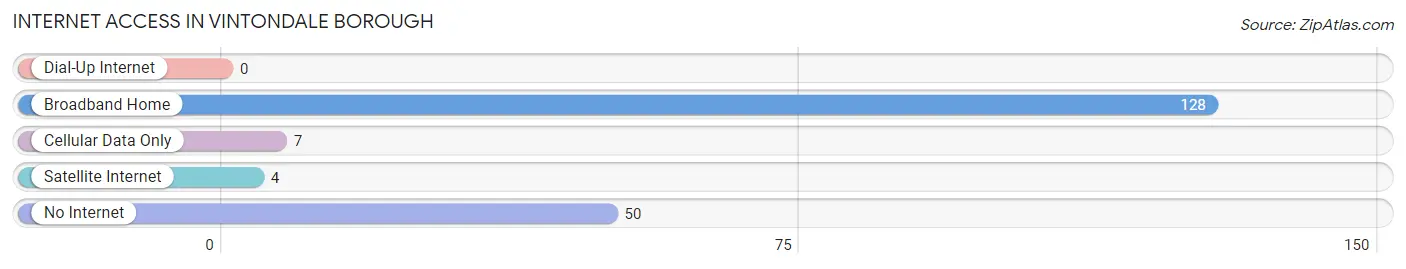
| Internet Type | # Households | % Households |
| Dial-Up Internet | 0 | 0.0% |
| Broadband Home | 128 | 67.7% |
| Cellular Data Only | 7 | 3.7% |
| Satellite Internet | 4 | 2.1% |
| No Internet | 50 | 26.5% |
| Total | 189 | 100.0% |
Vintondale borough Summary
Vintondale Borough is a small borough located in Cambria County, Pennsylvania. It is situated in the foothills of the Allegheny Mountains, approximately 10 miles east of Johnstown. The borough was founded in 1891 and is home to a population of approximately 500 people.
History
Vintondale Borough was founded in 1891 by a group of coal miners from the nearby town of Vintondale. The miners had been working in the coal mines of the area since the late 1800s and wanted to create a community of their own. The miners named the borough after their hometown of Vintondale, which was located in the nearby county of Somerset.
The first settlers of Vintondale were mostly of German and Irish descent. The town quickly grew and by the early 1900s, it had become a thriving coal mining community. The coal mines provided employment for many of the residents and the town soon became known for its coal production.
In the early 1900s, the town also became known for its brickyards. The brickyards provided employment for many of the residents and the town soon became known for its brick production.
The town continued to grow and by the mid-1900s, it had become a popular tourist destination. The town was known for its scenic beauty and its many outdoor activities. The town also had a thriving business district, which included a variety of shops and restaurants.
Geography
Vintondale Borough is located in the foothills of the Allegheny Mountains in Cambria County, Pennsylvania. The borough is situated approximately 10 miles east of Johnstown and is bordered by the towns of Vintondale, Nanty Glo, and Twin Rocks.
The borough is located in a valley surrounded by hills and mountains. The terrain is mostly hilly and the highest point in the borough is 1,400 feet above sea level. The borough is located in a temperate climate and experiences all four seasons.
Economy
The economy of Vintondale Borough is largely based on tourism and the service industry. The town is known for its scenic beauty and its many outdoor activities. The town also has a thriving business district, which includes a variety of shops and restaurants.
The town is also home to a number of small businesses, including a lumber yard, a hardware store, and a grocery store. The town also has a number of manufacturing businesses, including a brickyard and a coal mine.
Demographics
As of the 2010 census, the population of Vintondale Borough was 498 people. The racial makeup of the borough was 97.2% White, 0.6% African American, 0.2% Native American, 0.2% Asian, 0.2% from other races, and 1.8% from two or more races. Hispanic or Latino of any race were 0.8% of the population.
The median income for a household in the borough was $37,500 and the median income for a family was $41,250. The per capita income for the borough was $17,845. About 11.2% of families and 13.2% of the population were below the poverty line, including 18.2% of those under age 18 and 8.3% of those age 65 or over.
Common Questions
What is Per Capita Income in Vintondale borough?
Per Capita income in Vintondale borough is $25,121.
What is the Median Family Income in Vintondale borough?
Median Family Income in Vintondale borough is $55,938.
What is the Median Household income in Vintondale borough?
Median Household Income in Vintondale borough is $41,964.
What is Income or Wage Gap in Vintondale borough?
Income or Wage Gap in Vintondale borough is 33.1%.
Women in Vintondale borough earn 66.9 cents for every dollar earned by a man.
What is Inequality or Gini Index in Vintondale borough?
Inequality or Gini Index in Vintondale borough is 0.46.
What is the Total Population of Vintondale borough?
Total Population of Vintondale borough is 455.
What is the Total Male Population of Vintondale borough?
Total Male Population of Vintondale borough is 216.
What is the Total Female Population of Vintondale borough?
Total Female Population of Vintondale borough is 239.
What is the Ratio of Males per 100 Females in Vintondale borough?
There are 90.38 Males per 100 Females in Vintondale borough.
What is the Ratio of Females per 100 Males in Vintondale borough?
There are 110.65 Females per 100 Males in Vintondale borough.
What is the Median Population Age in Vintondale borough?
Median Population Age in Vintondale borough is 41.6 Years.
What is the Average Family Size in Vintondale borough
Average Family Size in Vintondale borough is 3.0 People.
What is the Average Household Size in Vintondale borough
Average Household Size in Vintondale borough is 2.4 People.
How Large is the Labor Force in Vintondale borough?
There are 188 People in the Labor Forcein in Vintondale borough.
What is the Percentage of People in the Labor Force in Vintondale borough?
51.8% of People are in the Labor Force in Vintondale borough.
What is the Unemployment Rate in Vintondale borough?
Unemployment Rate in Vintondale borough is 13.3%.