Zip Codes with the Highest Percentage of Population Employed in Installation, Maintenance & Repair in Pittston, PA
RELATED REPORTS & OPTIONS
Installation, Maintenance & Repair
Pittston
Compare Zip Codes
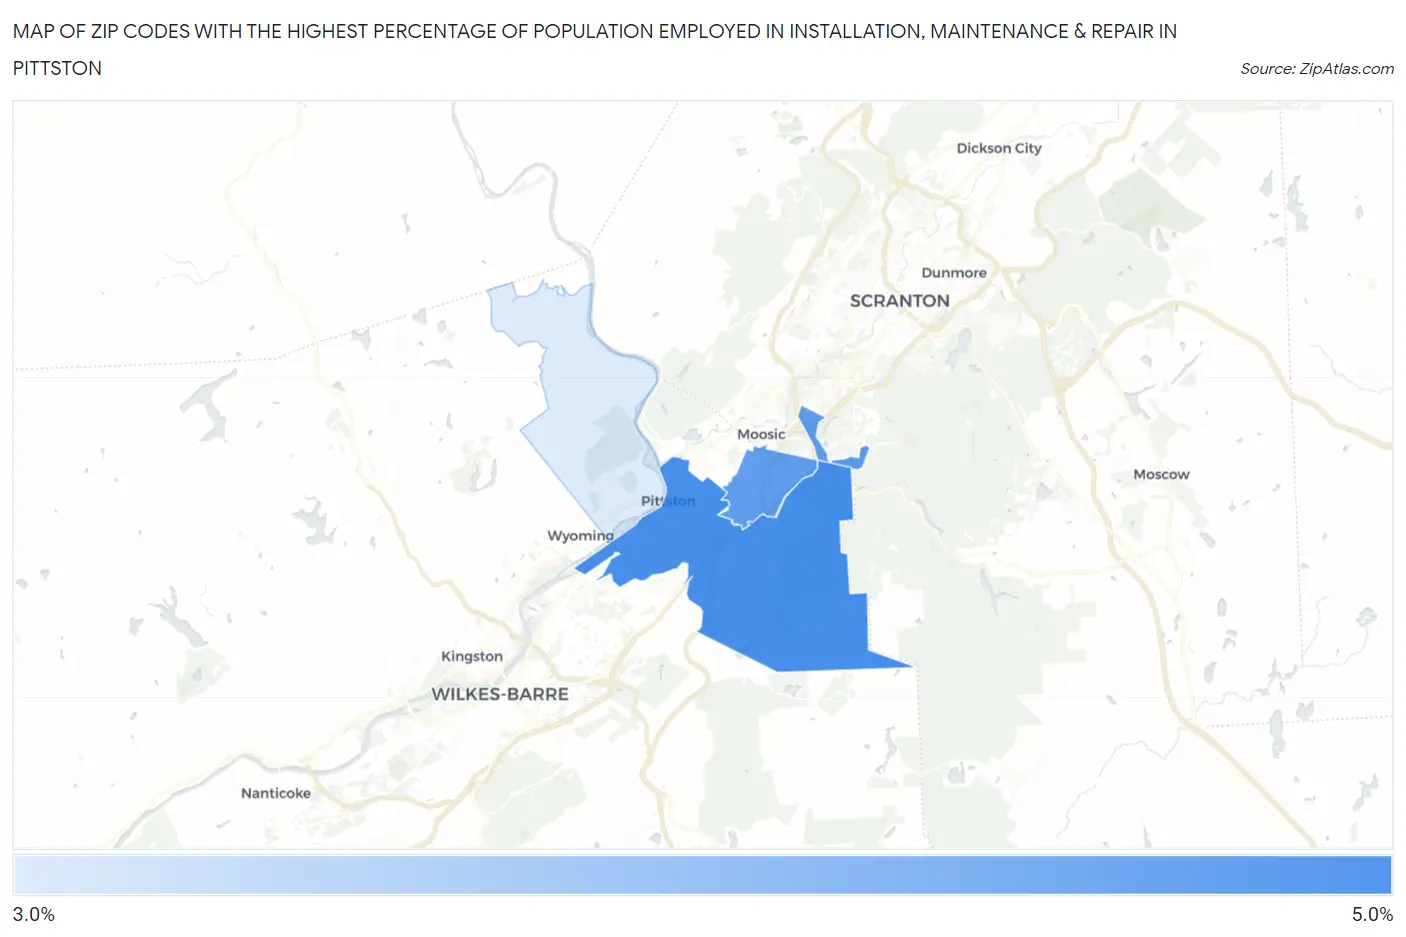
Map of Zip Codes with the Highest Percentage of Population Employed in Installation, Maintenance & Repair in Pittston
3.4%
4.5%
Zip Codes with the Highest Percentage of Population Employed in Installation, Maintenance & Repair in Pittston, PA
| Zip Code | % Employed | vs State | vs National | |
| 1. | 18640 | 4.5% | 3.1%(+1.42)#607 | 3.1%(+1.44)#10,374 |
| 2. | 18641 | 4.3% | 3.1%(+1.23)#647 | 3.1%(+1.25)#11,079 |
| 3. | 18643 | 3.4% | 3.1%(+0.283)#912 | 3.1%(+0.308)#15,195 |
1
Common Questions
What are the Top Zip Codes with the Highest Percentage of Population Employed in Installation, Maintenance & Repair in Pittston, PA?
Top Zip Codes with the Highest Percentage of Population Employed in Installation, Maintenance & Repair in Pittston, PA are:
What zip code has the Highest Percentage of Population Employed in Installation, Maintenance & Repair in Pittston, PA?
18640 has the Highest Percentage of Population Employed in Installation, Maintenance & Repair in Pittston, PA with 4.5%.
What is the Percentage of Population Employed in Installation, Maintenance & Repair in Pittston, PA?
Percentage of Population Employed in Installation, Maintenance & Repair in Pittston is 3.4%.
What is the Percentage of Population Employed in Installation, Maintenance & Repair in Pennsylvania?
Percentage of Population Employed in Installation, Maintenance & Repair in Pennsylvania is 3.1%.
What is the Percentage of Population Employed in Installation, Maintenance & Repair in the United States?
Percentage of Population Employed in Installation, Maintenance & Repair in the United States is 3.1%.