Beallsville borough, PA Map & Demographics
Beallsville borough Overview
$37,692
PER CAPITA INCOME
$81,964
AVG FAMILY INCOME
$72,188
AVG HOUSEHOLD INCOME
39.0%
WAGE / INCOME GAP [ % ]
61.0¢/ $1
WAGE / INCOME GAP [ $ ]
0.41
INEQUALITY / GINI INDEX
442
TOTAL POPULATION
239
MALE POPULATION
203
FEMALE POPULATION
117.73
MALES / 100 FEMALES
84.94
FEMALES / 100 MALES
47.2
MEDIAN AGE
3.1
AVG FAMILY SIZE
2.5
AVG HOUSEHOLD SIZE
238
LABOR FORCE [ PEOPLE ]
62.8%
PERCENT IN LABOR FORCE
7.1%
UNEMPLOYMENT RATE
Income in Beallsville borough
Income Overview in Beallsville borough
Per Capita Income in Beallsville borough is $37,692, while median incomes of families and households are $81,964 and $72,188 respectively.
| Characteristic | Number | Measure |
| Per Capita Income | 442 | $37,692 |
| Median Family Income | 127 | $81,964 |
| Mean Family Income | 127 | $112,067 |
| Median Household Income | 178 | $72,188 |
| Mean Household Income | 178 | $92,035 |
| Income Deficit | 127 | $0 |
| Wage / Income Gap (%) | 442 | 38.98% |
| Wage / Income Gap ($) | 442 | 61.02¢ per $1 |
| Gini / Inequality Index | 442 | 0.41 |
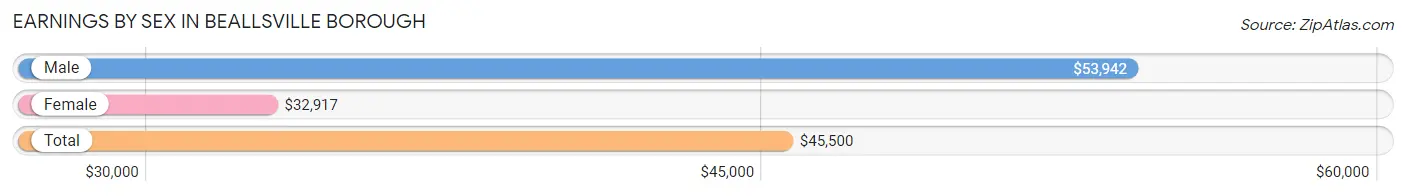
Earnings by Sex in Beallsville borough
Average Earnings in Beallsville borough are $45,500, $53,942 for men and $32,917 for women, a difference of 39.0%.
| Sex | Number | Average Earnings |
| Male | 135 (55.3%) | $53,942 |
| Female | 109 (44.7%) | $32,917 |
| Total | 244 (100.0%) | $45,500 |
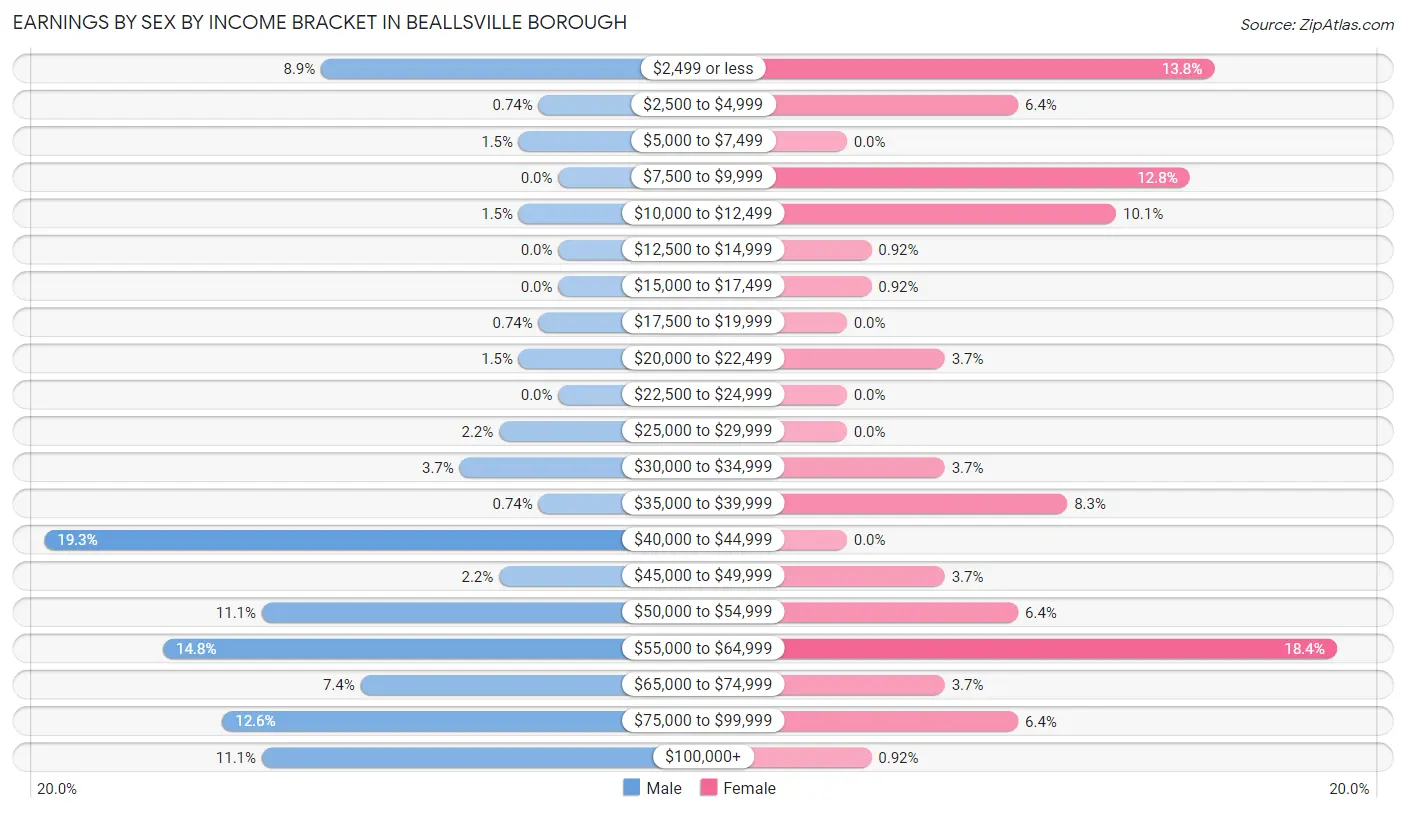
Earnings by Sex by Income Bracket in Beallsville borough
The most common earnings brackets in Beallsville borough are $40,000 to $44,999 for men (26 | 19.3%) and $55,000 to $64,999 for women (20 | 18.3%).
| Income | Male | Female |
| $2,499 or less | 12 (8.9%) | 15 (13.8%) |
| $2,500 to $4,999 | 1 (0.7%) | 7 (6.4%) |
| $5,000 to $7,499 | 2 (1.5%) | 0 (0.0%) |
| $7,500 to $9,999 | 0 (0.0%) | 14 (12.8%) |
| $10,000 to $12,499 | 2 (1.5%) | 11 (10.1%) |
| $12,500 to $14,999 | 0 (0.0%) | 1 (0.9%) |
| $15,000 to $17,499 | 0 (0.0%) | 1 (0.9%) |
| $17,500 to $19,999 | 1 (0.7%) | 0 (0.0%) |
| $20,000 to $22,499 | 2 (1.5%) | 4 (3.7%) |
| $22,500 to $24,999 | 0 (0.0%) | 0 (0.0%) |
| $25,000 to $29,999 | 3 (2.2%) | 0 (0.0%) |
| $30,000 to $34,999 | 5 (3.7%) | 4 (3.7%) |
| $35,000 to $39,999 | 1 (0.7%) | 9 (8.3%) |
| $40,000 to $44,999 | 26 (19.3%) | 0 (0.0%) |
| $45,000 to $49,999 | 3 (2.2%) | 4 (3.7%) |
| $50,000 to $54,999 | 15 (11.1%) | 7 (6.4%) |
| $55,000 to $64,999 | 20 (14.8%) | 20 (18.3%) |
| $65,000 to $74,999 | 10 (7.4%) | 4 (3.7%) |
| $75,000 to $99,999 | 17 (12.6%) | 7 (6.4%) |
| $100,000+ | 15 (11.1%) | 1 (0.9%) |
| Total | 135 (100.0%) | 109 (100.0%) |
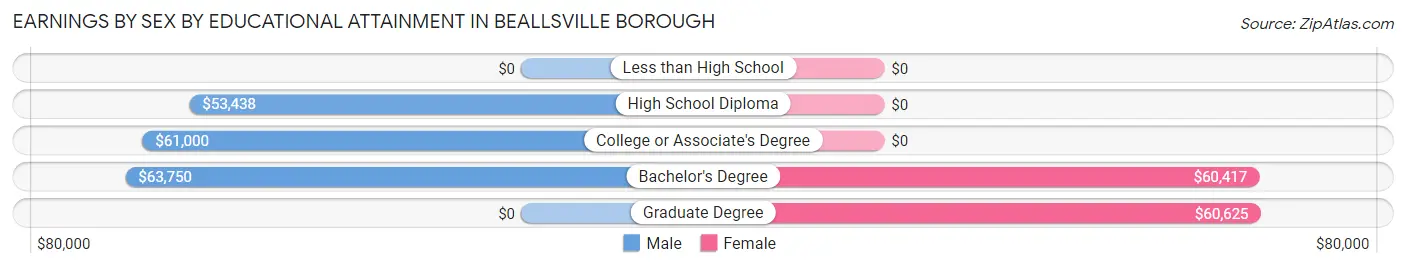
Earnings by Sex by Educational Attainment in Beallsville borough
Average earnings in Beallsville borough are $55,000 for men and $46,875 for women, a difference of 14.8%. Men with an educational attainment of bachelor's degree enjoy the highest average annual earnings of $63,750, while those with high school diploma education earn the least with $53,438. Women with an educational attainment of graduate degree earn the most with the average annual earnings of $60,625, while those with bachelor's degree education have the smallest earnings of $60,417.
| Educational Attainment | Male Income | Female Income |
| Less than High School | - | - |
| High School Diploma | $53,438 | $0 |
| College or Associate's Degree | $61,000 | $0 |
| Bachelor's Degree | $63,750 | $60,417 |
| Graduate Degree | - | - |
| Total | $55,000 | $46,875 |
Family Income in Beallsville borough
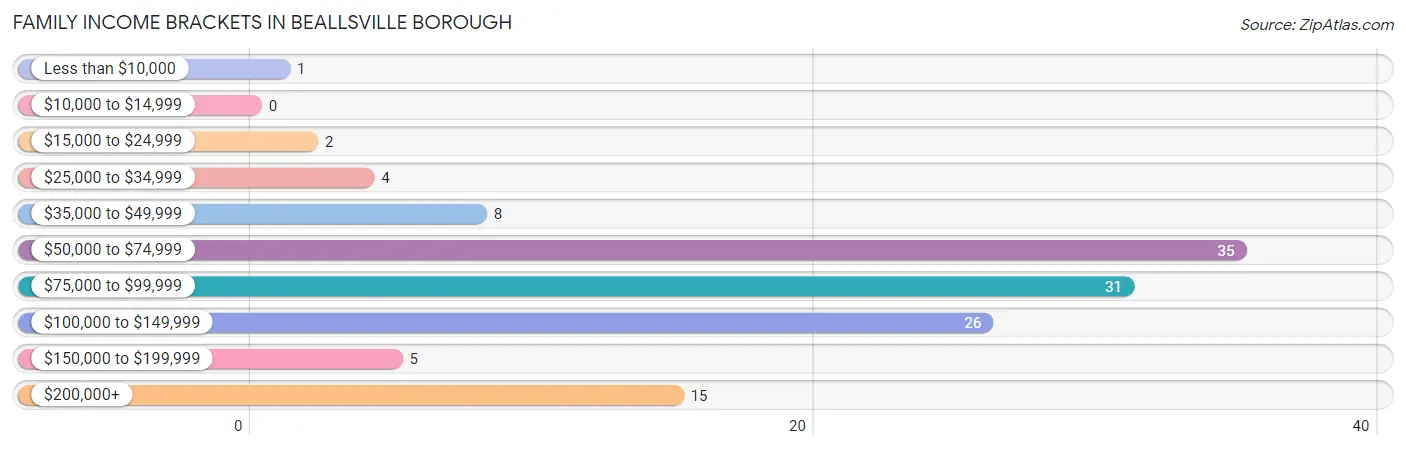
Family Income Brackets in Beallsville borough
According to the Beallsville borough family income data, there are 35 families falling into the $50,000 to $74,999 income range, which is the most common income bracket and makes up 27.6% of all families.
| Income Bracket | # Families | % Families |
| Less than $10,000 | 1 | 0.8% |
| $10,000 to $14,999 | 0 | 0.0% |
| $15,000 to $24,999 | 2 | 1.6% |
| $25,000 to $34,999 | 4 | 3.1% |
| $35,000 to $49,999 | 8 | 6.3% |
| $50,000 to $74,999 | 35 | 27.6% |
| $75,000 to $99,999 | 31 | 24.4% |
| $100,000 to $149,999 | 26 | 20.5% |
| $150,000 to $199,999 | 5 | 3.9% |
| $200,000+ | 15 | 11.8% |
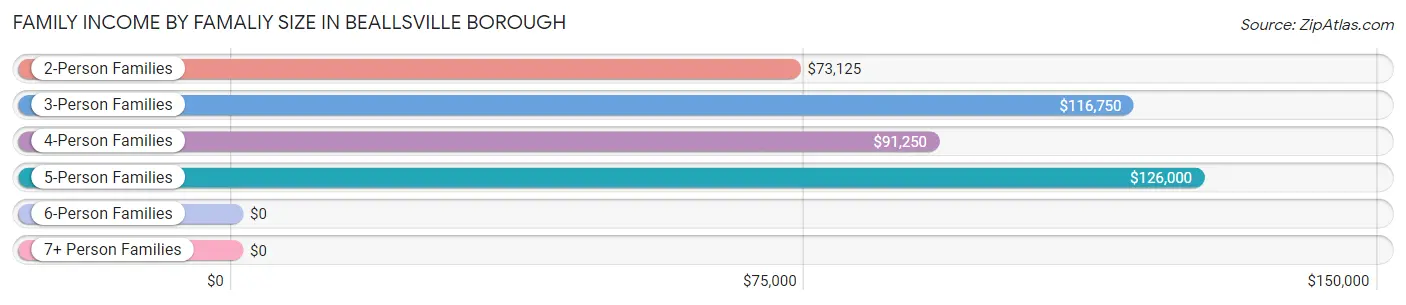
Family Income by Famaliy Size in Beallsville borough
5-person families (14 | 11.0%) account for the highest median family income in Beallsville borough with $126,000 per family, while 3-person families (19 | 15.0%) have the highest median income of $38,917 per family member.
| Income Bracket | # Families | Median Income |
| 2-Person Families | 65 (51.2%) | $73,125 |
| 3-Person Families | 19 (15.0%) | $116,750 |
| 4-Person Families | 27 (21.3%) | $91,250 |
| 5-Person Families | 14 (11.0%) | $126,000 |
| 6-Person Families | 2 (1.6%) | $0 |
| 7+ Person Families | 0 (0.0%) | $0 |
| Total | 127 (100.0%) | $81,964 |
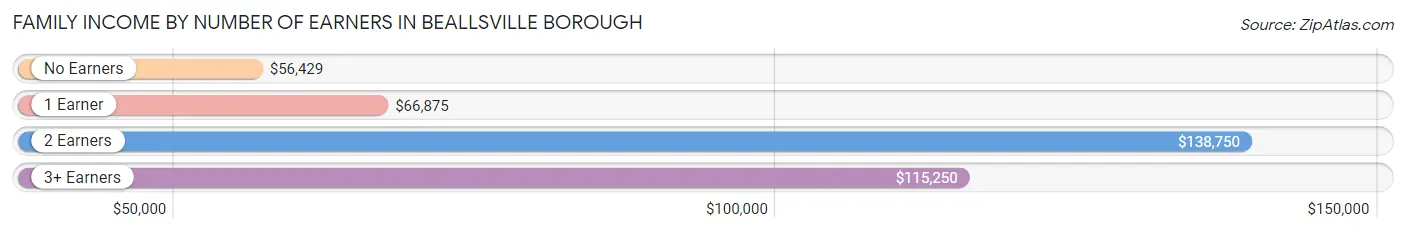
Family Income by Number of Earners in Beallsville borough
The median family income in Beallsville borough is $81,964, with families comprising 2 earners (33) having the highest median family income of $138,750, while families with no earners (26) have the lowest median family income of $56,429, accounting for 26.0% and 20.5% of families, respectively.
| Number of Earners | # Families | Median Income |
| No Earners | 26 (20.5%) | $56,429 |
| 1 Earner | 37 (29.1%) | $66,875 |
| 2 Earners | 33 (26.0%) | $138,750 |
| 3+ Earners | 31 (24.4%) | $115,250 |
| Total | 127 (100.0%) | $81,964 |
Household Income in Beallsville borough
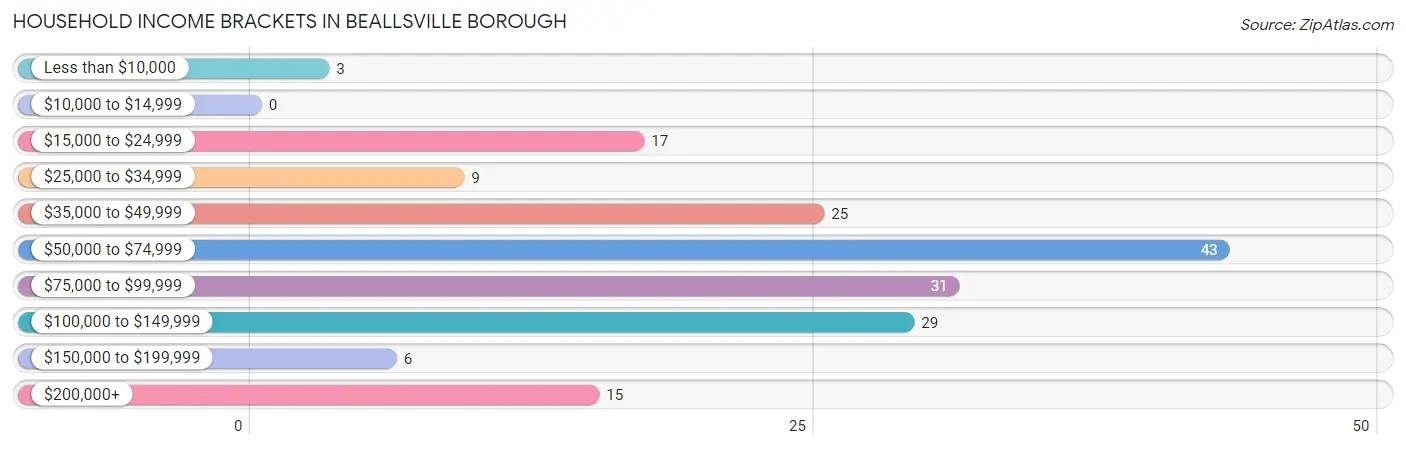
Household Income Brackets in Beallsville borough
With 43 households falling in the category, the $50,000 to $74,999 income range is the most frequent in Beallsville borough, accounting for 24.2% of all households.
| Income Bracket | # Households | % Households |
| Less than $10,000 | 3 | 1.7% |
| $10,000 to $14,999 | 0 | 0.0% |
| $15,000 to $24,999 | 17 | 9.6% |
| $25,000 to $34,999 | 9 | 5.1% |
| $35,000 to $49,999 | 25 | 14.0% |
| $50,000 to $74,999 | 43 | 24.2% |
| $75,000 to $99,999 | 31 | 17.4% |
| $100,000 to $149,999 | 29 | 16.3% |
| $150,000 to $199,999 | 6 | 3.4% |
| $200,000+ | 15 | 8.4% |
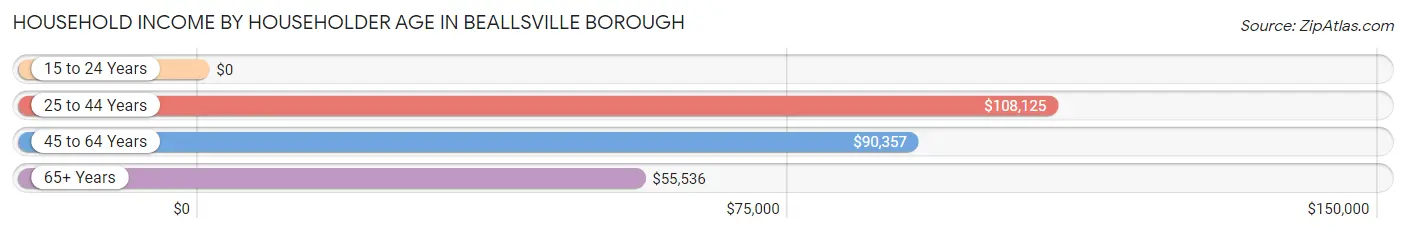
Household Income by Householder Age in Beallsville borough
The median household income in Beallsville borough is $72,188, with the highest median household income of $108,125 found in the 25 to 44 years age bracket for the primary householder. A total of 31 households (17.4%) fall into this category.
| Income Bracket | # Households | Median Income |
| 15 to 24 Years | 0 (0.0%) | $0 |
| 25 to 44 Years | 31 (17.4%) | $108,125 |
| 45 to 64 Years | 76 (42.7%) | $90,357 |
| 65+ Years | 71 (39.9%) | $55,536 |
| Total | 178 (100.0%) | $72,188 |
Poverty in Beallsville borough
Income Below Poverty by Sex and Age in Beallsville borough
With 3.8% poverty level for males and 1.0% for females among the residents of Beallsville borough, 12 to 14 year old males and 55 to 64 year old females are the most vulnerable to poverty, with 1 males (10.0%) and 2 females (6.1%) in their respective age groups living below the poverty level.
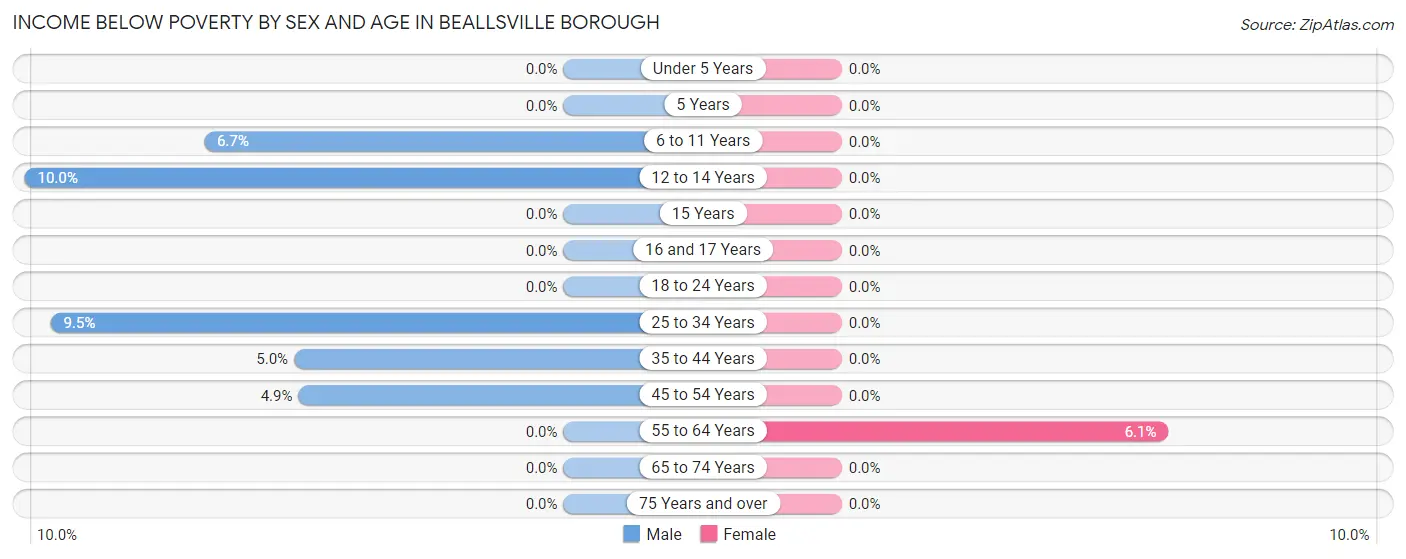
| Age Bracket | Male | Female |
| Under 5 Years | 0 (0.0%) | 0 (0.0%) |
| 5 Years | 0 (0.0%) | 0 (0.0%) |
| 6 to 11 Years | 2 (6.7%) | 0 (0.0%) |
| 12 to 14 Years | 1 (10.0%) | 0 (0.0%) |
| 15 Years | 0 (0.0%) | 0 (0.0%) |
| 16 and 17 Years | 0 (0.0%) | 0 (0.0%) |
| 18 to 24 Years | 0 (0.0%) | 0 (0.0%) |
| 25 to 34 Years | 2 (9.5%) | 0 (0.0%) |
| 35 to 44 Years | 1 (5.0%) | 0 (0.0%) |
| 45 to 54 Years | 3 (4.9%) | 0 (0.0%) |
| 55 to 64 Years | 0 (0.0%) | 2 (6.1%) |
| 65 to 74 Years | 0 (0.0%) | 0 (0.0%) |
| 75 Years and over | 0 (0.0%) | 0 (0.0%) |
| Total | 9 (3.8%) | 2 (1.0%) |
Income Above Poverty by Sex and Age in Beallsville borough
According to the poverty statistics in Beallsville borough, males aged 5 years and females aged 6 to 11 years are the age groups that are most secure financially, with 100.0% of males and 100.0% of females in these age groups living above the poverty line.
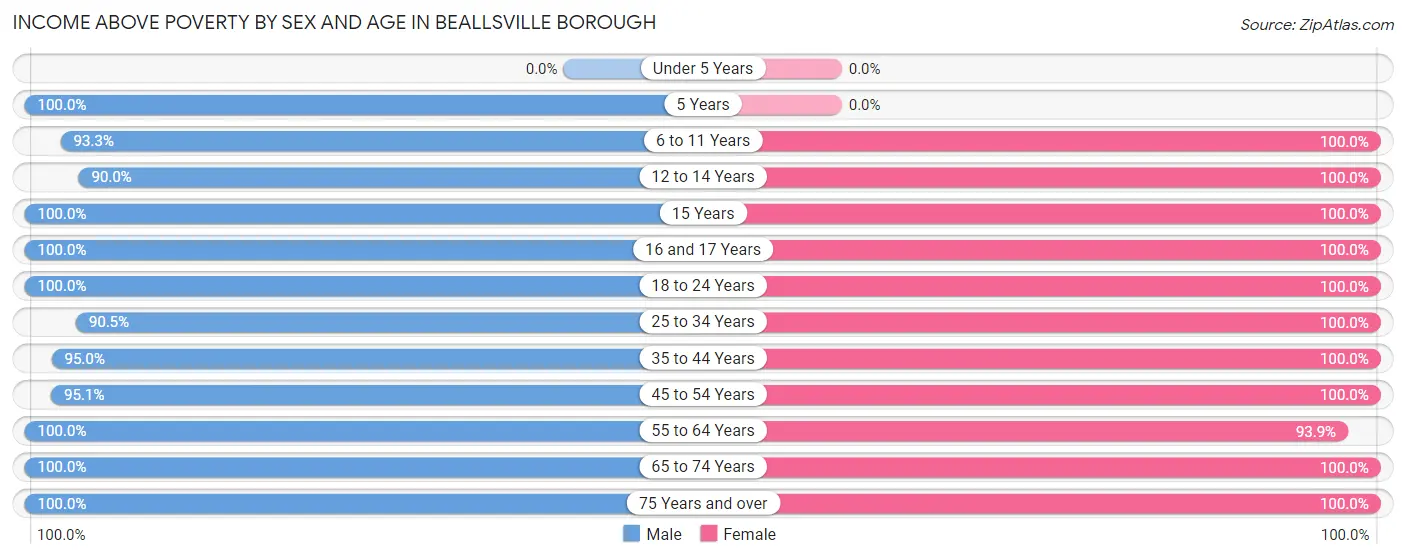
| Age Bracket | Male | Female |
| Under 5 Years | 0 (0.0%) | 0 (0.0%) |
| 5 Years | 6 (100.0%) | 0 (0.0%) |
| 6 to 11 Years | 28 (93.3%) | 1 (100.0%) |
| 12 to 14 Years | 9 (90.0%) | 4 (100.0%) |
| 15 Years | 6 (100.0%) | 6 (100.0%) |
| 16 and 17 Years | 16 (100.0%) | 7 (100.0%) |
| 18 to 24 Years | 6 (100.0%) | 21 (100.0%) |
| 25 to 34 Years | 19 (90.5%) | 12 (100.0%) |
| 35 to 44 Years | 19 (95.0%) | 29 (100.0%) |
| 45 to 54 Years | 58 (95.1%) | 21 (100.0%) |
| 55 to 64 Years | 30 (100.0%) | 31 (93.9%) |
| 65 to 74 Years | 26 (100.0%) | 51 (100.0%) |
| 75 Years and over | 7 (100.0%) | 18 (100.0%) |
| Total | 230 (96.2%) | 201 (99.0%) |
Income Below Poverty Among Married-Couple Families in Beallsville borough
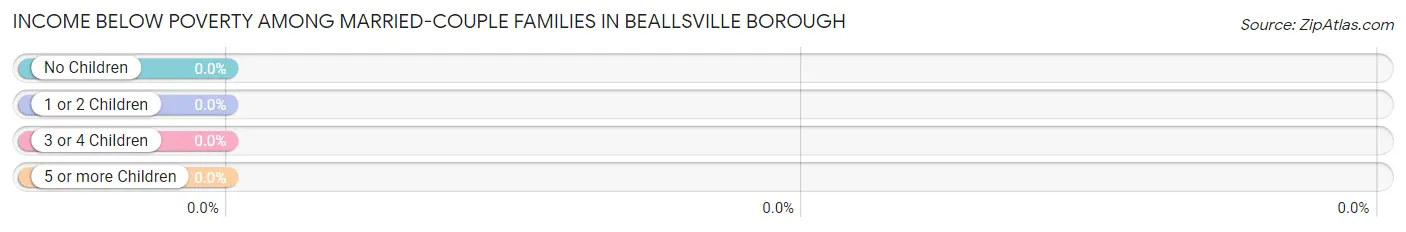
| Children | Above Poverty | Below Poverty |
| No Children | 59 (100.0%) | 0 (0.0%) |
| 1 or 2 Children | 33 (100.0%) | 0 (0.0%) |
| 3 or 4 Children | 7 (100.0%) | 0 (0.0%) |
| 5 or more Children | 0 (0.0%) | 0 (0.0%) |
| Total | 99 (100.0%) | 0 (0.0%) |
Income Below Poverty Among Single-Parent Households in Beallsville borough
According to the poverty data in Beallsville borough, 33.3% or 1 single-father households and 8.0% or 2 single-mother households are living below the poverty line. Among single-father households, those with 1 or 2 children have the highest poverty rate, with 1 households (100.0%) experiencing poverty. Likewise, among single-mother households, those with no children have the highest poverty rate, with 2 households (8.7%) falling below the poverty line.
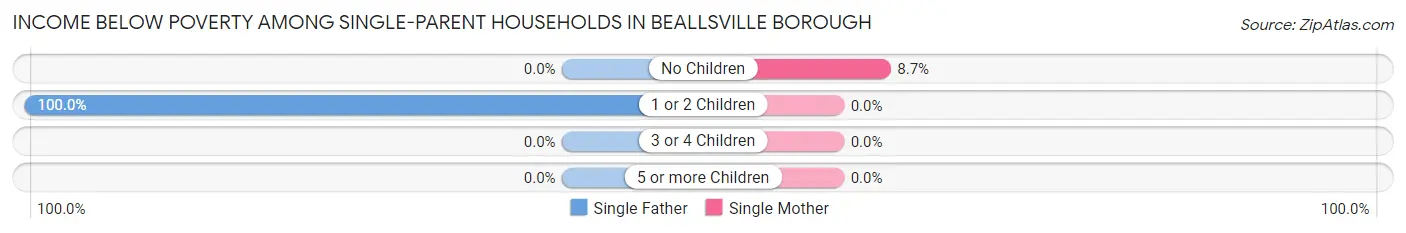
| Children | Single Father | Single Mother |
| No Children | 0 (0.0%) | 2 (8.7%) |
| 1 or 2 Children | 1 (100.0%) | 0 (0.0%) |
| 3 or 4 Children | 0 (0.0%) | 0 (0.0%) |
| 5 or more Children | 0 (0.0%) | 0 (0.0%) |
| Total | 1 (33.3%) | 2 (8.0%) |
Income Below Poverty Among Married-Couple vs Single-Parent Households in Beallsville borough
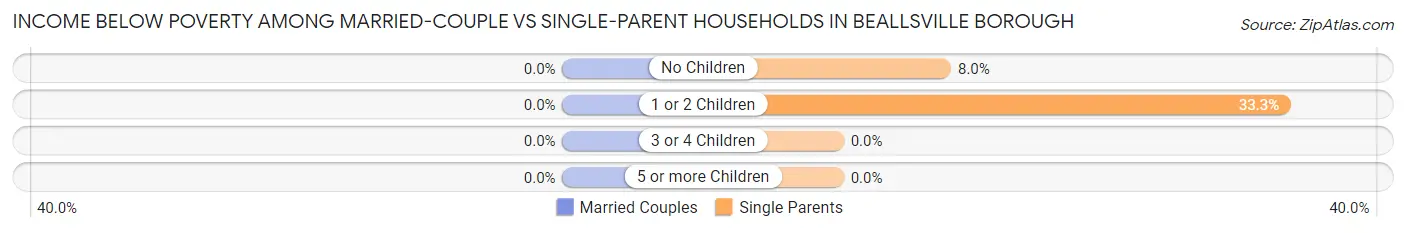
| Children | Married-Couple Families | Single-Parent Households |
| No Children | 0 (0.0%) | 2 (8.0%) |
| 1 or 2 Children | 0 (0.0%) | 1 (33.3%) |
| 3 or 4 Children | 0 (0.0%) | 0 (0.0%) |
| 5 or more Children | 0 (0.0%) | 0 (0.0%) |
| Total | 0 (0.0%) | 3 (10.7%) |
Race in Beallsville borough
The most populous races in Beallsville borough are White / Caucasian (410 | 92.8%), Two or more Races (26 | 5.9%), and Some other Race (5 | 1.1%).
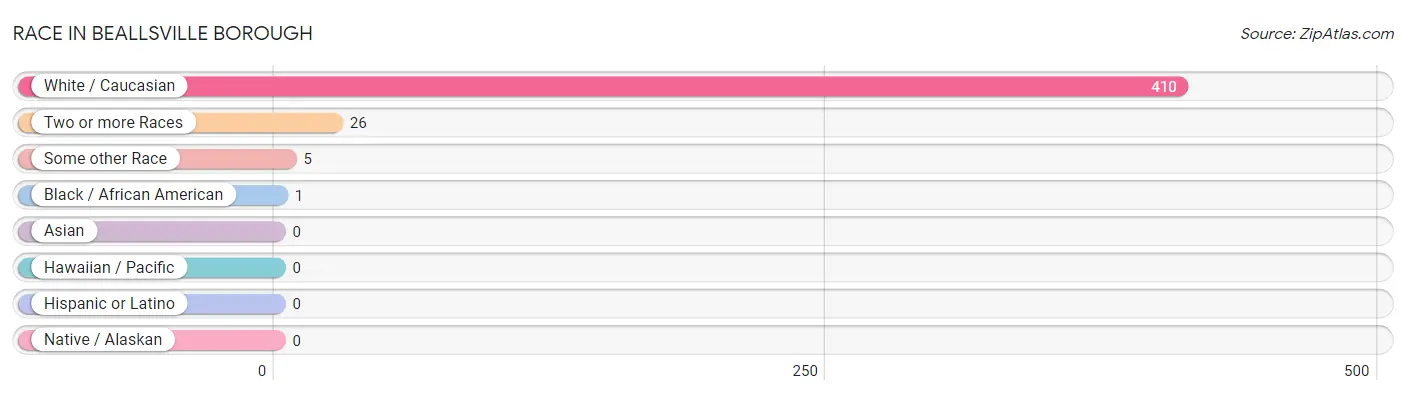
| Race | # Population | % Population |
| Asian | 0 | 0.0% |
| Black / African American | 1 | 0.2% |
| Hawaiian / Pacific | 0 | 0.0% |
| Hispanic or Latino | 0 | 0.0% |
| Native / Alaskan | 0 | 0.0% |
| White / Caucasian | 410 | 92.8% |
| Two or more Races | 26 | 5.9% |
| Some other Race | 5 | 1.1% |
| Total | 442 | 100.0% |
Ancestry in Beallsville borough
The most populous ancestries reported in Beallsville borough are German (118 | 26.7%), English (81 | 18.3%), Irish (59 | 13.4%), Scotch-Irish (54 | 12.2%), and Italian (49 | 11.1%), together accounting for 81.7% of all Beallsville borough residents.
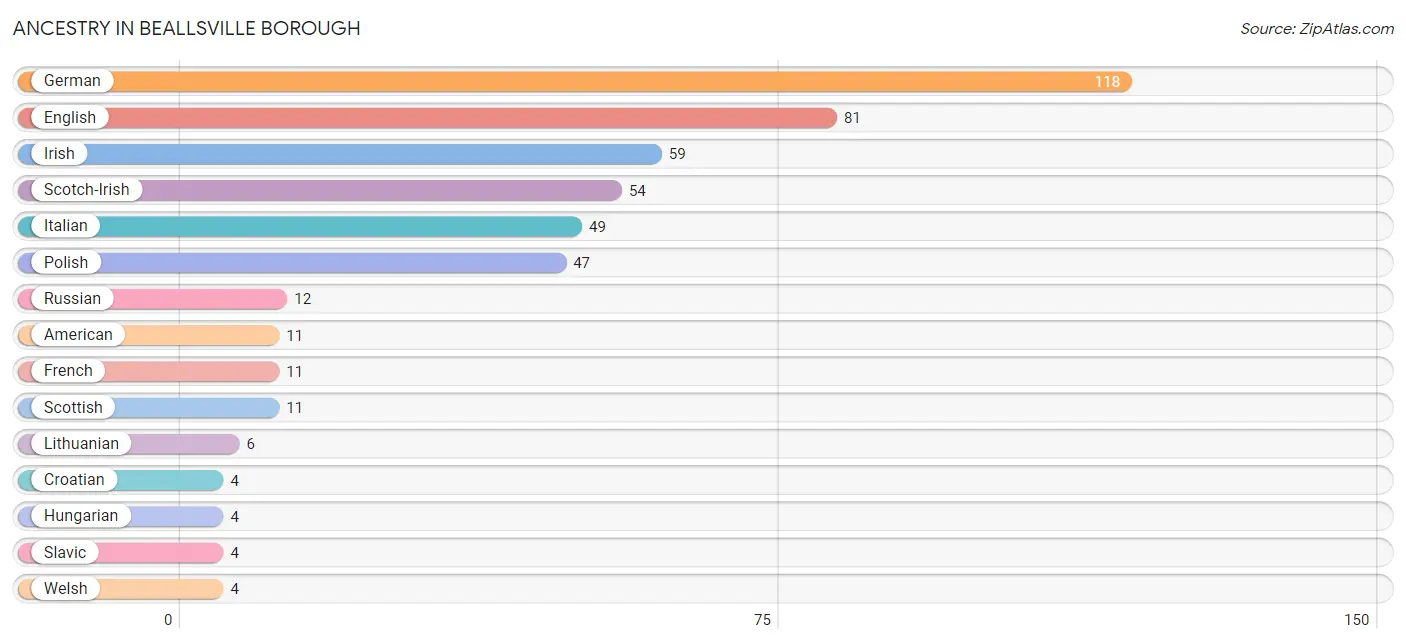
| Ancestry | # Population | % Population |
| American | 11 | 2.5% |
| Austrian | 3 | 0.7% |
| Croatian | 4 | 0.9% |
| Czech | 1 | 0.2% |
| Dutch | 3 | 0.7% |
| English | 81 | 18.3% |
| French | 11 | 2.5% |
| German | 118 | 26.7% |
| Hungarian | 4 | 0.9% |
| Irish | 59 | 13.4% |
| Italian | 49 | 11.1% |
| Lithuanian | 6 | 1.4% |
| Polish | 47 | 10.6% |
| Russian | 12 | 2.7% |
| Scotch-Irish | 54 | 12.2% |
| Scottish | 11 | 2.5% |
| Slavic | 4 | 0.9% |
| Slovak | 3 | 0.7% |
| Slovene | 1 | 0.2% |
| Swedish | 3 | 0.7% |
| Swiss | 1 | 0.2% |
| Ukrainian | 2 | 0.4% |
| Welsh | 4 | 0.9% | View All 23 Rows |
Immigrants in Beallsville borough

| Immigration Origin | # Population | % Population | View All 0 Rows |
Sex and Age in Beallsville borough
Sex and Age in Beallsville borough
The most populous age groups in Beallsville borough are 45 to 49 Years (42 | 17.6%) for men and 65 to 69 Years (31 | 15.3%) for women.
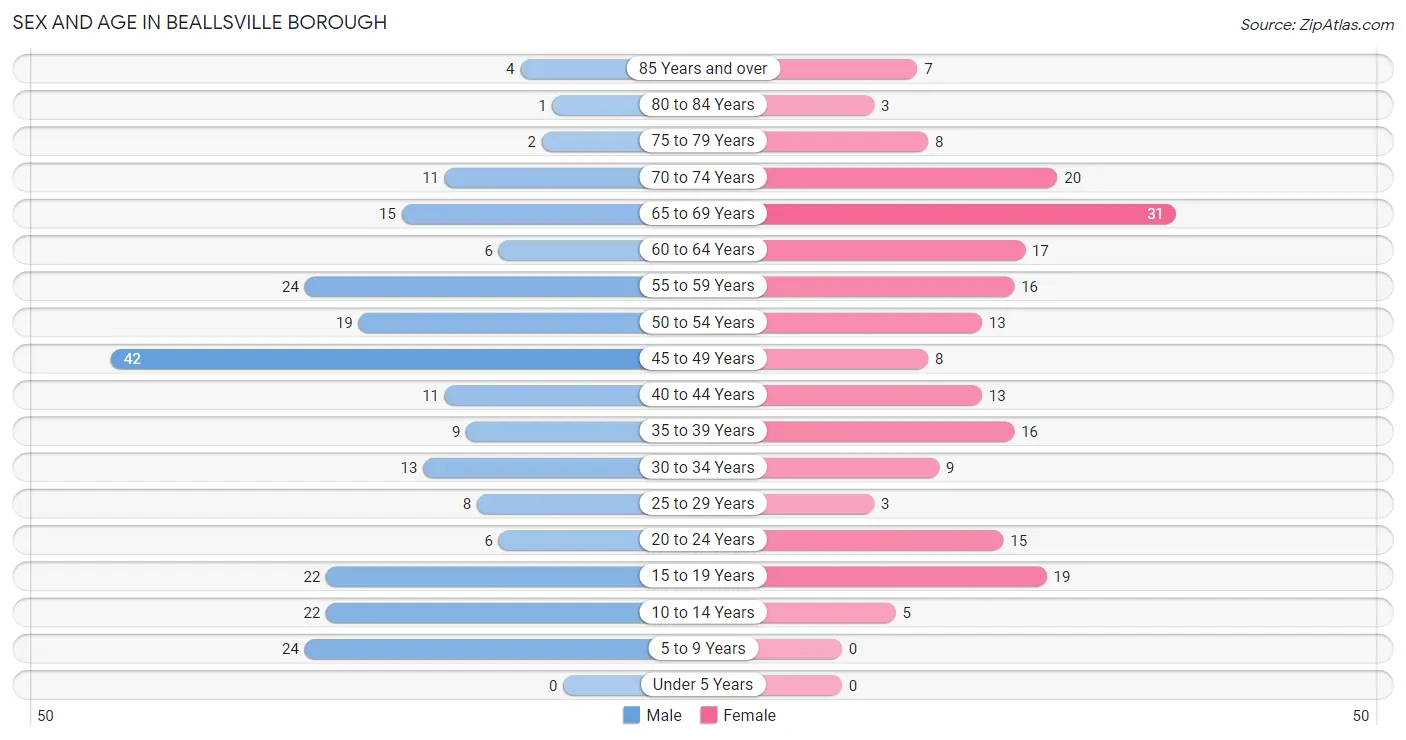
| Age Bracket | Male | Female |
| Under 5 Years | 0 (0.0%) | 0 (0.0%) |
| 5 to 9 Years | 24 (10.0%) | 0 (0.0%) |
| 10 to 14 Years | 22 (9.2%) | 5 (2.5%) |
| 15 to 19 Years | 22 (9.2%) | 19 (9.4%) |
| 20 to 24 Years | 6 (2.5%) | 15 (7.4%) |
| 25 to 29 Years | 8 (3.4%) | 3 (1.5%) |
| 30 to 34 Years | 13 (5.4%) | 9 (4.4%) |
| 35 to 39 Years | 9 (3.8%) | 16 (7.9%) |
| 40 to 44 Years | 11 (4.6%) | 13 (6.4%) |
| 45 to 49 Years | 42 (17.6%) | 8 (3.9%) |
| 50 to 54 Years | 19 (8.0%) | 13 (6.4%) |
| 55 to 59 Years | 24 (10.0%) | 16 (7.9%) |
| 60 to 64 Years | 6 (2.5%) | 17 (8.4%) |
| 65 to 69 Years | 15 (6.3%) | 31 (15.3%) |
| 70 to 74 Years | 11 (4.6%) | 20 (9.9%) |
| 75 to 79 Years | 2 (0.8%) | 8 (3.9%) |
| 80 to 84 Years | 1 (0.4%) | 3 (1.5%) |
| 85 Years and over | 4 (1.7%) | 7 (3.5%) |
| Total | 239 (100.0%) | 203 (100.0%) |
Families and Households in Beallsville borough
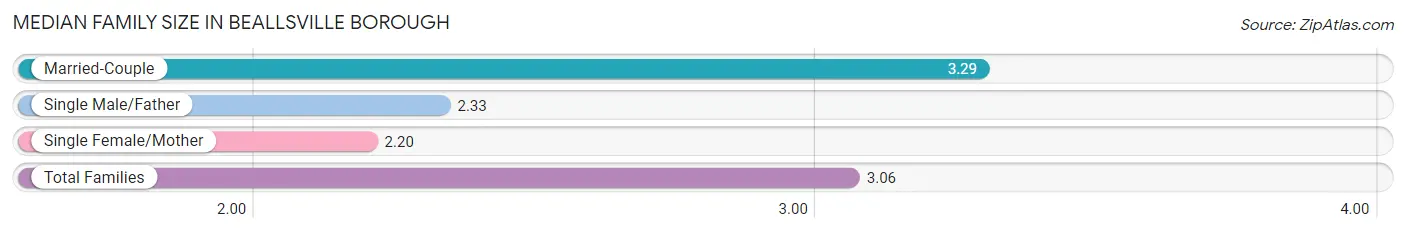
Median Family Size in Beallsville borough
The median family size in Beallsville borough is 3.06 persons per family, with married-couple families (99 | 77.9%) accounting for the largest median family size of 3.29 persons per family. On the other hand, single female/mother families (25 | 19.7%) represent the smallest median family size with 2.20 persons per family.
| Family Type | # Families | Family Size |
| Married-Couple | 99 (77.9%) | 3.29 |
| Single Male/Father | 3 (2.4%) | 2.33 |
| Single Female/Mother | 25 (19.7%) | 2.20 |
| Total Families | 127 (100.0%) | 3.06 |
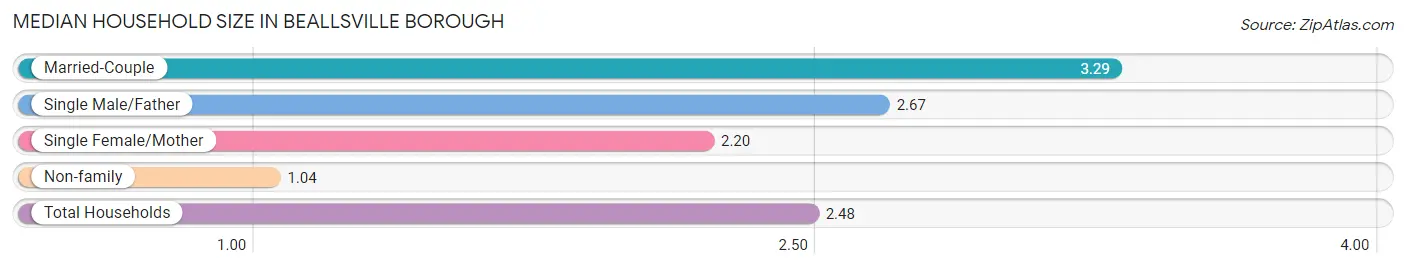
Median Household Size in Beallsville borough
The median household size in Beallsville borough is 2.48 persons per household, with married-couple households (99 | 55.6%) accounting for the largest median household size of 3.29 persons per household. non-family households (51 | 28.6%) represent the smallest median household size with 1.04 persons per household.
| Household Type | # Households | Household Size |
| Married-Couple | 99 (55.6%) | 3.29 |
| Single Male/Father | 3 (1.7%) | 2.67 |
| Single Female/Mother | 25 (14.0%) | 2.20 |
| Non-family | 51 (28.6%) | 1.04 |
| Total Households | 178 (100.0%) | 2.48 |
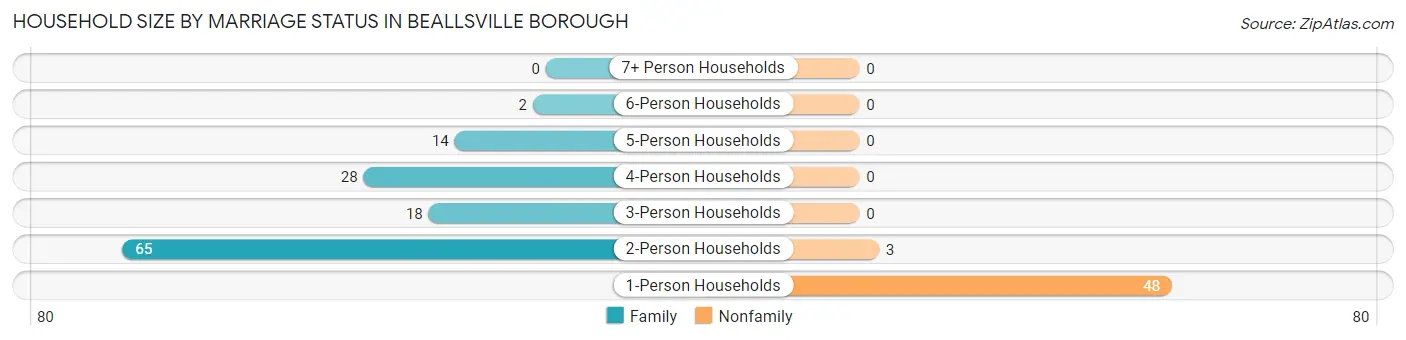
Household Size by Marriage Status in Beallsville borough
Out of a total of 178 households in Beallsville borough, 127 (71.4%) are family households, while 51 (28.6%) are nonfamily households. The most numerous type of family households are 2-person households, comprising 65, and the most common type of nonfamily households are 1-person households, comprising 48.
| Household Size | Family Households | Nonfamily Households |
| 1-Person Households | - | 48 (27.0%) |
| 2-Person Households | 65 (36.5%) | 3 (1.7%) |
| 3-Person Households | 18 (10.1%) | 0 (0.0%) |
| 4-Person Households | 28 (15.7%) | 0 (0.0%) |
| 5-Person Households | 14 (7.9%) | 0 (0.0%) |
| 6-Person Households | 2 (1.1%) | 0 (0.0%) |
| 7+ Person Households | 0 (0.0%) | 0 (0.0%) |
| Total | 127 (71.4%) | 51 (28.6%) |
Female Fertility in Beallsville borough
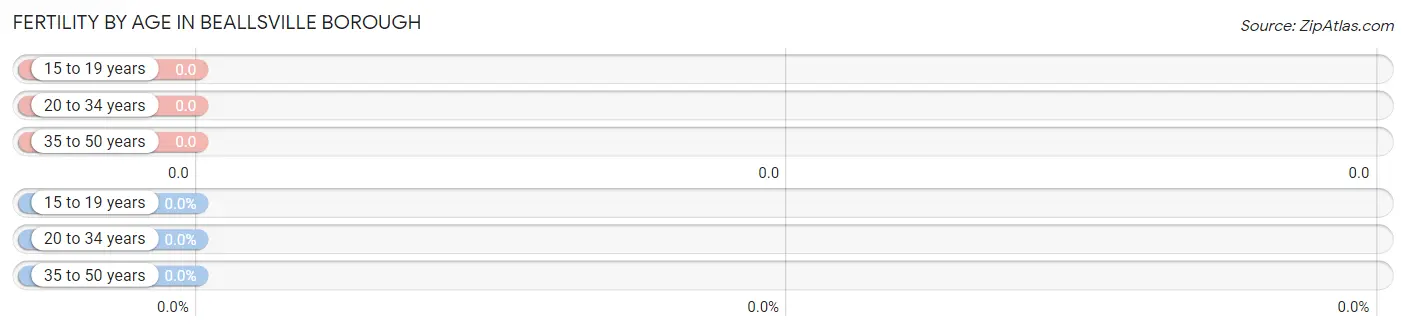
Fertility by Age in Beallsville borough
| Age Bracket | Women with Births | Births / 1,000 Women |
| 15 to 19 years | 0 (0.0%) | 0.0 |
| 20 to 34 years | 0 (0.0%) | 0.0 |
| 35 to 50 years | 0 (0.0%) | 0.0 |
| Total | 0 (0.0%) | 0.0 |
Fertility by Age by Marriage Status in Beallsville borough
| Age Bracket | Married | Unmarried |
| 15 to 19 years | 0 (0.0%) | 0 (0.0%) |
| 20 to 34 years | 0 (0.0%) | 0 (0.0%) |
| 35 to 50 years | 0 (0.0%) | 0 (0.0%) |
| Total | 0 (0.0%) | 0 (0.0%) |
Fertility by Education in Beallsville borough
| Educational Attainment | Women with Births | Births / 1,000 Women |
| Less than High School | 0 (0.0%) | 0.0 |
| High School Diploma | 0 (0.0%) | 0.0 |
| College or Associate's Degree | 0 (0.0%) | 0.0 |
| Bachelor's Degree | 0 (0.0%) | 0.0 |
| Graduate Degree | 0 (0.0%) | 0.0 |
| Total | 0 (0.0%) | 0.0 |
Fertility by Education by Marriage Status in Beallsville borough
| Educational Attainment | Married | Unmarried |
| Less than High School | 0 (0.0%) | 0 (0.0%) |
| High School Diploma | 0 (0.0%) | 0 (0.0%) |
| College or Associate's Degree | 0 (0.0%) | 0 (0.0%) |
| Bachelor's Degree | 0 (0.0%) | 0 (0.0%) |
| Graduate Degree | 0 (0.0%) | 0 (0.0%) |
| Total | 0 (0.0%) | 0 (0.0%) |
Employment Characteristics in Beallsville borough
Employment by Class of Employer in Beallsville borough
Among the 219 employed individuals in Beallsville borough, private company employees (164 | 74.9%), not-for-profit organizations (26 | 11.9%), and local government employees (11 | 5.0%) make up the most common classes of employment.
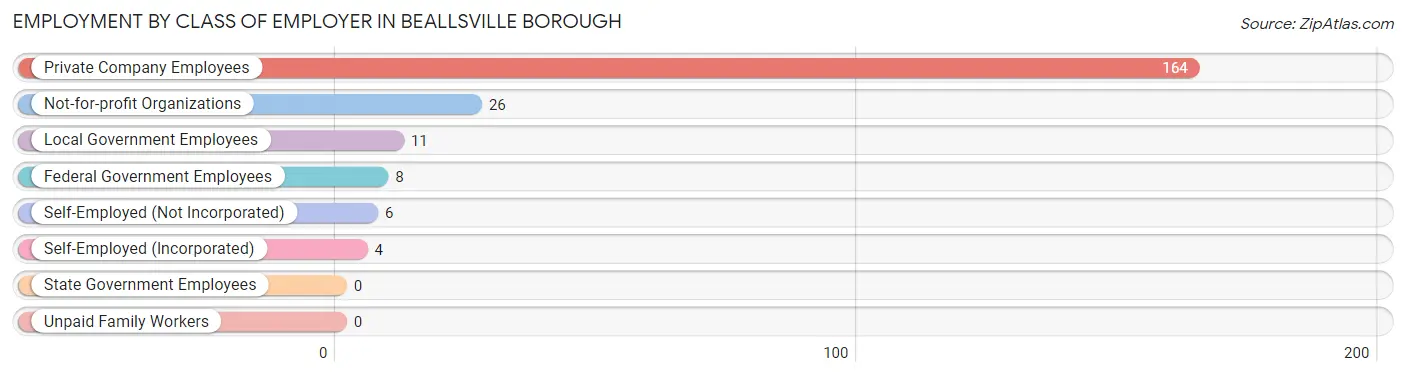
| Employer Class | # Employees | % Employees |
| Private Company Employees | 164 | 74.9% |
| Self-Employed (Incorporated) | 4 | 1.8% |
| Self-Employed (Not Incorporated) | 6 | 2.7% |
| Not-for-profit Organizations | 26 | 11.9% |
| Local Government Employees | 11 | 5.0% |
| State Government Employees | 0 | 0.0% |
| Federal Government Employees | 8 | 3.6% |
| Unpaid Family Workers | 0 | 0.0% |
| Total | 219 | 100.0% |
Employment Status by Age in Beallsville borough
According to the labor force statistics for Beallsville borough, out of the total population over 16 years of age (379), 62.8% or 238 individuals are in the labor force, with 7.1% or 17 of them unemployed. The age group with the highest labor force participation rate is 20 to 24 years, with 100.0% or 21 individuals in the labor force. Within the labor force, the 65 to 74 years age range has the highest percentage of unemployed individuals, with 20.0% or 5 of them being unemployed.
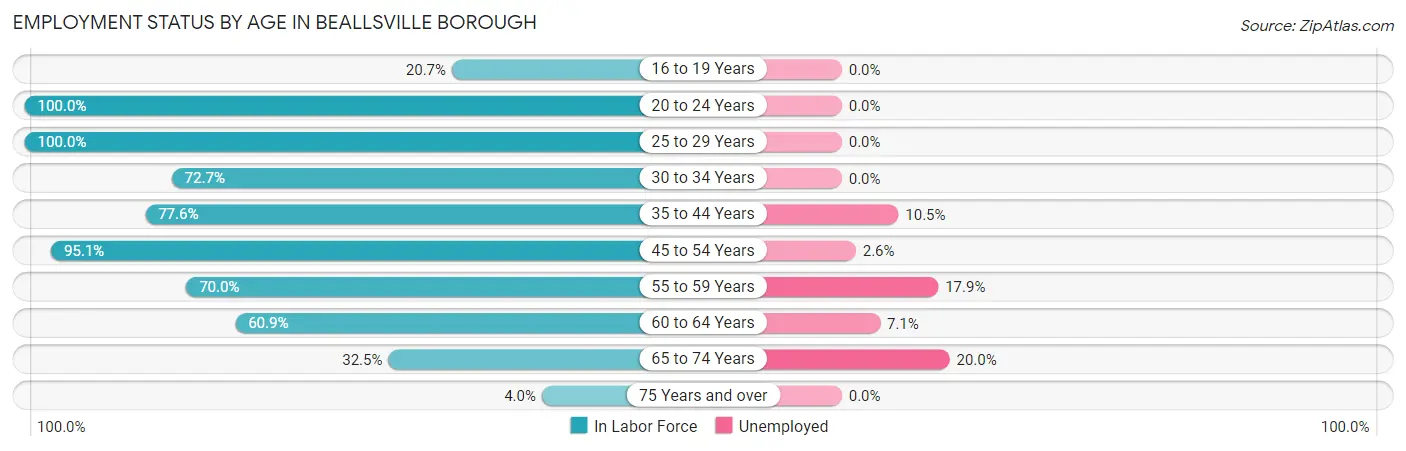
| Age Bracket | In Labor Force | Unemployed |
| 16 to 19 Years | 6 (20.7%) | 0 (0.0%) |
| 20 to 24 Years | 21 (100.0%) | 0 (0.0%) |
| 25 to 29 Years | 11 (100.0%) | 0 (0.0%) |
| 30 to 34 Years | 16 (72.7%) | 0 (0.0%) |
| 35 to 44 Years | 38 (77.6%) | 4 (10.5%) |
| 45 to 54 Years | 78 (95.1%) | 2 (2.6%) |
| 55 to 59 Years | 28 (70.0%) | 5 (17.9%) |
| 60 to 64 Years | 14 (60.9%) | 1 (7.1%) |
| 65 to 74 Years | 25 (32.5%) | 5 (20.0%) |
| 75 Years and over | 1 (4.0%) | 0 (0.0%) |
| Total | 238 (62.8%) | 17 (7.1%) |
Employment Status by Educational Attainment in Beallsville borough
According to labor force statistics for Beallsville borough, 81.5% of individuals (185) out of the total population between 25 and 64 years of age (227) are in the labor force, with 6.5% or 12 of them being unemployed. The group with the highest labor force participation rate are those with the educational attainment of bachelor's degree or higher, with 87.3% or 69 individuals in the labor force. Within the labor force, individuals with high school diploma education have the highest percentage of unemployment, with 11.8% or 8 of them being unemployed.
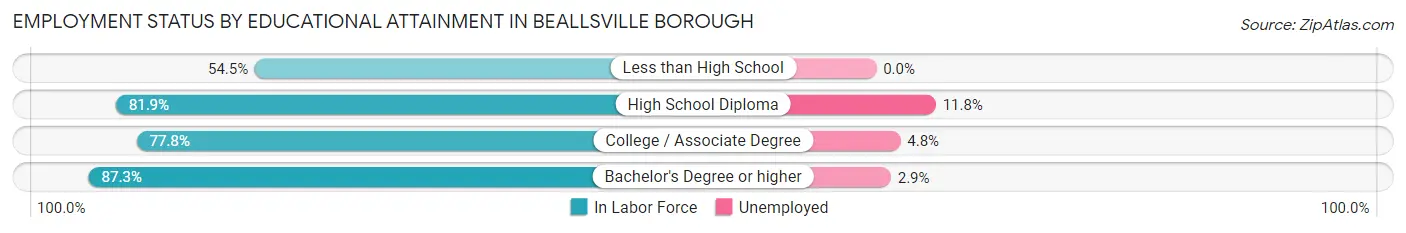
| Educational Attainment | In Labor Force | Unemployed |
| Less than High School | 6 (54.5%) | 0 (0.0%) |
| High School Diploma | 68 (81.9%) | 10 (11.8%) |
| College / Associate Degree | 42 (77.8%) | 3 (4.8%) |
| Bachelor's Degree or higher | 69 (87.3%) | 2 (2.9%) |
| Total | 185 (81.5%) | 15 (6.5%) |
Employment Occupations by Sex in Beallsville borough
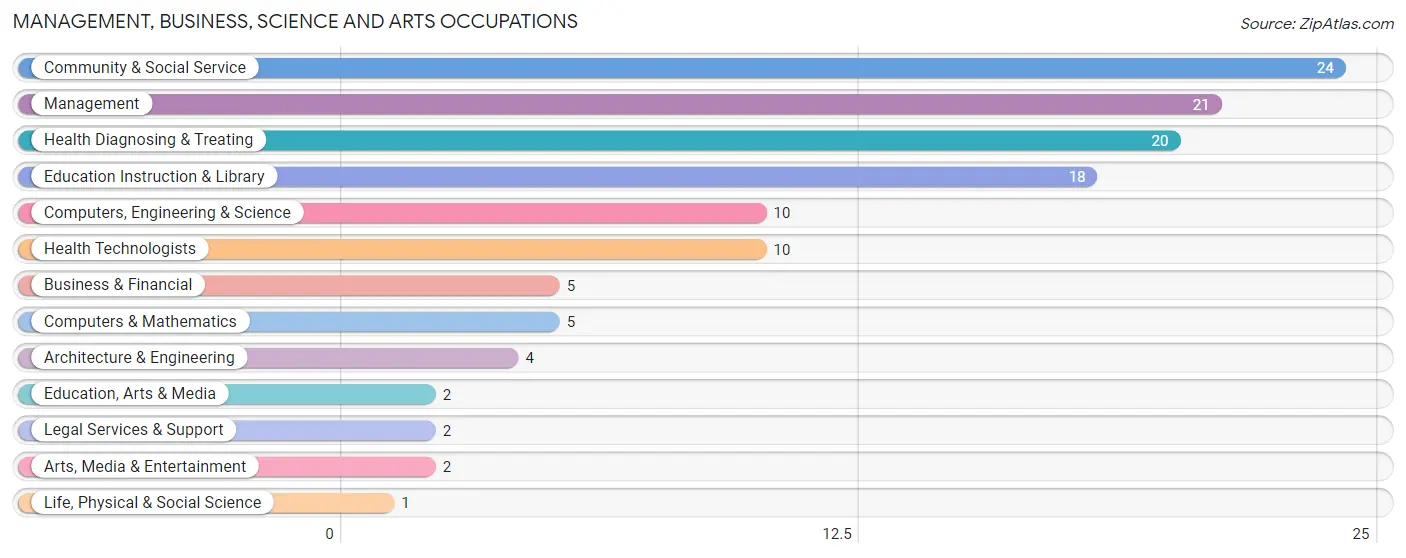
Management, Business, Science and Arts Occupations
The most common Management, Business, Science and Arts occupations in Beallsville borough are Community & Social Service (24 | 10.9%), Management (21 | 9.5%), Health Diagnosing & Treating (20 | 9.0%), Education Instruction & Library (18 | 8.1%), and Computers, Engineering & Science (10 | 4.5%).
Management, Business, Science and Arts Occupations by Sex
Within the Management, Business, Science and Arts occupations in Beallsville borough, the most male-oriented occupations are Business & Financial (100.0%), Computers, Engineering & Science (100.0%), and Computers & Mathematics (100.0%), while the most female-oriented occupations are Legal Services & Support (100.0%), Education Instruction & Library (100.0%), and Arts, Media & Entertainment (100.0%).
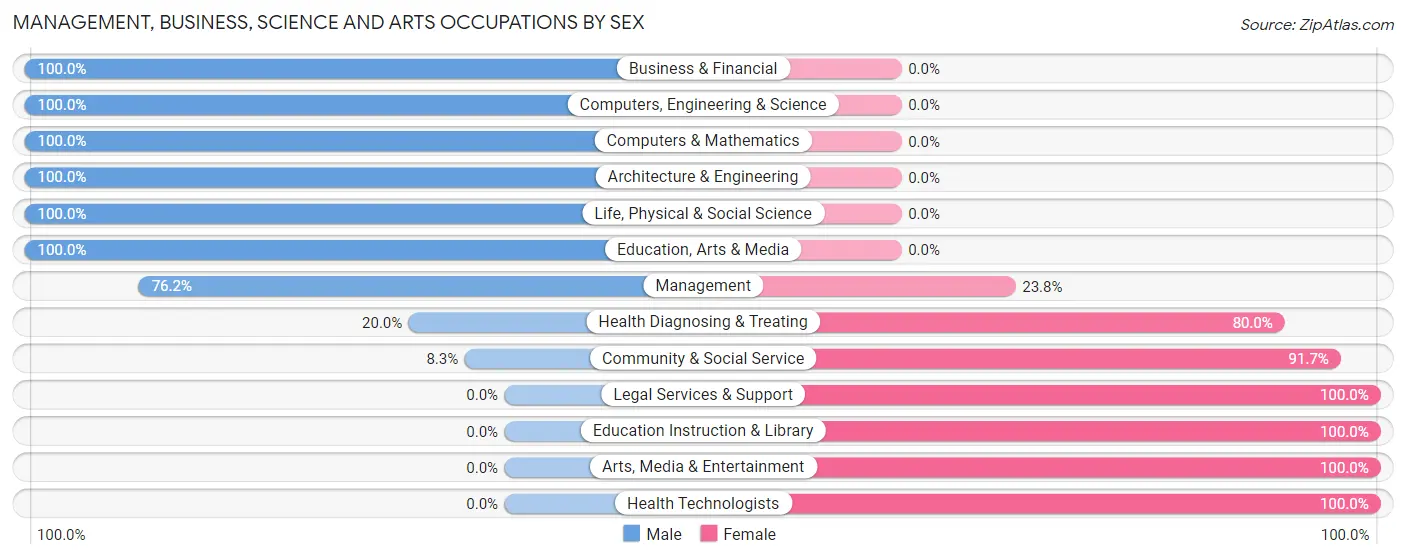
| Occupation | Male | Female |
| Management | 16 (76.2%) | 5 (23.8%) |
| Business & Financial | 5 (100.0%) | 0 (0.0%) |
| Computers, Engineering & Science | 10 (100.0%) | 0 (0.0%) |
| Computers & Mathematics | 5 (100.0%) | 0 (0.0%) |
| Architecture & Engineering | 4 (100.0%) | 0 (0.0%) |
| Life, Physical & Social Science | 1 (100.0%) | 0 (0.0%) |
| Community & Social Service | 2 (8.3%) | 22 (91.7%) |
| Education, Arts & Media | 2 (100.0%) | 0 (0.0%) |
| Legal Services & Support | 0 (0.0%) | 2 (100.0%) |
| Education Instruction & Library | 0 (0.0%) | 18 (100.0%) |
| Arts, Media & Entertainment | 0 (0.0%) | 2 (100.0%) |
| Health Diagnosing & Treating | 4 (20.0%) | 16 (80.0%) |
| Health Technologists | 0 (0.0%) | 10 (100.0%) |
| Total (Category) | 37 (46.3%) | 43 (53.7%) |
| Total (Overall) | 124 (56.1%) | 97 (43.9%) |
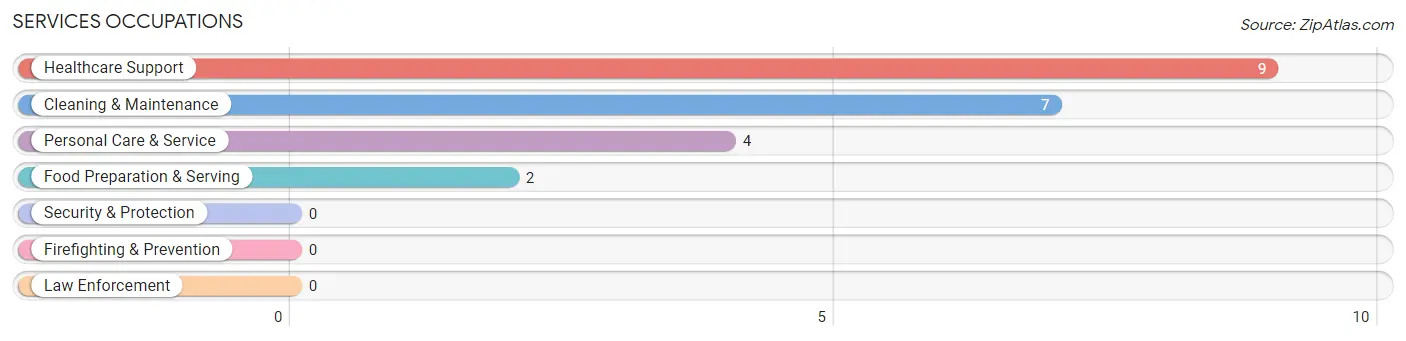
Services Occupations
The most common Services occupations in Beallsville borough are Healthcare Support (9 | 4.1%), Cleaning & Maintenance (7 | 3.2%), Personal Care & Service (4 | 1.8%), and Food Preparation & Serving (2 | 0.9%).
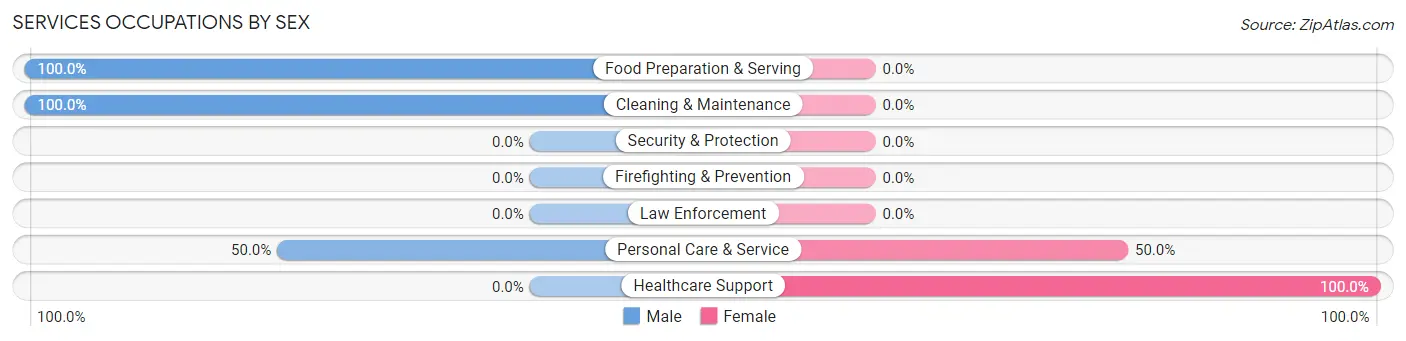
Services Occupations by Sex
Within the Services occupations in Beallsville borough, the most male-oriented occupations are Food Preparation & Serving (100.0%), Cleaning & Maintenance (100.0%), and Personal Care & Service (50.0%), while the most female-oriented occupations are Healthcare Support (100.0%), and Personal Care & Service (50.0%).
| Occupation | Male | Female |
| Healthcare Support | 0 (0.0%) | 9 (100.0%) |
| Security & Protection | 0 (0.0%) | 0 (0.0%) |
| Firefighting & Prevention | 0 (0.0%) | 0 (0.0%) |
| Law Enforcement | 0 (0.0%) | 0 (0.0%) |
| Food Preparation & Serving | 2 (100.0%) | 0 (0.0%) |
| Cleaning & Maintenance | 7 (100.0%) | 0 (0.0%) |
| Personal Care & Service | 2 (50.0%) | 2 (50.0%) |
| Total (Category) | 11 (50.0%) | 11 (50.0%) |
| Total (Overall) | 124 (56.1%) | 97 (43.9%) |
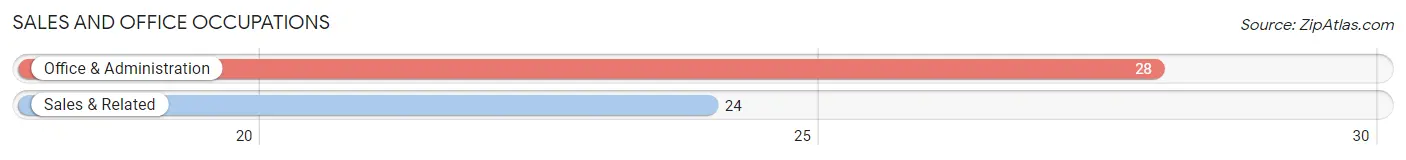
Sales and Office Occupations
The most common Sales and Office occupations in Beallsville borough are Office & Administration (28 | 12.7%), and Sales & Related (24 | 10.9%).
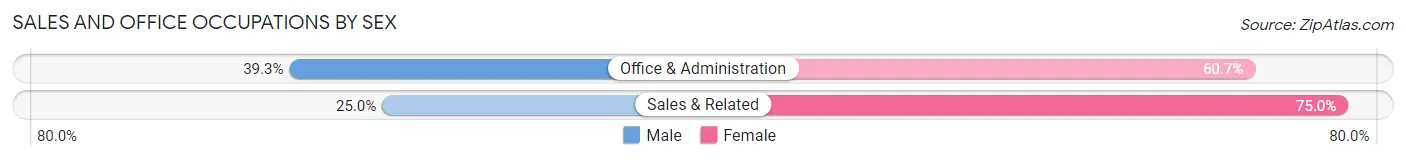
Sales and Office Occupations by Sex
| Occupation | Male | Female |
| Sales & Related | 6 (25.0%) | 18 (75.0%) |
| Office & Administration | 11 (39.3%) | 17 (60.7%) |
| Total (Category) | 17 (32.7%) | 35 (67.3%) |
| Total (Overall) | 124 (56.1%) | 97 (43.9%) |
Natural Resources, Construction and Maintenance Occupations
The most common Natural Resources, Construction and Maintenance occupations in Beallsville borough are Installation, Maintenance & Repair (30 | 13.6%), and Construction & Extraction (21 | 9.5%).
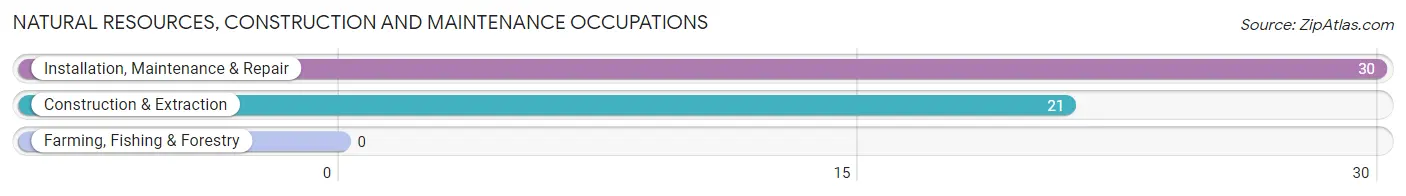
Natural Resources, Construction and Maintenance Occupations by Sex
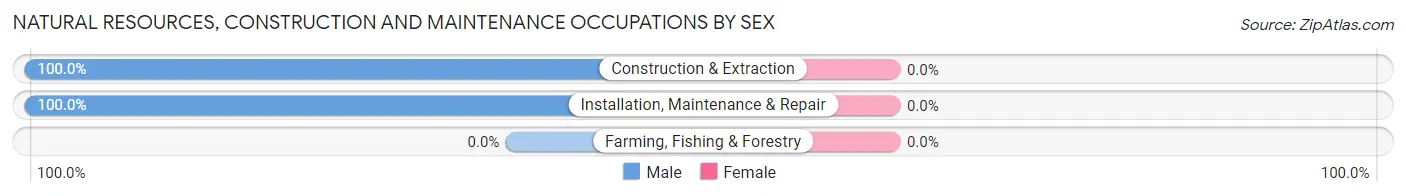
| Occupation | Male | Female |
| Farming, Fishing & Forestry | 0 (0.0%) | 0 (0.0%) |
| Construction & Extraction | 21 (100.0%) | 0 (0.0%) |
| Installation, Maintenance & Repair | 30 (100.0%) | 0 (0.0%) |
| Total (Category) | 51 (100.0%) | 0 (0.0%) |
| Total (Overall) | 124 (56.1%) | 97 (43.9%) |
Production, Transportation and Moving Occupations
The most common Production, Transportation and Moving occupations in Beallsville borough are Production (7 | 3.2%), Material Moving (7 | 3.2%), and Transportation (2 | 0.9%).
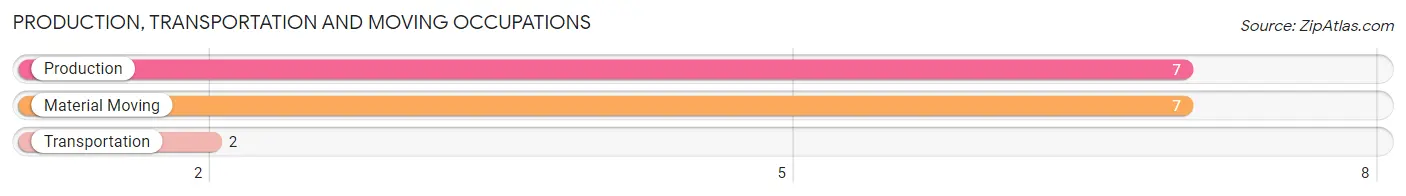
Production, Transportation and Moving Occupations by Sex
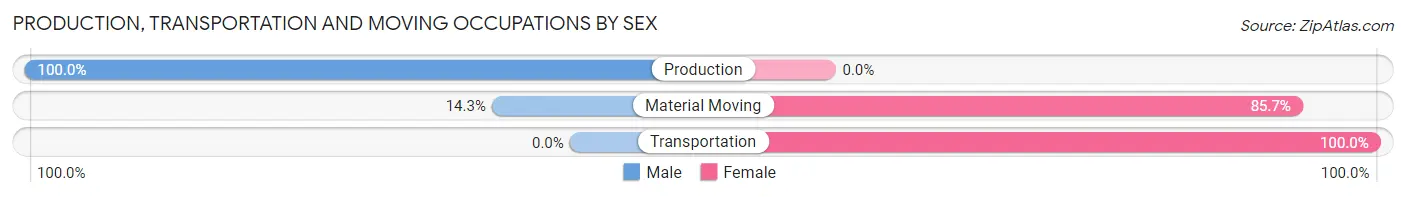
| Occupation | Male | Female |
| Production | 7 (100.0%) | 0 (0.0%) |
| Transportation | 0 (0.0%) | 2 (100.0%) |
| Material Moving | 1 (14.3%) | 6 (85.7%) |
| Total (Category) | 8 (50.0%) | 8 (50.0%) |
| Total (Overall) | 124 (56.1%) | 97 (43.9%) |
Employment Industries by Sex in Beallsville borough
Employment Industries in Beallsville borough
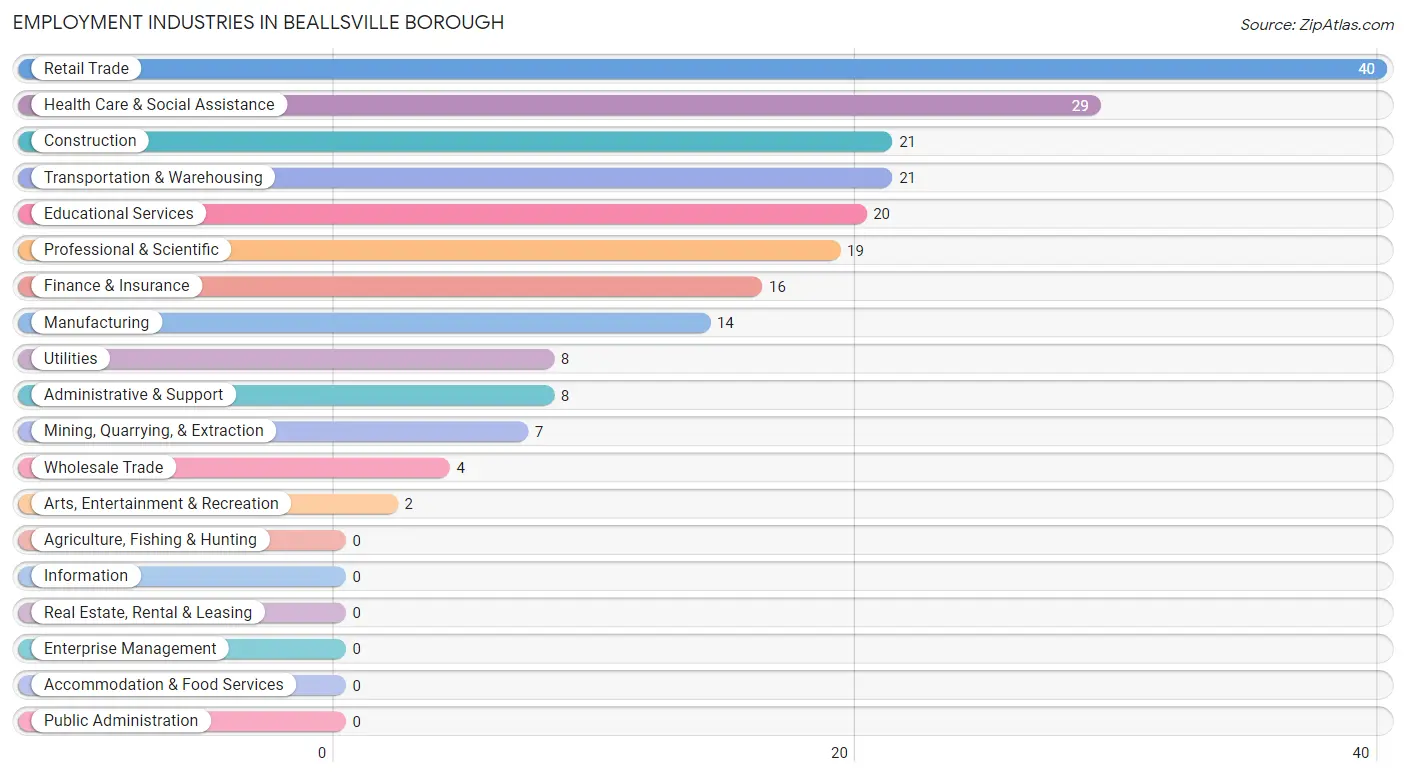
The major employment industries in Beallsville borough include Retail Trade (40 | 18.1%), Health Care & Social Assistance (29 | 13.1%), Construction (21 | 9.5%), Transportation & Warehousing (21 | 9.5%), and Educational Services (20 | 9.0%).
Employment Industries by Sex in Beallsville borough
The Beallsville borough industries that see more men than women are Mining, Quarrying, & Extraction (100.0%), Manufacturing (100.0%), and Utilities (100.0%), whereas the industries that tend to have a higher number of women are Educational Services (90.0%), Health Care & Social Assistance (72.4%), and Professional & Scientific (63.2%).

| Industry | Male | Female |
| Agriculture, Fishing & Hunting | 0 (0.0%) | 0 (0.0%) |
| Mining, Quarrying, & Extraction | 7 (100.0%) | 0 (0.0%) |
| Construction | 18 (85.7%) | 3 (14.3%) |
| Manufacturing | 14 (100.0%) | 0 (0.0%) |
| Wholesale Trade | 3 (75.0%) | 1 (25.0%) |
| Retail Trade | 15 (37.5%) | 25 (62.5%) |
| Transportation & Warehousing | 19 (90.5%) | 2 (9.5%) |
| Utilities | 8 (100.0%) | 0 (0.0%) |
| Information | 0 (0.0%) | 0 (0.0%) |
| Finance & Insurance | 7 (43.8%) | 9 (56.2%) |
| Real Estate, Rental & Leasing | 0 (0.0%) | 0 (0.0%) |
| Professional & Scientific | 7 (36.8%) | 12 (63.2%) |
| Enterprise Management | 0 (0.0%) | 0 (0.0%) |
| Administrative & Support | 7 (87.5%) | 1 (12.5%) |
| Educational Services | 2 (10.0%) | 18 (90.0%) |
| Health Care & Social Assistance | 8 (27.6%) | 21 (72.4%) |
| Arts, Entertainment & Recreation | 2 (100.0%) | 0 (0.0%) |
| Accommodation & Food Services | 0 (0.0%) | 0 (0.0%) |
| Public Administration | 0 (0.0%) | 0 (0.0%) |
| Total | 124 (56.1%) | 97 (43.9%) |
Education in Beallsville borough
School Enrollment in Beallsville borough
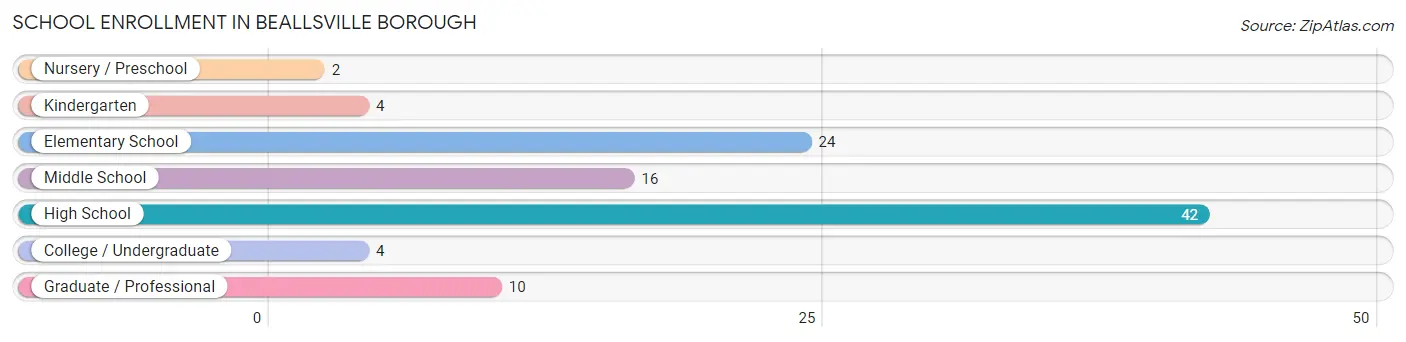
The most common levels of schooling among the 102 students in Beallsville borough are high school (42 | 41.2%), elementary school (24 | 23.5%), and middle school (16 | 15.7%).
| School Level | # Students | % Students |
| Nursery / Preschool | 2 | 2.0% |
| Kindergarten | 4 | 3.9% |
| Elementary School | 24 | 23.5% |
| Middle School | 16 | 15.7% |
| High School | 42 | 41.2% |
| College / Undergraduate | 4 | 3.9% |
| Graduate / Professional | 10 | 9.8% |
| Total | 102 | 100.0% |
School Enrollment by Age by Funding Source in Beallsville borough
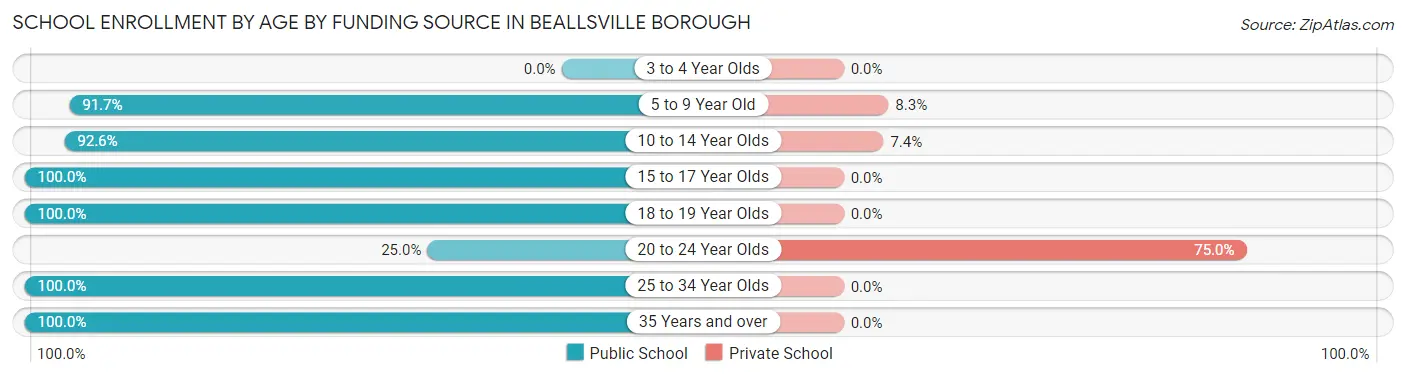
Out of a total of 102 students who are enrolled in schools in Beallsville borough, 10 (9.8%) attend a private institution, while the remaining 92 (90.2%) are enrolled in public schools. The age group of 20 to 24 year olds has the highest likelihood of being enrolled in private schools, with 6 (75.0% in the age bracket) enrolled. Conversely, the age group of 15 to 17 year olds has the lowest likelihood of being enrolled in a private school, with 35 (100.0% in the age bracket) attending a public institution.
| Age Bracket | Public School | Private School |
| 3 to 4 Year Olds | 0 (0.0%) | 0 (0.0%) |
| 5 to 9 Year Old | 22 (91.7%) | 2 (8.3%) |
| 10 to 14 Year Olds | 25 (92.6%) | 2 (7.4%) |
| 15 to 17 Year Olds | 35 (100.0%) | 0 (0.0%) |
| 18 to 19 Year Olds | 2 (100.0%) | 0 (0.0%) |
| 20 to 24 Year Olds | 2 (25.0%) | 6 (75.0%) |
| 25 to 34 Year Olds | 2 (100.0%) | 0 (0.0%) |
| 35 Years and over | 4 (100.0%) | 0 (0.0%) |
| Total | 92 (90.2%) | 10 (9.8%) |
Educational Attainment by Field of Study in Beallsville borough
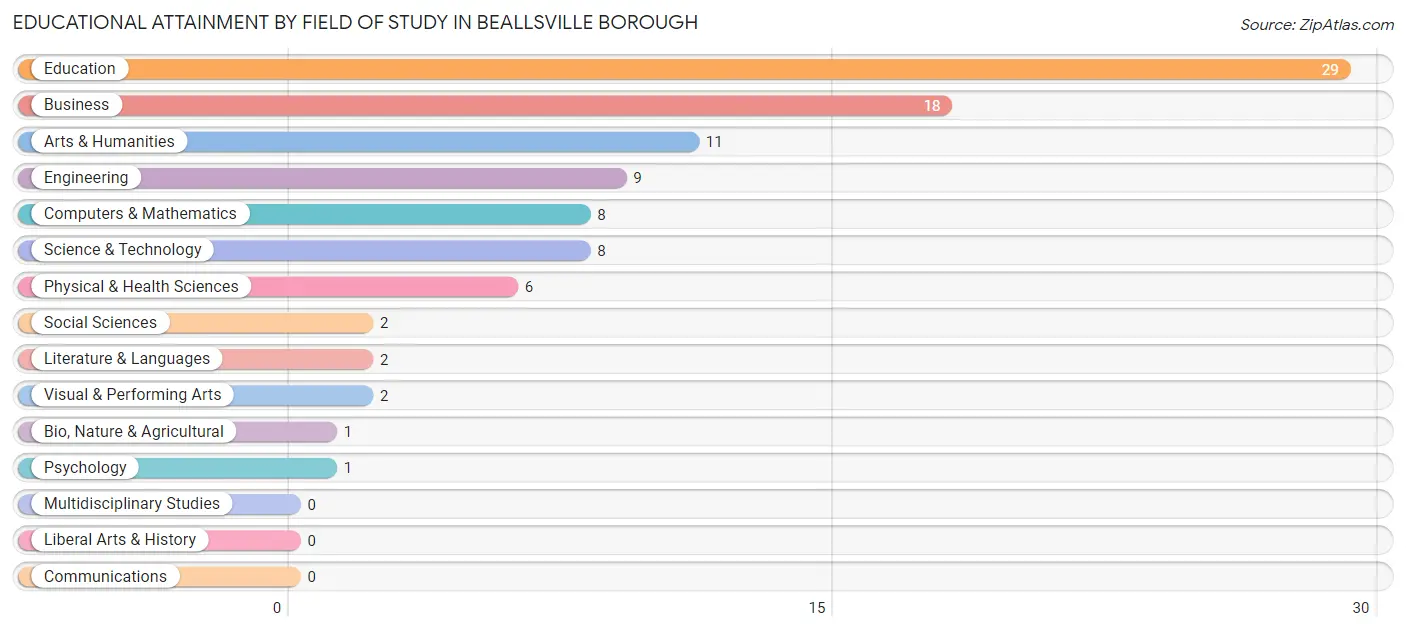
Education (29 | 29.9%), business (18 | 18.6%), arts & humanities (11 | 11.3%), engineering (9 | 9.3%), and computers & mathematics (8 | 8.3%) are the most common fields of study among 97 individuals in Beallsville borough who have obtained a bachelor's degree or higher.
| Field of Study | # Graduates | % Graduates |
| Computers & Mathematics | 8 | 8.3% |
| Bio, Nature & Agricultural | 1 | 1.0% |
| Physical & Health Sciences | 6 | 6.2% |
| Psychology | 1 | 1.0% |
| Social Sciences | 2 | 2.1% |
| Engineering | 9 | 9.3% |
| Multidisciplinary Studies | 0 | 0.0% |
| Science & Technology | 8 | 8.3% |
| Business | 18 | 18.6% |
| Education | 29 | 29.9% |
| Literature & Languages | 2 | 2.1% |
| Liberal Arts & History | 0 | 0.0% |
| Visual & Performing Arts | 2 | 2.1% |
| Communications | 0 | 0.0% |
| Arts & Humanities | 11 | 11.3% |
| Total | 97 | 100.0% |
Transportation & Commute in Beallsville borough
Vehicle Availability by Sex in Beallsville borough
The most prevalent vehicle ownership categories in Beallsville borough are males with 2 vehicles (41, accounting for 33.1%) and females with 2 vehicles (30, making up 43.2%).
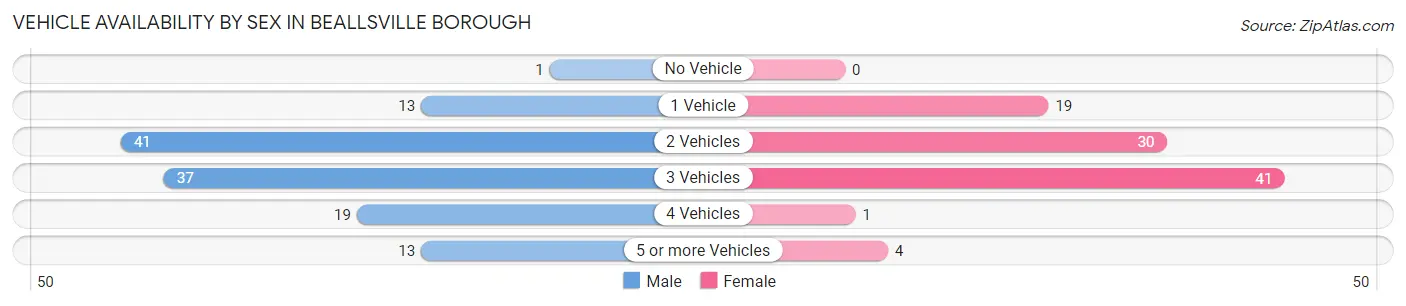
| Vehicles Available | Male | Female |
| No Vehicle | 1 (0.8%) | 0 (0.0%) |
| 1 Vehicle | 13 (10.5%) | 19 (20.0%) |
| 2 Vehicles | 41 (33.1%) | 30 (31.6%) |
| 3 Vehicles | 37 (29.8%) | 41 (43.2%) |
| 4 Vehicles | 19 (15.3%) | 1 (1.1%) |
| 5 or more Vehicles | 13 (10.5%) | 4 (4.2%) |
| Total | 124 (100.0%) | 95 (100.0%) |
Commute Time in Beallsville borough
The most frequently occuring commute durations in Beallsville borough are 30 to 34 minutes (53 commuters, 26.8%), 45 to 59 minutes (38 commuters, 19.2%), and 10 to 14 minutes (19 commuters, 9.6%).
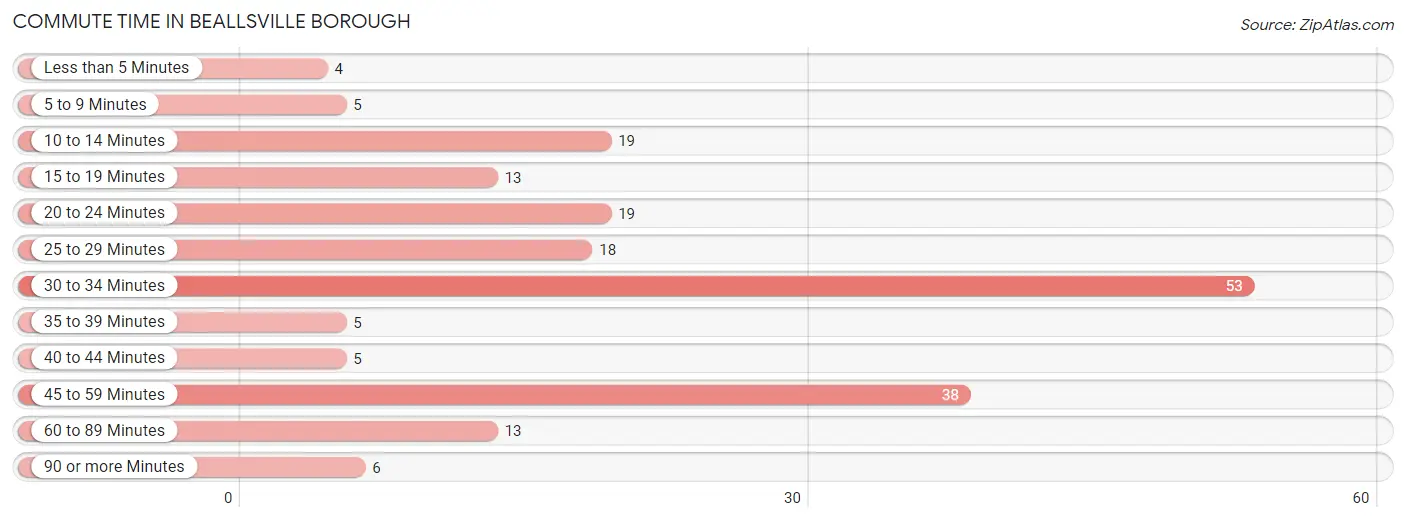
| Commute Time | # Commuters | % Commuters |
| Less than 5 Minutes | 4 | 2.0% |
| 5 to 9 Minutes | 5 | 2.5% |
| 10 to 14 Minutes | 19 | 9.6% |
| 15 to 19 Minutes | 13 | 6.6% |
| 20 to 24 Minutes | 19 | 9.6% |
| 25 to 29 Minutes | 18 | 9.1% |
| 30 to 34 Minutes | 53 | 26.8% |
| 35 to 39 Minutes | 5 | 2.5% |
| 40 to 44 Minutes | 5 | 2.5% |
| 45 to 59 Minutes | 38 | 19.2% |
| 60 to 89 Minutes | 13 | 6.6% |
| 90 or more Minutes | 6 | 3.0% |
Commute Time by Sex in Beallsville borough
The most common commute times in Beallsville borough are 45 to 59 minutes (36 commuters, 31.0%) for males and 30 to 34 minutes (22 commuters, 26.8%) for females.
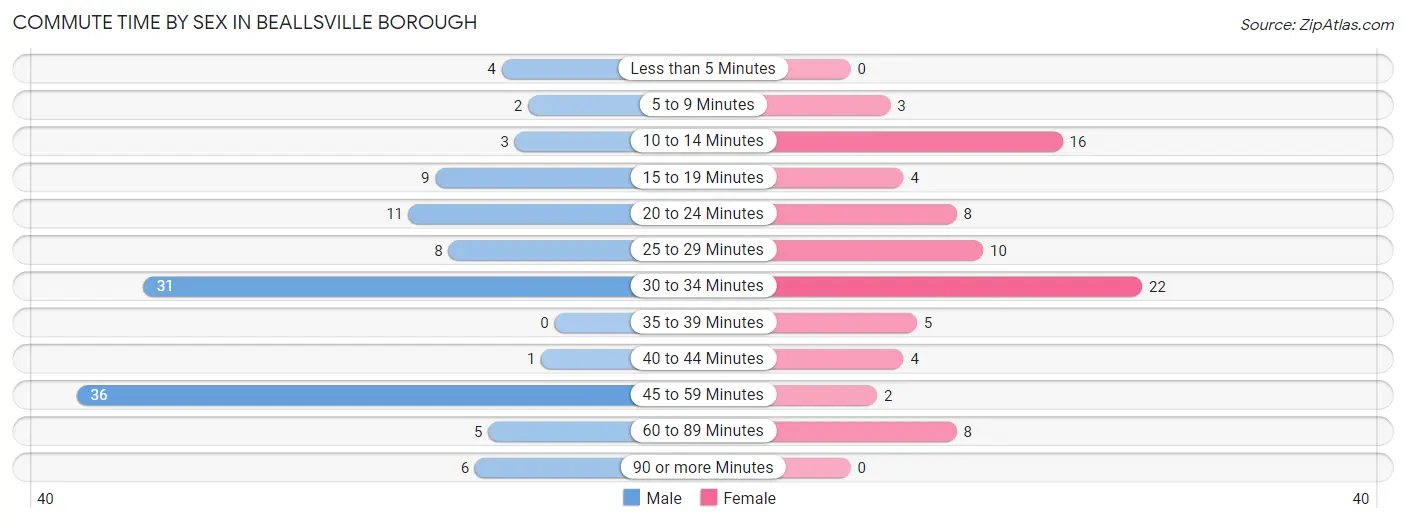
| Commute Time | Male | Female |
| Less than 5 Minutes | 4 (3.5%) | 0 (0.0%) |
| 5 to 9 Minutes | 2 (1.7%) | 3 (3.7%) |
| 10 to 14 Minutes | 3 (2.6%) | 16 (19.5%) |
| 15 to 19 Minutes | 9 (7.8%) | 4 (4.9%) |
| 20 to 24 Minutes | 11 (9.5%) | 8 (9.8%) |
| 25 to 29 Minutes | 8 (6.9%) | 10 (12.2%) |
| 30 to 34 Minutes | 31 (26.7%) | 22 (26.8%) |
| 35 to 39 Minutes | 0 (0.0%) | 5 (6.1%) |
| 40 to 44 Minutes | 1 (0.9%) | 4 (4.9%) |
| 45 to 59 Minutes | 36 (31.0%) | 2 (2.4%) |
| 60 to 89 Minutes | 5 (4.3%) | 8 (9.8%) |
| 90 or more Minutes | 6 (5.2%) | 0 (0.0%) |
Time of Departure to Work by Sex in Beallsville borough
The most frequent times of departure to work in Beallsville borough are 7:00 AM to 7:29 AM (23, 19.8%) for males and 12:00 PM to 3:59 PM (19, 23.2%) for females.
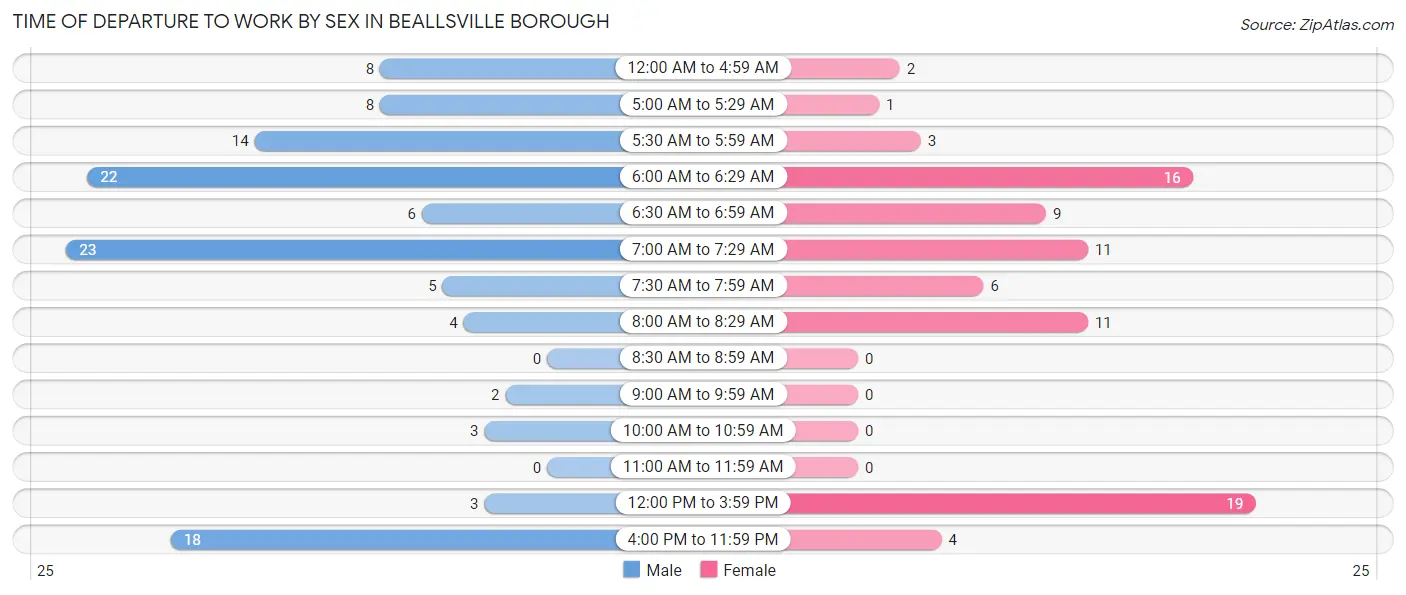
| Time of Departure | Male | Female |
| 12:00 AM to 4:59 AM | 8 (6.9%) | 2 (2.4%) |
| 5:00 AM to 5:29 AM | 8 (6.9%) | 1 (1.2%) |
| 5:30 AM to 5:59 AM | 14 (12.1%) | 3 (3.7%) |
| 6:00 AM to 6:29 AM | 22 (19.0%) | 16 (19.5%) |
| 6:30 AM to 6:59 AM | 6 (5.2%) | 9 (11.0%) |
| 7:00 AM to 7:29 AM | 23 (19.8%) | 11 (13.4%) |
| 7:30 AM to 7:59 AM | 5 (4.3%) | 6 (7.3%) |
| 8:00 AM to 8:29 AM | 4 (3.5%) | 11 (13.4%) |
| 8:30 AM to 8:59 AM | 0 (0.0%) | 0 (0.0%) |
| 9:00 AM to 9:59 AM | 2 (1.7%) | 0 (0.0%) |
| 10:00 AM to 10:59 AM | 3 (2.6%) | 0 (0.0%) |
| 11:00 AM to 11:59 AM | 0 (0.0%) | 0 (0.0%) |
| 12:00 PM to 3:59 PM | 3 (2.6%) | 19 (23.2%) |
| 4:00 PM to 11:59 PM | 18 (15.5%) | 4 (4.9%) |
| Total | 116 (100.0%) | 82 (100.0%) |
Housing Occupancy in Beallsville borough
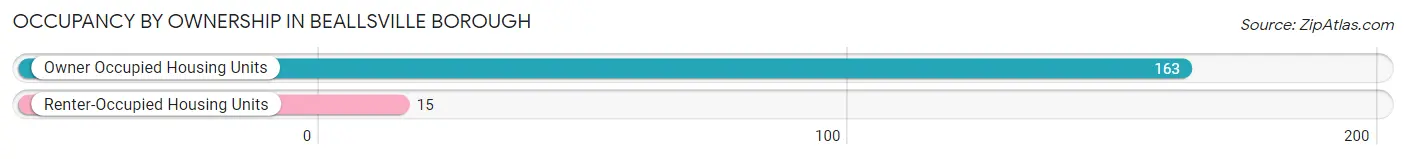
Occupancy by Ownership in Beallsville borough
Of the total 178 dwellings in Beallsville borough, owner-occupied units account for 163 (91.6%), while renter-occupied units make up 15 (8.4%).
| Occupancy | # Housing Units | % Housing Units |
| Owner Occupied Housing Units | 163 | 91.6% |
| Renter-Occupied Housing Units | 15 | 8.4% |
| Total Occupied Housing Units | 178 | 100.0% |
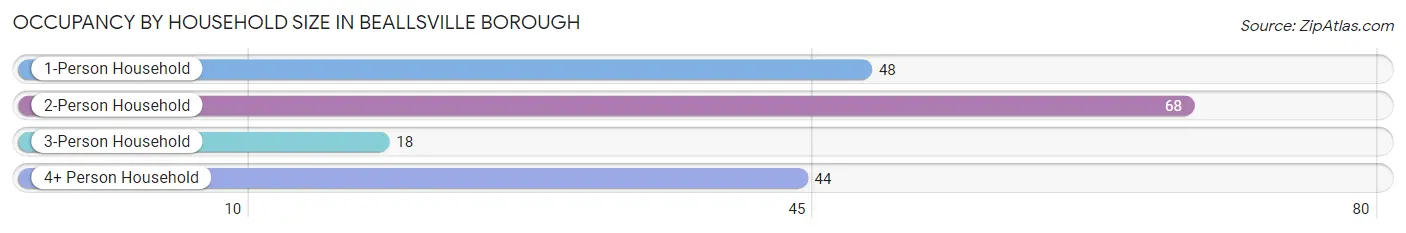
Occupancy by Household Size in Beallsville borough
| Household Size | # Housing Units | % Housing Units |
| 1-Person Household | 48 | 27.0% |
| 2-Person Household | 68 | 38.2% |
| 3-Person Household | 18 | 10.1% |
| 4+ Person Household | 44 | 24.7% |
| Total Housing Units | 178 | 100.0% |
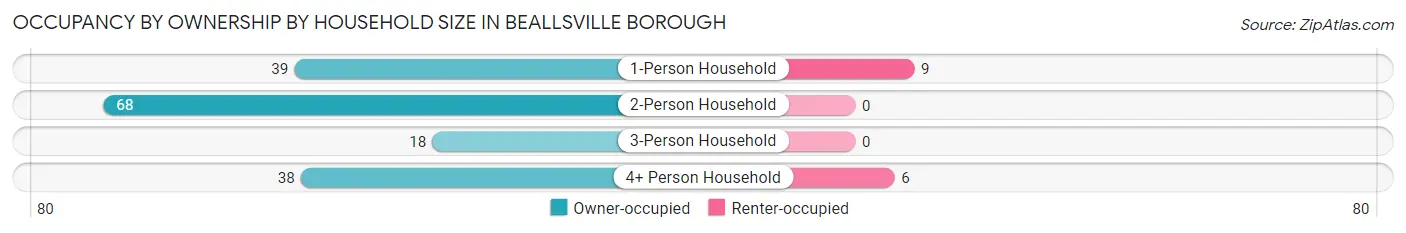
Occupancy by Ownership by Household Size in Beallsville borough
| Household Size | Owner-occupied | Renter-occupied |
| 1-Person Household | 39 (81.2%) | 9 (18.8%) |
| 2-Person Household | 68 (100.0%) | 0 (0.0%) |
| 3-Person Household | 18 (100.0%) | 0 (0.0%) |
| 4+ Person Household | 38 (86.4%) | 6 (13.6%) |
| Total Housing Units | 163 (91.6%) | 15 (8.4%) |
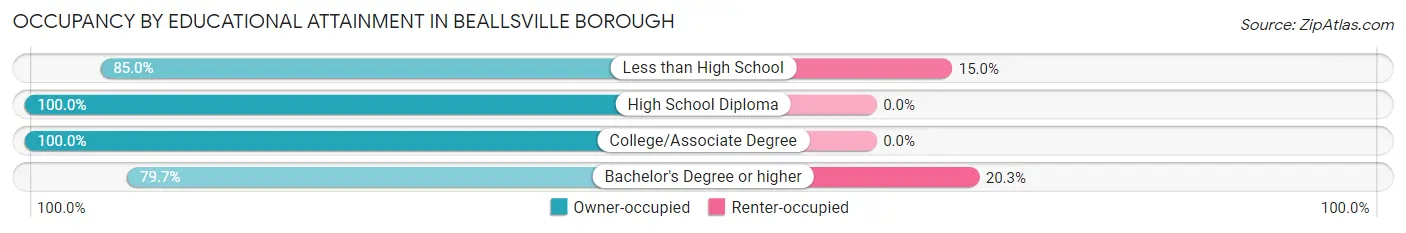
Occupancy by Educational Attainment in Beallsville borough
| Household Size | Owner-occupied | Renter-occupied |
| Less than High School | 17 (85.0%) | 3 (15.0%) |
| High School Diploma | 50 (100.0%) | 0 (0.0%) |
| College/Associate Degree | 49 (100.0%) | 0 (0.0%) |
| Bachelor's Degree or higher | 47 (79.7%) | 12 (20.3%) |
Occupancy by Age of Householder in Beallsville borough
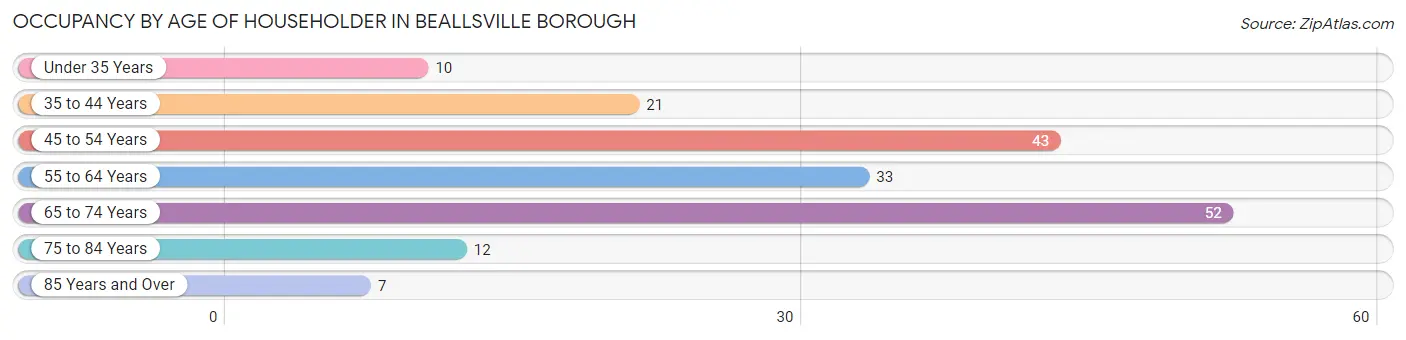
| Age Bracket | # Households | % Households |
| Under 35 Years | 10 | 5.6% |
| 35 to 44 Years | 21 | 11.8% |
| 45 to 54 Years | 43 | 24.2% |
| 55 to 64 Years | 33 | 18.5% |
| 65 to 74 Years | 52 | 29.2% |
| 75 to 84 Years | 12 | 6.7% |
| 85 Years and Over | 7 | 3.9% |
| Total | 178 | 100.0% |
Housing Finances in Beallsville borough
Median Income by Occupancy in Beallsville borough
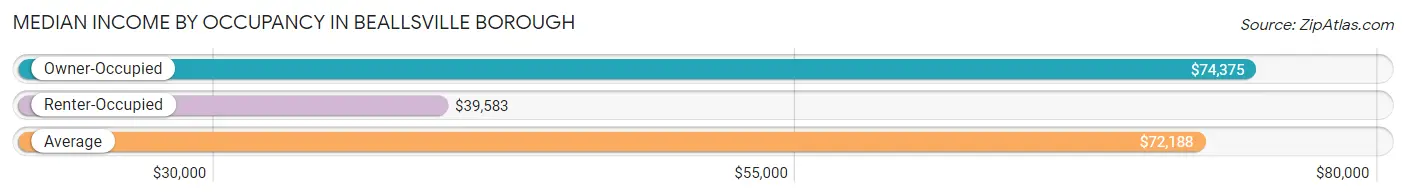
| Occupancy Type | # Households | Median Income |
| Owner-Occupied | 163 (91.6%) | $74,375 |
| Renter-Occupied | 15 (8.4%) | $39,583 |
| Average | 178 (100.0%) | $72,188 |
Occupancy by Householder Income Bracket in Beallsville borough
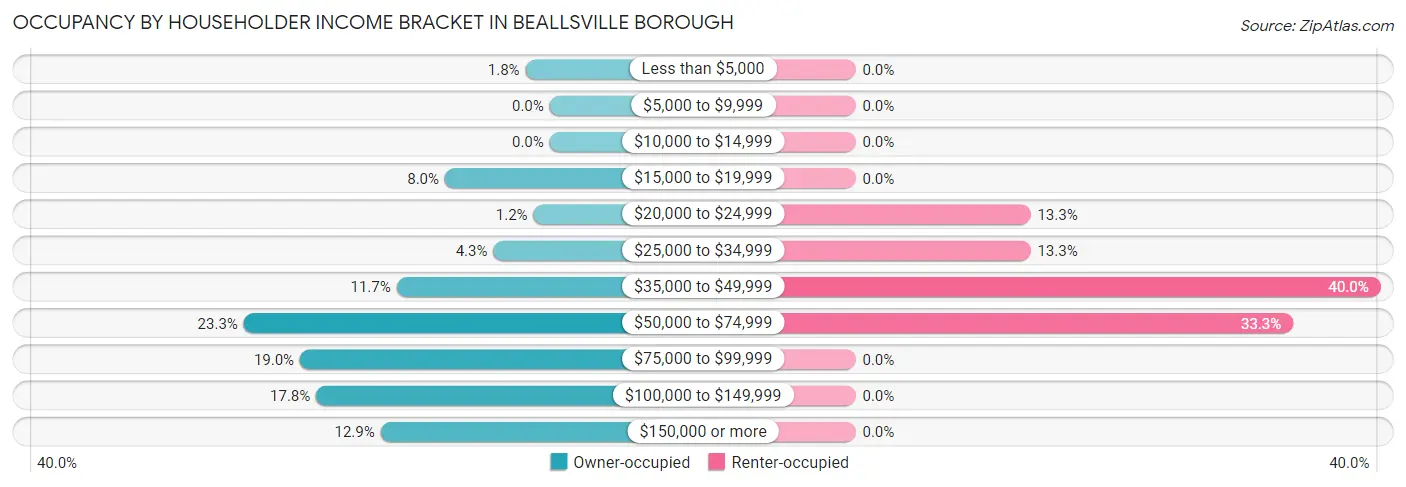
| Income Bracket | Owner-occupied | Renter-occupied |
| Less than $5,000 | 3 (1.8%) | 0 (0.0%) |
| $5,000 to $9,999 | 0 (0.0%) | 0 (0.0%) |
| $10,000 to $14,999 | 0 (0.0%) | 0 (0.0%) |
| $15,000 to $19,999 | 13 (8.0%) | 0 (0.0%) |
| $20,000 to $24,999 | 2 (1.2%) | 2 (13.3%) |
| $25,000 to $34,999 | 7 (4.3%) | 2 (13.3%) |
| $35,000 to $49,999 | 19 (11.7%) | 6 (40.0%) |
| $50,000 to $74,999 | 38 (23.3%) | 5 (33.3%) |
| $75,000 to $99,999 | 31 (19.0%) | 0 (0.0%) |
| $100,000 to $149,999 | 29 (17.8%) | 0 (0.0%) |
| $150,000 or more | 21 (12.9%) | 0 (0.0%) |
| Total | 163 (100.0%) | 15 (100.0%) |
Monthly Housing Cost Tiers in Beallsville borough
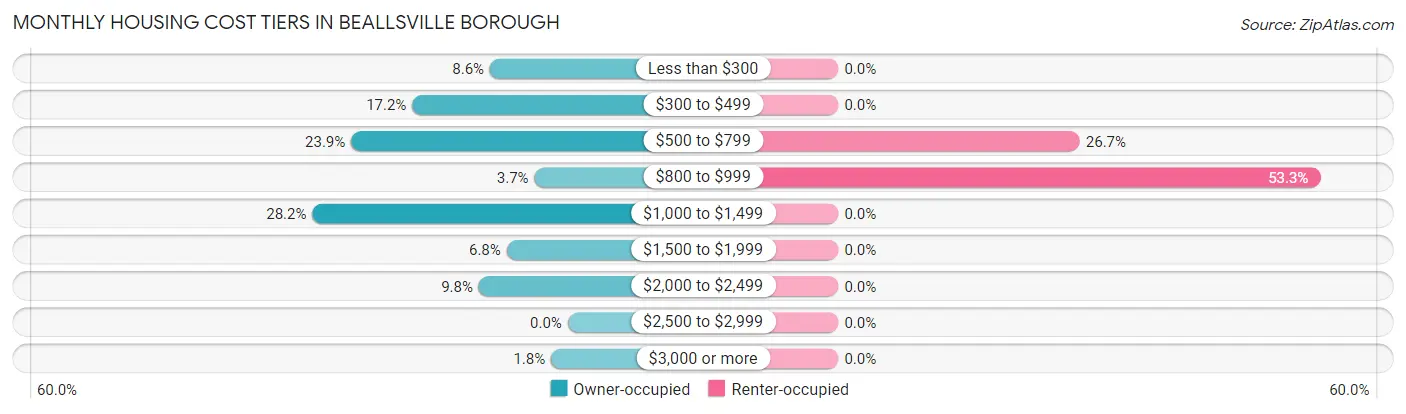
| Monthly Cost | Owner-occupied | Renter-occupied |
| Less than $300 | 14 (8.6%) | 0 (0.0%) |
| $300 to $499 | 28 (17.2%) | 0 (0.0%) |
| $500 to $799 | 39 (23.9%) | 4 (26.7%) |
| $800 to $999 | 6 (3.7%) | 8 (53.3%) |
| $1,000 to $1,499 | 46 (28.2%) | 0 (0.0%) |
| $1,500 to $1,999 | 11 (6.8%) | 0 (0.0%) |
| $2,000 to $2,499 | 16 (9.8%) | 0 (0.0%) |
| $2,500 to $2,999 | 0 (0.0%) | 0 (0.0%) |
| $3,000 or more | 3 (1.8%) | 0 (0.0%) |
| Total | 163 (100.0%) | 15 (100.0%) |
Physical Housing Characteristics in Beallsville borough
Housing Structures in Beallsville borough
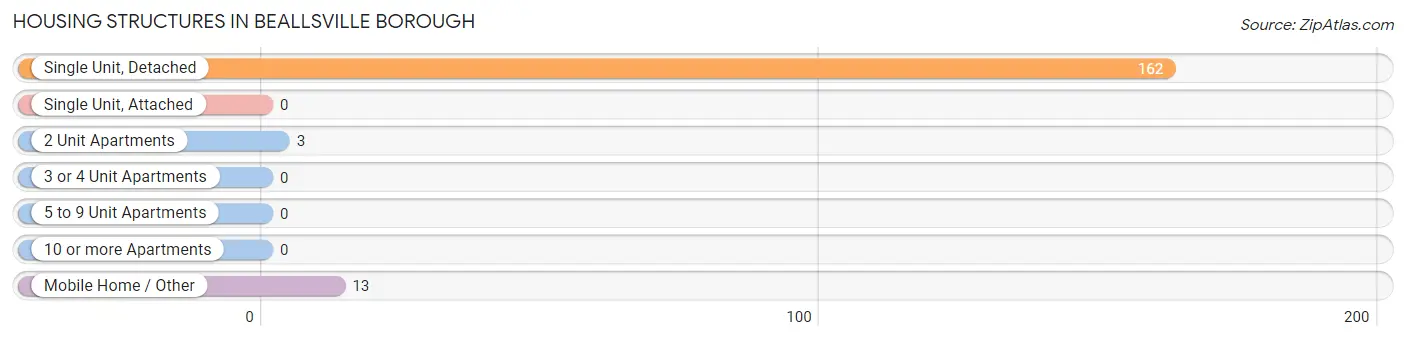
| Structure Type | # Housing Units | % Housing Units |
| Single Unit, Detached | 162 | 91.0% |
| Single Unit, Attached | 0 | 0.0% |
| 2 Unit Apartments | 3 | 1.7% |
| 3 or 4 Unit Apartments | 0 | 0.0% |
| 5 to 9 Unit Apartments | 0 | 0.0% |
| 10 or more Apartments | 0 | 0.0% |
| Mobile Home / Other | 13 | 7.3% |
| Total | 178 | 100.0% |
Housing Structures by Occupancy in Beallsville borough
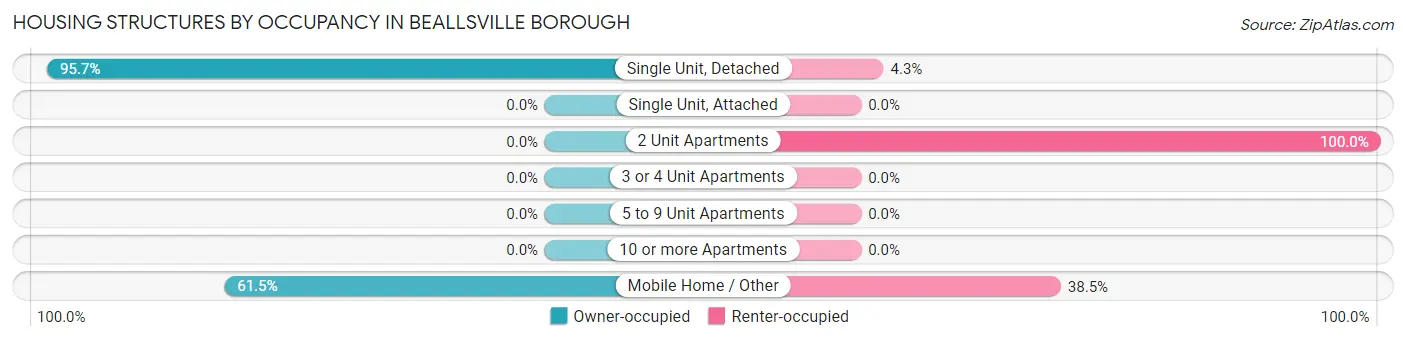
| Structure Type | Owner-occupied | Renter-occupied |
| Single Unit, Detached | 155 (95.7%) | 7 (4.3%) |
| Single Unit, Attached | 0 (0.0%) | 0 (0.0%) |
| 2 Unit Apartments | 0 (0.0%) | 3 (100.0%) |
| 3 or 4 Unit Apartments | 0 (0.0%) | 0 (0.0%) |
| 5 to 9 Unit Apartments | 0 (0.0%) | 0 (0.0%) |
| 10 or more Apartments | 0 (0.0%) | 0 (0.0%) |
| Mobile Home / Other | 8 (61.5%) | 5 (38.5%) |
| Total | 163 (91.6%) | 15 (8.4%) |
Housing Structures by Number of Rooms in Beallsville borough
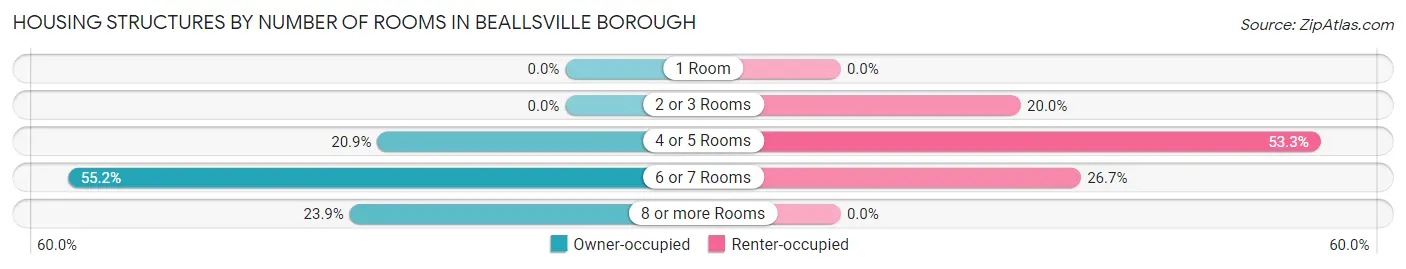
| Number of Rooms | Owner-occupied | Renter-occupied |
| 1 Room | 0 (0.0%) | 0 (0.0%) |
| 2 or 3 Rooms | 0 (0.0%) | 3 (20.0%) |
| 4 or 5 Rooms | 34 (20.9%) | 8 (53.3%) |
| 6 or 7 Rooms | 90 (55.2%) | 4 (26.7%) |
| 8 or more Rooms | 39 (23.9%) | 0 (0.0%) |
| Total | 163 (100.0%) | 15 (100.0%) |
Housing Structure by Heating Type in Beallsville borough
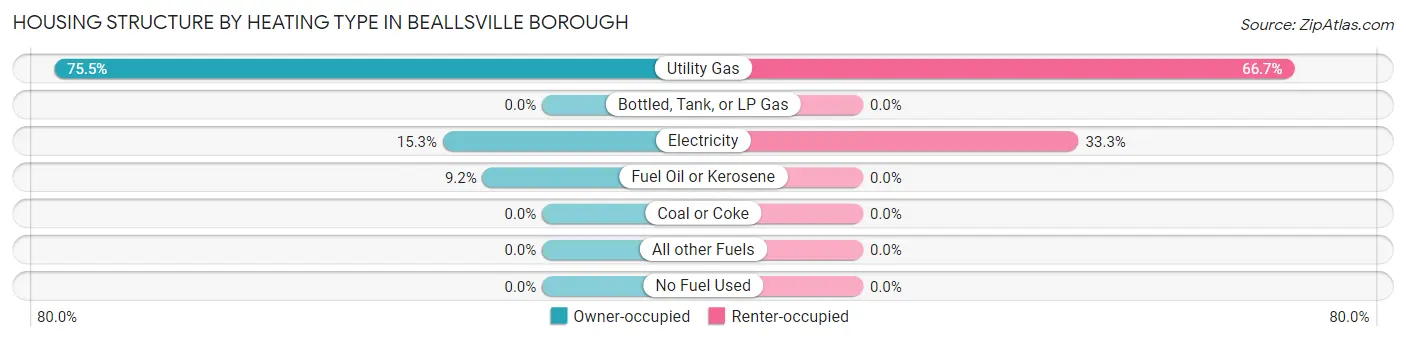
| Heating Type | Owner-occupied | Renter-occupied |
| Utility Gas | 123 (75.5%) | 10 (66.7%) |
| Bottled, Tank, or LP Gas | 0 (0.0%) | 0 (0.0%) |
| Electricity | 25 (15.3%) | 5 (33.3%) |
| Fuel Oil or Kerosene | 15 (9.2%) | 0 (0.0%) |
| Coal or Coke | 0 (0.0%) | 0 (0.0%) |
| All other Fuels | 0 (0.0%) | 0 (0.0%) |
| No Fuel Used | 0 (0.0%) | 0 (0.0%) |
| Total | 163 (100.0%) | 15 (100.0%) |
Household Vehicle Usage in Beallsville borough
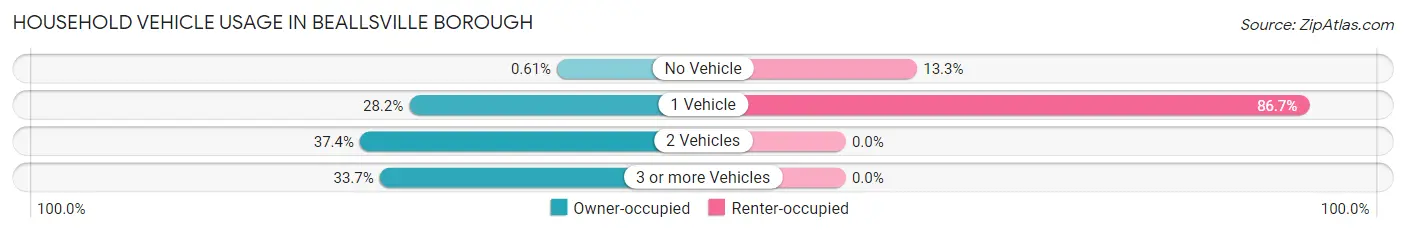
| Vehicles per Household | Owner-occupied | Renter-occupied |
| No Vehicle | 1 (0.6%) | 2 (13.3%) |
| 1 Vehicle | 46 (28.2%) | 13 (86.7%) |
| 2 Vehicles | 61 (37.4%) | 0 (0.0%) |
| 3 or more Vehicles | 55 (33.7%) | 0 (0.0%) |
| Total | 163 (100.0%) | 15 (100.0%) |
Real Estate & Mortgages in Beallsville borough
Real Estate and Mortgage Overview in Beallsville borough
| Characteristic | Without Mortgage | With Mortgage |
| Housing Units | 77 | 86 |
| Median Property Value | $129,900 | $150,000 |
| Median Household Income | $58,977 | $17 |
| Monthly Housing Costs | $456 | $1 |
| Real Estate Taxes | $1,056 | $0 |
Property Value by Mortgage Status in Beallsville borough
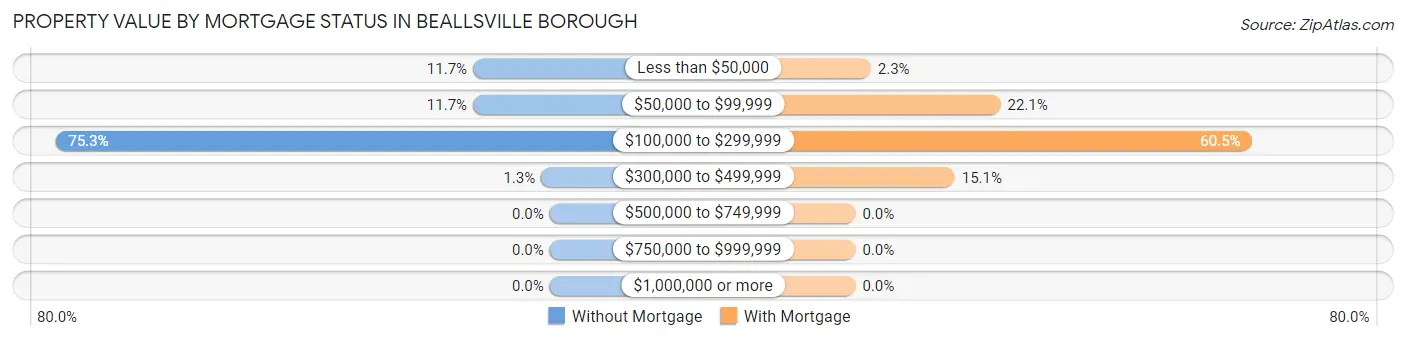
| Property Value | Without Mortgage | With Mortgage |
| Less than $50,000 | 9 (11.7%) | 2 (2.3%) |
| $50,000 to $99,999 | 9 (11.7%) | 19 (22.1%) |
| $100,000 to $299,999 | 58 (75.3%) | 52 (60.5%) |
| $300,000 to $499,999 | 1 (1.3%) | 13 (15.1%) |
| $500,000 to $749,999 | 0 (0.0%) | 0 (0.0%) |
| $750,000 to $999,999 | 0 (0.0%) | 0 (0.0%) |
| $1,000,000 or more | 0 (0.0%) | 0 (0.0%) |
| Total | 77 (100.0%) | 86 (100.0%) |
Household Income by Mortgage Status in Beallsville borough
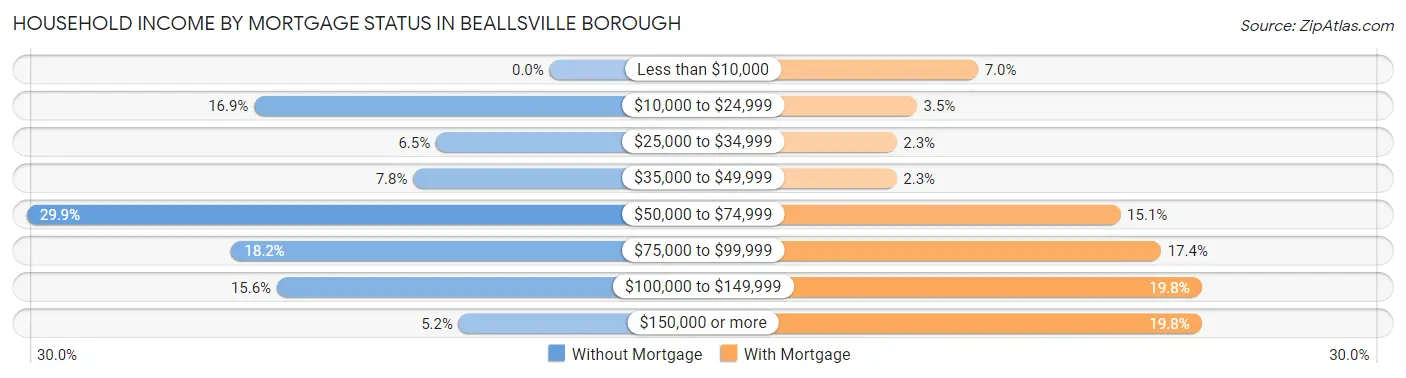
| Household Income | Without Mortgage | With Mortgage |
| Less than $10,000 | 0 (0.0%) | 6 (7.0%) |
| $10,000 to $24,999 | 13 (16.9%) | 3 (3.5%) |
| $25,000 to $34,999 | 5 (6.5%) | 2 (2.3%) |
| $35,000 to $49,999 | 6 (7.8%) | 2 (2.3%) |
| $50,000 to $74,999 | 23 (29.9%) | 13 (15.1%) |
| $75,000 to $99,999 | 14 (18.2%) | 15 (17.4%) |
| $100,000 to $149,999 | 12 (15.6%) | 17 (19.8%) |
| $150,000 or more | 4 (5.2%) | 17 (19.8%) |
| Total | 77 (100.0%) | 86 (100.0%) |
Property Value to Household Income Ratio in Beallsville borough
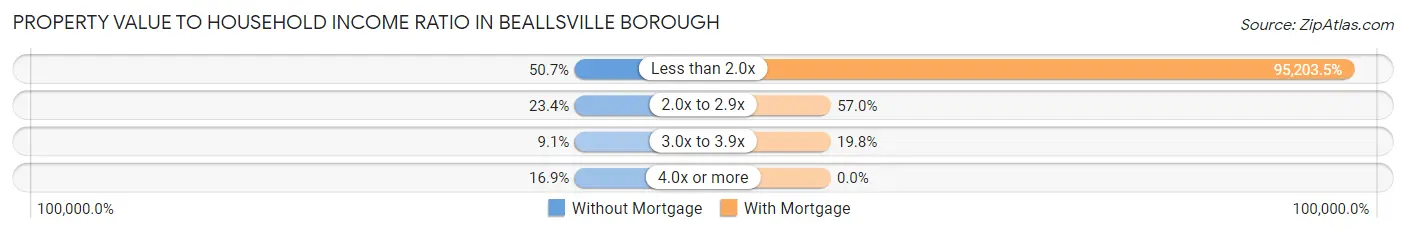
| Value-to-Income Ratio | Without Mortgage | With Mortgage |
| Less than 2.0x | 39 (50.6%) | 81,875 (95,203.5%) |
| 2.0x to 2.9x | 18 (23.4%) | 49 (57.0%) |
| 3.0x to 3.9x | 7 (9.1%) | 17 (19.8%) |
| 4.0x or more | 13 (16.9%) | 0 (0.0%) |
| Total | 77 (100.0%) | 86 (100.0%) |
Real Estate Taxes by Mortgage Status in Beallsville borough
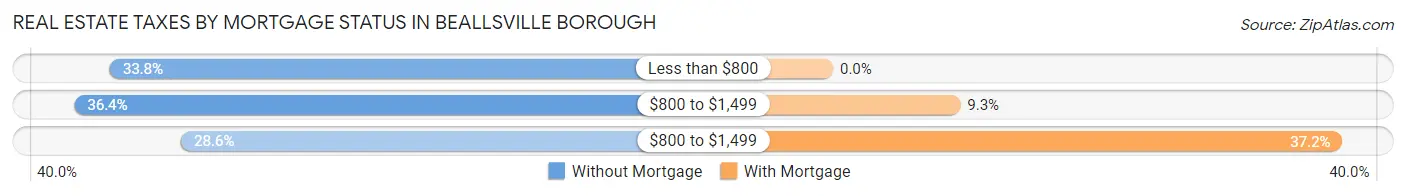
| Property Taxes | Without Mortgage | With Mortgage |
| Less than $800 | 26 (33.8%) | 0 (0.0%) |
| $800 to $1,499 | 28 (36.4%) | 8 (9.3%) |
| $800 to $1,499 | 22 (28.6%) | 32 (37.2%) |
| Total | 77 (100.0%) | 86 (100.0%) |
Health & Disability in Beallsville borough
Health Insurance Coverage by Age in Beallsville borough
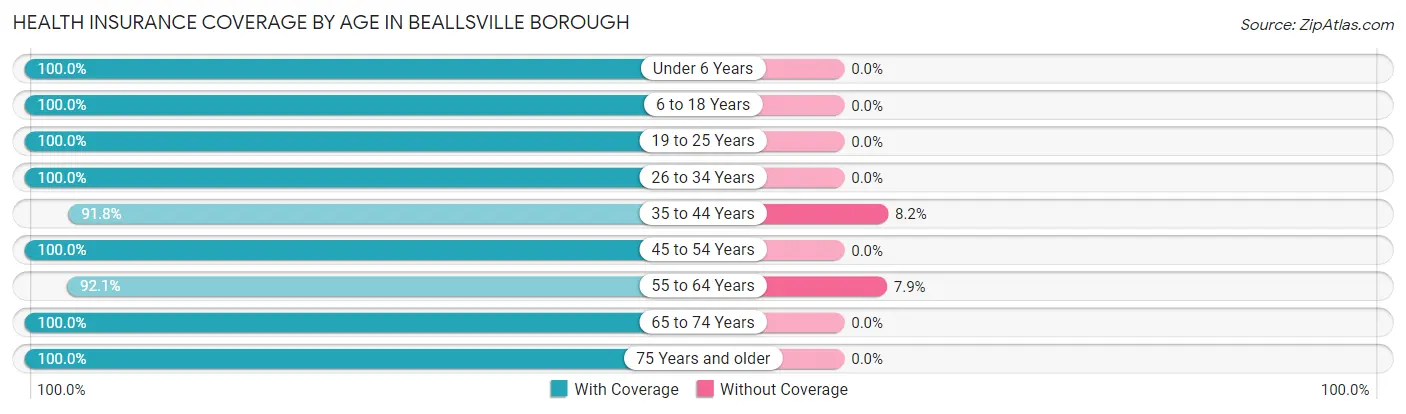
| Age Bracket | With Coverage | Without Coverage |
| Under 6 Years | 6 (100.0%) | 0 (0.0%) |
| 6 to 18 Years | 82 (100.0%) | 0 (0.0%) |
| 19 to 25 Years | 29 (100.0%) | 0 (0.0%) |
| 26 to 34 Years | 29 (100.0%) | 0 (0.0%) |
| 35 to 44 Years | 45 (91.8%) | 4 (8.2%) |
| 45 to 54 Years | 82 (100.0%) | 0 (0.0%) |
| 55 to 64 Years | 58 (92.1%) | 5 (7.9%) |
| 65 to 74 Years | 77 (100.0%) | 0 (0.0%) |
| 75 Years and older | 25 (100.0%) | 0 (0.0%) |
| Total | 433 (98.0%) | 9 (2.0%) |
Health Insurance Coverage by Citizenship Status in Beallsville borough
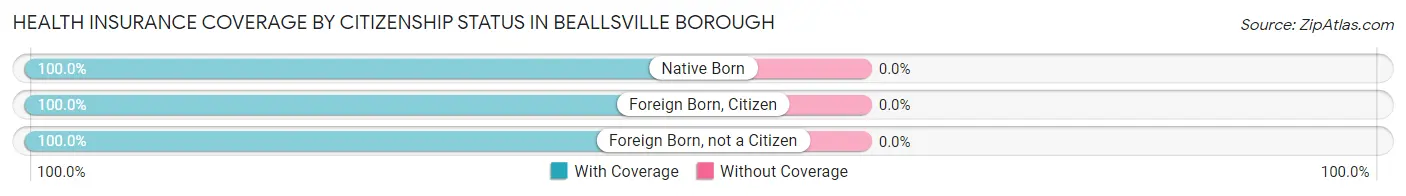
| Citizenship Status | With Coverage | Without Coverage |
| Native Born | 6 (100.0%) | 0 (0.0%) |
| Foreign Born, Citizen | 82 (100.0%) | 0 (0.0%) |
| Foreign Born, not a Citizen | 29 (100.0%) | 0 (0.0%) |
Health Insurance Coverage by Household Income in Beallsville borough
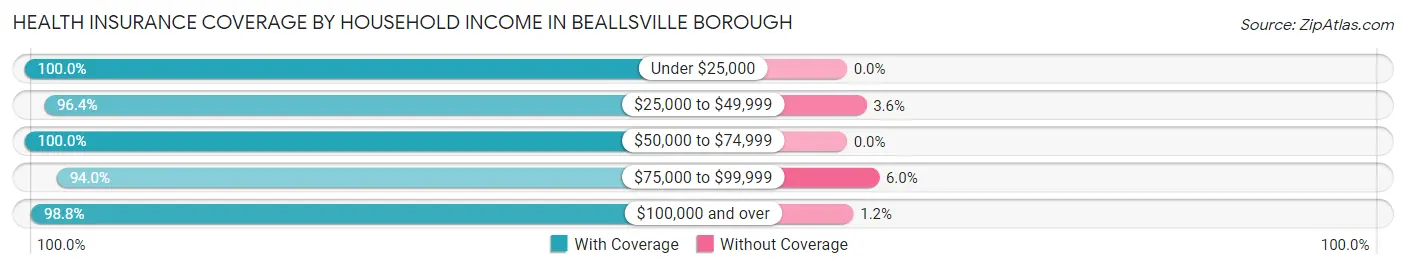
| Household Income | With Coverage | Without Coverage |
| Under $25,000 | 22 (100.0%) | 0 (0.0%) |
| $25,000 to $49,999 | 53 (96.4%) | 2 (3.6%) |
| $50,000 to $74,999 | 118 (100.0%) | 0 (0.0%) |
| $75,000 to $99,999 | 78 (94.0%) | 5 (6.0%) |
| $100,000 and over | 162 (98.8%) | 2 (1.2%) |
Public vs Private Health Insurance Coverage by Age in Beallsville borough
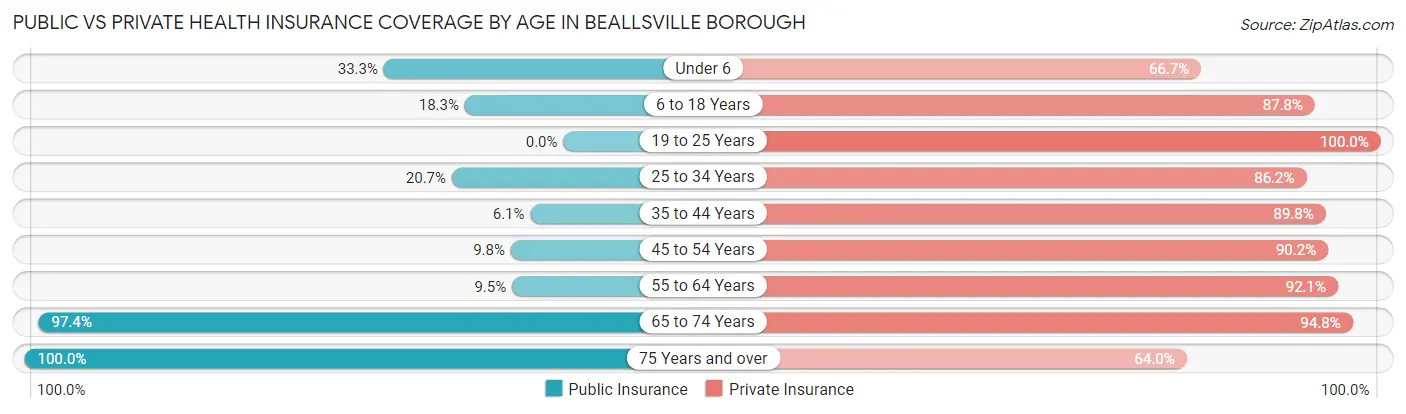
| Age Bracket | Public Insurance | Private Insurance |
| Under 6 | 2 (33.3%) | 4 (66.7%) |
| 6 to 18 Years | 15 (18.3%) | 72 (87.8%) |
| 19 to 25 Years | 0 (0.0%) | 29 (100.0%) |
| 25 to 34 Years | 6 (20.7%) | 25 (86.2%) |
| 35 to 44 Years | 3 (6.1%) | 44 (89.8%) |
| 45 to 54 Years | 8 (9.8%) | 74 (90.2%) |
| 55 to 64 Years | 6 (9.5%) | 58 (92.1%) |
| 65 to 74 Years | 75 (97.4%) | 73 (94.8%) |
| 75 Years and over | 25 (100.0%) | 16 (64.0%) |
| Total | 140 (31.7%) | 395 (89.4%) |
Disability Status by Sex by Age in Beallsville borough
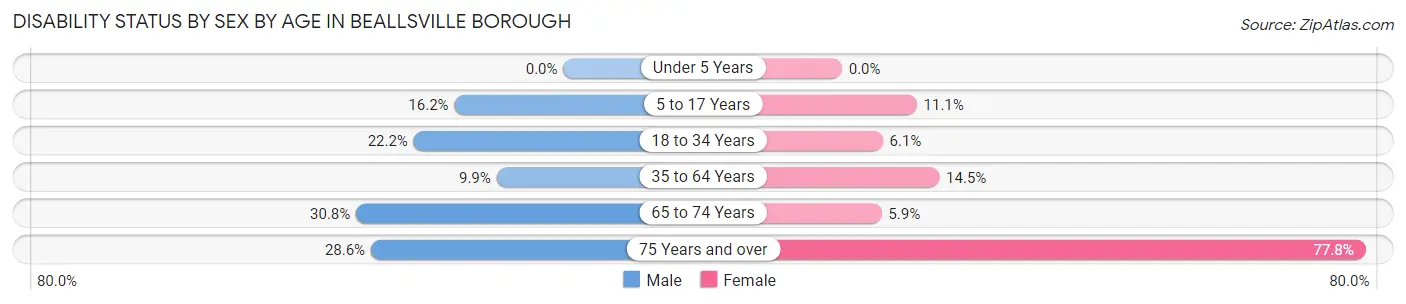
| Age Bracket | Male | Female |
| Under 5 Years | 0 (0.0%) | 0 (0.0%) |
| 5 to 17 Years | 11 (16.2%) | 2 (11.1%) |
| 18 to 34 Years | 6 (22.2%) | 2 (6.1%) |
| 35 to 64 Years | 11 (9.9%) | 12 (14.5%) |
| 65 to 74 Years | 8 (30.8%) | 3 (5.9%) |
| 75 Years and over | 2 (28.6%) | 14 (77.8%) |
Disability Class by Sex by Age in Beallsville borough
Disability Class: Hearing Difficulty
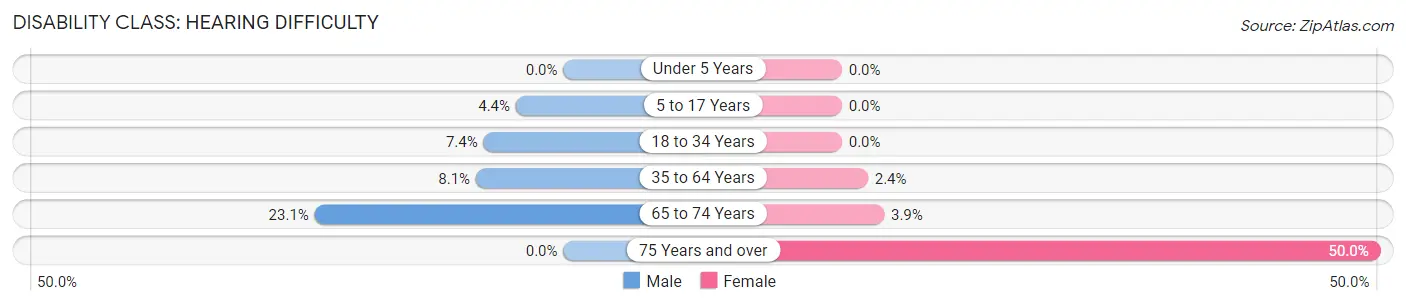
| Age Bracket | Male | Female |
| Under 5 Years | 0 (0.0%) | 0 (0.0%) |
| 5 to 17 Years | 3 (4.4%) | 0 (0.0%) |
| 18 to 34 Years | 2 (7.4%) | 0 (0.0%) |
| 35 to 64 Years | 9 (8.1%) | 2 (2.4%) |
| 65 to 74 Years | 6 (23.1%) | 2 (3.9%) |
| 75 Years and over | 0 (0.0%) | 9 (50.0%) |
Disability Class: Vision Difficulty
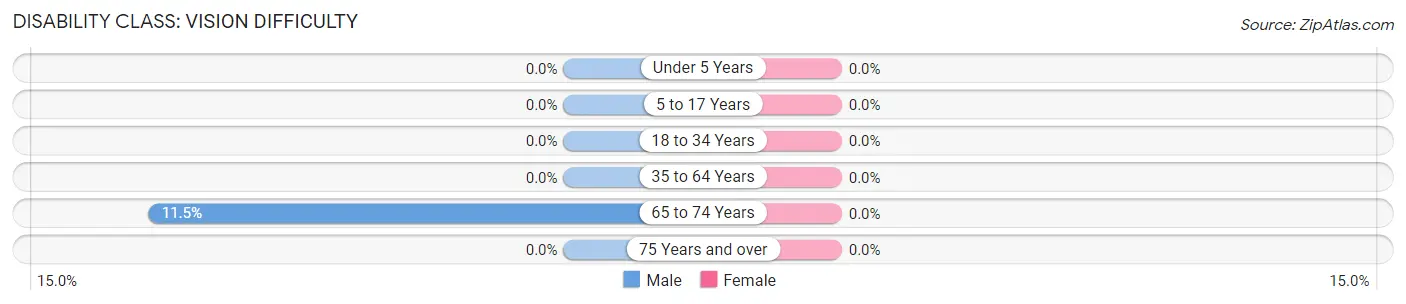
| Age Bracket | Male | Female |
| Under 5 Years | 0 (0.0%) | 0 (0.0%) |
| 5 to 17 Years | 0 (0.0%) | 0 (0.0%) |
| 18 to 34 Years | 0 (0.0%) | 0 (0.0%) |
| 35 to 64 Years | 0 (0.0%) | 0 (0.0%) |
| 65 to 74 Years | 3 (11.5%) | 0 (0.0%) |
| 75 Years and over | 0 (0.0%) | 0 (0.0%) |
Disability Class: Cognitive Difficulty
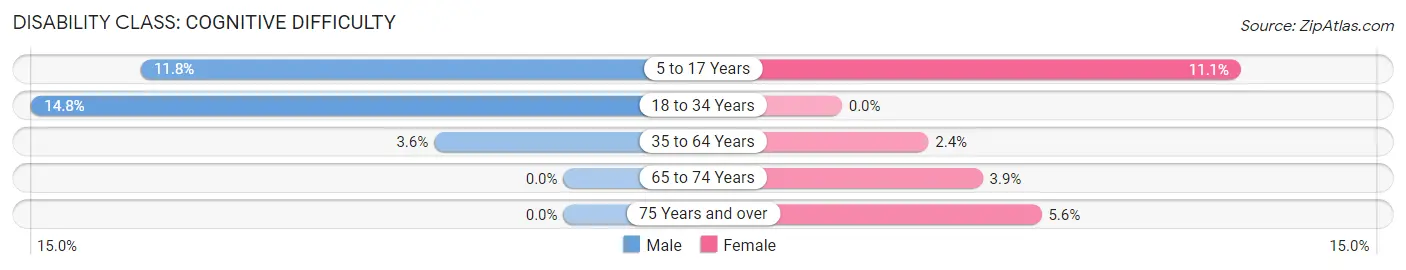
| Age Bracket | Male | Female |
| 5 to 17 Years | 8 (11.8%) | 2 (11.1%) |
| 18 to 34 Years | 4 (14.8%) | 0 (0.0%) |
| 35 to 64 Years | 4 (3.6%) | 2 (2.4%) |
| 65 to 74 Years | 0 (0.0%) | 2 (3.9%) |
| 75 Years and over | 0 (0.0%) | 1 (5.6%) |
Disability Class: Ambulatory Difficulty
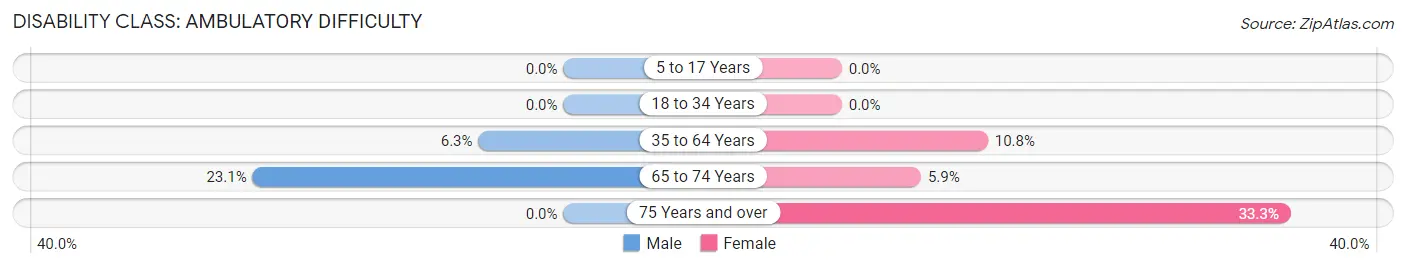
| Age Bracket | Male | Female |
| 5 to 17 Years | 0 (0.0%) | 0 (0.0%) |
| 18 to 34 Years | 0 (0.0%) | 0 (0.0%) |
| 35 to 64 Years | 7 (6.3%) | 9 (10.8%) |
| 65 to 74 Years | 6 (23.1%) | 3 (5.9%) |
| 75 Years and over | 0 (0.0%) | 6 (33.3%) |
Disability Class: Self-Care Difficulty
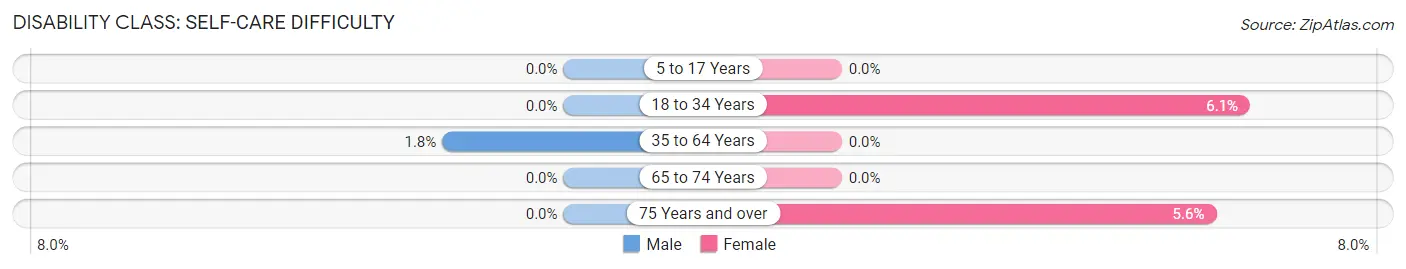
| Age Bracket | Male | Female |
| 5 to 17 Years | 0 (0.0%) | 0 (0.0%) |
| 18 to 34 Years | 0 (0.0%) | 2 (6.1%) |
| 35 to 64 Years | 2 (1.8%) | 0 (0.0%) |
| 65 to 74 Years | 0 (0.0%) | 0 (0.0%) |
| 75 Years and over | 0 (0.0%) | 1 (5.6%) |
Technology Access in Beallsville borough
Computing Device Access in Beallsville borough
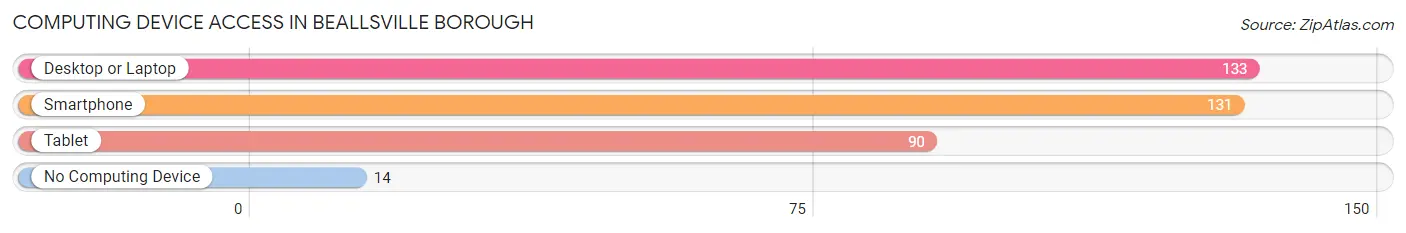
| Device Type | # Households | % Households |
| Desktop or Laptop | 133 | 74.7% |
| Smartphone | 131 | 73.6% |
| Tablet | 90 | 50.6% |
| No Computing Device | 14 | 7.9% |
| Total | 178 | 100.0% |
Internet Access in Beallsville borough
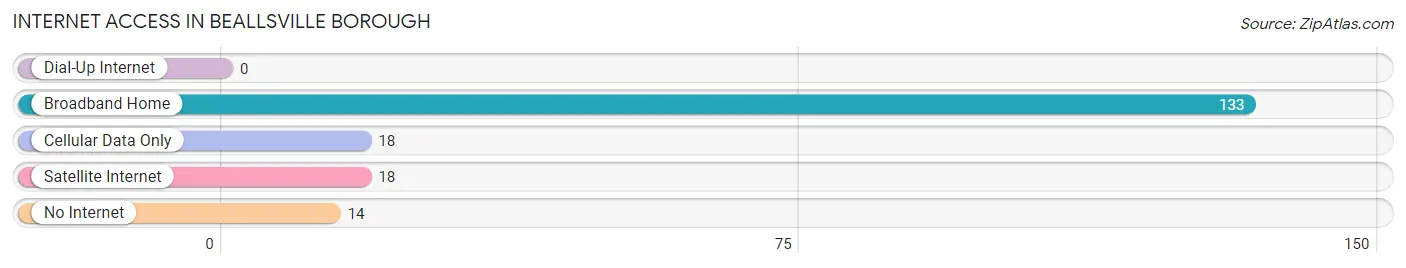
| Internet Type | # Households | % Households |
| Dial-Up Internet | 0 | 0.0% |
| Broadband Home | 133 | 74.7% |
| Cellular Data Only | 18 | 10.1% |
| Satellite Internet | 18 | 10.1% |
| No Internet | 14 | 7.9% |
| Total | 178 | 100.0% |
Beallsville borough Summary
Beallsville Borough is a small borough located in Washington County, Pennsylvania. It is situated in the southwestern corner of the state, approximately 30 miles south of Pittsburgh. The borough is bordered by the townships of Donegal, East Finley, Morris, and West Finley. As of the 2010 census, the population of Beallsville Borough was 545.
History
Beallsville Borough was founded in 1832 by John Beall, a Revolutionary War veteran. Beall purchased the land from the heirs of William Crawford, who had been granted the land by the Commonwealth of Pennsylvania in 1786. Beall named the town after himself and began to develop it as a small farming community.
In 1836, Beall donated land for the construction of a schoolhouse, which was the first school in the area. The schoolhouse was also used as a church and a meeting place for the community.
In 1845 Beall donated land for the construction of a cemetery which is still in use today
In 1851 the first post office was established in Beallsville
In 1854, the first bridge was built across the Monongahela River, connecting Beallsville to the town of West Finley.
In 1871, the first railroad line was built through Beallsville, connecting it to the larger cities of Pittsburgh and Washington, D.C.
In 1872 the first bank was established in Beallsville
In 1873 the first newspaper the Beallsville Herald was published
In 1876 the first telephone line was installed in Beallsville
In 1877 the first fire company was established in Beallsville
In 1878 the first electric lights were installed in Beallsville
In 1879 the first public library was established in Beallsville
In 1881 the first waterworks were established in Beallsville
In 1882 the first public school was established in Beallsville
In 1883 the first fire station was built in Beallsville
In 1884 the first hospital was established in Beallsville
In 1885 the first bank building was constructed in Beallsville
In 1886 the first telephone exchange was established in Beallsville
In 1887 the first gas station was established in Beallsville
In 1888 the first movie theater was opened in Beallsville
In 1889 the first public park was established in Beallsville
In 1890 the first electric streetcar line was built in Beallsville
In 1891 the first public swimming pool was opened in Beallsville
In 1892 the first public library building was constructed in Beallsville
In 1893 the first public high school was established in Beallsville
In 1895 the first public sewer system was installed in Beallsville
In 1896 the first public water system was established in Beallsville
In 1897 the first public electric power plant was built in Beallsville
In 1898 the first public street lighting system was installed in Beallsville
In 1899 the first public telephone system was established in Beallsville
Geography
Beallsville Borough is located in the southwestern corner of Washington County, Pennsylvania. It is situated along the Monongahela River, approximately 30 miles south of Pittsburgh. The borough is bordered by the townships of Donegal, East Finley, Morris, and West Finley.
The total area of Beallsville Borough is 0.6 square miles, all of which is land. The borough is located in a hilly region of the state, with elevations ranging from 860 to 1,000 feet above sea level.
Economy
The economy of Beallsville Borough is largely based on agriculture and tourism. The borough is home to several small farms, which produce a variety of crops, including corn, soybeans, wheat, hay, and vegetables.
The borough is also home to several small businesses, including restaurants, retail stores, and service providers. The borough is also home to several bed and breakfasts, which attract tourists from around the region.
Demographics
As of the 2010 census, the population of Beallsville Borough was 545. The racial makeup of the borough was 97.3% White, 0.7% African American, 0.2% Native American, 0.2% Asian, 0.2% from other races, and 1.6% from two or more races. Hispanic or Latino of any race were 0.7% of the population.
The median household income in Beallsville Borough was $41,250, and the median family income was $50,000. The per capita income for the borough was $20,945. About 8.3% of families and 10.2% of the population were below the poverty line, including 14.3% of those under age 18 and 6.3% of those age 65 or over.
Common Questions
What is Per Capita Income in Beallsville borough?
Per Capita income in Beallsville borough is $37,692.
What is the Median Family Income in Beallsville borough?
Median Family Income in Beallsville borough is $81,964.
What is the Median Household income in Beallsville borough?
Median Household Income in Beallsville borough is $72,188.
What is Income or Wage Gap in Beallsville borough?
Income or Wage Gap in Beallsville borough is 39.0%.
Women in Beallsville borough earn 61.0 cents for every dollar earned by a man.
What is Inequality or Gini Index in Beallsville borough?
Inequality or Gini Index in Beallsville borough is 0.41.
What is the Total Population of Beallsville borough?
Total Population of Beallsville borough is 442.
What is the Total Male Population of Beallsville borough?
Total Male Population of Beallsville borough is 239.
What is the Total Female Population of Beallsville borough?
Total Female Population of Beallsville borough is 203.
What is the Ratio of Males per 100 Females in Beallsville borough?
There are 117.73 Males per 100 Females in Beallsville borough.
What is the Ratio of Females per 100 Males in Beallsville borough?
There are 84.94 Females per 100 Males in Beallsville borough.
What is the Median Population Age in Beallsville borough?
Median Population Age in Beallsville borough is 47.2 Years.
What is the Average Family Size in Beallsville borough
Average Family Size in Beallsville borough is 3.1 People.
What is the Average Household Size in Beallsville borough
Average Household Size in Beallsville borough is 2.5 People.
How Large is the Labor Force in Beallsville borough?
There are 238 People in the Labor Forcein in Beallsville borough.
What is the Percentage of People in the Labor Force in Beallsville borough?
62.8% of People are in the Labor Force in Beallsville borough.
What is the Unemployment Rate in Beallsville borough?
Unemployment Rate in Beallsville borough is 7.1%.