New Salem, PA Map & Demographics
New Salem Map
New Salem Overview
$29,943
PER CAPITA INCOME
$74,036
AVG FAMILY INCOME
$80,643
AVG HOUSEHOLD INCOME
0.3%
WAGE / INCOME GAP [ % ]
99.7¢/ $1
WAGE / INCOME GAP [ $ ]
0.28
INEQUALITY / GINI INDEX
677
TOTAL POPULATION
406
MALE POPULATION
271
FEMALE POPULATION
149.82
MALES / 100 FEMALES
66.75
FEMALES / 100 MALES
36.8
MEDIAN AGE
2.8
AVG FAMILY SIZE
2.9
AVG HOUSEHOLD SIZE
396
LABOR FORCE [ PEOPLE ]
63.0%
PERCENT IN LABOR FORCE
16.4%
UNEMPLOYMENT RATE
New Salem Zip Codes
New Salem Area Codes
Income in New Salem
Income Overview in New Salem
Per Capita Income in New Salem is $29,943, while median incomes of families and households are $74,036 and $80,643 respectively.
| Characteristic | Number | Measure |
| Per Capita Income | 677 | $29,943 |
| Median Family Income | 217 | $74,036 |
| Mean Family Income | 217 | $74,802 |
| Median Household Income | 236 | $80,643 |
| Mean Household Income | 236 | $88,047 |
| Income Deficit | 217 | $0 |
| Wage / Income Gap (%) | 677 | 0.29% |
| Wage / Income Gap ($) | 677 | 99.71¢ per $1 |
| Gini / Inequality Index | 677 | 0.28 |
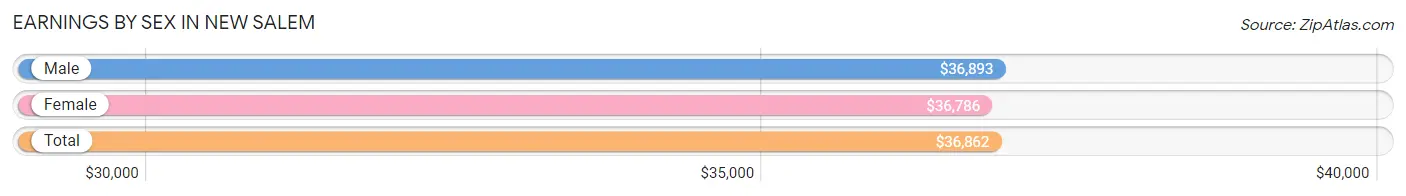
Earnings by Sex in New Salem
Average Earnings in New Salem are $36,862, $36,893 for men and $36,786 for women, a difference of 0.3%.
| Sex | Number | Average Earnings |
| Male | 253 (71.3%) | $36,893 |
| Female | 102 (28.7%) | $36,786 |
| Total | 355 (100.0%) | $36,862 |
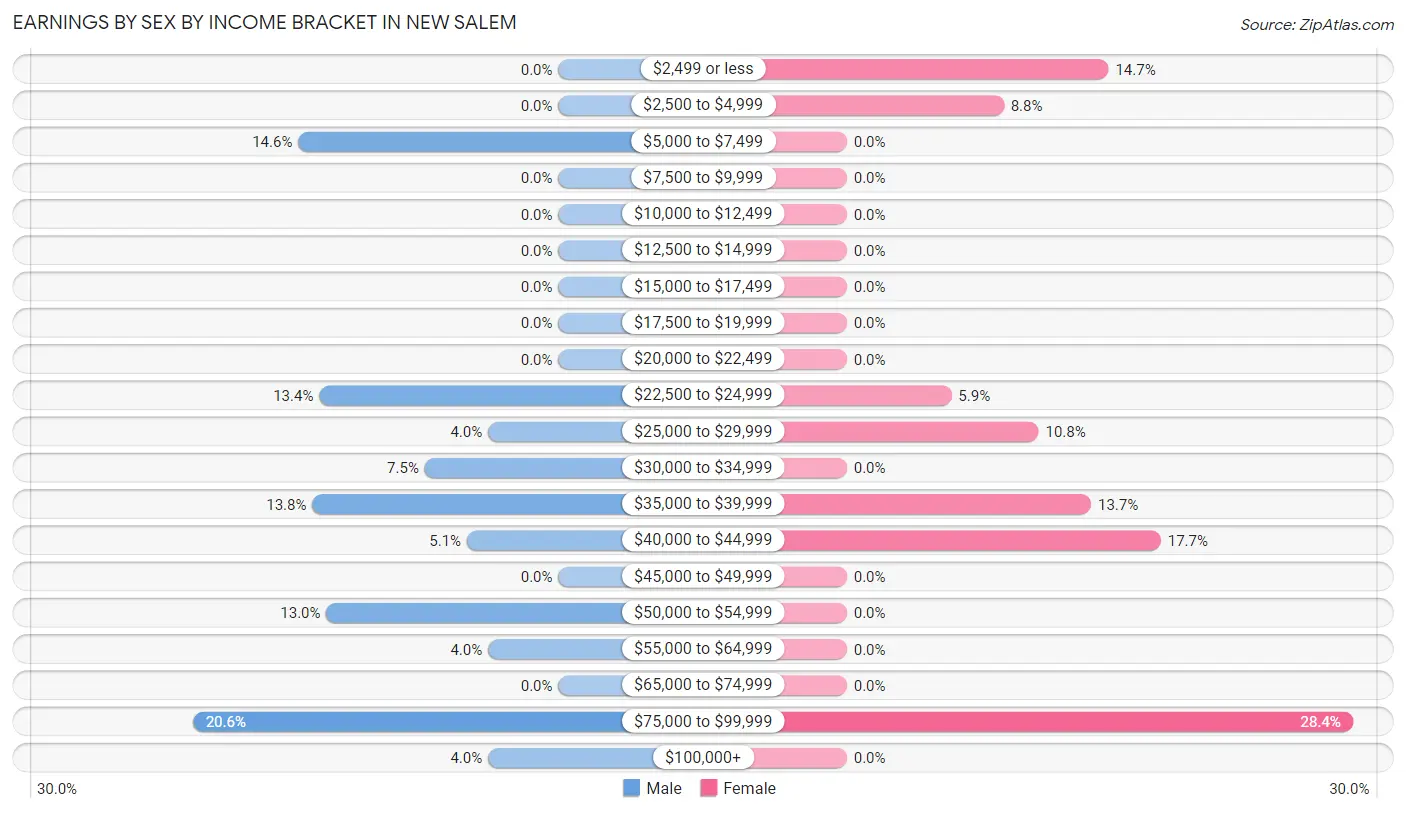
Earnings by Sex by Income Bracket in New Salem
The most common earnings brackets in New Salem are $75,000 to $99,999 for men (52 | 20.5%) and $75,000 to $99,999 for women (29 | 28.4%).
| Income | Male | Female |
| $2,499 or less | 0 (0.0%) | 15 (14.7%) |
| $2,500 to $4,999 | 0 (0.0%) | 9 (8.8%) |
| $5,000 to $7,499 | 37 (14.6%) | 0 (0.0%) |
| $7,500 to $9,999 | 0 (0.0%) | 0 (0.0%) |
| $10,000 to $12,499 | 0 (0.0%) | 0 (0.0%) |
| $12,500 to $14,999 | 0 (0.0%) | 0 (0.0%) |
| $15,000 to $17,499 | 0 (0.0%) | 0 (0.0%) |
| $17,500 to $19,999 | 0 (0.0%) | 0 (0.0%) |
| $20,000 to $22,499 | 0 (0.0%) | 0 (0.0%) |
| $22,500 to $24,999 | 34 (13.4%) | 6 (5.9%) |
| $25,000 to $29,999 | 10 (4.0%) | 11 (10.8%) |
| $30,000 to $34,999 | 19 (7.5%) | 0 (0.0%) |
| $35,000 to $39,999 | 35 (13.8%) | 14 (13.7%) |
| $40,000 to $44,999 | 13 (5.1%) | 18 (17.6%) |
| $45,000 to $49,999 | 0 (0.0%) | 0 (0.0%) |
| $50,000 to $54,999 | 33 (13.0%) | 0 (0.0%) |
| $55,000 to $64,999 | 10 (4.0%) | 0 (0.0%) |
| $65,000 to $74,999 | 0 (0.0%) | 0 (0.0%) |
| $75,000 to $99,999 | 52 (20.5%) | 29 (28.4%) |
| $100,000+ | 10 (4.0%) | 0 (0.0%) |
| Total | 253 (100.0%) | 102 (100.0%) |
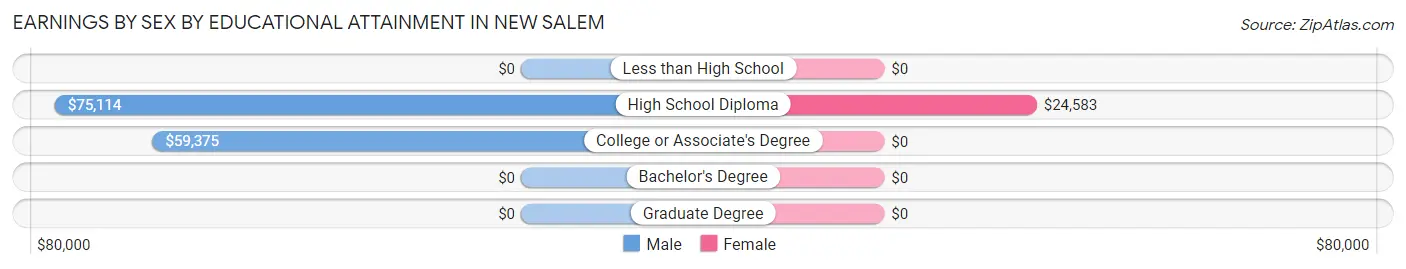
Earnings by Sex by Educational Attainment in New Salem
| Educational Attainment | Male Income | Female Income |
| Less than High School | - | - |
| High School Diploma | $75,114 | $24,583 |
| College or Associate's Degree | $59,375 | $0 |
| Bachelor's Degree | - | - |
| Graduate Degree | - | - |
| Total | $51,780 | $0 |
Family Income in New Salem
Family Income Brackets in New Salem
According to the New Salem family income data, there are 87 families falling into the $50,000 to $74,999 income range, which is the most common income bracket and makes up 40.1% of all families.
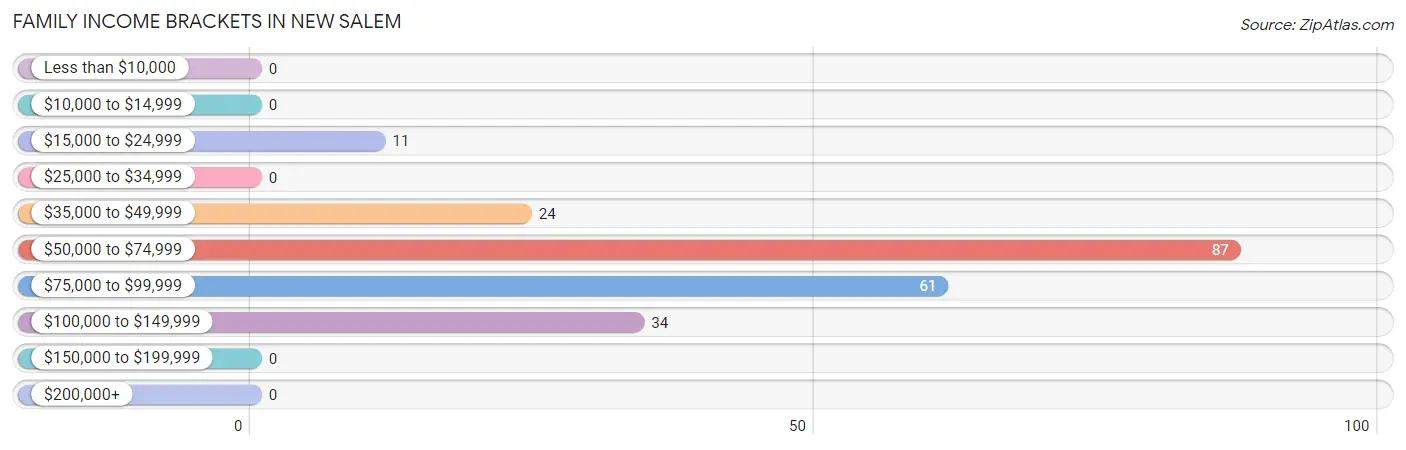
| Income Bracket | # Families | % Families |
| Less than $10,000 | 0 | 0.0% |
| $10,000 to $14,999 | 0 | 0.0% |
| $15,000 to $24,999 | 11 | 5.1% |
| $25,000 to $34,999 | 0 | 0.0% |
| $35,000 to $49,999 | 24 | 11.1% |
| $50,000 to $74,999 | 87 | 40.1% |
| $75,000 to $99,999 | 61 | 28.1% |
| $100,000 to $149,999 | 34 | 15.7% |
| $150,000 to $199,999 | 0 | 0.0% |
| $200,000+ | 0 | 0.0% |
Family Income by Famaliy Size in New Salem
3-person families (50 | 23.0%) account for the highest median family income in New Salem with $99,545 per family, while 3-person families (50 | 23.0%) have the highest median income of $33,182 per family member.
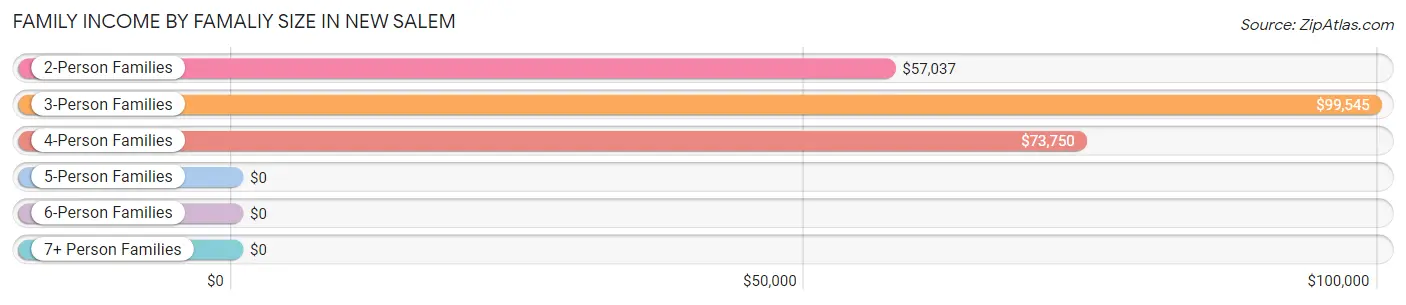
| Income Bracket | # Families | Median Income |
| 2-Person Families | 116 (53.5%) | $57,037 |
| 3-Person Families | 50 (23.0%) | $99,545 |
| 4-Person Families | 51 (23.5%) | $73,750 |
| 5-Person Families | 0 (0.0%) | $0 |
| 6-Person Families | 0 (0.0%) | $0 |
| 7+ Person Families | 0 (0.0%) | $0 |
| Total | 217 (100.0%) | $74,036 |
Family Income by Number of Earners in New Salem
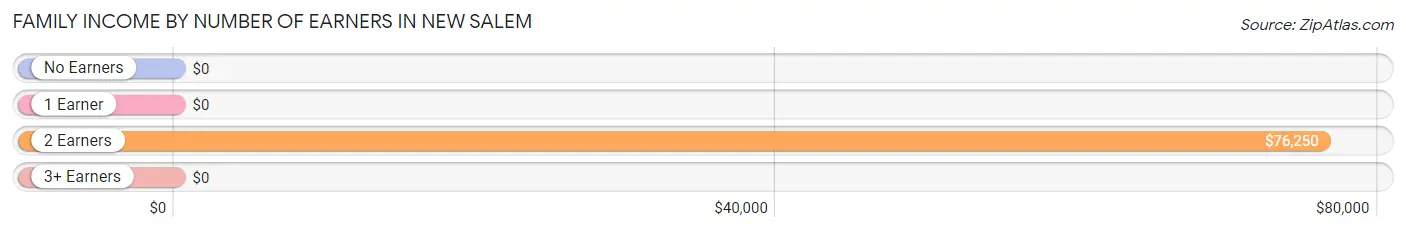
| Number of Earners | # Families | Median Income |
| No Earners | 36 (16.6%) | $0 |
| 1 Earner | 95 (43.8%) | $0 |
| 2 Earners | 70 (32.3%) | $76,250 |
| 3+ Earners | 16 (7.4%) | $0 |
| Total | 217 (100.0%) | $74,036 |
Household Income in New Salem
Household Income Brackets in New Salem
With 67 households falling in the category, the $75,000 to $99,999 income range is the most frequent in New Salem, accounting for 28.4% of all households.
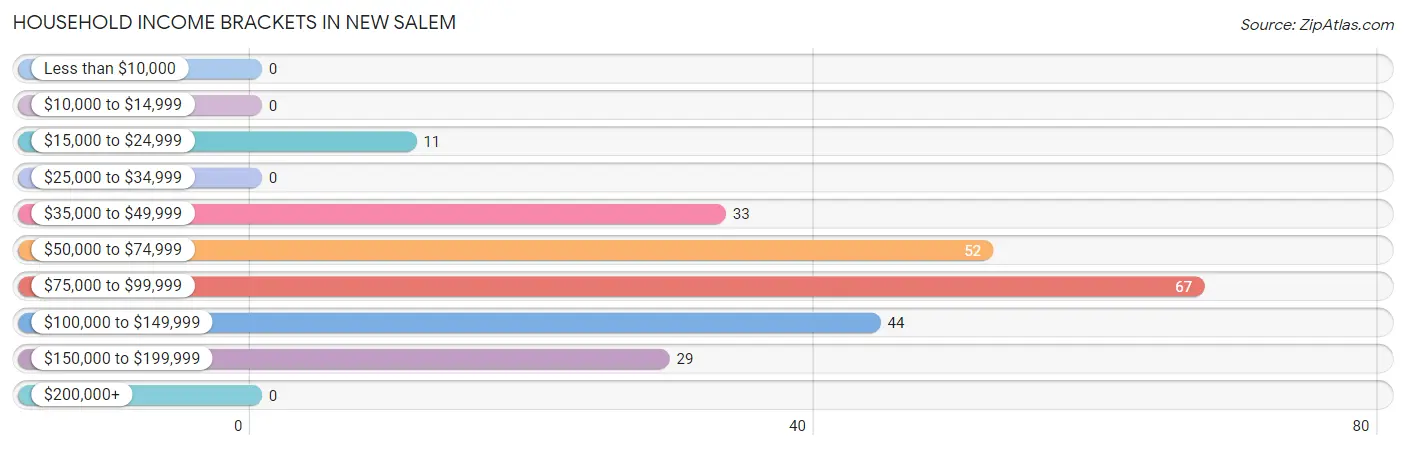
| Income Bracket | # Households | % Households |
| Less than $10,000 | 0 | 0.0% |
| $10,000 to $14,999 | 0 | 0.0% |
| $15,000 to $24,999 | 11 | 4.7% |
| $25,000 to $34,999 | 0 | 0.0% |
| $35,000 to $49,999 | 33 | 14.0% |
| $50,000 to $74,999 | 52 | 22.0% |
| $75,000 to $99,999 | 67 | 28.4% |
| $100,000 to $149,999 | 44 | 18.6% |
| $150,000 to $199,999 | 29 | 12.3% |
| $200,000+ | 0 | 0.0% |
Household Income by Householder Age in New Salem
The median household income in New Salem is $80,643, with the highest median household income of $97,841 found in the 25 to 44 years age bracket for the primary householder. A total of 99 households (41.9%) fall into this category.
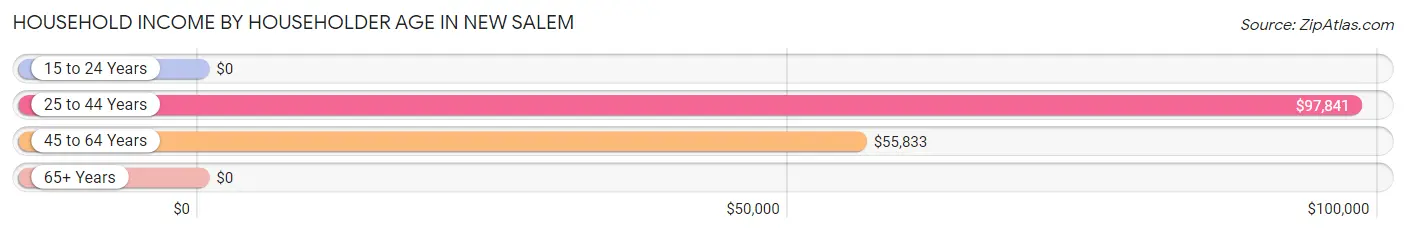
| Income Bracket | # Households | Median Income |
| 15 to 24 Years | 0 (0.0%) | $0 |
| 25 to 44 Years | 99 (41.9%) | $97,841 |
| 45 to 64 Years | 88 (37.3%) | $55,833 |
| 65+ Years | 49 (20.8%) | $0 |
| Total | 236 (100.0%) | $80,643 |
Poverty in New Salem
Income Below Poverty by Sex and Age in New Salem
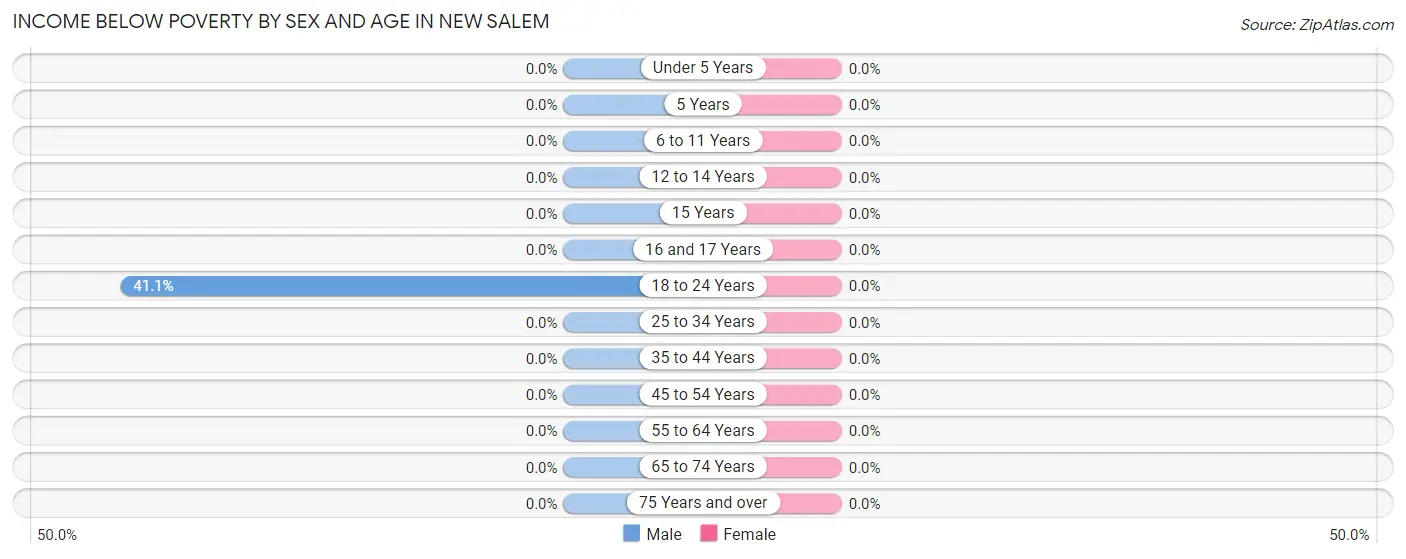
| Age Bracket | Male | Female |
| Under 5 Years | 0 (0.0%) | 0 (0.0%) |
| 5 Years | 0 (0.0%) | 0 (0.0%) |
| 6 to 11 Years | 0 (0.0%) | 0 (0.0%) |
| 12 to 14 Years | 0 (0.0%) | 0 (0.0%) |
| 15 Years | 0 (0.0%) | 0 (0.0%) |
| 16 and 17 Years | 0 (0.0%) | 0 (0.0%) |
| 18 to 24 Years | 37 (41.1%) | 0 (0.0%) |
| 25 to 34 Years | 0 (0.0%) | 0 (0.0%) |
| 35 to 44 Years | 0 (0.0%) | 0 (0.0%) |
| 45 to 54 Years | 0 (0.0%) | 0 (0.0%) |
| 55 to 64 Years | 0 (0.0%) | 0 (0.0%) |
| 65 to 74 Years | 0 (0.0%) | 0 (0.0%) |
| 75 Years and over | 0 (0.0%) | 0 (0.0%) |
| Total | 37 (9.1%) | 0 (0.0%) |
Income Above Poverty by Sex and Age in New Salem
According to the poverty statistics in New Salem, males aged 6 to 11 years and females aged under 5 years are the age groups that are most secure financially, with 100.0% of males and 100.0% of females in these age groups living above the poverty line.
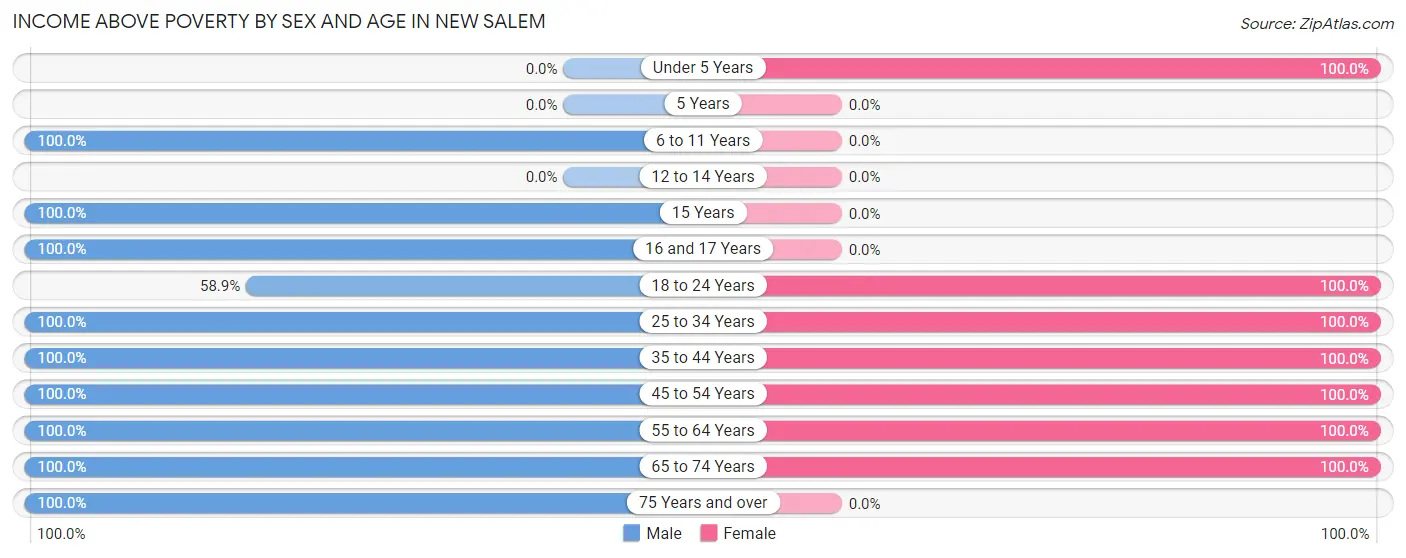
| Age Bracket | Male | Female |
| Under 5 Years | 0 (0.0%) | 30 (100.0%) |
| 5 Years | 0 (0.0%) | 0 (0.0%) |
| 6 to 11 Years | 10 (100.0%) | 0 (0.0%) |
| 12 to 14 Years | 0 (0.0%) | 0 (0.0%) |
| 15 Years | 8 (100.0%) | 0 (0.0%) |
| 16 and 17 Years | 55 (100.0%) | 0 (0.0%) |
| 18 to 24 Years | 53 (58.9%) | 30 (100.0%) |
| 25 to 34 Years | 64 (100.0%) | 25 (100.0%) |
| 35 to 44 Years | 24 (100.0%) | 85 (100.0%) |
| 45 to 54 Years | 69 (100.0%) | 36 (100.0%) |
| 55 to 64 Years | 37 (100.0%) | 62 (100.0%) |
| 65 to 74 Years | 24 (100.0%) | 3 (100.0%) |
| 75 Years and over | 25 (100.0%) | 0 (0.0%) |
| Total | 369 (90.9%) | 271 (100.0%) |
Income Below Poverty Among Married-Couple Families in New Salem
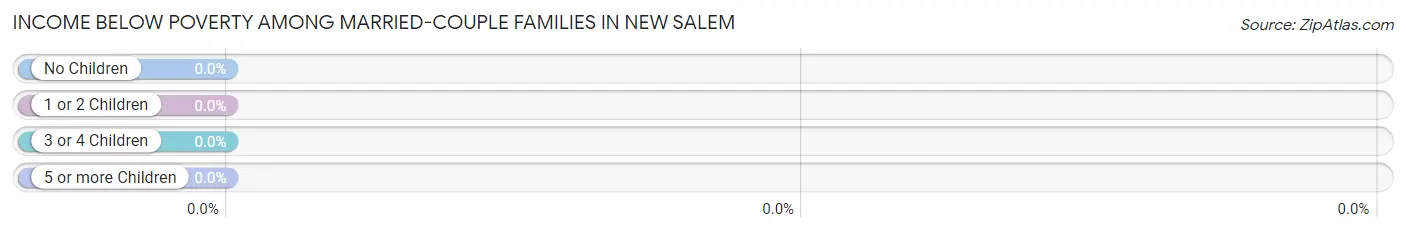
| Children | Above Poverty | Below Poverty |
| No Children | 84 (100.0%) | 0 (0.0%) |
| 1 or 2 Children | 62 (100.0%) | 0 (0.0%) |
| 3 or 4 Children | 0 (0.0%) | 0 (0.0%) |
| 5 or more Children | 0 (0.0%) | 0 (0.0%) |
| Total | 146 (100.0%) | 0 (0.0%) |
Income Below Poverty Among Single-Parent Households in New Salem
| Children | Single Father | Single Mother |
| No Children | 0 (0.0%) | 0 (0.0%) |
| 1 or 2 Children | 0 (0.0%) | 0 (0.0%) |
| 3 or 4 Children | 0 (0.0%) | 0 (0.0%) |
| 5 or more Children | 0 (0.0%) | 0 (0.0%) |
| Total | 0 (0.0%) | 0 (0.0%) |
Income Below Poverty Among Married-Couple vs Single-Parent Households in New Salem
| Children | Married-Couple Families | Single-Parent Households |
| No Children | 0 (0.0%) | 0 (0.0%) |
| 1 or 2 Children | 0 (0.0%) | 0 (0.0%) |
| 3 or 4 Children | 0 (0.0%) | 0 (0.0%) |
| 5 or more Children | 0 (0.0%) | 0 (0.0%) |
| Total | 0 (0.0%) | 0 (0.0%) |
Race in New Salem
The most populous races in New Salem are White / Caucasian (668 | 98.7%), Hispanic or Latino (37 | 5.5%), and Two or more Races (9 | 1.3%).
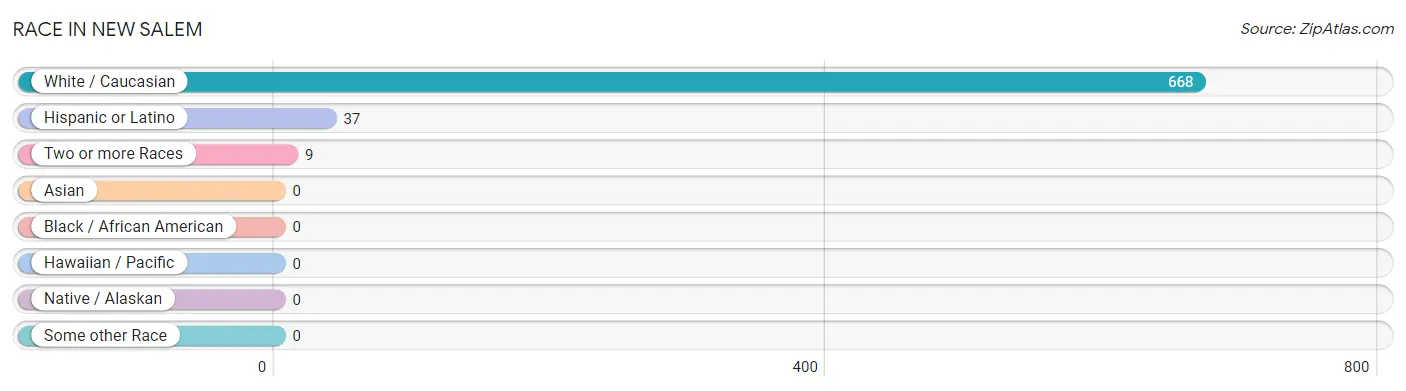
| Race | # Population | % Population |
| Asian | 0 | 0.0% |
| Black / African American | 0 | 0.0% |
| Hawaiian / Pacific | 0 | 0.0% |
| Hispanic or Latino | 37 | 5.5% |
| Native / Alaskan | 0 | 0.0% |
| White / Caucasian | 668 | 98.7% |
| Two or more Races | 9 | 1.3% |
| Some other Race | 0 | 0.0% |
| Total | 677 | 100.0% |
Ancestry in New Salem
The most populous ancestries reported in New Salem are German (120 | 17.7%), American (105 | 15.5%), Italian (103 | 15.2%), English (97 | 14.3%), and Scotch-Irish (84 | 12.4%), together accounting for 75.2% of all New Salem residents.
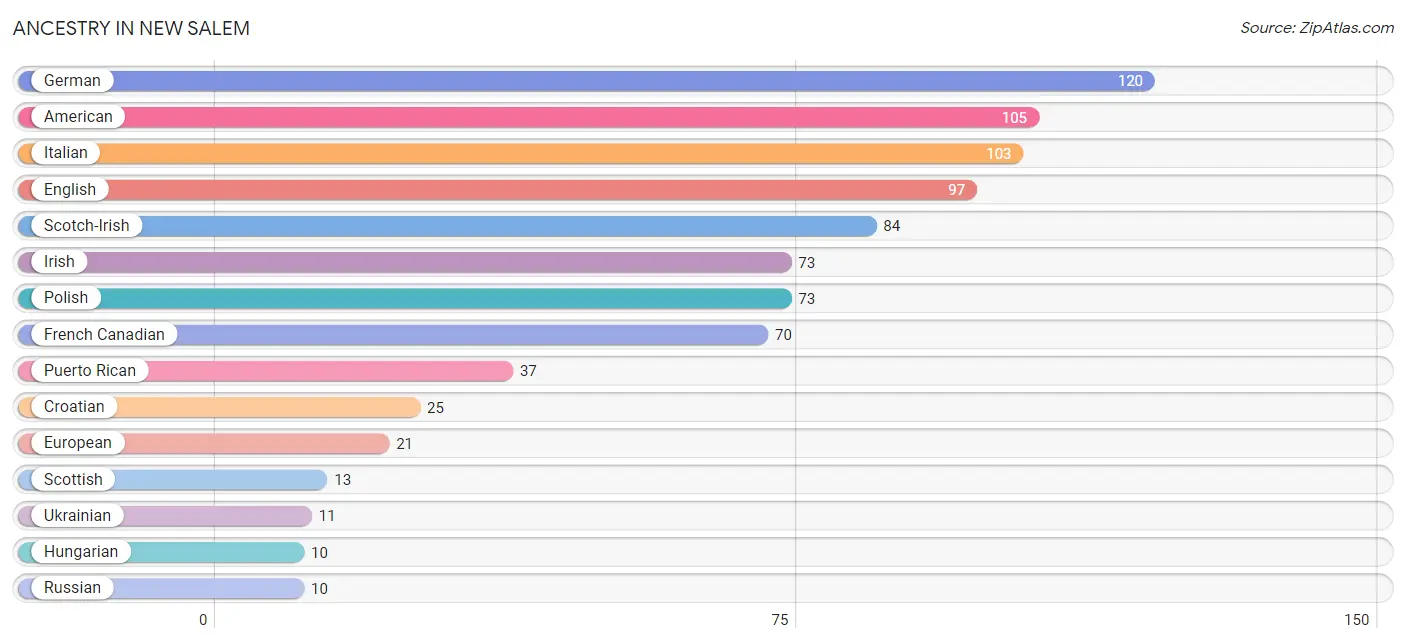
| Ancestry | # Population | % Population |
| American | 105 | 15.5% |
| Blackfeet | 9 | 1.3% |
| Cherokee | 9 | 1.3% |
| Croatian | 25 | 3.7% |
| English | 97 | 14.3% |
| European | 21 | 3.1% |
| French Canadian | 70 | 10.3% |
| German | 120 | 17.7% |
| Hungarian | 10 | 1.5% |
| Irish | 73 | 10.8% |
| Italian | 103 | 15.2% |
| Polish | 73 | 10.8% |
| Puerto Rican | 37 | 5.5% |
| Russian | 10 | 1.5% |
| Scotch-Irish | 84 | 12.4% |
| Scottish | 13 | 1.9% |
| Slovak | 8 | 1.2% |
| Ukrainian | 11 | 1.6% | View All 18 Rows |
Immigrants in New Salem

| Immigration Origin | # Population | % Population | View All 0 Rows |
Sex and Age in New Salem
Sex and Age in New Salem
The most populous age groups in New Salem are 15 to 19 Years (97 | 23.9%) for men and 60 to 64 Years (52 | 19.2%) for women.
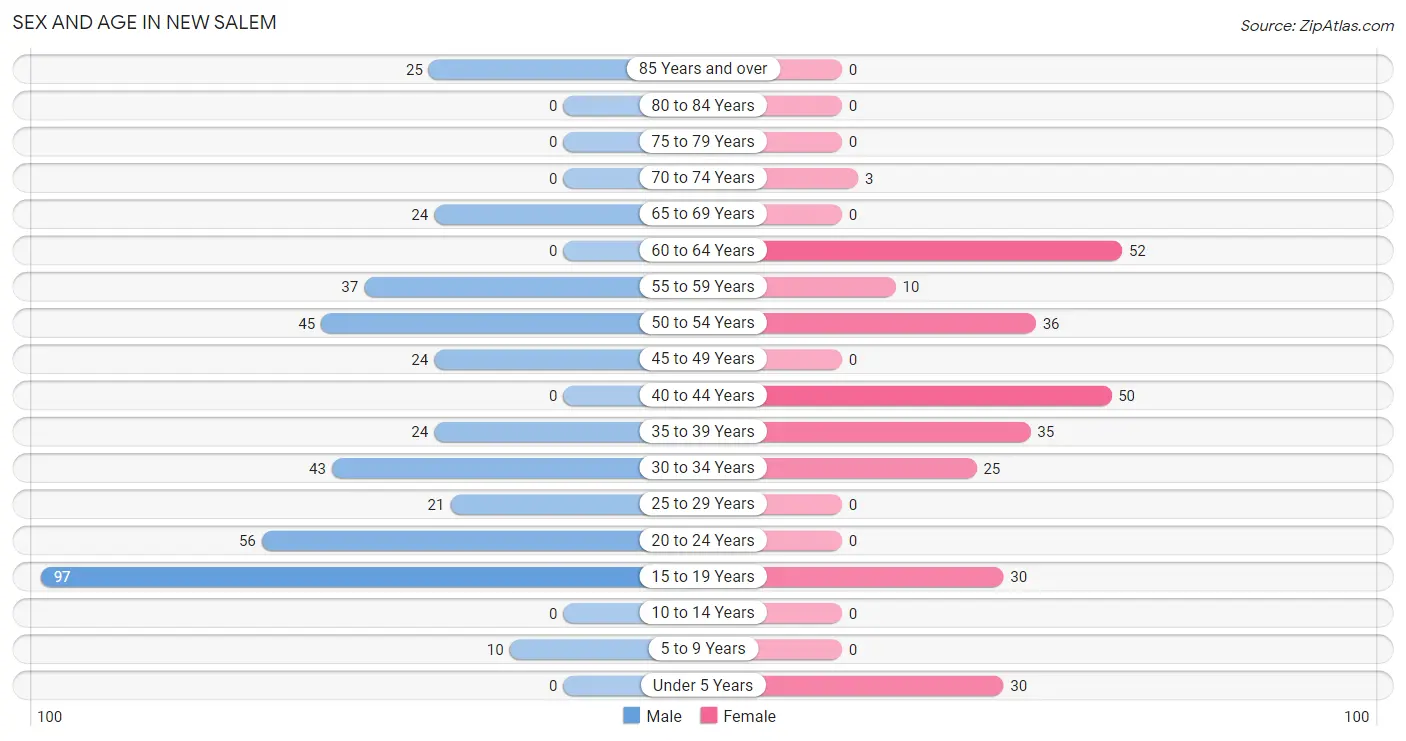
| Age Bracket | Male | Female |
| Under 5 Years | 0 (0.0%) | 30 (11.1%) |
| 5 to 9 Years | 10 (2.5%) | 0 (0.0%) |
| 10 to 14 Years | 0 (0.0%) | 0 (0.0%) |
| 15 to 19 Years | 97 (23.9%) | 30 (11.1%) |
| 20 to 24 Years | 56 (13.8%) | 0 (0.0%) |
| 25 to 29 Years | 21 (5.2%) | 0 (0.0%) |
| 30 to 34 Years | 43 (10.6%) | 25 (9.2%) |
| 35 to 39 Years | 24 (5.9%) | 35 (12.9%) |
| 40 to 44 Years | 0 (0.0%) | 50 (18.4%) |
| 45 to 49 Years | 24 (5.9%) | 0 (0.0%) |
| 50 to 54 Years | 45 (11.1%) | 36 (13.3%) |
| 55 to 59 Years | 37 (9.1%) | 10 (3.7%) |
| 60 to 64 Years | 0 (0.0%) | 52 (19.2%) |
| 65 to 69 Years | 24 (5.9%) | 0 (0.0%) |
| 70 to 74 Years | 0 (0.0%) | 3 (1.1%) |
| 75 to 79 Years | 0 (0.0%) | 0 (0.0%) |
| 80 to 84 Years | 0 (0.0%) | 0 (0.0%) |
| 85 Years and over | 25 (6.2%) | 0 (0.0%) |
| Total | 406 (100.0%) | 271 (100.0%) |
Families and Households in New Salem
Median Family Size in New Salem
The median family size in New Salem is 2.75 persons per family, with married-couple families (146 | 67.3%) accounting for the largest median family size of 3.03 persons per family. On the other hand, single male/father families (36 | 16.6%) represent the smallest median family size with 2.06 persons per family.
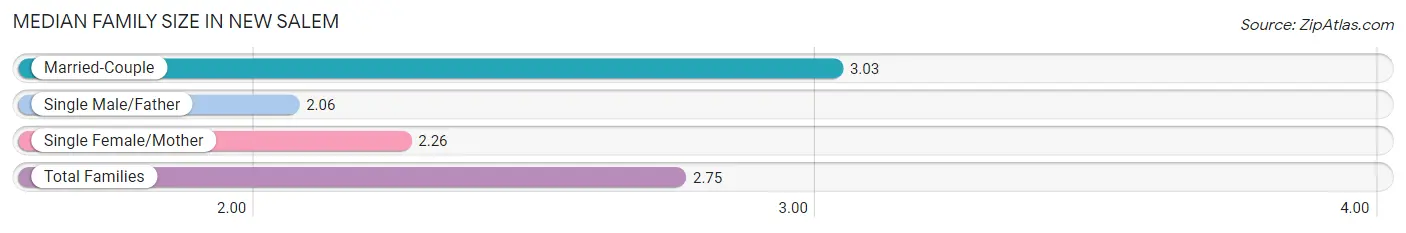
| Family Type | # Families | Family Size |
| Married-Couple | 146 (67.3%) | 3.03 |
| Single Male/Father | 36 (16.6%) | 2.06 |
| Single Female/Mother | 35 (16.1%) | 2.26 |
| Total Families | 217 (100.0%) | 2.75 |
Median Household Size in New Salem
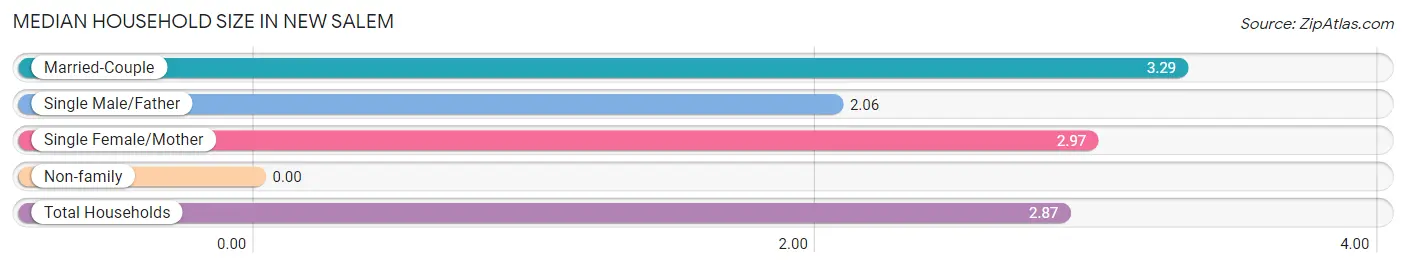
| Household Type | # Households | Household Size |
| Married-Couple | 146 (61.9%) | 3.29 |
| Single Male/Father | 36 (15.2%) | 2.06 |
| Single Female/Mother | 35 (14.8%) | 2.97 |
| Non-family | 19 (8.1%) | - |
| Total Households | 236 (100.0%) | 2.87 |
Household Size by Marriage Status in New Salem
Out of a total of 236 households in New Salem, 217 (91.9%) are family households, while 19 (8.1%) are nonfamily households. The most numerous type of family households are 2-person households, comprising 87, and the most common type of nonfamily households are 1-person households, comprising 19.
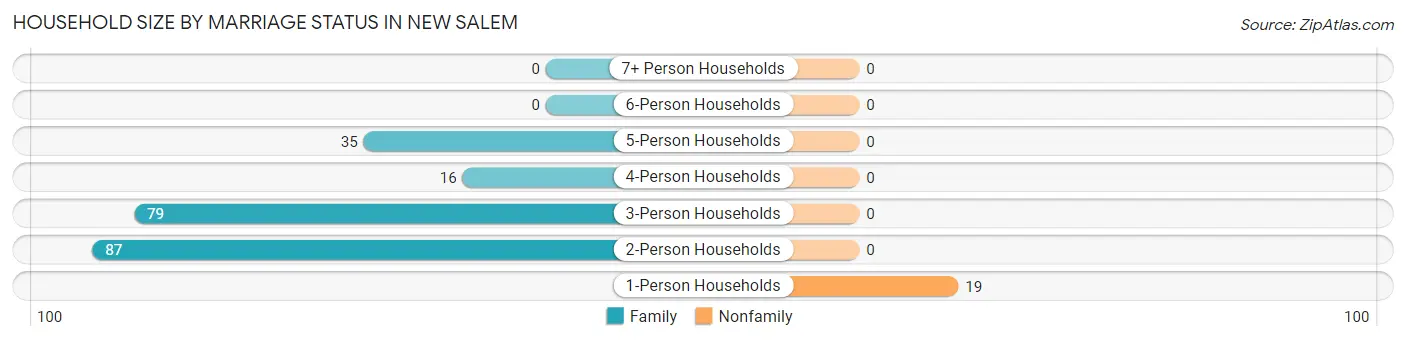
| Household Size | Family Households | Nonfamily Households |
| 1-Person Households | - | 19 (8.1%) |
| 2-Person Households | 87 (36.9%) | 0 (0.0%) |
| 3-Person Households | 79 (33.5%) | 0 (0.0%) |
| 4-Person Households | 16 (6.8%) | 0 (0.0%) |
| 5-Person Households | 35 (14.8%) | 0 (0.0%) |
| 6-Person Households | 0 (0.0%) | 0 (0.0%) |
| 7+ Person Households | 0 (0.0%) | 0 (0.0%) |
| Total | 217 (91.9%) | 19 (8.1%) |
Female Fertility in New Salem
Fertility by Age in New Salem
| Age Bracket | Women with Births | Births / 1,000 Women |
| 15 to 19 years | 0 (0.0%) | 0.0 |
| 20 to 34 years | 0 (0.0%) | 0.0 |
| 35 to 50 years | 0 (0.0%) | 0.0 |
| Total | 0 (0.0%) | 0.0 |
Fertility by Age by Marriage Status in New Salem
| Age Bracket | Married | Unmarried |
| 15 to 19 years | 0 (0.0%) | 0 (0.0%) |
| 20 to 34 years | 0 (0.0%) | 0 (0.0%) |
| 35 to 50 years | 0 (0.0%) | 0 (0.0%) |
| Total | 0 (0.0%) | 0 (0.0%) |
Fertility by Education in New Salem
| Educational Attainment | Women with Births | Births / 1,000 Women |
| Less than High School | 0 (0.0%) | 0.0 |
| High School Diploma | 0 (0.0%) | 0.0 |
| College or Associate's Degree | 0 (0.0%) | 0.0 |
| Bachelor's Degree | 0 (0.0%) | 0.0 |
| Graduate Degree | 0 (0.0%) | 0.0 |
| Total | 0 (0.0%) | 0.0 |
Fertility by Education by Marriage Status in New Salem
| Educational Attainment | Married | Unmarried |
| Less than High School | 0 (0.0%) | 0 (0.0%) |
| High School Diploma | 0 (0.0%) | 0 (0.0%) |
| College or Associate's Degree | 0 (0.0%) | 0 (0.0%) |
| Bachelor's Degree | 0 (0.0%) | 0 (0.0%) |
| Graduate Degree | 0 (0.0%) | 0 (0.0%) |
| Total | 0 (0.0%) | 0 (0.0%) |
Employment Characteristics in New Salem
Employment by Class of Employer in New Salem
Among the 331 employed individuals in New Salem, private company employees (275 | 83.1%), local government employees (29 | 8.8%), and self-employed (not incorporated) (27 | 8.2%) make up the most common classes of employment.
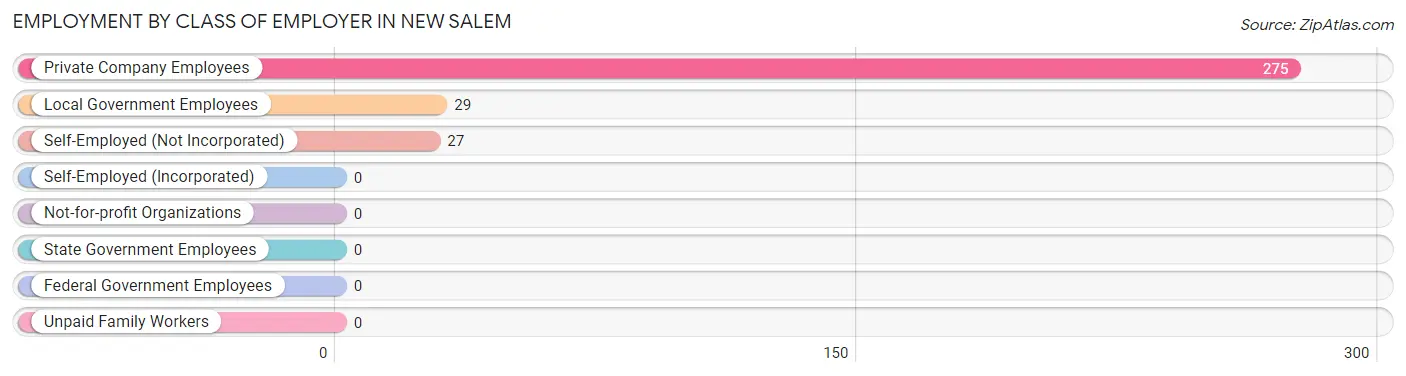
| Employer Class | # Employees | % Employees |
| Private Company Employees | 275 | 83.1% |
| Self-Employed (Incorporated) | 0 | 0.0% |
| Self-Employed (Not Incorporated) | 27 | 8.2% |
| Not-for-profit Organizations | 0 | 0.0% |
| Local Government Employees | 29 | 8.8% |
| State Government Employees | 0 | 0.0% |
| Federal Government Employees | 0 | 0.0% |
| Unpaid Family Workers | 0 | 0.0% |
| Total | 331 | 100.0% |
Employment Status by Age in New Salem
According to the labor force statistics for New Salem, out of the total population over 16 years of age (629), 63.0% or 396 individuals are in the labor force, with 16.4% or 65 of them unemployed. The age group with the highest labor force participation rate is 20 to 24 years, with 100.0% or 56 individuals in the labor force. Within the labor force, the 25 to 29 years age range has the highest percentage of unemployed individuals, with 52.4% or 11 of them being unemployed.
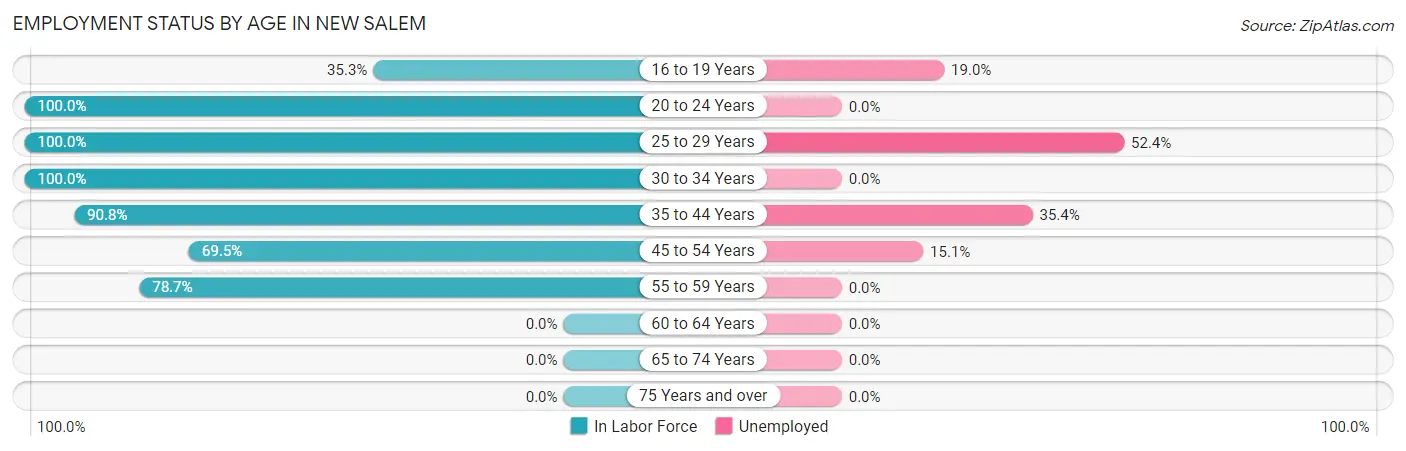
| Age Bracket | In Labor Force | Unemployed |
| 16 to 19 Years | 42 (35.3%) | 8 (19.0%) |
| 20 to 24 Years | 56 (100.0%) | 0 (0.0%) |
| 25 to 29 Years | 21 (100.0%) | 11 (52.4%) |
| 30 to 34 Years | 68 (100.0%) | 0 (0.0%) |
| 35 to 44 Years | 99 (90.8%) | 35 (35.4%) |
| 45 to 54 Years | 73 (69.5%) | 11 (15.1%) |
| 55 to 59 Years | 37 (78.7%) | 0 (0.0%) |
| 60 to 64 Years | 0 (0.0%) | 0 (0.0%) |
| 65 to 74 Years | 0 (0.0%) | 0 (0.0%) |
| 75 Years and over | 0 (0.0%) | 0 (0.0%) |
| Total | 396 (63.0%) | 65 (16.4%) |
Employment Status by Educational Attainment in New Salem
According to labor force statistics for New Salem, 74.1% of individuals (298) out of the total population between 25 and 64 years of age (402) are in the labor force, with 19.1% or 57 of them being unemployed. The group with the highest labor force participation rate are those with the educational attainment of college / associate degree, with 100.0% or 62 individuals in the labor force. Within the labor force, individuals with high school diploma education have the highest percentage of unemployment, with 35.4% or 57 of them being unemployed.
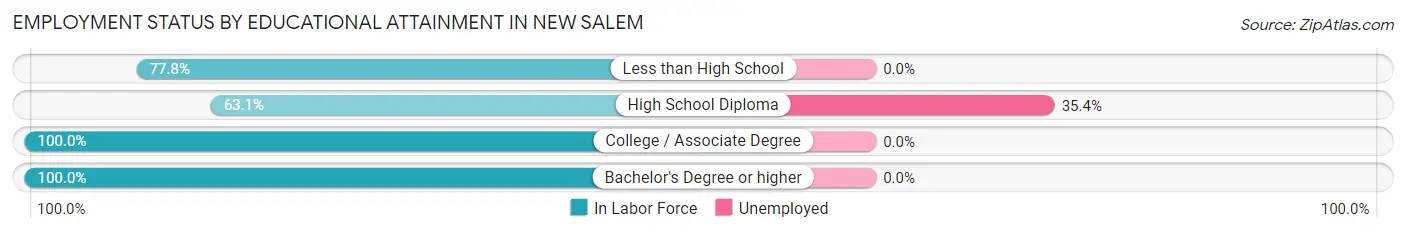
| Educational Attainment | In Labor Force | Unemployed |
| Less than High School | 35 (77.8%) | 0 (0.0%) |
| High School Diploma | 161 (63.1%) | 90 (35.4%) |
| College / Associate Degree | 62 (100.0%) | 0 (0.0%) |
| Bachelor's Degree or higher | 40 (100.0%) | 0 (0.0%) |
| Total | 298 (74.1%) | 77 (19.1%) |
Employment Occupations by Sex in New Salem
Management, Business, Science and Arts Occupations
The most common Management, Business, Science and Arts occupations in New Salem are Community & Social Service (29 | 8.8%), Education Instruction & Library (29 | 8.8%), Management (26 | 7.9%), Health Diagnosing & Treating (14 | 4.2%), and Computers, Engineering & Science (10 | 3.0%).
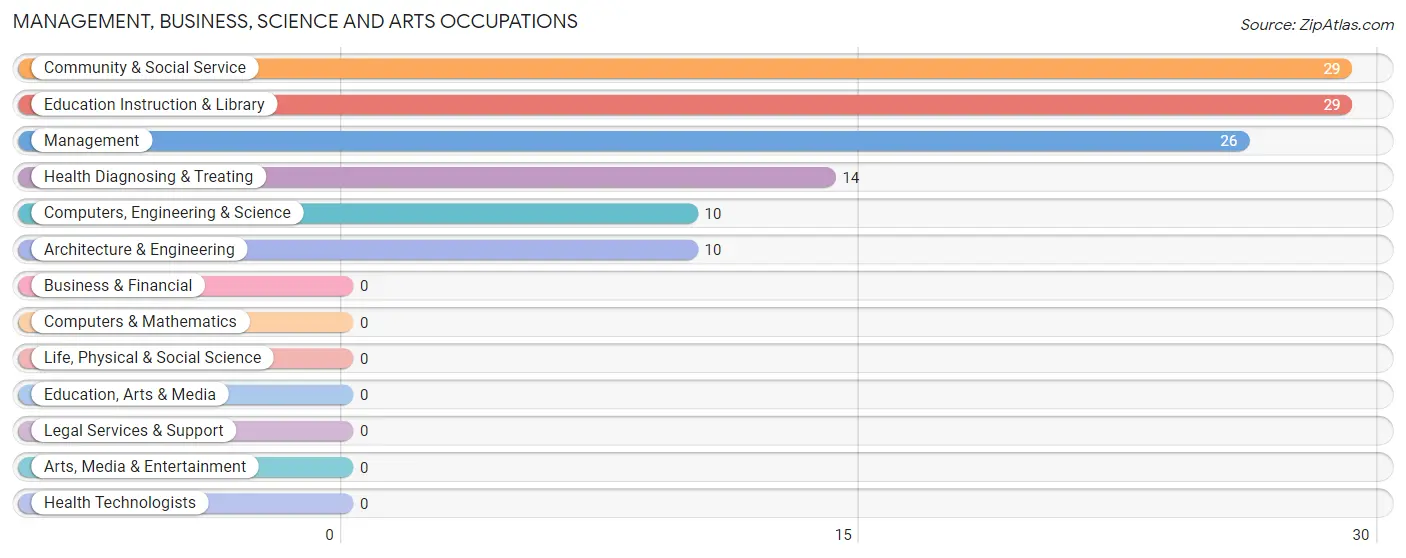
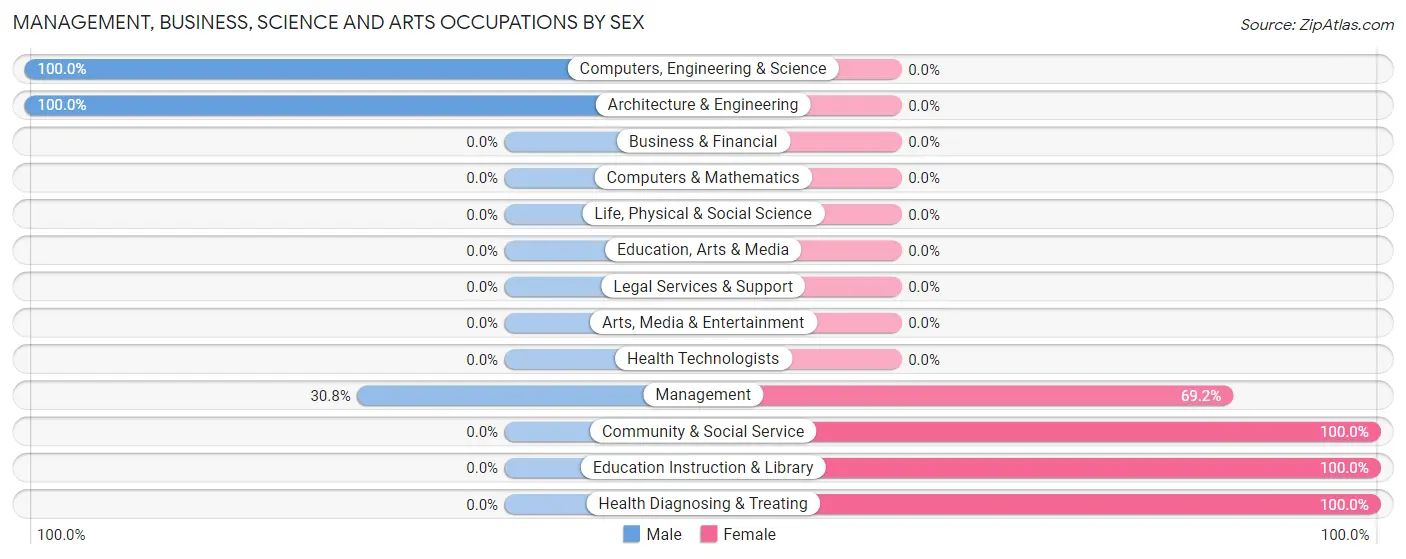
Management, Business, Science and Arts Occupations by Sex
Within the Management, Business, Science and Arts occupations in New Salem, the most male-oriented occupations are Computers, Engineering & Science (100.0%), Architecture & Engineering (100.0%), and Management (30.8%), while the most female-oriented occupations are Community & Social Service (100.0%), Education Instruction & Library (100.0%), and Health Diagnosing & Treating (100.0%).
| Occupation | Male | Female |
| Management | 8 (30.8%) | 18 (69.2%) |
| Business & Financial | 0 (0.0%) | 0 (0.0%) |
| Computers, Engineering & Science | 10 (100.0%) | 0 (0.0%) |
| Computers & Mathematics | 0 (0.0%) | 0 (0.0%) |
| Architecture & Engineering | 10 (100.0%) | 0 (0.0%) |
| Life, Physical & Social Science | 0 (0.0%) | 0 (0.0%) |
| Community & Social Service | 0 (0.0%) | 29 (100.0%) |
| Education, Arts & Media | 0 (0.0%) | 0 (0.0%) |
| Legal Services & Support | 0 (0.0%) | 0 (0.0%) |
| Education Instruction & Library | 0 (0.0%) | 29 (100.0%) |
| Arts, Media & Entertainment | 0 (0.0%) | 0 (0.0%) |
| Health Diagnosing & Treating | 0 (0.0%) | 14 (100.0%) |
| Health Technologists | 0 (0.0%) | 0 (0.0%) |
| Total (Category) | 18 (22.8%) | 61 (77.2%) |
| Total (Overall) | 253 (76.4%) | 78 (23.6%) |
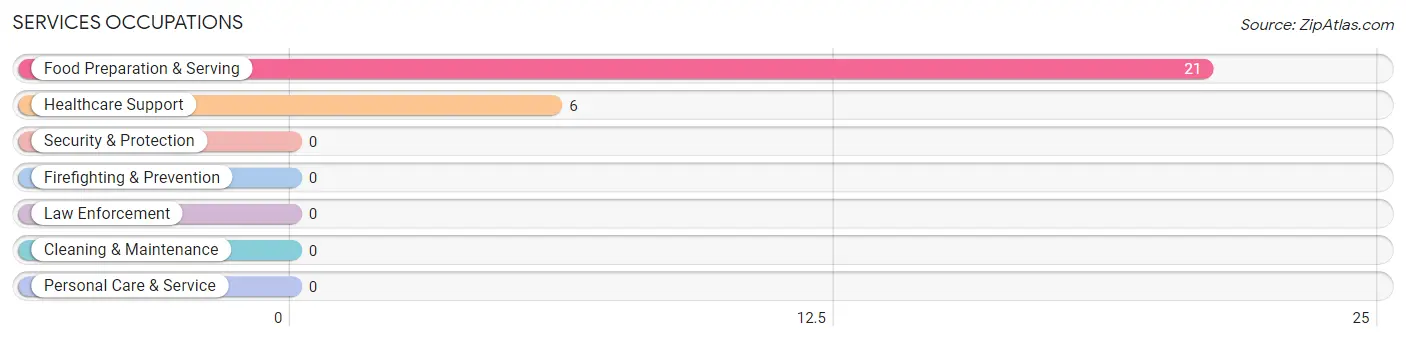
Services Occupations
The most common Services occupations in New Salem are Food Preparation & Serving (21 | 6.3%), and Healthcare Support (6 | 1.8%).
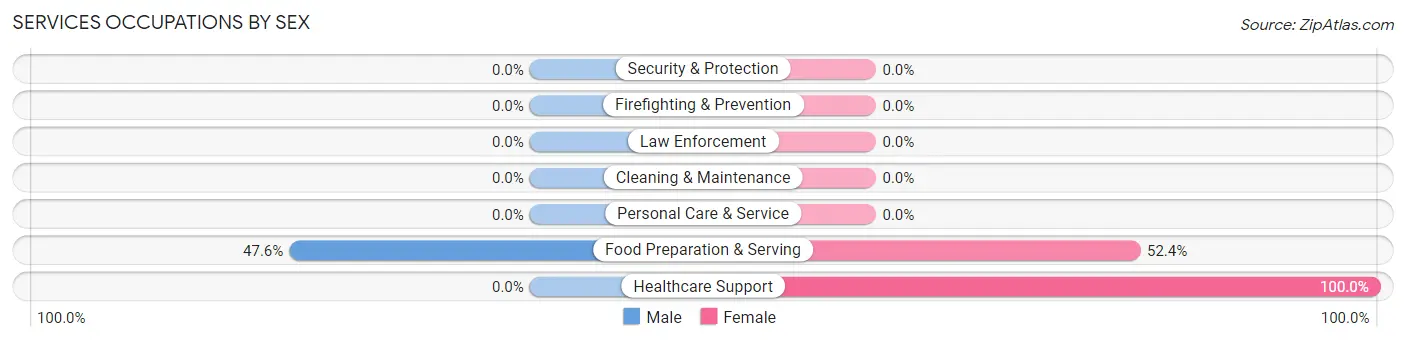
Services Occupations by Sex
| Occupation | Male | Female |
| Healthcare Support | 0 (0.0%) | 6 (100.0%) |
| Security & Protection | 0 (0.0%) | 0 (0.0%) |
| Firefighting & Prevention | 0 (0.0%) | 0 (0.0%) |
| Law Enforcement | 0 (0.0%) | 0 (0.0%) |
| Food Preparation & Serving | 10 (47.6%) | 11 (52.4%) |
| Cleaning & Maintenance | 0 (0.0%) | 0 (0.0%) |
| Personal Care & Service | 0 (0.0%) | 0 (0.0%) |
| Total (Category) | 10 (37.0%) | 17 (63.0%) |
| Total (Overall) | 253 (76.4%) | 78 (23.6%) |
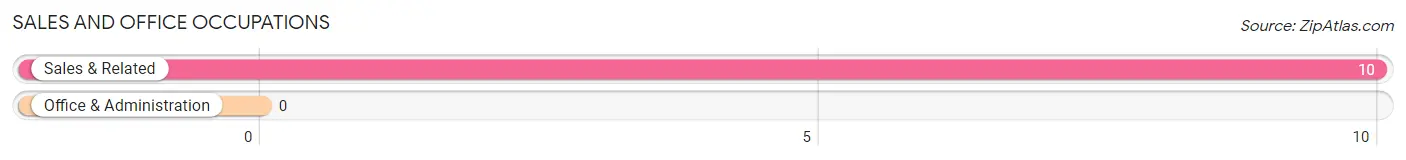
Sales and Office Occupations
The most common Sales and Office occupations in New Salem are , and Sales & Related (10 | 3.0%).
Sales and Office Occupations by Sex
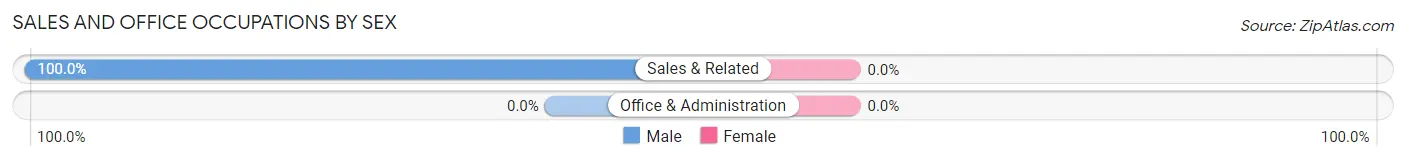
| Occupation | Male | Female |
| Sales & Related | 10 (100.0%) | 0 (0.0%) |
| Office & Administration | 0 (0.0%) | 0 (0.0%) |
| Total (Category) | 10 (100.0%) | 0 (0.0%) |
| Total (Overall) | 253 (76.4%) | 78 (23.6%) |
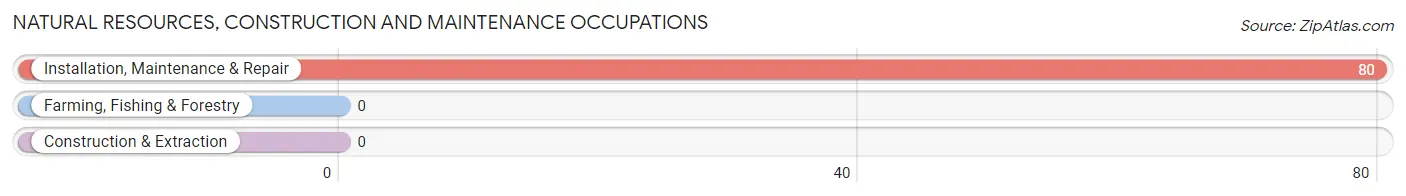
Natural Resources, Construction and Maintenance Occupations
The most common Natural Resources, Construction and Maintenance occupations in New Salem are , and Installation, Maintenance & Repair (80 | 24.2%).
Natural Resources, Construction and Maintenance Occupations by Sex
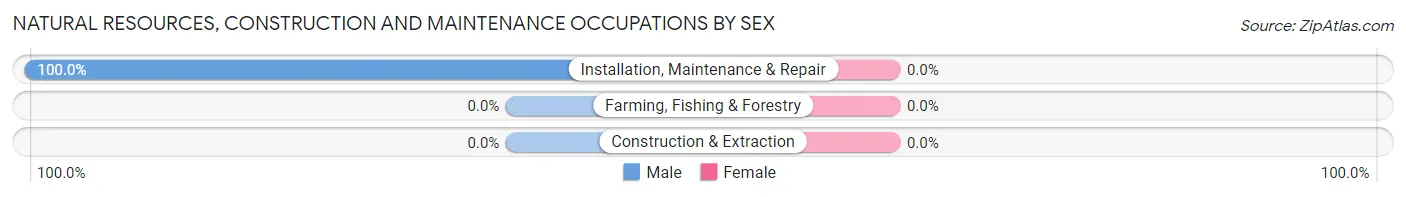
| Occupation | Male | Female |
| Farming, Fishing & Forestry | 0 (0.0%) | 0 (0.0%) |
| Construction & Extraction | 0 (0.0%) | 0 (0.0%) |
| Installation, Maintenance & Repair | 80 (100.0%) | 0 (0.0%) |
| Total (Category) | 80 (100.0%) | 0 (0.0%) |
| Total (Overall) | 253 (76.4%) | 78 (23.6%) |
Production, Transportation and Moving Occupations
The most common Production, Transportation and Moving occupations in New Salem are Production (52 | 15.7%), Material Moving (50 | 15.1%), and Transportation (33 | 10.0%).
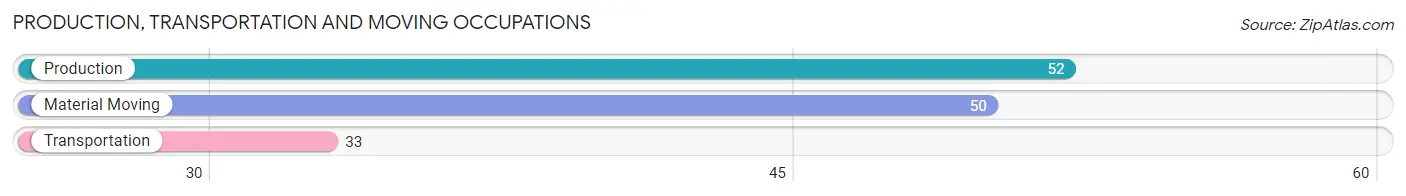
Production, Transportation and Moving Occupations by Sex
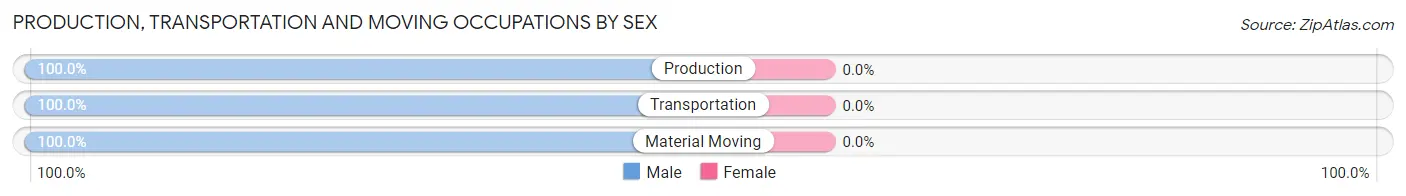
| Occupation | Male | Female |
| Production | 52 (100.0%) | 0 (0.0%) |
| Transportation | 33 (100.0%) | 0 (0.0%) |
| Material Moving | 50 (100.0%) | 0 (0.0%) |
| Total (Category) | 135 (100.0%) | 0 (0.0%) |
| Total (Overall) | 253 (76.4%) | 78 (23.6%) |
Employment Industries by Sex in New Salem
Employment Industries in New Salem
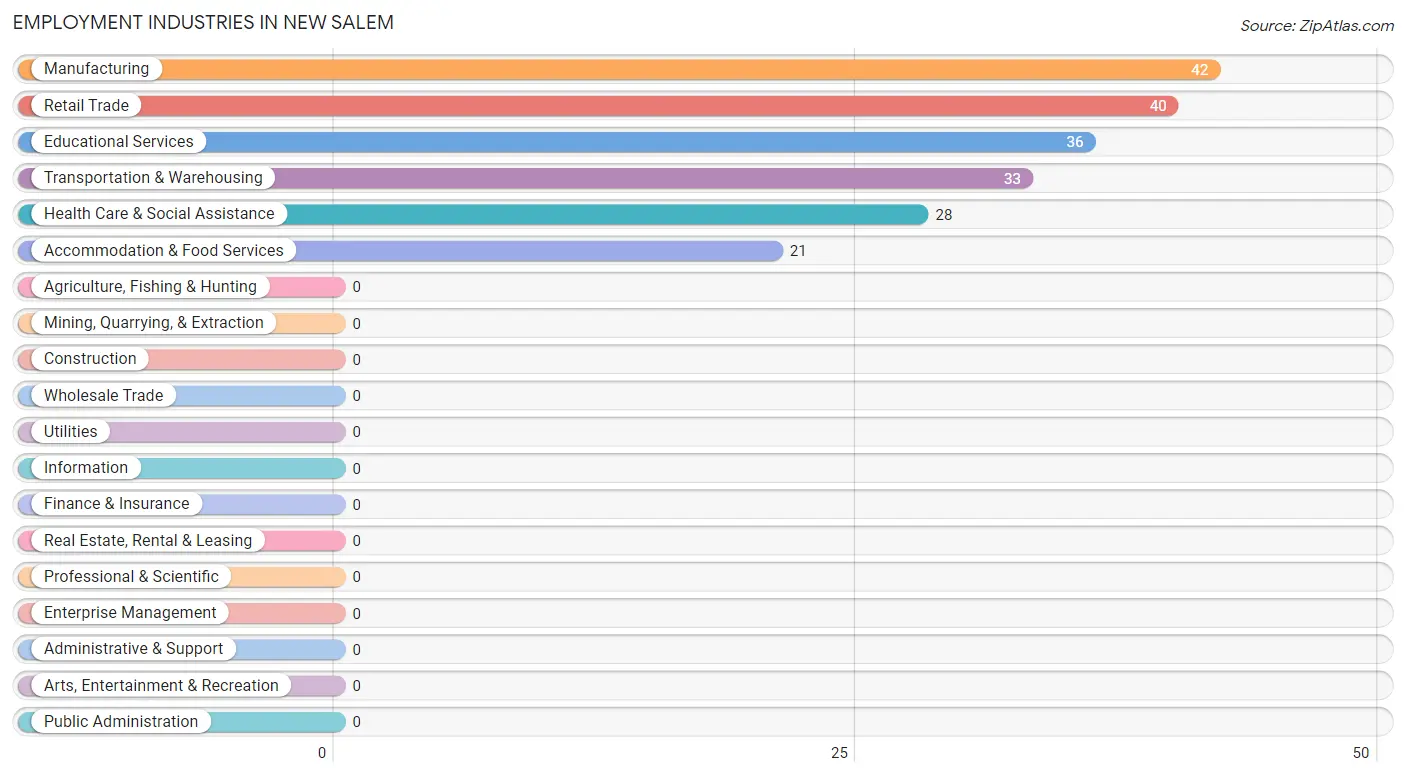
The major employment industries in New Salem include Manufacturing (42 | 12.7%), Retail Trade (40 | 12.1%), Educational Services (36 | 10.9%), Transportation & Warehousing (33 | 10.0%), and Health Care & Social Assistance (28 | 8.5%).
Employment Industries by Sex in New Salem
The New Salem industries that see more men than women are Manufacturing (100.0%), Transportation & Warehousing (100.0%), and Retail Trade (72.5%), whereas the industries that tend to have a higher number of women are Educational Services (100.0%), Health Care & Social Assistance (71.4%), and Accommodation & Food Services (52.4%).
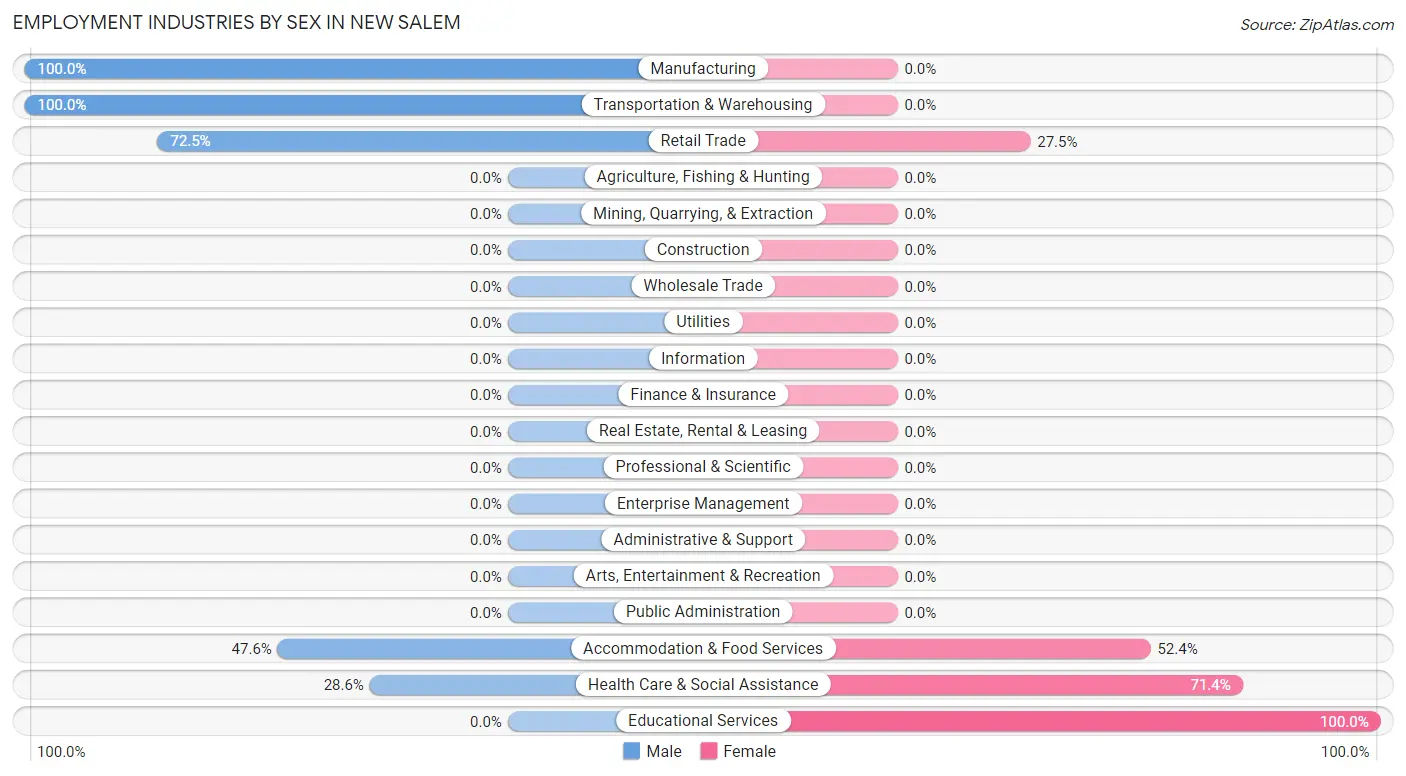
| Industry | Male | Female |
| Agriculture, Fishing & Hunting | 0 (0.0%) | 0 (0.0%) |
| Mining, Quarrying, & Extraction | 0 (0.0%) | 0 (0.0%) |
| Construction | 0 (0.0%) | 0 (0.0%) |
| Manufacturing | 42 (100.0%) | 0 (0.0%) |
| Wholesale Trade | 0 (0.0%) | 0 (0.0%) |
| Retail Trade | 29 (72.5%) | 11 (27.5%) |
| Transportation & Warehousing | 33 (100.0%) | 0 (0.0%) |
| Utilities | 0 (0.0%) | 0 (0.0%) |
| Information | 0 (0.0%) | 0 (0.0%) |
| Finance & Insurance | 0 (0.0%) | 0 (0.0%) |
| Real Estate, Rental & Leasing | 0 (0.0%) | 0 (0.0%) |
| Professional & Scientific | 0 (0.0%) | 0 (0.0%) |
| Enterprise Management | 0 (0.0%) | 0 (0.0%) |
| Administrative & Support | 0 (0.0%) | 0 (0.0%) |
| Educational Services | 0 (0.0%) | 36 (100.0%) |
| Health Care & Social Assistance | 8 (28.6%) | 20 (71.4%) |
| Arts, Entertainment & Recreation | 0 (0.0%) | 0 (0.0%) |
| Accommodation & Food Services | 10 (47.6%) | 11 (52.4%) |
| Public Administration | 0 (0.0%) | 0 (0.0%) |
| Total | 253 (76.4%) | 78 (23.6%) |
Education in New Salem
School Enrollment in New Salem
The most common levels of schooling among the 74 students in New Salem are high school (55 | 74.3%), kindergarten (10 | 13.5%), and college / undergraduate (9 | 12.2%).
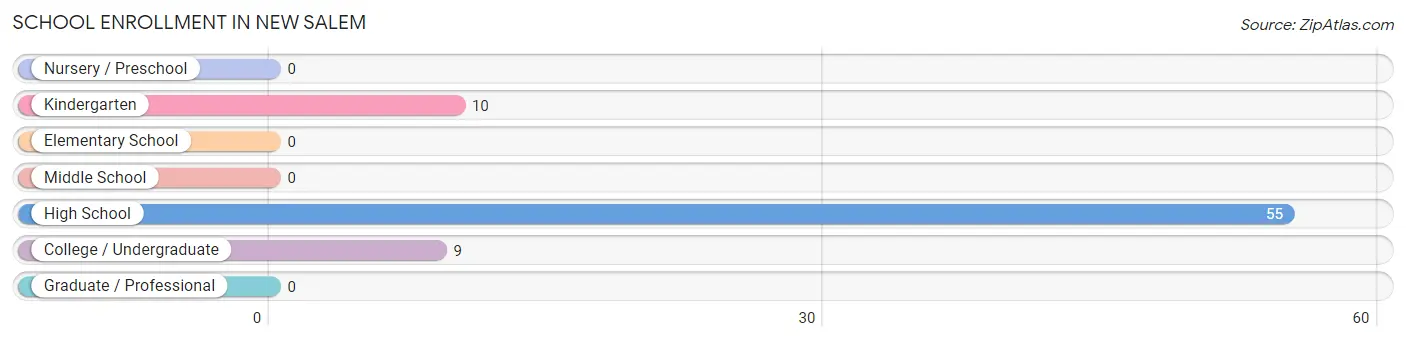
| School Level | # Students | % Students |
| Nursery / Preschool | 0 | 0.0% |
| Kindergarten | 10 | 13.5% |
| Elementary School | 0 | 0.0% |
| Middle School | 0 | 0.0% |
| High School | 55 | 74.3% |
| College / Undergraduate | 9 | 12.2% |
| Graduate / Professional | 0 | 0.0% |
| Total | 74 | 100.0% |
School Enrollment by Age by Funding Source in New Salem
Out of a total of 74 students who are enrolled in schools in New Salem, 9 (12.2%) attend a private institution, while the remaining 65 (87.8%) are enrolled in public schools. The age group of 18 to 19 year olds has the highest likelihood of being enrolled in private schools, with 9 (100.0% in the age bracket) enrolled. Conversely, the age group of 5 to 9 year old has the lowest likelihood of being enrolled in a private school, with 10 (100.0% in the age bracket) attending a public institution.
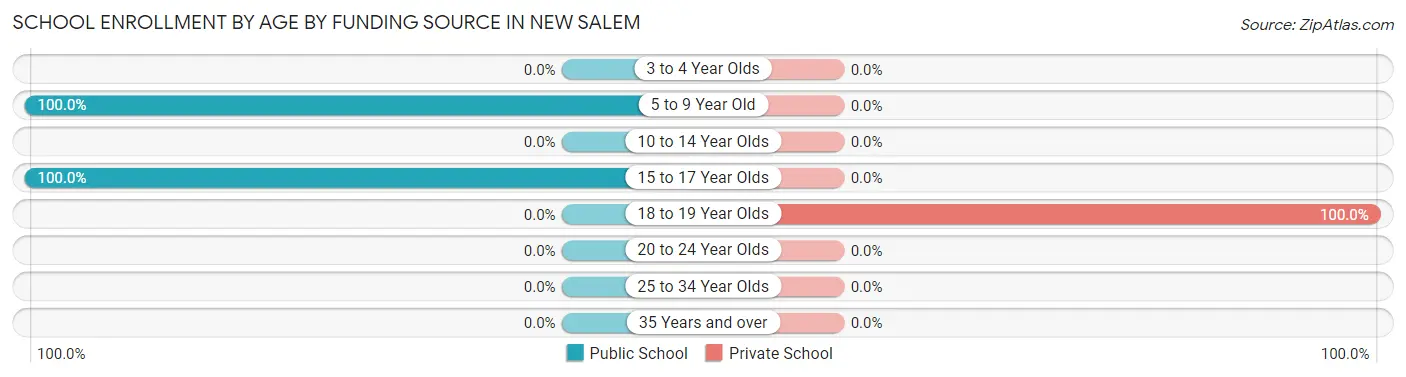
| Age Bracket | Public School | Private School |
| 3 to 4 Year Olds | 0 (0.0%) | 0 (0.0%) |
| 5 to 9 Year Old | 10 (100.0%) | 0 (0.0%) |
| 10 to 14 Year Olds | 0 (0.0%) | 0 (0.0%) |
| 15 to 17 Year Olds | 55 (100.0%) | 0 (0.0%) |
| 18 to 19 Year Olds | 0 (0.0%) | 9 (100.0%) |
| 20 to 24 Year Olds | 0 (0.0%) | 0 (0.0%) |
| 25 to 34 Year Olds | 0 (0.0%) | 0 (0.0%) |
| 35 Years and over | 0 (0.0%) | 0 (0.0%) |
| Total | 65 (87.8%) | 9 (12.2%) |
Educational Attainment by Field of Study in New Salem
Education (29 | 72.5%), and business (11 | 27.5%) are the most common fields of study among 40 individuals in New Salem who have obtained a bachelor's degree or higher.
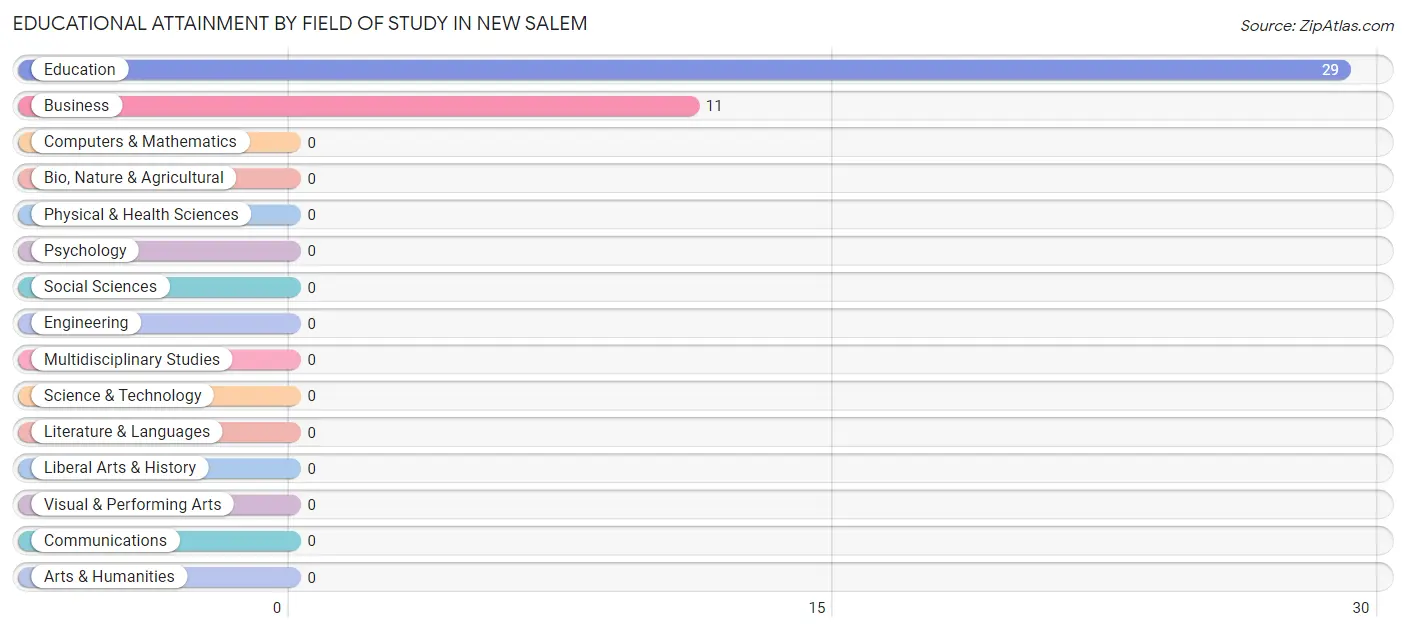
| Field of Study | # Graduates | % Graduates |
| Computers & Mathematics | 0 | 0.0% |
| Bio, Nature & Agricultural | 0 | 0.0% |
| Physical & Health Sciences | 0 | 0.0% |
| Psychology | 0 | 0.0% |
| Social Sciences | 0 | 0.0% |
| Engineering | 0 | 0.0% |
| Multidisciplinary Studies | 0 | 0.0% |
| Science & Technology | 0 | 0.0% |
| Business | 11 | 27.5% |
| Education | 29 | 72.5% |
| Literature & Languages | 0 | 0.0% |
| Liberal Arts & History | 0 | 0.0% |
| Visual & Performing Arts | 0 | 0.0% |
| Communications | 0 | 0.0% |
| Arts & Humanities | 0 | 0.0% |
| Total | 40 | 100.0% |
Transportation & Commute in New Salem
Vehicle Availability by Sex in New Salem
The most prevalent vehicle ownership categories in New Salem are males with 3 vehicles (147, accounting for 58.1%) and females with 3 vehicles (47, making up 188.5%).
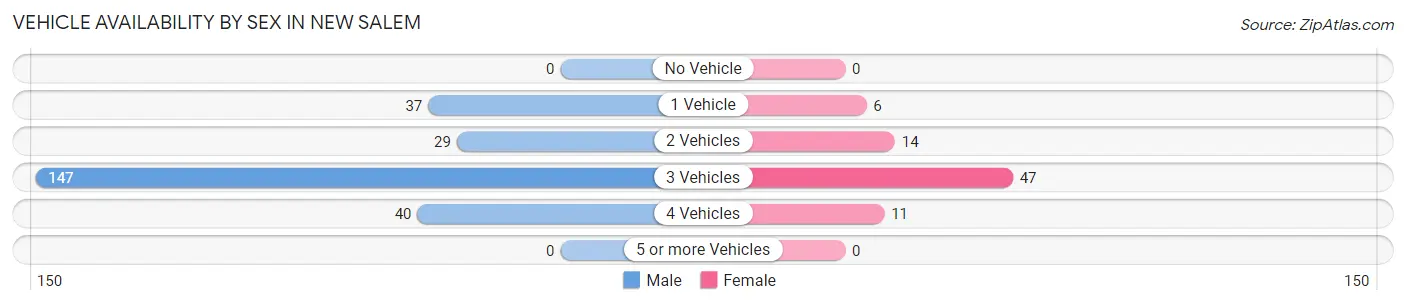
| Vehicles Available | Male | Female |
| No Vehicle | 0 (0.0%) | 0 (0.0%) |
| 1 Vehicle | 37 (14.6%) | 6 (7.7%) |
| 2 Vehicles | 29 (11.5%) | 14 (17.9%) |
| 3 Vehicles | 147 (58.1%) | 47 (60.3%) |
| 4 Vehicles | 40 (15.8%) | 11 (14.1%) |
| 5 or more Vehicles | 0 (0.0%) | 0 (0.0%) |
| Total | 253 (100.0%) | 78 (100.0%) |
Commute Time in New Salem
The most frequently occuring commute durations in New Salem are 30 to 34 minutes (169 commuters, 51.1%), 45 to 59 minutes (43 commuters, 13.0%), and 20 to 24 minutes (34 commuters, 10.3%).
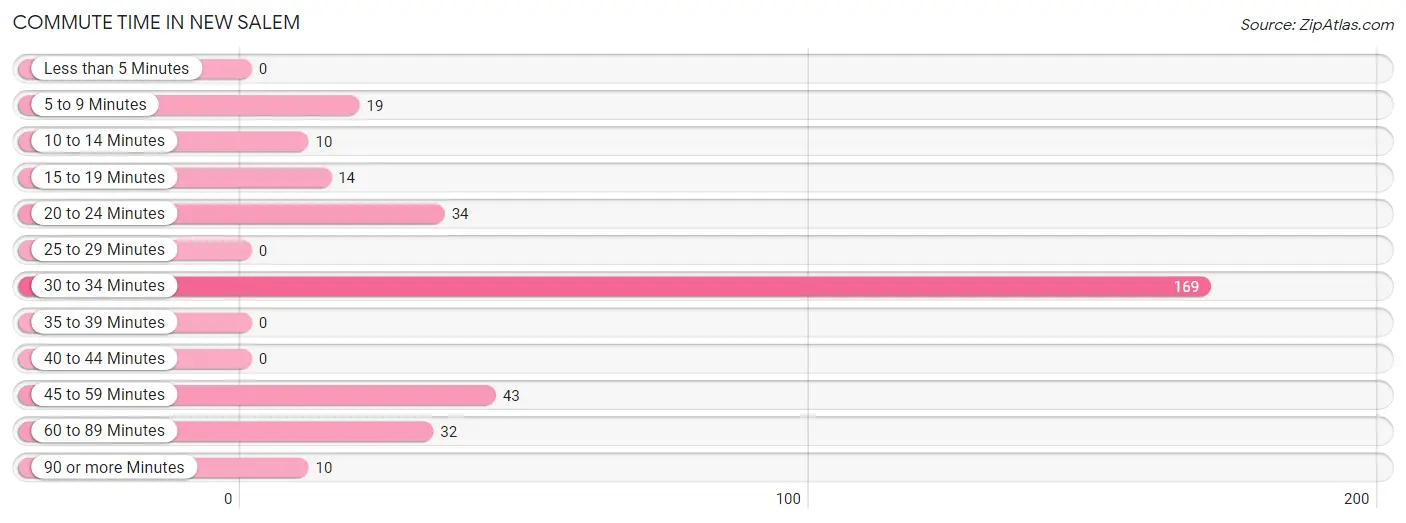
| Commute Time | # Commuters | % Commuters |
| Less than 5 Minutes | 0 | 0.0% |
| 5 to 9 Minutes | 19 | 5.7% |
| 10 to 14 Minutes | 10 | 3.0% |
| 15 to 19 Minutes | 14 | 4.2% |
| 20 to 24 Minutes | 34 | 10.3% |
| 25 to 29 Minutes | 0 | 0.0% |
| 30 to 34 Minutes | 169 | 51.1% |
| 35 to 39 Minutes | 0 | 0.0% |
| 40 to 44 Minutes | 0 | 0.0% |
| 45 to 59 Minutes | 43 | 13.0% |
| 60 to 89 Minutes | 32 | 9.7% |
| 90 or more Minutes | 10 | 3.0% |
Commute Time by Sex in New Salem
The most common commute times in New Salem are 30 to 34 minutes (116 commuters, 45.9%) for males and 30 to 34 minutes (53 commuters, 67.9%) for females.
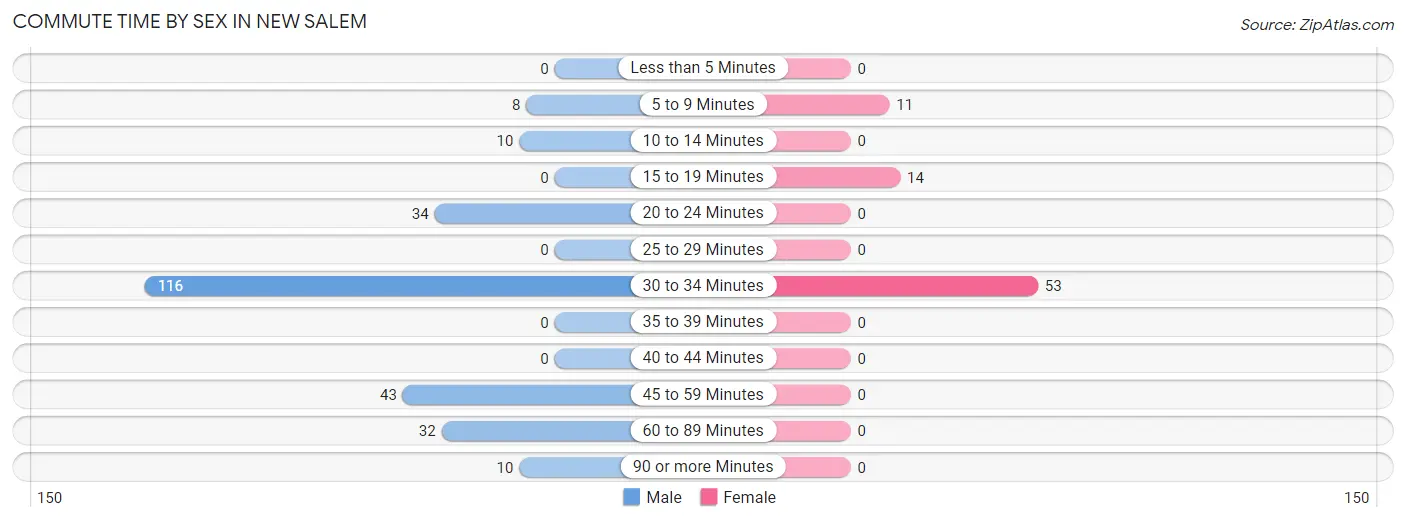
| Commute Time | Male | Female |
| Less than 5 Minutes | 0 (0.0%) | 0 (0.0%) |
| 5 to 9 Minutes | 8 (3.2%) | 11 (14.1%) |
| 10 to 14 Minutes | 10 (4.0%) | 0 (0.0%) |
| 15 to 19 Minutes | 0 (0.0%) | 14 (17.9%) |
| 20 to 24 Minutes | 34 (13.4%) | 0 (0.0%) |
| 25 to 29 Minutes | 0 (0.0%) | 0 (0.0%) |
| 30 to 34 Minutes | 116 (45.9%) | 53 (67.9%) |
| 35 to 39 Minutes | 0 (0.0%) | 0 (0.0%) |
| 40 to 44 Minutes | 0 (0.0%) | 0 (0.0%) |
| 45 to 59 Minutes | 43 (17.0%) | 0 (0.0%) |
| 60 to 89 Minutes | 32 (12.7%) | 0 (0.0%) |
| 90 or more Minutes | 10 (4.0%) | 0 (0.0%) |
Time of Departure to Work by Sex in New Salem
The most frequent times of departure to work in New Salem are 12:00 AM to 4:59 AM (91, 36.0%) for males and 5:30 AM to 5:59 AM (40, 51.3%) for females.
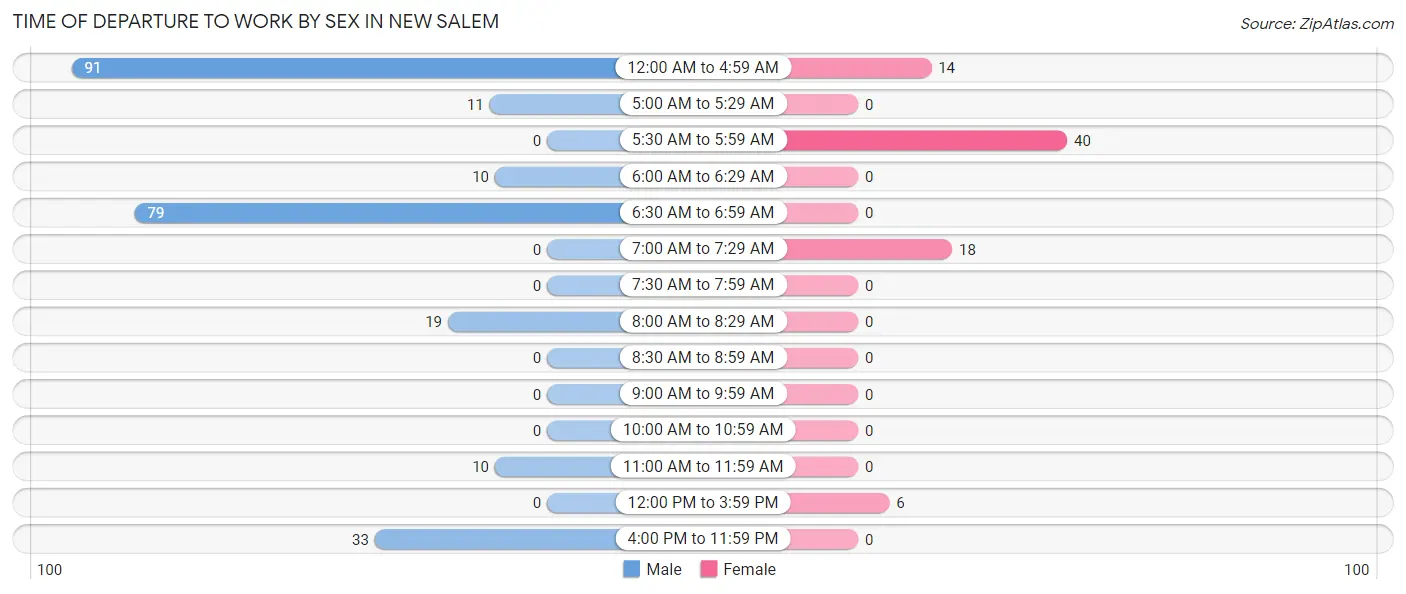
| Time of Departure | Male | Female |
| 12:00 AM to 4:59 AM | 91 (36.0%) | 14 (17.9%) |
| 5:00 AM to 5:29 AM | 11 (4.3%) | 0 (0.0%) |
| 5:30 AM to 5:59 AM | 0 (0.0%) | 40 (51.3%) |
| 6:00 AM to 6:29 AM | 10 (4.0%) | 0 (0.0%) |
| 6:30 AM to 6:59 AM | 79 (31.2%) | 0 (0.0%) |
| 7:00 AM to 7:29 AM | 0 (0.0%) | 18 (23.1%) |
| 7:30 AM to 7:59 AM | 0 (0.0%) | 0 (0.0%) |
| 8:00 AM to 8:29 AM | 19 (7.5%) | 0 (0.0%) |
| 8:30 AM to 8:59 AM | 0 (0.0%) | 0 (0.0%) |
| 9:00 AM to 9:59 AM | 0 (0.0%) | 0 (0.0%) |
| 10:00 AM to 10:59 AM | 0 (0.0%) | 0 (0.0%) |
| 11:00 AM to 11:59 AM | 10 (4.0%) | 0 (0.0%) |
| 12:00 PM to 3:59 PM | 0 (0.0%) | 6 (7.7%) |
| 4:00 PM to 11:59 PM | 33 (13.0%) | 0 (0.0%) |
| Total | 253 (100.0%) | 78 (100.0%) |
Housing Occupancy in New Salem
Occupancy by Ownership in New Salem
Of the total 236 dwellings in New Salem, owner-occupied units account for 236 (100.0%), while renter-occupied units make up 0 (0.0%).
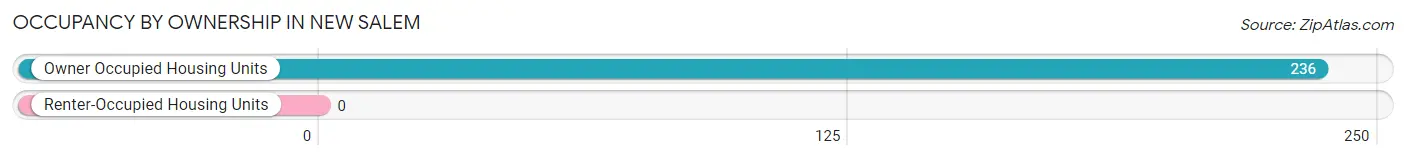
| Occupancy | # Housing Units | % Housing Units |
| Owner Occupied Housing Units | 236 | 100.0% |
| Renter-Occupied Housing Units | 0 | 0.0% |
| Total Occupied Housing Units | 236 | 100.0% |
Occupancy by Household Size in New Salem
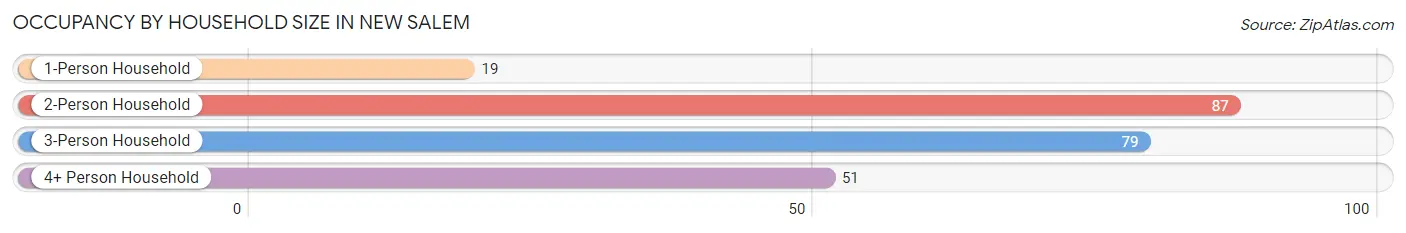
| Household Size | # Housing Units | % Housing Units |
| 1-Person Household | 19 | 8.1% |
| 2-Person Household | 87 | 36.9% |
| 3-Person Household | 79 | 33.5% |
| 4+ Person Household | 51 | 21.6% |
| Total Housing Units | 236 | 100.0% |
Occupancy by Ownership by Household Size in New Salem
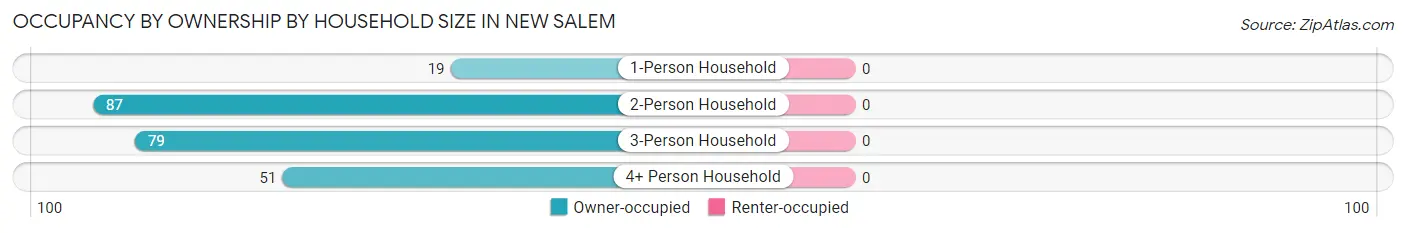
| Household Size | Owner-occupied | Renter-occupied |
| 1-Person Household | 19 (100.0%) | 0 (0.0%) |
| 2-Person Household | 87 (100.0%) | 0 (0.0%) |
| 3-Person Household | 79 (100.0%) | 0 (0.0%) |
| 4+ Person Household | 51 (100.0%) | 0 (0.0%) |
| Total Housing Units | 236 (100.0%) | 0 (0.0%) |
Occupancy by Educational Attainment in New Salem
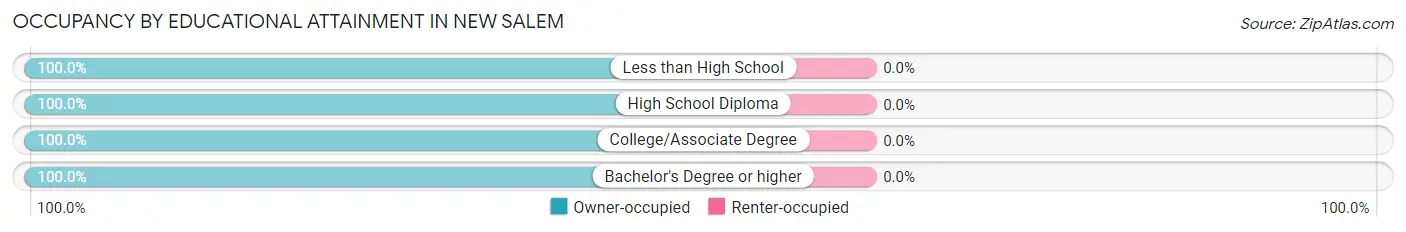
| Household Size | Owner-occupied | Renter-occupied |
| Less than High School | 18 (100.0%) | 0 (0.0%) |
| High School Diploma | 147 (100.0%) | 0 (0.0%) |
| College/Associate Degree | 31 (100.0%) | 0 (0.0%) |
| Bachelor's Degree or higher | 40 (100.0%) | 0 (0.0%) |
Occupancy by Age of Householder in New Salem
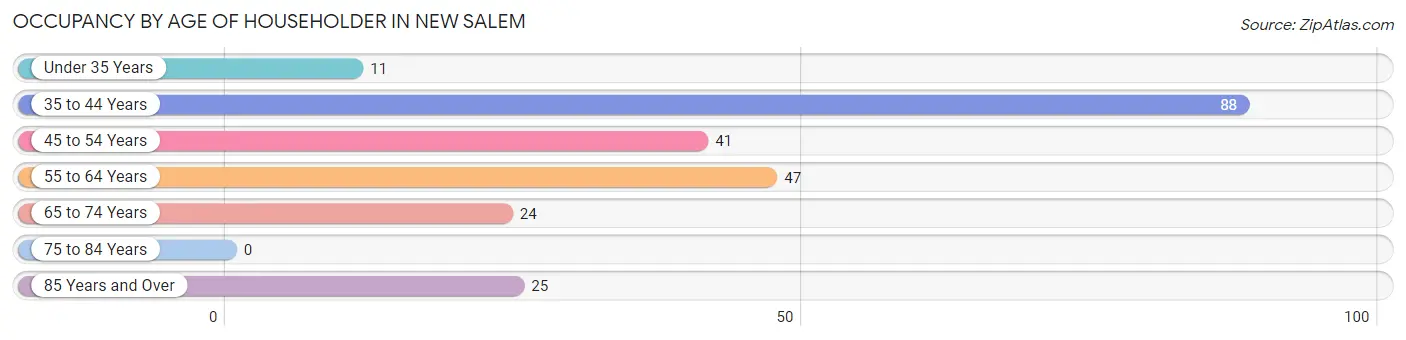
| Age Bracket | # Households | % Households |
| Under 35 Years | 11 | 4.7% |
| 35 to 44 Years | 88 | 37.3% |
| 45 to 54 Years | 41 | 17.4% |
| 55 to 64 Years | 47 | 19.9% |
| 65 to 74 Years | 24 | 10.2% |
| 75 to 84 Years | 0 | 0.0% |
| 85 Years and Over | 25 | 10.6% |
| Total | 236 | 100.0% |
Housing Finances in New Salem
Median Income by Occupancy in New Salem
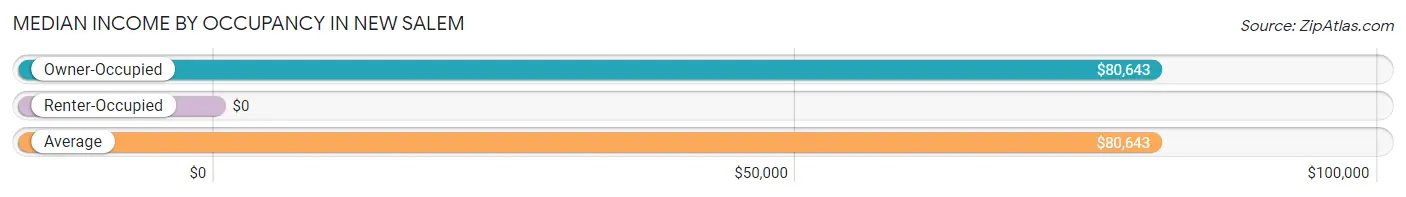
| Occupancy Type | # Households | Median Income |
| Owner-Occupied | 236 (100.0%) | $80,643 |
| Renter-Occupied | 0 (0.0%) | $0 |
| Average | 236 (100.0%) | $80,643 |
Occupancy by Householder Income Bracket in New Salem
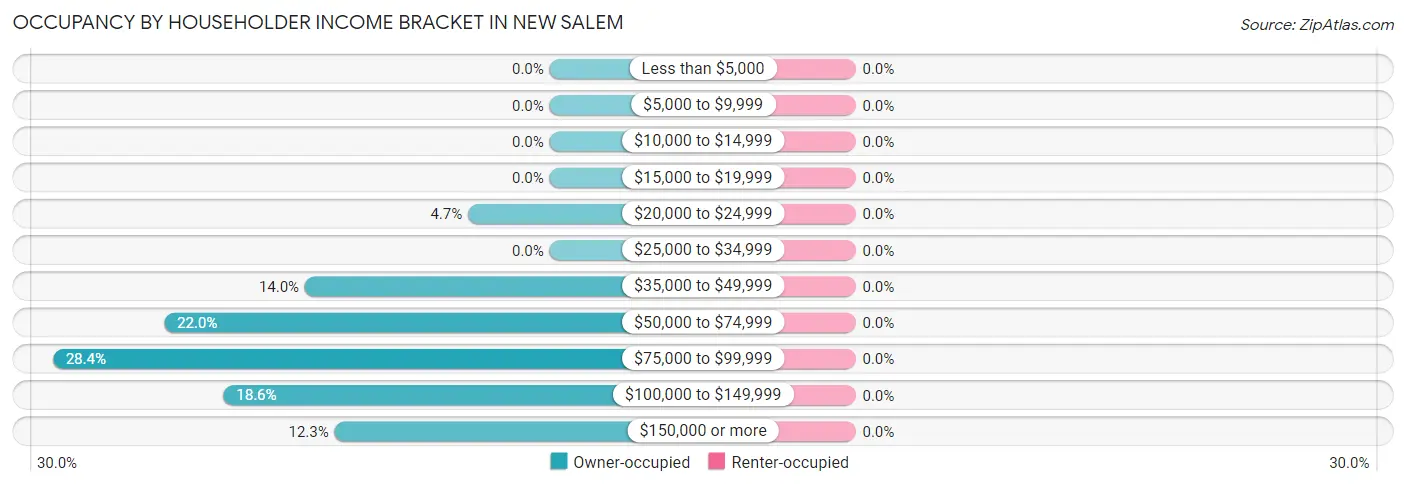
| Income Bracket | Owner-occupied | Renter-occupied |
| Less than $5,000 | 0 (0.0%) | 0 (0.0%) |
| $5,000 to $9,999 | 0 (0.0%) | 0 (0.0%) |
| $10,000 to $14,999 | 0 (0.0%) | 0 (0.0%) |
| $15,000 to $19,999 | 0 (0.0%) | 0 (0.0%) |
| $20,000 to $24,999 | 11 (4.7%) | 0 (0.0%) |
| $25,000 to $34,999 | 0 (0.0%) | 0 (0.0%) |
| $35,000 to $49,999 | 33 (14.0%) | 0 (0.0%) |
| $50,000 to $74,999 | 52 (22.0%) | 0 (0.0%) |
| $75,000 to $99,999 | 67 (28.4%) | 0 (0.0%) |
| $100,000 to $149,999 | 44 (18.6%) | 0 (0.0%) |
| $150,000 or more | 29 (12.3%) | 0 (0.0%) |
| Total | 236 (100.0%) | 0 (0.0%) |
Monthly Housing Cost Tiers in New Salem
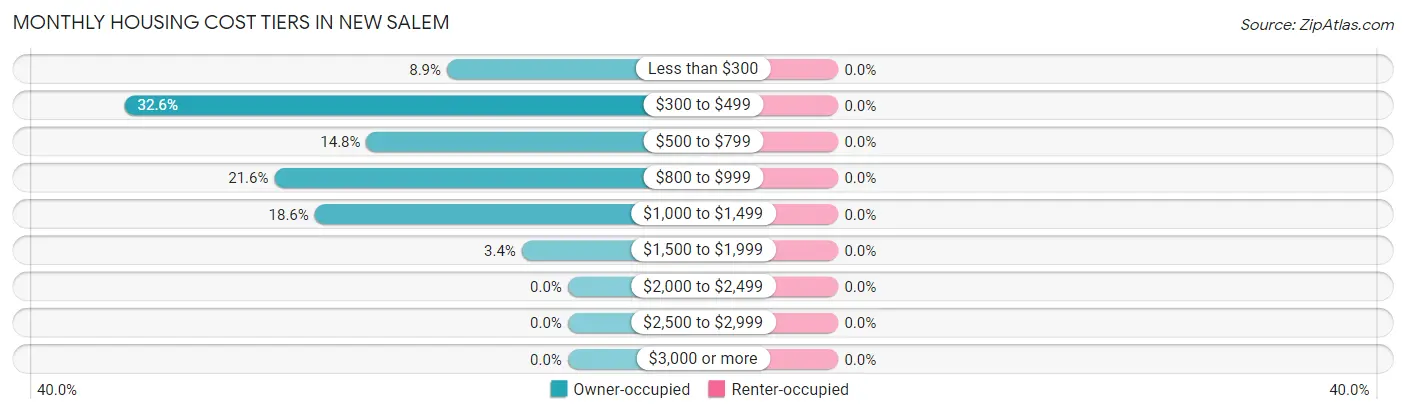
| Monthly Cost | Owner-occupied | Renter-occupied |
| Less than $300 | 21 (8.9%) | 0 (0.0%) |
| $300 to $499 | 77 (32.6%) | 0 (0.0%) |
| $500 to $799 | 35 (14.8%) | 0 (0.0%) |
| $800 to $999 | 51 (21.6%) | 0 (0.0%) |
| $1,000 to $1,499 | 44 (18.6%) | 0 (0.0%) |
| $1,500 to $1,999 | 8 (3.4%) | 0 (0.0%) |
| $2,000 to $2,499 | 0 (0.0%) | 0 (0.0%) |
| $2,500 to $2,999 | 0 (0.0%) | 0 (0.0%) |
| $3,000 or more | 0 (0.0%) | 0 (0.0%) |
| Total | 236 (100.0%) | 0 (0.0%) |
Physical Housing Characteristics in New Salem
Housing Structures in New Salem
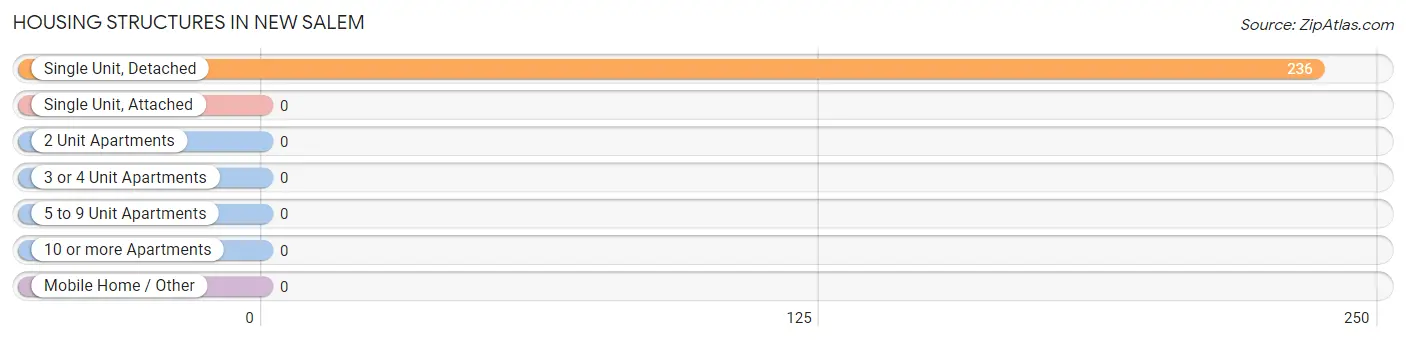
| Structure Type | # Housing Units | % Housing Units |
| Single Unit, Detached | 236 | 100.0% |
| Single Unit, Attached | 0 | 0.0% |
| 2 Unit Apartments | 0 | 0.0% |
| 3 or 4 Unit Apartments | 0 | 0.0% |
| 5 to 9 Unit Apartments | 0 | 0.0% |
| 10 or more Apartments | 0 | 0.0% |
| Mobile Home / Other | 0 | 0.0% |
| Total | 236 | 100.0% |
Housing Structures by Occupancy in New Salem
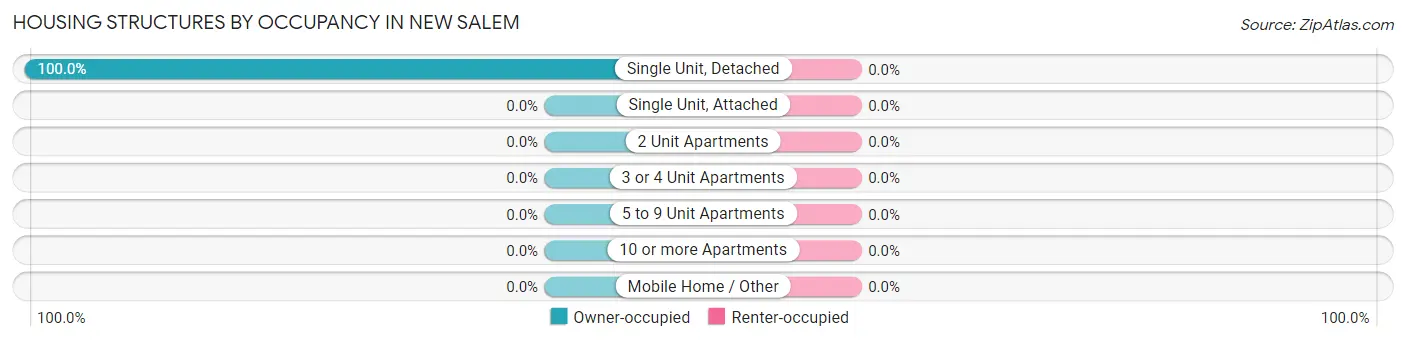
| Structure Type | Owner-occupied | Renter-occupied |
| Single Unit, Detached | 236 (100.0%) | 0 (0.0%) |
| Single Unit, Attached | 0 (0.0%) | 0 (0.0%) |
| 2 Unit Apartments | 0 (0.0%) | 0 (0.0%) |
| 3 or 4 Unit Apartments | 0 (0.0%) | 0 (0.0%) |
| 5 to 9 Unit Apartments | 0 (0.0%) | 0 (0.0%) |
| 10 or more Apartments | 0 (0.0%) | 0 (0.0%) |
| Mobile Home / Other | 0 (0.0%) | 0 (0.0%) |
| Total | 236 (100.0%) | 0 (0.0%) |
Housing Structures by Number of Rooms in New Salem
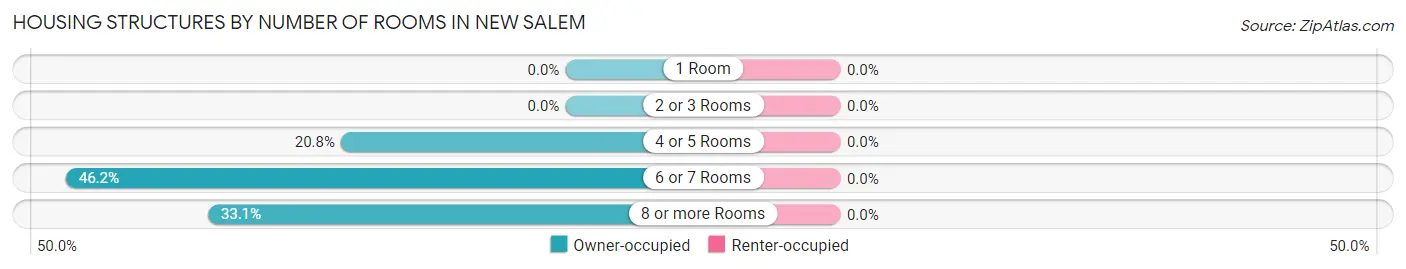
| Number of Rooms | Owner-occupied | Renter-occupied |
| 1 Room | 0 (0.0%) | 0 (0.0%) |
| 2 or 3 Rooms | 0 (0.0%) | 0 (0.0%) |
| 4 or 5 Rooms | 49 (20.8%) | 0 (0.0%) |
| 6 or 7 Rooms | 109 (46.2%) | 0 (0.0%) |
| 8 or more Rooms | 78 (33.1%) | 0 (0.0%) |
| Total | 236 (100.0%) | 0 (0.0%) |
Housing Structure by Heating Type in New Salem
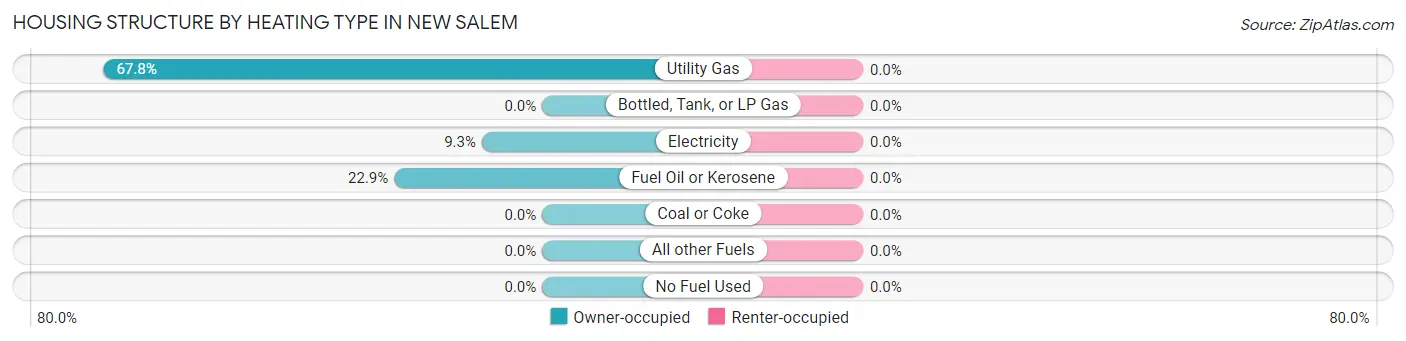
| Heating Type | Owner-occupied | Renter-occupied |
| Utility Gas | 160 (67.8%) | 0 (0.0%) |
| Bottled, Tank, or LP Gas | 0 (0.0%) | 0 (0.0%) |
| Electricity | 22 (9.3%) | 0 (0.0%) |
| Fuel Oil or Kerosene | 54 (22.9%) | 0 (0.0%) |
| Coal or Coke | 0 (0.0%) | 0 (0.0%) |
| All other Fuels | 0 (0.0%) | 0 (0.0%) |
| No Fuel Used | 0 (0.0%) | 0 (0.0%) |
| Total | 236 (100.0%) | 0 (0.0%) |
Household Vehicle Usage in New Salem
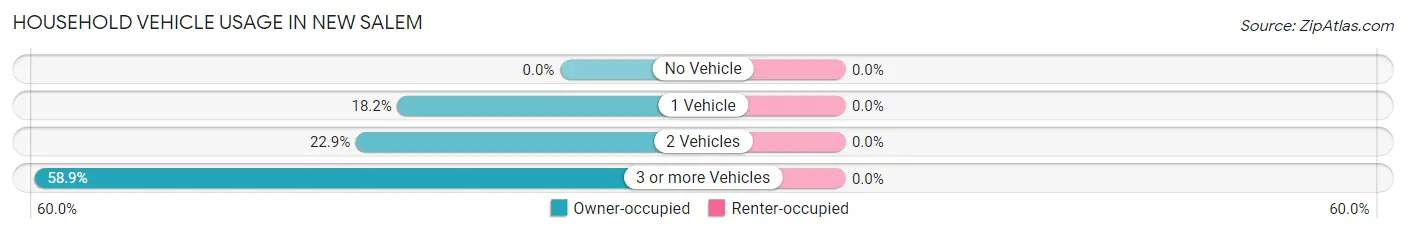
| Vehicles per Household | Owner-occupied | Renter-occupied |
| No Vehicle | 0 (0.0%) | 0 (0.0%) |
| 1 Vehicle | 43 (18.2%) | 0 (0.0%) |
| 2 Vehicles | 54 (22.9%) | 0 (0.0%) |
| 3 or more Vehicles | 139 (58.9%) | 0 (0.0%) |
| Total | 236 (100.0%) | 0 (0.0%) |
Real Estate & Mortgages in New Salem
Real Estate and Mortgage Overview in New Salem
| Characteristic | Without Mortgage | With Mortgage |
| Housing Units | 171 | 65 |
| Median Property Value | $85,900 | $98,300 |
| Median Household Income | $80,250 | $0 |
| Monthly Housing Costs | $481 | $0 |
| Real Estate Taxes | $918 | $0 |
Property Value by Mortgage Status in New Salem
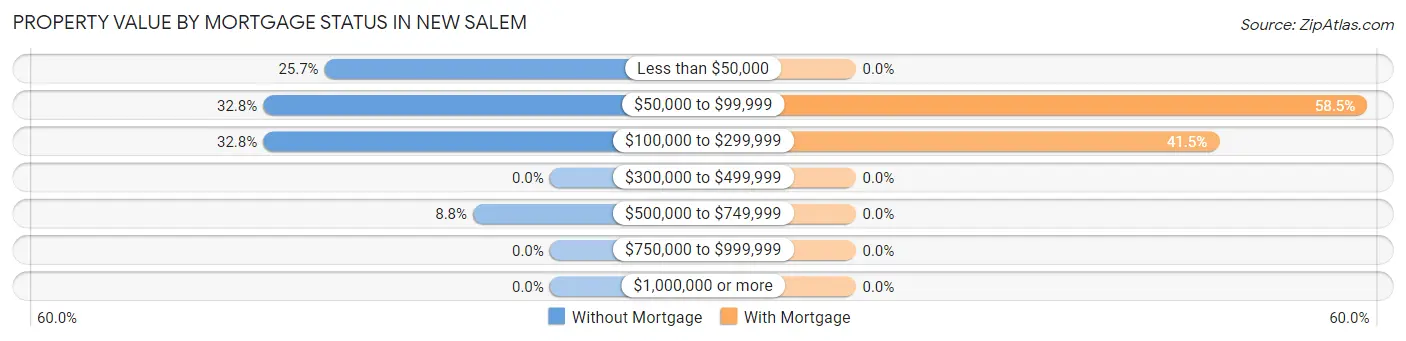
| Property Value | Without Mortgage | With Mortgage |
| Less than $50,000 | 44 (25.7%) | 0 (0.0%) |
| $50,000 to $99,999 | 56 (32.8%) | 38 (58.5%) |
| $100,000 to $299,999 | 56 (32.8%) | 27 (41.5%) |
| $300,000 to $499,999 | 0 (0.0%) | 0 (0.0%) |
| $500,000 to $749,999 | 15 (8.8%) | 0 (0.0%) |
| $750,000 to $999,999 | 0 (0.0%) | 0 (0.0%) |
| $1,000,000 or more | 0 (0.0%) | 0 (0.0%) |
| Total | 171 (100.0%) | 65 (100.0%) |
Household Income by Mortgage Status in New Salem
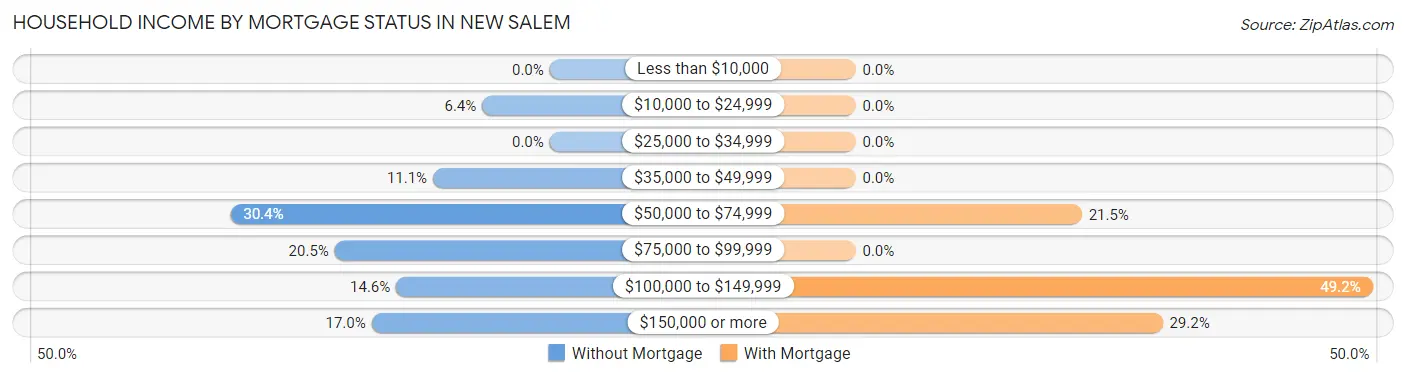
| Household Income | Without Mortgage | With Mortgage |
| Less than $10,000 | 0 (0.0%) | 0 (0.0%) |
| $10,000 to $24,999 | 11 (6.4%) | 0 (0.0%) |
| $25,000 to $34,999 | 0 (0.0%) | 0 (0.0%) |
| $35,000 to $49,999 | 19 (11.1%) | 0 (0.0%) |
| $50,000 to $74,999 | 52 (30.4%) | 14 (21.5%) |
| $75,000 to $99,999 | 35 (20.5%) | 0 (0.0%) |
| $100,000 to $149,999 | 25 (14.6%) | 32 (49.2%) |
| $150,000 or more | 29 (17.0%) | 19 (29.2%) |
| Total | 171 (100.0%) | 65 (100.0%) |
Property Value to Household Income Ratio in New Salem
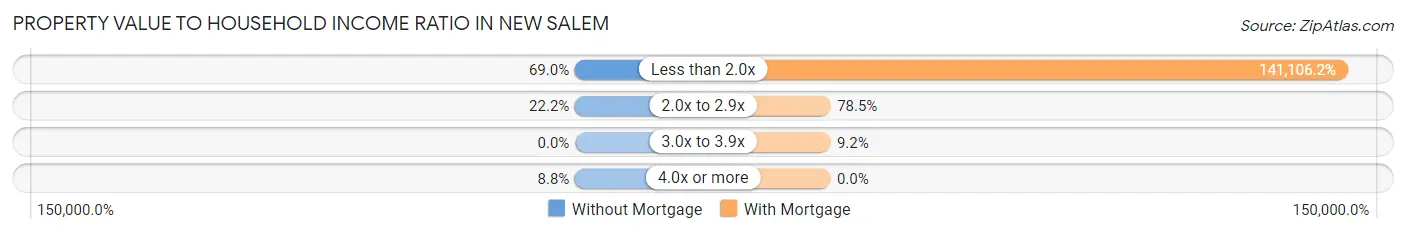
| Value-to-Income Ratio | Without Mortgage | With Mortgage |
| Less than 2.0x | 118 (69.0%) | 91,719 (141,106.2%) |
| 2.0x to 2.9x | 38 (22.2%) | 51 (78.5%) |
| 3.0x to 3.9x | 0 (0.0%) | 6 (9.2%) |
| 4.0x or more | 15 (8.8%) | 0 (0.0%) |
| Total | 171 (100.0%) | 65 (100.0%) |
Real Estate Taxes by Mortgage Status in New Salem
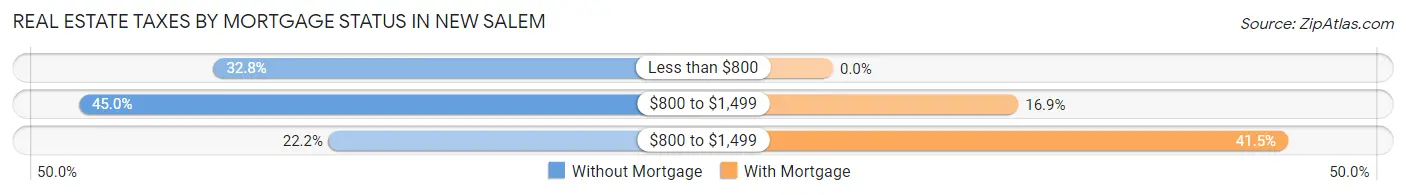
| Property Taxes | Without Mortgage | With Mortgage |
| Less than $800 | 56 (32.8%) | 0 (0.0%) |
| $800 to $1,499 | 77 (45.0%) | 11 (16.9%) |
| $800 to $1,499 | 38 (22.2%) | 27 (41.5%) |
| Total | 171 (100.0%) | 65 (100.0%) |
Health & Disability in New Salem
Health Insurance Coverage by Age in New Salem
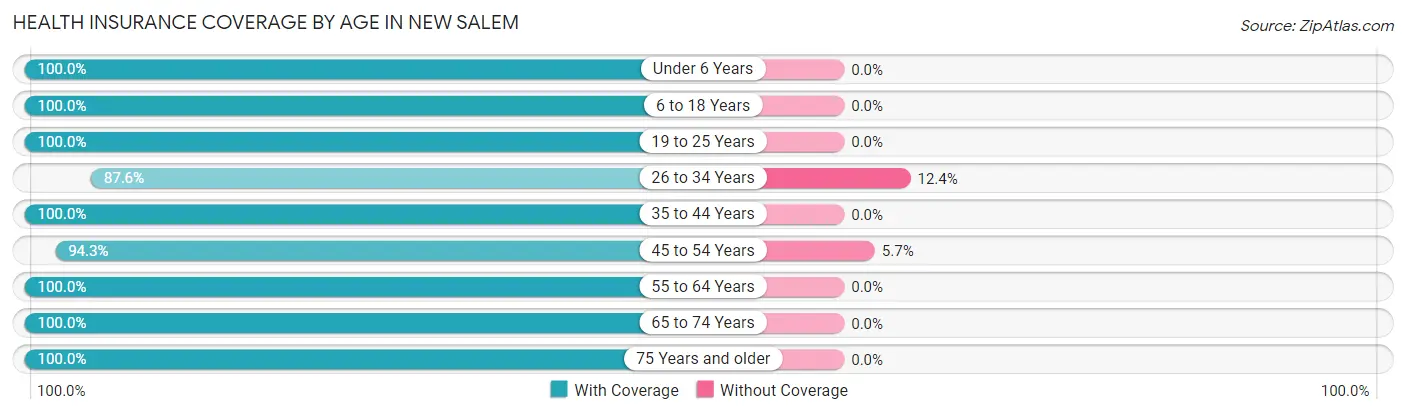
| Age Bracket | With Coverage | Without Coverage |
| Under 6 Years | 30 (100.0%) | 0 (0.0%) |
| 6 to 18 Years | 107 (100.0%) | 0 (0.0%) |
| 19 to 25 Years | 86 (100.0%) | 0 (0.0%) |
| 26 to 34 Years | 78 (87.6%) | 11 (12.4%) |
| 35 to 44 Years | 109 (100.0%) | 0 (0.0%) |
| 45 to 54 Years | 99 (94.3%) | 6 (5.7%) |
| 55 to 64 Years | 99 (100.0%) | 0 (0.0%) |
| 65 to 74 Years | 27 (100.0%) | 0 (0.0%) |
| 75 Years and older | 25 (100.0%) | 0 (0.0%) |
| Total | 660 (97.5%) | 17 (2.5%) |
Health Insurance Coverage by Citizenship Status in New Salem
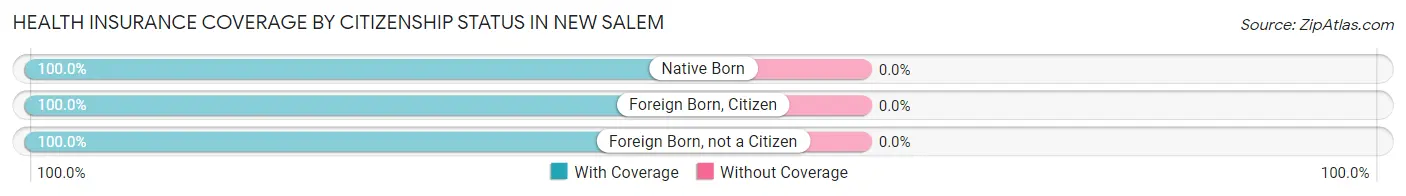
| Citizenship Status | With Coverage | Without Coverage |
| Native Born | 30 (100.0%) | 0 (0.0%) |
| Foreign Born, Citizen | 107 (100.0%) | 0 (0.0%) |
| Foreign Born, not a Citizen | 86 (100.0%) | 0 (0.0%) |
Health Insurance Coverage by Household Income in New Salem
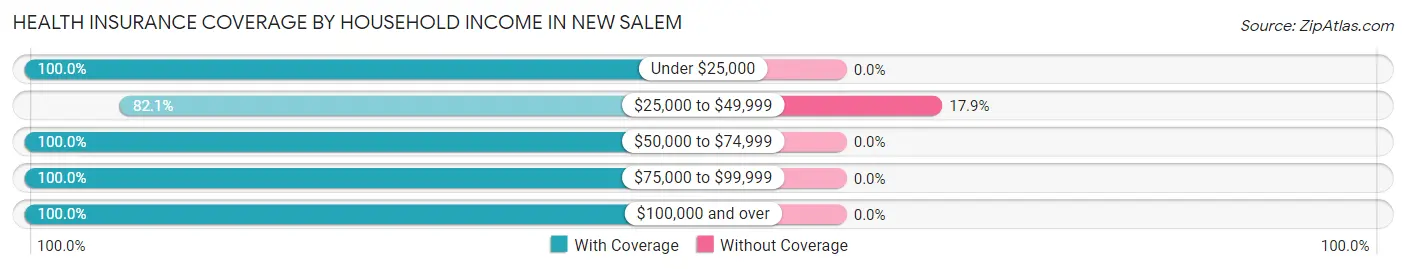
| Household Income | With Coverage | Without Coverage |
| Under $25,000 | 24 (100.0%) | 0 (0.0%) |
| $25,000 to $49,999 | 78 (82.1%) | 17 (17.9%) |
| $50,000 to $74,999 | 104 (100.0%) | 0 (0.0%) |
| $75,000 to $99,999 | 264 (100.0%) | 0 (0.0%) |
| $100,000 and over | 190 (100.0%) | 0 (0.0%) |
Public vs Private Health Insurance Coverage by Age in New Salem
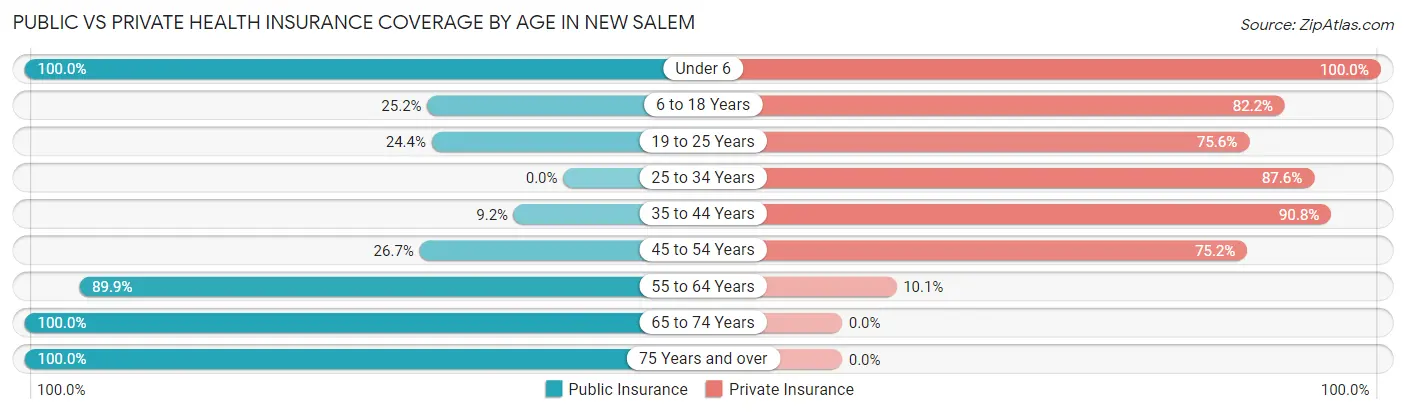
| Age Bracket | Public Insurance | Private Insurance |
| Under 6 | 30 (100.0%) | 30 (100.0%) |
| 6 to 18 Years | 27 (25.2%) | 88 (82.2%) |
| 19 to 25 Years | 21 (24.4%) | 65 (75.6%) |
| 25 to 34 Years | 0 (0.0%) | 78 (87.6%) |
| 35 to 44 Years | 10 (9.2%) | 99 (90.8%) |
| 45 to 54 Years | 28 (26.7%) | 79 (75.2%) |
| 55 to 64 Years | 89 (89.9%) | 10 (10.1%) |
| 65 to 74 Years | 27 (100.0%) | 0 (0.0%) |
| 75 Years and over | 25 (100.0%) | 0 (0.0%) |
| Total | 257 (38.0%) | 449 (66.3%) |
Disability Status by Sex by Age in New Salem
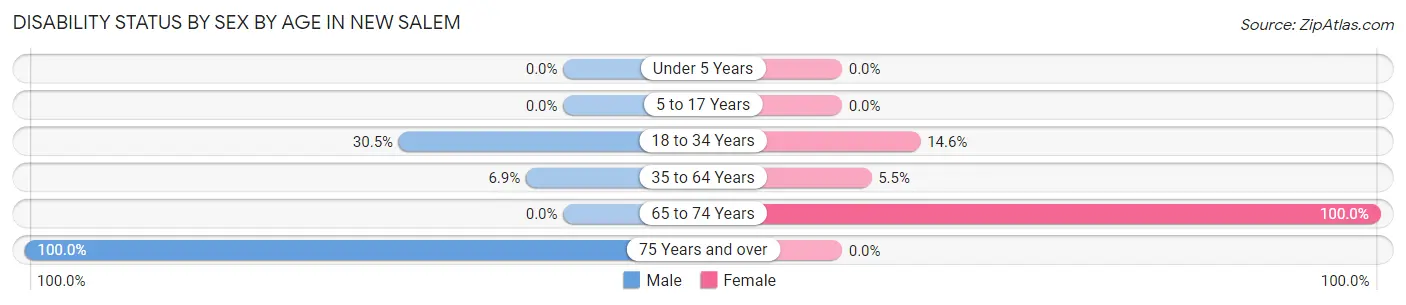
| Age Bracket | Male | Female |
| Under 5 Years | 0 (0.0%) | 0 (0.0%) |
| 5 to 17 Years | 0 (0.0%) | 0 (0.0%) |
| 18 to 34 Years | 47 (30.5%) | 8 (14.5%) |
| 35 to 64 Years | 9 (6.9%) | 10 (5.5%) |
| 65 to 74 Years | 0 (0.0%) | 3 (100.0%) |
| 75 Years and over | 25 (100.0%) | 0 (0.0%) |
Disability Class by Sex by Age in New Salem
Disability Class: Hearing Difficulty
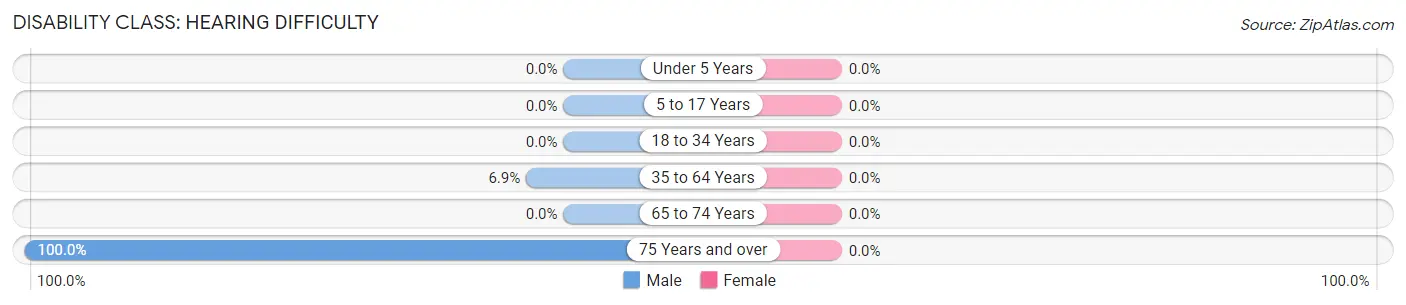
| Age Bracket | Male | Female |
| Under 5 Years | 0 (0.0%) | 0 (0.0%) |
| 5 to 17 Years | 0 (0.0%) | 0 (0.0%) |
| 18 to 34 Years | 0 (0.0%) | 0 (0.0%) |
| 35 to 64 Years | 9 (6.9%) | 0 (0.0%) |
| 65 to 74 Years | 0 (0.0%) | 0 (0.0%) |
| 75 Years and over | 25 (100.0%) | 0 (0.0%) |
Disability Class: Vision Difficulty
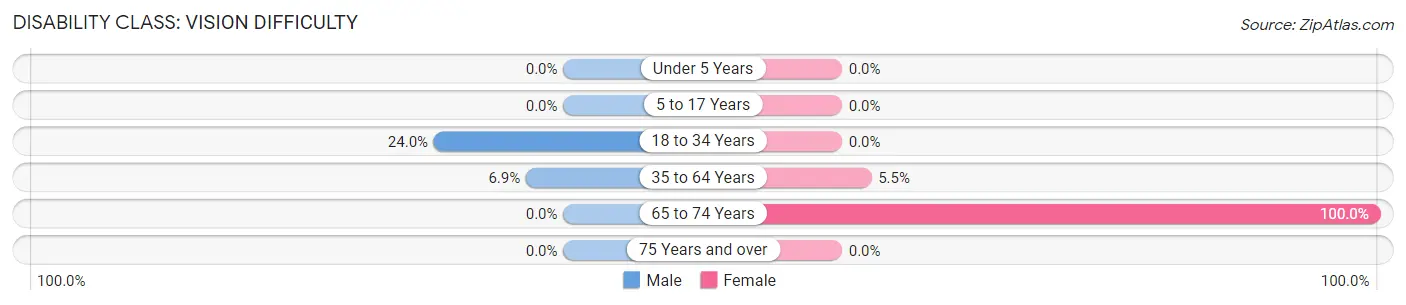
| Age Bracket | Male | Female |
| Under 5 Years | 0 (0.0%) | 0 (0.0%) |
| 5 to 17 Years | 0 (0.0%) | 0 (0.0%) |
| 18 to 34 Years | 37 (24.0%) | 0 (0.0%) |
| 35 to 64 Years | 9 (6.9%) | 10 (5.5%) |
| 65 to 74 Years | 0 (0.0%) | 3 (100.0%) |
| 75 Years and over | 0 (0.0%) | 0 (0.0%) |
Disability Class: Cognitive Difficulty
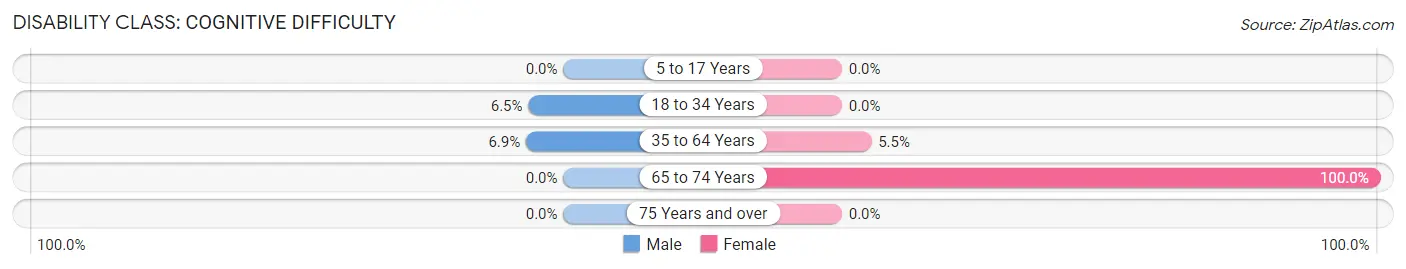
| Age Bracket | Male | Female |
| 5 to 17 Years | 0 (0.0%) | 0 (0.0%) |
| 18 to 34 Years | 10 (6.5%) | 0 (0.0%) |
| 35 to 64 Years | 9 (6.9%) | 10 (5.5%) |
| 65 to 74 Years | 0 (0.0%) | 3 (100.0%) |
| 75 Years and over | 0 (0.0%) | 0 (0.0%) |
Disability Class: Ambulatory Difficulty
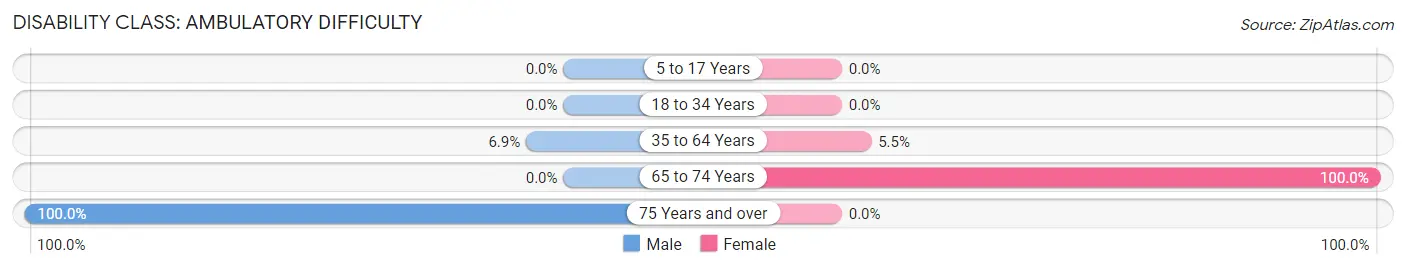
| Age Bracket | Male | Female |
| 5 to 17 Years | 0 (0.0%) | 0 (0.0%) |
| 18 to 34 Years | 0 (0.0%) | 0 (0.0%) |
| 35 to 64 Years | 9 (6.9%) | 10 (5.5%) |
| 65 to 74 Years | 0 (0.0%) | 3 (100.0%) |
| 75 Years and over | 25 (100.0%) | 0 (0.0%) |
Disability Class: Self-Care Difficulty
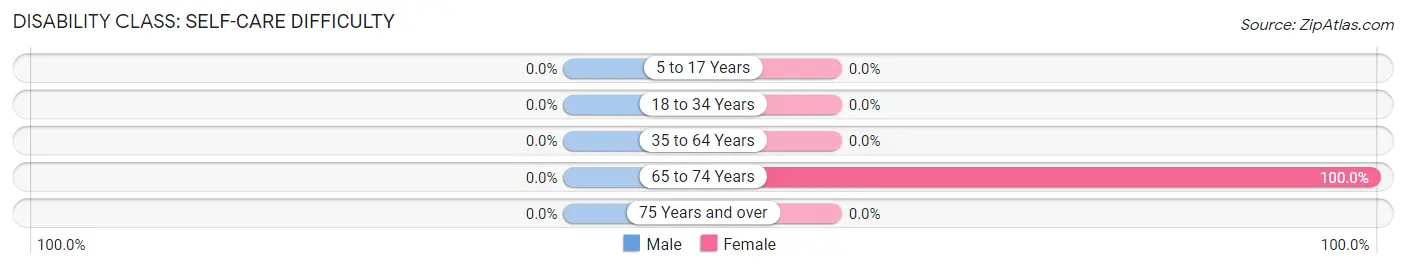
| Age Bracket | Male | Female |
| 5 to 17 Years | 0 (0.0%) | 0 (0.0%) |
| 18 to 34 Years | 0 (0.0%) | 0 (0.0%) |
| 35 to 64 Years | 0 (0.0%) | 0 (0.0%) |
| 65 to 74 Years | 0 (0.0%) | 3 (100.0%) |
| 75 Years and over | 0 (0.0%) | 0 (0.0%) |
Technology Access in New Salem
Computing Device Access in New Salem
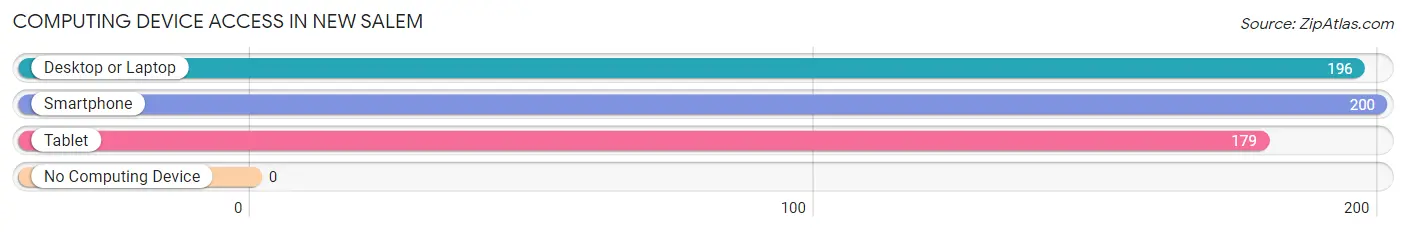
| Device Type | # Households | % Households |
| Desktop or Laptop | 196 | 83.1% |
| Smartphone | 200 | 84.8% |
| Tablet | 179 | 75.8% |
| No Computing Device | 0 | 0.0% |
| Total | 236 | 100.0% |
Internet Access in New Salem
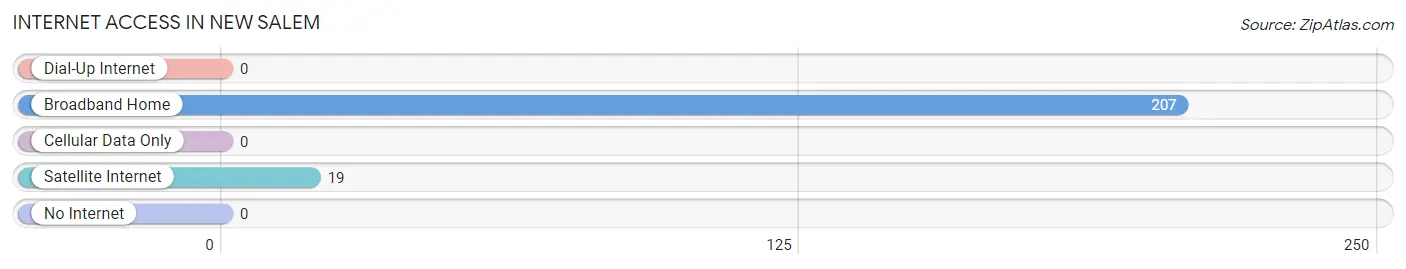
| Internet Type | # Households | % Households |
| Dial-Up Internet | 0 | 0.0% |
| Broadband Home | 207 | 87.7% |
| Cellular Data Only | 0 | 0.0% |
| Satellite Internet | 19 | 8.1% |
| No Internet | 0 | 0.0% |
| Total | 236 | 100.0% |
New Salem Summary
New Salem is a borough located in Westmoreland County, Pennsylvania. It is situated in the Laurel Highlands region of the state, and is part of the Pittsburgh metropolitan area. The borough was founded in 1817 and has a population of approximately 1,000 people.
History
New Salem was founded in 1817 by a group of settlers from New England. The settlers were looking for a place to settle and start a new life, and they chose the area that is now New Salem. The town was named after the town of Salem, Massachusetts, which was the hometown of many of the settlers.
The town was originally a farming community, and the settlers grew a variety of crops, including wheat, corn, and oats. The town also had a sawmill, a gristmill, and a blacksmith shop.
In the late 1800s, the town began to grow and develop. The railroad came to town in 1871, and the town began to attract more businesses and industries. The town also had a post office, a bank, and a hotel.
Geography
New Salem is located in Westmoreland County, Pennsylvania. It is situated in the Laurel Highlands region of the state, and is part of the Pittsburgh metropolitan area. The borough is located in the Allegheny Mountains, and is surrounded by rolling hills and forests.
The borough is located at an elevation of 1,400 feet above sea level. The climate in New Salem is humid continental, with cold winters and hot summers. The average annual temperature is around 50 degrees Fahrenheit.
Economy
The economy of New Salem is largely based on agriculture and tourism. The town is home to several farms, which produce a variety of crops, including wheat, corn, and oats. The town also has several small businesses, including restaurants, shops, and a hotel.
The town is also a popular tourist destination, as it is located in the beautiful Laurel Highlands region of the state. The town is home to several attractions, including the New Salem State Park, which offers hiking, camping, and other outdoor activities.
Demographics
As of the 2010 census, the population of New Salem was 1,000 people. The racial makeup of the town was 97.2% White, 0.7% African American, 0.2% Native American, 0.2% Asian, and 1.7% from other races. The median household income was $37,500, and the median family income was $45,000.
Conclusion
New Salem is a small borough located in Westmoreland County, Pennsylvania. It is situated in the Laurel Highlands region of the state, and is part of the Pittsburgh metropolitan area. The borough was founded in 1817 and has a population of approximately 1,000 people. The economy of New Salem is largely based on agriculture and tourism, and the town is home to several farms, businesses, and attractions. The racial makeup of the town is predominantly White, with a small percentage of African American, Native American, and Asian residents.
Common Questions
What is Per Capita Income in New Salem?
Per Capita income in New Salem is $29,943.
What is the Median Family Income in New Salem?
Median Family Income in New Salem is $74,036.
What is the Median Household income in New Salem?
Median Household Income in New Salem is $80,643.
What is Income or Wage Gap in New Salem?
Income or Wage Gap in New Salem is 0.3%.
Women in New Salem earn 99.7 cents for every dollar earned by a man.
What is Inequality or Gini Index in New Salem?
Inequality or Gini Index in New Salem is 0.28.
What is the Total Population of New Salem?
Total Population of New Salem is 677.
What is the Total Male Population of New Salem?
Total Male Population of New Salem is 406.
What is the Total Female Population of New Salem?
Total Female Population of New Salem is 271.
What is the Ratio of Males per 100 Females in New Salem?
There are 149.82 Males per 100 Females in New Salem.
What is the Ratio of Females per 100 Males in New Salem?
There are 66.75 Females per 100 Males in New Salem.
What is the Median Population Age in New Salem?
Median Population Age in New Salem is 36.8 Years.
What is the Average Family Size in New Salem
Average Family Size in New Salem is 2.8 People.
What is the Average Household Size in New Salem
Average Household Size in New Salem is 2.9 People.
How Large is the Labor Force in New Salem?
There are 396 People in the Labor Forcein in New Salem.
What is the Percentage of People in the Labor Force in New Salem?
63.0% of People are in the Labor Force in New Salem.
What is the Unemployment Rate in New Salem?
Unemployment Rate in New Salem is 16.4%.