Zip Codes with the Highest Percentage of Population Employed in Installation, Maintenance & Repair in Chambersburg, PA
RELATED REPORTS & OPTIONS
Installation, Maintenance & Repair
Chambersburg
Compare Zip Codes
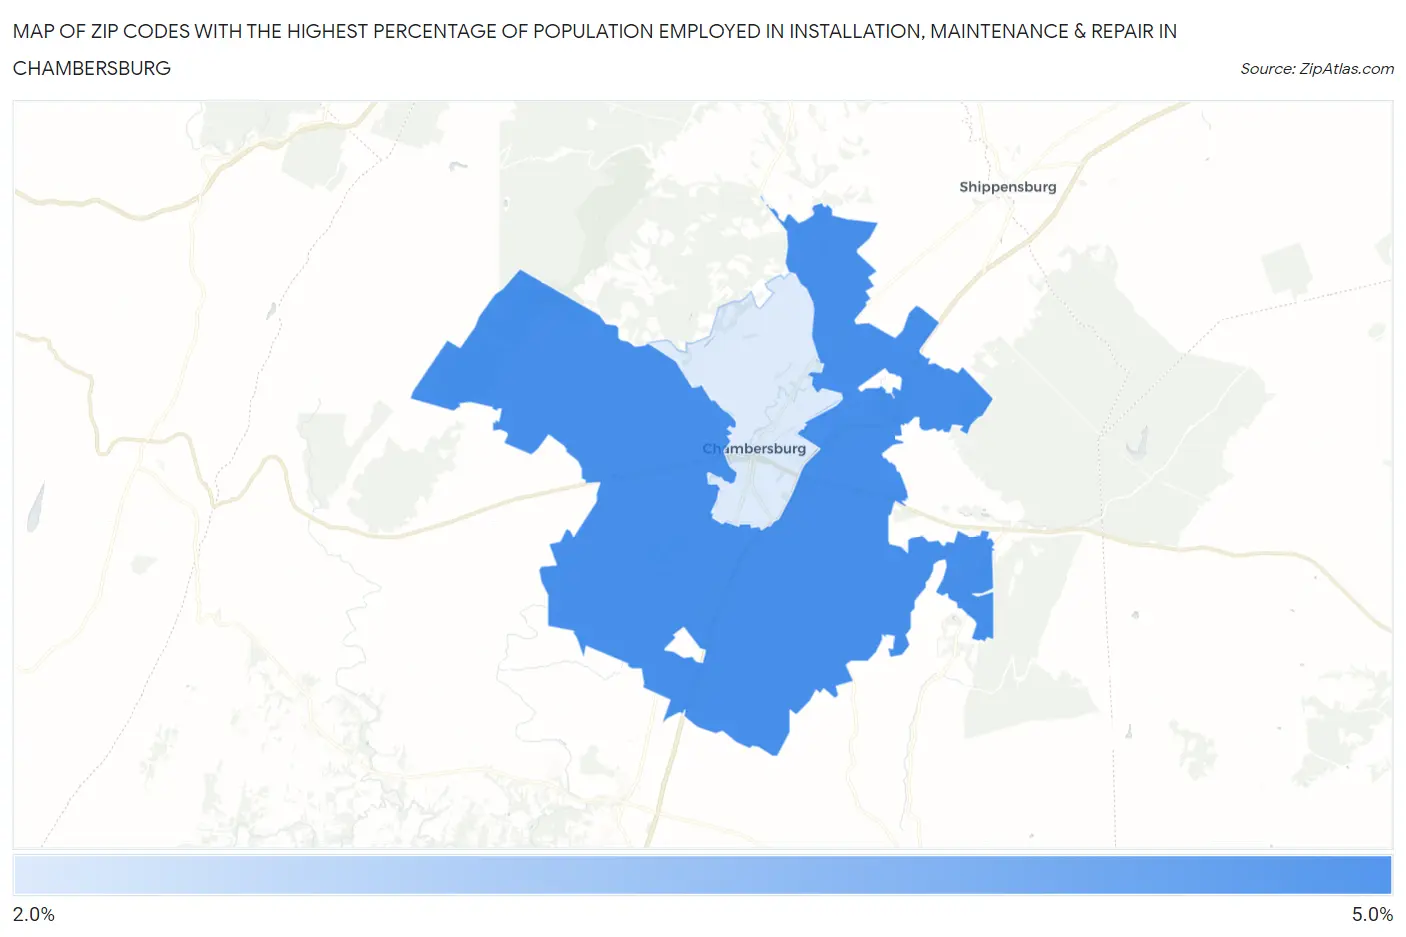
Map of Zip Codes with the Highest Percentage of Population Employed in Installation, Maintenance & Repair in Chambersburg
2.5%
4.9%
Zip Codes with the Highest Percentage of Population Employed in Installation, Maintenance & Repair in Chambersburg, PA
| Zip Code | % Employed | vs State | vs National | |
| 1. | 17202 | 4.9% | 3.1%(+1.79)#524 | 3.1%(+1.81)#9,110 |
| 2. | 17201 | 2.5% | 3.1%(-0.570)#1,106 | 3.1%(-0.546)#19,438 |
1
Common Questions
What are the Top Zip Codes with the Highest Percentage of Population Employed in Installation, Maintenance & Repair in Chambersburg, PA?
Top Zip Codes with the Highest Percentage of Population Employed in Installation, Maintenance & Repair in Chambersburg, PA are:
What zip code has the Highest Percentage of Population Employed in Installation, Maintenance & Repair in Chambersburg, PA?
17202 has the Highest Percentage of Population Employed in Installation, Maintenance & Repair in Chambersburg, PA with 4.9%.
What is the Percentage of Population Employed in Installation, Maintenance & Repair in Pennsylvania?
Percentage of Population Employed in Installation, Maintenance & Repair in Pennsylvania is 3.1%.
What is the Percentage of Population Employed in Installation, Maintenance & Repair in the United States?
Percentage of Population Employed in Installation, Maintenance & Repair in the United States is 3.1%.