Fawn Grove borough, PA Map & Demographics
Fawn Grove borough Overview
$36,136
PER CAPITA INCOME
$90,250
AVG FAMILY INCOME
$62,083
AVG HOUSEHOLD INCOME
52.7%
WAGE / INCOME GAP [ % ]
47.3¢/ $1
WAGE / INCOME GAP [ $ ]
$7,200
FAMILY INCOME DEFICIT
0.39
INEQUALITY / GINI INDEX
450
TOTAL POPULATION
218
MALE POPULATION
232
FEMALE POPULATION
93.97
MALES / 100 FEMALES
106.42
FEMALES / 100 MALES
52.0
MEDIAN AGE
2.9
AVG FAMILY SIZE
2.4
AVG HOUSEHOLD SIZE
196
LABOR FORCE [ PEOPLE ]
50.8%
PERCENT IN LABOR FORCE
8.9%
UNEMPLOYMENT RATE
Income in Fawn Grove borough
Income Overview in Fawn Grove borough
Per Capita Income in Fawn Grove borough is $36,136, while median incomes of families and households are $90,250 and $62,083 respectively.
| Characteristic | Number | Measure |
| Per Capita Income | 450 | $36,136 |
| Median Family Income | 137 | $90,250 |
| Mean Family Income | 137 | $98,306 |
| Median Household Income | 187 | $62,083 |
| Mean Household Income | 187 | $85,188 |
| Income Deficit | 137 | $7,200 |
| Wage / Income Gap (%) | 450 | 52.67% |
| Wage / Income Gap ($) | 450 | 47.33¢ per $1 |
| Gini / Inequality Index | 450 | 0.39 |
Earnings by Sex in Fawn Grove borough
Average Earnings in Fawn Grove borough are $37,750, $58,625 for men and $27,750 for women, a difference of 52.7%.
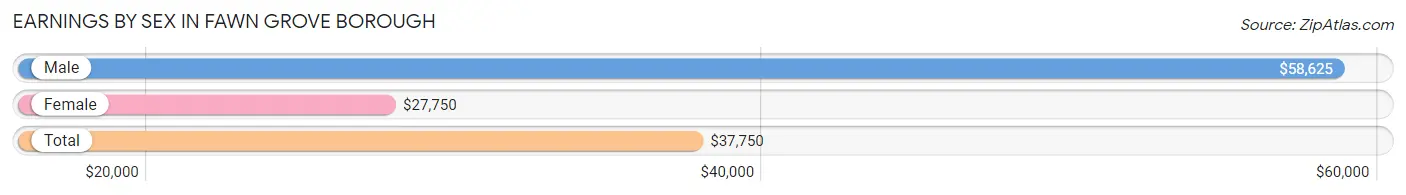
| Sex | Number | Average Earnings |
| Male | 115 (53.5%) | $58,625 |
| Female | 100 (46.5%) | $27,750 |
| Total | 215 (100.0%) | $37,750 |
Earnings by Sex by Income Bracket in Fawn Grove borough
The most common earnings brackets in Fawn Grove borough are $75,000 to $99,999 for men (20 | 17.4%) and $20,000 to $22,499 for women (22 | 22.0%).
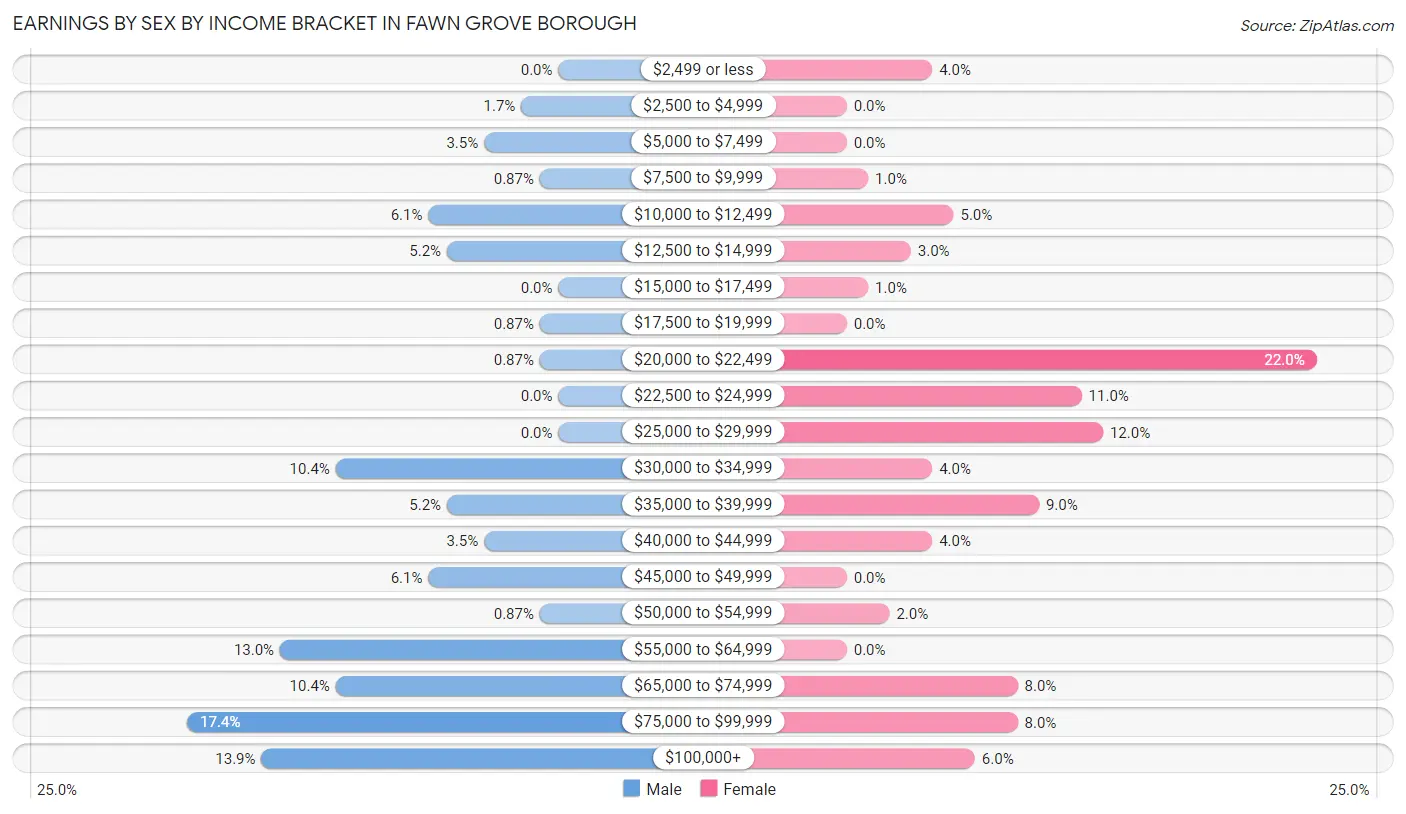
| Income | Male | Female |
| $2,499 or less | 0 (0.0%) | 4 (4.0%) |
| $2,500 to $4,999 | 2 (1.7%) | 0 (0.0%) |
| $5,000 to $7,499 | 4 (3.5%) | 0 (0.0%) |
| $7,500 to $9,999 | 1 (0.9%) | 1 (1.0%) |
| $10,000 to $12,499 | 7 (6.1%) | 5 (5.0%) |
| $12,500 to $14,999 | 6 (5.2%) | 3 (3.0%) |
| $15,000 to $17,499 | 0 (0.0%) | 1 (1.0%) |
| $17,500 to $19,999 | 1 (0.9%) | 0 (0.0%) |
| $20,000 to $22,499 | 1 (0.9%) | 22 (22.0%) |
| $22,500 to $24,999 | 0 (0.0%) | 11 (11.0%) |
| $25,000 to $29,999 | 0 (0.0%) | 12 (12.0%) |
| $30,000 to $34,999 | 12 (10.4%) | 4 (4.0%) |
| $35,000 to $39,999 | 6 (5.2%) | 9 (9.0%) |
| $40,000 to $44,999 | 4 (3.5%) | 4 (4.0%) |
| $45,000 to $49,999 | 7 (6.1%) | 0 (0.0%) |
| $50,000 to $54,999 | 1 (0.9%) | 2 (2.0%) |
| $55,000 to $64,999 | 15 (13.0%) | 0 (0.0%) |
| $65,000 to $74,999 | 12 (10.4%) | 8 (8.0%) |
| $75,000 to $99,999 | 20 (17.4%) | 8 (8.0%) |
| $100,000+ | 16 (13.9%) | 6 (6.0%) |
| Total | 115 (100.0%) | 100 (100.0%) |
Earnings by Sex by Educational Attainment in Fawn Grove borough
Average earnings in Fawn Grove borough are $60,000 for men and $34,063 for women, a difference of 43.2%. Men with an educational attainment of college or associate's degree enjoy the highest average annual earnings of $73,333, while those with high school diploma education earn the least with $60,625. Women with an educational attainment of bachelor's degree earn the most with the average annual earnings of $77,917, while those with less than high school education have the smallest earnings of $32,813.
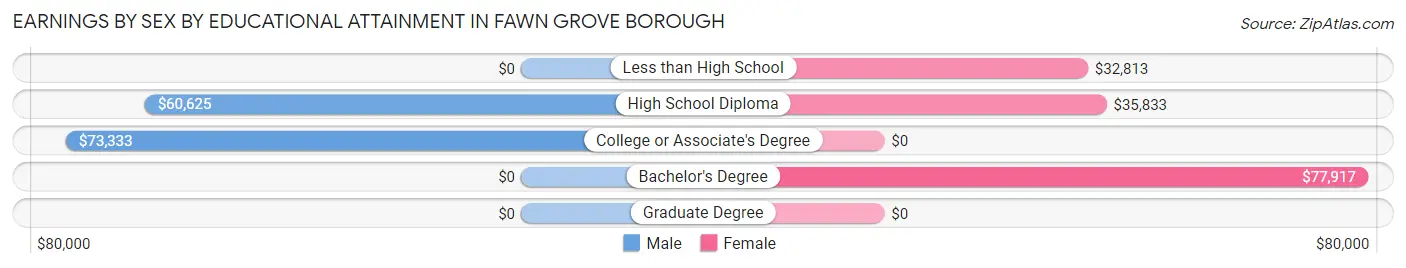
| Educational Attainment | Male Income | Female Income |
| Less than High School | - | - |
| High School Diploma | $60,625 | $35,833 |
| College or Associate's Degree | $73,333 | $0 |
| Bachelor's Degree | - | - |
| Graduate Degree | - | - |
| Total | $60,000 | $34,063 |
Family Income in Fawn Grove borough
Family Income Brackets in Fawn Grove borough
According to the Fawn Grove borough family income data, there are 31 families falling into the $100,000 to $149,999 income range, which is the most common income bracket and makes up 22.6% of all families.
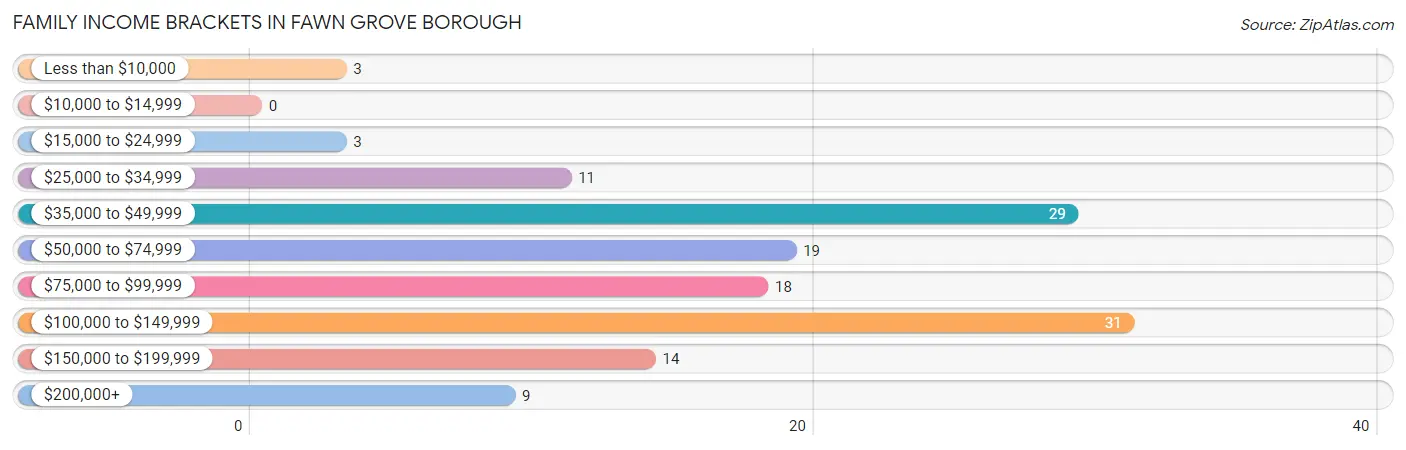
| Income Bracket | # Families | % Families |
| Less than $10,000 | 3 | 2.2% |
| $10,000 to $14,999 | 0 | 0.0% |
| $15,000 to $24,999 | 3 | 2.2% |
| $25,000 to $34,999 | 11 | 8.0% |
| $35,000 to $49,999 | 29 | 21.2% |
| $50,000 to $74,999 | 19 | 13.9% |
| $75,000 to $99,999 | 18 | 13.1% |
| $100,000 to $149,999 | 31 | 22.6% |
| $150,000 to $199,999 | 14 | 10.2% |
| $200,000+ | 9 | 6.6% |
Family Income by Famaliy Size in Fawn Grove borough
4-person families (29 | 21.2%) account for the highest median family income in Fawn Grove borough with $130,469 per family, while 4-person families (29 | 21.2%) have the highest median income of $32,617 per family member.
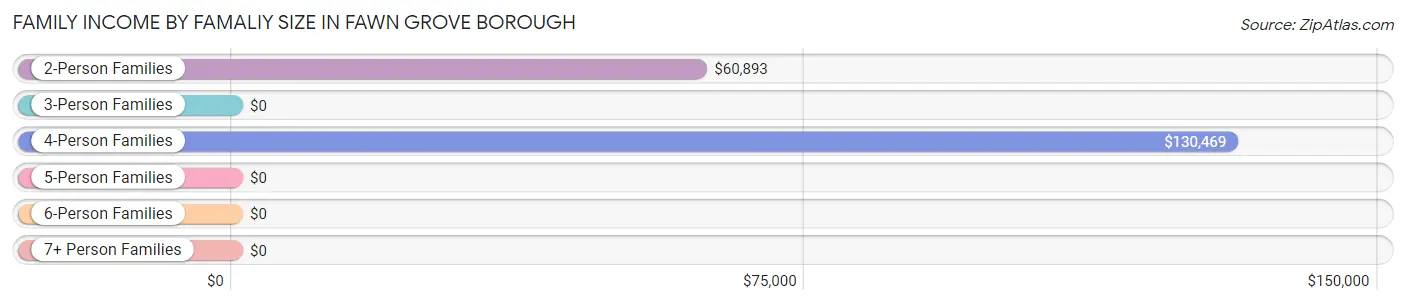
| Income Bracket | # Families | Median Income |
| 2-Person Families | 81 (59.1%) | $60,893 |
| 3-Person Families | 17 (12.4%) | $0 |
| 4-Person Families | 29 (21.2%) | $130,469 |
| 5-Person Families | 10 (7.3%) | $0 |
| 6-Person Families | 0 (0.0%) | $0 |
| 7+ Person Families | 0 (0.0%) | $0 |
| Total | 137 (100.0%) | $90,250 |
Family Income by Number of Earners in Fawn Grove borough
The median family income in Fawn Grove borough is $90,250, with families comprising 3+ earners (14) having the highest median family income of $141,389, while families with 1 earner (40) have the lowest median family income of $39,167, accounting for 10.2% and 29.2% of families, respectively.
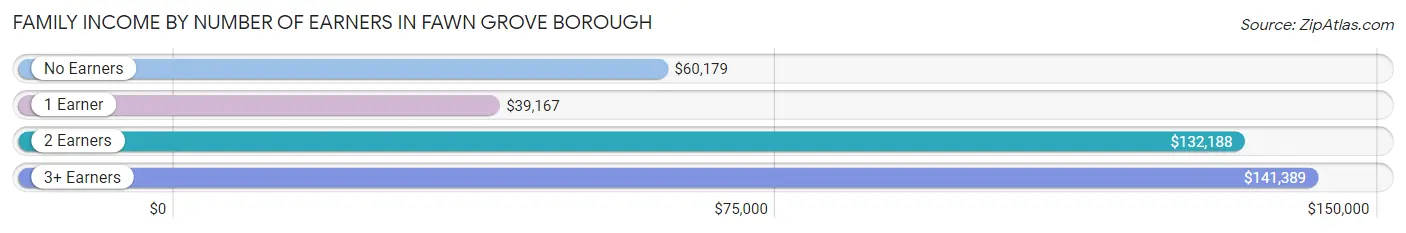
| Number of Earners | # Families | Median Income |
| No Earners | 43 (31.4%) | $60,179 |
| 1 Earner | 40 (29.2%) | $39,167 |
| 2 Earners | 40 (29.2%) | $132,188 |
| 3+ Earners | 14 (10.2%) | $141,389 |
| Total | 137 (100.0%) | $90,250 |
Household Income in Fawn Grove borough
Household Income Brackets in Fawn Grove borough
With 38 households falling in the category, the $35,000 to $49,999 income range is the most frequent in Fawn Grove borough, accounting for 20.3% of all households. In contrast, only 1 households (0.5%) fall into the $10,000 to $14,999 income bracket, making it the least populous group.
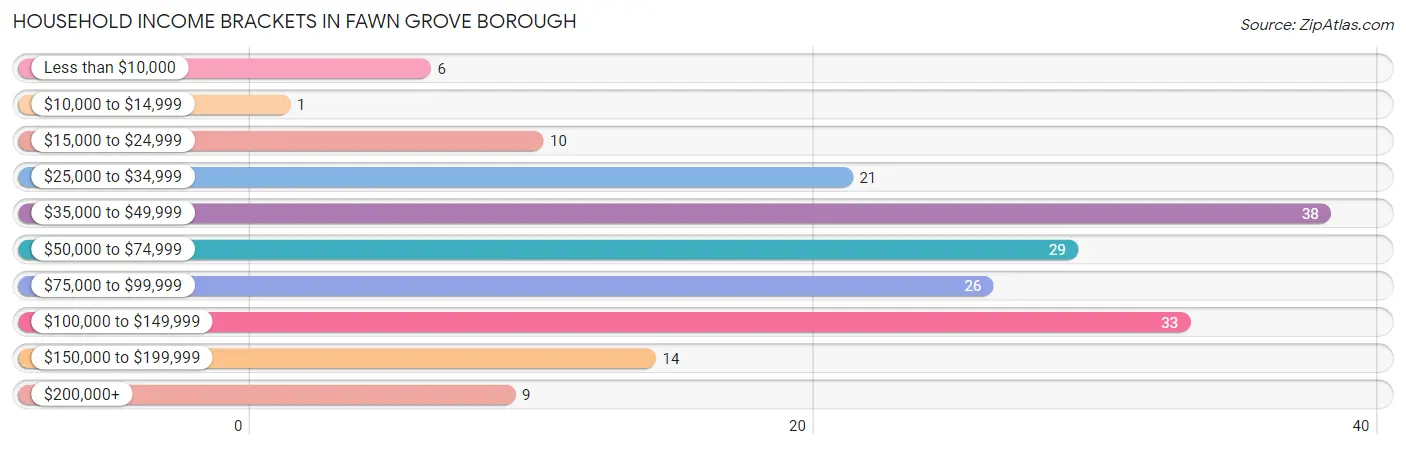
| Income Bracket | # Households | % Households |
| Less than $10,000 | 6 | 3.2% |
| $10,000 to $14,999 | 1 | 0.5% |
| $15,000 to $24,999 | 10 | 5.3% |
| $25,000 to $34,999 | 21 | 11.2% |
| $35,000 to $49,999 | 38 | 20.3% |
| $50,000 to $74,999 | 29 | 15.5% |
| $75,000 to $99,999 | 26 | 13.9% |
| $100,000 to $149,999 | 33 | 17.6% |
| $150,000 to $199,999 | 14 | 7.5% |
| $200,000+ | 9 | 4.8% |
Household Income by Householder Age in Fawn Grove borough
The median household income in Fawn Grove borough is $62,083, with the highest median household income of $97,500 found in the 25 to 44 years age bracket for the primary householder. A total of 28 households (15.0%) fall into this category. Meanwhile, the 15 to 24 years age bracket for the primary householder has the lowest median household income of $0, with 4 households (2.1%) in this group.
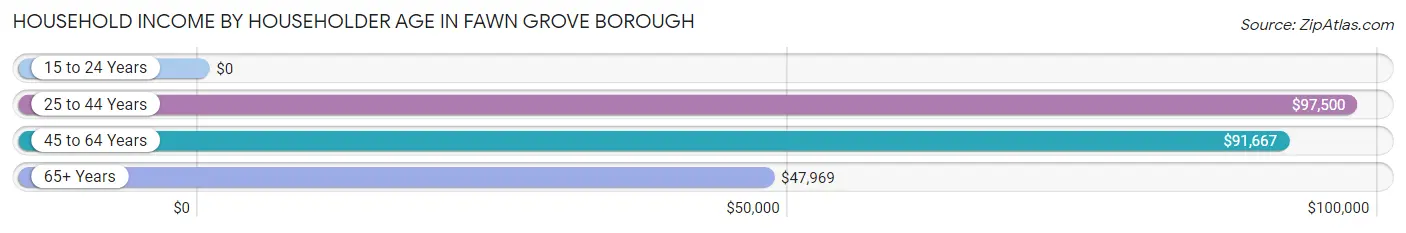
| Income Bracket | # Households | Median Income |
| 15 to 24 Years | 4 (2.1%) | $0 |
| 25 to 44 Years | 28 (15.0%) | $97,500 |
| 45 to 64 Years | 70 (37.4%) | $91,667 |
| 65+ Years | 85 (45.5%) | $47,969 |
| Total | 187 (100.0%) | $62,083 |
Poverty in Fawn Grove borough
Income Below Poverty by Sex and Age in Fawn Grove borough
With 5.1% poverty level for males and 3.0% for females among the residents of Fawn Grove borough, 18 to 24 year old males and 75 year old and over females are the most vulnerable to poverty, with 4 males (28.6%) and 3 females (9.7%) in their respective age groups living below the poverty level.
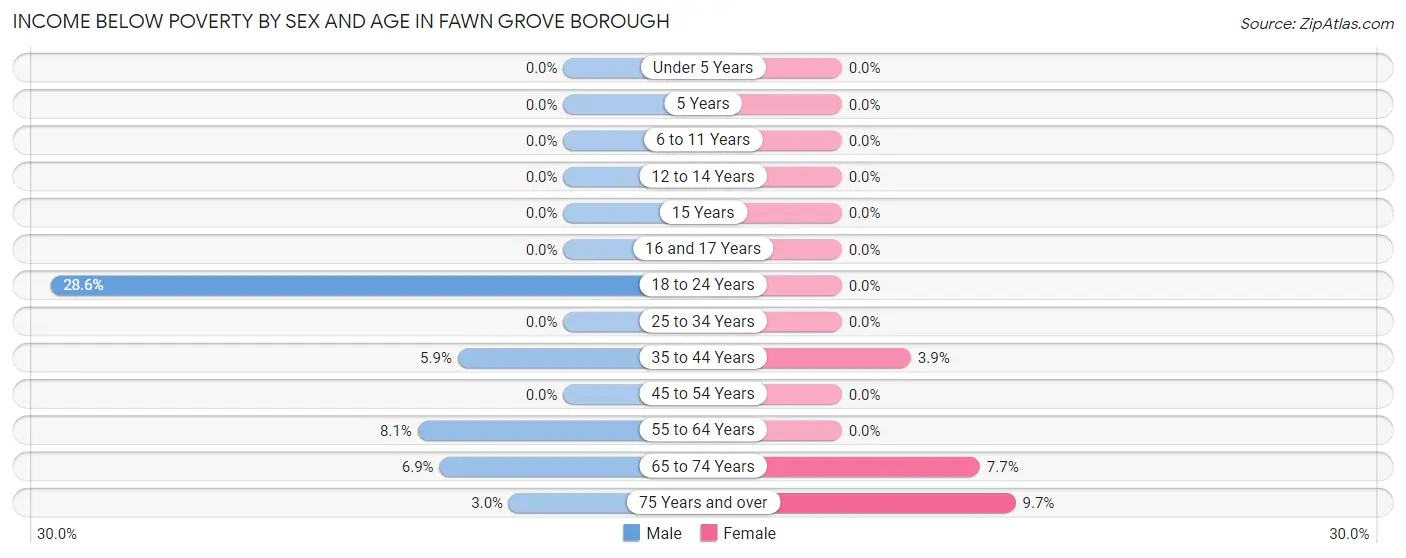
| Age Bracket | Male | Female |
| Under 5 Years | 0 (0.0%) | 0 (0.0%) |
| 5 Years | 0 (0.0%) | 0 (0.0%) |
| 6 to 11 Years | 0 (0.0%) | 0 (0.0%) |
| 12 to 14 Years | 0 (0.0%) | 0 (0.0%) |
| 15 Years | 0 (0.0%) | 0 (0.0%) |
| 16 and 17 Years | 0 (0.0%) | 0 (0.0%) |
| 18 to 24 Years | 4 (28.6%) | 0 (0.0%) |
| 25 to 34 Years | 0 (0.0%) | 0 (0.0%) |
| 35 to 44 Years | 1 (5.9%) | 1 (3.8%) |
| 45 to 54 Years | 0 (0.0%) | 0 (0.0%) |
| 55 to 64 Years | 3 (8.1%) | 0 (0.0%) |
| 65 to 74 Years | 2 (6.9%) | 3 (7.7%) |
| 75 Years and over | 1 (3.0%) | 3 (9.7%) |
| Total | 11 (5.1%) | 7 (3.0%) |
Income Above Poverty by Sex and Age in Fawn Grove borough
According to the poverty statistics in Fawn Grove borough, males aged under 5 years and females aged under 5 years are the age groups that are most secure financially, with 100.0% of males and 100.0% of females in these age groups living above the poverty line.
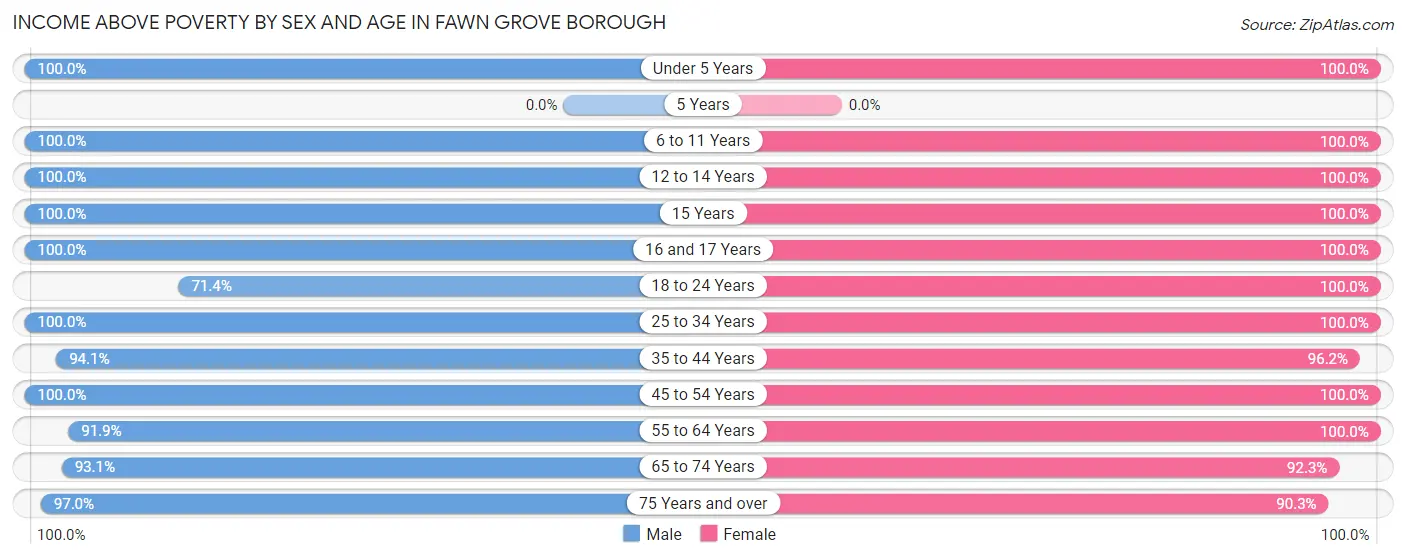
| Age Bracket | Male | Female |
| Under 5 Years | 13 (100.0%) | 16 (100.0%) |
| 5 Years | 0 (0.0%) | 0 (0.0%) |
| 6 to 11 Years | 18 (100.0%) | 10 (100.0%) |
| 12 to 14 Years | 2 (100.0%) | 3 (100.0%) |
| 15 Years | 1 (100.0%) | 1 (100.0%) |
| 16 and 17 Years | 1 (100.0%) | 4 (100.0%) |
| 18 to 24 Years | 10 (71.4%) | 29 (100.0%) |
| 25 to 34 Years | 13 (100.0%) | 15 (100.0%) |
| 35 to 44 Years | 16 (94.1%) | 25 (96.2%) |
| 45 to 54 Years | 40 (100.0%) | 23 (100.0%) |
| 55 to 64 Years | 34 (91.9%) | 35 (100.0%) |
| 65 to 74 Years | 27 (93.1%) | 36 (92.3%) |
| 75 Years and over | 32 (97.0%) | 28 (90.3%) |
| Total | 207 (95.0%) | 225 (97.0%) |
Income Below Poverty Among Married-Couple Families in Fawn Grove borough
The poverty statistics for married-couple families in Fawn Grove borough show that 3.5% or 4 of the total 116 families live below the poverty line. Families with no children have the highest poverty rate of 5.0%, comprising of 4 families. On the other hand, families with 1 or 2 children have the lowest poverty rate of 0.0%, which includes 0 families.
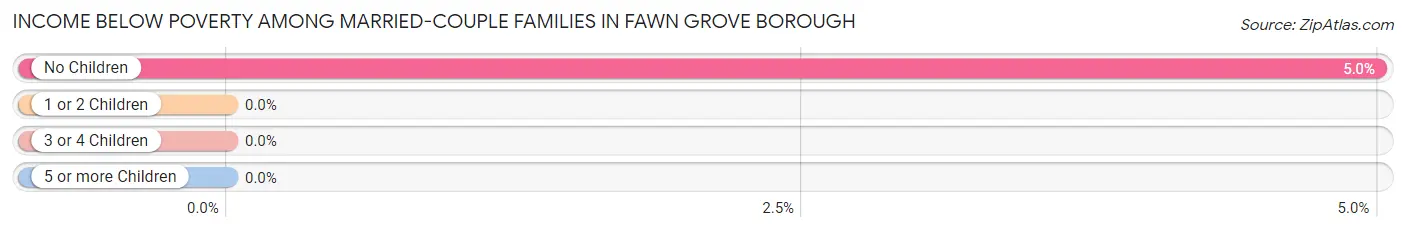
| Children | Above Poverty | Below Poverty |
| No Children | 76 (95.0%) | 4 (5.0%) |
| 1 or 2 Children | 36 (100.0%) | 0 (0.0%) |
| 3 or 4 Children | 0 (0.0%) | 0 (0.0%) |
| 5 or more Children | 0 (0.0%) | 0 (0.0%) |
| Total | 112 (96.6%) | 4 (3.5%) |
Income Below Poverty Among Single-Parent Households in Fawn Grove borough
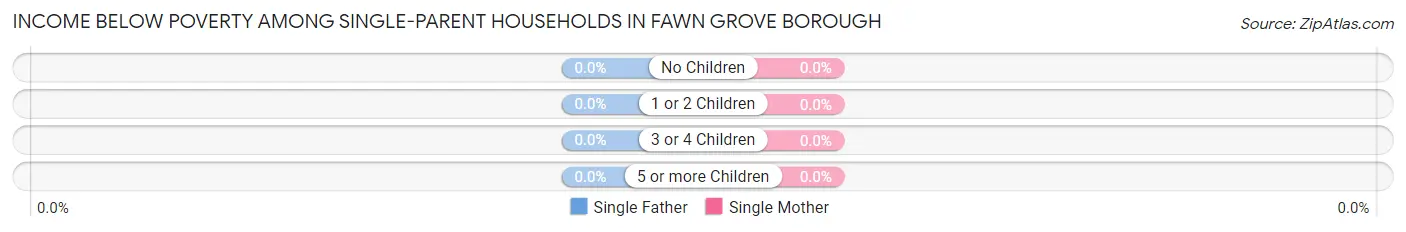
| Children | Single Father | Single Mother |
| No Children | 0 (0.0%) | 0 (0.0%) |
| 1 or 2 Children | 0 (0.0%) | 0 (0.0%) |
| 3 or 4 Children | 0 (0.0%) | 0 (0.0%) |
| 5 or more Children | 0 (0.0%) | 0 (0.0%) |
| Total | 0 (0.0%) | 0 (0.0%) |
Income Below Poverty Among Married-Couple vs Single-Parent Households in Fawn Grove borough
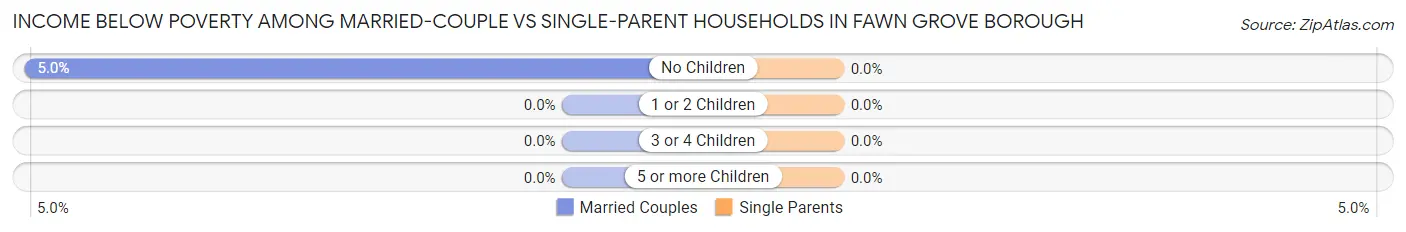
| Children | Married-Couple Families | Single-Parent Households |
| No Children | 4 (5.0%) | 0 (0.0%) |
| 1 or 2 Children | 0 (0.0%) | 0 (0.0%) |
| 3 or 4 Children | 0 (0.0%) | 0 (0.0%) |
| 5 or more Children | 0 (0.0%) | 0 (0.0%) |
| Total | 4 (3.5%) | 0 (0.0%) |
Race in Fawn Grove borough
The most populous races in Fawn Grove borough are White / Caucasian (406 | 90.2%), Two or more Races (42 | 9.3%), and Hispanic or Latino (40 | 8.9%).
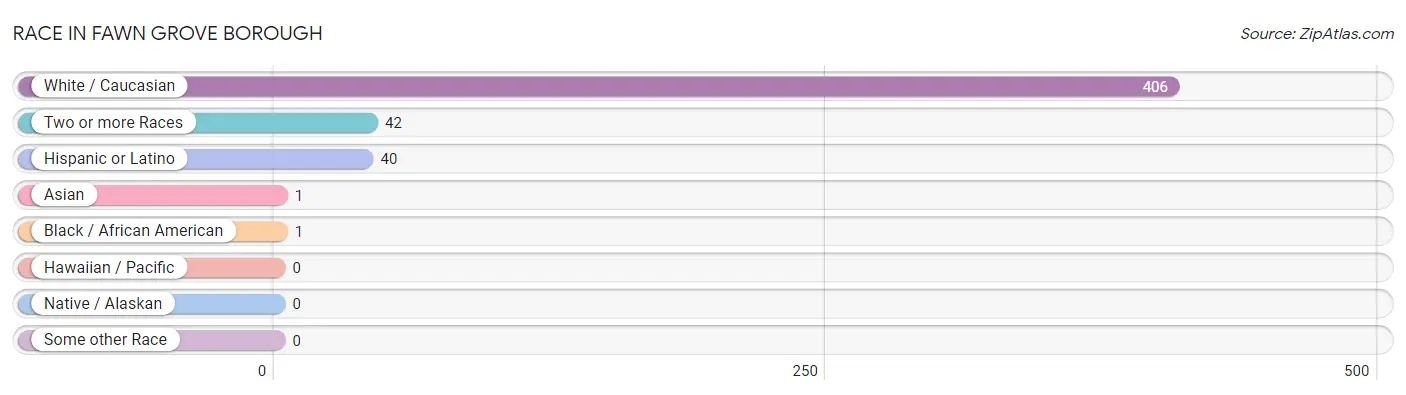
| Race | # Population | % Population |
| Asian | 1 | 0.2% |
| Black / African American | 1 | 0.2% |
| Hawaiian / Pacific | 0 | 0.0% |
| Hispanic or Latino | 40 | 8.9% |
| Native / Alaskan | 0 | 0.0% |
| White / Caucasian | 406 | 90.2% |
| Two or more Races | 42 | 9.3% |
| Some other Race | 0 | 0.0% |
| Total | 450 | 100.0% |
Ancestry in Fawn Grove borough
The most populous ancestries reported in Fawn Grove borough are German (98 | 21.8%), Irish (82 | 18.2%), English (50 | 11.1%), Italian (38 | 8.4%), and Ecuadorian (37 | 8.2%), together accounting for 67.8% of all Fawn Grove borough residents.
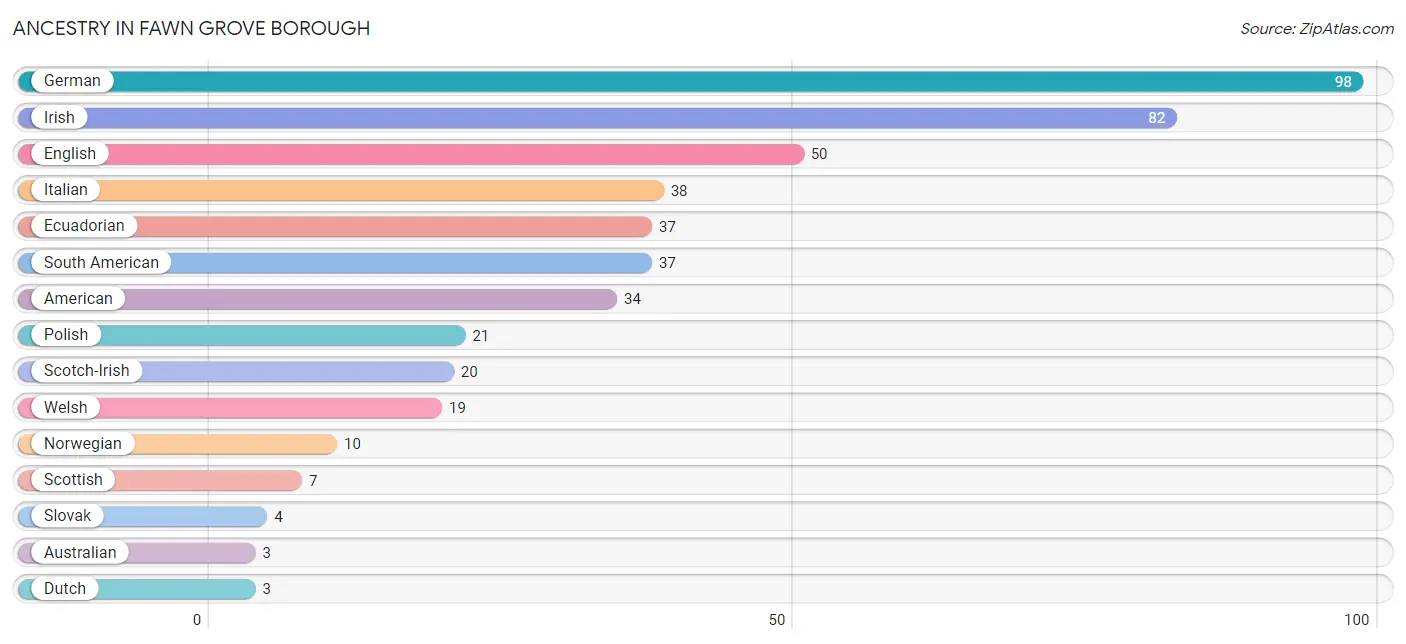
| Ancestry | # Population | % Population |
| American | 34 | 7.6% |
| Australian | 3 | 0.7% |
| British | 2 | 0.4% |
| Dutch | 3 | 0.7% |
| Ecuadorian | 37 | 8.2% |
| English | 50 | 11.1% |
| European | 2 | 0.4% |
| French | 1 | 0.2% |
| French Canadian | 2 | 0.4% |
| German | 98 | 21.8% |
| Greek | 2 | 0.4% |
| Indian (Asian) | 3 | 0.7% |
| Irish | 82 | 18.2% |
| Italian | 38 | 8.4% |
| Norwegian | 10 | 2.2% |
| Pennsylvania German | 2 | 0.4% |
| Polish | 21 | 4.7% |
| Puerto Rican | 3 | 0.7% |
| Russian | 2 | 0.4% |
| Scotch-Irish | 20 | 4.4% |
| Scottish | 7 | 1.6% |
| Slovak | 4 | 0.9% |
| South American | 37 | 8.2% |
| Swedish | 1 | 0.2% |
| Welsh | 19 | 4.2% | View All 25 Rows |
Immigrants in Fawn Grove borough
The most numerous immigrant groups reported in Fawn Grove borough came from Asia (1 | 0.2%), Australia (1 | 0.2%), China (1 | 0.2%), Eastern Asia (1 | 0.2%), and Oceania (1 | 0.2%), together accounting for 1.1% of all Fawn Grove borough residents.
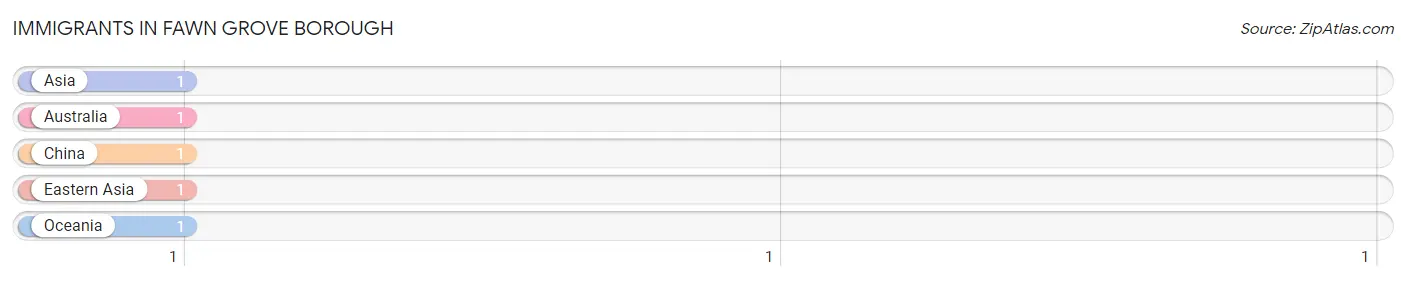
| Immigration Origin | # Population | % Population |
| Asia | 1 | 0.2% |
| Australia | 1 | 0.2% |
| China | 1 | 0.2% |
| Eastern Asia | 1 | 0.2% |
| Oceania | 1 | 0.2% | View All 5 Rows |
Sex and Age in Fawn Grove borough
Sex and Age in Fawn Grove borough
The most populous age groups in Fawn Grove borough are 55 to 59 Years (27 | 12.4%) for men and 65 to 69 Years (26 | 11.2%) for women.
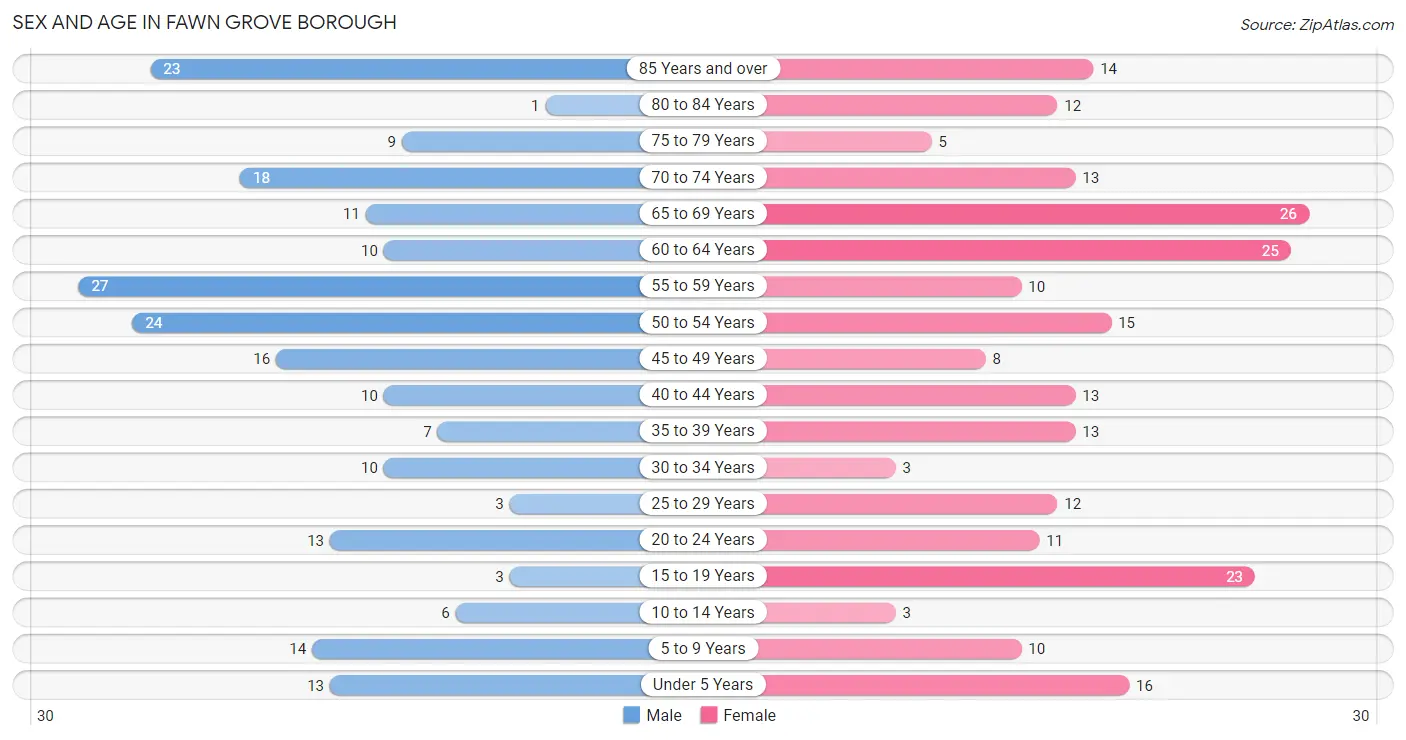
| Age Bracket | Male | Female |
| Under 5 Years | 13 (6.0%) | 16 (6.9%) |
| 5 to 9 Years | 14 (6.4%) | 10 (4.3%) |
| 10 to 14 Years | 6 (2.8%) | 3 (1.3%) |
| 15 to 19 Years | 3 (1.4%) | 23 (9.9%) |
| 20 to 24 Years | 13 (6.0%) | 11 (4.7%) |
| 25 to 29 Years | 3 (1.4%) | 12 (5.2%) |
| 30 to 34 Years | 10 (4.6%) | 3 (1.3%) |
| 35 to 39 Years | 7 (3.2%) | 13 (5.6%) |
| 40 to 44 Years | 10 (4.6%) | 13 (5.6%) |
| 45 to 49 Years | 16 (7.3%) | 8 (3.5%) |
| 50 to 54 Years | 24 (11.0%) | 15 (6.5%) |
| 55 to 59 Years | 27 (12.4%) | 10 (4.3%) |
| 60 to 64 Years | 10 (4.6%) | 25 (10.8%) |
| 65 to 69 Years | 11 (5.1%) | 26 (11.2%) |
| 70 to 74 Years | 18 (8.3%) | 13 (5.6%) |
| 75 to 79 Years | 9 (4.1%) | 5 (2.2%) |
| 80 to 84 Years | 1 (0.5%) | 12 (5.2%) |
| 85 Years and over | 23 (10.5%) | 14 (6.0%) |
| Total | 218 (100.0%) | 232 (100.0%) |
Families and Households in Fawn Grove borough
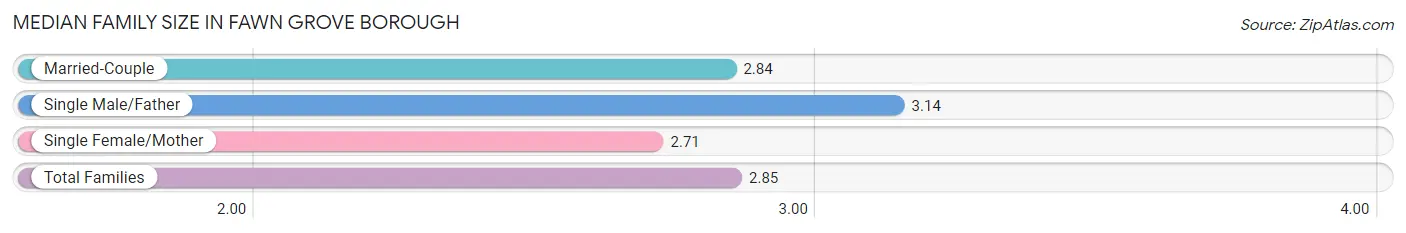
Median Family Size in Fawn Grove borough
The median family size in Fawn Grove borough is 2.85 persons per family, with single male/father families (7 | 5.1%) accounting for the largest median family size of 3.14 persons per family. On the other hand, single female/mother families (14 | 10.2%) represent the smallest median family size with 2.71 persons per family.
| Family Type | # Families | Family Size |
| Married-Couple | 116 (84.7%) | 2.84 |
| Single Male/Father | 7 (5.1%) | 3.14 |
| Single Female/Mother | 14 (10.2%) | 2.71 |
| Total Families | 137 (100.0%) | 2.85 |
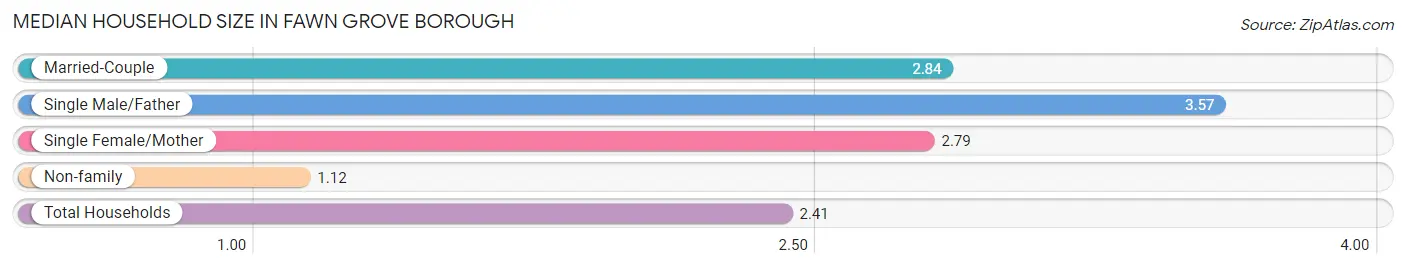
Median Household Size in Fawn Grove borough
The median household size in Fawn Grove borough is 2.41 persons per household, with single male/father households (7 | 3.7%) accounting for the largest median household size of 3.57 persons per household. non-family households (50 | 26.7%) represent the smallest median household size with 1.12 persons per household.
| Household Type | # Households | Household Size |
| Married-Couple | 116 (62.0%) | 2.84 |
| Single Male/Father | 7 (3.7%) | 3.57 |
| Single Female/Mother | 14 (7.5%) | 2.79 |
| Non-family | 50 (26.7%) | 1.12 |
| Total Households | 187 (100.0%) | 2.41 |
Household Size by Marriage Status in Fawn Grove borough
Out of a total of 187 households in Fawn Grove borough, 137 (73.3%) are family households, while 50 (26.7%) are nonfamily households. The most numerous type of family households are 2-person households, comprising 80, and the most common type of nonfamily households are 1-person households, comprising 44.
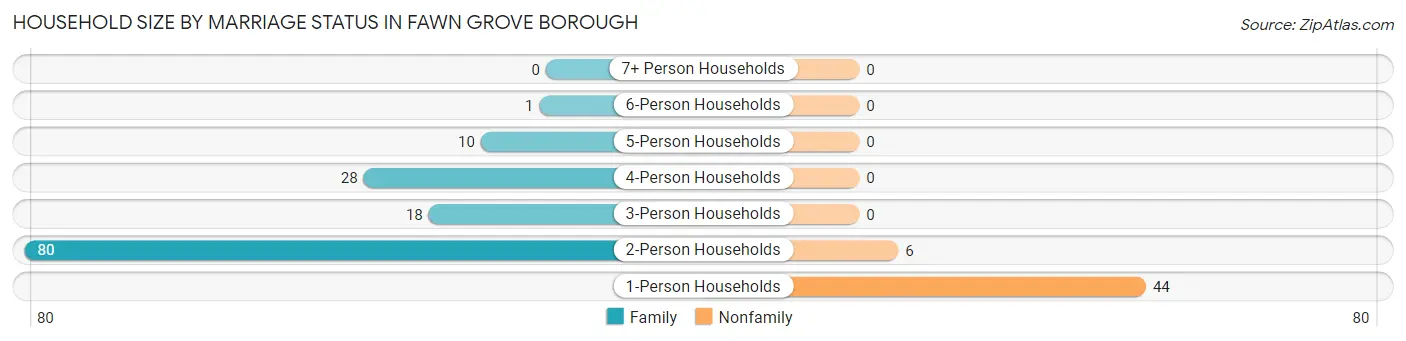
| Household Size | Family Households | Nonfamily Households |
| 1-Person Households | - | 44 (23.5%) |
| 2-Person Households | 80 (42.8%) | 6 (3.2%) |
| 3-Person Households | 18 (9.6%) | 0 (0.0%) |
| 4-Person Households | 28 (15.0%) | 0 (0.0%) |
| 5-Person Households | 10 (5.3%) | 0 (0.0%) |
| 6-Person Households | 1 (0.5%) | 0 (0.0%) |
| 7+ Person Households | 0 (0.0%) | 0 (0.0%) |
| Total | 137 (73.3%) | 50 (26.7%) |
Female Fertility in Fawn Grove borough
Fertility by Age in Fawn Grove borough
Average fertility rate in Fawn Grove borough is 178.0 births per 1,000 women. Women in the age bracket of 20 to 34 years have the highest fertility rate with 462.0 births per 1,000 women. Women in the age bracket of 20 to 34 years acount for 75.0% of all women with births.
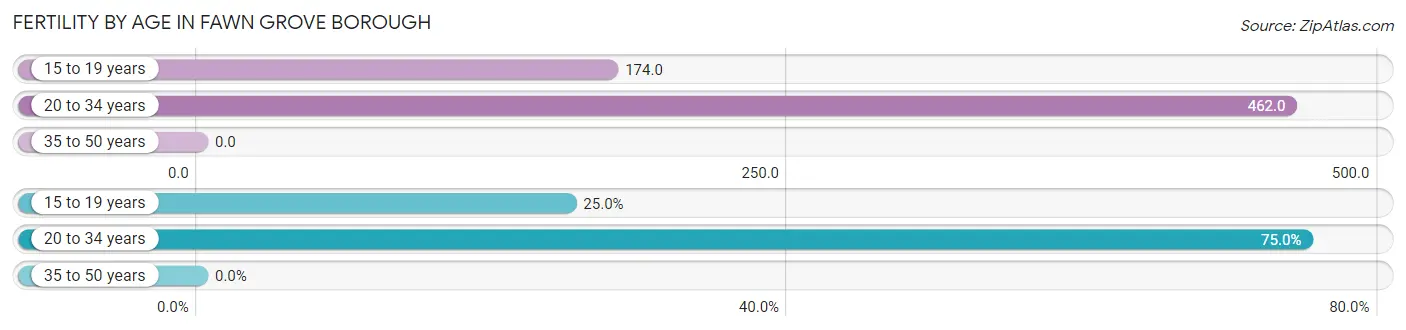
| Age Bracket | Women with Births | Births / 1,000 Women |
| 15 to 19 years | 4 (25.0%) | 174.0 |
| 20 to 34 years | 12 (75.0%) | 462.0 |
| 35 to 50 years | 0 (0.0%) | 0.0 |
| Total | 16 (100.0%) | 178.0 |
Fertility by Age by Marriage Status in Fawn Grove borough
62.5% of women with births (16) in Fawn Grove borough are married. The highest percentage of unmarried women with births falls into 15 to 19 years age bracket with 100.0% of them unmarried at the time of birth, while the lowest percentage of unmarried women with births belong to 20 to 34 years age bracket with 16.7% of them unmarried.
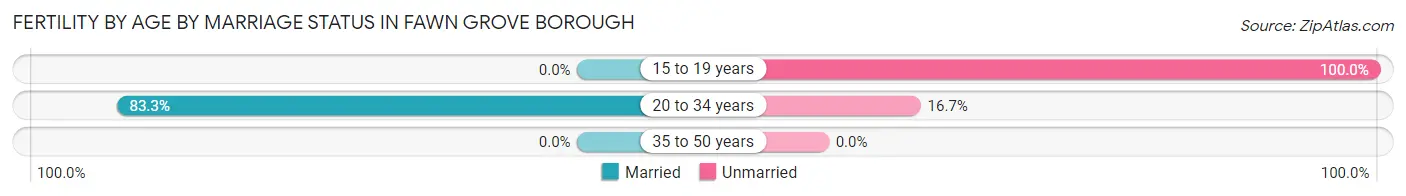
| Age Bracket | Married | Unmarried |
| 15 to 19 years | 0 (0.0%) | 4 (100.0%) |
| 20 to 34 years | 10 (83.3%) | 2 (16.7%) |
| 35 to 50 years | 0 (0.0%) | 0 (0.0%) |
| Total | 10 (62.5%) | 6 (37.5%) |
Fertility by Education in Fawn Grove borough
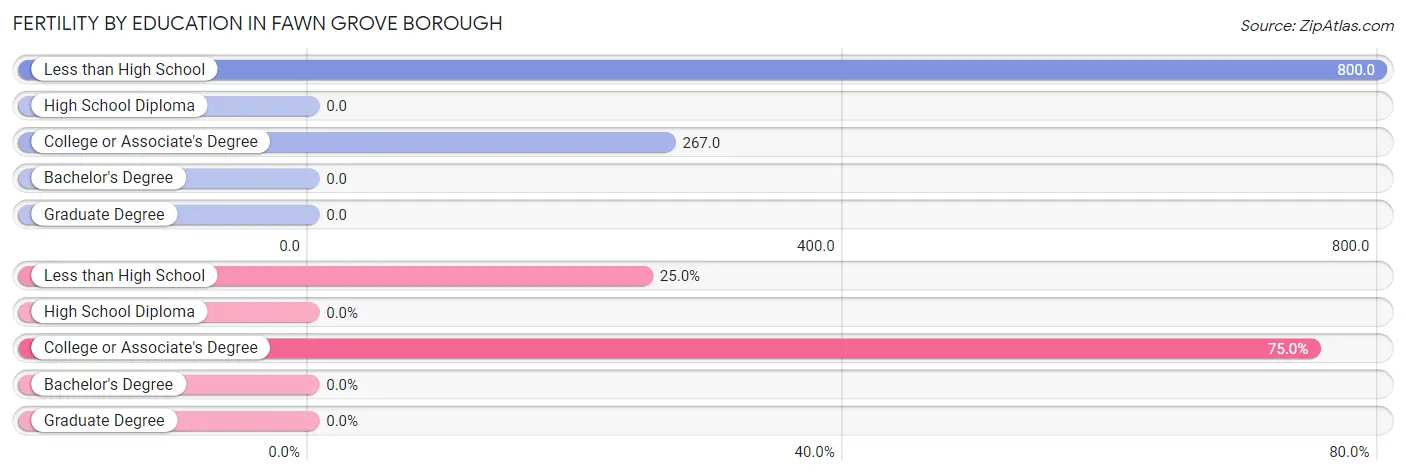
| Educational Attainment | Women with Births | Births / 1,000 Women |
| Less than High School | 4 (25.0%) | 800.0 |
| High School Diploma | 0 (0.0%) | 0.0 |
| College or Associate's Degree | 12 (75.0%) | 267.0 |
| Bachelor's Degree | 0 (0.0%) | 0.0 |
| Graduate Degree | 0 (0.0%) | 0.0 |
| Total | 16 (100.0%) | 178.0 |
Fertility by Education by Marriage Status in Fawn Grove borough
37.5% of women with births in Fawn Grove borough are unmarried. Women with the educational attainment of college or associate's degree are most likely to be married with 83.3% of them married at childbirth, while women with the educational attainment of less than high school are least likely to be married with 100.0% of them unmarried at childbirth.
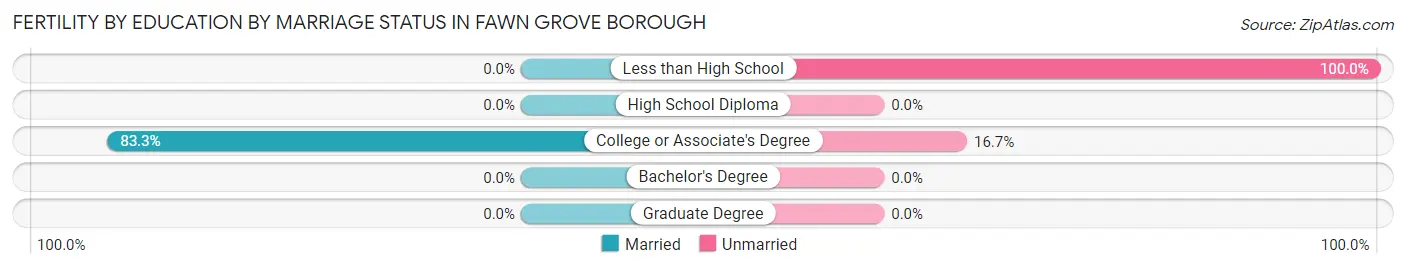
| Educational Attainment | Married | Unmarried |
| Less than High School | 0 (0.0%) | 4 (100.0%) |
| High School Diploma | 0 (0.0%) | 0 (0.0%) |
| College or Associate's Degree | 10 (83.3%) | 2 (16.7%) |
| Bachelor's Degree | 0 (0.0%) | 0 (0.0%) |
| Graduate Degree | 0 (0.0%) | 0 (0.0%) |
| Total | 10 (62.5%) | 6 (37.5%) |
Employment Characteristics in Fawn Grove borough
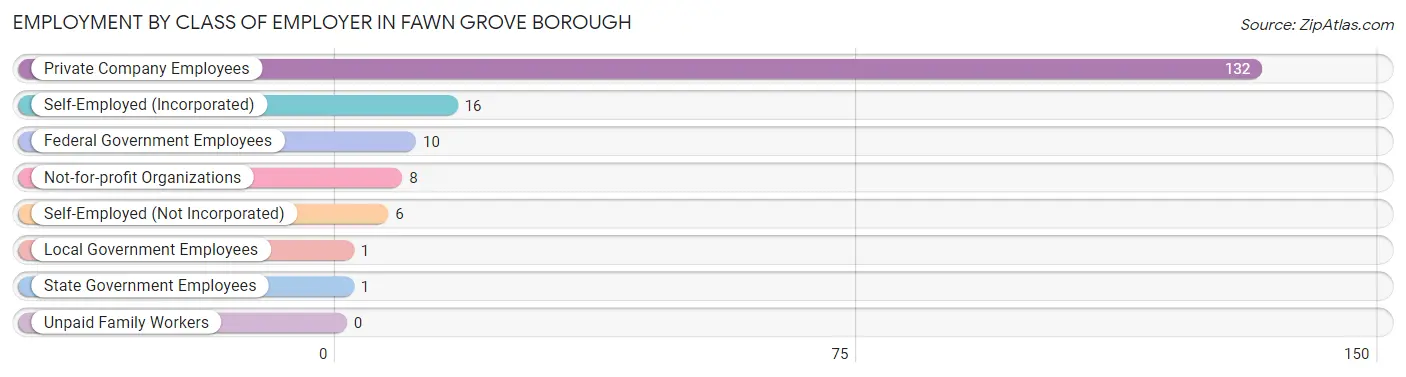
Employment by Class of Employer in Fawn Grove borough
Among the 174 employed individuals in Fawn Grove borough, private company employees (132 | 75.9%), self-employed (incorporated) (16 | 9.2%), and federal government employees (10 | 5.8%) make up the most common classes of employment.
| Employer Class | # Employees | % Employees |
| Private Company Employees | 132 | 75.9% |
| Self-Employed (Incorporated) | 16 | 9.2% |
| Self-Employed (Not Incorporated) | 6 | 3.5% |
| Not-for-profit Organizations | 8 | 4.6% |
| Local Government Employees | 1 | 0.6% |
| State Government Employees | 1 | 0.6% |
| Federal Government Employees | 10 | 5.8% |
| Unpaid Family Workers | 0 | 0.0% |
| Total | 174 | 100.0% |
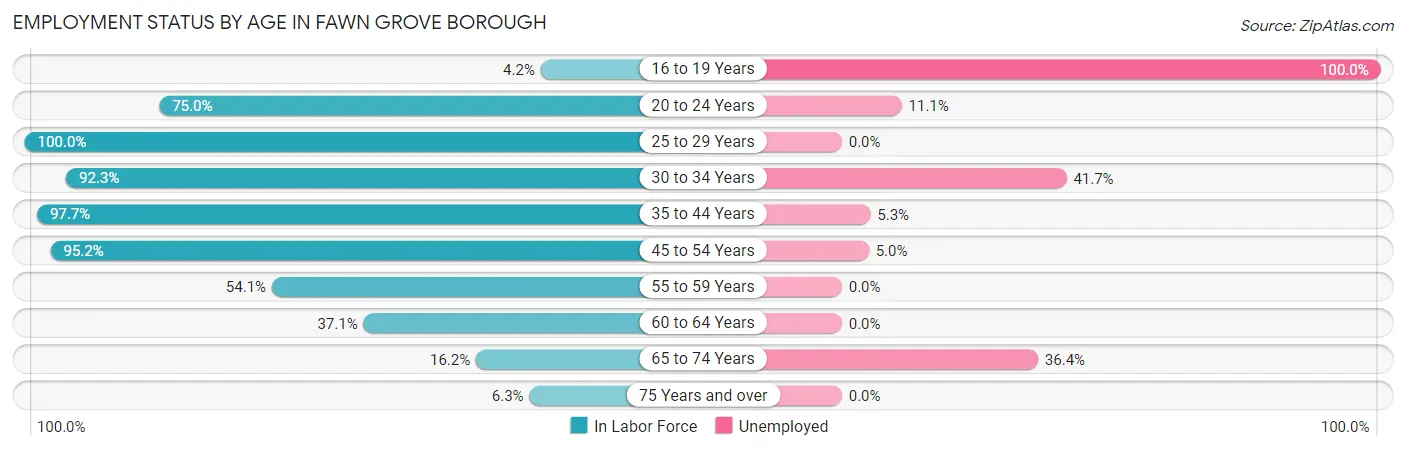
Employment Status by Age in Fawn Grove borough
According to the labor force statistics for Fawn Grove borough, out of the total population over 16 years of age (386), 50.8% or 196 individuals are in the labor force, with 8.9% or 17 of them unemployed. The age group with the highest labor force participation rate is 25 to 29 years, with 100.0% or 15 individuals in the labor force. Within the labor force, the 16 to 19 years age range has the highest percentage of unemployed individuals, with 100.0% or 1 of them being unemployed.
| Age Bracket | In Labor Force | Unemployed |
| 16 to 19 Years | 1 (4.2%) | 1 (100.0%) |
| 20 to 24 Years | 18 (75.0%) | 2 (11.1%) |
| 25 to 29 Years | 15 (100.0%) | 0 (0.0%) |
| 30 to 34 Years | 12 (92.3%) | 5 (41.7%) |
| 35 to 44 Years | 42 (97.7%) | 2 (5.3%) |
| 45 to 54 Years | 60 (95.2%) | 3 (5.0%) |
| 55 to 59 Years | 20 (54.1%) | 0 (0.0%) |
| 60 to 64 Years | 13 (37.1%) | 0 (0.0%) |
| 65 to 74 Years | 11 (16.2%) | 4 (36.4%) |
| 75 Years and over | 4 (6.3%) | 0 (0.0%) |
| Total | 196 (50.8%) | 17 (8.9%) |
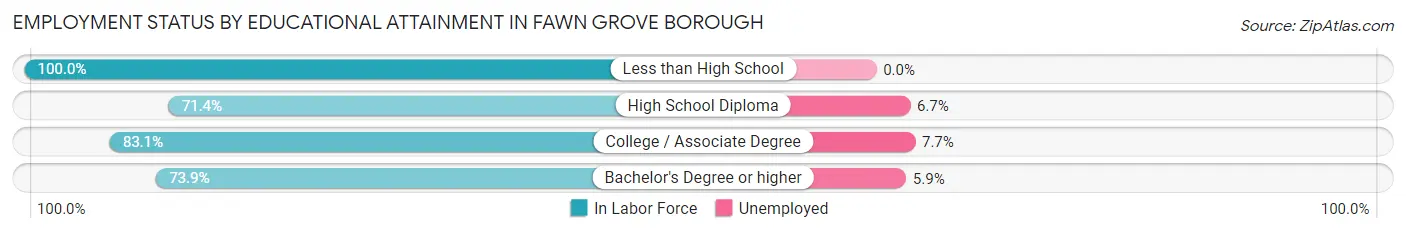
Employment Status by Educational Attainment in Fawn Grove borough
According to labor force statistics for Fawn Grove borough, 78.6% of individuals (162) out of the total population between 25 and 64 years of age (206) are in the labor force, with 6.3% or 10 of them being unemployed. The group with the highest labor force participation rate are those with the educational attainment of less than high school, with 100.0% or 16 individuals in the labor force. Within the labor force, individuals with college / associate degree education have the highest percentage of unemployment, with 7.7% or 5 of them being unemployed.
| Educational Attainment | In Labor Force | Unemployed |
| Less than High School | 16 (100.0%) | 0 (0.0%) |
| High School Diploma | 60 (71.4%) | 6 (6.7%) |
| College / Associate Degree | 69 (83.1%) | 6 (7.7%) |
| Bachelor's Degree or higher | 17 (73.9%) | 1 (5.9%) |
| Total | 162 (78.6%) | 13 (6.3%) |
Employment Occupations by Sex in Fawn Grove borough
Management, Business, Science and Arts Occupations
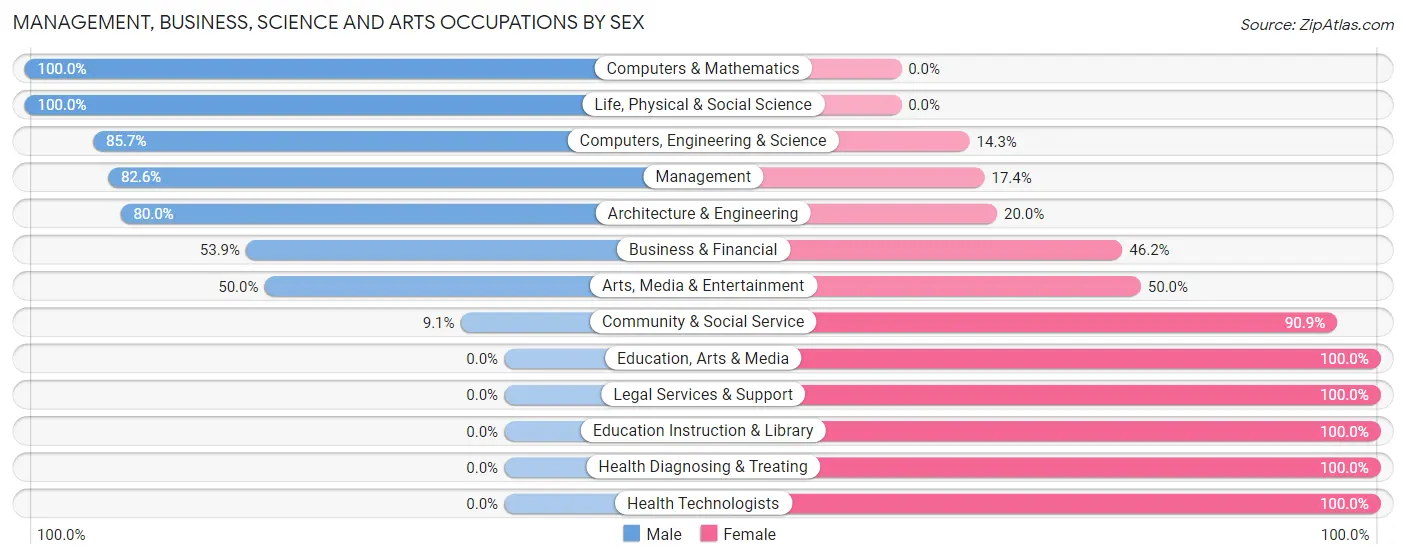
The most common Management, Business, Science and Arts occupations in Fawn Grove borough are Management (23 | 13.1%), Business & Financial (13 | 7.4%), Community & Social Service (11 | 6.3%), Health Diagnosing & Treating (9 | 5.1%), and Computers, Engineering & Science (7 | 4.0%).
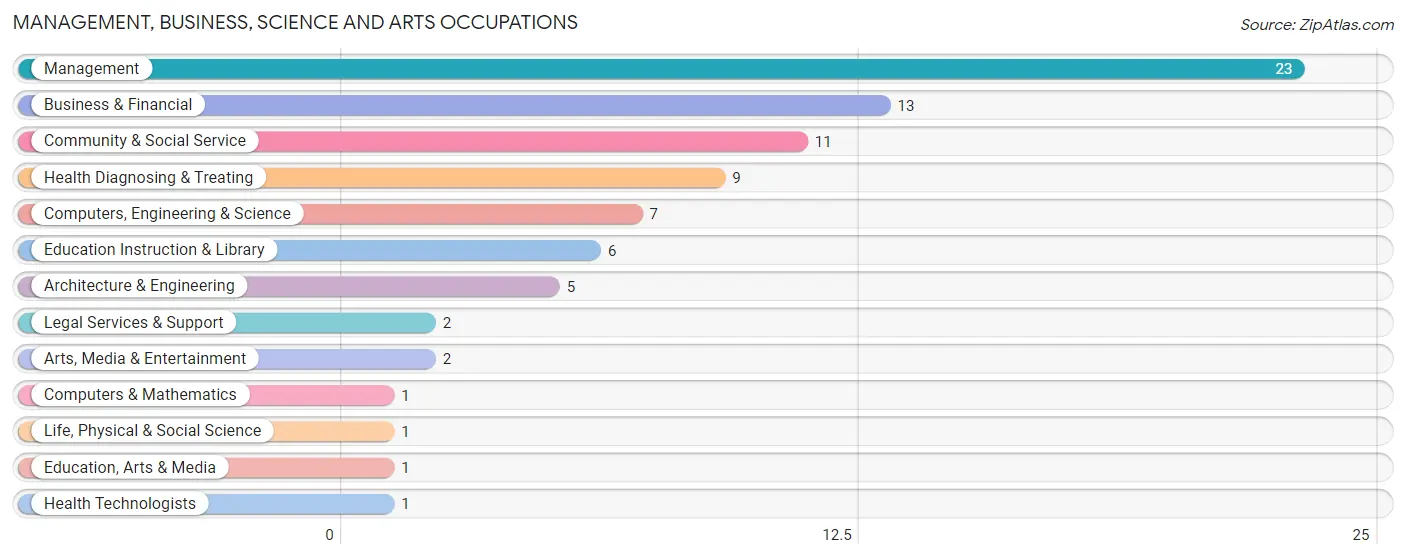
Management, Business, Science and Arts Occupations by Sex
Within the Management, Business, Science and Arts occupations in Fawn Grove borough, the most male-oriented occupations are Computers & Mathematics (100.0%), Life, Physical & Social Science (100.0%), and Computers, Engineering & Science (85.7%), while the most female-oriented occupations are Education, Arts & Media (100.0%), Legal Services & Support (100.0%), and Education Instruction & Library (100.0%).
| Occupation | Male | Female |
| Management | 19 (82.6%) | 4 (17.4%) |
| Business & Financial | 7 (53.8%) | 6 (46.2%) |
| Computers, Engineering & Science | 6 (85.7%) | 1 (14.3%) |
| Computers & Mathematics | 1 (100.0%) | 0 (0.0%) |
| Architecture & Engineering | 4 (80.0%) | 1 (20.0%) |
| Life, Physical & Social Science | 1 (100.0%) | 0 (0.0%) |
| Community & Social Service | 1 (9.1%) | 10 (90.9%) |
| Education, Arts & Media | 0 (0.0%) | 1 (100.0%) |
| Legal Services & Support | 0 (0.0%) | 2 (100.0%) |
| Education Instruction & Library | 0 (0.0%) | 6 (100.0%) |
| Arts, Media & Entertainment | 1 (50.0%) | 1 (50.0%) |
| Health Diagnosing & Treating | 0 (0.0%) | 9 (100.0%) |
| Health Technologists | 0 (0.0%) | 1 (100.0%) |
| Total (Category) | 33 (52.4%) | 30 (47.6%) |
| Total (Overall) | 101 (57.7%) | 74 (42.3%) |
Services Occupations
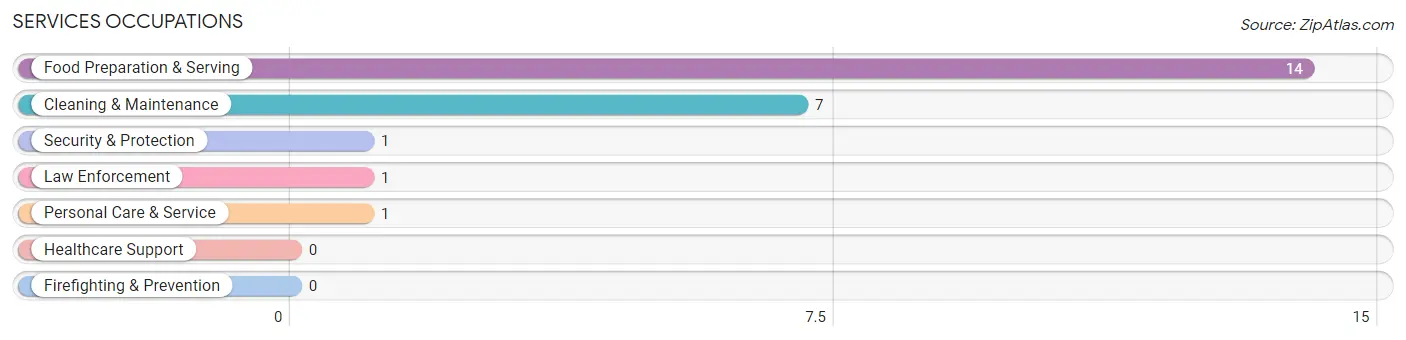
The most common Services occupations in Fawn Grove borough are Food Preparation & Serving (14 | 8.0%), Cleaning & Maintenance (7 | 4.0%), Security & Protection (1 | 0.6%), Law Enforcement (1 | 0.6%), and Personal Care & Service (1 | 0.6%).
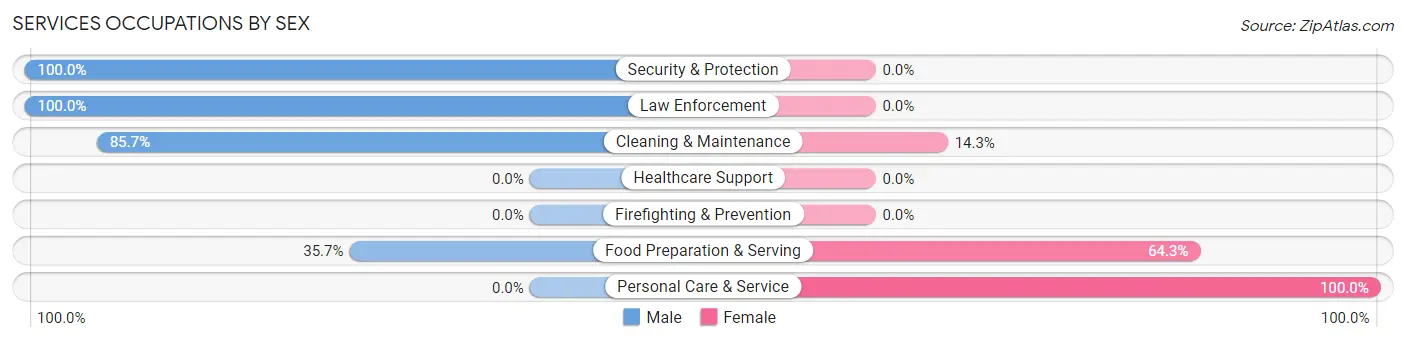
Services Occupations by Sex
Within the Services occupations in Fawn Grove borough, the most male-oriented occupations are Security & Protection (100.0%), Law Enforcement (100.0%), and Cleaning & Maintenance (85.7%), while the most female-oriented occupations are Personal Care & Service (100.0%), Food Preparation & Serving (64.3%), and Cleaning & Maintenance (14.3%).
| Occupation | Male | Female |
| Healthcare Support | 0 (0.0%) | 0 (0.0%) |
| Security & Protection | 1 (100.0%) | 0 (0.0%) |
| Firefighting & Prevention | 0 (0.0%) | 0 (0.0%) |
| Law Enforcement | 1 (100.0%) | 0 (0.0%) |
| Food Preparation & Serving | 5 (35.7%) | 9 (64.3%) |
| Cleaning & Maintenance | 6 (85.7%) | 1 (14.3%) |
| Personal Care & Service | 0 (0.0%) | 1 (100.0%) |
| Total (Category) | 12 (52.2%) | 11 (47.8%) |
| Total (Overall) | 101 (57.7%) | 74 (42.3%) |
Sales and Office Occupations
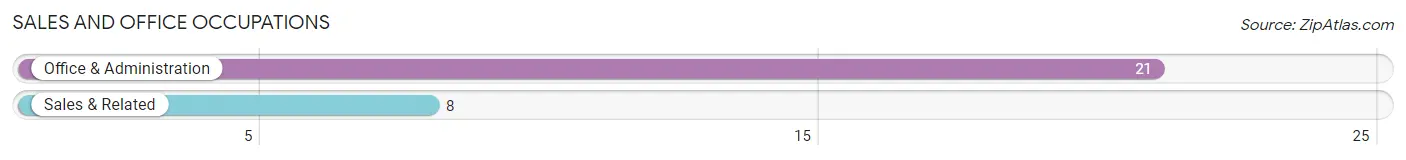
The most common Sales and Office occupations in Fawn Grove borough are Office & Administration (21 | 12.0%), and Sales & Related (8 | 4.6%).
Sales and Office Occupations by Sex
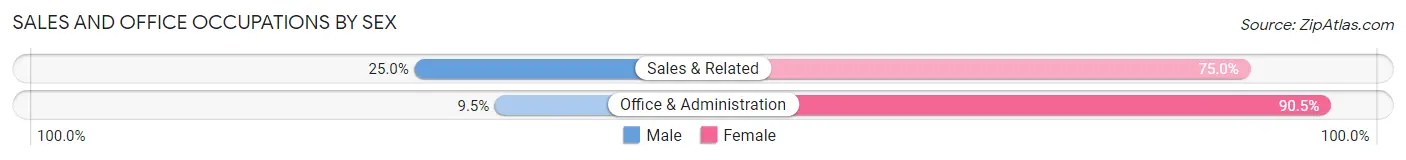
| Occupation | Male | Female |
| Sales & Related | 2 (25.0%) | 6 (75.0%) |
| Office & Administration | 2 (9.5%) | 19 (90.5%) |
| Total (Category) | 4 (13.8%) | 25 (86.2%) |
| Total (Overall) | 101 (57.7%) | 74 (42.3%) |
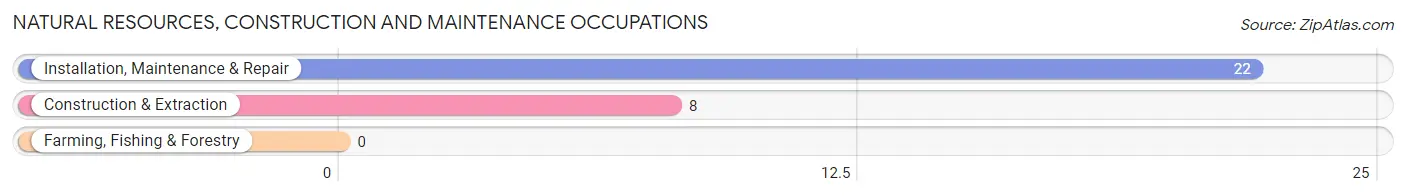
Natural Resources, Construction and Maintenance Occupations
The most common Natural Resources, Construction and Maintenance occupations in Fawn Grove borough are Installation, Maintenance & Repair (22 | 12.6%), and Construction & Extraction (8 | 4.6%).
Natural Resources, Construction and Maintenance Occupations by Sex
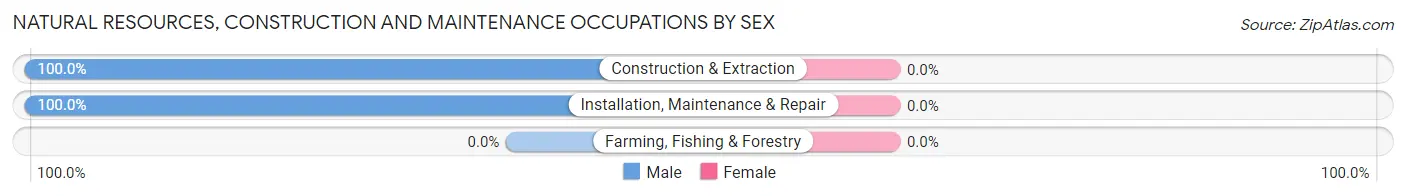
| Occupation | Male | Female |
| Farming, Fishing & Forestry | 0 (0.0%) | 0 (0.0%) |
| Construction & Extraction | 8 (100.0%) | 0 (0.0%) |
| Installation, Maintenance & Repair | 22 (100.0%) | 0 (0.0%) |
| Total (Category) | 30 (100.0%) | 0 (0.0%) |
| Total (Overall) | 101 (57.7%) | 74 (42.3%) |
Production, Transportation and Moving Occupations
The most common Production, Transportation and Moving occupations in Fawn Grove borough are Material Moving (14 | 8.0%), Production (8 | 4.6%), and Transportation (8 | 4.6%).
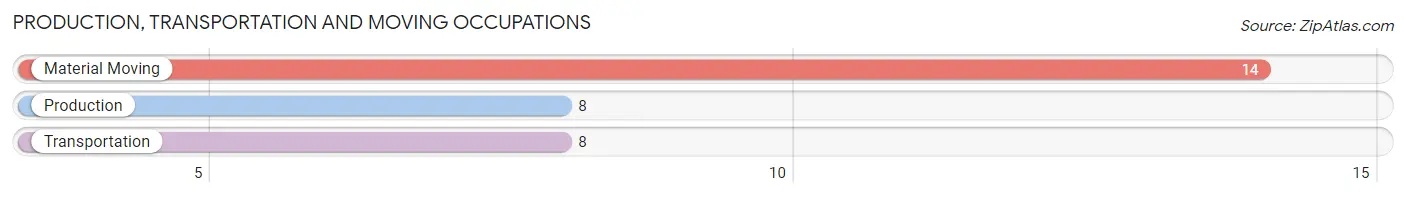
Production, Transportation and Moving Occupations by Sex
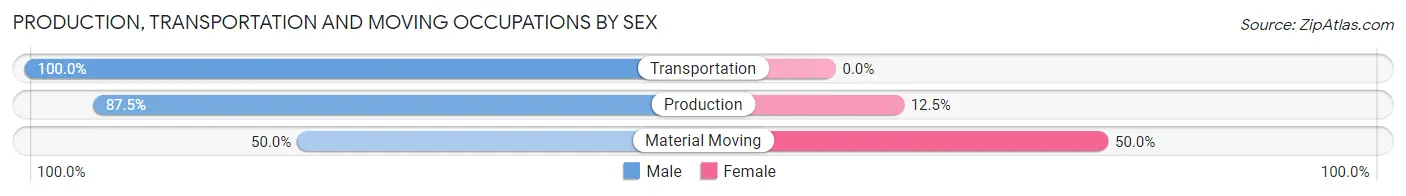
| Occupation | Male | Female |
| Production | 7 (87.5%) | 1 (12.5%) |
| Transportation | 8 (100.0%) | 0 (0.0%) |
| Material Moving | 7 (50.0%) | 7 (50.0%) |
| Total (Category) | 22 (73.3%) | 8 (26.7%) |
| Total (Overall) | 101 (57.7%) | 74 (42.3%) |
Employment Industries by Sex in Fawn Grove borough
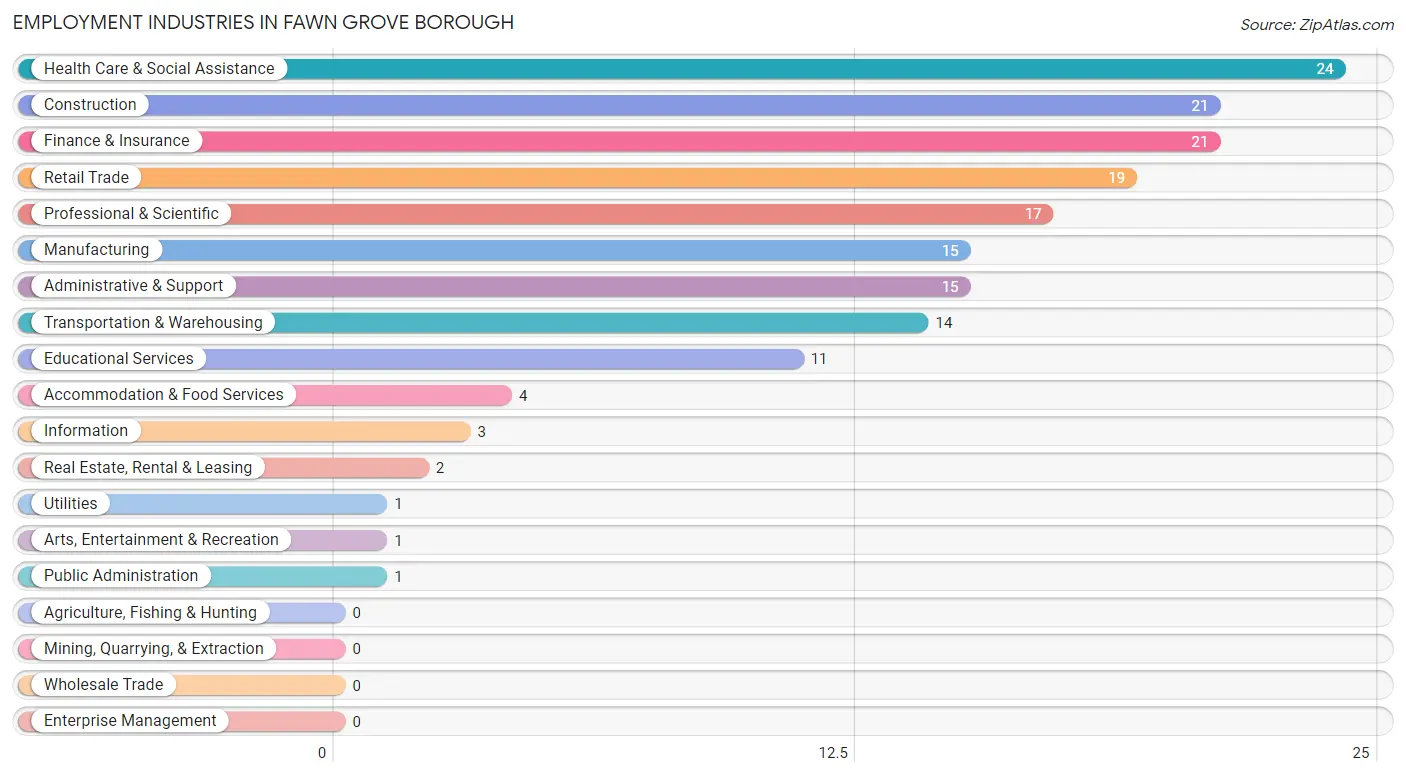
Employment Industries in Fawn Grove borough
The major employment industries in Fawn Grove borough include Health Care & Social Assistance (24 | 13.7%), Construction (21 | 12.0%), Finance & Insurance (21 | 12.0%), Retail Trade (19 | 10.9%), and Professional & Scientific (17 | 9.7%).
Employment Industries by Sex in Fawn Grove borough
The Fawn Grove borough industries that see more men than women are Utilities (100.0%), Arts, Entertainment & Recreation (100.0%), and Public Administration (100.0%), whereas the industries that tend to have a higher number of women are Real Estate, Rental & Leasing (100.0%), Educational Services (100.0%), and Accommodation & Food Services (75.0%).
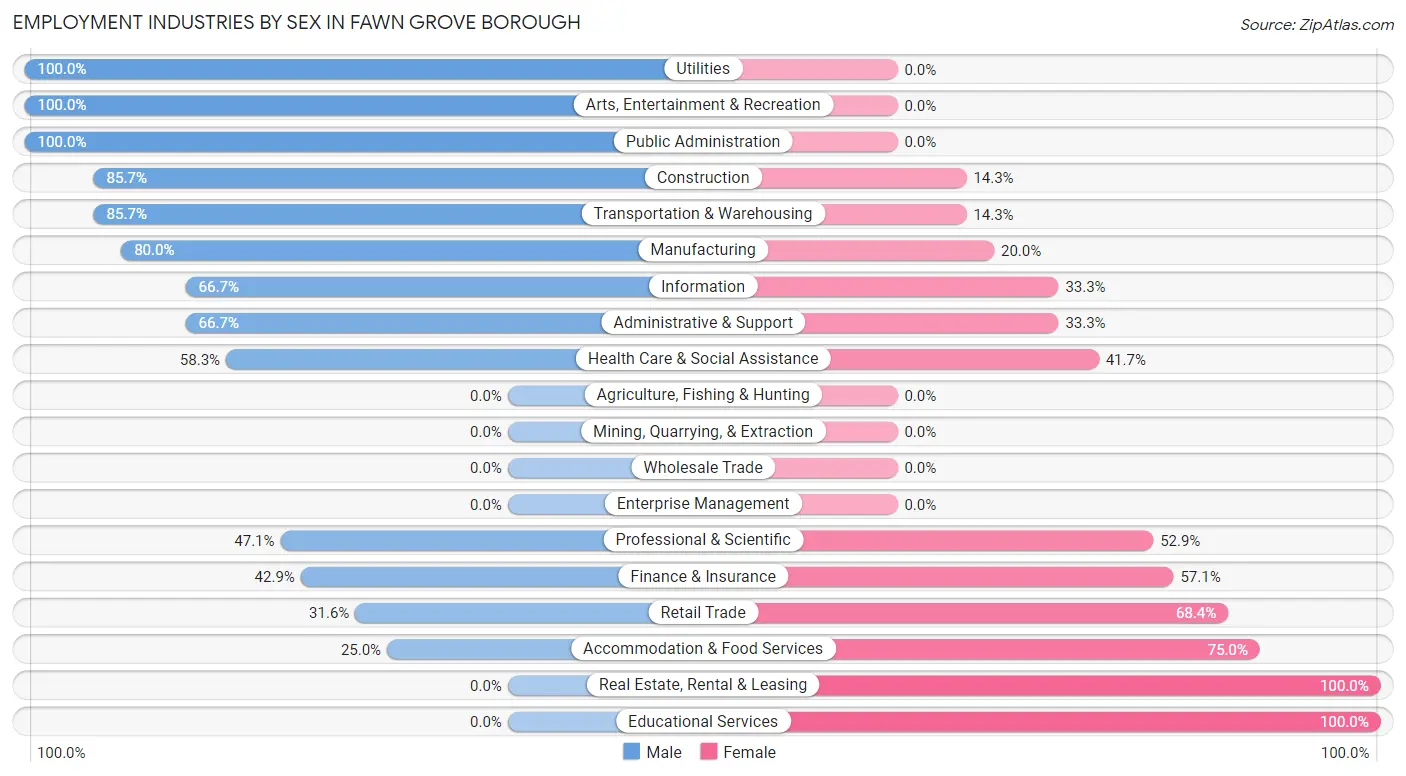
| Industry | Male | Female |
| Agriculture, Fishing & Hunting | 0 (0.0%) | 0 (0.0%) |
| Mining, Quarrying, & Extraction | 0 (0.0%) | 0 (0.0%) |
| Construction | 18 (85.7%) | 3 (14.3%) |
| Manufacturing | 12 (80.0%) | 3 (20.0%) |
| Wholesale Trade | 0 (0.0%) | 0 (0.0%) |
| Retail Trade | 6 (31.6%) | 13 (68.4%) |
| Transportation & Warehousing | 12 (85.7%) | 2 (14.3%) |
| Utilities | 1 (100.0%) | 0 (0.0%) |
| Information | 2 (66.7%) | 1 (33.3%) |
| Finance & Insurance | 9 (42.9%) | 12 (57.1%) |
| Real Estate, Rental & Leasing | 0 (0.0%) | 2 (100.0%) |
| Professional & Scientific | 8 (47.1%) | 9 (52.9%) |
| Enterprise Management | 0 (0.0%) | 0 (0.0%) |
| Administrative & Support | 10 (66.7%) | 5 (33.3%) |
| Educational Services | 0 (0.0%) | 11 (100.0%) |
| Health Care & Social Assistance | 14 (58.3%) | 10 (41.7%) |
| Arts, Entertainment & Recreation | 1 (100.0%) | 0 (0.0%) |
| Accommodation & Food Services | 1 (25.0%) | 3 (75.0%) |
| Public Administration | 1 (100.0%) | 0 (0.0%) |
| Total | 101 (57.7%) | 74 (42.3%) |
Education in Fawn Grove borough
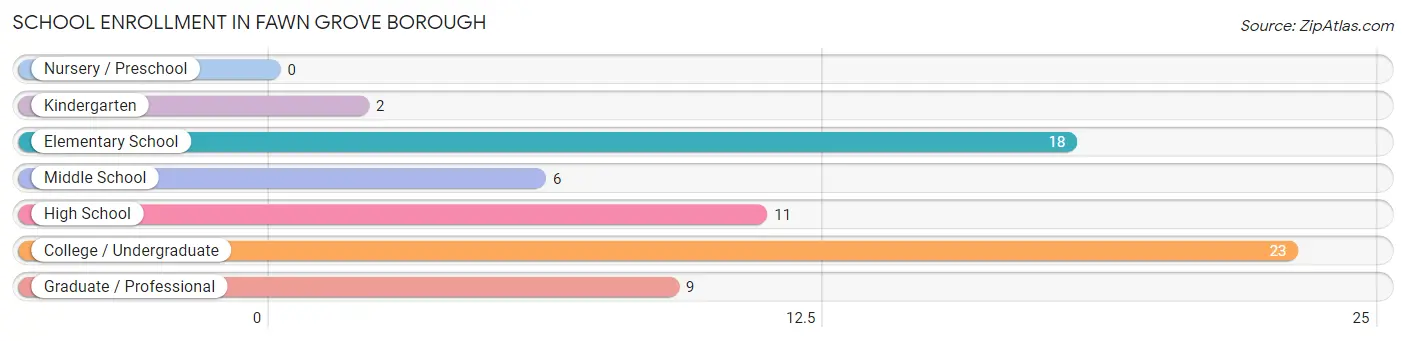
School Enrollment in Fawn Grove borough
The most common levels of schooling among the 69 students in Fawn Grove borough are college / undergraduate (23 | 33.3%), elementary school (18 | 26.1%), and high school (11 | 15.9%).
| School Level | # Students | % Students |
| Nursery / Preschool | 0 | 0.0% |
| Kindergarten | 2 | 2.9% |
| Elementary School | 18 | 26.1% |
| Middle School | 6 | 8.7% |
| High School | 11 | 15.9% |
| College / Undergraduate | 23 | 33.3% |
| Graduate / Professional | 9 | 13.0% |
| Total | 69 | 100.0% |
School Enrollment by Age by Funding Source in Fawn Grove borough
Out of a total of 69 students who are enrolled in schools in Fawn Grove borough, 22 (31.9%) attend a private institution, while the remaining 47 (68.1%) are enrolled in public schools. The age group of 18 to 19 year olds has the highest likelihood of being enrolled in private schools, with 18 (100.0% in the age bracket) enrolled. Conversely, the age group of 5 to 9 year old has the lowest likelihood of being enrolled in a private school, with 20 (100.0% in the age bracket) attending a public institution.
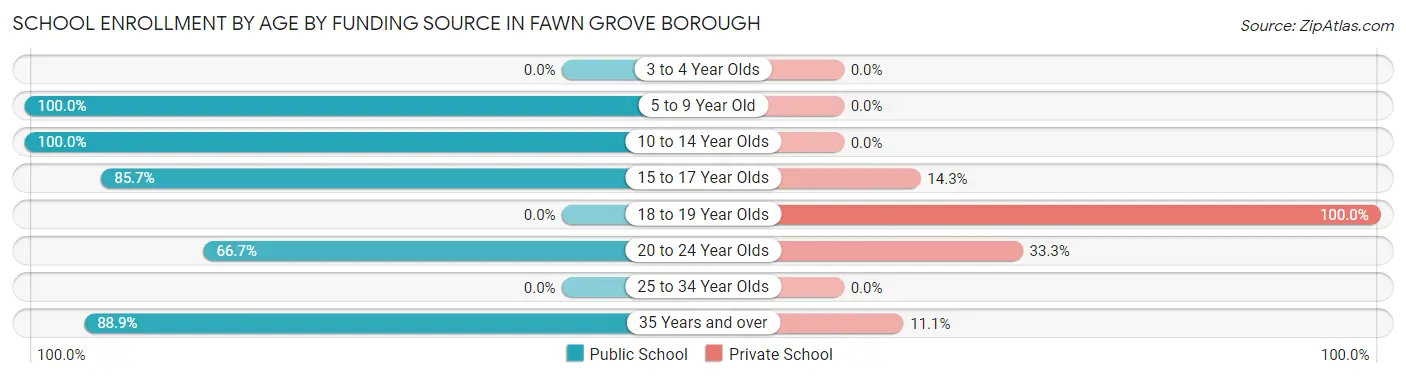
| Age Bracket | Public School | Private School |
| 3 to 4 Year Olds | 0 (0.0%) | 0 (0.0%) |
| 5 to 9 Year Old | 20 (100.0%) | 0 (0.0%) |
| 10 to 14 Year Olds | 9 (100.0%) | 0 (0.0%) |
| 15 to 17 Year Olds | 6 (85.7%) | 1 (14.3%) |
| 18 to 19 Year Olds | 0 (0.0%) | 18 (100.0%) |
| 20 to 24 Year Olds | 4 (66.7%) | 2 (33.3%) |
| 25 to 34 Year Olds | 0 (0.0%) | 0 (0.0%) |
| 35 Years and over | 8 (88.9%) | 1 (11.1%) |
| Total | 47 (68.1%) | 22 (31.9%) |
Educational Attainment by Field of Study in Fawn Grove borough
Education (18 | 36.7%), business (17 | 34.7%), arts & humanities (6 | 12.2%), bio, nature & agricultural (2 | 4.1%), and science & technology (2 | 4.1%) are the most common fields of study among 49 individuals in Fawn Grove borough who have obtained a bachelor's degree or higher.
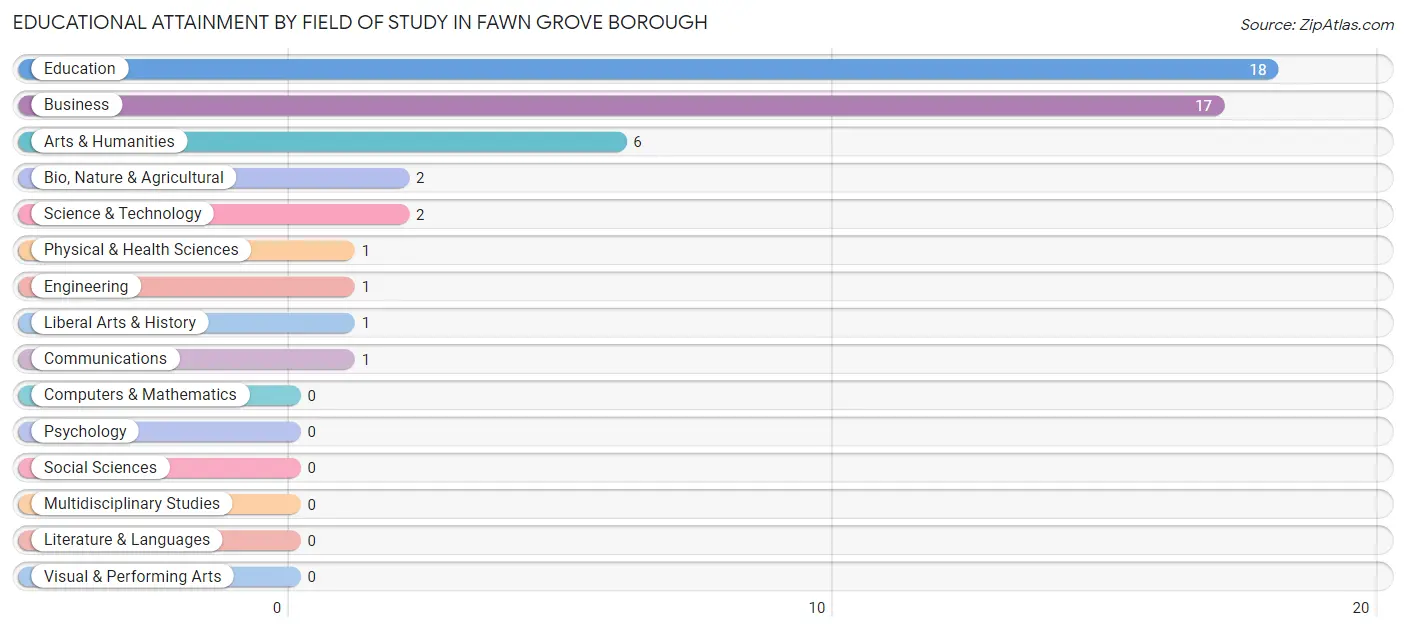
| Field of Study | # Graduates | % Graduates |
| Computers & Mathematics | 0 | 0.0% |
| Bio, Nature & Agricultural | 2 | 4.1% |
| Physical & Health Sciences | 1 | 2.0% |
| Psychology | 0 | 0.0% |
| Social Sciences | 0 | 0.0% |
| Engineering | 1 | 2.0% |
| Multidisciplinary Studies | 0 | 0.0% |
| Science & Technology | 2 | 4.1% |
| Business | 17 | 34.7% |
| Education | 18 | 36.7% |
| Literature & Languages | 0 | 0.0% |
| Liberal Arts & History | 1 | 2.0% |
| Visual & Performing Arts | 0 | 0.0% |
| Communications | 1 | 2.0% |
| Arts & Humanities | 6 | 12.2% |
| Total | 49 | 100.0% |
Transportation & Commute in Fawn Grove borough
Vehicle Availability by Sex in Fawn Grove borough
The most prevalent vehicle ownership categories in Fawn Grove borough are males with 2 vehicles (36, accounting for 35.6%) and females with 2 vehicles (29, making up 49.3%).
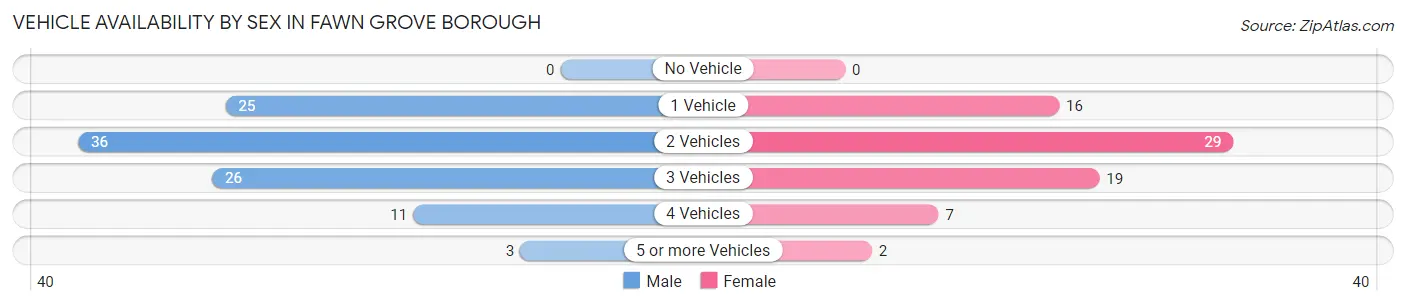
| Vehicles Available | Male | Female |
| No Vehicle | 0 (0.0%) | 0 (0.0%) |
| 1 Vehicle | 25 (24.7%) | 16 (21.9%) |
| 2 Vehicles | 36 (35.6%) | 29 (39.7%) |
| 3 Vehicles | 26 (25.7%) | 19 (26.0%) |
| 4 Vehicles | 11 (10.9%) | 7 (9.6%) |
| 5 or more Vehicles | 3 (3.0%) | 2 (2.7%) |
| Total | 101 (100.0%) | 73 (100.0%) |
Commute Time in Fawn Grove borough
The most frequently occuring commute durations in Fawn Grove borough are 45 to 59 minutes (50 commuters, 36.2%), less than 5 minutes (18 commuters, 13.0%), and 60 to 89 minutes (18 commuters, 13.0%).
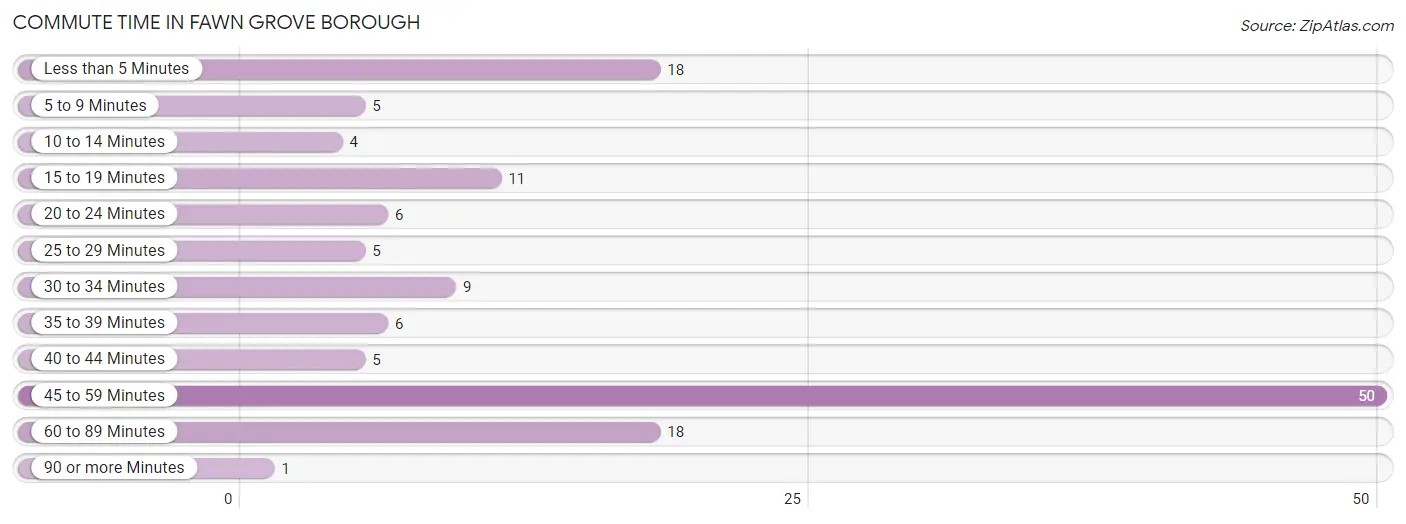
| Commute Time | # Commuters | % Commuters |
| Less than 5 Minutes | 18 | 13.0% |
| 5 to 9 Minutes | 5 | 3.6% |
| 10 to 14 Minutes | 4 | 2.9% |
| 15 to 19 Minutes | 11 | 8.0% |
| 20 to 24 Minutes | 6 | 4.3% |
| 25 to 29 Minutes | 5 | 3.6% |
| 30 to 34 Minutes | 9 | 6.5% |
| 35 to 39 Minutes | 6 | 4.3% |
| 40 to 44 Minutes | 5 | 3.6% |
| 45 to 59 Minutes | 50 | 36.2% |
| 60 to 89 Minutes | 18 | 13.0% |
| 90 or more Minutes | 1 | 0.7% |
Commute Time by Sex in Fawn Grove borough
The most common commute times in Fawn Grove borough are 45 to 59 minutes (47 commuters, 51.6%) for males and less than 5 minutes (16 commuters, 34.0%) for females.
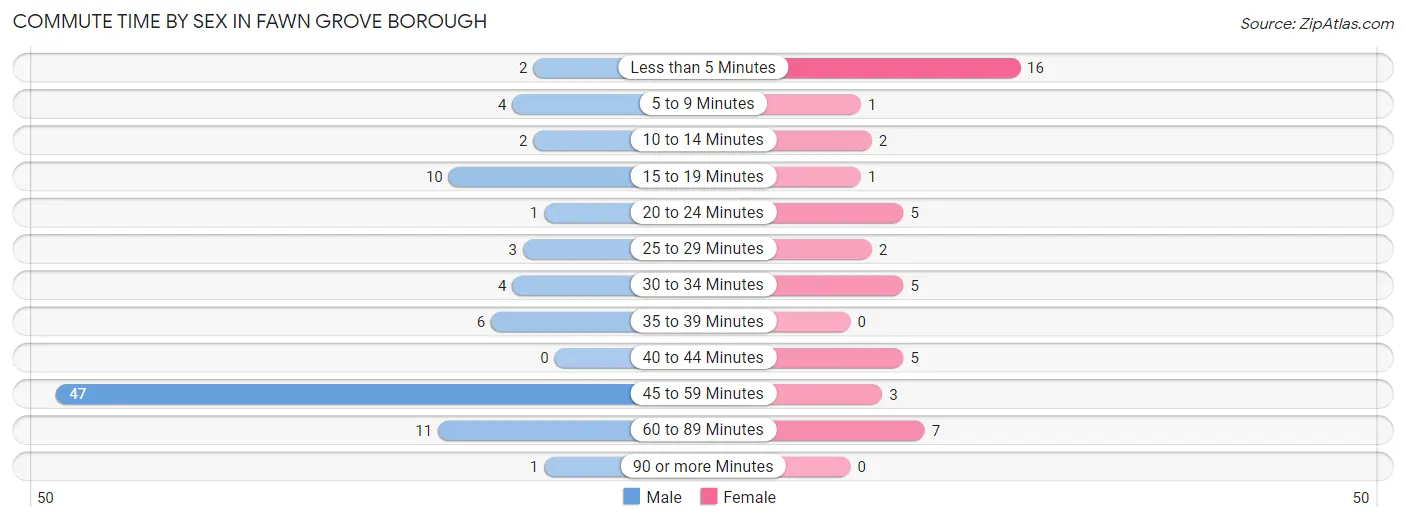
| Commute Time | Male | Female |
| Less than 5 Minutes | 2 (2.2%) | 16 (34.0%) |
| 5 to 9 Minutes | 4 (4.4%) | 1 (2.1%) |
| 10 to 14 Minutes | 2 (2.2%) | 2 (4.3%) |
| 15 to 19 Minutes | 10 (11.0%) | 1 (2.1%) |
| 20 to 24 Minutes | 1 (1.1%) | 5 (10.6%) |
| 25 to 29 Minutes | 3 (3.3%) | 2 (4.3%) |
| 30 to 34 Minutes | 4 (4.4%) | 5 (10.6%) |
| 35 to 39 Minutes | 6 (6.6%) | 0 (0.0%) |
| 40 to 44 Minutes | 0 (0.0%) | 5 (10.6%) |
| 45 to 59 Minutes | 47 (51.6%) | 3 (6.4%) |
| 60 to 89 Minutes | 11 (12.1%) | 7 (14.9%) |
| 90 or more Minutes | 1 (1.1%) | 0 (0.0%) |
Time of Departure to Work by Sex in Fawn Grove borough
The most frequent times of departure to work in Fawn Grove borough are 5:00 AM to 5:29 AM (19, 20.9%) for males and 6:00 AM to 6:29 AM (15, 31.9%) for females.
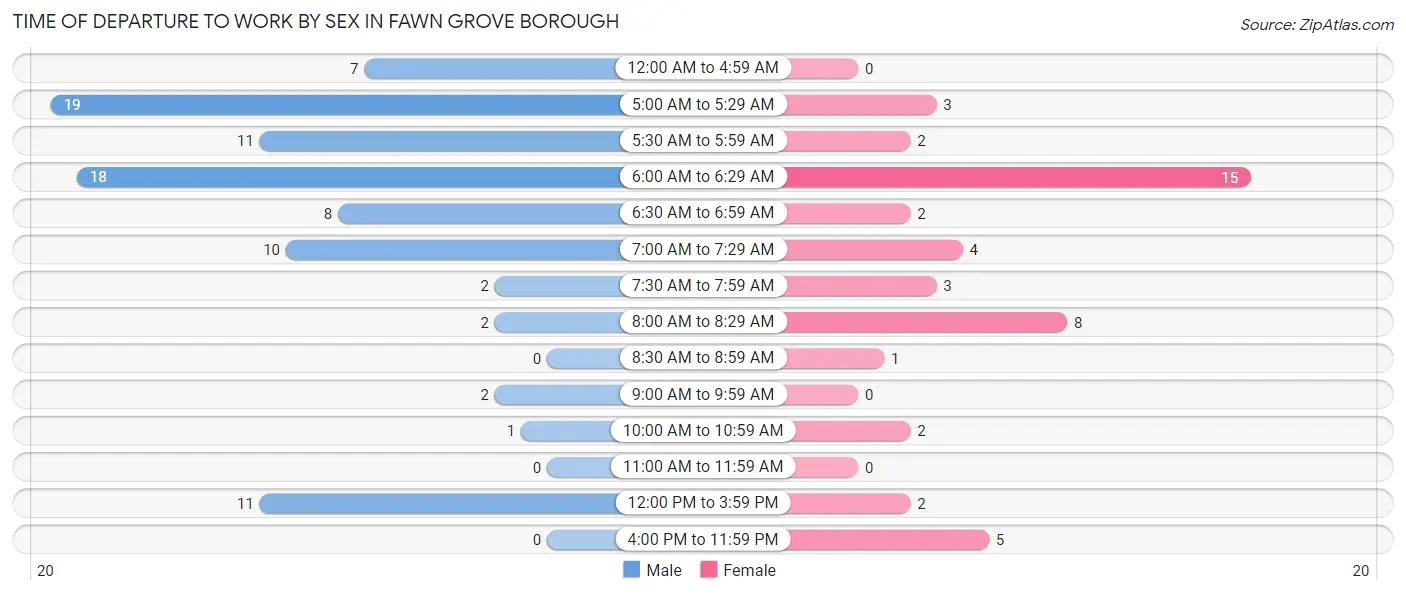
| Time of Departure | Male | Female |
| 12:00 AM to 4:59 AM | 7 (7.7%) | 0 (0.0%) |
| 5:00 AM to 5:29 AM | 19 (20.9%) | 3 (6.4%) |
| 5:30 AM to 5:59 AM | 11 (12.1%) | 2 (4.3%) |
| 6:00 AM to 6:29 AM | 18 (19.8%) | 15 (31.9%) |
| 6:30 AM to 6:59 AM | 8 (8.8%) | 2 (4.3%) |
| 7:00 AM to 7:29 AM | 10 (11.0%) | 4 (8.5%) |
| 7:30 AM to 7:59 AM | 2 (2.2%) | 3 (6.4%) |
| 8:00 AM to 8:29 AM | 2 (2.2%) | 8 (17.0%) |
| 8:30 AM to 8:59 AM | 0 (0.0%) | 1 (2.1%) |
| 9:00 AM to 9:59 AM | 2 (2.2%) | 0 (0.0%) |
| 10:00 AM to 10:59 AM | 1 (1.1%) | 2 (4.3%) |
| 11:00 AM to 11:59 AM | 0 (0.0%) | 0 (0.0%) |
| 12:00 PM to 3:59 PM | 11 (12.1%) | 2 (4.3%) |
| 4:00 PM to 11:59 PM | 0 (0.0%) | 5 (10.6%) |
| Total | 91 (100.0%) | 47 (100.0%) |
Housing Occupancy in Fawn Grove borough
Occupancy by Ownership in Fawn Grove borough
Of the total 187 dwellings in Fawn Grove borough, owner-occupied units account for 144 (77.0%), while renter-occupied units make up 43 (23.0%).
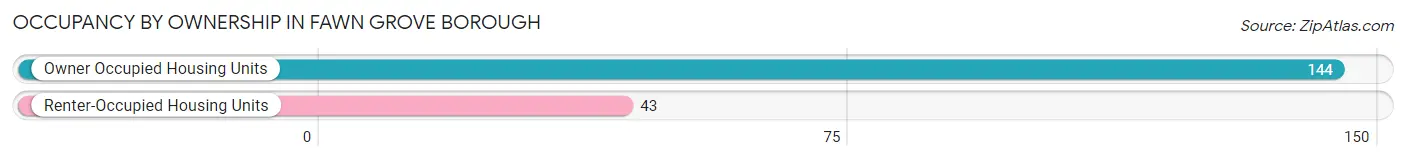
| Occupancy | # Housing Units | % Housing Units |
| Owner Occupied Housing Units | 144 | 77.0% |
| Renter-Occupied Housing Units | 43 | 23.0% |
| Total Occupied Housing Units | 187 | 100.0% |
Occupancy by Household Size in Fawn Grove borough
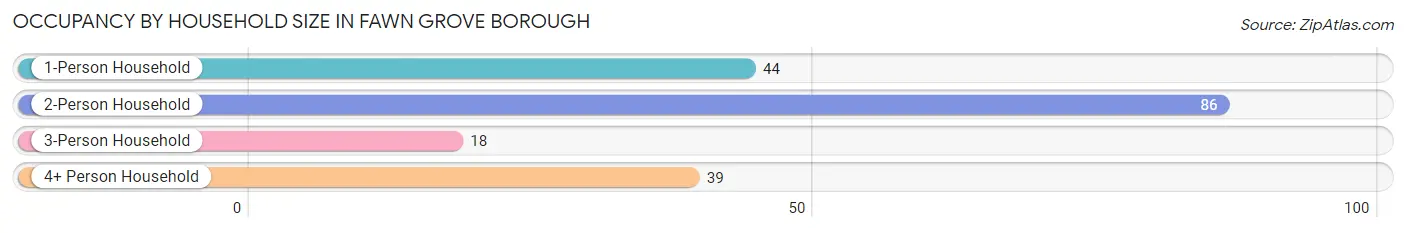
| Household Size | # Housing Units | % Housing Units |
| 1-Person Household | 44 | 23.5% |
| 2-Person Household | 86 | 46.0% |
| 3-Person Household | 18 | 9.6% |
| 4+ Person Household | 39 | 20.9% |
| Total Housing Units | 187 | 100.0% |
Occupancy by Ownership by Household Size in Fawn Grove borough
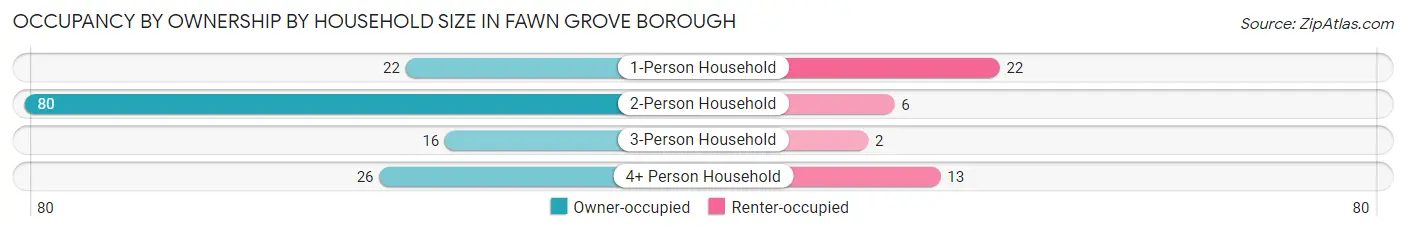
| Household Size | Owner-occupied | Renter-occupied |
| 1-Person Household | 22 (50.0%) | 22 (50.0%) |
| 2-Person Household | 80 (93.0%) | 6 (7.0%) |
| 3-Person Household | 16 (88.9%) | 2 (11.1%) |
| 4+ Person Household | 26 (66.7%) | 13 (33.3%) |
| Total Housing Units | 144 (77.0%) | 43 (23.0%) |
Occupancy by Educational Attainment in Fawn Grove borough
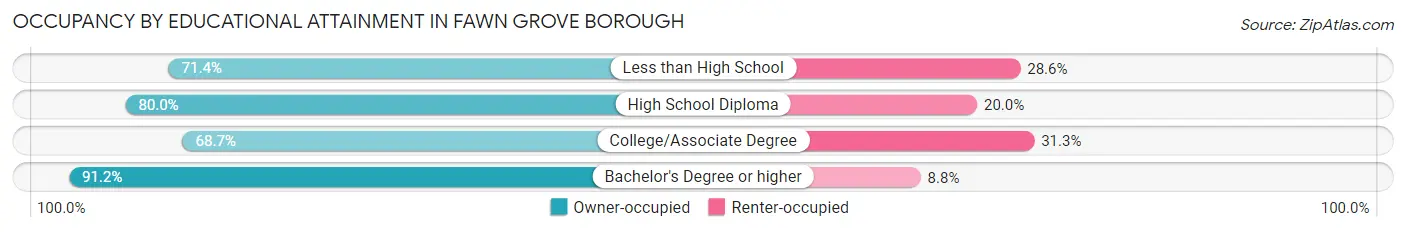
| Household Size | Owner-occupied | Renter-occupied |
| Less than High School | 15 (71.4%) | 6 (28.6%) |
| High School Diploma | 52 (80.0%) | 13 (20.0%) |
| College/Associate Degree | 46 (68.7%) | 21 (31.3%) |
| Bachelor's Degree or higher | 31 (91.2%) | 3 (8.8%) |
Occupancy by Age of Householder in Fawn Grove borough
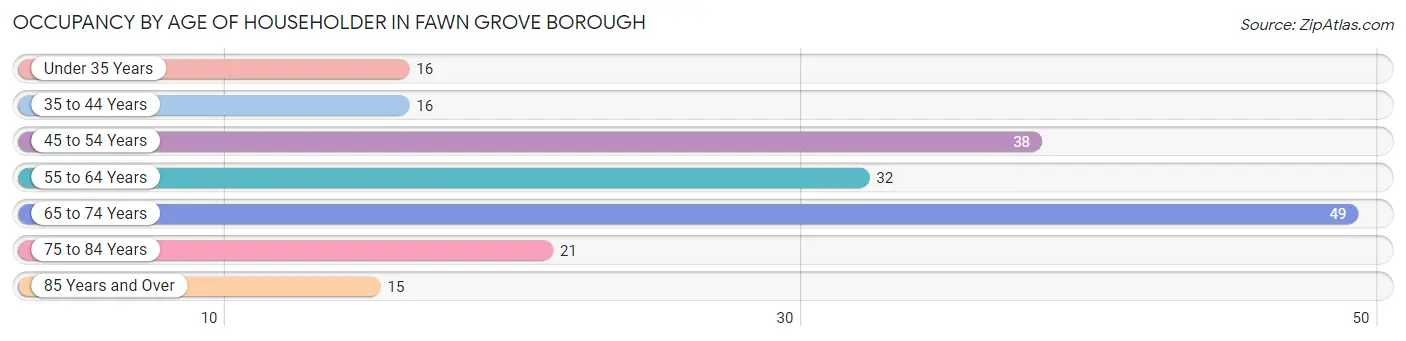
| Age Bracket | # Households | % Households |
| Under 35 Years | 16 | 8.6% |
| 35 to 44 Years | 16 | 8.6% |
| 45 to 54 Years | 38 | 20.3% |
| 55 to 64 Years | 32 | 17.1% |
| 65 to 74 Years | 49 | 26.2% |
| 75 to 84 Years | 21 | 11.2% |
| 85 Years and Over | 15 | 8.0% |
| Total | 187 | 100.0% |
Housing Finances in Fawn Grove borough
Median Income by Occupancy in Fawn Grove borough
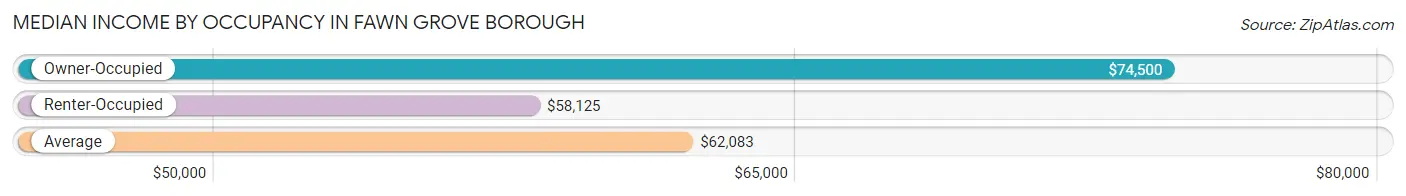
| Occupancy Type | # Households | Median Income |
| Owner-Occupied | 144 (77.0%) | $74,500 |
| Renter-Occupied | 43 (23.0%) | $58,125 |
| Average | 187 (100.0%) | $62,083 |
Occupancy by Householder Income Bracket in Fawn Grove borough
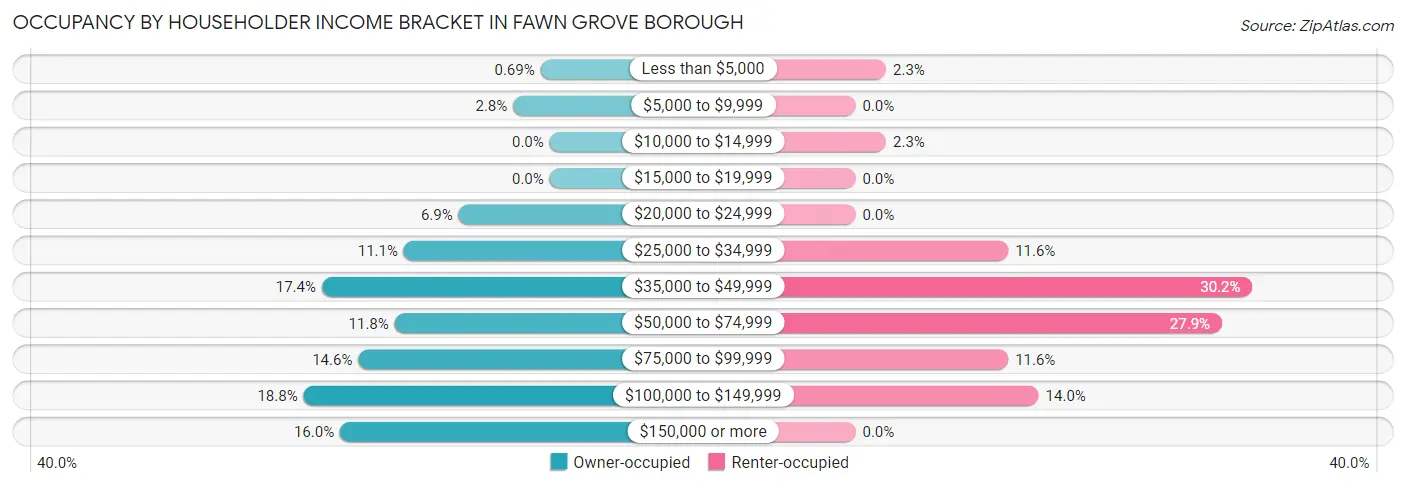
| Income Bracket | Owner-occupied | Renter-occupied |
| Less than $5,000 | 1 (0.7%) | 1 (2.3%) |
| $5,000 to $9,999 | 4 (2.8%) | 0 (0.0%) |
| $10,000 to $14,999 | 0 (0.0%) | 1 (2.3%) |
| $15,000 to $19,999 | 0 (0.0%) | 0 (0.0%) |
| $20,000 to $24,999 | 10 (6.9%) | 0 (0.0%) |
| $25,000 to $34,999 | 16 (11.1%) | 5 (11.6%) |
| $35,000 to $49,999 | 25 (17.4%) | 13 (30.2%) |
| $50,000 to $74,999 | 17 (11.8%) | 12 (27.9%) |
| $75,000 to $99,999 | 21 (14.6%) | 5 (11.6%) |
| $100,000 to $149,999 | 27 (18.8%) | 6 (14.0%) |
| $150,000 or more | 23 (16.0%) | 0 (0.0%) |
| Total | 144 (100.0%) | 43 (100.0%) |
Monthly Housing Cost Tiers in Fawn Grove borough
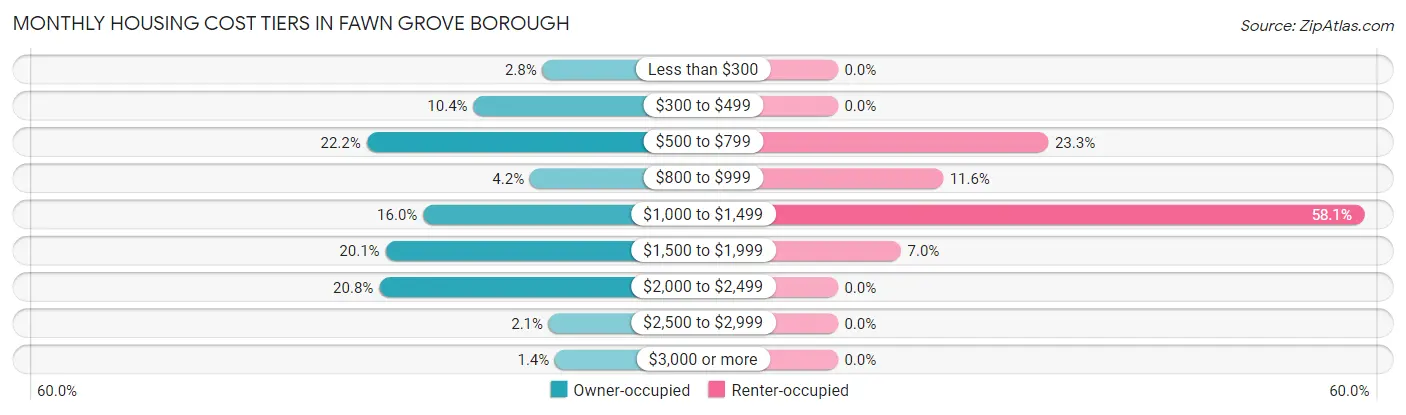
| Monthly Cost | Owner-occupied | Renter-occupied |
| Less than $300 | 4 (2.8%) | 0 (0.0%) |
| $300 to $499 | 15 (10.4%) | 0 (0.0%) |
| $500 to $799 | 32 (22.2%) | 10 (23.3%) |
| $800 to $999 | 6 (4.2%) | 5 (11.6%) |
| $1,000 to $1,499 | 23 (16.0%) | 25 (58.1%) |
| $1,500 to $1,999 | 29 (20.1%) | 3 (7.0%) |
| $2,000 to $2,499 | 30 (20.8%) | 0 (0.0%) |
| $2,500 to $2,999 | 3 (2.1%) | 0 (0.0%) |
| $3,000 or more | 2 (1.4%) | 0 (0.0%) |
| Total | 144 (100.0%) | 43 (100.0%) |
Physical Housing Characteristics in Fawn Grove borough
Housing Structures in Fawn Grove borough
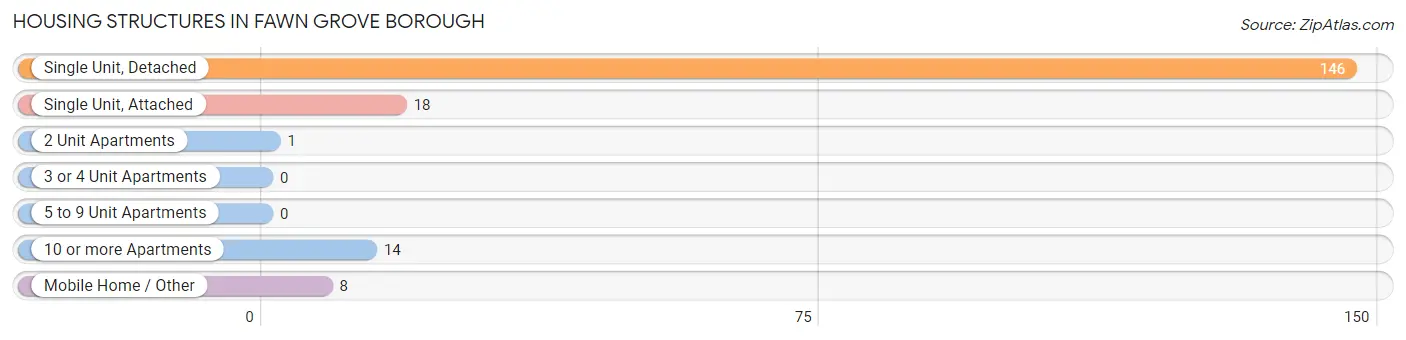
| Structure Type | # Housing Units | % Housing Units |
| Single Unit, Detached | 146 | 78.1% |
| Single Unit, Attached | 18 | 9.6% |
| 2 Unit Apartments | 1 | 0.5% |
| 3 or 4 Unit Apartments | 0 | 0.0% |
| 5 to 9 Unit Apartments | 0 | 0.0% |
| 10 or more Apartments | 14 | 7.5% |
| Mobile Home / Other | 8 | 4.3% |
| Total | 187 | 100.0% |
Housing Structures by Occupancy in Fawn Grove borough
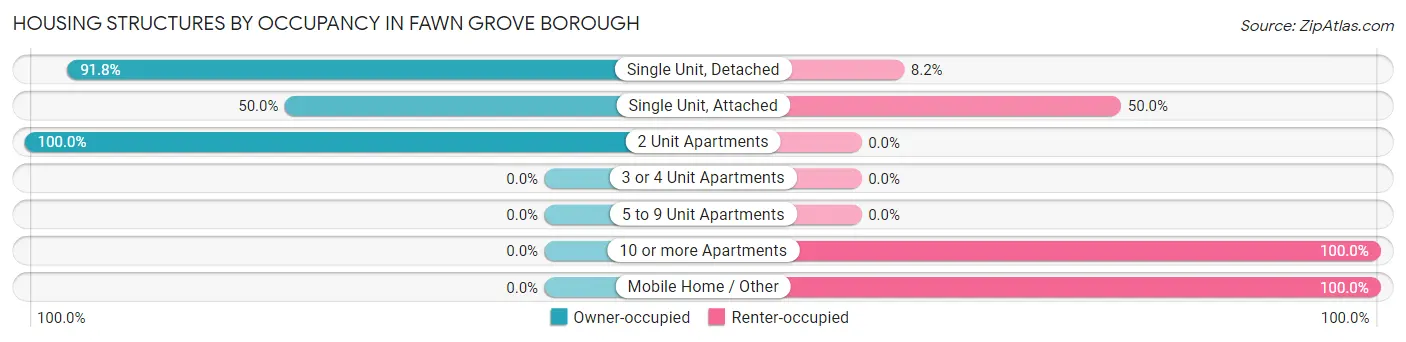
| Structure Type | Owner-occupied | Renter-occupied |
| Single Unit, Detached | 134 (91.8%) | 12 (8.2%) |
| Single Unit, Attached | 9 (50.0%) | 9 (50.0%) |
| 2 Unit Apartments | 1 (100.0%) | 0 (0.0%) |
| 3 or 4 Unit Apartments | 0 (0.0%) | 0 (0.0%) |
| 5 to 9 Unit Apartments | 0 (0.0%) | 0 (0.0%) |
| 10 or more Apartments | 0 (0.0%) | 14 (100.0%) |
| Mobile Home / Other | 0 (0.0%) | 8 (100.0%) |
| Total | 144 (77.0%) | 43 (23.0%) |
Housing Structures by Number of Rooms in Fawn Grove borough
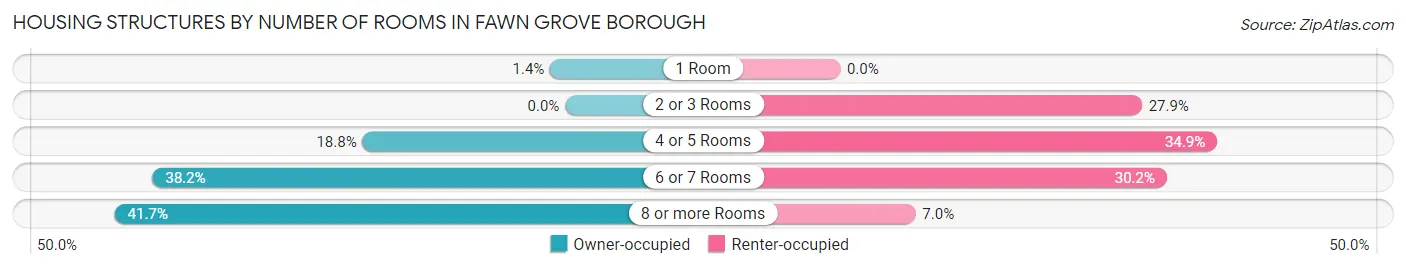
| Number of Rooms | Owner-occupied | Renter-occupied |
| 1 Room | 2 (1.4%) | 0 (0.0%) |
| 2 or 3 Rooms | 0 (0.0%) | 12 (27.9%) |
| 4 or 5 Rooms | 27 (18.8%) | 15 (34.9%) |
| 6 or 7 Rooms | 55 (38.2%) | 13 (30.2%) |
| 8 or more Rooms | 60 (41.7%) | 3 (7.0%) |
| Total | 144 (100.0%) | 43 (100.0%) |
Housing Structure by Heating Type in Fawn Grove borough
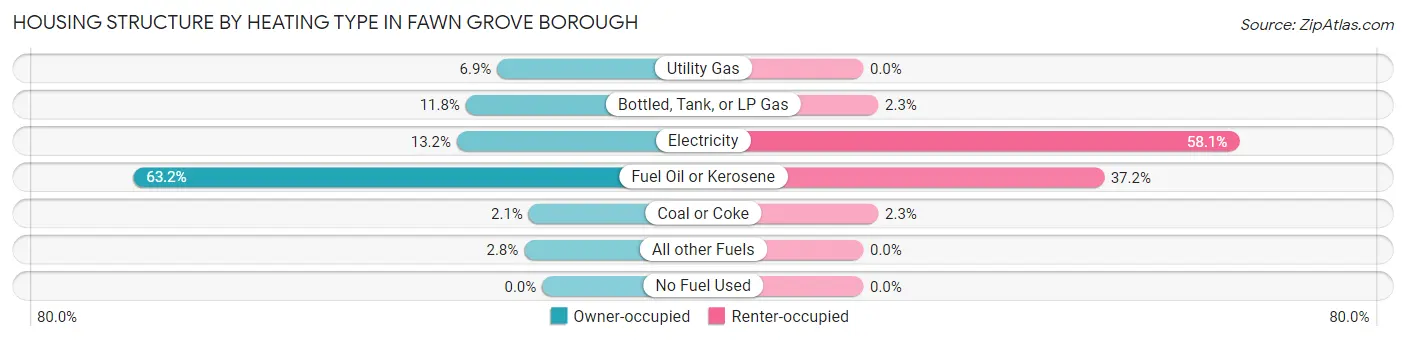
| Heating Type | Owner-occupied | Renter-occupied |
| Utility Gas | 10 (6.9%) | 0 (0.0%) |
| Bottled, Tank, or LP Gas | 17 (11.8%) | 1 (2.3%) |
| Electricity | 19 (13.2%) | 25 (58.1%) |
| Fuel Oil or Kerosene | 91 (63.2%) | 16 (37.2%) |
| Coal or Coke | 3 (2.1%) | 1 (2.3%) |
| All other Fuels | 4 (2.8%) | 0 (0.0%) |
| No Fuel Used | 0 (0.0%) | 0 (0.0%) |
| Total | 144 (100.0%) | 43 (100.0%) |
Household Vehicle Usage in Fawn Grove borough
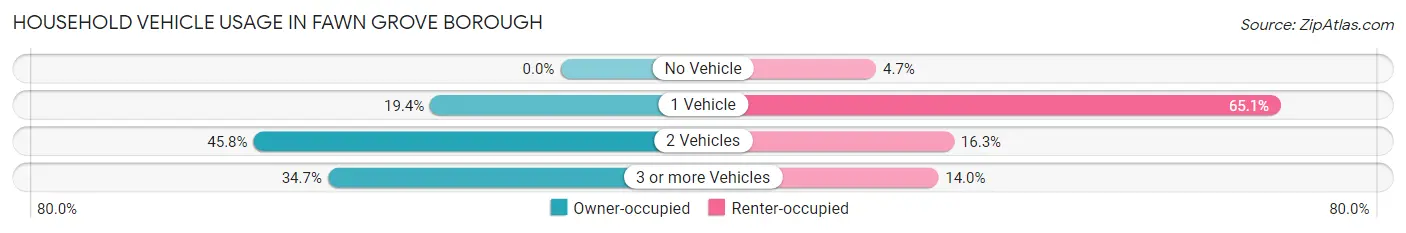
| Vehicles per Household | Owner-occupied | Renter-occupied |
| No Vehicle | 0 (0.0%) | 2 (4.6%) |
| 1 Vehicle | 28 (19.4%) | 28 (65.1%) |
| 2 Vehicles | 66 (45.8%) | 7 (16.3%) |
| 3 or more Vehicles | 50 (34.7%) | 6 (14.0%) |
| Total | 144 (100.0%) | 43 (100.0%) |
Real Estate & Mortgages in Fawn Grove borough
Real Estate and Mortgage Overview in Fawn Grove borough
| Characteristic | Without Mortgage | With Mortgage |
| Housing Units | 59 | 85 |
| Median Property Value | $263,500 | $233,100 |
| Median Household Income | $48,125 | $19 |
| Monthly Housing Costs | $675 | $1 |
| Real Estate Taxes | $3,813 | $0 |
Property Value by Mortgage Status in Fawn Grove borough
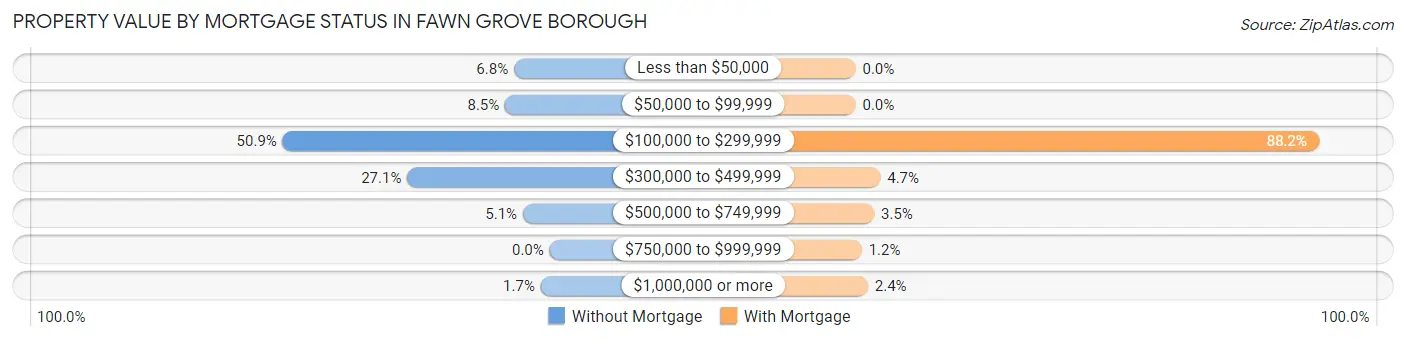
| Property Value | Without Mortgage | With Mortgage |
| Less than $50,000 | 4 (6.8%) | 0 (0.0%) |
| $50,000 to $99,999 | 5 (8.5%) | 0 (0.0%) |
| $100,000 to $299,999 | 30 (50.8%) | 75 (88.2%) |
| $300,000 to $499,999 | 16 (27.1%) | 4 (4.7%) |
| $500,000 to $749,999 | 3 (5.1%) | 3 (3.5%) |
| $750,000 to $999,999 | 0 (0.0%) | 1 (1.2%) |
| $1,000,000 or more | 1 (1.7%) | 2 (2.4%) |
| Total | 59 (100.0%) | 85 (100.0%) |
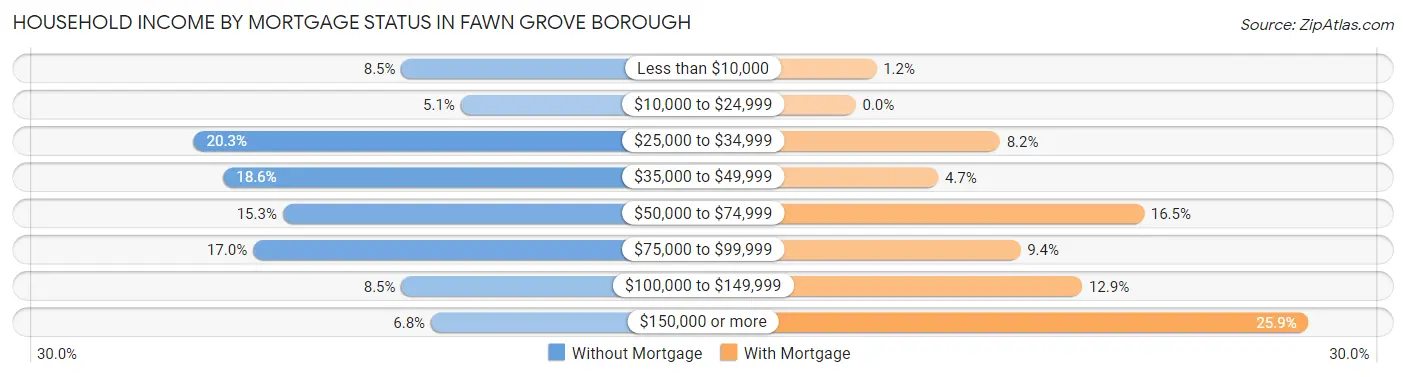
Household Income by Mortgage Status in Fawn Grove borough
| Household Income | Without Mortgage | With Mortgage |
| Less than $10,000 | 5 (8.5%) | 1 (1.2%) |
| $10,000 to $24,999 | 3 (5.1%) | 0 (0.0%) |
| $25,000 to $34,999 | 12 (20.3%) | 7 (8.2%) |
| $35,000 to $49,999 | 11 (18.6%) | 4 (4.7%) |
| $50,000 to $74,999 | 9 (15.2%) | 14 (16.5%) |
| $75,000 to $99,999 | 10 (17.0%) | 8 (9.4%) |
| $100,000 to $149,999 | 5 (8.5%) | 11 (12.9%) |
| $150,000 or more | 4 (6.8%) | 22 (25.9%) |
| Total | 59 (100.0%) | 85 (100.0%) |
Property Value to Household Income Ratio in Fawn Grove borough
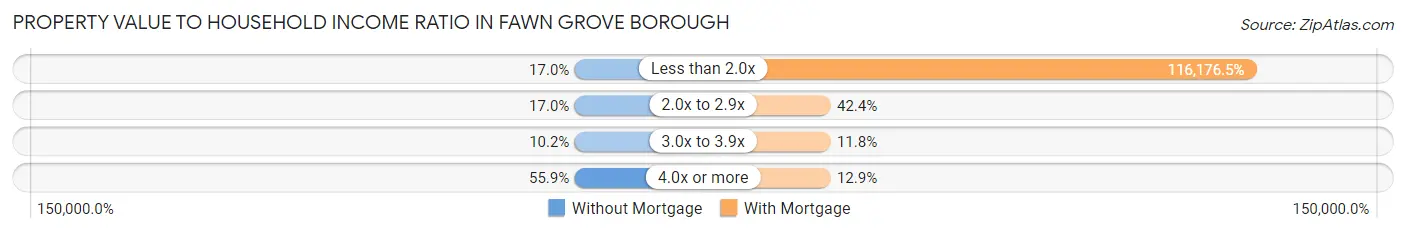
| Value-to-Income Ratio | Without Mortgage | With Mortgage |
| Less than 2.0x | 10 (17.0%) | 98,750 (116,176.5%) |
| 2.0x to 2.9x | 10 (17.0%) | 36 (42.3%) |
| 3.0x to 3.9x | 6 (10.2%) | 10 (11.8%) |
| 4.0x or more | 33 (55.9%) | 11 (12.9%) |
| Total | 59 (100.0%) | 85 (100.0%) |
Real Estate Taxes by Mortgage Status in Fawn Grove borough
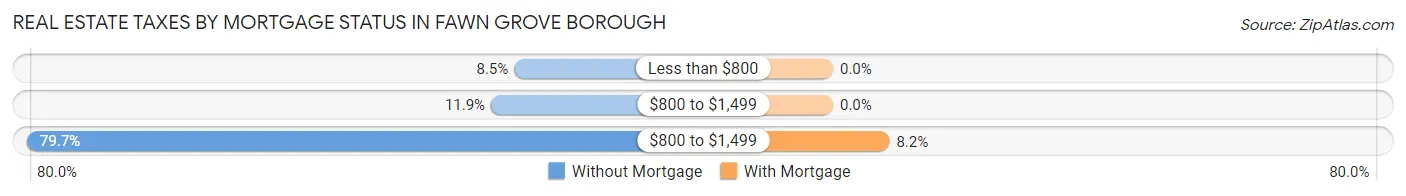
| Property Taxes | Without Mortgage | With Mortgage |
| Less than $800 | 5 (8.5%) | 0 (0.0%) |
| $800 to $1,499 | 7 (11.9%) | 0 (0.0%) |
| $800 to $1,499 | 47 (79.7%) | 7 (8.2%) |
| Total | 59 (100.0%) | 85 (100.0%) |
Health & Disability in Fawn Grove borough
Health Insurance Coverage by Age in Fawn Grove borough
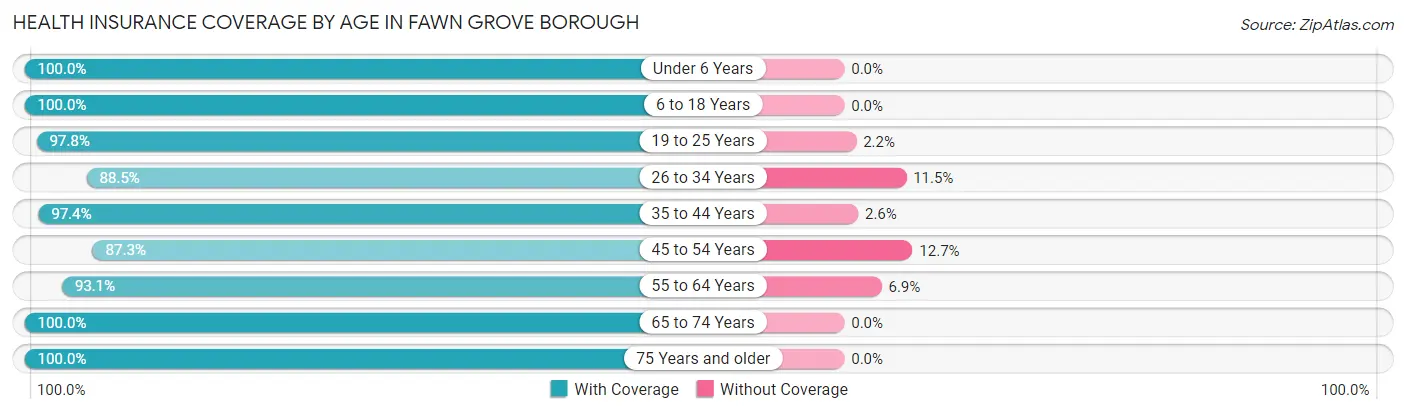
| Age Bracket | With Coverage | Without Coverage |
| Under 6 Years | 29 (100.0%) | 0 (0.0%) |
| 6 to 18 Years | 40 (100.0%) | 0 (0.0%) |
| 19 to 25 Years | 44 (97.8%) | 1 (2.2%) |
| 26 to 34 Years | 23 (88.5%) | 3 (11.5%) |
| 35 to 44 Years | 38 (97.4%) | 1 (2.6%) |
| 45 to 54 Years | 55 (87.3%) | 8 (12.7%) |
| 55 to 64 Years | 67 (93.1%) | 5 (6.9%) |
| 65 to 74 Years | 68 (100.0%) | 0 (0.0%) |
| 75 Years and older | 64 (100.0%) | 0 (0.0%) |
| Total | 428 (96.0%) | 18 (4.0%) |
Health Insurance Coverage by Citizenship Status in Fawn Grove borough
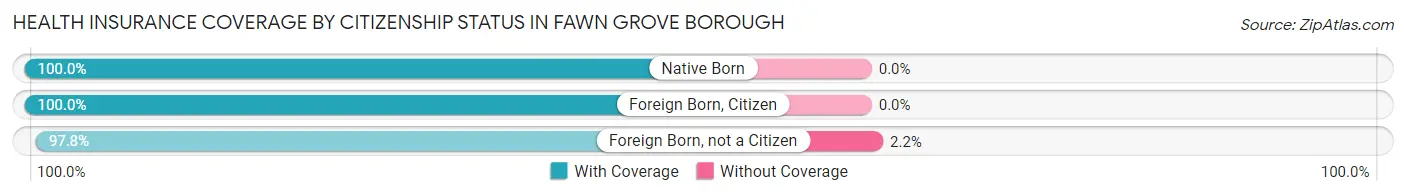
| Citizenship Status | With Coverage | Without Coverage |
| Native Born | 29 (100.0%) | 0 (0.0%) |
| Foreign Born, Citizen | 40 (100.0%) | 0 (0.0%) |
| Foreign Born, not a Citizen | 44 (97.8%) | 1 (2.2%) |
Health Insurance Coverage by Household Income in Fawn Grove borough
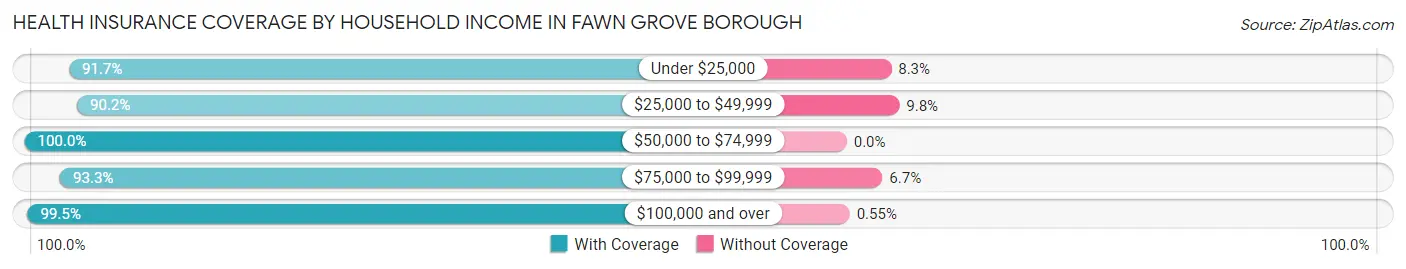
| Household Income | With Coverage | Without Coverage |
| Under $25,000 | 22 (91.7%) | 2 (8.3%) |
| $25,000 to $49,999 | 110 (90.2%) | 12 (9.8%) |
| $50,000 to $74,999 | 74 (100.0%) | 0 (0.0%) |
| $75,000 to $99,999 | 42 (93.3%) | 3 (6.7%) |
| $100,000 and over | 180 (99.5%) | 1 (0.5%) |
Public vs Private Health Insurance Coverage by Age in Fawn Grove borough
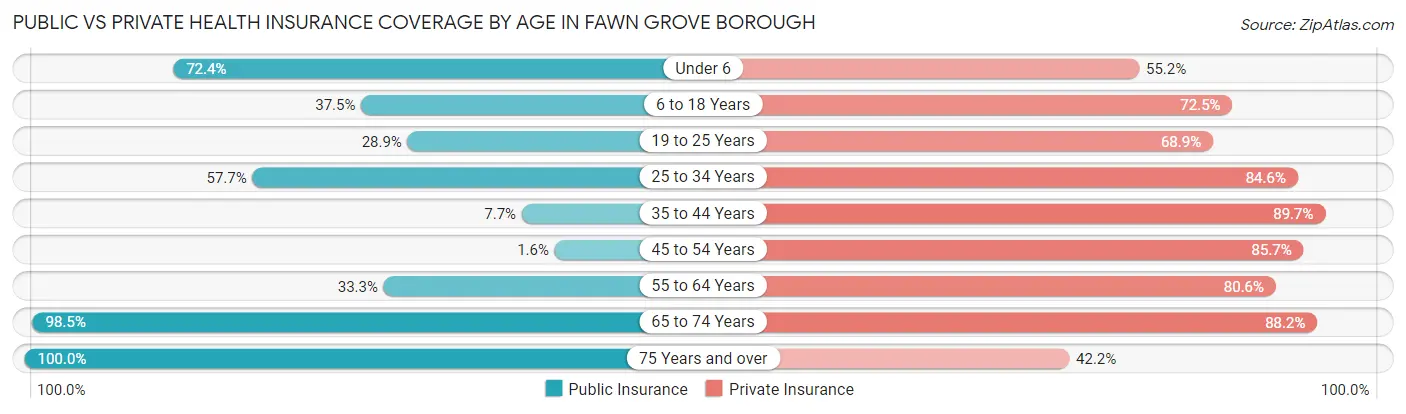
| Age Bracket | Public Insurance | Private Insurance |
| Under 6 | 21 (72.4%) | 16 (55.2%) |
| 6 to 18 Years | 15 (37.5%) | 29 (72.5%) |
| 19 to 25 Years | 13 (28.9%) | 31 (68.9%) |
| 25 to 34 Years | 15 (57.7%) | 22 (84.6%) |
| 35 to 44 Years | 3 (7.7%) | 35 (89.7%) |
| 45 to 54 Years | 1 (1.6%) | 54 (85.7%) |
| 55 to 64 Years | 24 (33.3%) | 58 (80.6%) |
| 65 to 74 Years | 67 (98.5%) | 60 (88.2%) |
| 75 Years and over | 64 (100.0%) | 27 (42.2%) |
| Total | 223 (50.0%) | 332 (74.4%) |
Disability Status by Sex by Age in Fawn Grove borough
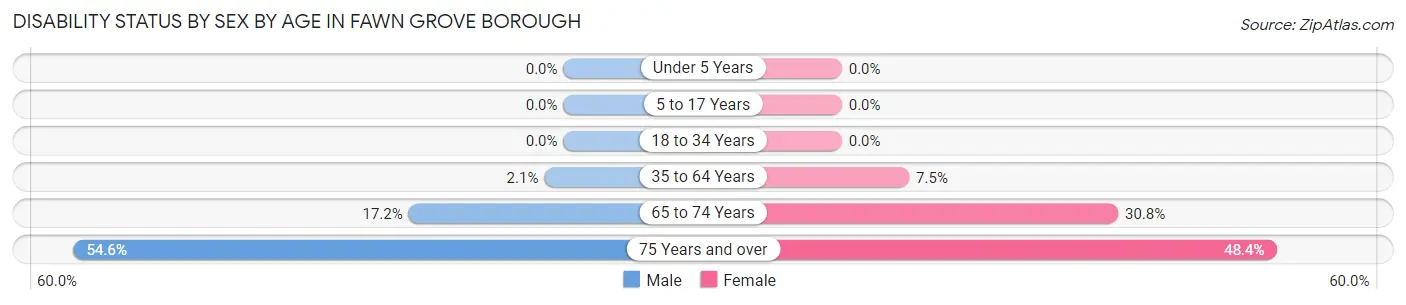
| Age Bracket | Male | Female |
| Under 5 Years | 0 (0.0%) | 0 (0.0%) |
| 5 to 17 Years | 0 (0.0%) | 0 (0.0%) |
| 18 to 34 Years | 0 (0.0%) | 0 (0.0%) |
| 35 to 64 Years | 2 (2.1%) | 6 (7.5%) |
| 65 to 74 Years | 5 (17.2%) | 12 (30.8%) |
| 75 Years and over | 18 (54.5%) | 15 (48.4%) |
Disability Class by Sex by Age in Fawn Grove borough
Disability Class: Hearing Difficulty
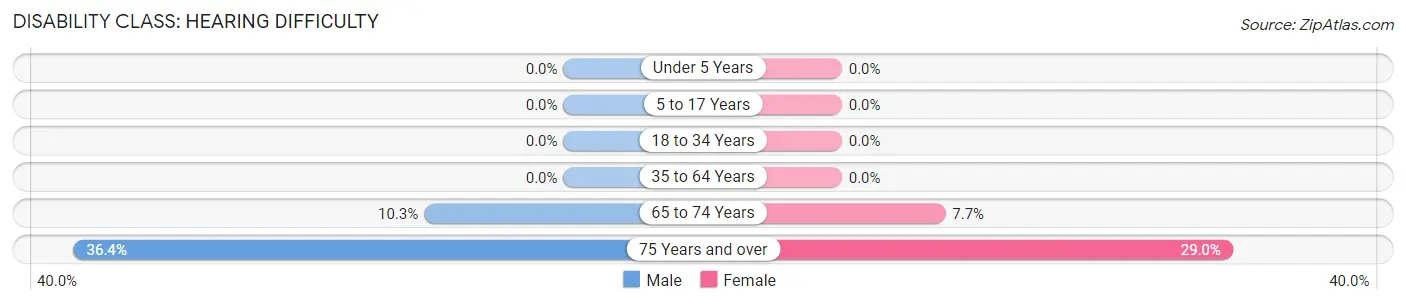
| Age Bracket | Male | Female |
| Under 5 Years | 0 (0.0%) | 0 (0.0%) |
| 5 to 17 Years | 0 (0.0%) | 0 (0.0%) |
| 18 to 34 Years | 0 (0.0%) | 0 (0.0%) |
| 35 to 64 Years | 0 (0.0%) | 0 (0.0%) |
| 65 to 74 Years | 3 (10.3%) | 3 (7.7%) |
| 75 Years and over | 12 (36.4%) | 9 (29.0%) |
Disability Class: Vision Difficulty
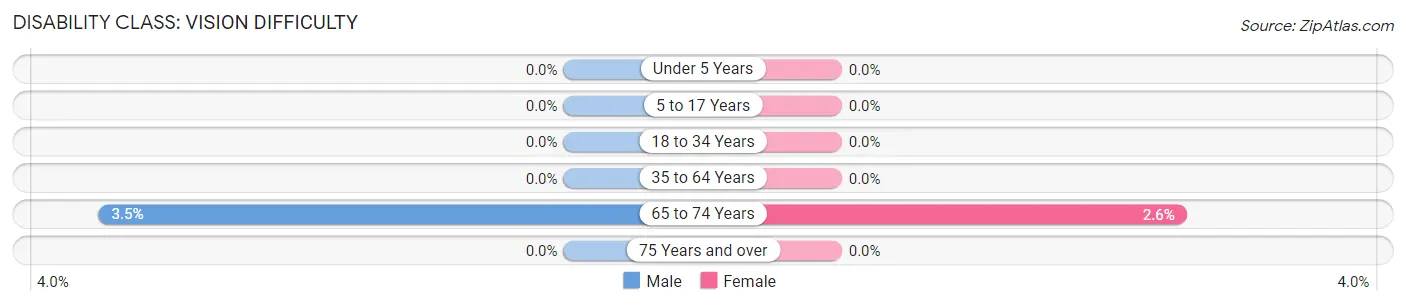
| Age Bracket | Male | Female |
| Under 5 Years | 0 (0.0%) | 0 (0.0%) |
| 5 to 17 Years | 0 (0.0%) | 0 (0.0%) |
| 18 to 34 Years | 0 (0.0%) | 0 (0.0%) |
| 35 to 64 Years | 0 (0.0%) | 0 (0.0%) |
| 65 to 74 Years | 1 (3.5%) | 1 (2.6%) |
| 75 Years and over | 0 (0.0%) | 0 (0.0%) |
Disability Class: Cognitive Difficulty
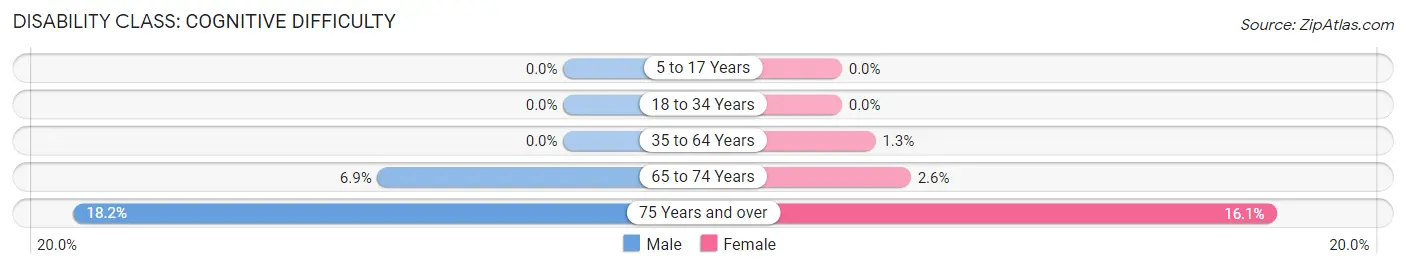
| Age Bracket | Male | Female |
| 5 to 17 Years | 0 (0.0%) | 0 (0.0%) |
| 18 to 34 Years | 0 (0.0%) | 0 (0.0%) |
| 35 to 64 Years | 0 (0.0%) | 1 (1.3%) |
| 65 to 74 Years | 2 (6.9%) | 1 (2.6%) |
| 75 Years and over | 6 (18.2%) | 5 (16.1%) |
Disability Class: Ambulatory Difficulty
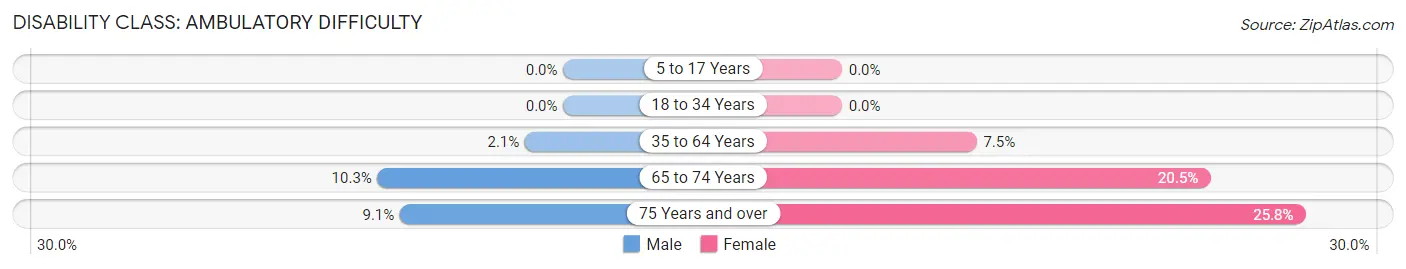
| Age Bracket | Male | Female |
| 5 to 17 Years | 0 (0.0%) | 0 (0.0%) |
| 18 to 34 Years | 0 (0.0%) | 0 (0.0%) |
| 35 to 64 Years | 2 (2.1%) | 6 (7.5%) |
| 65 to 74 Years | 3 (10.3%) | 8 (20.5%) |
| 75 Years and over | 3 (9.1%) | 8 (25.8%) |
Disability Class: Self-Care Difficulty
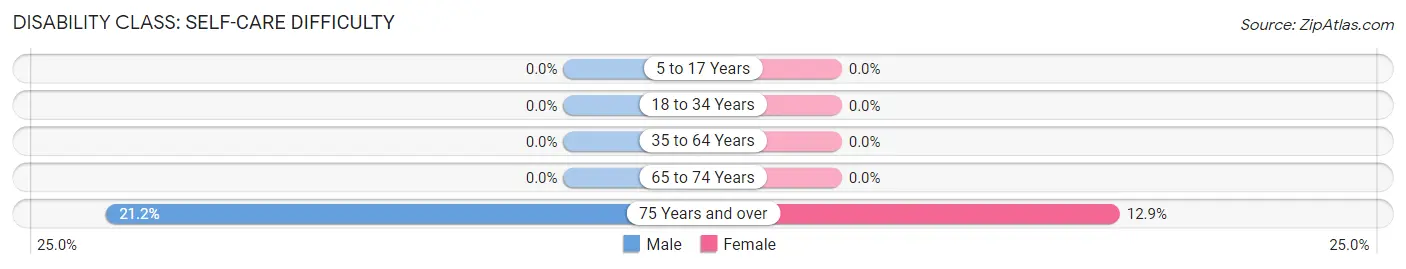
| Age Bracket | Male | Female |
| 5 to 17 Years | 0 (0.0%) | 0 (0.0%) |
| 18 to 34 Years | 0 (0.0%) | 0 (0.0%) |
| 35 to 64 Years | 0 (0.0%) | 0 (0.0%) |
| 65 to 74 Years | 0 (0.0%) | 0 (0.0%) |
| 75 Years and over | 7 (21.2%) | 4 (12.9%) |
Technology Access in Fawn Grove borough
Computing Device Access in Fawn Grove borough
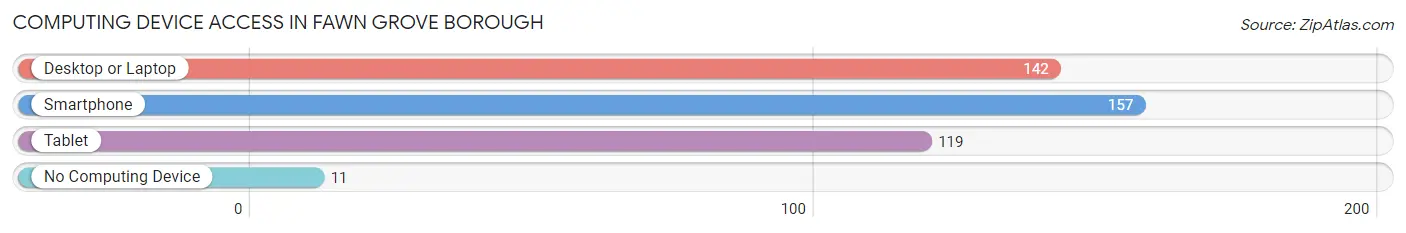
| Device Type | # Households | % Households |
| Desktop or Laptop | 142 | 75.9% |
| Smartphone | 157 | 84.0% |
| Tablet | 119 | 63.6% |
| No Computing Device | 11 | 5.9% |
| Total | 187 | 100.0% |
Internet Access in Fawn Grove borough
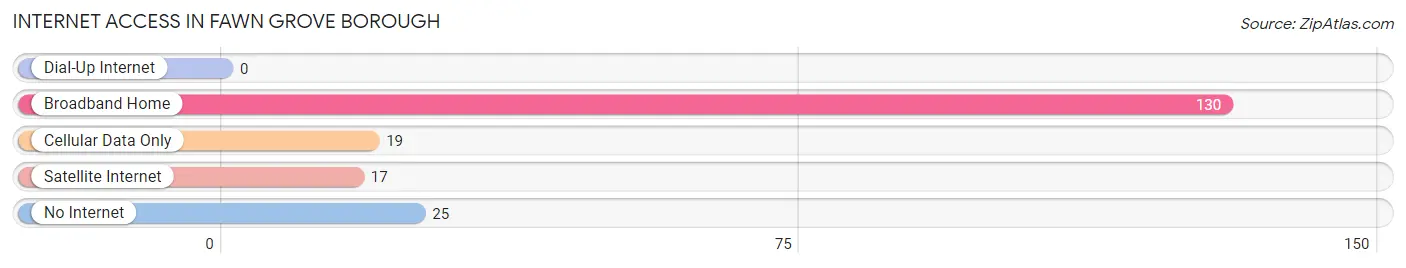
| Internet Type | # Households | % Households |
| Dial-Up Internet | 0 | 0.0% |
| Broadband Home | 130 | 69.5% |
| Cellular Data Only | 19 | 10.2% |
| Satellite Internet | 17 | 9.1% |
| No Internet | 25 | 13.4% |
| Total | 187 | 100.0% |
Fawn Grove borough Summary
Fawn Grove Borough is a small borough located in York County, Pennsylvania. It is situated in the southeastern corner of the county, just north of the Maryland border. The borough is part of the York-Hanover Metropolitan Statistical Area. As of the 2010 census, the population of Fawn Grove Borough was 1,541.
History
Fawn Grove Borough was founded in 1845 by a group of settlers from Maryland. The town was named after a nearby stream, which was named for the white-tailed deer that were often seen in the area. The first post office in the borough was established in 1848.
In the late 19th century, Fawn Grove was a thriving agricultural community. The town was home to several mills, including a grist mill, a saw mill, and a woolen mill. The town also had a blacksmith shop, a general store, and a hotel.
In the early 20th century, Fawn Grove began to experience a decline in population as many of its residents moved away to larger cities. The town was also affected by the Great Depression, which caused many businesses to close.
Geography
Fawn Grove Borough is located at 39°45'45" North, 76°25'45" West (39.7625, -76.4292). The borough has a total area of 0.9 square miles, all of which is land.
The borough is located in the Piedmont region of Pennsylvania. The terrain is mostly flat, with some rolling hills. The borough is located in the Susquehanna River watershed.
Economy
Fawn Grove Borough has a small, but diverse economy. The town is home to several small businesses, including a grocery store, a hardware store, a pharmacy, and a restaurant. The town also has a few manufacturing companies, including a plastics manufacturer and a metal fabrication company.
The town is also home to several farms, which produce a variety of crops, including corn, soybeans, and hay. The town also has a few wineries, which produce a variety of wines.
Demographics
As of the 2010 census, the population of Fawn Grove Borough was 1,541. The racial makeup of the borough was 97.3% White, 0.7% African American, 0.2% Native American, 0.3% Asian, 0.1% from other races, and 1.4% from two or more races. Hispanic or Latino of any race were 0.7% of the population.
The median household income in Fawn Grove Borough was $50,938, and the median family income was $60,000. The per capita income for the borough was $22,845. About 8.2% of families and 10.2% of the population were below the poverty line, including 14.3% of those under age 18 and 5.2% of those age 65 or over.
The population of Fawn Grove Borough is largely rural, with most of the residents living in single-family homes. The town is served by the South Eastern School District. The town has one elementary school, one middle school, and one high school.
Common Questions
What is Per Capita Income in Fawn Grove borough?
Per Capita income in Fawn Grove borough is $36,136.
What is the Median Family Income in Fawn Grove borough?
Median Family Income in Fawn Grove borough is $90,250.
What is the Median Household income in Fawn Grove borough?
Median Household Income in Fawn Grove borough is $62,083.
What is Income or Wage Gap in Fawn Grove borough?
Income or Wage Gap in Fawn Grove borough is 52.7%.
Women in Fawn Grove borough earn 47.3 cents for every dollar earned by a man.
What is Family Income Deficit in Fawn Grove borough?
Family Income Deficit in Fawn Grove borough is $7,200.
Families that are below poverty line in Fawn Grove borough earn $7,200 less on average than the poverty threshold level.
What is Inequality or Gini Index in Fawn Grove borough?
Inequality or Gini Index in Fawn Grove borough is 0.39.
What is the Total Population of Fawn Grove borough?
Total Population of Fawn Grove borough is 450.
What is the Total Male Population of Fawn Grove borough?
Total Male Population of Fawn Grove borough is 218.
What is the Total Female Population of Fawn Grove borough?
Total Female Population of Fawn Grove borough is 232.
What is the Ratio of Males per 100 Females in Fawn Grove borough?
There are 93.97 Males per 100 Females in Fawn Grove borough.
What is the Ratio of Females per 100 Males in Fawn Grove borough?
There are 106.42 Females per 100 Males in Fawn Grove borough.
What is the Median Population Age in Fawn Grove borough?
Median Population Age in Fawn Grove borough is 52.0 Years.
What is the Average Family Size in Fawn Grove borough
Average Family Size in Fawn Grove borough is 2.9 People.
What is the Average Household Size in Fawn Grove borough
Average Household Size in Fawn Grove borough is 2.4 People.
How Large is the Labor Force in Fawn Grove borough?
There are 196 People in the Labor Forcein in Fawn Grove borough.
What is the Percentage of People in the Labor Force in Fawn Grove borough?
50.8% of People are in the Labor Force in Fawn Grove borough.
What is the Unemployment Rate in Fawn Grove borough?
Unemployment Rate in Fawn Grove borough is 8.9%.