Parkside borough, PA Map & Demographics
Parkside borough Overview
$39,374
PER CAPITA INCOME
$98,462
AVG FAMILY INCOME
$86,587
AVG HOUSEHOLD INCOME
41.7%
WAGE / INCOME GAP [ % ]
58.3¢/ $1
WAGE / INCOME GAP [ $ ]
0.43
INEQUALITY / GINI INDEX
2,052
TOTAL POPULATION
892
MALE POPULATION
1,160
FEMALE POPULATION
76.90
MALES / 100 FEMALES
130.04
FEMALES / 100 MALES
34.6
MEDIAN AGE
3.2
AVG FAMILY SIZE
2.7
AVG HOUSEHOLD SIZE
1,281
LABOR FORCE [ PEOPLE ]
77.8%
PERCENT IN LABOR FORCE
4.1%
UNEMPLOYMENT RATE
Income in Parkside borough
Income Overview in Parkside borough
Per Capita Income in Parkside borough is $39,374, while median incomes of families and households are $98,462 and $86,587 respectively.
| Characteristic | Number | Measure |
| Per Capita Income | 2,052 | $39,374 |
| Median Family Income | 556 | $98,462 |
| Mean Family Income | 556 | $115,514 |
| Median Household Income | 765 | $86,587 |
| Mean Household Income | 765 | $105,368 |
| Income Deficit | 556 | $0 |
| Wage / Income Gap (%) | 2,052 | 41.68% |
| Wage / Income Gap ($) | 2,052 | 58.32¢ per $1 |
| Gini / Inequality Index | 2,052 | 0.43 |
Earnings by Sex in Parkside borough
Average Earnings in Parkside borough are $46,845, $59,474 for men and $34,688 for women, a difference of 41.7%.
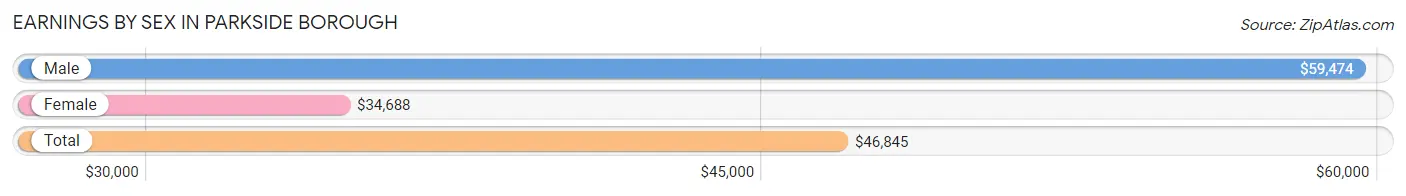
| Sex | Number | Average Earnings |
| Male | 590 (44.6%) | $59,474 |
| Female | 732 (55.4%) | $34,688 |
| Total | 1,322 (100.0%) | $46,845 |
Earnings by Sex by Income Bracket in Parkside borough
The most common earnings brackets in Parkside borough are $100,000+ for men (116 | 19.7%) and $2,499 or less for women (130 | 17.8%).
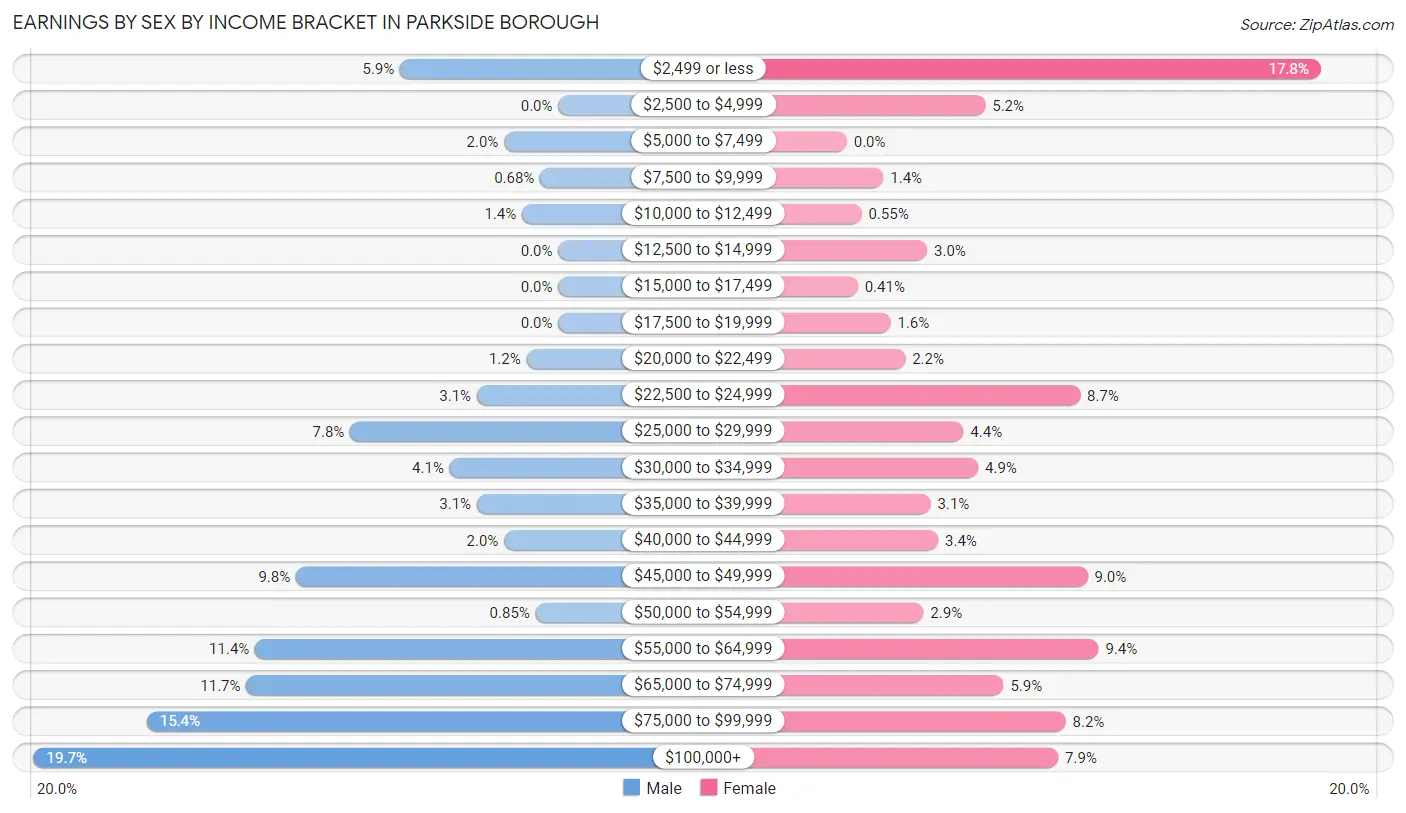
| Income | Male | Female |
| $2,499 or less | 35 (5.9%) | 130 (17.8%) |
| $2,500 to $4,999 | 0 (0.0%) | 38 (5.2%) |
| $5,000 to $7,499 | 12 (2.0%) | 0 (0.0%) |
| $7,500 to $9,999 | 4 (0.7%) | 10 (1.4%) |
| $10,000 to $12,499 | 8 (1.4%) | 4 (0.5%) |
| $12,500 to $14,999 | 0 (0.0%) | 22 (3.0%) |
| $15,000 to $17,499 | 0 (0.0%) | 3 (0.4%) |
| $17,500 to $19,999 | 0 (0.0%) | 12 (1.6%) |
| $20,000 to $22,499 | 7 (1.2%) | 16 (2.2%) |
| $22,500 to $24,999 | 18 (3.0%) | 64 (8.7%) |
| $25,000 to $29,999 | 46 (7.8%) | 32 (4.4%) |
| $30,000 to $34,999 | 24 (4.1%) | 36 (4.9%) |
| $35,000 to $39,999 | 18 (3.0%) | 23 (3.1%) |
| $40,000 to $44,999 | 12 (2.0%) | 25 (3.4%) |
| $45,000 to $49,999 | 58 (9.8%) | 66 (9.0%) |
| $50,000 to $54,999 | 5 (0.9%) | 21 (2.9%) |
| $55,000 to $64,999 | 67 (11.4%) | 69 (9.4%) |
| $65,000 to $74,999 | 69 (11.7%) | 43 (5.9%) |
| $75,000 to $99,999 | 91 (15.4%) | 60 (8.2%) |
| $100,000+ | 116 (19.7%) | 58 (7.9%) |
| Total | 590 (100.0%) | 732 (100.0%) |
Earnings by Sex by Educational Attainment in Parkside borough
Average earnings in Parkside borough are $66,316 for men and $47,225 for women, a difference of 28.8%. Men with an educational attainment of graduate degree enjoy the highest average annual earnings of $104,167, while those with college or associate's degree education earn the least with $56,339. Women with an educational attainment of graduate degree earn the most with the average annual earnings of $95,417, while those with high school diploma education have the smallest earnings of $40,583.
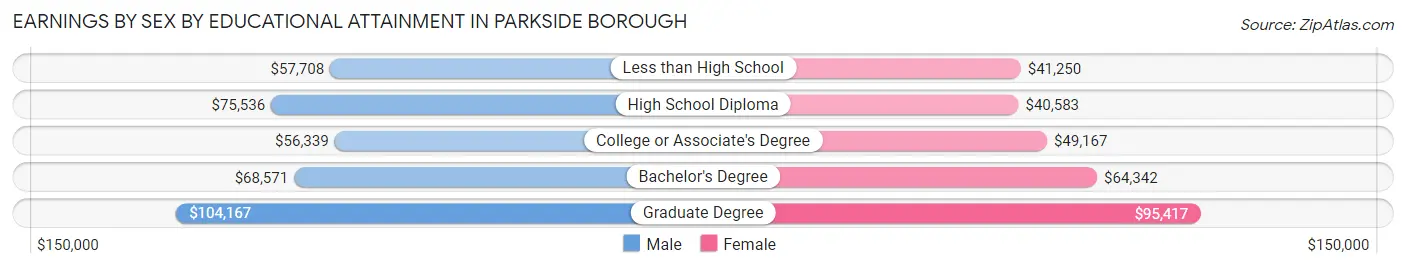
| Educational Attainment | Male Income | Female Income |
| Less than High School | $57,708 | $41,250 |
| High School Diploma | $75,536 | $40,583 |
| College or Associate's Degree | $56,339 | $49,167 |
| Bachelor's Degree | $68,571 | $64,342 |
| Graduate Degree | $104,167 | $95,417 |
| Total | $66,316 | $47,225 |
Family Income in Parkside borough
Family Income Brackets in Parkside borough
According to the Parkside borough family income data, there are 147 families falling into the $150,000 to $199,999 income range, which is the most common income bracket and makes up 26.4% of all families.
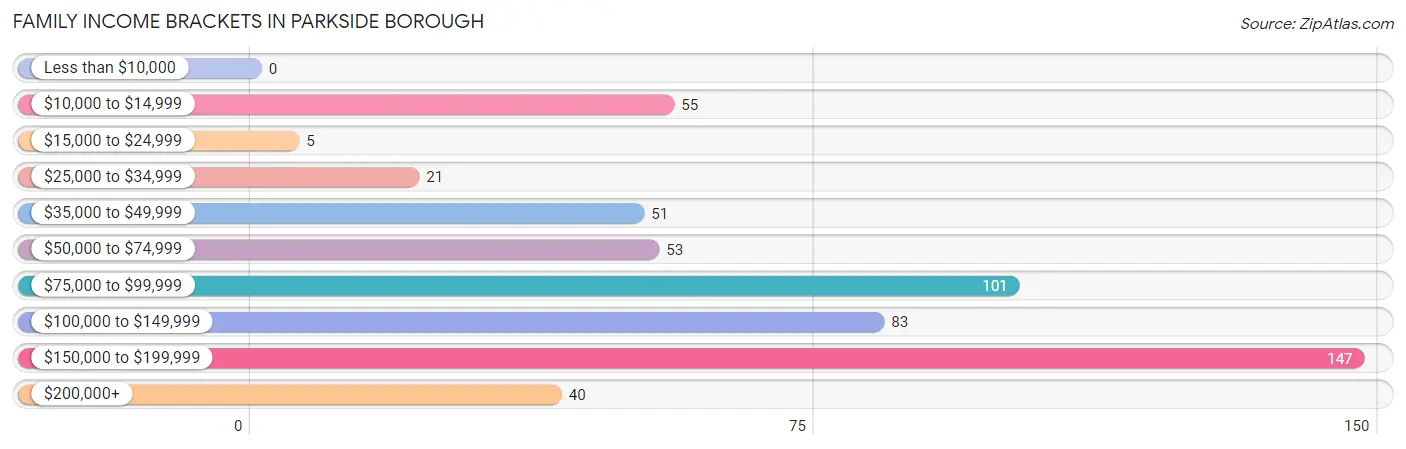
| Income Bracket | # Families | % Families |
| Less than $10,000 | 0 | 0.0% |
| $10,000 to $14,999 | 55 | 9.9% |
| $15,000 to $24,999 | 5 | 0.9% |
| $25,000 to $34,999 | 21 | 3.8% |
| $35,000 to $49,999 | 51 | 9.2% |
| $50,000 to $74,999 | 53 | 9.5% |
| $75,000 to $99,999 | 101 | 18.2% |
| $100,000 to $149,999 | 83 | 14.9% |
| $150,000 to $199,999 | 147 | 26.4% |
| $200,000+ | 40 | 7.2% |
Family Income by Famaliy Size in Parkside borough
4-person families (155 | 27.9%) account for the highest median family income in Parkside borough with $175,750 per family, while 4-person families (155 | 27.9%) have the highest median income of $43,938 per family member.
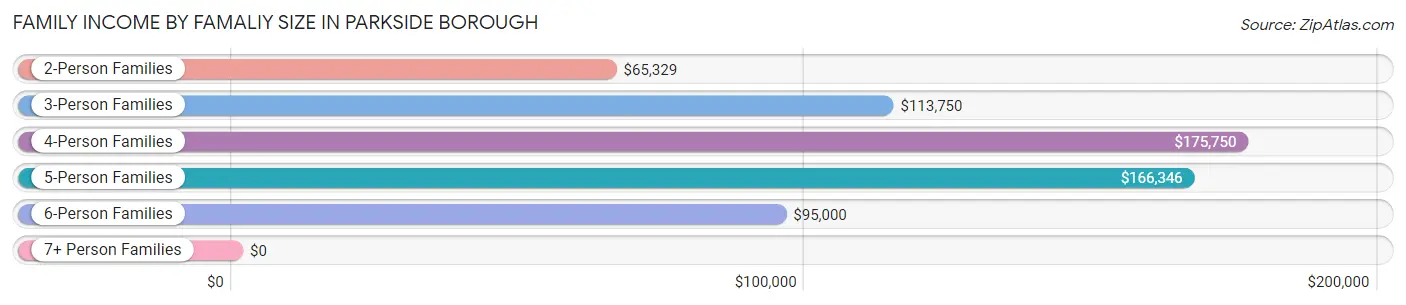
| Income Bracket | # Families | Median Income |
| 2-Person Families | 211 (38.0%) | $65,329 |
| 3-Person Families | 124 (22.3%) | $113,750 |
| 4-Person Families | 155 (27.9%) | $175,750 |
| 5-Person Families | 54 (9.7%) | $166,346 |
| 6-Person Families | 12 (2.2%) | $95,000 |
| 7+ Person Families | 0 (0.0%) | $0 |
| Total | 556 (100.0%) | $98,462 |
Family Income by Number of Earners in Parkside borough
The median family income in Parkside borough is $98,462, with families comprising 3+ earners (136) having the highest median family income of $183,561, while families with no earners (13) have the lowest median family income of $47,188, accounting for 24.5% and 2.3% of families, respectively.
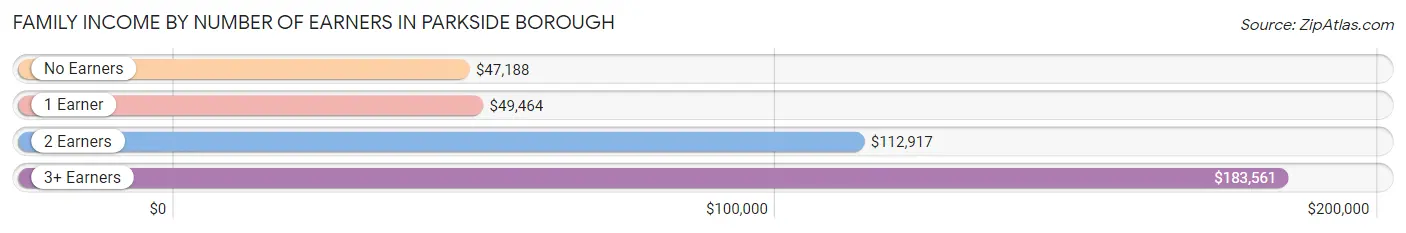
| Number of Earners | # Families | Median Income |
| No Earners | 13 (2.3%) | $47,188 |
| 1 Earner | 191 (34.4%) | $49,464 |
| 2 Earners | 216 (38.9%) | $112,917 |
| 3+ Earners | 136 (24.5%) | $183,561 |
| Total | 556 (100.0%) | $98,462 |
Household Income in Parkside borough
Household Income Brackets in Parkside borough
With 152 households falling in the category, the $150,000 to $199,999 income range is the most frequent in Parkside borough, accounting for 19.9% of all households. In contrast, only 11 households (1.4%) fall into the less than $10,000 income bracket, making it the least populous group.
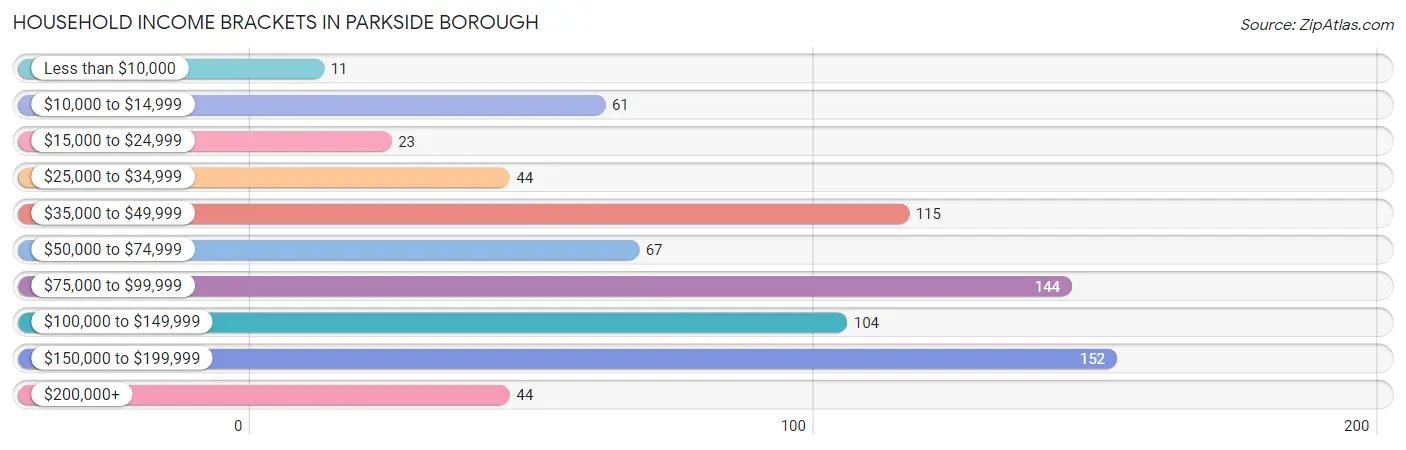
| Income Bracket | # Households | % Households |
| Less than $10,000 | 11 | 1.4% |
| $10,000 to $14,999 | 61 | 8.0% |
| $15,000 to $24,999 | 23 | 3.0% |
| $25,000 to $34,999 | 44 | 5.8% |
| $35,000 to $49,999 | 115 | 15.0% |
| $50,000 to $74,999 | 67 | 8.8% |
| $75,000 to $99,999 | 144 | 18.8% |
| $100,000 to $149,999 | 104 | 13.6% |
| $150,000 to $199,999 | 152 | 19.9% |
| $200,000+ | 44 | 5.8% |
Household Income by Householder Age in Parkside borough
The median household income in Parkside borough is $86,587, with the highest median household income of $94,000 found in the 45 to 64 years age bracket for the primary householder. A total of 368 households (48.1%) fall into this category. Meanwhile, the 15 to 24 years age bracket for the primary householder has the lowest median household income of $0, with 15 households (2.0%) in this group.
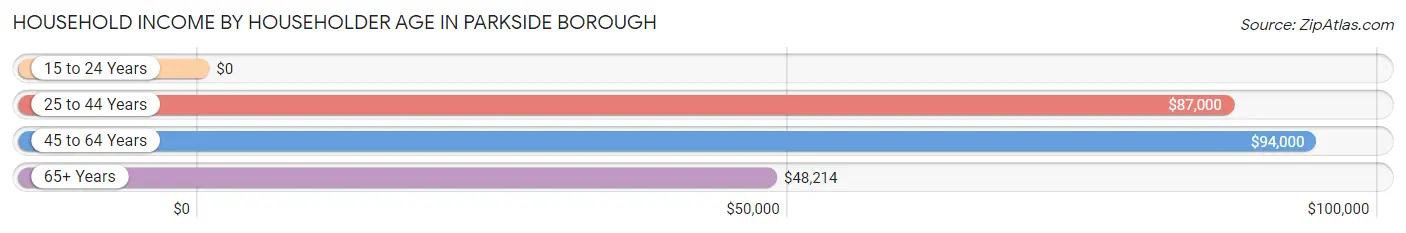
| Income Bracket | # Households | Median Income |
| 15 to 24 Years | 15 (2.0%) | $0 |
| 25 to 44 Years | 286 (37.4%) | $87,000 |
| 45 to 64 Years | 368 (48.1%) | $94,000 |
| 65+ Years | 96 (12.6%) | $48,214 |
| Total | 765 (100.0%) | $86,587 |
Poverty in Parkside borough
Income Below Poverty by Sex and Age in Parkside borough
With 1.5% poverty level for males and 12.7% for females among the residents of Parkside borough, 75 year old and over males and 16 and 17 year old females are the most vulnerable to poverty, with 3 males (33.3%) and 12 females (27.9%) in their respective age groups living below the poverty level.
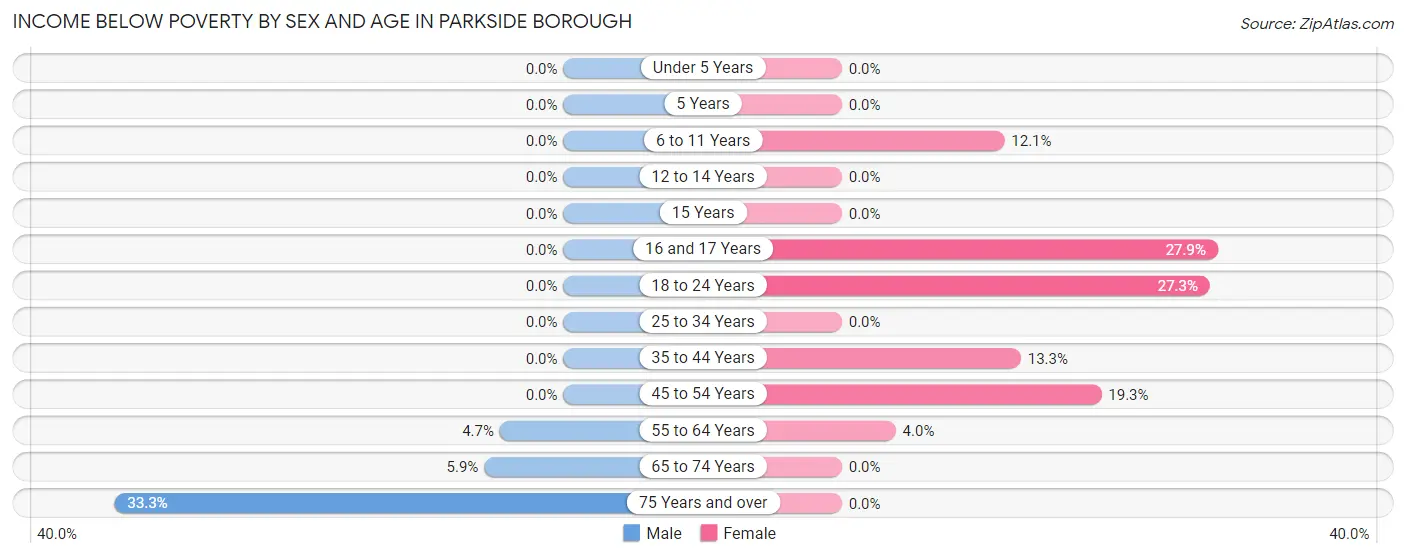
| Age Bracket | Male | Female |
| Under 5 Years | 0 (0.0%) | 0 (0.0%) |
| 5 Years | 0 (0.0%) | 0 (0.0%) |
| 6 to 11 Years | 0 (0.0%) | 14 (12.1%) |
| 12 to 14 Years | 0 (0.0%) | 0 (0.0%) |
| 15 Years | 0 (0.0%) | 0 (0.0%) |
| 16 and 17 Years | 0 (0.0%) | 12 (27.9%) |
| 18 to 24 Years | 0 (0.0%) | 56 (27.3%) |
| 25 to 34 Years | 0 (0.0%) | 0 (0.0%) |
| 35 to 44 Years | 0 (0.0%) | 19 (13.3%) |
| 45 to 54 Years | 0 (0.0%) | 42 (19.3%) |
| 55 to 64 Years | 6 (4.7%) | 4 (4.0%) |
| 65 to 74 Years | 4 (5.9%) | 0 (0.0%) |
| 75 Years and over | 3 (33.3%) | 0 (0.0%) |
| Total | 13 (1.5%) | 147 (12.7%) |
Income Above Poverty by Sex and Age in Parkside borough
According to the poverty statistics in Parkside borough, males aged under 5 years and females aged under 5 years are the age groups that are most secure financially, with 100.0% of males and 100.0% of females in these age groups living above the poverty line.
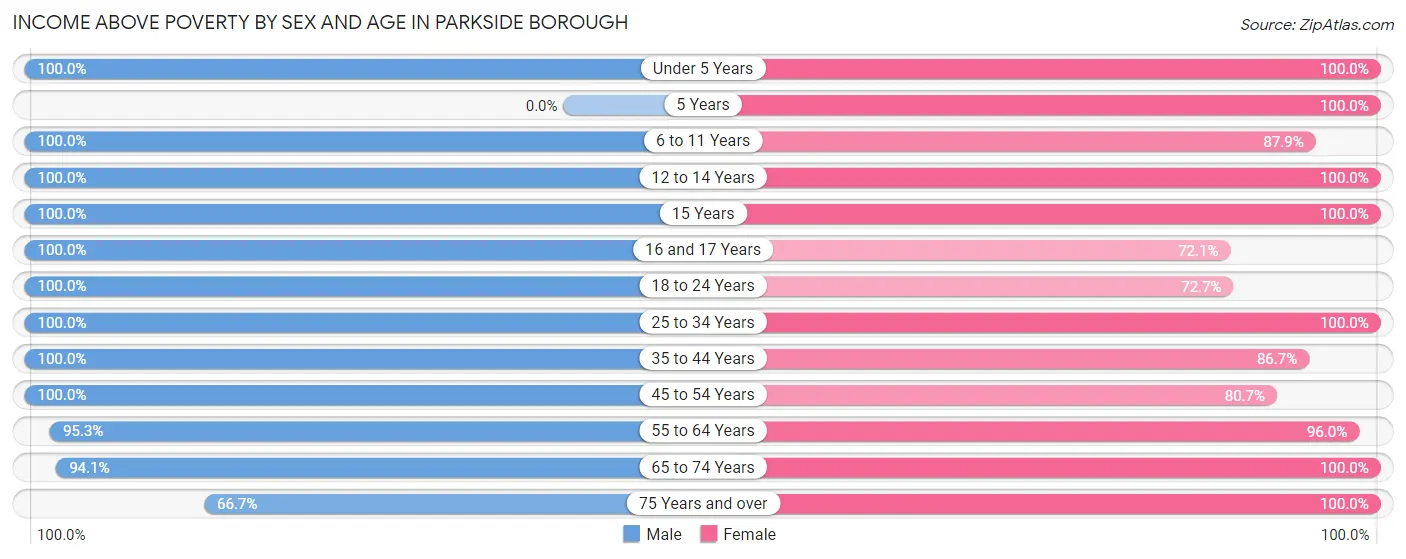
| Age Bracket | Male | Female |
| Under 5 Years | 58 (100.0%) | 32 (100.0%) |
| 5 Years | 0 (0.0%) | 14 (100.0%) |
| 6 to 11 Years | 46 (100.0%) | 102 (87.9%) |
| 12 to 14 Years | 54 (100.0%) | 41 (100.0%) |
| 15 Years | 30 (100.0%) | 8 (100.0%) |
| 16 and 17 Years | 20 (100.0%) | 31 (72.1%) |
| 18 to 24 Years | 109 (100.0%) | 149 (72.7%) |
| 25 to 34 Years | 94 (100.0%) | 159 (100.0%) |
| 35 to 44 Years | 92 (100.0%) | 124 (86.7%) |
| 45 to 54 Years | 185 (100.0%) | 176 (80.7%) |
| 55 to 64 Years | 121 (95.3%) | 96 (96.0%) |
| 65 to 74 Years | 64 (94.1%) | 46 (100.0%) |
| 75 Years and over | 6 (66.7%) | 29 (100.0%) |
| Total | 879 (98.5%) | 1,007 (87.3%) |
Income Below Poverty Among Married-Couple Families in Parkside borough
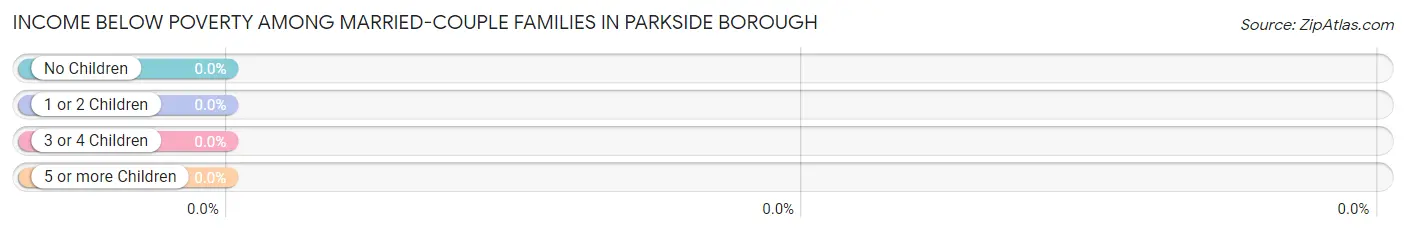
| Children | Above Poverty | Below Poverty |
| No Children | 198 (100.0%) | 0 (0.0%) |
| 1 or 2 Children | 144 (100.0%) | 0 (0.0%) |
| 3 or 4 Children | 28 (100.0%) | 0 (0.0%) |
| 5 or more Children | 0 (0.0%) | 0 (0.0%) |
| Total | 370 (100.0%) | 0 (0.0%) |
Income Below Poverty Among Single-Parent Households in Parkside borough
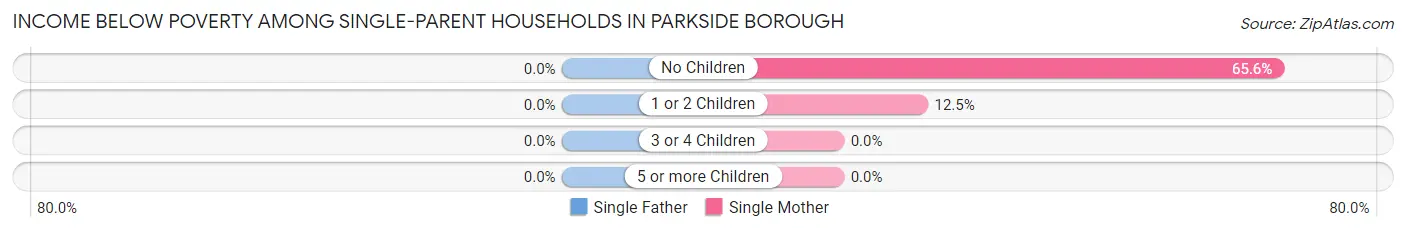
| Children | Single Father | Single Mother |
| No Children | 0 (0.0%) | 42 (65.6%) |
| 1 or 2 Children | 0 (0.0%) | 13 (12.5%) |
| 3 or 4 Children | 0 (0.0%) | 0 (0.0%) |
| 5 or more Children | 0 (0.0%) | 0 (0.0%) |
| Total | 0 (0.0%) | 55 (31.6%) |
Income Below Poverty Among Married-Couple vs Single-Parent Households in Parkside borough
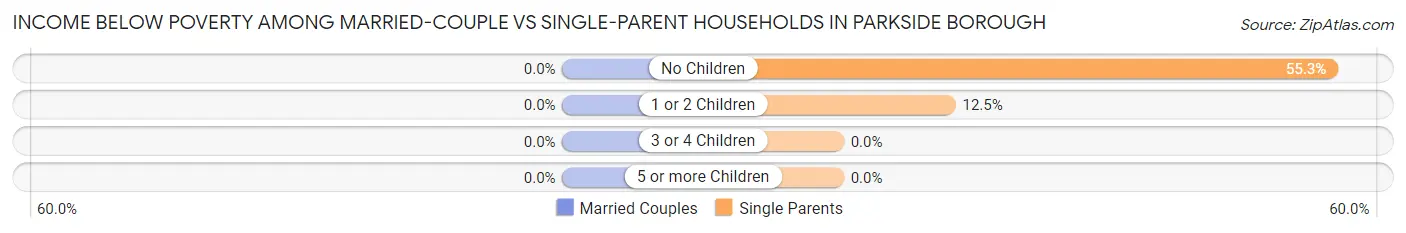
| Children | Married-Couple Families | Single-Parent Households |
| No Children | 0 (0.0%) | 42 (55.3%) |
| 1 or 2 Children | 0 (0.0%) | 13 (12.5%) |
| 3 or 4 Children | 0 (0.0%) | 0 (0.0%) |
| 5 or more Children | 0 (0.0%) | 0 (0.0%) |
| Total | 0 (0.0%) | 55 (29.6%) |
Race in Parkside borough
The most populous races in Parkside borough are White / Caucasian (1,434 | 69.9%), Black / African American (361 | 17.6%), and Two or more Races (127 | 6.2%).
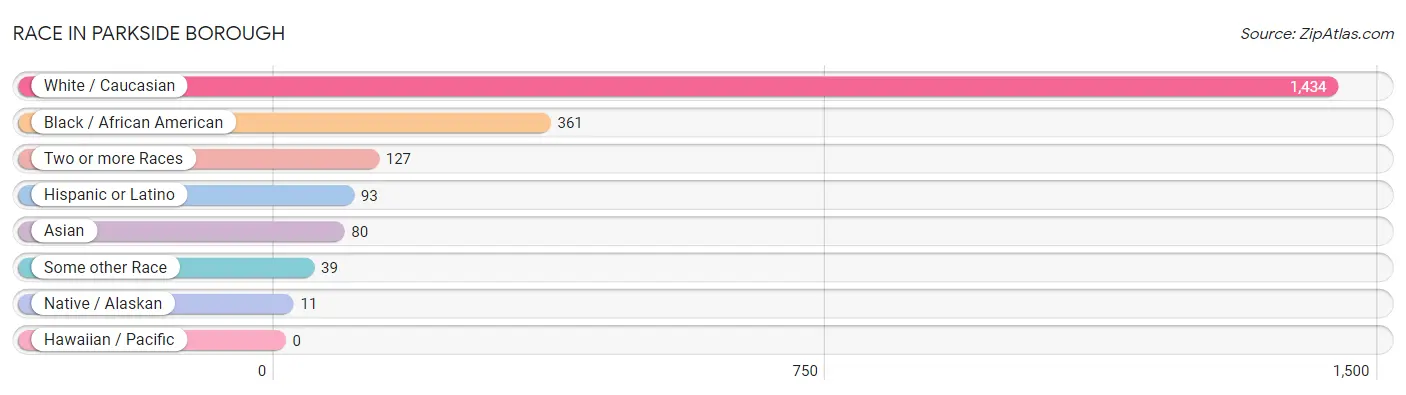
| Race | # Population | % Population |
| Asian | 80 | 3.9% |
| Black / African American | 361 | 17.6% |
| Hawaiian / Pacific | 0 | 0.0% |
| Hispanic or Latino | 93 | 4.5% |
| Native / Alaskan | 11 | 0.5% |
| White / Caucasian | 1,434 | 69.9% |
| Two or more Races | 127 | 6.2% |
| Some other Race | 39 | 1.9% |
| Total | 2,052 | 100.0% |
Ancestry in Parkside borough
The most populous ancestries reported in Parkside borough are German (553 | 27.0%), English (452 | 22.0%), Irish (438 | 21.3%), Italian (175 | 8.5%), and French (127 | 6.2%), together accounting for 85.1% of all Parkside borough residents.
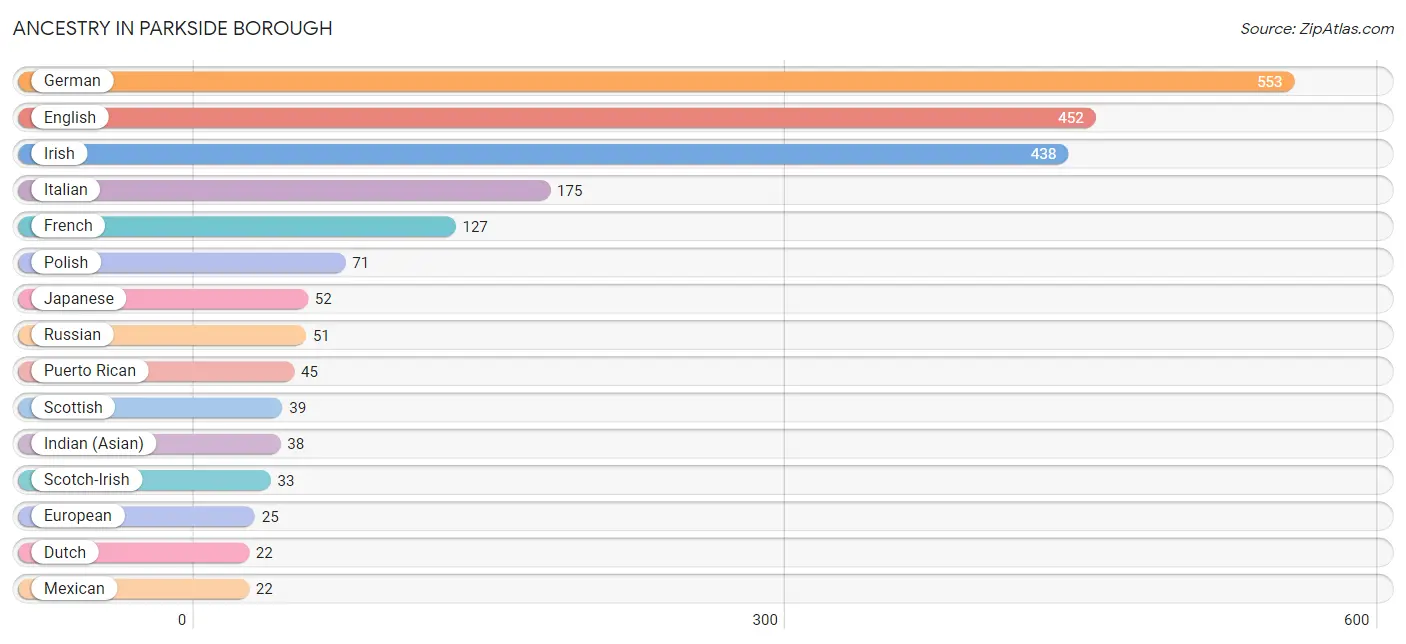
| Ancestry | # Population | % Population |
| African | 11 | 0.5% |
| American | 20 | 1.0% |
| Argentinean | 8 | 0.4% |
| Austrian | 4 | 0.2% |
| Bahamian | 5 | 0.2% |
| British | 3 | 0.2% |
| Central American | 3 | 0.2% |
| Central American Indian | 11 | 0.5% |
| Dominican | 15 | 0.7% |
| Dutch | 22 | 1.1% |
| English | 452 | 22.0% |
| European | 25 | 1.2% |
| French | 127 | 6.2% |
| German | 553 | 27.0% |
| Greek | 9 | 0.4% |
| Hungarian | 16 | 0.8% |
| Indian (Asian) | 38 | 1.8% |
| Irish | 438 | 21.3% |
| Italian | 175 | 8.5% |
| Jamaican | 12 | 0.6% |
| Japanese | 52 | 2.5% |
| Lithuanian | 9 | 0.4% |
| Mexican | 22 | 1.1% |
| Nicaraguan | 3 | 0.2% |
| Pennsylvania German | 7 | 0.3% |
| Polish | 71 | 3.5% |
| Puerto Rican | 45 | 2.2% |
| Russian | 51 | 2.5% |
| Scotch-Irish | 33 | 1.6% |
| Scottish | 39 | 1.9% |
| South American | 8 | 0.4% |
| Subsaharan African | 11 | 0.5% |
| Swedish | 6 | 0.3% |
| Thai | 10 | 0.5% |
| Ukrainian | 8 | 0.4% |
| Welsh | 12 | 0.6% |
| Yugoslavian | 4 | 0.2% | View All 37 Rows |
Immigrants in Parkside borough
The most numerous immigrant groups reported in Parkside borough came from Asia (69 | 3.4%), South Eastern Asia (64 | 3.1%), Cambodia (52 | 2.5%), Vietnam (12 | 0.6%), and Europe (9 | 0.4%), together accounting for 10.0% of all Parkside borough residents.
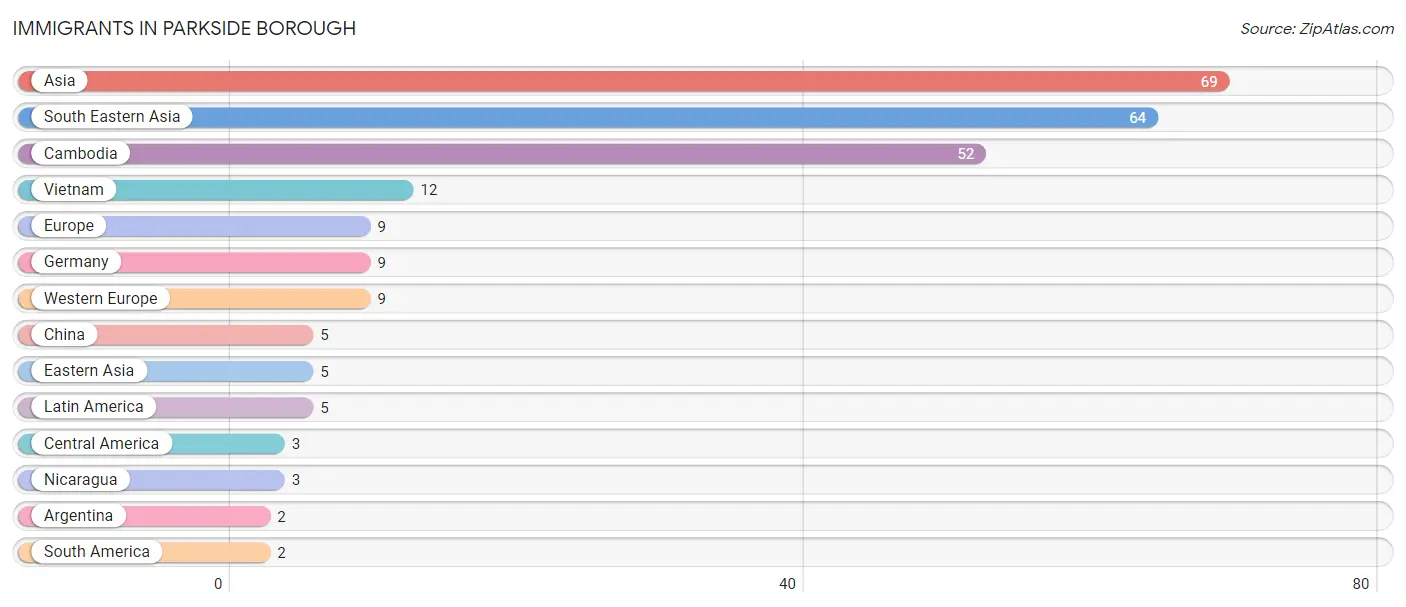
| Immigration Origin | # Population | % Population |
| Argentina | 2 | 0.1% |
| Asia | 69 | 3.4% |
| Cambodia | 52 | 2.5% |
| Central America | 3 | 0.2% |
| China | 5 | 0.2% |
| Eastern Asia | 5 | 0.2% |
| Europe | 9 | 0.4% |
| Germany | 9 | 0.4% |
| Latin America | 5 | 0.2% |
| Nicaragua | 3 | 0.2% |
| South America | 2 | 0.1% |
| South Eastern Asia | 64 | 3.1% |
| Vietnam | 12 | 0.6% |
| Western Europe | 9 | 0.4% | View All 14 Rows |
Sex and Age in Parkside borough
Sex and Age in Parkside borough
The most populous age groups in Parkside borough are 45 to 49 Years (120 | 13.5%) for men and 15 to 19 Years (177 | 15.3%) for women.
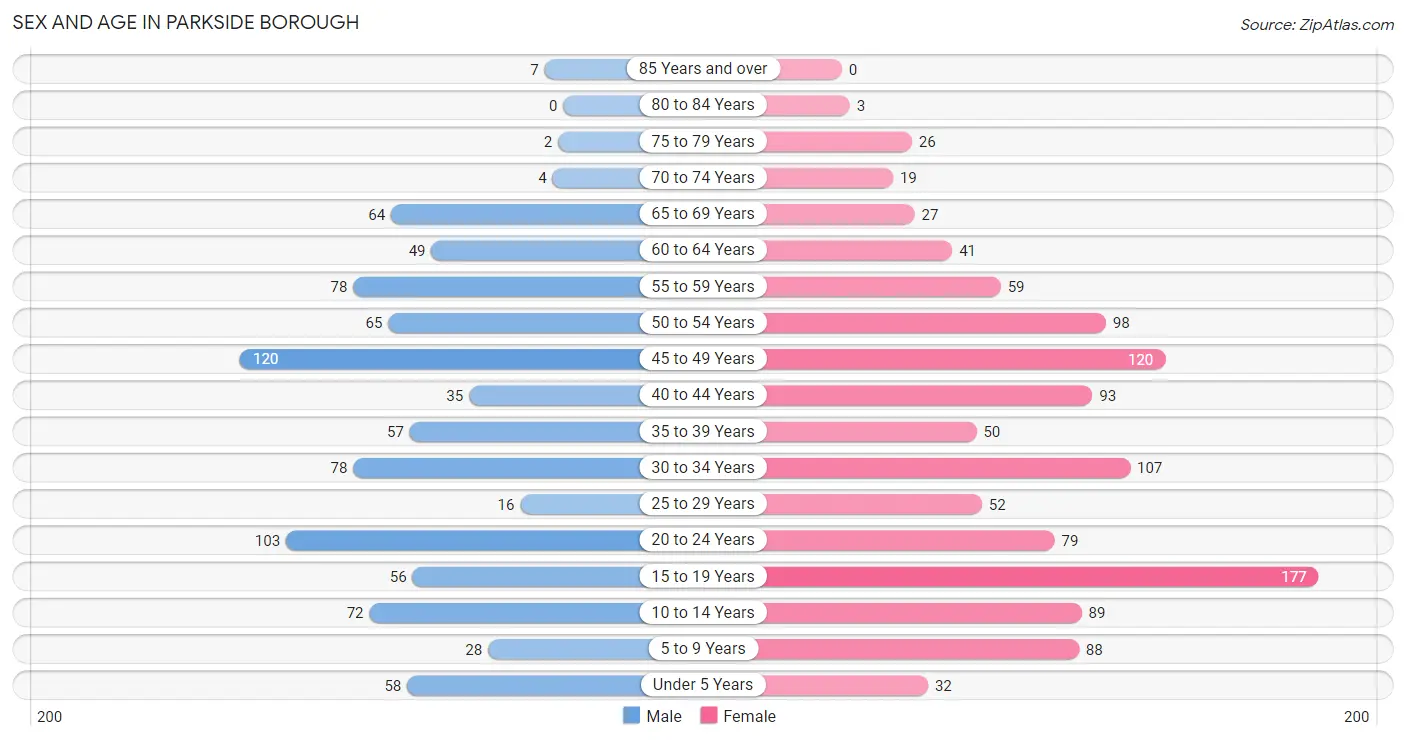
| Age Bracket | Male | Female |
| Under 5 Years | 58 (6.5%) | 32 (2.8%) |
| 5 to 9 Years | 28 (3.1%) | 88 (7.6%) |
| 10 to 14 Years | 72 (8.1%) | 89 (7.7%) |
| 15 to 19 Years | 56 (6.3%) | 177 (15.3%) |
| 20 to 24 Years | 103 (11.6%) | 79 (6.8%) |
| 25 to 29 Years | 16 (1.8%) | 52 (4.5%) |
| 30 to 34 Years | 78 (8.7%) | 107 (9.2%) |
| 35 to 39 Years | 57 (6.4%) | 50 (4.3%) |
| 40 to 44 Years | 35 (3.9%) | 93 (8.0%) |
| 45 to 49 Years | 120 (13.5%) | 120 (10.3%) |
| 50 to 54 Years | 65 (7.3%) | 98 (8.5%) |
| 55 to 59 Years | 78 (8.7%) | 59 (5.1%) |
| 60 to 64 Years | 49 (5.5%) | 41 (3.5%) |
| 65 to 69 Years | 64 (7.2%) | 27 (2.3%) |
| 70 to 74 Years | 4 (0.4%) | 19 (1.6%) |
| 75 to 79 Years | 2 (0.2%) | 26 (2.2%) |
| 80 to 84 Years | 0 (0.0%) | 3 (0.3%) |
| 85 Years and over | 7 (0.8%) | 0 (0.0%) |
| Total | 892 (100.0%) | 1,160 (100.0%) |
Families and Households in Parkside borough
Median Family Size in Parkside borough
The median family size in Parkside borough is 3.23 persons per family, with married-couple families (370 | 66.5%) accounting for the largest median family size of 3.52 persons per family. On the other hand, single male/father families (12 | 2.2%) represent the smallest median family size with 2.33 persons per family.
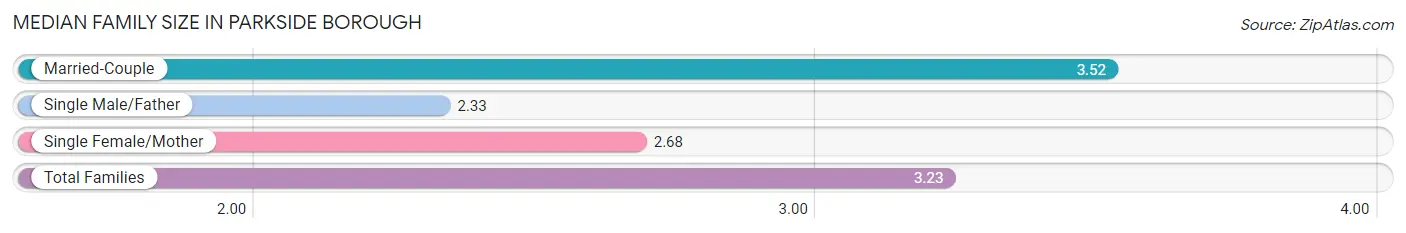
| Family Type | # Families | Family Size |
| Married-Couple | 370 (66.5%) | 3.52 |
| Single Male/Father | 12 (2.2%) | 2.33 |
| Single Female/Mother | 174 (31.3%) | 2.68 |
| Total Families | 556 (100.0%) | 3.23 |
Median Household Size in Parkside borough
The median household size in Parkside borough is 2.68 persons per household, with married-couple households (370 | 48.4%) accounting for the largest median household size of 3.54 persons per household. non-family households (209 | 27.3%) represent the smallest median household size with 1.10 persons per household.
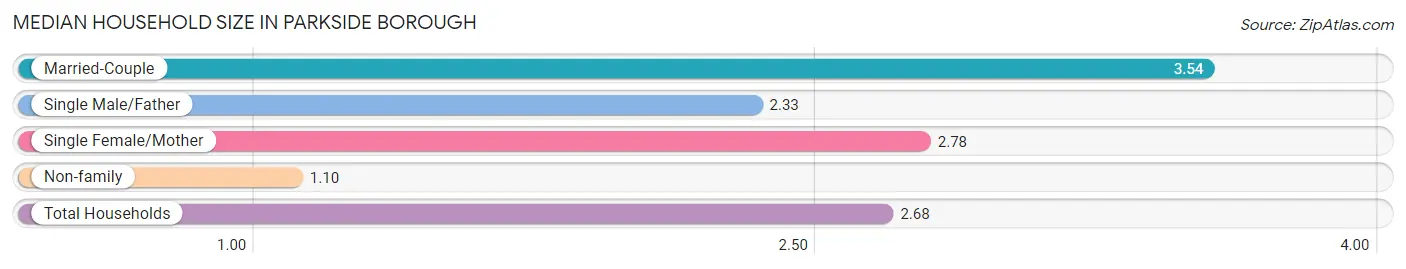
| Household Type | # Households | Household Size |
| Married-Couple | 370 (48.4%) | 3.54 |
| Single Male/Father | 12 (1.6%) | 2.33 |
| Single Female/Mother | 174 (22.8%) | 2.78 |
| Non-family | 209 (27.3%) | 1.10 |
| Total Households | 765 (100.0%) | 2.68 |
Household Size by Marriage Status in Parkside borough
Out of a total of 765 households in Parkside borough, 556 (72.7%) are family households, while 209 (27.3%) are nonfamily households. The most numerous type of family households are 2-person households, comprising 211, and the most common type of nonfamily households are 1-person households, comprising 184.
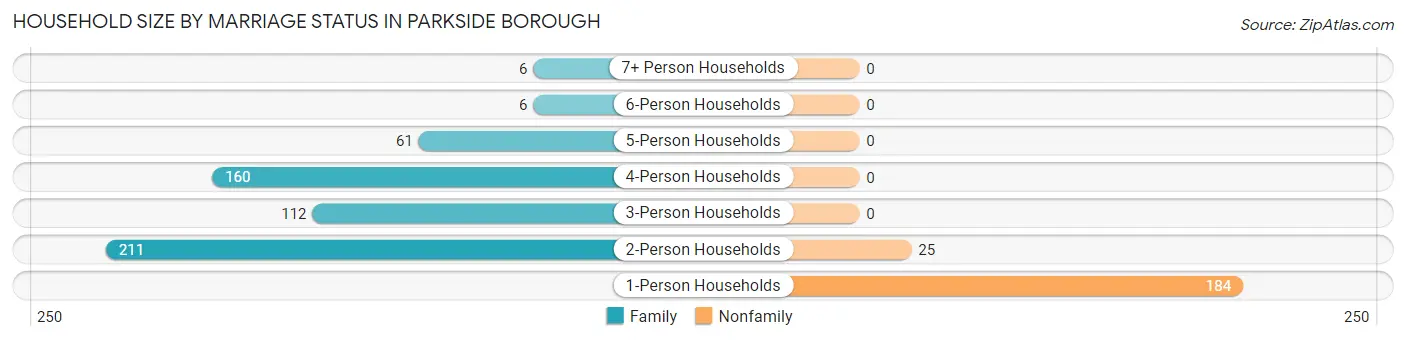
| Household Size | Family Households | Nonfamily Households |
| 1-Person Households | - | 184 (24.0%) |
| 2-Person Households | 211 (27.6%) | 25 (3.3%) |
| 3-Person Households | 112 (14.6%) | 0 (0.0%) |
| 4-Person Households | 160 (20.9%) | 0 (0.0%) |
| 5-Person Households | 61 (8.0%) | 0 (0.0%) |
| 6-Person Households | 6 (0.8%) | 0 (0.0%) |
| 7+ Person Households | 6 (0.8%) | 0 (0.0%) |
| Total | 556 (72.7%) | 209 (27.3%) |
Female Fertility in Parkside borough
Fertility by Age in Parkside borough
Average fertility rate in Parkside borough is 16.0 births per 1,000 women. Women in the age bracket of 20 to 34 years have the highest fertility rate with 46.0 births per 1,000 women. Women in the age bracket of 20 to 34 years acount for 100.0% of all women with births.
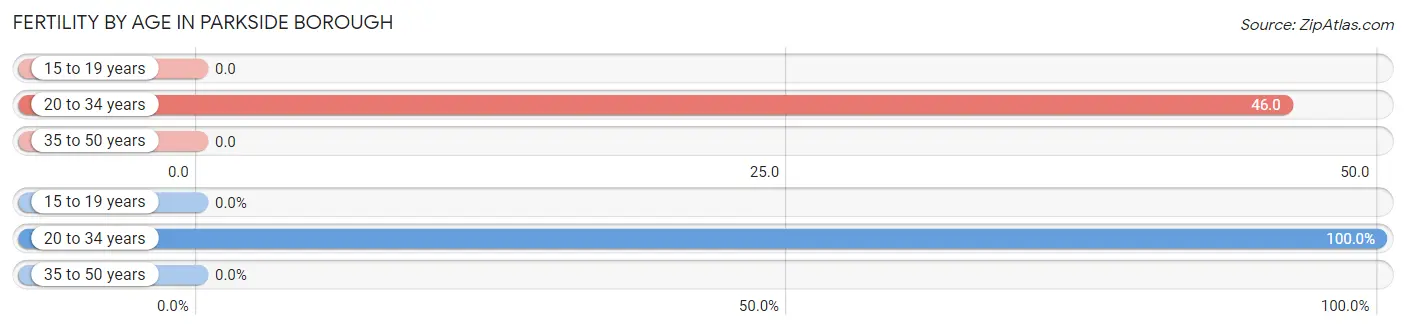
| Age Bracket | Women with Births | Births / 1,000 Women |
| 15 to 19 years | 0 (0.0%) | 0.0 |
| 20 to 34 years | 11 (100.0%) | 46.0 |
| 35 to 50 years | 0 (0.0%) | 0.0 |
| Total | 11 (100.0%) | 16.0 |
Fertility by Age by Marriage Status in Parkside borough
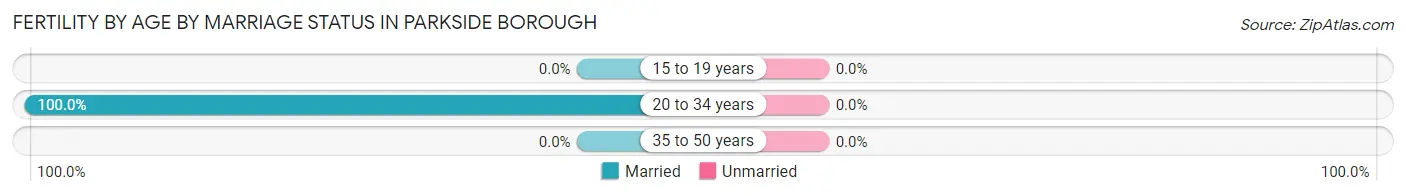
| Age Bracket | Married | Unmarried |
| 15 to 19 years | 0 (0.0%) | 0 (0.0%) |
| 20 to 34 years | 11 (100.0%) | 0 (0.0%) |
| 35 to 50 years | 0 (0.0%) | 0 (0.0%) |
| Total | 11 (100.0%) | 0 (0.0%) |
Fertility by Education in Parkside borough
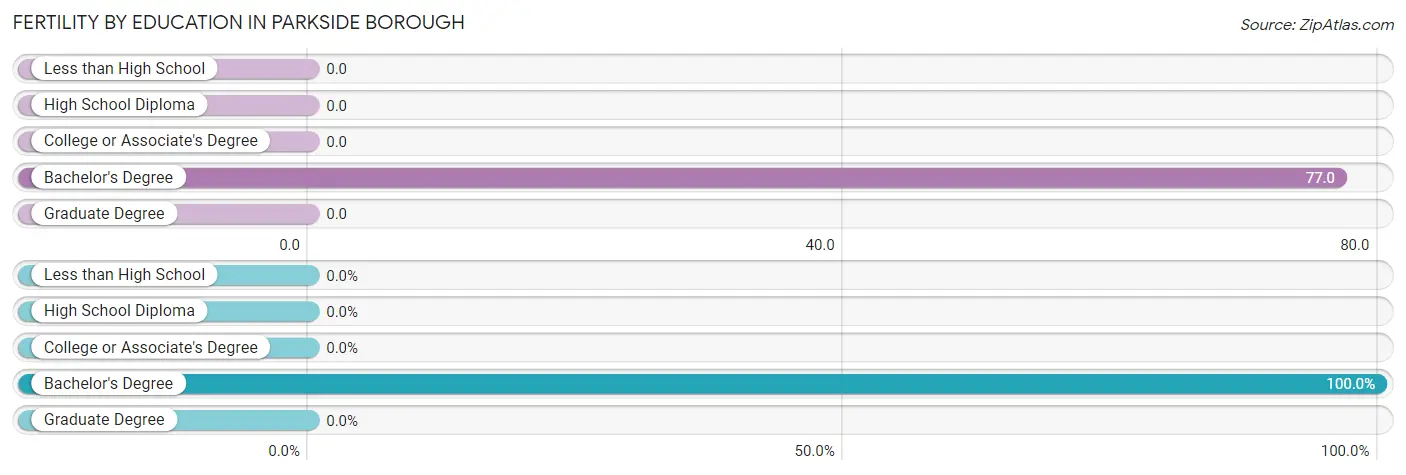
| Educational Attainment | Women with Births | Births / 1,000 Women |
| Less than High School | 0 (0.0%) | 0.0 |
| High School Diploma | 0 (0.0%) | 0.0 |
| College or Associate's Degree | 0 (0.0%) | 0.0 |
| Bachelor's Degree | 11 (100.0%) | 77.0 |
| Graduate Degree | 0 (0.0%) | 0.0 |
| Total | 11 (100.0%) | 16.0 |
Fertility by Education by Marriage Status in Parkside borough
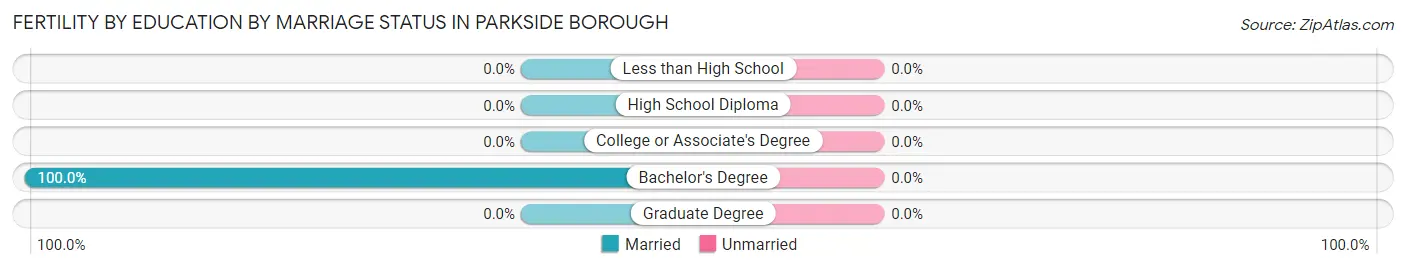
| Educational Attainment | Married | Unmarried |
| Less than High School | 0 (0.0%) | 0 (0.0%) |
| High School Diploma | 0 (0.0%) | 0 (0.0%) |
| College or Associate's Degree | 0 (0.0%) | 0 (0.0%) |
| Bachelor's Degree | 11 (100.0%) | 0 (0.0%) |
| Graduate Degree | 0 (0.0%) | 0 (0.0%) |
| Total | 11 (100.0%) | 0 (0.0%) |
Employment Characteristics in Parkside borough
Employment by Class of Employer in Parkside borough
Among the 1,211 employed individuals in Parkside borough, private company employees (911 | 75.2%), federal government employees (91 | 7.5%), and not-for-profit organizations (84 | 6.9%) make up the most common classes of employment.
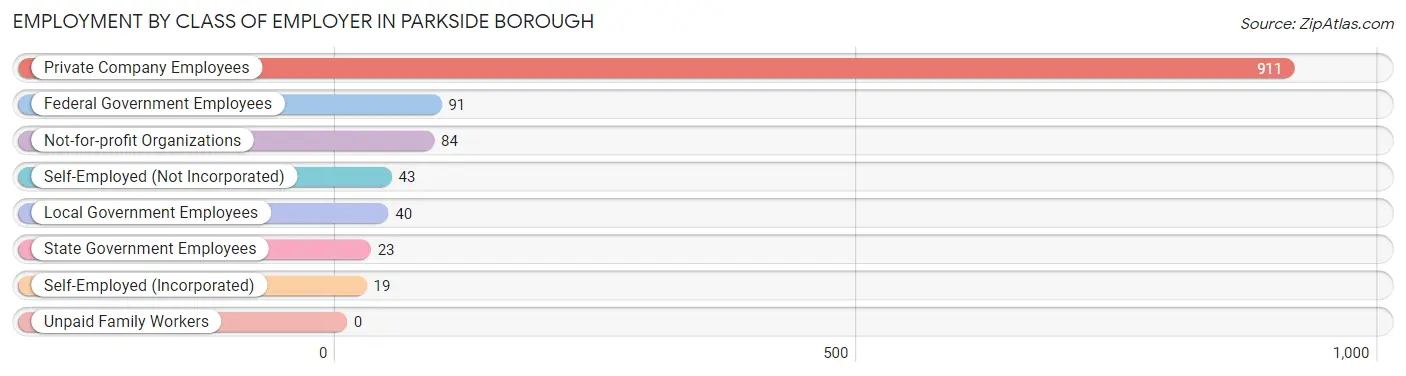
| Employer Class | # Employees | % Employees |
| Private Company Employees | 911 | 75.2% |
| Self-Employed (Incorporated) | 19 | 1.6% |
| Self-Employed (Not Incorporated) | 43 | 3.5% |
| Not-for-profit Organizations | 84 | 6.9% |
| Local Government Employees | 40 | 3.3% |
| State Government Employees | 23 | 1.9% |
| Federal Government Employees | 91 | 7.5% |
| Unpaid Family Workers | 0 | 0.0% |
| Total | 1,211 | 100.0% |
Employment Status by Age in Parkside borough
According to the labor force statistics for Parkside borough, out of the total population over 16 years of age (1,647), 77.8% or 1,281 individuals are in the labor force, with 4.1% or 53 of them unemployed. The age group with the highest labor force participation rate is 30 to 34 years, with 100.0% or 185 individuals in the labor force. Within the labor force, the 16 to 19 years age range has the highest percentage of unemployed individuals, with 19.5% or 17 of them being unemployed.
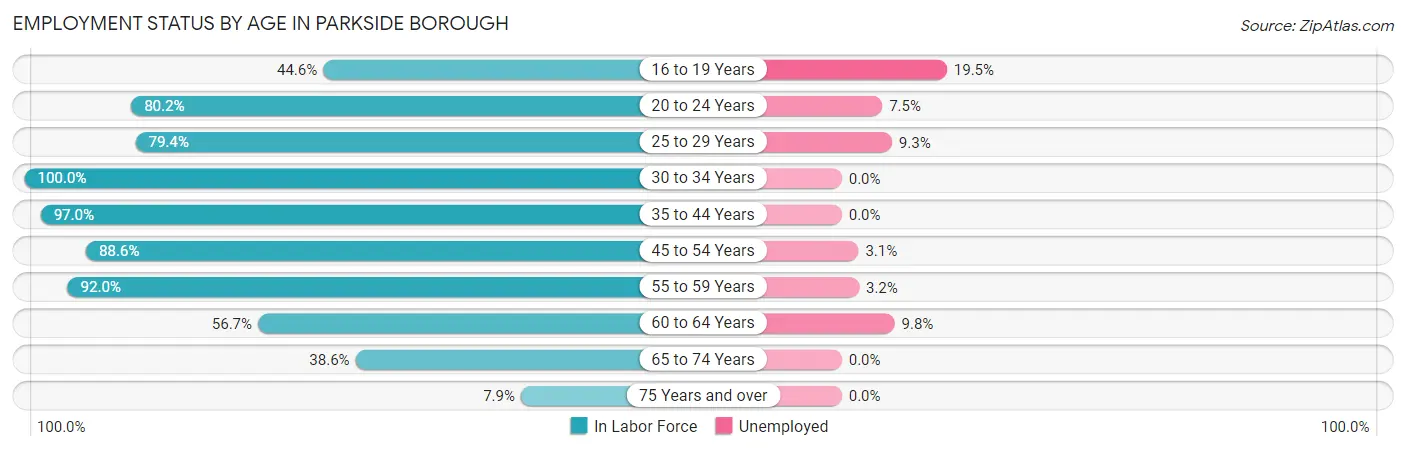
| Age Bracket | In Labor Force | Unemployed |
| 16 to 19 Years | 87 (44.6%) | 17 (19.5%) |
| 20 to 24 Years | 146 (80.2%) | 11 (7.5%) |
| 25 to 29 Years | 54 (79.4%) | 5 (9.3%) |
| 30 to 34 Years | 185 (100.0%) | 0 (0.0%) |
| 35 to 44 Years | 228 (97.0%) | 0 (0.0%) |
| 45 to 54 Years | 357 (88.6%) | 11 (3.1%) |
| 55 to 59 Years | 126 (92.0%) | 4 (3.2%) |
| 60 to 64 Years | 51 (56.7%) | 5 (9.8%) |
| 65 to 74 Years | 44 (38.6%) | 0 (0.0%) |
| 75 Years and over | 3 (7.9%) | 0 (0.0%) |
| Total | 1,281 (77.8%) | 53 (4.1%) |
Employment Status by Educational Attainment in Parkside borough
According to labor force statistics for Parkside borough, 89.5% of individuals (1,001) out of the total population between 25 and 64 years of age (1,118) are in the labor force, with 2.5% or 25 of them being unemployed. The group with the highest labor force participation rate are those with the educational attainment of less than high school, with 92.5% or 37 individuals in the labor force. Within the labor force, individuals with high school diploma education have the highest percentage of unemployment, with 4.7% or 16 of them being unemployed.
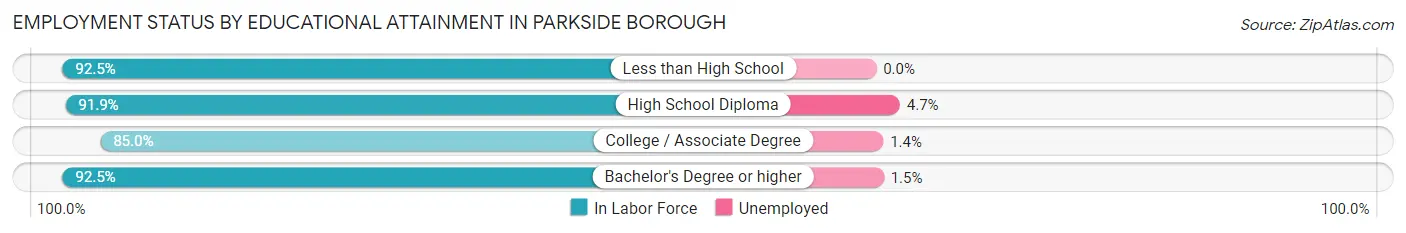
| Educational Attainment | In Labor Force | Unemployed |
| Less than High School | 37 (92.5%) | 0 (0.0%) |
| High School Diploma | 341 (91.9%) | 17 (4.7%) |
| College / Associate Degree | 352 (85.0%) | 6 (1.4%) |
| Bachelor's Degree or higher | 271 (92.5%) | 4 (1.5%) |
| Total | 1,001 (89.5%) | 28 (2.5%) |
Employment Occupations by Sex in Parkside borough
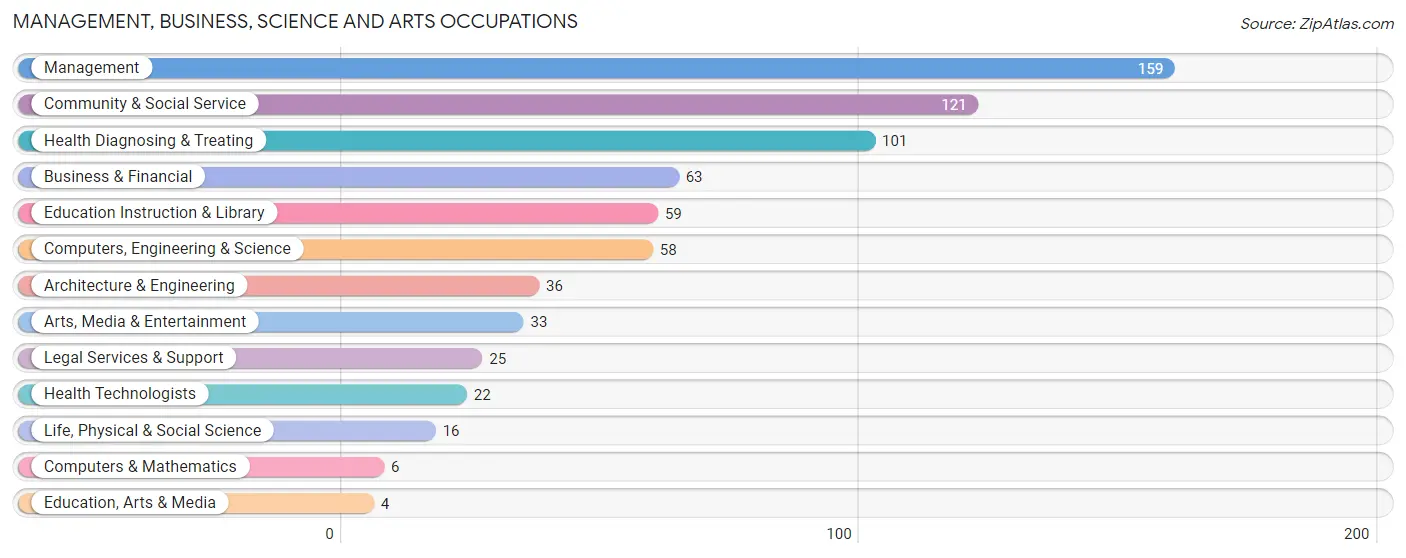
Management, Business, Science and Arts Occupations
The most common Management, Business, Science and Arts occupations in Parkside borough are Management (159 | 13.0%), Community & Social Service (121 | 9.9%), Health Diagnosing & Treating (101 | 8.2%), Business & Financial (63 | 5.1%), and Education Instruction & Library (59 | 4.8%).
Management, Business, Science and Arts Occupations by Sex
Within the Management, Business, Science and Arts occupations in Parkside borough, the most male-oriented occupations are Computers, Engineering & Science (100.0%), Computers & Mathematics (100.0%), and Architecture & Engineering (100.0%), while the most female-oriented occupations are Education, Arts & Media (100.0%), Legal Services & Support (100.0%), and Health Diagnosing & Treating (100.0%).
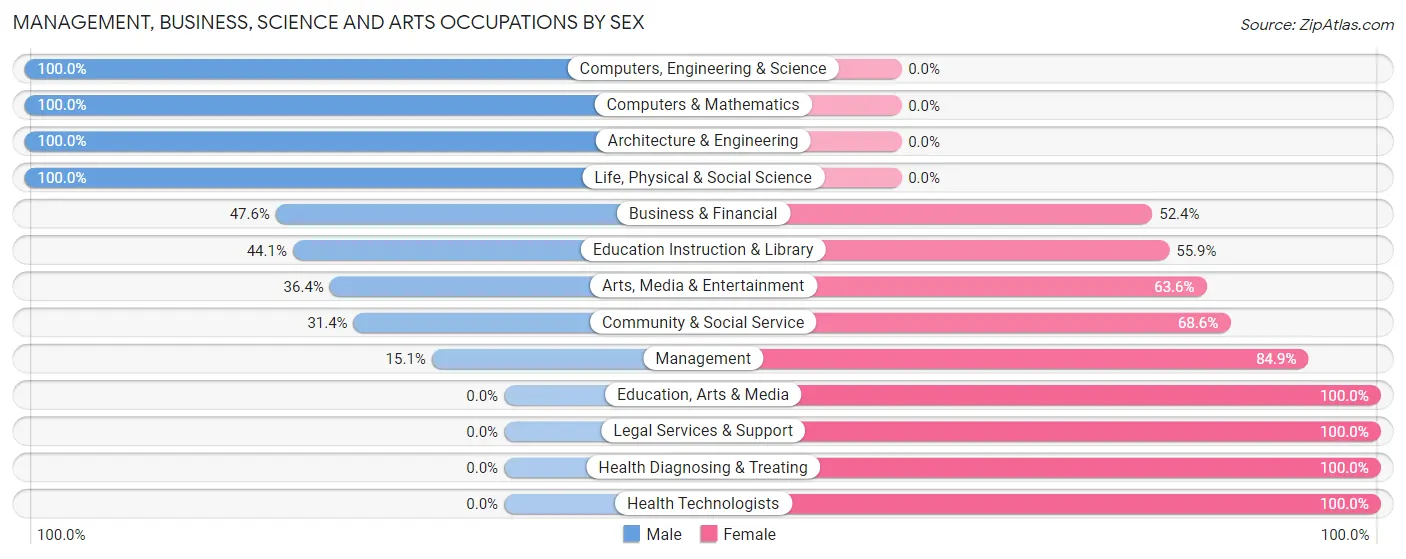
| Occupation | Male | Female |
| Management | 24 (15.1%) | 135 (84.9%) |
| Business & Financial | 30 (47.6%) | 33 (52.4%) |
| Computers, Engineering & Science | 58 (100.0%) | 0 (0.0%) |
| Computers & Mathematics | 6 (100.0%) | 0 (0.0%) |
| Architecture & Engineering | 36 (100.0%) | 0 (0.0%) |
| Life, Physical & Social Science | 16 (100.0%) | 0 (0.0%) |
| Community & Social Service | 38 (31.4%) | 83 (68.6%) |
| Education, Arts & Media | 0 (0.0%) | 4 (100.0%) |
| Legal Services & Support | 0 (0.0%) | 25 (100.0%) |
| Education Instruction & Library | 26 (44.1%) | 33 (55.9%) |
| Arts, Media & Entertainment | 12 (36.4%) | 21 (63.6%) |
| Health Diagnosing & Treating | 0 (0.0%) | 101 (100.0%) |
| Health Technologists | 0 (0.0%) | 22 (100.0%) |
| Total (Category) | 150 (29.9%) | 352 (70.1%) |
| Total (Overall) | 558 (45.4%) | 670 (54.6%) |
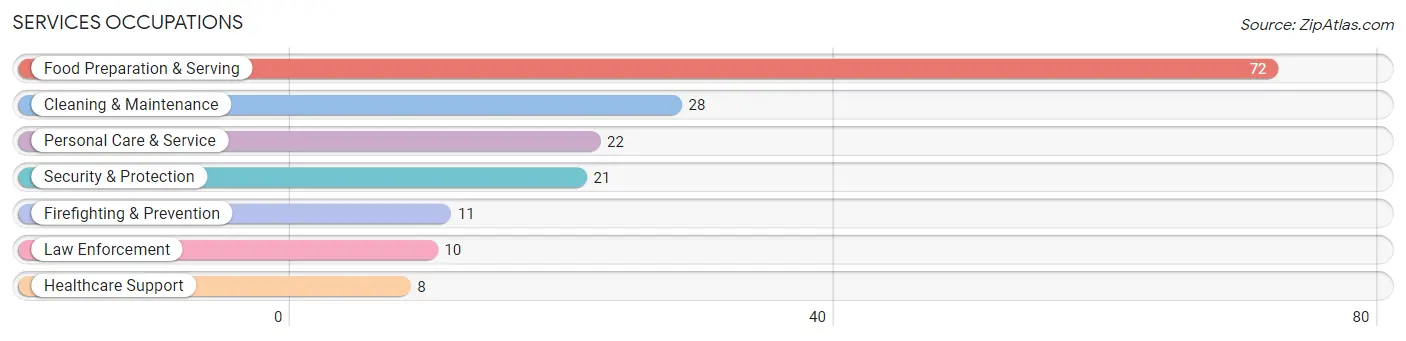
Services Occupations
The most common Services occupations in Parkside borough are Food Preparation & Serving (72 | 5.9%), Cleaning & Maintenance (28 | 2.3%), Personal Care & Service (22 | 1.8%), Security & Protection (21 | 1.7%), and Firefighting & Prevention (11 | 0.9%).
Services Occupations by Sex
Within the Services occupations in Parkside borough, the most male-oriented occupations are Firefighting & Prevention (100.0%), Cleaning & Maintenance (100.0%), and Food Preparation & Serving (65.3%), while the most female-oriented occupations are Healthcare Support (100.0%), Law Enforcement (100.0%), and Personal Care & Service (86.4%).
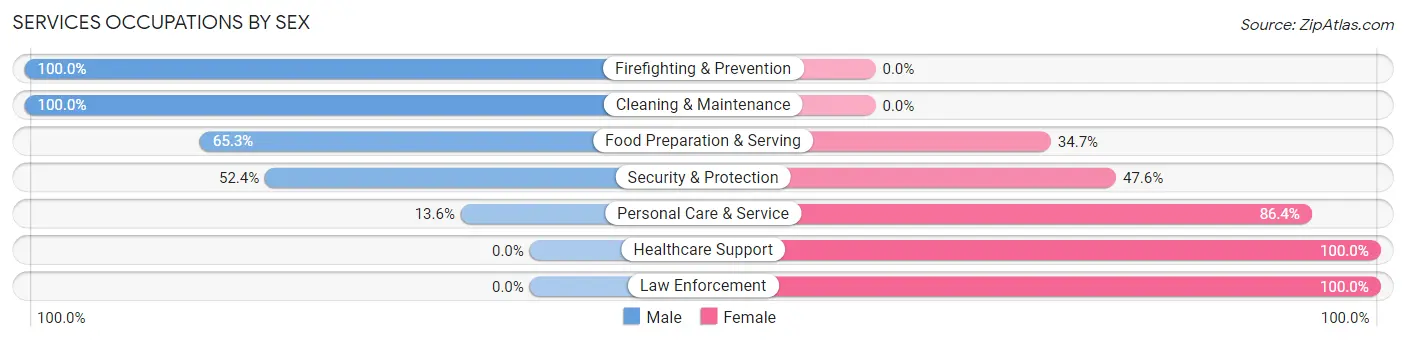
| Occupation | Male | Female |
| Healthcare Support | 0 (0.0%) | 8 (100.0%) |
| Security & Protection | 11 (52.4%) | 10 (47.6%) |
| Firefighting & Prevention | 11 (100.0%) | 0 (0.0%) |
| Law Enforcement | 0 (0.0%) | 10 (100.0%) |
| Food Preparation & Serving | 47 (65.3%) | 25 (34.7%) |
| Cleaning & Maintenance | 28 (100.0%) | 0 (0.0%) |
| Personal Care & Service | 3 (13.6%) | 19 (86.4%) |
| Total (Category) | 89 (58.9%) | 62 (41.1%) |
| Total (Overall) | 558 (45.4%) | 670 (54.6%) |
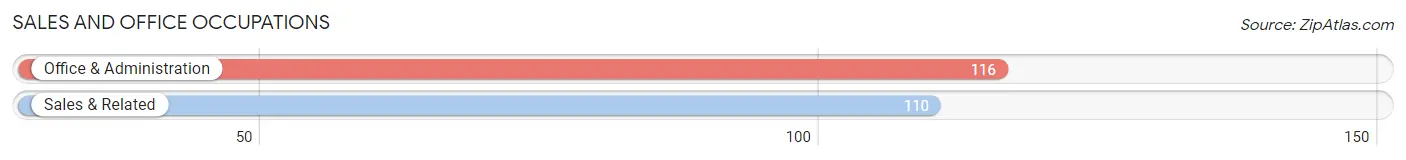
Sales and Office Occupations
The most common Sales and Office occupations in Parkside borough are Office & Administration (116 | 9.5%), and Sales & Related (110 | 9.0%).
Sales and Office Occupations by Sex
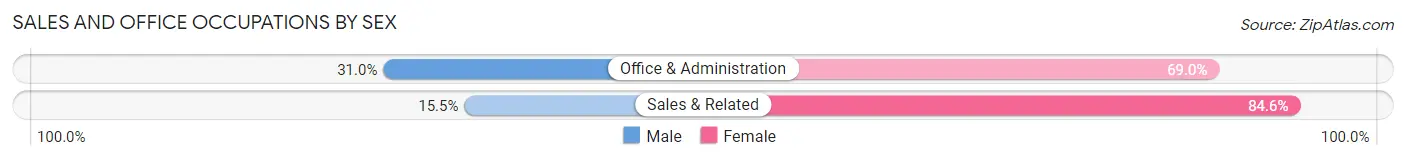
| Occupation | Male | Female |
| Sales & Related | 17 (15.4%) | 93 (84.6%) |
| Office & Administration | 36 (31.0%) | 80 (69.0%) |
| Total (Category) | 53 (23.4%) | 173 (76.5%) |
| Total (Overall) | 558 (45.4%) | 670 (54.6%) |
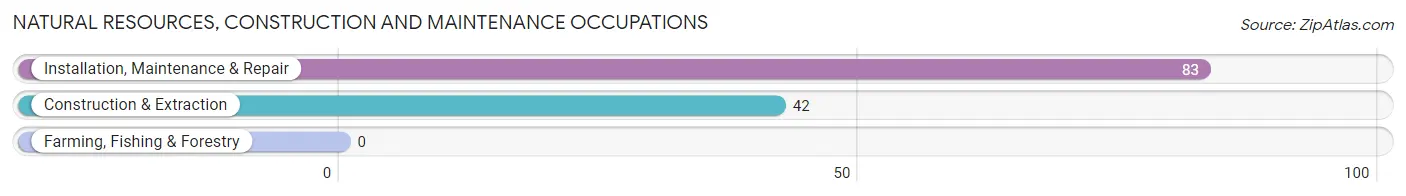
Natural Resources, Construction and Maintenance Occupations
The most common Natural Resources, Construction and Maintenance occupations in Parkside borough are Installation, Maintenance & Repair (83 | 6.8%), and Construction & Extraction (42 | 3.4%).
Natural Resources, Construction and Maintenance Occupations by Sex
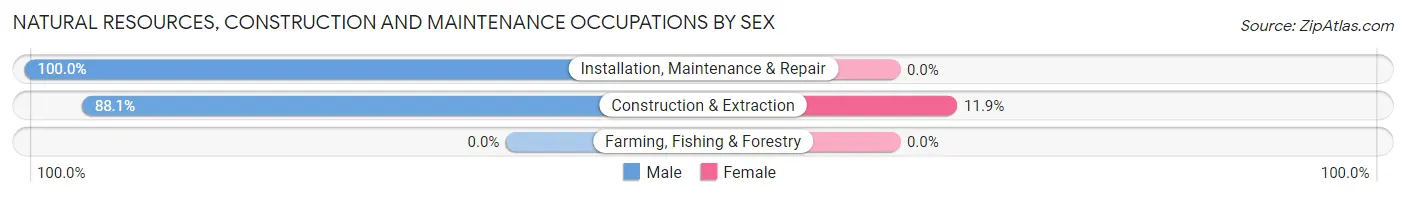
| Occupation | Male | Female |
| Farming, Fishing & Forestry | 0 (0.0%) | 0 (0.0%) |
| Construction & Extraction | 37 (88.1%) | 5 (11.9%) |
| Installation, Maintenance & Repair | 83 (100.0%) | 0 (0.0%) |
| Total (Category) | 120 (96.0%) | 5 (4.0%) |
| Total (Overall) | 558 (45.4%) | 670 (54.6%) |
Production, Transportation and Moving Occupations
The most common Production, Transportation and Moving occupations in Parkside borough are Transportation (105 | 8.6%), Material Moving (65 | 5.3%), and Production (54 | 4.4%).
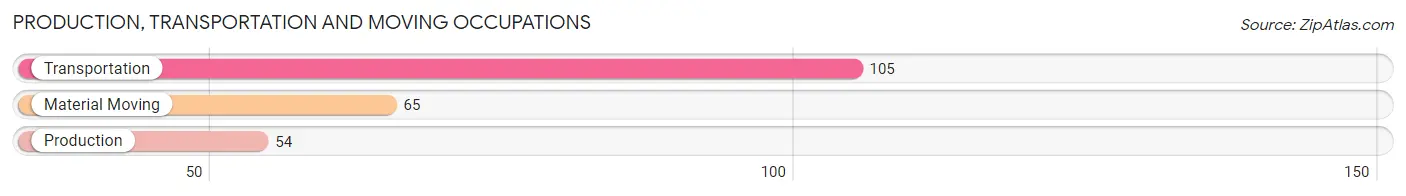
Production, Transportation and Moving Occupations by Sex
| Occupation | Male | Female |
| Production | 41 (75.9%) | 13 (24.1%) |
| Transportation | 105 (100.0%) | 0 (0.0%) |
| Material Moving | 0 (0.0%) | 65 (100.0%) |
| Total (Category) | 146 (65.2%) | 78 (34.8%) |
| Total (Overall) | 558 (45.4%) | 670 (54.6%) |
Employment Industries by Sex in Parkside borough
Employment Industries in Parkside borough
The major employment industries in Parkside borough include Health Care & Social Assistance (192 | 15.6%), Retail Trade (187 | 15.2%), Accommodation & Food Services (145 | 11.8%), Professional & Scientific (130 | 10.6%), and Manufacturing (103 | 8.4%).
Employment Industries by Sex in Parkside borough
The Parkside borough industries that see more men than women are Wholesale Trade (100.0%), Information (100.0%), and Transportation & Warehousing (94.7%), whereas the industries that tend to have a higher number of women are Real Estate, Rental & Leasing (100.0%), Arts, Entertainment & Recreation (100.0%), and Health Care & Social Assistance (92.7%).
| Industry | Male | Female |
| Agriculture, Fishing & Hunting | 0 (0.0%) | 0 (0.0%) |
| Mining, Quarrying, & Extraction | 0 (0.0%) | 0 (0.0%) |
| Construction | 63 (92.6%) | 5 (7.3%) |
| Manufacturing | 69 (67.0%) | 34 (33.0%) |
| Wholesale Trade | 4 (100.0%) | 0 (0.0%) |
| Retail Trade | 48 (25.7%) | 139 (74.3%) |
| Transportation & Warehousing | 89 (94.7%) | 5 (5.3%) |
| Utilities | 0 (0.0%) | 0 (0.0%) |
| Information | 4 (100.0%) | 0 (0.0%) |
| Finance & Insurance | 47 (48.0%) | 51 (52.0%) |
| Real Estate, Rental & Leasing | 0 (0.0%) | 7 (100.0%) |
| Professional & Scientific | 52 (40.0%) | 78 (60.0%) |
| Enterprise Management | 0 (0.0%) | 0 (0.0%) |
| Administrative & Support | 36 (87.8%) | 5 (12.2%) |
| Educational Services | 25 (32.9%) | 51 (67.1%) |
| Health Care & Social Assistance | 14 (7.3%) | 178 (92.7%) |
| Arts, Entertainment & Recreation | 0 (0.0%) | 11 (100.0%) |
| Accommodation & Food Services | 64 (44.1%) | 81 (55.9%) |
| Public Administration | 14 (40.0%) | 21 (60.0%) |
| Total | 558 (45.4%) | 670 (54.6%) |
Education in Parkside borough
School Enrollment in Parkside borough
The most common levels of schooling among the 549 students in Parkside borough are high school (190 | 34.6%), middle school (126 | 23.0%), and elementary school (83 | 15.1%).
| School Level | # Students | % Students |
| Nursery / Preschool | 22 | 4.0% |
| Kindergarten | 28 | 5.1% |
| Elementary School | 83 | 15.1% |
| Middle School | 126 | 23.0% |
| High School | 190 | 34.6% |
| College / Undergraduate | 74 | 13.5% |
| Graduate / Professional | 26 | 4.7% |
| Total | 549 | 100.0% |
School Enrollment by Age by Funding Source in Parkside borough
Out of a total of 549 students who are enrolled in schools in Parkside borough, 71 (12.9%) attend a private institution, while the remaining 478 (87.1%) are enrolled in public schools. The age group of 35 years and over has the highest likelihood of being enrolled in private schools, with 17 (85.0% in the age bracket) enrolled. Conversely, the age group of 25 to 34 year olds has the lowest likelihood of being enrolled in a private school, with 17 (100.0% in the age bracket) attending a public institution.
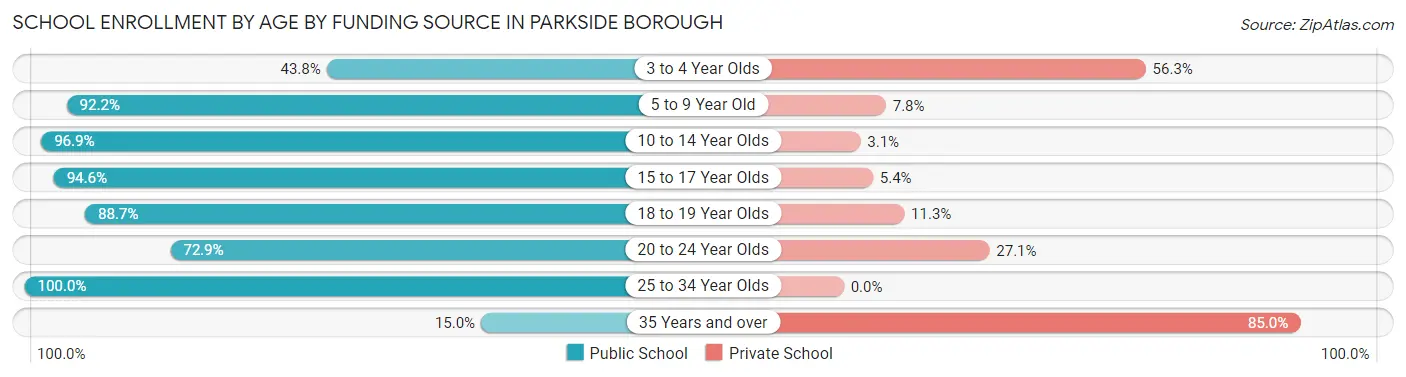
| Age Bracket | Public School | Private School |
| 3 to 4 Year Olds | 7 (43.8%) | 9 (56.2%) |
| 5 to 9 Year Old | 94 (92.2%) | 8 (7.8%) |
| 10 to 14 Year Olds | 156 (96.9%) | 5 (3.1%) |
| 15 to 17 Year Olds | 87 (94.6%) | 5 (5.4%) |
| 18 to 19 Year Olds | 63 (88.7%) | 8 (11.3%) |
| 20 to 24 Year Olds | 51 (72.9%) | 19 (27.1%) |
| 25 to 34 Year Olds | 17 (100.0%) | 0 (0.0%) |
| 35 Years and over | 3 (15.0%) | 17 (85.0%) |
| Total | 478 (87.1%) | 71 (12.9%) |
Educational Attainment by Field of Study in Parkside borough
Business (83 | 25.5%), education (46 | 14.1%), arts & humanities (43 | 13.2%), liberal arts & history (37 | 11.4%), and science & technology (23 | 7.1%) are the most common fields of study among 326 individuals in Parkside borough who have obtained a bachelor's degree or higher.
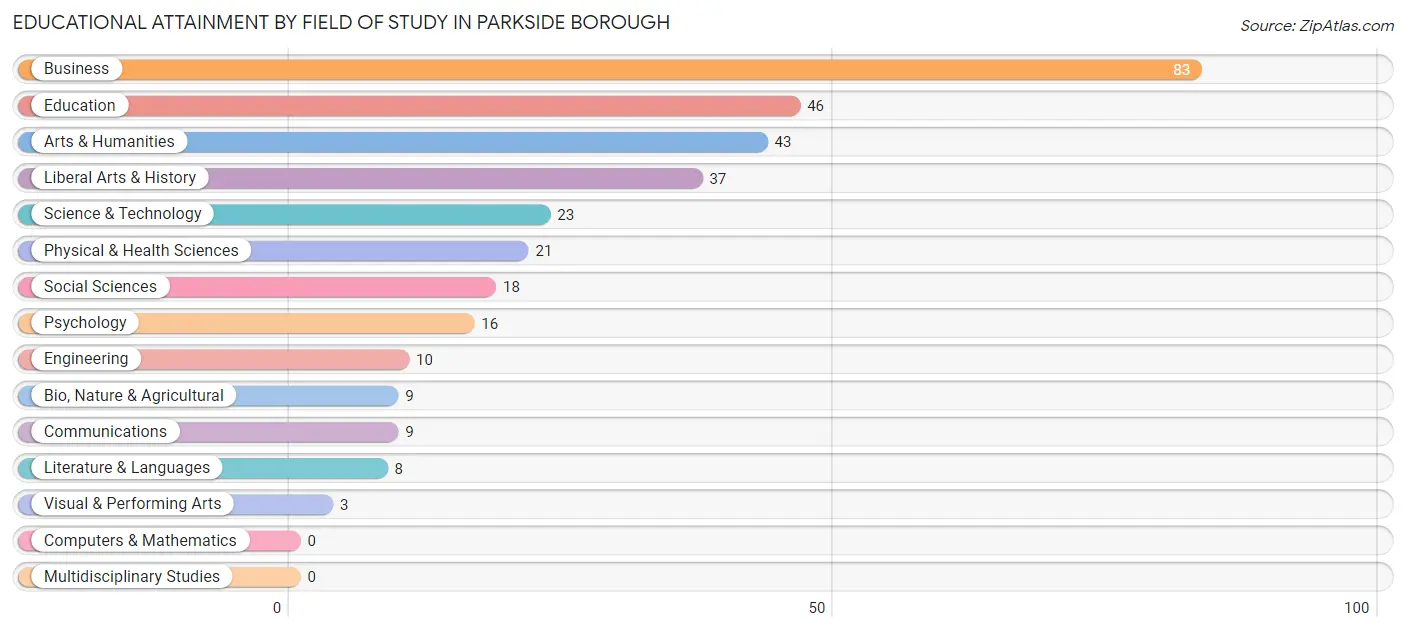
| Field of Study | # Graduates | % Graduates |
| Computers & Mathematics | 0 | 0.0% |
| Bio, Nature & Agricultural | 9 | 2.8% |
| Physical & Health Sciences | 21 | 6.4% |
| Psychology | 16 | 4.9% |
| Social Sciences | 18 | 5.5% |
| Engineering | 10 | 3.1% |
| Multidisciplinary Studies | 0 | 0.0% |
| Science & Technology | 23 | 7.1% |
| Business | 83 | 25.5% |
| Education | 46 | 14.1% |
| Literature & Languages | 8 | 2.5% |
| Liberal Arts & History | 37 | 11.4% |
| Visual & Performing Arts | 3 | 0.9% |
| Communications | 9 | 2.8% |
| Arts & Humanities | 43 | 13.2% |
| Total | 326 | 100.0% |
Transportation & Commute in Parkside borough
Vehicle Availability by Sex in Parkside borough
The most prevalent vehicle ownership categories in Parkside borough are males with 2 vehicles (342, accounting for 61.3%) and females with 2 vehicles (318, making up 52.4%).
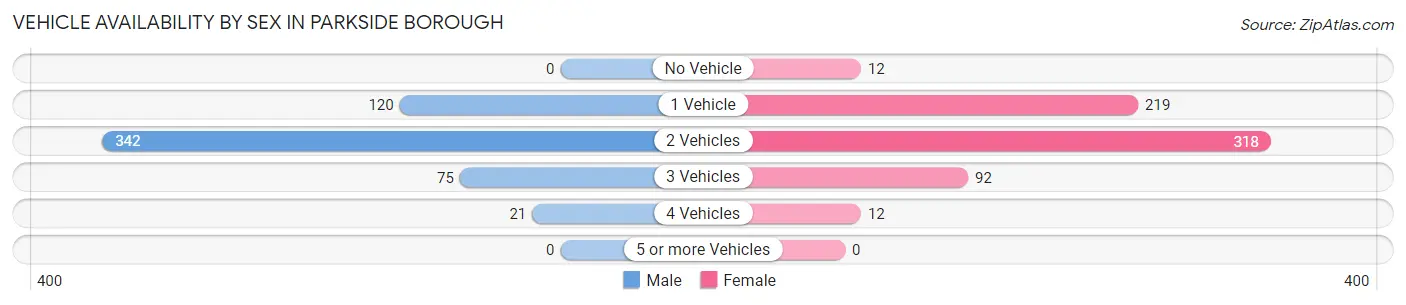
| Vehicles Available | Male | Female |
| No Vehicle | 0 (0.0%) | 12 (1.8%) |
| 1 Vehicle | 120 (21.5%) | 219 (33.5%) |
| 2 Vehicles | 342 (61.3%) | 318 (48.7%) |
| 3 Vehicles | 75 (13.4%) | 92 (14.1%) |
| 4 Vehicles | 21 (3.8%) | 12 (1.8%) |
| 5 or more Vehicles | 0 (0.0%) | 0 (0.0%) |
| Total | 558 (100.0%) | 653 (100.0%) |
Commute Time in Parkside borough
The most frequently occuring commute durations in Parkside borough are 15 to 19 minutes (277 commuters, 26.9%), 5 to 9 minutes (123 commuters, 11.9%), and 35 to 39 minutes (95 commuters, 9.2%).
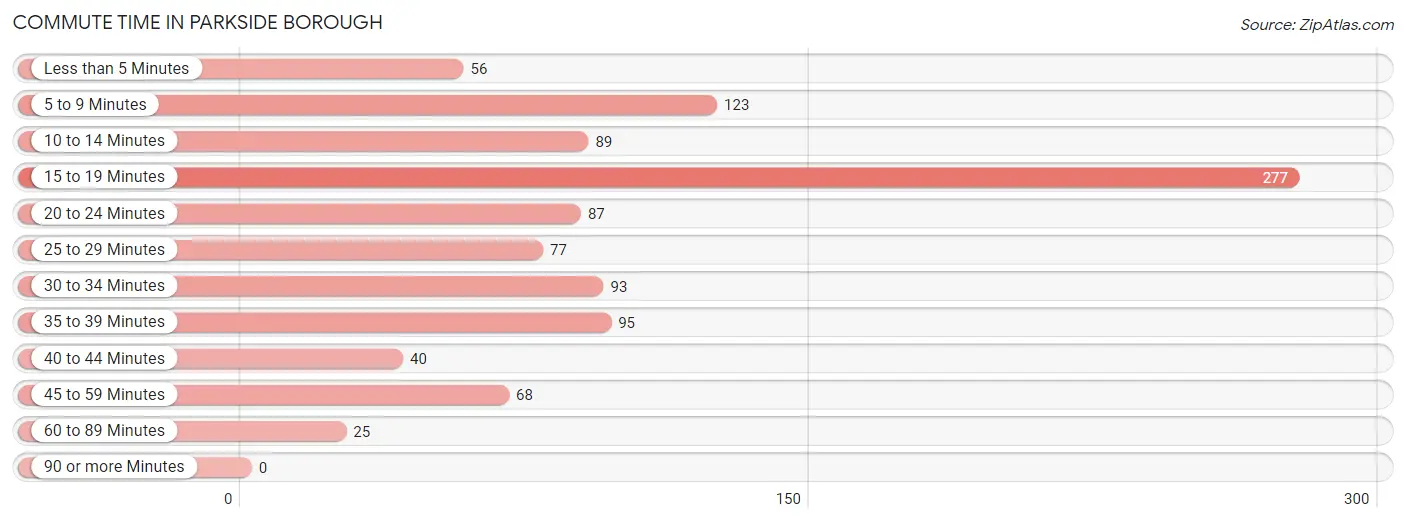
| Commute Time | # Commuters | % Commuters |
| Less than 5 Minutes | 56 | 5.4% |
| 5 to 9 Minutes | 123 | 11.9% |
| 10 to 14 Minutes | 89 | 8.6% |
| 15 to 19 Minutes | 277 | 26.9% |
| 20 to 24 Minutes | 87 | 8.5% |
| 25 to 29 Minutes | 77 | 7.5% |
| 30 to 34 Minutes | 93 | 9.0% |
| 35 to 39 Minutes | 95 | 9.2% |
| 40 to 44 Minutes | 40 | 3.9% |
| 45 to 59 Minutes | 68 | 6.6% |
| 60 to 89 Minutes | 25 | 2.4% |
| 90 or more Minutes | 0 | 0.0% |
Commute Time by Sex in Parkside borough
The most common commute times in Parkside borough are 15 to 19 minutes (175 commuters, 34.9%) for males and 15 to 19 minutes (102 commuters, 19.3%) for females.
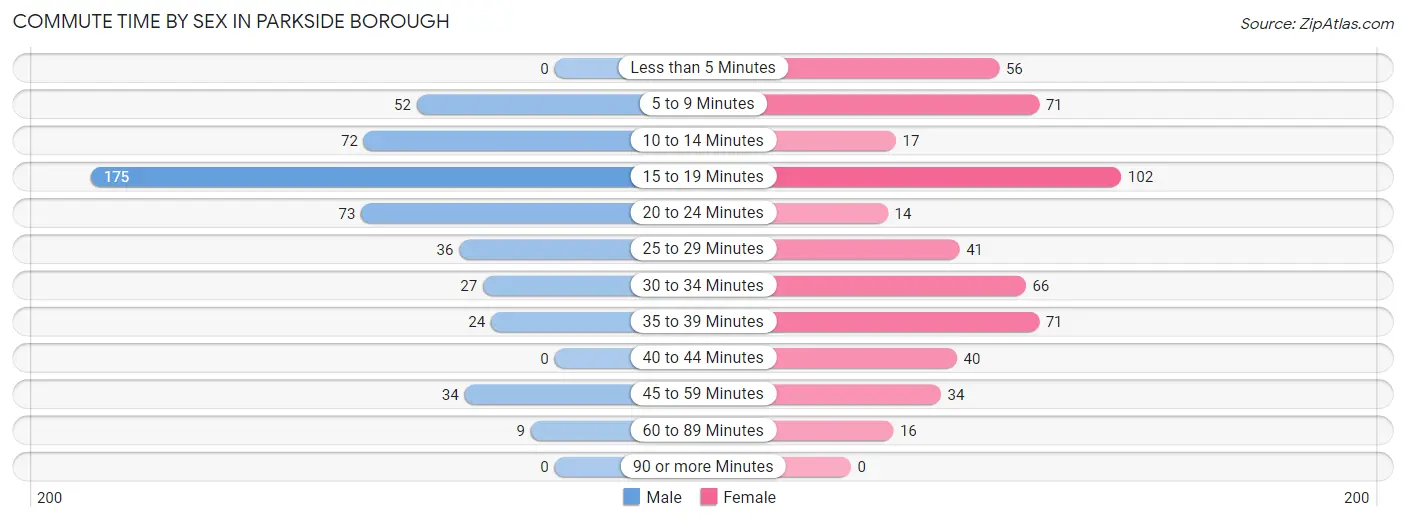
| Commute Time | Male | Female |
| Less than 5 Minutes | 0 (0.0%) | 56 (10.6%) |
| 5 to 9 Minutes | 52 (10.4%) | 71 (13.5%) |
| 10 to 14 Minutes | 72 (14.3%) | 17 (3.2%) |
| 15 to 19 Minutes | 175 (34.9%) | 102 (19.3%) |
| 20 to 24 Minutes | 73 (14.5%) | 14 (2.6%) |
| 25 to 29 Minutes | 36 (7.2%) | 41 (7.8%) |
| 30 to 34 Minutes | 27 (5.4%) | 66 (12.5%) |
| 35 to 39 Minutes | 24 (4.8%) | 71 (13.5%) |
| 40 to 44 Minutes | 0 (0.0%) | 40 (7.6%) |
| 45 to 59 Minutes | 34 (6.8%) | 34 (6.4%) |
| 60 to 89 Minutes | 9 (1.8%) | 16 (3.0%) |
| 90 or more Minutes | 0 (0.0%) | 0 (0.0%) |
Time of Departure to Work by Sex in Parkside borough
The most frequent times of departure to work in Parkside borough are 4:00 PM to 11:59 PM (100, 19.9%) for males and 7:30 AM to 7:59 AM (81, 15.3%) for females.
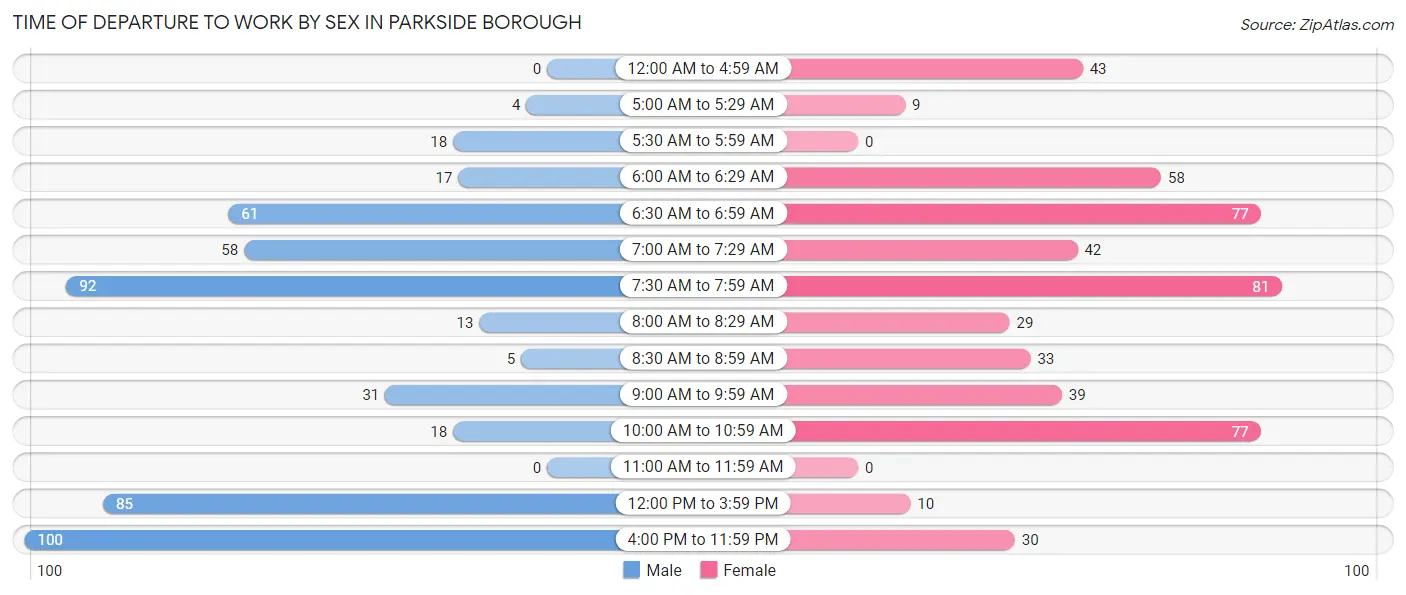
| Time of Departure | Male | Female |
| 12:00 AM to 4:59 AM | 0 (0.0%) | 43 (8.1%) |
| 5:00 AM to 5:29 AM | 4 (0.8%) | 9 (1.7%) |
| 5:30 AM to 5:59 AM | 18 (3.6%) | 0 (0.0%) |
| 6:00 AM to 6:29 AM | 17 (3.4%) | 58 (11.0%) |
| 6:30 AM to 6:59 AM | 61 (12.1%) | 77 (14.6%) |
| 7:00 AM to 7:29 AM | 58 (11.6%) | 42 (8.0%) |
| 7:30 AM to 7:59 AM | 92 (18.3%) | 81 (15.3%) |
| 8:00 AM to 8:29 AM | 13 (2.6%) | 29 (5.5%) |
| 8:30 AM to 8:59 AM | 5 (1.0%) | 33 (6.2%) |
| 9:00 AM to 9:59 AM | 31 (6.2%) | 39 (7.4%) |
| 10:00 AM to 10:59 AM | 18 (3.6%) | 77 (14.6%) |
| 11:00 AM to 11:59 AM | 0 (0.0%) | 0 (0.0%) |
| 12:00 PM to 3:59 PM | 85 (16.9%) | 10 (1.9%) |
| 4:00 PM to 11:59 PM | 100 (19.9%) | 30 (5.7%) |
| Total | 502 (100.0%) | 528 (100.0%) |
Housing Occupancy in Parkside borough
Occupancy by Ownership in Parkside borough
Of the total 765 dwellings in Parkside borough, owner-occupied units account for 560 (73.2%), while renter-occupied units make up 205 (26.8%).
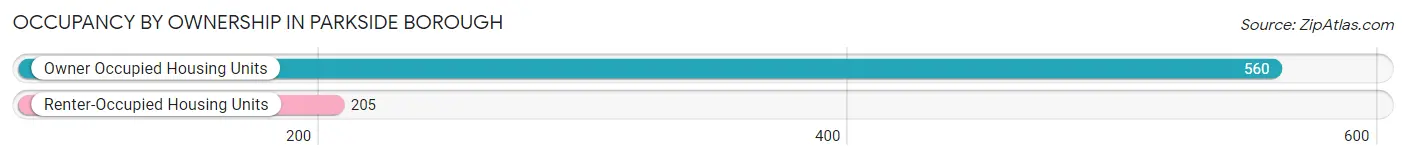
| Occupancy | # Housing Units | % Housing Units |
| Owner Occupied Housing Units | 560 | 73.2% |
| Renter-Occupied Housing Units | 205 | 26.8% |
| Total Occupied Housing Units | 765 | 100.0% |
Occupancy by Household Size in Parkside borough
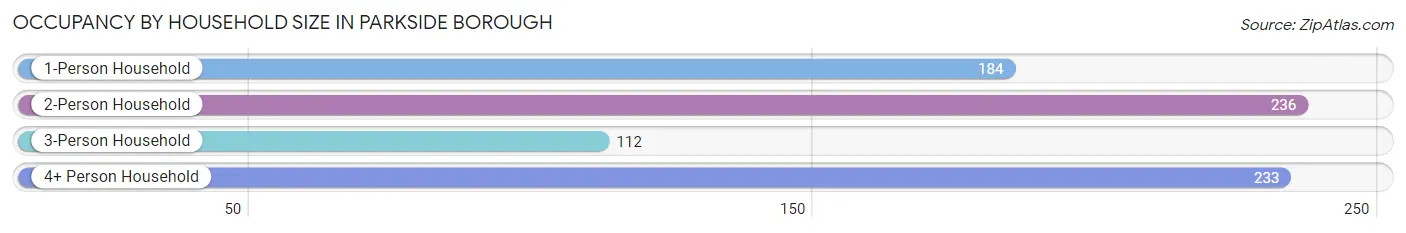
| Household Size | # Housing Units | % Housing Units |
| 1-Person Household | 184 | 24.0% |
| 2-Person Household | 236 | 30.8% |
| 3-Person Household | 112 | 14.6% |
| 4+ Person Household | 233 | 30.5% |
| Total Housing Units | 765 | 100.0% |
Occupancy by Ownership by Household Size in Parkside borough
| Household Size | Owner-occupied | Renter-occupied |
| 1-Person Household | 126 (68.5%) | 58 (31.5%) |
| 2-Person Household | 124 (52.5%) | 112 (47.5%) |
| 3-Person Household | 94 (83.9%) | 18 (16.1%) |
| 4+ Person Household | 216 (92.7%) | 17 (7.3%) |
| Total Housing Units | 560 (73.2%) | 205 (26.8%) |
Occupancy by Educational Attainment in Parkside borough
| Household Size | Owner-occupied | Renter-occupied |
| Less than High School | 21 (100.0%) | 0 (0.0%) |
| High School Diploma | 165 (64.7%) | 90 (35.3%) |
| College/Associate Degree | 215 (67.0%) | 106 (33.0%) |
| Bachelor's Degree or higher | 159 (94.6%) | 9 (5.4%) |
Occupancy by Age of Householder in Parkside borough
| Age Bracket | # Households | % Households |
| Under 35 Years | 149 | 19.5% |
| 35 to 44 Years | 152 | 19.9% |
| 45 to 54 Years | 233 | 30.5% |
| 55 to 64 Years | 135 | 17.6% |
| 65 to 74 Years | 66 | 8.6% |
| 75 to 84 Years | 23 | 3.0% |
| 85 Years and Over | 7 | 0.9% |
| Total | 765 | 100.0% |
Housing Finances in Parkside borough
Median Income by Occupancy in Parkside borough
| Occupancy Type | # Households | Median Income |
| Owner-Occupied | 560 (73.2%) | $98,846 |
| Renter-Occupied | 205 (26.8%) | $38,384 |
| Average | 765 (100.0%) | $86,587 |
Occupancy by Householder Income Bracket in Parkside borough
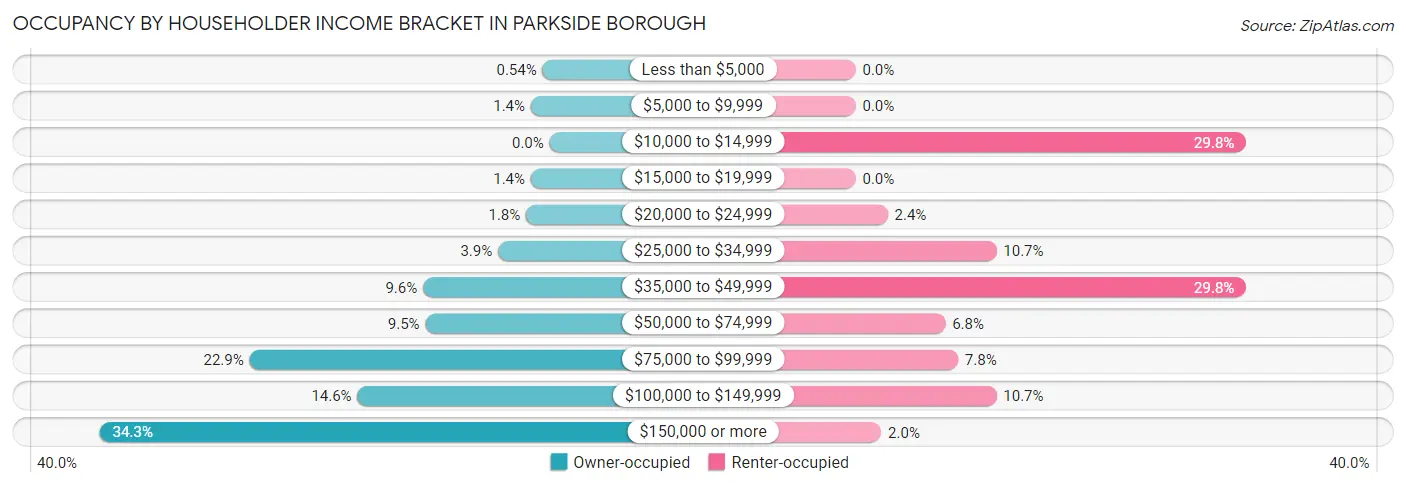
| Income Bracket | Owner-occupied | Renter-occupied |
| Less than $5,000 | 3 (0.5%) | 0 (0.0%) |
| $5,000 to $9,999 | 8 (1.4%) | 0 (0.0%) |
| $10,000 to $14,999 | 0 (0.0%) | 61 (29.8%) |
| $15,000 to $19,999 | 8 (1.4%) | 0 (0.0%) |
| $20,000 to $24,999 | 10 (1.8%) | 5 (2.4%) |
| $25,000 to $34,999 | 22 (3.9%) | 22 (10.7%) |
| $35,000 to $49,999 | 54 (9.6%) | 61 (29.8%) |
| $50,000 to $74,999 | 53 (9.5%) | 14 (6.8%) |
| $75,000 to $99,999 | 128 (22.9%) | 16 (7.8%) |
| $100,000 to $149,999 | 82 (14.6%) | 22 (10.7%) |
| $150,000 or more | 192 (34.3%) | 4 (1.9%) |
| Total | 560 (100.0%) | 205 (100.0%) |
Monthly Housing Cost Tiers in Parkside borough
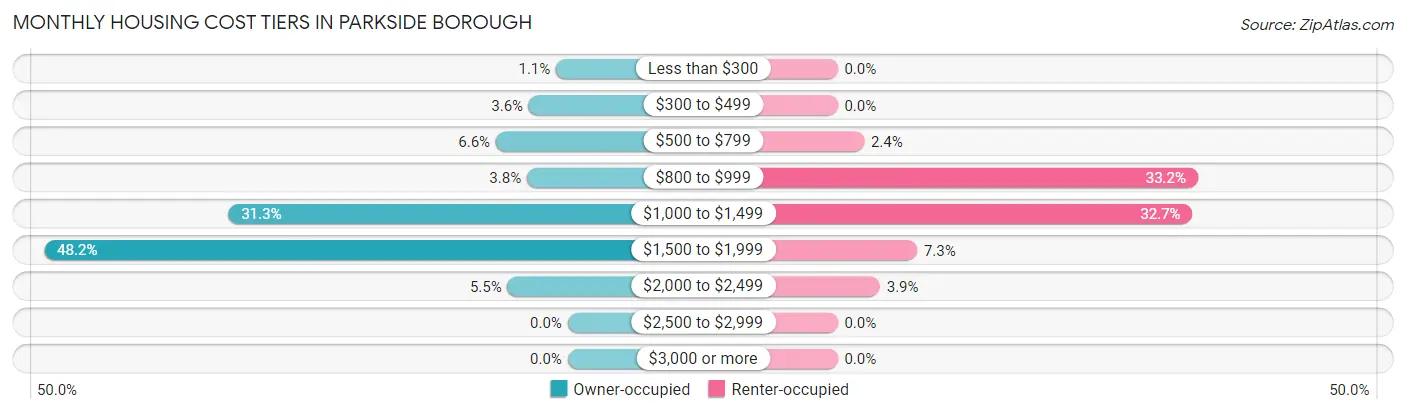
| Monthly Cost | Owner-occupied | Renter-occupied |
| Less than $300 | 6 (1.1%) | 0 (0.0%) |
| $300 to $499 | 20 (3.6%) | 0 (0.0%) |
| $500 to $799 | 37 (6.6%) | 5 (2.4%) |
| $800 to $999 | 21 (3.7%) | 68 (33.2%) |
| $1,000 to $1,499 | 175 (31.2%) | 67 (32.7%) |
| $1,500 to $1,999 | 270 (48.2%) | 15 (7.3%) |
| $2,000 to $2,499 | 31 (5.5%) | 8 (3.9%) |
| $2,500 to $2,999 | 0 (0.0%) | 0 (0.0%) |
| $3,000 or more | 0 (0.0%) | 0 (0.0%) |
| Total | 560 (100.0%) | 205 (100.0%) |
Physical Housing Characteristics in Parkside borough
Housing Structures in Parkside borough
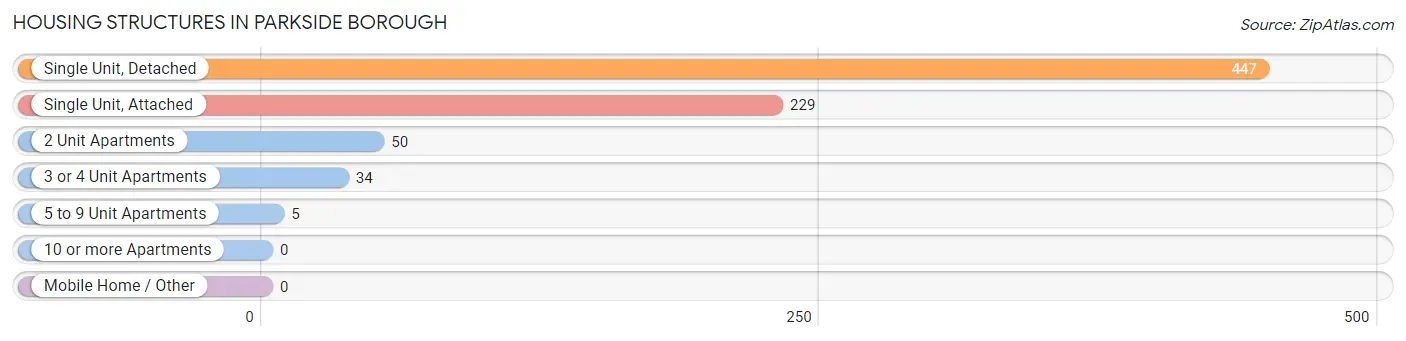
| Structure Type | # Housing Units | % Housing Units |
| Single Unit, Detached | 447 | 58.4% |
| Single Unit, Attached | 229 | 29.9% |
| 2 Unit Apartments | 50 | 6.5% |
| 3 or 4 Unit Apartments | 34 | 4.4% |
| 5 to 9 Unit Apartments | 5 | 0.6% |
| 10 or more Apartments | 0 | 0.0% |
| Mobile Home / Other | 0 | 0.0% |
| Total | 765 | 100.0% |
Housing Structures by Occupancy in Parkside borough
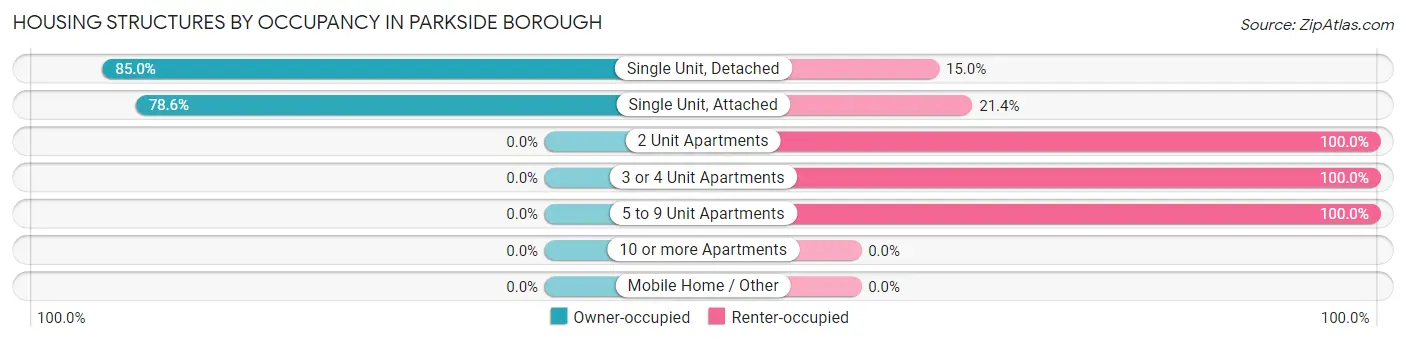
| Structure Type | Owner-occupied | Renter-occupied |
| Single Unit, Detached | 380 (85.0%) | 67 (15.0%) |
| Single Unit, Attached | 180 (78.6%) | 49 (21.4%) |
| 2 Unit Apartments | 0 (0.0%) | 50 (100.0%) |
| 3 or 4 Unit Apartments | 0 (0.0%) | 34 (100.0%) |
| 5 to 9 Unit Apartments | 0 (0.0%) | 5 (100.0%) |
| 10 or more Apartments | 0 (0.0%) | 0 (0.0%) |
| Mobile Home / Other | 0 (0.0%) | 0 (0.0%) |
| Total | 560 (73.2%) | 205 (26.8%) |
Housing Structures by Number of Rooms in Parkside borough
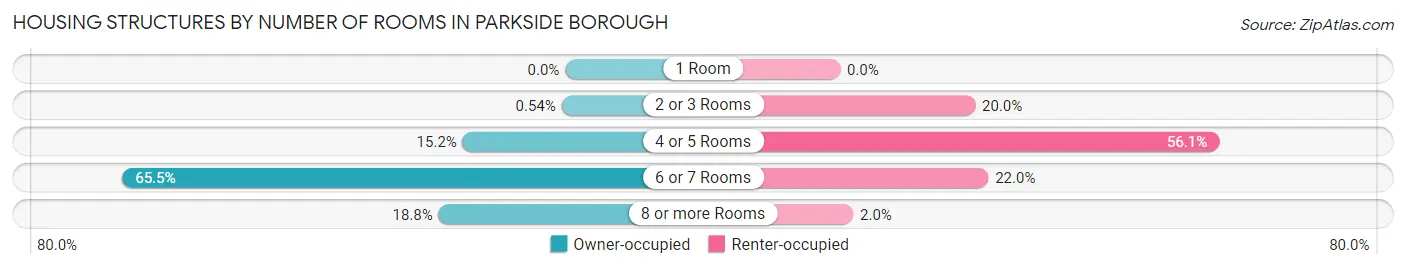
| Number of Rooms | Owner-occupied | Renter-occupied |
| 1 Room | 0 (0.0%) | 0 (0.0%) |
| 2 or 3 Rooms | 3 (0.5%) | 41 (20.0%) |
| 4 or 5 Rooms | 85 (15.2%) | 115 (56.1%) |
| 6 or 7 Rooms | 367 (65.5%) | 45 (22.0%) |
| 8 or more Rooms | 105 (18.8%) | 4 (1.9%) |
| Total | 560 (100.0%) | 205 (100.0%) |
Housing Structure by Heating Type in Parkside borough
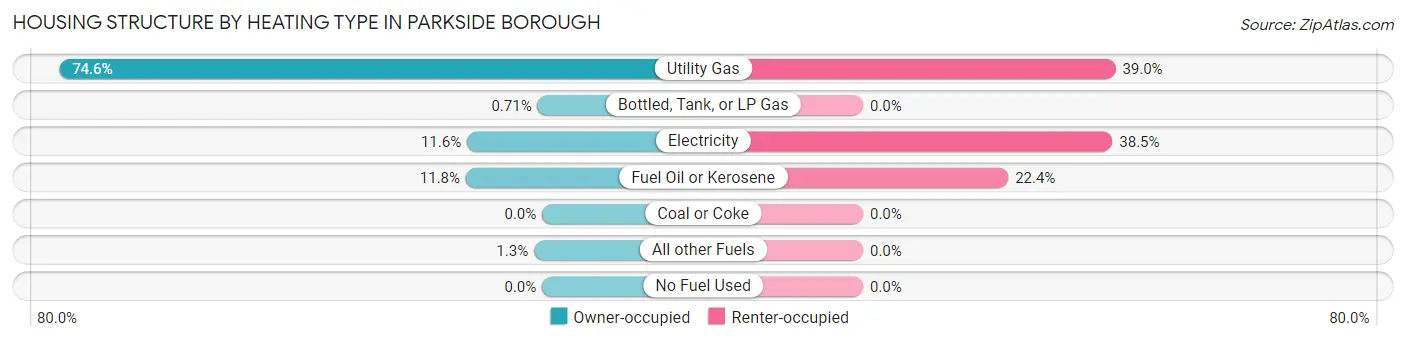
| Heating Type | Owner-occupied | Renter-occupied |
| Utility Gas | 418 (74.6%) | 80 (39.0%) |
| Bottled, Tank, or LP Gas | 4 (0.7%) | 0 (0.0%) |
| Electricity | 65 (11.6%) | 79 (38.5%) |
| Fuel Oil or Kerosene | 66 (11.8%) | 46 (22.4%) |
| Coal or Coke | 0 (0.0%) | 0 (0.0%) |
| All other Fuels | 7 (1.3%) | 0 (0.0%) |
| No Fuel Used | 0 (0.0%) | 0 (0.0%) |
| Total | 560 (100.0%) | 205 (100.0%) |
Household Vehicle Usage in Parkside borough
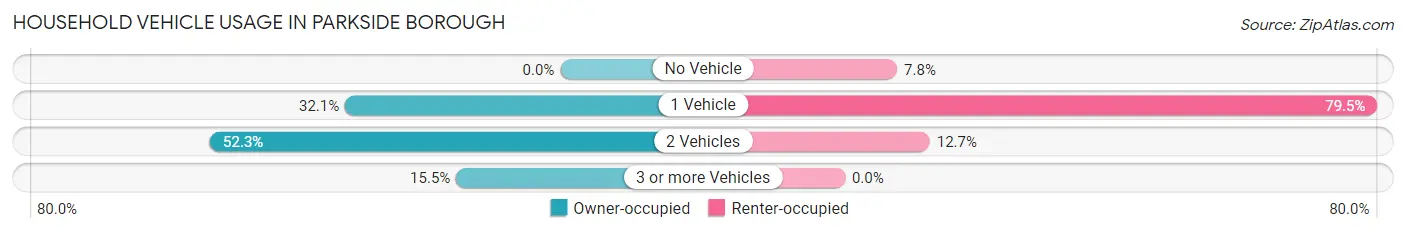
| Vehicles per Household | Owner-occupied | Renter-occupied |
| No Vehicle | 0 (0.0%) | 16 (7.8%) |
| 1 Vehicle | 180 (32.1%) | 163 (79.5%) |
| 2 Vehicles | 293 (52.3%) | 26 (12.7%) |
| 3 or more Vehicles | 87 (15.5%) | 0 (0.0%) |
| Total | 560 (100.0%) | 205 (100.0%) |
Real Estate & Mortgages in Parkside borough
Real Estate and Mortgage Overview in Parkside borough
| Characteristic | Without Mortgage | With Mortgage |
| Housing Units | 75 | 485 |
| Median Property Value | $167,400 | $181,200 |
| Median Household Income | - | - |
| Monthly Housing Costs | $608 | $0 |
| Real Estate Taxes | $3,411 | $7 |
Property Value by Mortgage Status in Parkside borough
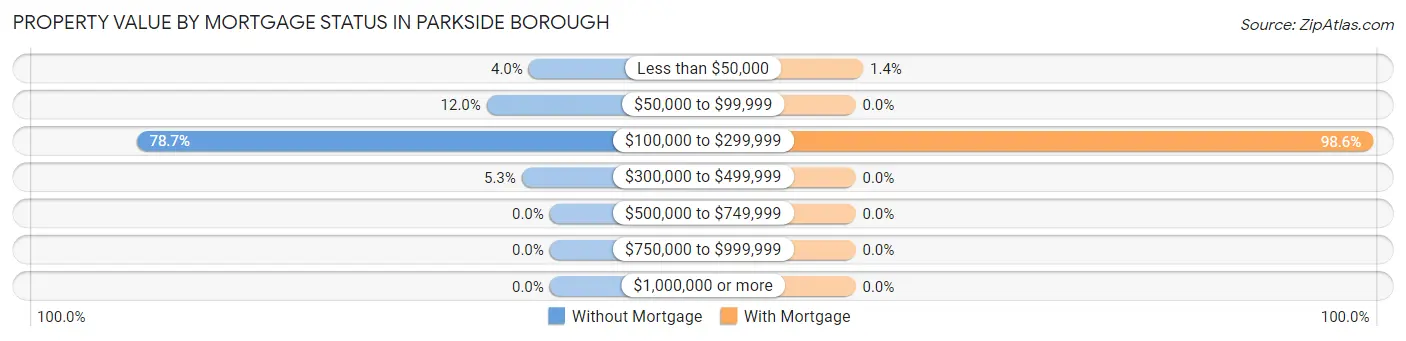
| Property Value | Without Mortgage | With Mortgage |
| Less than $50,000 | 3 (4.0%) | 7 (1.4%) |
| $50,000 to $99,999 | 9 (12.0%) | 0 (0.0%) |
| $100,000 to $299,999 | 59 (78.7%) | 478 (98.6%) |
| $300,000 to $499,999 | 4 (5.3%) | 0 (0.0%) |
| $500,000 to $749,999 | 0 (0.0%) | 0 (0.0%) |
| $750,000 to $999,999 | 0 (0.0%) | 0 (0.0%) |
| $1,000,000 or more | 0 (0.0%) | 0 (0.0%) |
| Total | 75 (100.0%) | 485 (100.0%) |
Household Income by Mortgage Status in Parkside borough
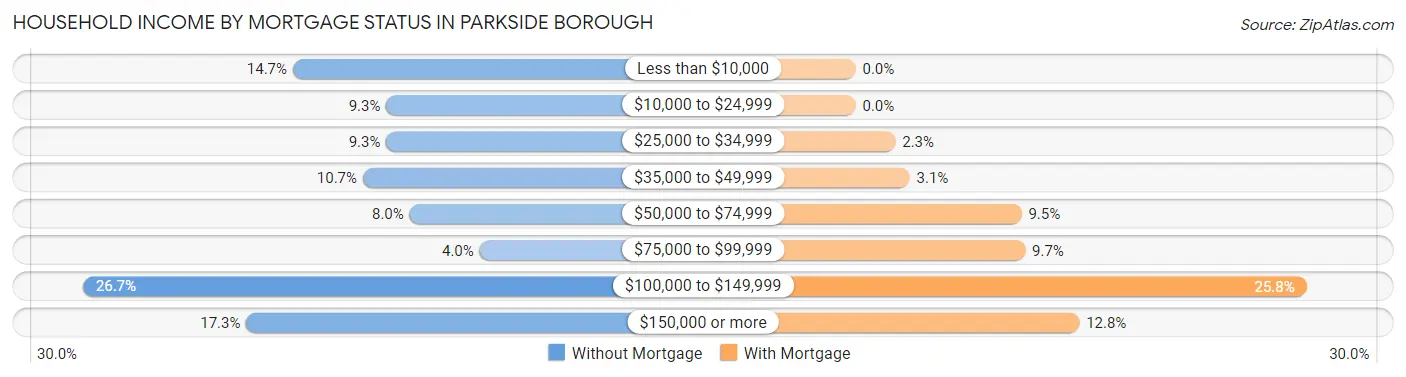
| Household Income | Without Mortgage | With Mortgage |
| Less than $10,000 | 11 (14.7%) | 0 (0.0%) |
| $10,000 to $24,999 | 7 (9.3%) | 0 (0.0%) |
| $25,000 to $34,999 | 7 (9.3%) | 11 (2.3%) |
| $35,000 to $49,999 | 8 (10.7%) | 15 (3.1%) |
| $50,000 to $74,999 | 6 (8.0%) | 46 (9.5%) |
| $75,000 to $99,999 | 3 (4.0%) | 47 (9.7%) |
| $100,000 to $149,999 | 20 (26.7%) | 125 (25.8%) |
| $150,000 or more | 13 (17.3%) | 62 (12.8%) |
| Total | 75 (100.0%) | 485 (100.0%) |
Property Value to Household Income Ratio in Parkside borough
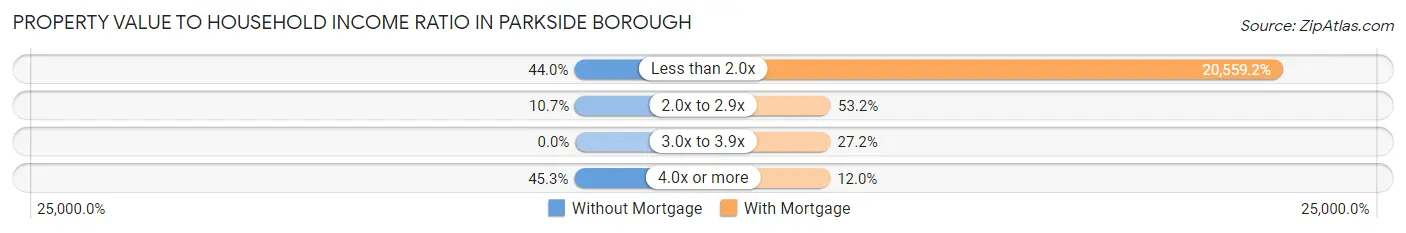
| Value-to-Income Ratio | Without Mortgage | With Mortgage |
| Less than 2.0x | 33 (44.0%) | 99,712 (20,559.2%) |
| 2.0x to 2.9x | 8 (10.7%) | 258 (53.2%) |
| 3.0x to 3.9x | 0 (0.0%) | 132 (27.2%) |
| 4.0x or more | 34 (45.3%) | 58 (12.0%) |
| Total | 75 (100.0%) | 485 (100.0%) |
Real Estate Taxes by Mortgage Status in Parkside borough
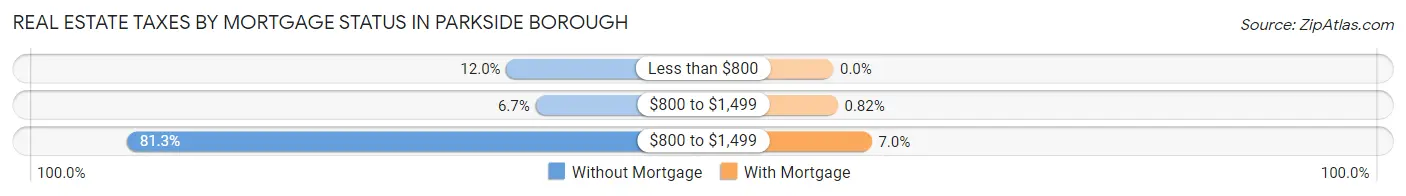
| Property Taxes | Without Mortgage | With Mortgage |
| Less than $800 | 9 (12.0%) | 0 (0.0%) |
| $800 to $1,499 | 5 (6.7%) | 4 (0.8%) |
| $800 to $1,499 | 61 (81.3%) | 34 (7.0%) |
| Total | 75 (100.0%) | 485 (100.0%) |
Health & Disability in Parkside borough
Health Insurance Coverage by Age in Parkside borough
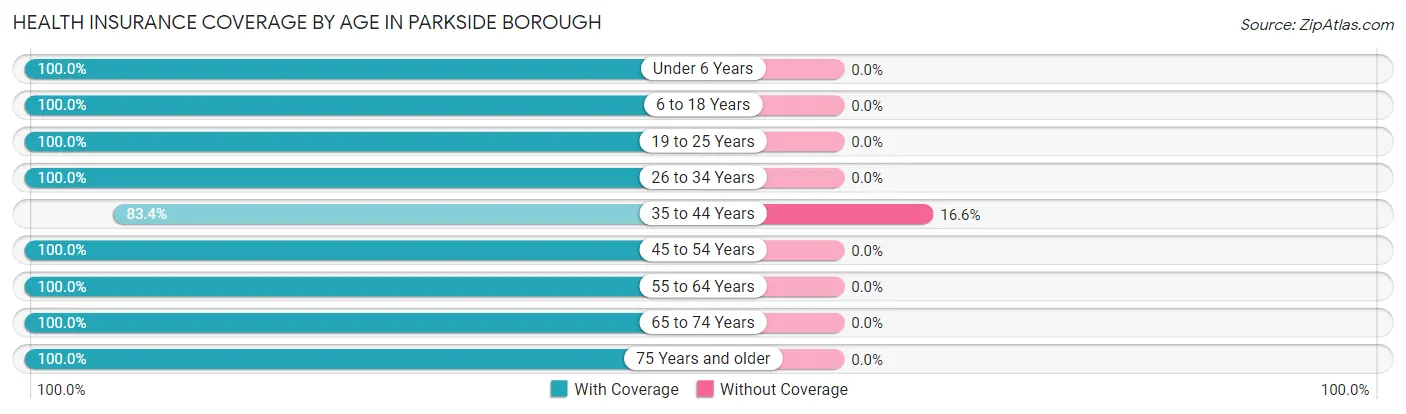
| Age Bracket | With Coverage | Without Coverage |
| Under 6 Years | 104 (100.0%) | 0 (0.0%) |
| 6 to 18 Years | 430 (100.0%) | 0 (0.0%) |
| 19 to 25 Years | 263 (100.0%) | 0 (0.0%) |
| 26 to 34 Years | 238 (100.0%) | 0 (0.0%) |
| 35 to 44 Years | 196 (83.4%) | 39 (16.6%) |
| 45 to 54 Years | 403 (100.0%) | 0 (0.0%) |
| 55 to 64 Years | 227 (100.0%) | 0 (0.0%) |
| 65 to 74 Years | 114 (100.0%) | 0 (0.0%) |
| 75 Years and older | 38 (100.0%) | 0 (0.0%) |
| Total | 2,013 (98.1%) | 39 (1.9%) |
Health Insurance Coverage by Citizenship Status in Parkside borough
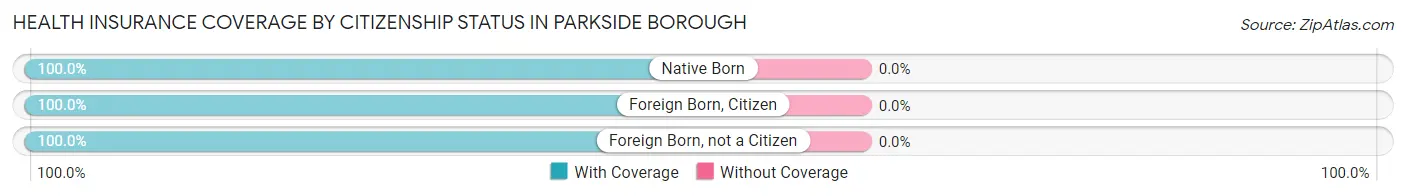
| Citizenship Status | With Coverage | Without Coverage |
| Native Born | 104 (100.0%) | 0 (0.0%) |
| Foreign Born, Citizen | 430 (100.0%) | 0 (0.0%) |
| Foreign Born, not a Citizen | 263 (100.0%) | 0 (0.0%) |
Health Insurance Coverage by Household Income in Parkside borough
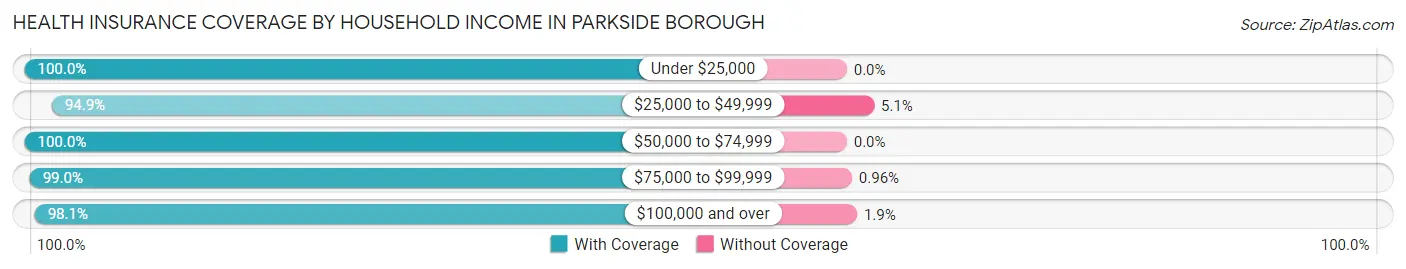
| Household Income | With Coverage | Without Coverage |
| Under $25,000 | 182 (100.0%) | 0 (0.0%) |
| $25,000 to $49,999 | 278 (94.9%) | 15 (5.1%) |
| $50,000 to $74,999 | 158 (100.0%) | 0 (0.0%) |
| $75,000 to $99,999 | 308 (99.0%) | 3 (1.0%) |
| $100,000 and over | 1,087 (98.1%) | 21 (1.9%) |
Public vs Private Health Insurance Coverage by Age in Parkside borough
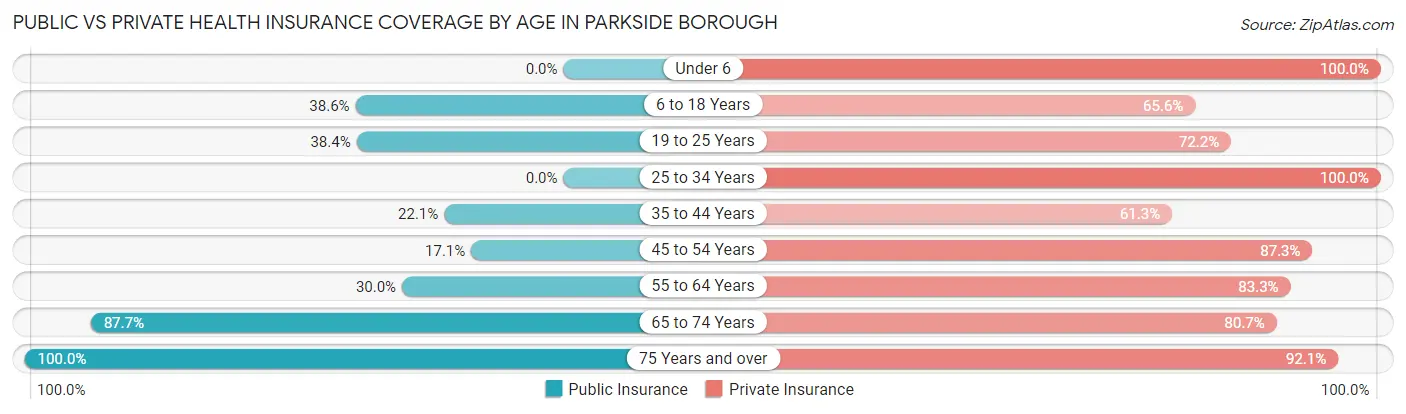
| Age Bracket | Public Insurance | Private Insurance |
| Under 6 | 0 (0.0%) | 104 (100.0%) |
| 6 to 18 Years | 166 (38.6%) | 282 (65.6%) |
| 19 to 25 Years | 101 (38.4%) | 190 (72.2%) |
| 25 to 34 Years | 0 (0.0%) | 238 (100.0%) |
| 35 to 44 Years | 52 (22.1%) | 144 (61.3%) |
| 45 to 54 Years | 69 (17.1%) | 352 (87.3%) |
| 55 to 64 Years | 68 (30.0%) | 189 (83.3%) |
| 65 to 74 Years | 100 (87.7%) | 92 (80.7%) |
| 75 Years and over | 38 (100.0%) | 35 (92.1%) |
| Total | 594 (28.9%) | 1,626 (79.2%) |
Disability Status by Sex by Age in Parkside borough
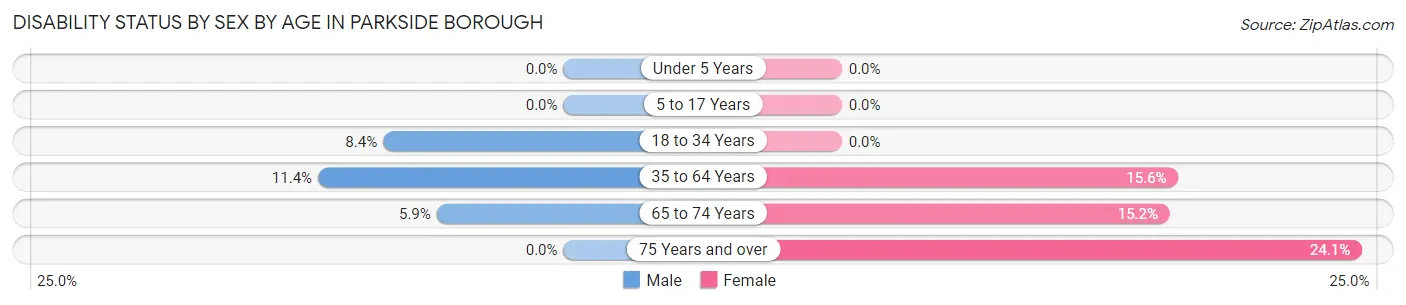
| Age Bracket | Male | Female |
| Under 5 Years | 0 (0.0%) | 0 (0.0%) |
| 5 to 17 Years | 0 (0.0%) | 0 (0.0%) |
| 18 to 34 Years | 17 (8.4%) | 0 (0.0%) |
| 35 to 64 Years | 46 (11.4%) | 72 (15.6%) |
| 65 to 74 Years | 4 (5.9%) | 7 (15.2%) |
| 75 Years and over | 0 (0.0%) | 7 (24.1%) |
Disability Class by Sex by Age in Parkside borough
Disability Class: Hearing Difficulty
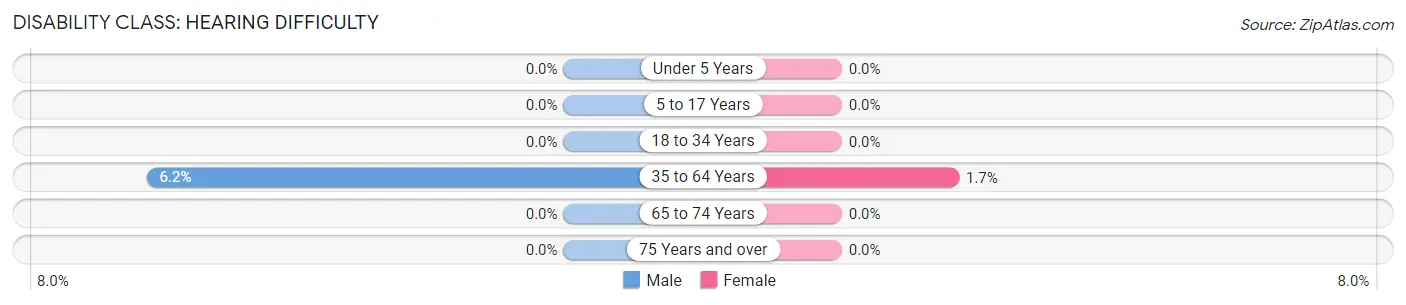
| Age Bracket | Male | Female |
| Under 5 Years | 0 (0.0%) | 0 (0.0%) |
| 5 to 17 Years | 0 (0.0%) | 0 (0.0%) |
| 18 to 34 Years | 0 (0.0%) | 0 (0.0%) |
| 35 to 64 Years | 25 (6.2%) | 8 (1.7%) |
| 65 to 74 Years | 0 (0.0%) | 0 (0.0%) |
| 75 Years and over | 0 (0.0%) | 0 (0.0%) |
Disability Class: Vision Difficulty
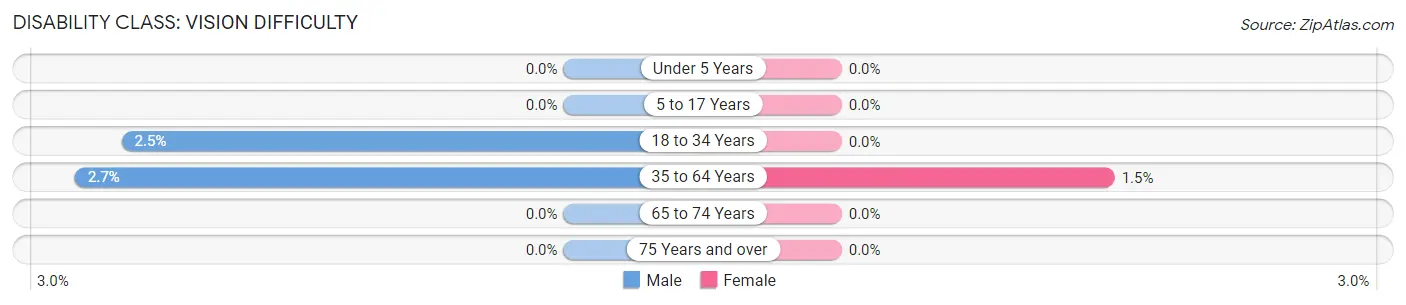
| Age Bracket | Male | Female |
| Under 5 Years | 0 (0.0%) | 0 (0.0%) |
| 5 to 17 Years | 0 (0.0%) | 0 (0.0%) |
| 18 to 34 Years | 5 (2.5%) | 0 (0.0%) |
| 35 to 64 Years | 11 (2.7%) | 7 (1.5%) |
| 65 to 74 Years | 0 (0.0%) | 0 (0.0%) |
| 75 Years and over | 0 (0.0%) | 0 (0.0%) |
Disability Class: Cognitive Difficulty
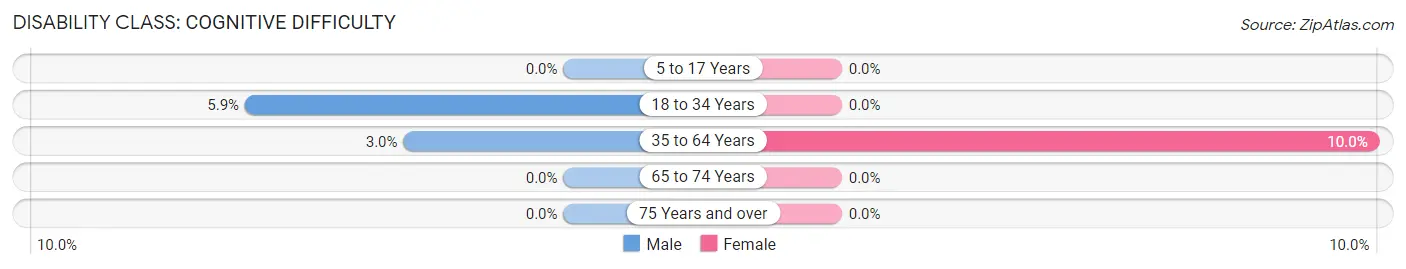
| Age Bracket | Male | Female |
| 5 to 17 Years | 0 (0.0%) | 0 (0.0%) |
| 18 to 34 Years | 12 (5.9%) | 0 (0.0%) |
| 35 to 64 Years | 12 (3.0%) | 46 (10.0%) |
| 65 to 74 Years | 0 (0.0%) | 0 (0.0%) |
| 75 Years and over | 0 (0.0%) | 0 (0.0%) |
Disability Class: Ambulatory Difficulty
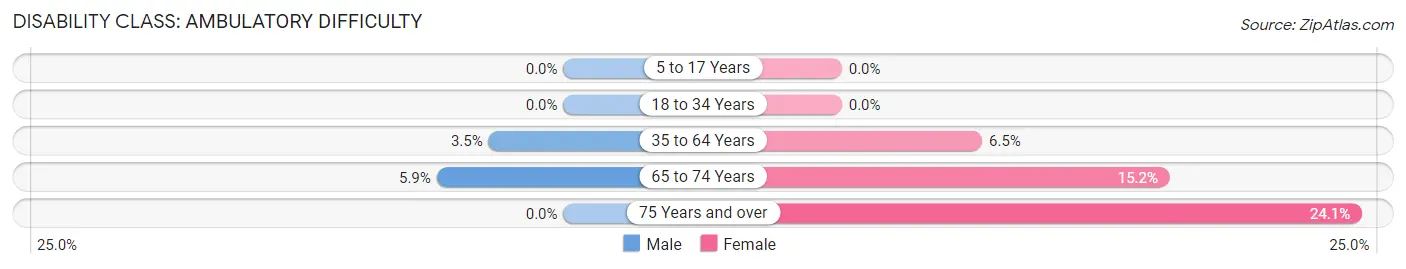
| Age Bracket | Male | Female |
| 5 to 17 Years | 0 (0.0%) | 0 (0.0%) |
| 18 to 34 Years | 0 (0.0%) | 0 (0.0%) |
| 35 to 64 Years | 14 (3.5%) | 30 (6.5%) |
| 65 to 74 Years | 4 (5.9%) | 7 (15.2%) |
| 75 Years and over | 0 (0.0%) | 7 (24.1%) |
Disability Class: Self-Care Difficulty
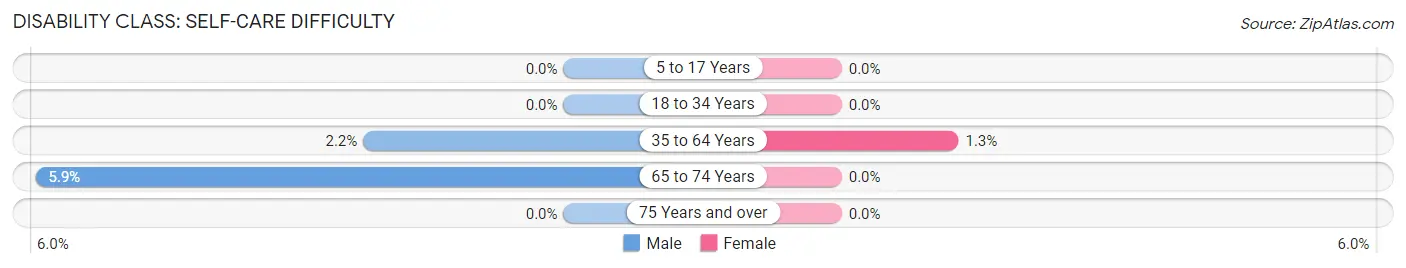
| Age Bracket | Male | Female |
| 5 to 17 Years | 0 (0.0%) | 0 (0.0%) |
| 18 to 34 Years | 0 (0.0%) | 0 (0.0%) |
| 35 to 64 Years | 9 (2.2%) | 6 (1.3%) |
| 65 to 74 Years | 4 (5.9%) | 0 (0.0%) |
| 75 Years and over | 0 (0.0%) | 0 (0.0%) |
Technology Access in Parkside borough
Computing Device Access in Parkside borough
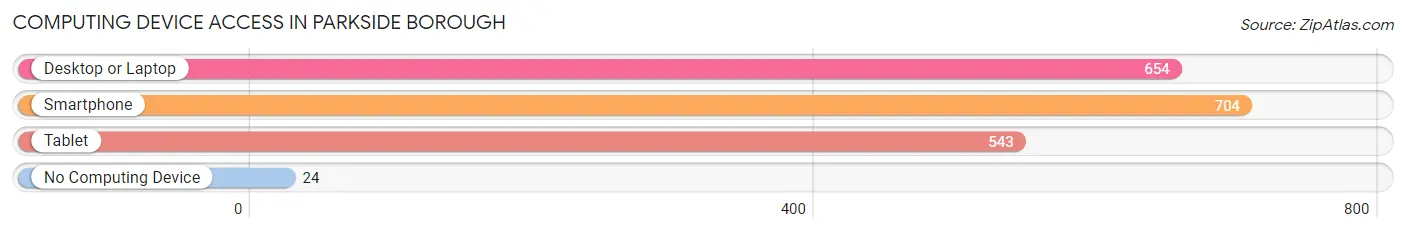
| Device Type | # Households | % Households |
| Desktop or Laptop | 654 | 85.5% |
| Smartphone | 704 | 92.0% |
| Tablet | 543 | 71.0% |
| No Computing Device | 24 | 3.1% |
| Total | 765 | 100.0% |
Internet Access in Parkside borough
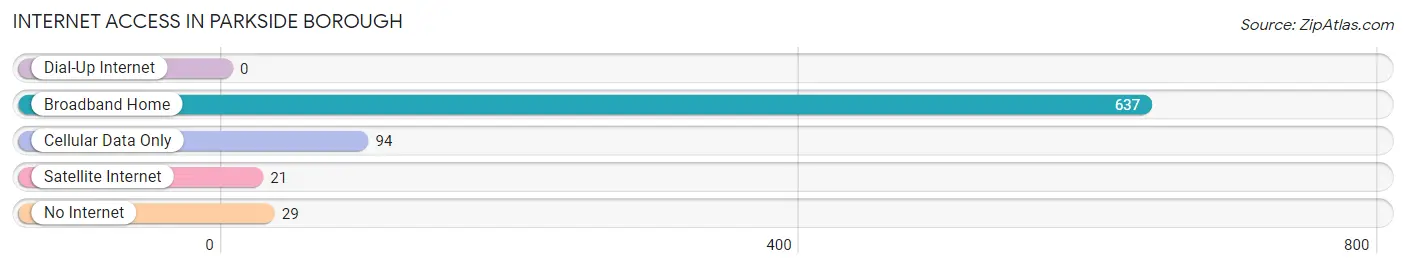
| Internet Type | # Households | % Households |
| Dial-Up Internet | 0 | 0.0% |
| Broadband Home | 637 | 83.3% |
| Cellular Data Only | 94 | 12.3% |
| Satellite Internet | 21 | 2.8% |
| No Internet | 29 | 3.8% |
| Total | 765 | 100.0% |
Parkside borough Summary
Parkside Borough is a small borough located in Delaware County, Pennsylvania. It is situated in the southeastern corner of the county, just north of the city of Philadelphia. The borough is bordered by the boroughs of Ridley Park, Prospect Park, and Norwood, as well as the townships of Nether Providence and Upper Providence. The population of Parkside Borough was 4,845 at the 2010 census.
History
Parkside Borough was originally part of Nether Providence Township, which was established in 1687. The area was first settled in the late 1700s, and the first post office was established in 1851. In 1876, the area was incorporated as a borough, and it was named Parkside in honor of the many parks and green spaces in the area.
Geography
Parkside Borough is located at 39°54'45" North, 75°19'45" West (39.912500, -75.329167). It has a total area of 0.7 square miles, all of which is land. The borough is located in the southeastern corner of Delaware County, just north of the city of Philadelphia. It is bordered by the boroughs of Ridley Park, Prospect Park, and Norwood, as well as the townships of Nether Providence and Upper Providence.
Economy
The economy of Parkside Borough is largely based on small businesses and retail. The borough is home to several small businesses, including restaurants, shops, and professional services. The borough also has a few larger employers, such as the Parkside Shopping Center and the Parkside Industrial Park.
Demographics
As of the 2010 census, there were 4,845 people, 1,945 households, and 1,269 families residing in the borough. The population density was 6,945.3 people per square mile. The racial makeup of the borough was 79.2% White, 13.2% African American, 0.2% Native American, 2.3% Asian, 0.1% Pacific Islander, 2.7% from other races, and 2.3% from two or more races. Hispanic or Latino of any race were 5.3% of the population.
The median income for a household in the borough was $50,972, and the median income for a family was $62,857. The per capita income for the borough was $25,945. About 6.2% of families and 8.2% of the population were below the poverty line, including 10.2% of those under age 18 and 6.2% of those age 65 or over.
Common Questions
What is Per Capita Income in Parkside borough?
Per Capita income in Parkside borough is $39,374.
What is the Median Family Income in Parkside borough?
Median Family Income in Parkside borough is $98,462.
What is the Median Household income in Parkside borough?
Median Household Income in Parkside borough is $86,587.
What is Income or Wage Gap in Parkside borough?
Income or Wage Gap in Parkside borough is 41.7%.
Women in Parkside borough earn 58.3 cents for every dollar earned by a man.
What is Inequality or Gini Index in Parkside borough?
Inequality or Gini Index in Parkside borough is 0.43.
What is the Total Population of Parkside borough?
Total Population of Parkside borough is 2,052.
What is the Total Male Population of Parkside borough?
Total Male Population of Parkside borough is 892.
What is the Total Female Population of Parkside borough?
Total Female Population of Parkside borough is 1,160.
What is the Ratio of Males per 100 Females in Parkside borough?
There are 76.90 Males per 100 Females in Parkside borough.
What is the Ratio of Females per 100 Males in Parkside borough?
There are 130.04 Females per 100 Males in Parkside borough.
What is the Median Population Age in Parkside borough?
Median Population Age in Parkside borough is 34.6 Years.
What is the Average Family Size in Parkside borough
Average Family Size in Parkside borough is 3.2 People.
What is the Average Household Size in Parkside borough
Average Household Size in Parkside borough is 2.7 People.
How Large is the Labor Force in Parkside borough?
There are 1,281 People in the Labor Forcein in Parkside borough.
What is the Percentage of People in the Labor Force in Parkside borough?
77.8% of People are in the Labor Force in Parkside borough.
What is the Unemployment Rate in Parkside borough?
Unemployment Rate in Parkside borough is 4.1%.