Soudersburg, PA Map & Demographics
Soudersburg Map
Soudersburg Overview
$32,073
PER CAPITA INCOME
$55,329
AVG FAMILY INCOME
$72,313
AVG HOUSEHOLD INCOME
43.6%
WAGE / INCOME GAP [ % ]
56.4¢/ $1
WAGE / INCOME GAP [ $ ]
0.20
INEQUALITY / GINI INDEX
453
TOTAL POPULATION
183
MALE POPULATION
270
FEMALE POPULATION
67.78
MALES / 100 FEMALES
147.54
FEMALES / 100 MALES
35.4
MEDIAN AGE
2.5
AVG FAMILY SIZE
2.5
AVG HOUSEHOLD SIZE
230
LABOR FORCE [ PEOPLE ]
64.6%
PERCENT IN LABOR FORCE
Soudersburg Area Codes
Income in Soudersburg
Income Overview in Soudersburg
Per Capita Income in Soudersburg is $32,073, while median incomes of families and households are $55,329 and $72,313 respectively.
| Characteristic | Number | Measure |
| Per Capita Income | 453 | $32,073 |
| Median Family Income | 155 | $55,329 |
| Mean Family Income | 155 | $64,744 |
| Median Household Income | 185 | $72,313 |
| Mean Household Income | 185 | $76,568 |
| Income Deficit | 155 | $0 |
| Wage / Income Gap (%) | 453 | 43.62% |
| Wage / Income Gap ($) | 453 | 56.38¢ per $1 |
| Gini / Inequality Index | 453 | 0.20 |
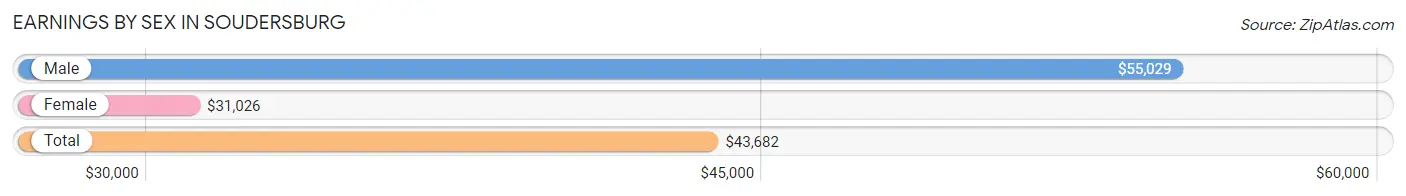
Earnings by Sex in Soudersburg
Average Earnings in Soudersburg are $43,682, $55,029 for men and $31,026 for women, a difference of 43.6%.
| Sex | Number | Average Earnings |
| Male | 167 (61.2%) | $55,029 |
| Female | 106 (38.8%) | $31,026 |
| Total | 273 (100.0%) | $43,682 |
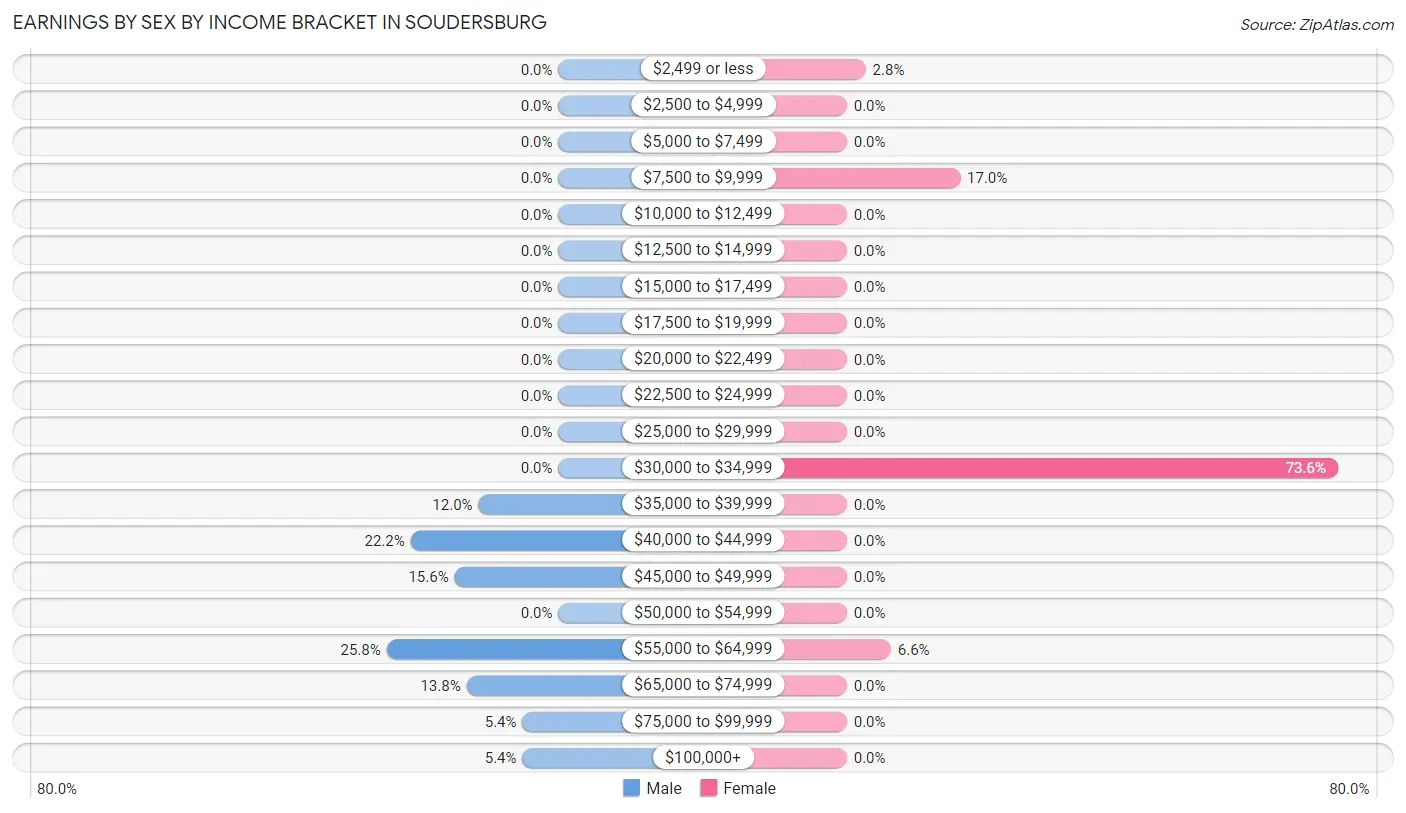
Earnings by Sex by Income Bracket in Soudersburg
The most common earnings brackets in Soudersburg are $55,000 to $64,999 for men (43 | 25.8%) and $30,000 to $34,999 for women (78 | 73.6%).
| Income | Male | Female |
| $2,499 or less | 0 (0.0%) | 3 (2.8%) |
| $2,500 to $4,999 | 0 (0.0%) | 0 (0.0%) |
| $5,000 to $7,499 | 0 (0.0%) | 0 (0.0%) |
| $7,500 to $9,999 | 0 (0.0%) | 18 (17.0%) |
| $10,000 to $12,499 | 0 (0.0%) | 0 (0.0%) |
| $12,500 to $14,999 | 0 (0.0%) | 0 (0.0%) |
| $15,000 to $17,499 | 0 (0.0%) | 0 (0.0%) |
| $17,500 to $19,999 | 0 (0.0%) | 0 (0.0%) |
| $20,000 to $22,499 | 0 (0.0%) | 0 (0.0%) |
| $22,500 to $24,999 | 0 (0.0%) | 0 (0.0%) |
| $25,000 to $29,999 | 0 (0.0%) | 0 (0.0%) |
| $30,000 to $34,999 | 0 (0.0%) | 78 (73.6%) |
| $35,000 to $39,999 | 20 (12.0%) | 0 (0.0%) |
| $40,000 to $44,999 | 37 (22.2%) | 0 (0.0%) |
| $45,000 to $49,999 | 26 (15.6%) | 0 (0.0%) |
| $50,000 to $54,999 | 0 (0.0%) | 0 (0.0%) |
| $55,000 to $64,999 | 43 (25.8%) | 7 (6.6%) |
| $65,000 to $74,999 | 23 (13.8%) | 0 (0.0%) |
| $75,000 to $99,999 | 9 (5.4%) | 0 (0.0%) |
| $100,000+ | 9 (5.4%) | 0 (0.0%) |
| Total | 167 (100.0%) | 106 (100.0%) |
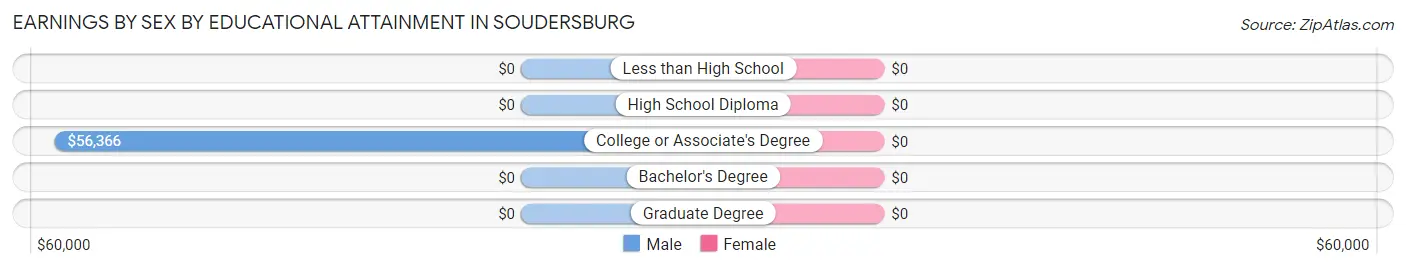
Earnings by Sex by Educational Attainment in Soudersburg
| Educational Attainment | Male Income | Female Income |
| Less than High School | - | - |
| High School Diploma | - | - |
| College or Associate's Degree | $56,366 | $0 |
| Bachelor's Degree | - | - |
| Graduate Degree | - | - |
| Total | $55,610 | $30,714 |
Family Income in Soudersburg
Family Income Brackets in Soudersburg
According to the Soudersburg family income data, there are 75 families falling into the $35,000 to $49,999 income range, which is the most common income bracket and makes up 48.4% of all families.
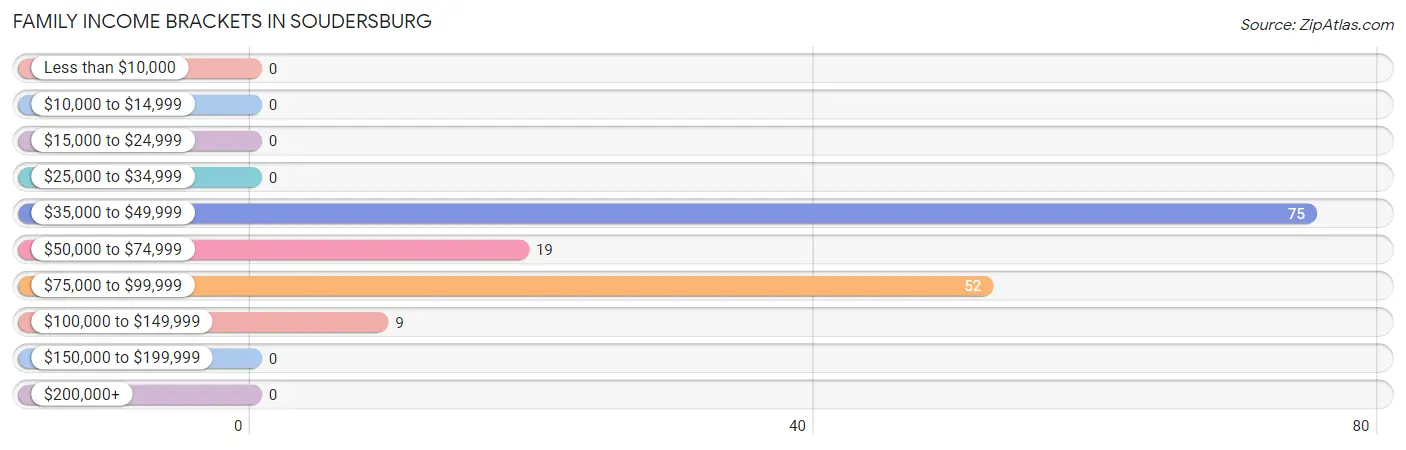
| Income Bracket | # Families | % Families |
| Less than $10,000 | 0 | 0.0% |
| $10,000 to $14,999 | 0 | 0.0% |
| $15,000 to $24,999 | 0 | 0.0% |
| $25,000 to $34,999 | 0 | 0.0% |
| $35,000 to $49,999 | 75 | 48.4% |
| $50,000 to $74,999 | 19 | 12.3% |
| $75,000 to $99,999 | 52 | 33.5% |
| $100,000 to $149,999 | 9 | 5.8% |
| $150,000 to $199,999 | 0 | 0.0% |
| $200,000+ | 0 | 0.0% |
Family Income by Famaliy Size in Soudersburg
3-person families (71 | 45.8%) account for the highest median family income in Soudersburg with $88,459 per family, while 3-person families (71 | 45.8%) have the highest median income of $29,486 per family member.
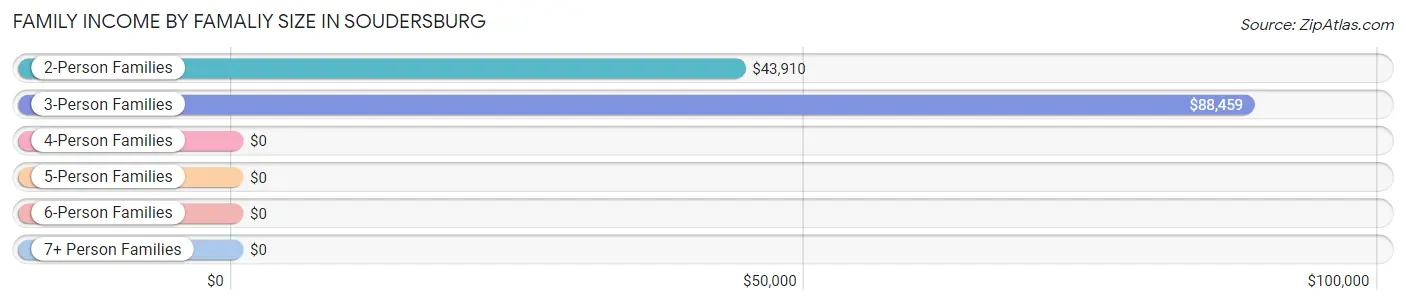
| Income Bracket | # Families | Median Income |
| 2-Person Families | 84 (54.2%) | $43,910 |
| 3-Person Families | 71 (45.8%) | $88,459 |
| 4-Person Families | 0 (0.0%) | $0 |
| 5-Person Families | 0 (0.0%) | $0 |
| 6-Person Families | 0 (0.0%) | $0 |
| 7+ Person Families | 0 (0.0%) | $0 |
| Total | 155 (100.0%) | $55,329 |
Family Income by Number of Earners in Soudersburg
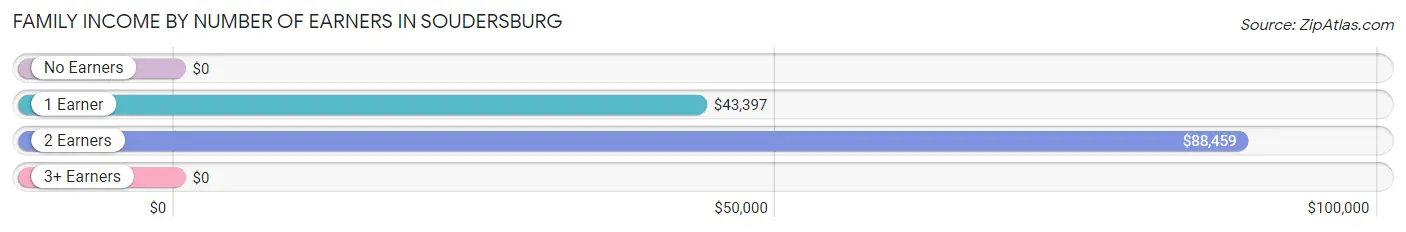
| Number of Earners | # Families | Median Income |
| No Earners | 16 (10.3%) | $0 |
| 1 Earner | 68 (43.9%) | $43,397 |
| 2 Earners | 71 (45.8%) | $88,459 |
| 3+ Earners | 0 (0.0%) | $0 |
| Total | 155 (100.0%) | $55,329 |
Household Income in Soudersburg
Household Income Brackets in Soudersburg
With 55 households falling in the category, the $35,000 to $49,999 income range is the most frequent in Soudersburg, accounting for 29.7% of all households.
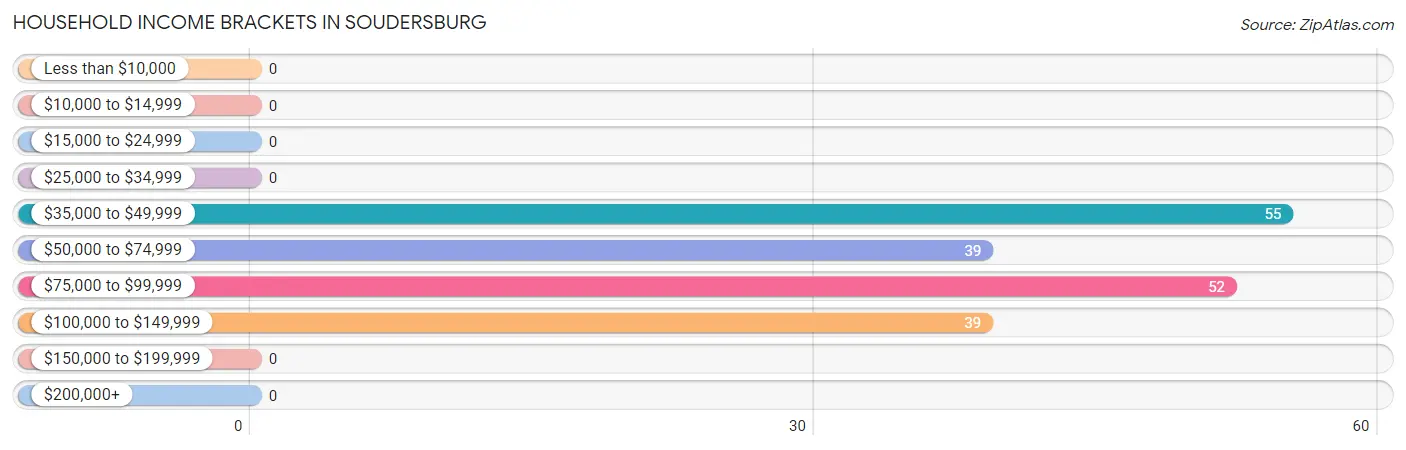
| Income Bracket | # Households | % Households |
| Less than $10,000 | 0 | 0.0% |
| $10,000 to $14,999 | 0 | 0.0% |
| $15,000 to $24,999 | 0 | 0.0% |
| $25,000 to $34,999 | 0 | 0.0% |
| $35,000 to $49,999 | 55 | 29.7% |
| $50,000 to $74,999 | 39 | 21.1% |
| $75,000 to $99,999 | 52 | 28.1% |
| $100,000 to $149,999 | 39 | 21.1% |
| $150,000 to $199,999 | 0 | 0.0% |
| $200,000+ | 0 | 0.0% |
Household Income by Householder Age in Soudersburg
The median household income in Soudersburg is $72,313, with the highest median household income of $88,663 found in the 25 to 44 years age bracket for the primary householder. A total of 78 households (42.2%) fall into this category. Meanwhile, the 15 to 24 years age bracket for the primary householder has the lowest median household income of $0, with 20 households (10.8%) in this group.
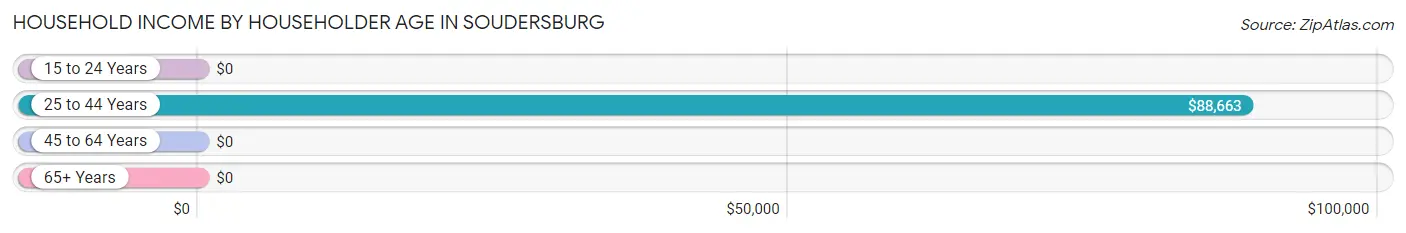
| Income Bracket | # Households | Median Income |
| 15 to 24 Years | 20 (10.8%) | $0 |
| 25 to 44 Years | 78 (42.2%) | $88,663 |
| 45 to 64 Years | 71 (38.4%) | $0 |
| 65+ Years | 16 (8.6%) | $0 |
| Total | 185 (100.0%) | $72,313 |
Poverty in Soudersburg
Income Below Poverty by Sex and Age in Soudersburg
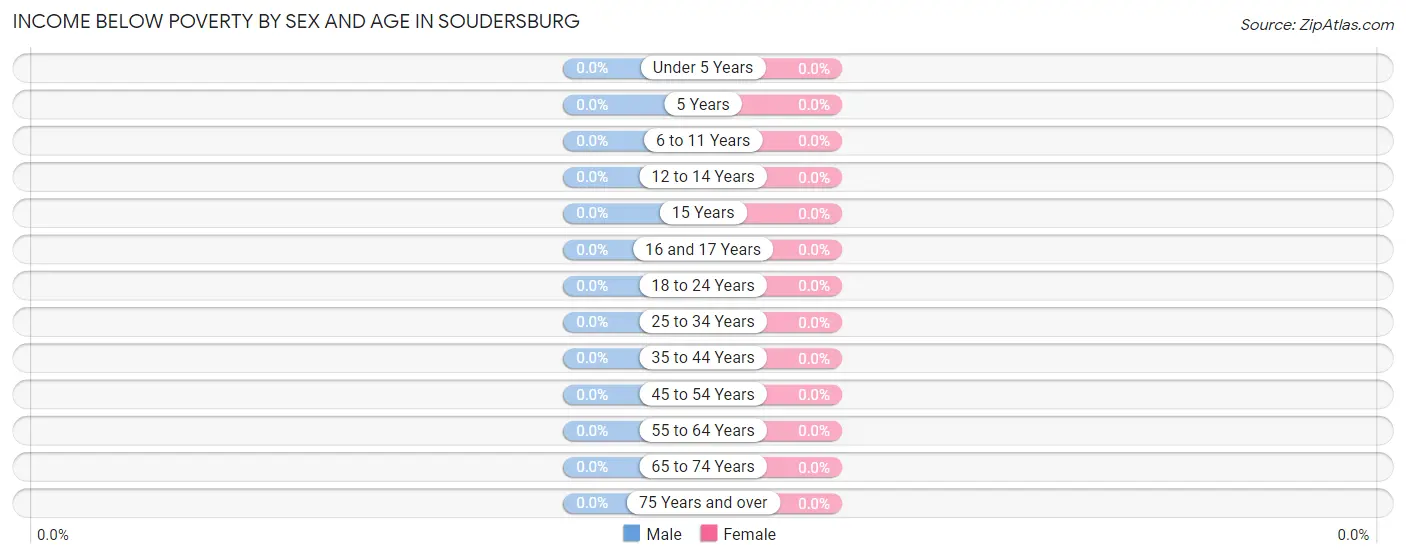
| Age Bracket | Male | Female |
| Under 5 Years | 0 (0.0%) | 0 (0.0%) |
| 5 Years | 0 (0.0%) | 0 (0.0%) |
| 6 to 11 Years | 0 (0.0%) | 0 (0.0%) |
| 12 to 14 Years | 0 (0.0%) | 0 (0.0%) |
| 15 Years | 0 (0.0%) | 0 (0.0%) |
| 16 and 17 Years | 0 (0.0%) | 0 (0.0%) |
| 18 to 24 Years | 0 (0.0%) | 0 (0.0%) |
| 25 to 34 Years | 0 (0.0%) | 0 (0.0%) |
| 35 to 44 Years | 0 (0.0%) | 0 (0.0%) |
| 45 to 54 Years | 0 (0.0%) | 0 (0.0%) |
| 55 to 64 Years | 0 (0.0%) | 0 (0.0%) |
| 65 to 74 Years | 0 (0.0%) | 0 (0.0%) |
| 75 Years and over | 0 (0.0%) | 0 (0.0%) |
| Total | 0 (0.0%) | 0 (0.0%) |
Income Above Poverty by Sex and Age in Soudersburg
According to the poverty statistics in Soudersburg, males aged 18 to 24 years and females aged under 5 years are the age groups that are most secure financially, with 100.0% of males and 100.0% of females in these age groups living above the poverty line.
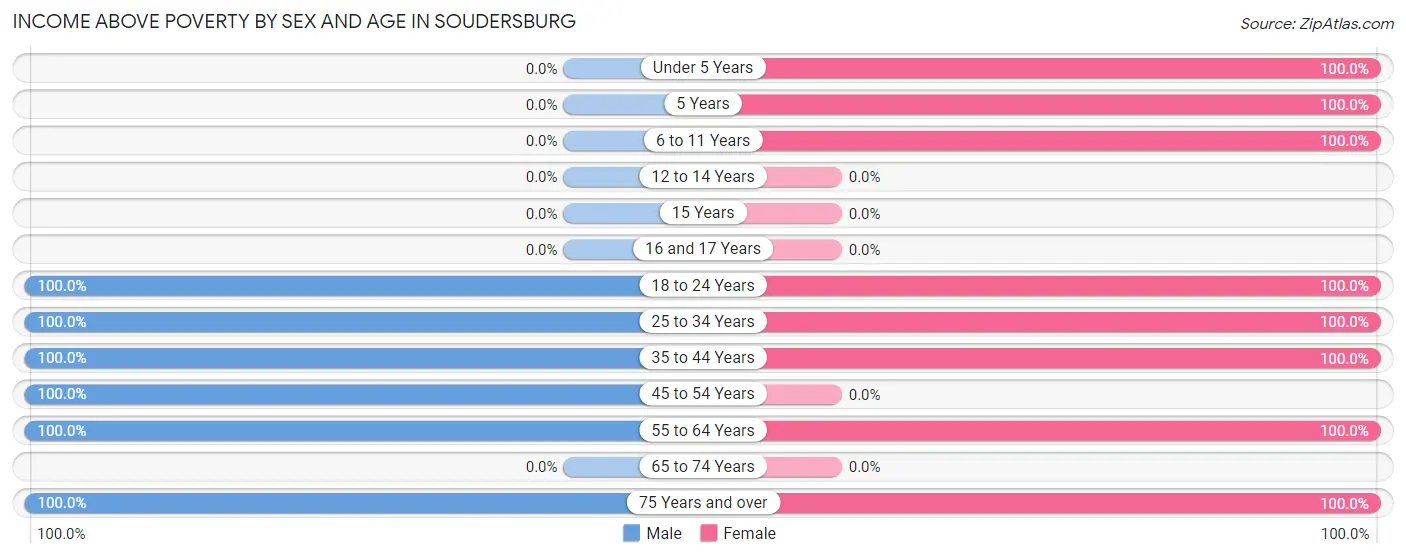
| Age Bracket | Male | Female |
| Under 5 Years | 0 (0.0%) | 71 (100.0%) |
| 5 Years | 0 (0.0%) | 18 (100.0%) |
| 6 to 11 Years | 0 (0.0%) | 8 (100.0%) |
| 12 to 14 Years | 0 (0.0%) | 0 (0.0%) |
| 15 Years | 0 (0.0%) | 0 (0.0%) |
| 16 and 17 Years | 0 (0.0%) | 0 (0.0%) |
| 18 to 24 Years | 20 (100.0%) | 36 (100.0%) |
| 25 to 34 Years | 35 (100.0%) | 21 (100.0%) |
| 35 to 44 Years | 43 (100.0%) | 49 (100.0%) |
| 45 to 54 Years | 23 (100.0%) | 0 (0.0%) |
| 55 to 64 Years | 46 (100.0%) | 49 (100.0%) |
| 65 to 74 Years | 0 (0.0%) | 0 (0.0%) |
| 75 Years and over | 16 (100.0%) | 18 (100.0%) |
| Total | 183 (100.0%) | 270 (100.0%) |
Income Below Poverty Among Married-Couple Families in Soudersburg
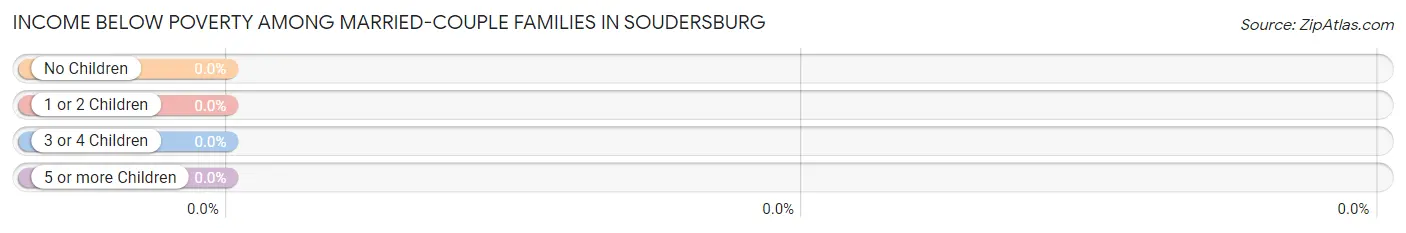
| Children | Above Poverty | Below Poverty |
| No Children | 64 (100.0%) | 0 (0.0%) |
| 1 or 2 Children | 62 (100.0%) | 0 (0.0%) |
| 3 or 4 Children | 0 (0.0%) | 0 (0.0%) |
| 5 or more Children | 0 (0.0%) | 0 (0.0%) |
| Total | 126 (100.0%) | 0 (0.0%) |
Income Below Poverty Among Single-Parent Households in Soudersburg
| Children | Single Father | Single Mother |
| No Children | 0 (0.0%) | 0 (0.0%) |
| 1 or 2 Children | 0 (0.0%) | 0 (0.0%) |
| 3 or 4 Children | 0 (0.0%) | 0 (0.0%) |
| 5 or more Children | 0 (0.0%) | 0 (0.0%) |
| Total | 0 (0.0%) | 0 (0.0%) |
Income Below Poverty Among Married-Couple vs Single-Parent Households in Soudersburg
| Children | Married-Couple Families | Single-Parent Households |
| No Children | 0 (0.0%) | 0 (0.0%) |
| 1 or 2 Children | 0 (0.0%) | 0 (0.0%) |
| 3 or 4 Children | 0 (0.0%) | 0 (0.0%) |
| 5 or more Children | 0 (0.0%) | 0 (0.0%) |
| Total | 0 (0.0%) | 0 (0.0%) |
Race in Soudersburg
The most populous races in Soudersburg are White / Caucasian (325 | 71.7%), Black / African American (96 | 21.2%), and Hispanic or Latino (61 | 13.5%).
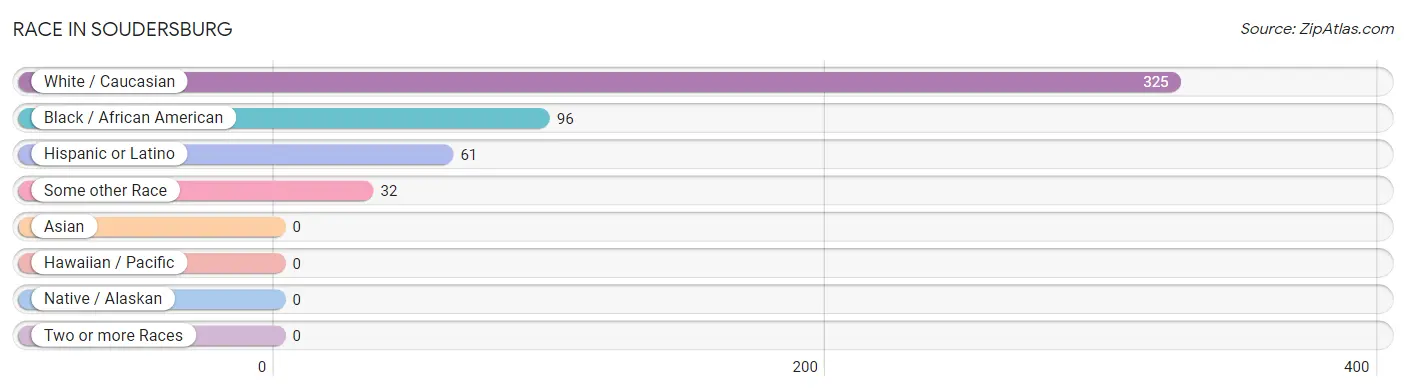
| Race | # Population | % Population |
| Asian | 0 | 0.0% |
| Black / African American | 96 | 21.2% |
| Hawaiian / Pacific | 0 | 0.0% |
| Hispanic or Latino | 61 | 13.5% |
| Native / Alaskan | 0 | 0.0% |
| White / Caucasian | 325 | 71.7% |
| Two or more Races | 0 | 0.0% |
| Some other Race | 32 | 7.1% |
| Total | 453 | 100.0% |
Ancestry in Soudersburg
The most populous ancestries reported in Soudersburg are German (128 | 28.3%), Polish (88 | 19.4%), Irish (61 | 13.5%), Puerto Rican (61 | 13.5%), and Italian (57 | 12.6%), together accounting for 87.2% of all Soudersburg residents.
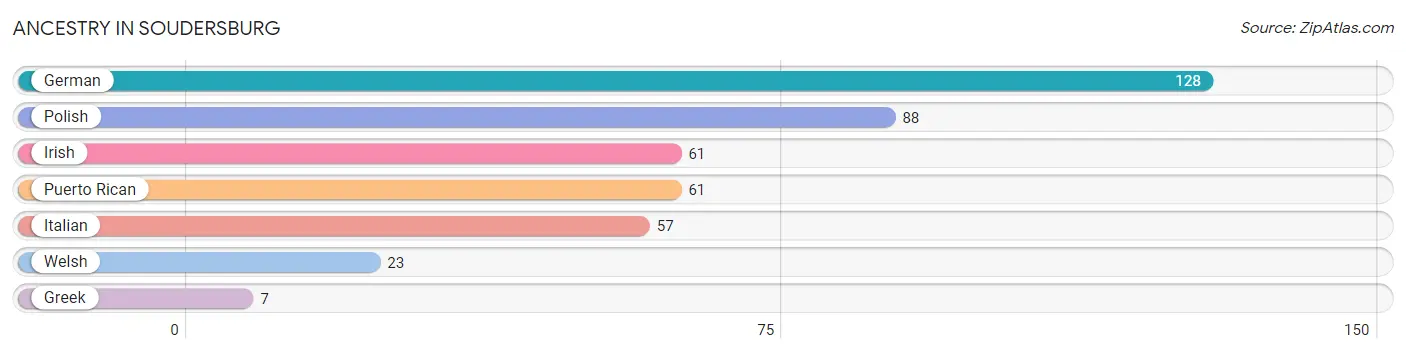
| Ancestry | # Population | % Population |
| German | 128 | 28.3% |
| Greek | 7 | 1.5% |
| Irish | 61 | 13.5% |
| Italian | 57 | 12.6% |
| Polish | 88 | 19.4% |
| Puerto Rican | 61 | 13.5% |
| Welsh | 23 | 5.1% | View All 7 Rows |
Immigrants in Soudersburg

| Immigration Origin | # Population | % Population | View All 0 Rows |
Sex and Age in Soudersburg
Sex and Age in Soudersburg
The most populous age groups in Soudersburg are 35 to 39 Years (43 | 23.5%) for men and Under 5 Years (71 | 26.3%) for women.
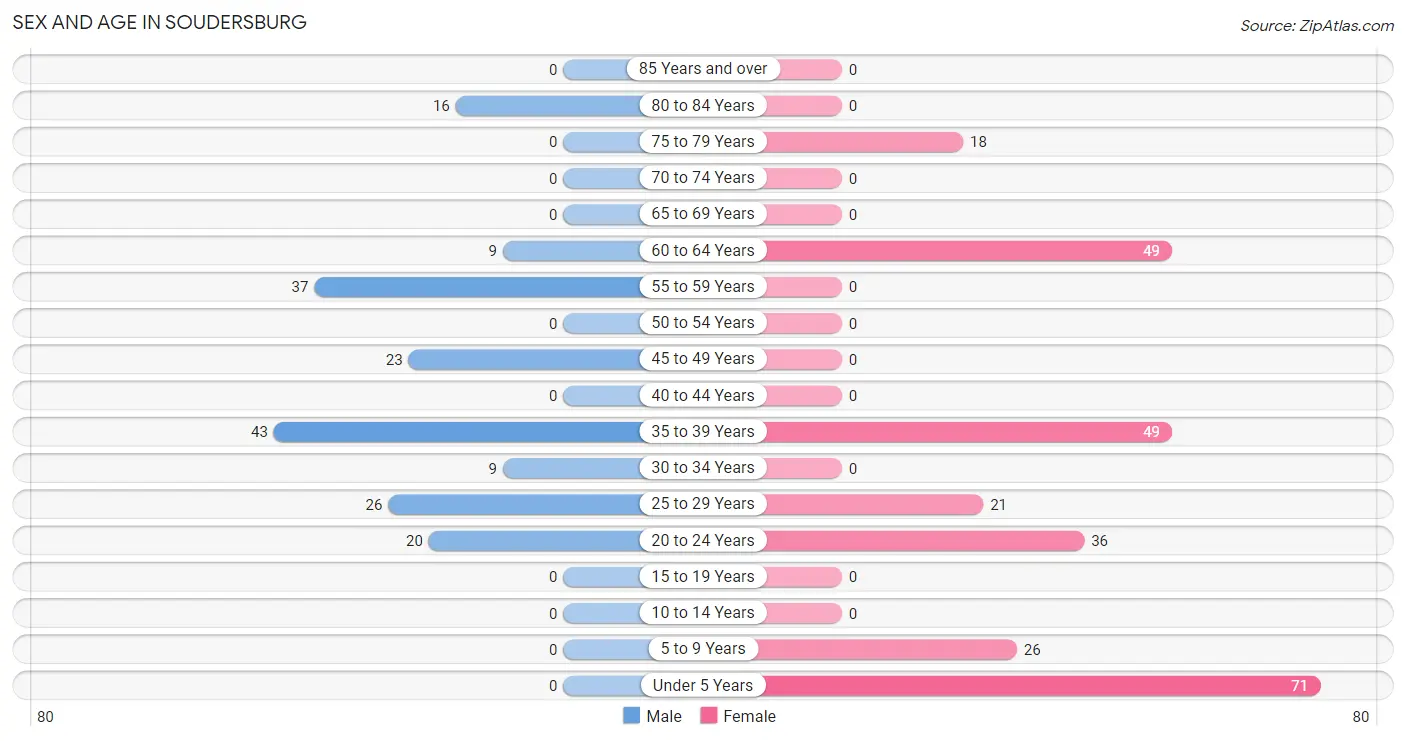
| Age Bracket | Male | Female |
| Under 5 Years | 0 (0.0%) | 71 (26.3%) |
| 5 to 9 Years | 0 (0.0%) | 26 (9.6%) |
| 10 to 14 Years | 0 (0.0%) | 0 (0.0%) |
| 15 to 19 Years | 0 (0.0%) | 0 (0.0%) |
| 20 to 24 Years | 20 (10.9%) | 36 (13.3%) |
| 25 to 29 Years | 26 (14.2%) | 21 (7.8%) |
| 30 to 34 Years | 9 (4.9%) | 0 (0.0%) |
| 35 to 39 Years | 43 (23.5%) | 49 (18.1%) |
| 40 to 44 Years | 0 (0.0%) | 0 (0.0%) |
| 45 to 49 Years | 23 (12.6%) | 0 (0.0%) |
| 50 to 54 Years | 0 (0.0%) | 0 (0.0%) |
| 55 to 59 Years | 37 (20.2%) | 0 (0.0%) |
| 60 to 64 Years | 9 (4.9%) | 49 (18.1%) |
| 65 to 69 Years | 0 (0.0%) | 0 (0.0%) |
| 70 to 74 Years | 0 (0.0%) | 0 (0.0%) |
| 75 to 79 Years | 0 (0.0%) | 18 (6.7%) |
| 80 to 84 Years | 16 (8.7%) | 0 (0.0%) |
| 85 Years and over | 0 (0.0%) | 0 (0.0%) |
| Total | 183 (100.0%) | 270 (100.0%) |
Families and Households in Soudersburg
Median Family Size in Soudersburg
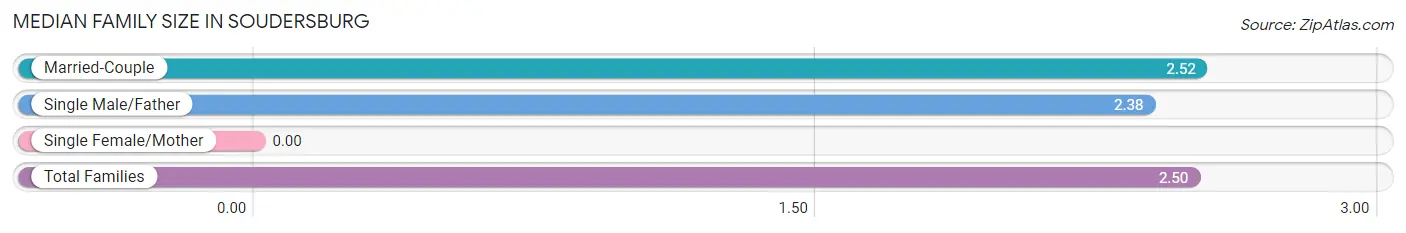
| Family Type | # Families | Family Size |
| Married-Couple | 126 (81.3%) | 2.52 |
| Single Male/Father | 29 (18.7%) | 2.38 |
| Single Female/Mother | 0 (0.0%) | - |
| Total Families | 155 (100.0%) | 2.50 |
Median Household Size in Soudersburg
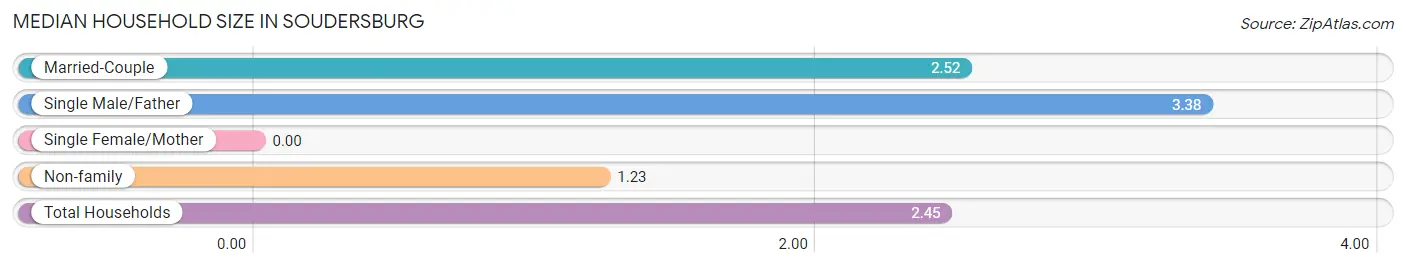
| Household Type | # Households | Household Size |
| Married-Couple | 126 (68.1%) | 2.52 |
| Single Male/Father | 29 (15.7%) | 3.38 |
| Single Female/Mother | 0 (0.0%) | - |
| Non-family | 30 (16.2%) | 1.23 |
| Total Households | 185 (100.0%) | 2.45 |
Household Size by Marriage Status in Soudersburg
Out of a total of 185 households in Soudersburg, 155 (83.8%) are family households, while 30 (16.2%) are nonfamily households. The most numerous type of family households are 3-person households, comprising 91, and the most common type of nonfamily households are 1-person households, comprising 23.
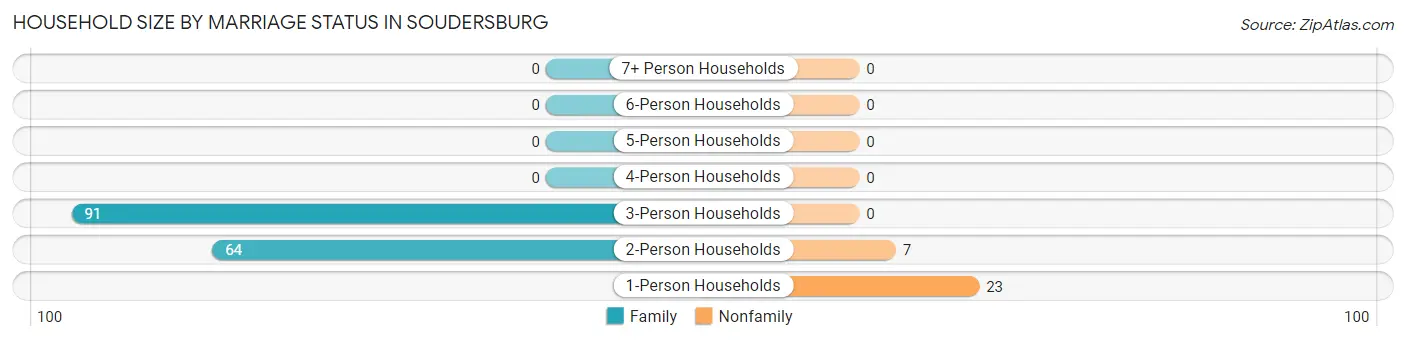
| Household Size | Family Households | Nonfamily Households |
| 1-Person Households | - | 23 (12.4%) |
| 2-Person Households | 64 (34.6%) | 7 (3.8%) |
| 3-Person Households | 91 (49.2%) | 0 (0.0%) |
| 4-Person Households | 0 (0.0%) | 0 (0.0%) |
| 5-Person Households | 0 (0.0%) | 0 (0.0%) |
| 6-Person Households | 0 (0.0%) | 0 (0.0%) |
| 7+ Person Households | 0 (0.0%) | 0 (0.0%) |
| Total | 155 (83.8%) | 30 (16.2%) |
Female Fertility in Soudersburg
Fertility by Age in Soudersburg
Average fertility rate in Soudersburg is 274.0 births per 1,000 women. Women in the age bracket of 20 to 34 years have the highest fertility rate with 509.0 births per 1,000 women. Women in the age bracket of 20 to 34 years acount for 100.0% of all women with births.
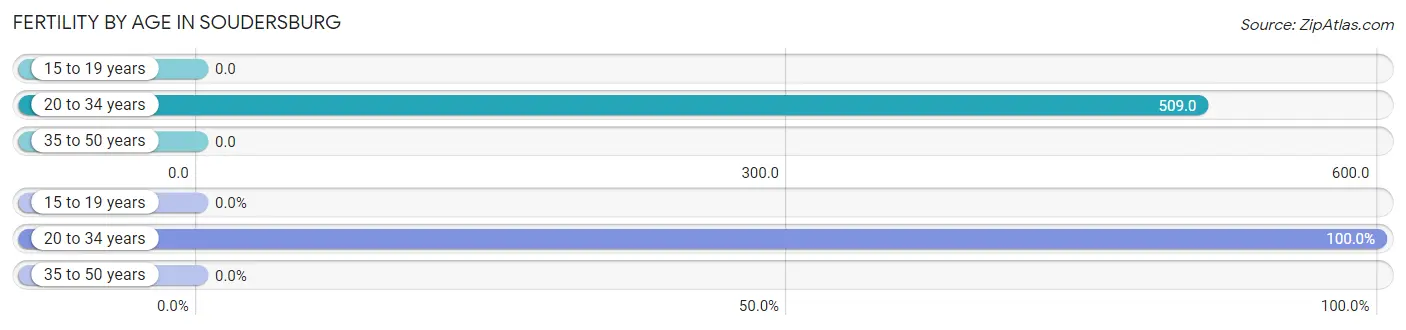
| Age Bracket | Women with Births | Births / 1,000 Women |
| 15 to 19 years | 0 (0.0%) | 0.0 |
| 20 to 34 years | 29 (100.0%) | 509.0 |
| 35 to 50 years | 0 (0.0%) | 0.0 |
| Total | 29 (100.0%) | 274.0 |
Fertility by Age by Marriage Status in Soudersburg
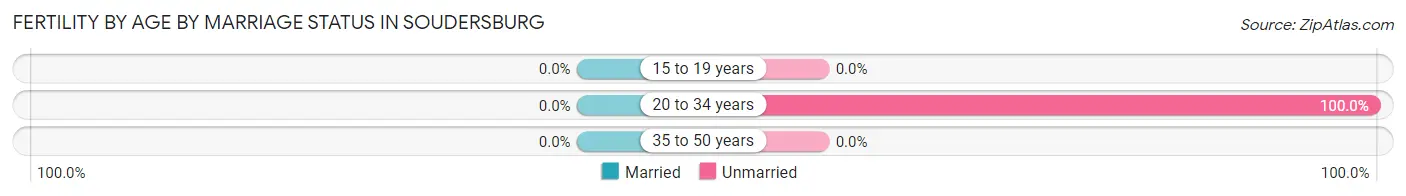
| Age Bracket | Married | Unmarried |
| 15 to 19 years | 0 (0.0%) | 0 (0.0%) |
| 20 to 34 years | 0 (0.0%) | 29 (100.0%) |
| 35 to 50 years | 0 (0.0%) | 0 (0.0%) |
| Total | 0 (0.0%) | 29 (100.0%) |
Fertility by Education in Soudersburg
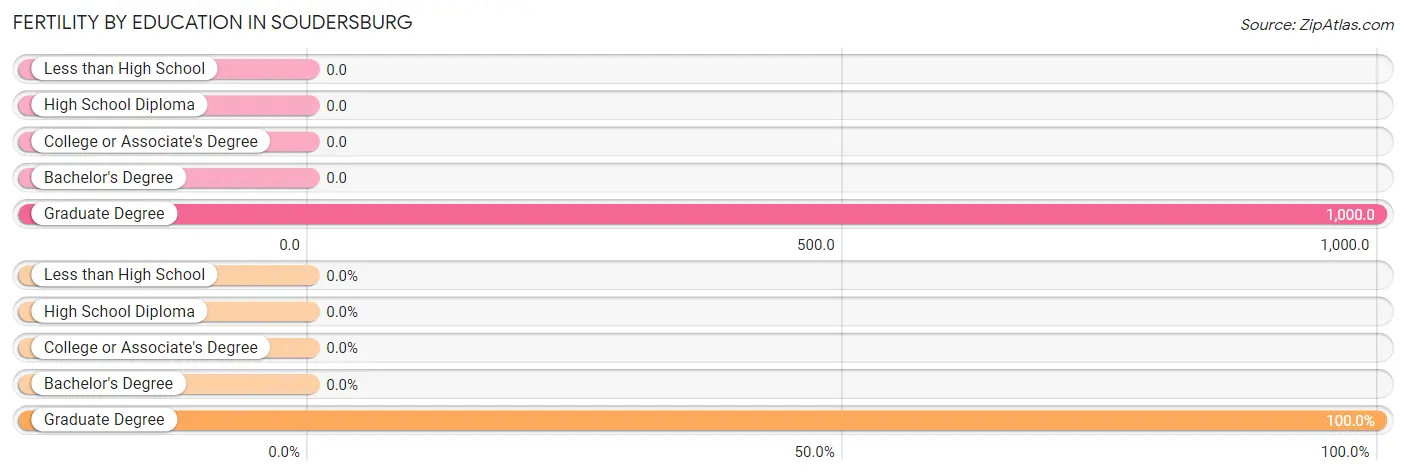
| Educational Attainment | Women with Births | Births / 1,000 Women |
| Less than High School | 0 (0.0%) | 0.0 |
| High School Diploma | 0 (0.0%) | 0.0 |
| College or Associate's Degree | 0 (0.0%) | 0.0 |
| Bachelor's Degree | 0 (0.0%) | 0.0 |
| Graduate Degree | 29 (100.0%) | 1,000.0 |
| Total | 29 (100.0%) | 274.0 |
Fertility by Education by Marriage Status in Soudersburg
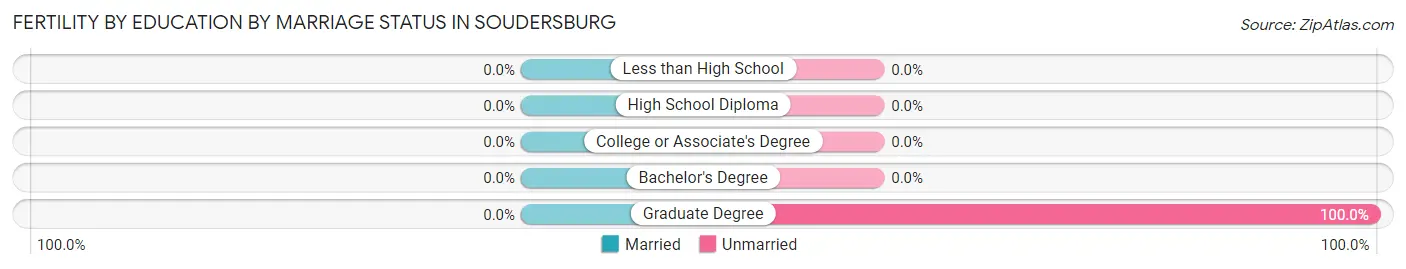
| Educational Attainment | Married | Unmarried |
| Less than High School | 0 (0.0%) | 0 (0.0%) |
| High School Diploma | 0 (0.0%) | 0 (0.0%) |
| College or Associate's Degree | 0 (0.0%) | 0 (0.0%) |
| Bachelor's Degree | 0 (0.0%) | 0 (0.0%) |
| Graduate Degree | 0 (0.0%) | 29 (100.0%) |
| Total | 0 (0.0%) | 29 (100.0%) |
Employment Characteristics in Soudersburg
Employment by Class of Employer in Soudersburg
Among the 230 employed individuals in Soudersburg, private company employees (127 | 55.2%), self-employed (not incorporated) (37 | 16.1%), and not-for-profit organizations (37 | 16.1%) make up the most common classes of employment.
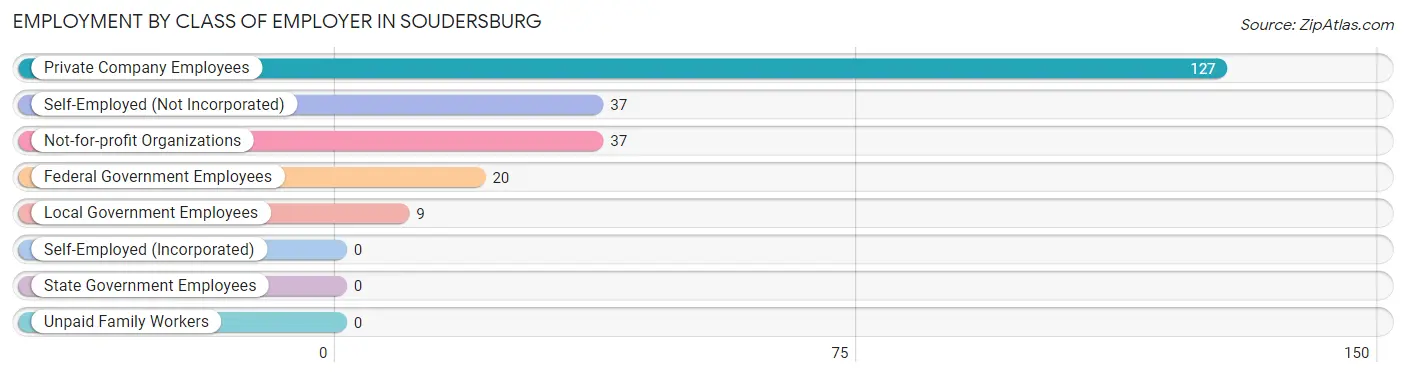
| Employer Class | # Employees | % Employees |
| Private Company Employees | 127 | 55.2% |
| Self-Employed (Incorporated) | 0 | 0.0% |
| Self-Employed (Not Incorporated) | 37 | 16.1% |
| Not-for-profit Organizations | 37 | 16.1% |
| Local Government Employees | 9 | 3.9% |
| State Government Employees | 0 | 0.0% |
| Federal Government Employees | 20 | 8.7% |
| Unpaid Family Workers | 0 | 0.0% |
| Total | 230 | 100.0% |
Employment Status by Age in Soudersburg
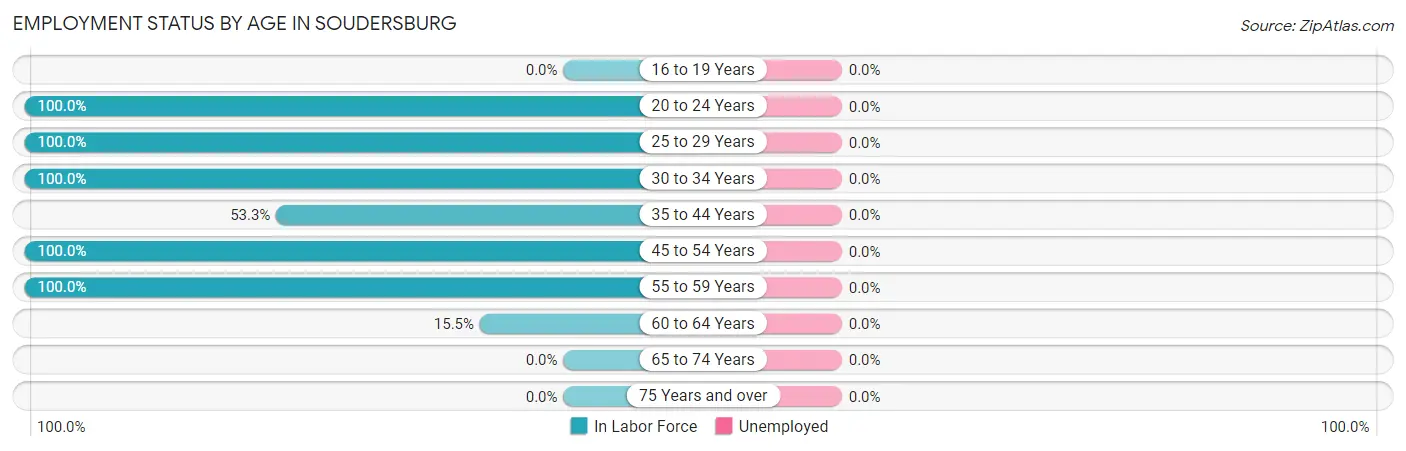
| Age Bracket | In Labor Force | Unemployed |
| 16 to 19 Years | 0 (0.0%) | 0 (0.0%) |
| 20 to 24 Years | 56 (100.0%) | 0 (0.0%) |
| 25 to 29 Years | 47 (100.0%) | 0 (0.0%) |
| 30 to 34 Years | 9 (100.0%) | 0 (0.0%) |
| 35 to 44 Years | 49 (53.3%) | 0 (0.0%) |
| 45 to 54 Years | 23 (100.0%) | 0 (0.0%) |
| 55 to 59 Years | 37 (100.0%) | 0 (0.0%) |
| 60 to 64 Years | 9 (15.5%) | 0 (0.0%) |
| 65 to 74 Years | 0 (0.0%) | 0 (0.0%) |
| 75 Years and over | 0 (0.0%) | 0 (0.0%) |
| Total | 230 (64.6%) | 0 (0.0%) |
Employment Status by Educational Attainment in Soudersburg
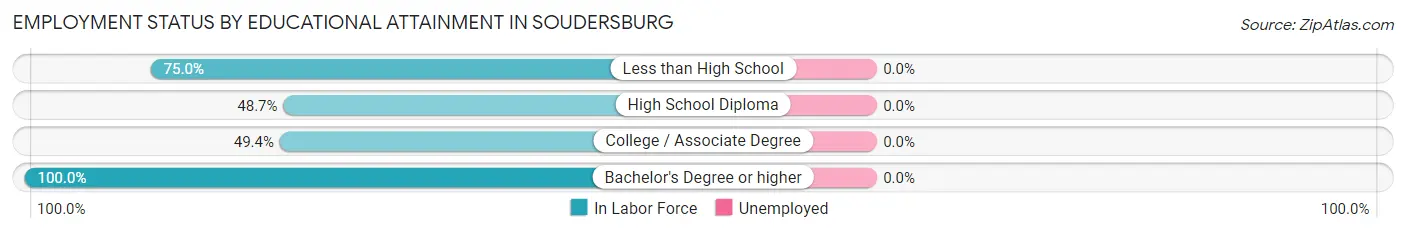
| Educational Attainment | In Labor Force | Unemployed |
| Less than High School | 30 (75.0%) | 0 (0.0%) |
| High School Diploma | 37 (48.7%) | 0 (0.0%) |
| College / Associate Degree | 42 (49.4%) | 0 (0.0%) |
| Bachelor's Degree or higher | 65 (100.0%) | 0 (0.0%) |
| Total | 174 (65.4%) | 0 (0.0%) |
Employment Occupations by Sex in Soudersburg
Management, Business, Science and Arts Occupations
The most common Management, Business, Science and Arts occupations in Soudersburg are Community & Social Service (19 | 8.3%), Education Instruction & Library (19 | 8.3%), Health Diagnosing & Treating (16 | 7.0%), and Business & Financial (7 | 3.0%).
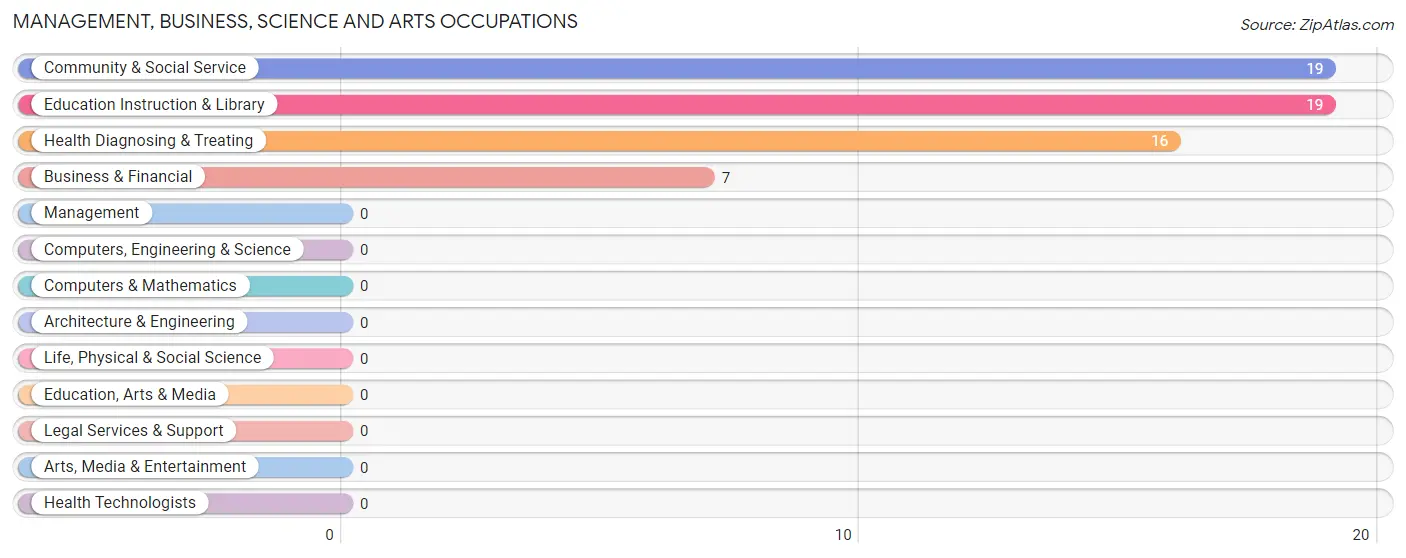
Management, Business, Science and Arts Occupations by Sex
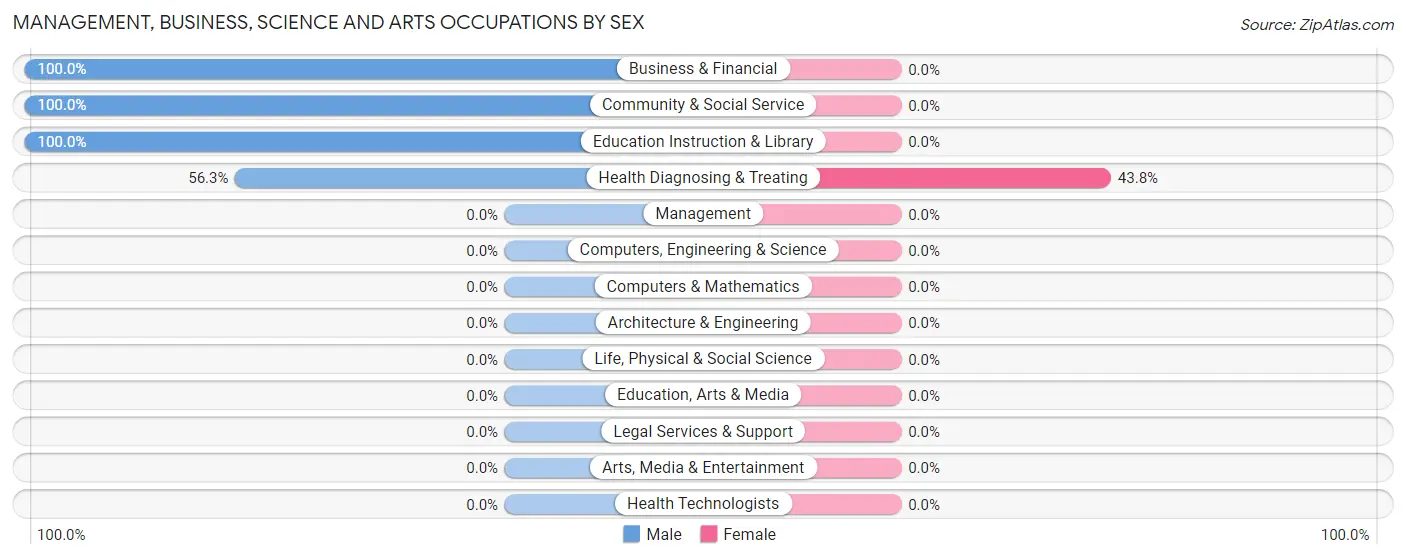
| Occupation | Male | Female |
| Management | 0 (0.0%) | 0 (0.0%) |
| Business & Financial | 7 (100.0%) | 0 (0.0%) |
| Computers, Engineering & Science | 0 (0.0%) | 0 (0.0%) |
| Computers & Mathematics | 0 (0.0%) | 0 (0.0%) |
| Architecture & Engineering | 0 (0.0%) | 0 (0.0%) |
| Life, Physical & Social Science | 0 (0.0%) | 0 (0.0%) |
| Community & Social Service | 19 (100.0%) | 0 (0.0%) |
| Education, Arts & Media | 0 (0.0%) | 0 (0.0%) |
| Legal Services & Support | 0 (0.0%) | 0 (0.0%) |
| Education Instruction & Library | 19 (100.0%) | 0 (0.0%) |
| Arts, Media & Entertainment | 0 (0.0%) | 0 (0.0%) |
| Health Diagnosing & Treating | 9 (56.2%) | 7 (43.8%) |
| Health Technologists | 0 (0.0%) | 0 (0.0%) |
| Total (Category) | 35 (83.3%) | 7 (16.7%) |
| Total (Overall) | 124 (53.9%) | 106 (46.1%) |
Services Occupations
The most common Services occupations in Soudersburg are , and Food Preparation & Serving (29 | 12.6%).
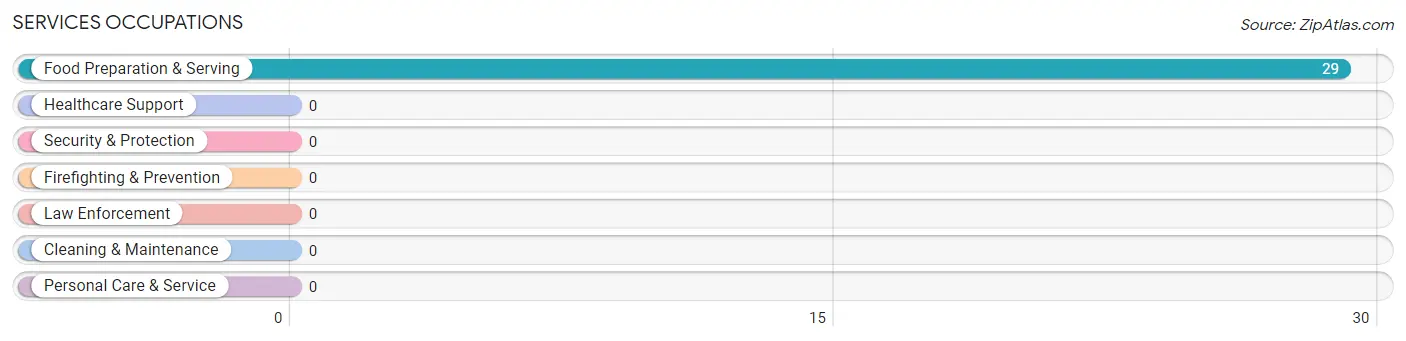
Services Occupations by Sex
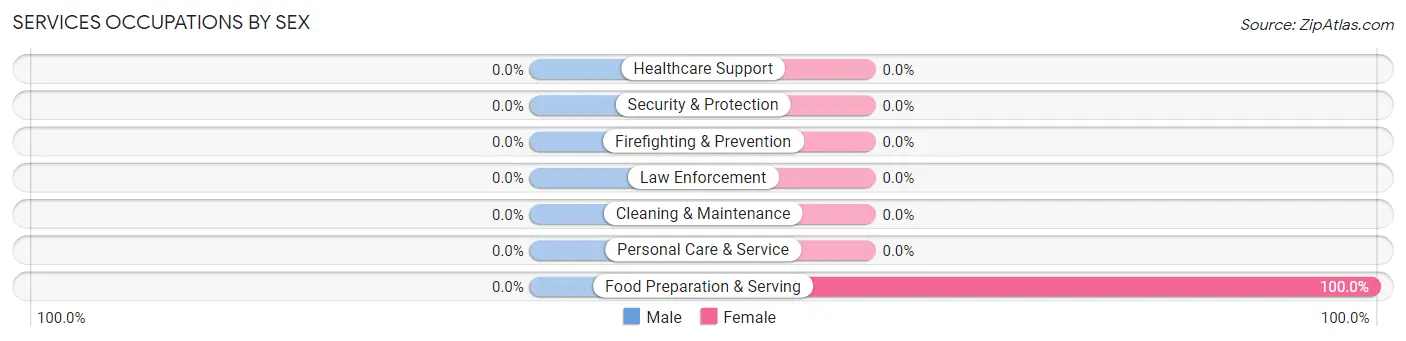
| Occupation | Male | Female |
| Healthcare Support | 0 (0.0%) | 0 (0.0%) |
| Security & Protection | 0 (0.0%) | 0 (0.0%) |
| Firefighting & Prevention | 0 (0.0%) | 0 (0.0%) |
| Law Enforcement | 0 (0.0%) | 0 (0.0%) |
| Food Preparation & Serving | 0 (0.0%) | 29 (100.0%) |
| Cleaning & Maintenance | 0 (0.0%) | 0 (0.0%) |
| Personal Care & Service | 0 (0.0%) | 0 (0.0%) |
| Total (Category) | 0 (0.0%) | 29 (100.0%) |
| Total (Overall) | 124 (53.9%) | 106 (46.1%) |
Sales and Office Occupations
The most common Sales and Office occupations in Soudersburg are Sales & Related (52 | 22.6%), and Office & Administration (23 | 10.0%).
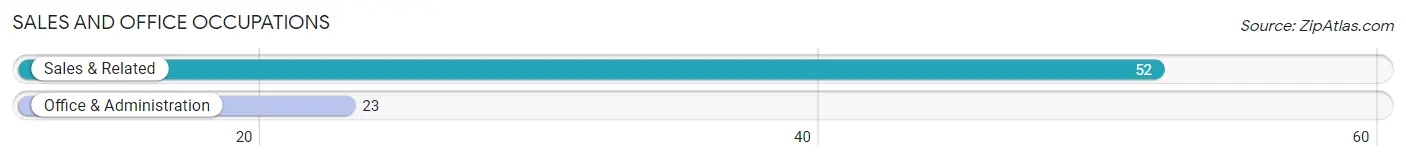
Sales and Office Occupations by Sex
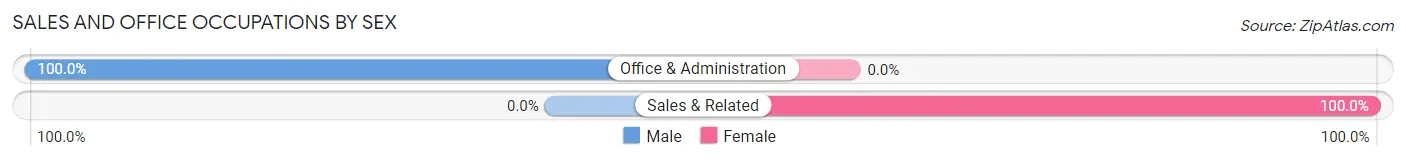
| Occupation | Male | Female |
| Sales & Related | 0 (0.0%) | 52 (100.0%) |
| Office & Administration | 23 (100.0%) | 0 (0.0%) |
| Total (Category) | 23 (30.7%) | 52 (69.3%) |
| Total (Overall) | 124 (53.9%) | 106 (46.1%) |
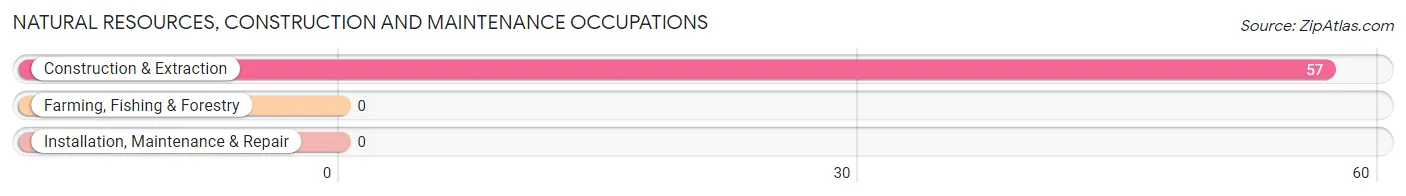
Natural Resources, Construction and Maintenance Occupations
The most common Natural Resources, Construction and Maintenance occupations in Soudersburg are , and Construction & Extraction (57 | 24.8%).
Natural Resources, Construction and Maintenance Occupations by Sex
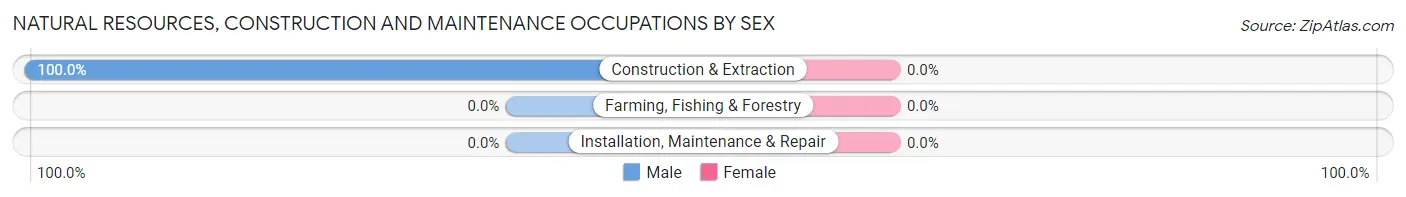
| Occupation | Male | Female |
| Farming, Fishing & Forestry | 0 (0.0%) | 0 (0.0%) |
| Construction & Extraction | 57 (100.0%) | 0 (0.0%) |
| Installation, Maintenance & Repair | 0 (0.0%) | 0 (0.0%) |
| Total (Category) | 57 (100.0%) | 0 (0.0%) |
| Total (Overall) | 124 (53.9%) | 106 (46.1%) |
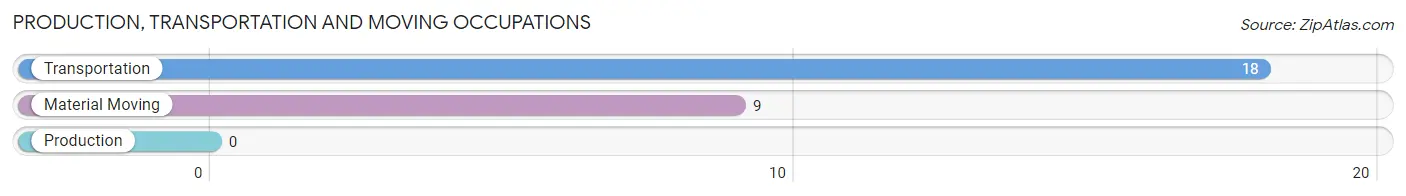
Production, Transportation and Moving Occupations
The most common Production, Transportation and Moving occupations in Soudersburg are Transportation (18 | 7.8%), and Material Moving (9 | 3.9%).
Production, Transportation and Moving Occupations by Sex
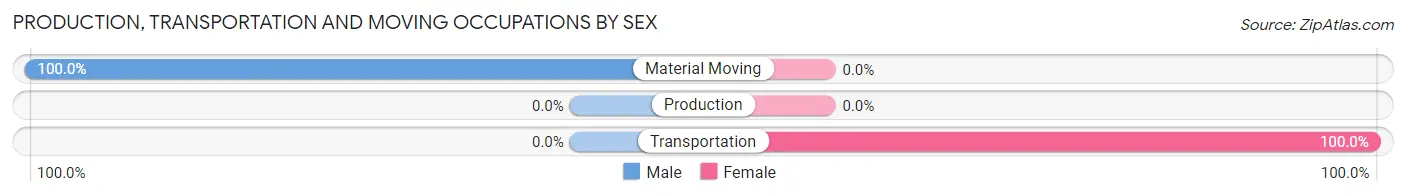
| Occupation | Male | Female |
| Production | 0 (0.0%) | 0 (0.0%) |
| Transportation | 0 (0.0%) | 18 (100.0%) |
| Material Moving | 9 (100.0%) | 0 (0.0%) |
| Total (Category) | 9 (33.3%) | 18 (66.7%) |
| Total (Overall) | 124 (53.9%) | 106 (46.1%) |
Employment Industries by Sex in Soudersburg
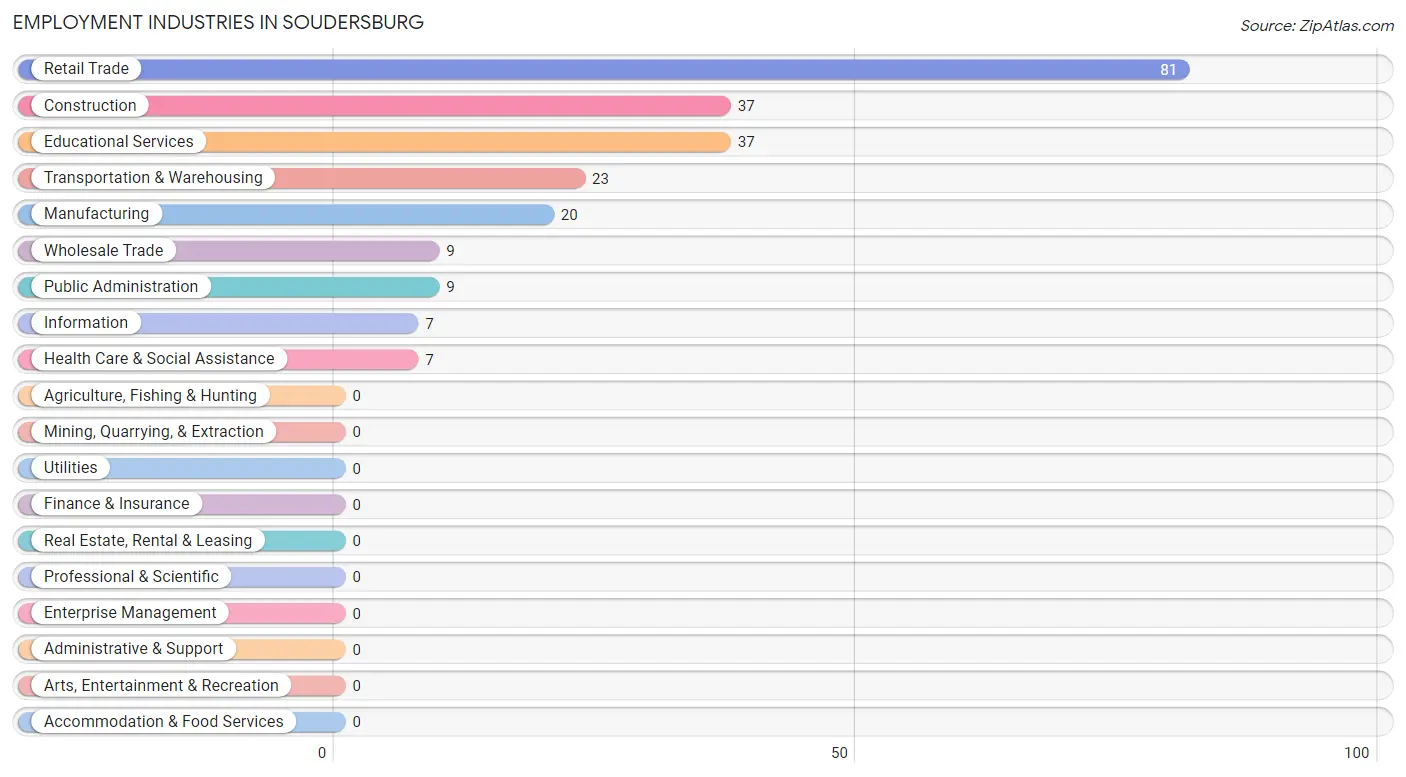
Employment Industries in Soudersburg
The major employment industries in Soudersburg include Retail Trade (81 | 35.2%), Construction (37 | 16.1%), Educational Services (37 | 16.1%), Transportation & Warehousing (23 | 10.0%), and Manufacturing (20 | 8.7%).
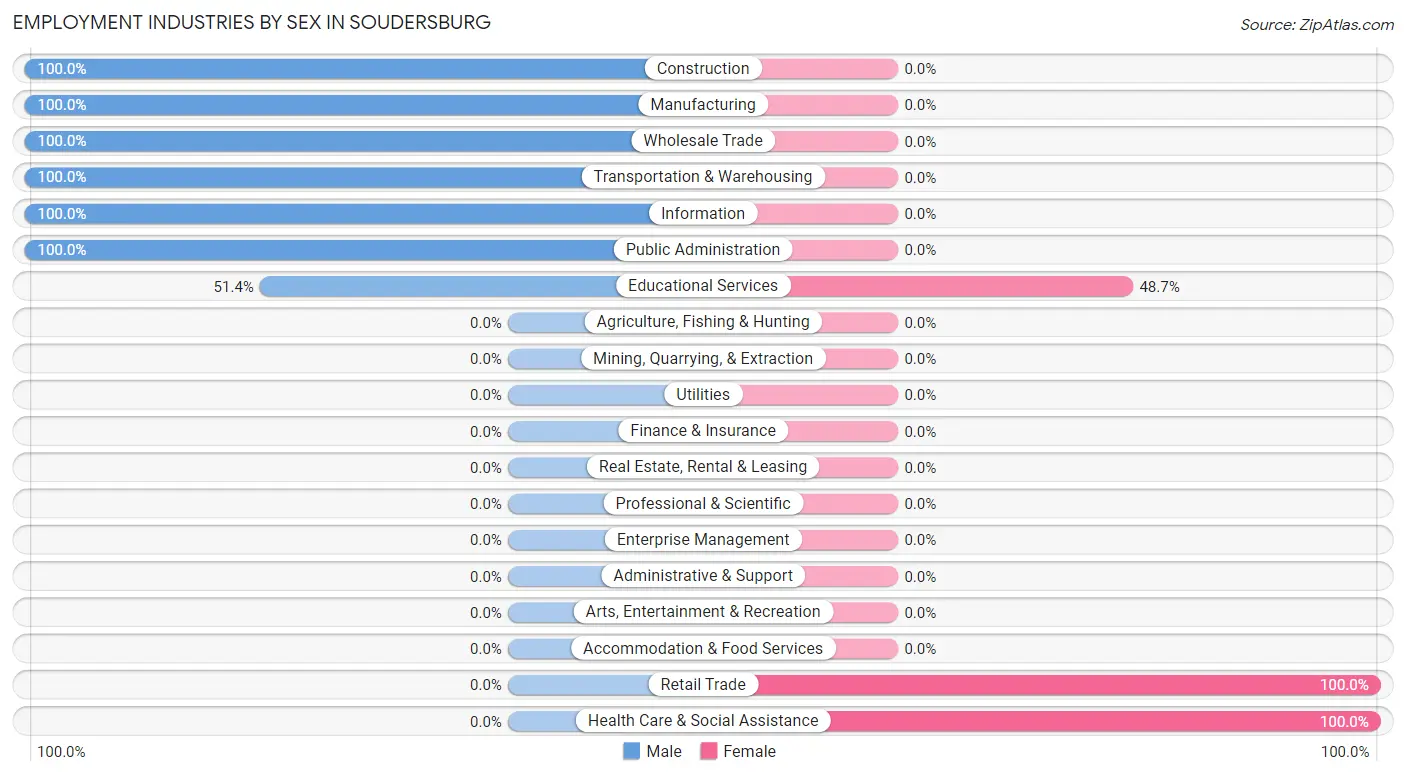
Employment Industries by Sex in Soudersburg
The Soudersburg industries that see more men than women are Construction (100.0%), Manufacturing (100.0%), and Wholesale Trade (100.0%), whereas the industries that tend to have a higher number of women are Retail Trade (100.0%), Health Care & Social Assistance (100.0%), and Educational Services (48.6%).
| Industry | Male | Female |
| Agriculture, Fishing & Hunting | 0 (0.0%) | 0 (0.0%) |
| Mining, Quarrying, & Extraction | 0 (0.0%) | 0 (0.0%) |
| Construction | 37 (100.0%) | 0 (0.0%) |
| Manufacturing | 20 (100.0%) | 0 (0.0%) |
| Wholesale Trade | 9 (100.0%) | 0 (0.0%) |
| Retail Trade | 0 (0.0%) | 81 (100.0%) |
| Transportation & Warehousing | 23 (100.0%) | 0 (0.0%) |
| Utilities | 0 (0.0%) | 0 (0.0%) |
| Information | 7 (100.0%) | 0 (0.0%) |
| Finance & Insurance | 0 (0.0%) | 0 (0.0%) |
| Real Estate, Rental & Leasing | 0 (0.0%) | 0 (0.0%) |
| Professional & Scientific | 0 (0.0%) | 0 (0.0%) |
| Enterprise Management | 0 (0.0%) | 0 (0.0%) |
| Administrative & Support | 0 (0.0%) | 0 (0.0%) |
| Educational Services | 19 (51.3%) | 18 (48.6%) |
| Health Care & Social Assistance | 0 (0.0%) | 7 (100.0%) |
| Arts, Entertainment & Recreation | 0 (0.0%) | 0 (0.0%) |
| Accommodation & Food Services | 0 (0.0%) | 0 (0.0%) |
| Public Administration | 9 (100.0%) | 0 (0.0%) |
| Total | 124 (53.9%) | 106 (46.1%) |
Education in Soudersburg
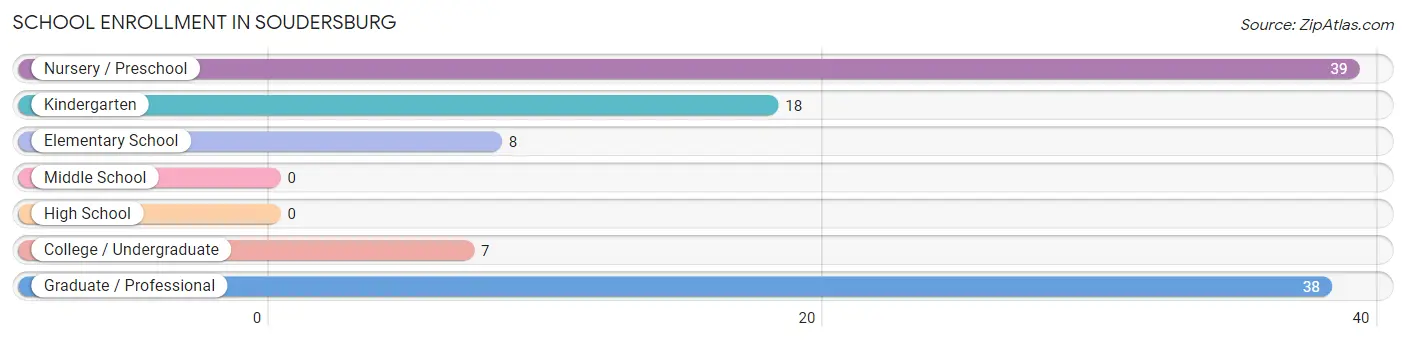
School Enrollment in Soudersburg
The most common levels of schooling among the 110 students in Soudersburg are nursery / preschool (39 | 35.4%), graduate / professional (38 | 34.5%), and kindergarten (18 | 16.4%).
| School Level | # Students | % Students |
| Nursery / Preschool | 39 | 35.4% |
| Kindergarten | 18 | 16.4% |
| Elementary School | 8 | 7.3% |
| Middle School | 0 | 0.0% |
| High School | 0 | 0.0% |
| College / Undergraduate | 7 | 6.4% |
| Graduate / Professional | 38 | 34.5% |
| Total | 110 | 100.0% |
School Enrollment by Age by Funding Source in Soudersburg
Out of a total of 110 students who are enrolled in schools in Soudersburg, 64 (58.2%) attend a private institution, while the remaining 46 (41.8%) are enrolled in public schools. The age group of 3 to 4 year olds has the highest likelihood of being enrolled in private schools, with 39 (100.0% in the age bracket) enrolled. Conversely, the age group of 25 to 34 year olds has the lowest likelihood of being enrolled in a private school, with 9 (100.0% in the age bracket) attending a public institution.
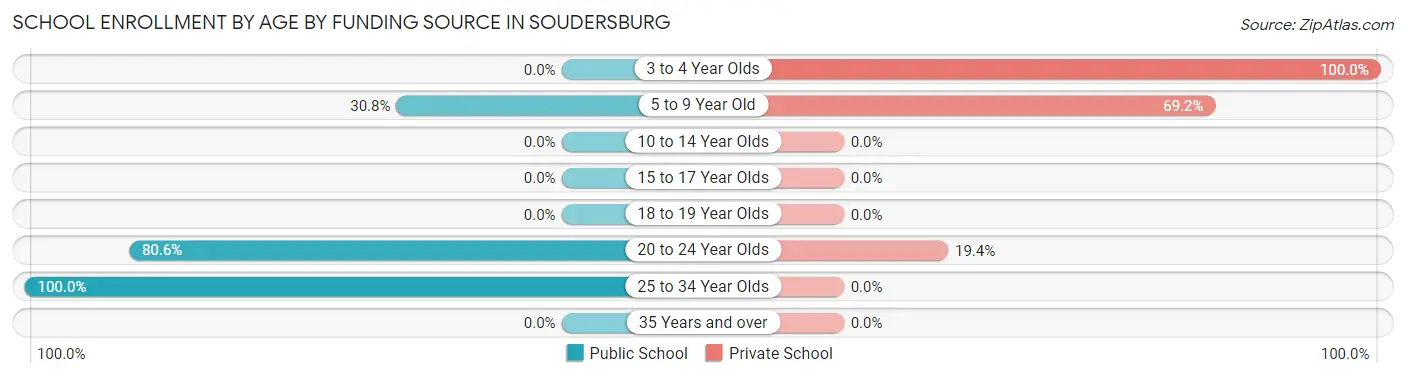
| Age Bracket | Public School | Private School |
| 3 to 4 Year Olds | 0 (0.0%) | 39 (100.0%) |
| 5 to 9 Year Old | 8 (30.8%) | 18 (69.2%) |
| 10 to 14 Year Olds | 0 (0.0%) | 0 (0.0%) |
| 15 to 17 Year Olds | 0 (0.0%) | 0 (0.0%) |
| 18 to 19 Year Olds | 0 (0.0%) | 0 (0.0%) |
| 20 to 24 Year Olds | 29 (80.6%) | 7 (19.4%) |
| 25 to 34 Year Olds | 9 (100.0%) | 0 (0.0%) |
| 35 Years and over | 0 (0.0%) | 0 (0.0%) |
| Total | 46 (41.8%) | 64 (58.2%) |
Educational Attainment by Field of Study in Soudersburg
Bio, nature & agricultural (49 | 40.5%), business (49 | 40.5%), science & technology (9 | 7.4%), engineering (7 | 5.8%), and visual & performing arts (7 | 5.8%) are the most common fields of study among 121 individuals in Soudersburg who have obtained a bachelor's degree or higher.
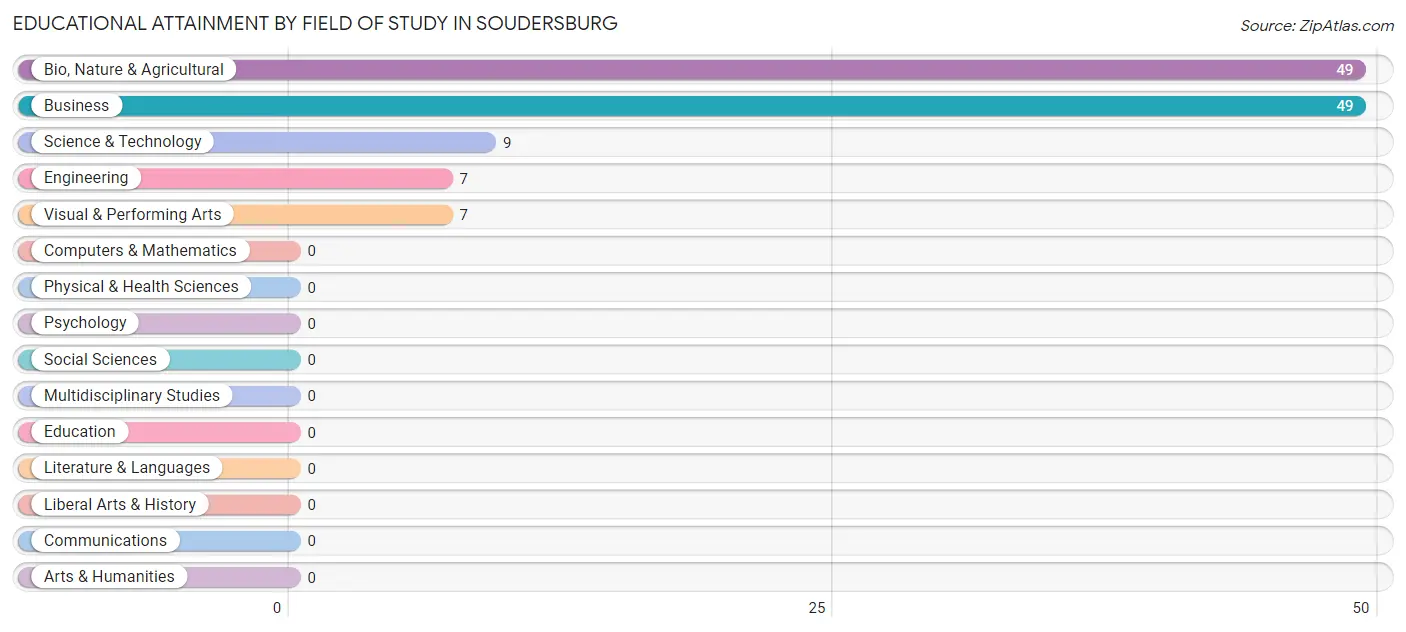
| Field of Study | # Graduates | % Graduates |
| Computers & Mathematics | 0 | 0.0% |
| Bio, Nature & Agricultural | 49 | 40.5% |
| Physical & Health Sciences | 0 | 0.0% |
| Psychology | 0 | 0.0% |
| Social Sciences | 0 | 0.0% |
| Engineering | 7 | 5.8% |
| Multidisciplinary Studies | 0 | 0.0% |
| Science & Technology | 9 | 7.4% |
| Business | 49 | 40.5% |
| Education | 0 | 0.0% |
| Literature & Languages | 0 | 0.0% |
| Liberal Arts & History | 0 | 0.0% |
| Visual & Performing Arts | 7 | 5.8% |
| Communications | 0 | 0.0% |
| Arts & Humanities | 0 | 0.0% |
| Total | 121 | 100.0% |
Transportation & Commute in Soudersburg
Vehicle Availability by Sex in Soudersburg
The most prevalent vehicle ownership categories in Soudersburg are males with 1 vehicle (43, accounting for 34.7%) and females with 1 vehicle (29, making up 40.6%).
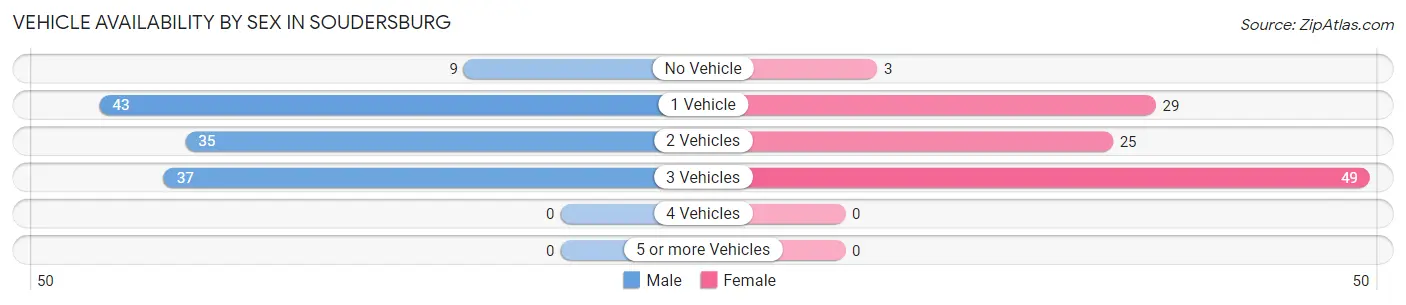
| Vehicles Available | Male | Female |
| No Vehicle | 9 (7.3%) | 3 (2.8%) |
| 1 Vehicle | 43 (34.7%) | 29 (27.4%) |
| 2 Vehicles | 35 (28.2%) | 25 (23.6%) |
| 3 Vehicles | 37 (29.8%) | 49 (46.2%) |
| 4 Vehicles | 0 (0.0%) | 0 (0.0%) |
| 5 or more Vehicles | 0 (0.0%) | 0 (0.0%) |
| Total | 124 (100.0%) | 106 (100.0%) |
Commute Time in Soudersburg
The most frequently occuring commute durations in Soudersburg are 20 to 24 minutes (57 commuters, 24.8%), 10 to 14 minutes (49 commuters, 21.3%), and 5 to 9 minutes (46 commuters, 20.0%).
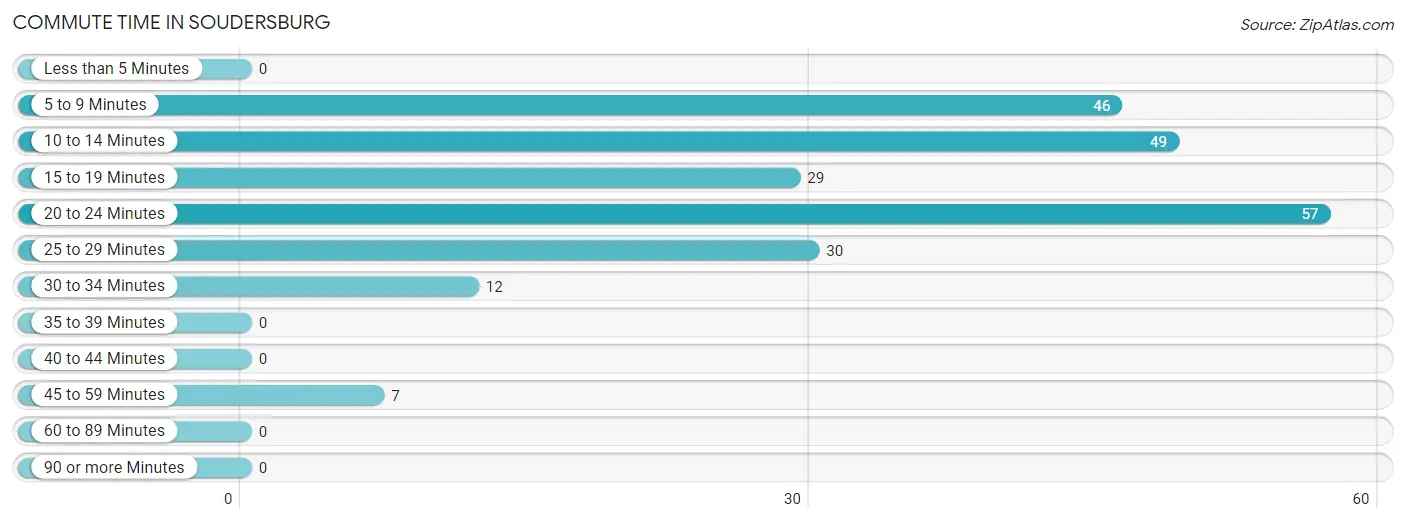
| Commute Time | # Commuters | % Commuters |
| Less than 5 Minutes | 0 | 0.0% |
| 5 to 9 Minutes | 46 | 20.0% |
| 10 to 14 Minutes | 49 | 21.3% |
| 15 to 19 Minutes | 29 | 12.6% |
| 20 to 24 Minutes | 57 | 24.8% |
| 25 to 29 Minutes | 30 | 13.0% |
| 30 to 34 Minutes | 12 | 5.2% |
| 35 to 39 Minutes | 0 | 0.0% |
| 40 to 44 Minutes | 0 | 0.0% |
| 45 to 59 Minutes | 7 | 3.0% |
| 60 to 89 Minutes | 0 | 0.0% |
| 90 or more Minutes | 0 | 0.0% |
Commute Time by Sex in Soudersburg
The most common commute times in Soudersburg are 5 to 9 minutes (46 commuters, 37.1%) for males and 10 to 14 minutes (49 commuters, 46.2%) for females.
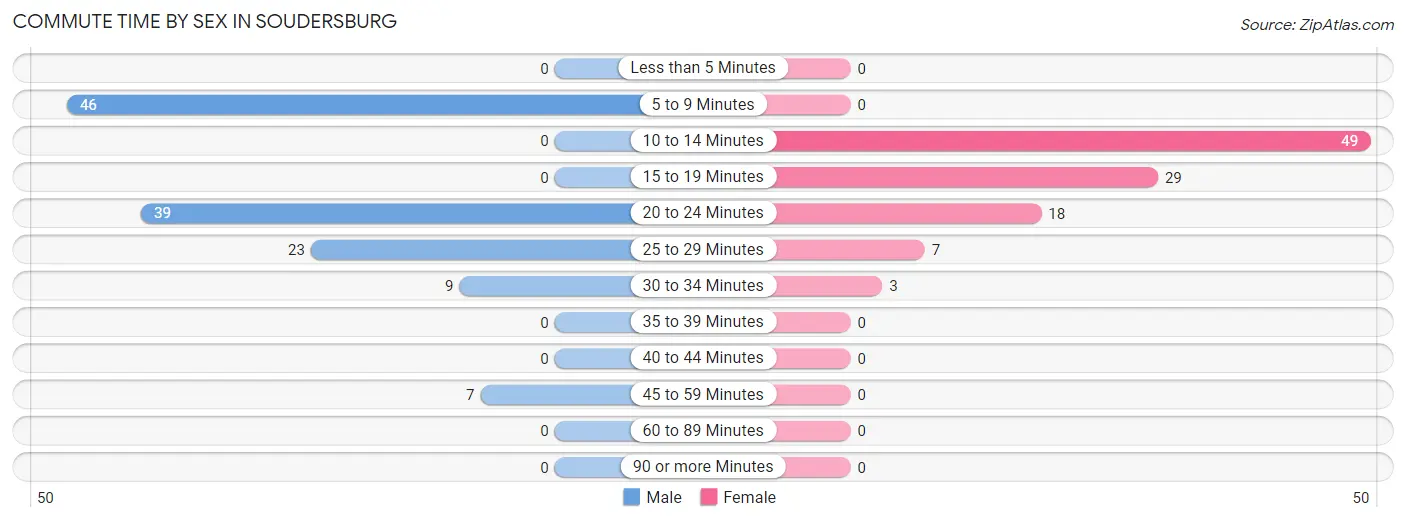
| Commute Time | Male | Female |
| Less than 5 Minutes | 0 (0.0%) | 0 (0.0%) |
| 5 to 9 Minutes | 46 (37.1%) | 0 (0.0%) |
| 10 to 14 Minutes | 0 (0.0%) | 49 (46.2%) |
| 15 to 19 Minutes | 0 (0.0%) | 29 (27.4%) |
| 20 to 24 Minutes | 39 (31.5%) | 18 (17.0%) |
| 25 to 29 Minutes | 23 (18.5%) | 7 (6.6%) |
| 30 to 34 Minutes | 9 (7.3%) | 3 (2.8%) |
| 35 to 39 Minutes | 0 (0.0%) | 0 (0.0%) |
| 40 to 44 Minutes | 0 (0.0%) | 0 (0.0%) |
| 45 to 59 Minutes | 7 (5.7%) | 0 (0.0%) |
| 60 to 89 Minutes | 0 (0.0%) | 0 (0.0%) |
| 90 or more Minutes | 0 (0.0%) | 0 (0.0%) |
Time of Departure to Work by Sex in Soudersburg
The most frequent times of departure to work in Soudersburg are 6:00 AM to 6:29 AM (44, 35.5%) for males and 4:00 PM to 11:59 PM (49, 46.2%) for females.
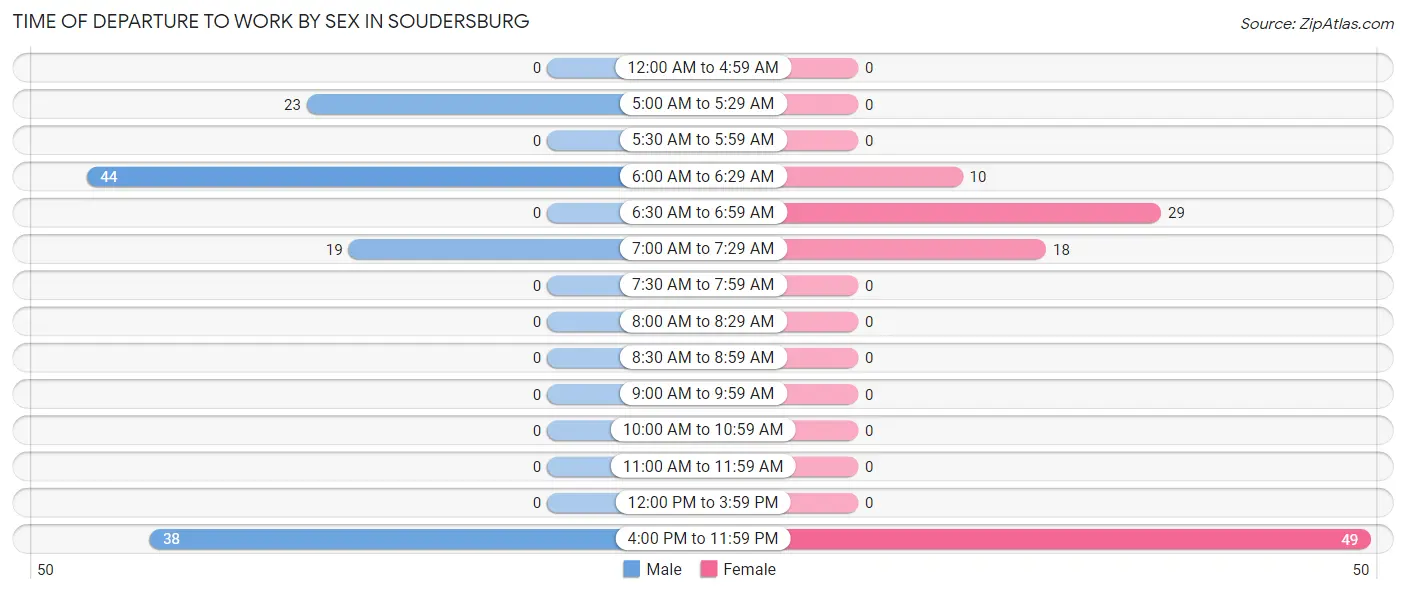
| Time of Departure | Male | Female |
| 12:00 AM to 4:59 AM | 0 (0.0%) | 0 (0.0%) |
| 5:00 AM to 5:29 AM | 23 (18.5%) | 0 (0.0%) |
| 5:30 AM to 5:59 AM | 0 (0.0%) | 0 (0.0%) |
| 6:00 AM to 6:29 AM | 44 (35.5%) | 10 (9.4%) |
| 6:30 AM to 6:59 AM | 0 (0.0%) | 29 (27.4%) |
| 7:00 AM to 7:29 AM | 19 (15.3%) | 18 (17.0%) |
| 7:30 AM to 7:59 AM | 0 (0.0%) | 0 (0.0%) |
| 8:00 AM to 8:29 AM | 0 (0.0%) | 0 (0.0%) |
| 8:30 AM to 8:59 AM | 0 (0.0%) | 0 (0.0%) |
| 9:00 AM to 9:59 AM | 0 (0.0%) | 0 (0.0%) |
| 10:00 AM to 10:59 AM | 0 (0.0%) | 0 (0.0%) |
| 11:00 AM to 11:59 AM | 0 (0.0%) | 0 (0.0%) |
| 12:00 PM to 3:59 PM | 0 (0.0%) | 0 (0.0%) |
| 4:00 PM to 11:59 PM | 38 (30.6%) | 49 (46.2%) |
| Total | 124 (100.0%) | 106 (100.0%) |
Housing Occupancy in Soudersburg
Occupancy by Ownership in Soudersburg
Of the total 185 dwellings in Soudersburg, owner-occupied units account for 83 (44.9%), while renter-occupied units make up 102 (55.1%).
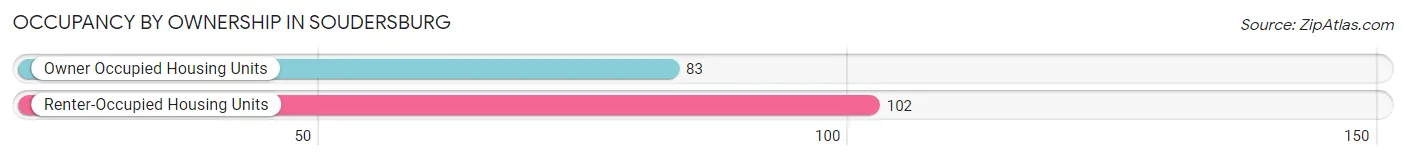
| Occupancy | # Housing Units | % Housing Units |
| Owner Occupied Housing Units | 83 | 44.9% |
| Renter-Occupied Housing Units | 102 | 55.1% |
| Total Occupied Housing Units | 185 | 100.0% |
Occupancy by Household Size in Soudersburg
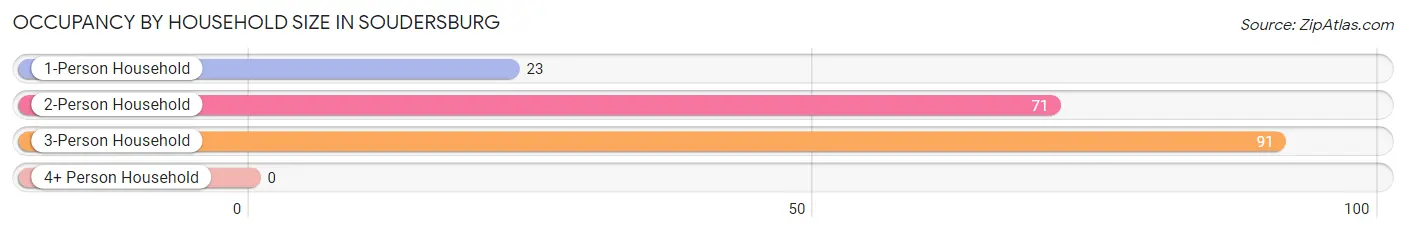
| Household Size | # Housing Units | % Housing Units |
| 1-Person Household | 23 | 12.4% |
| 2-Person Household | 71 | 38.4% |
| 3-Person Household | 91 | 49.2% |
| 4+ Person Household | 0 | 0.0% |
| Total Housing Units | 185 | 100.0% |
Occupancy by Ownership by Household Size in Soudersburg
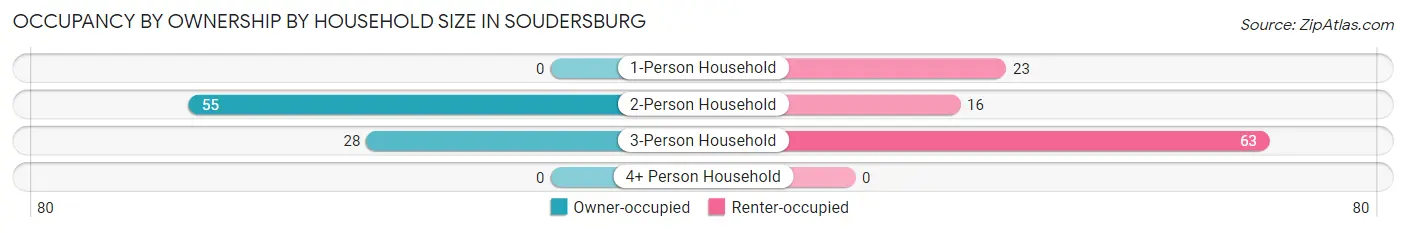
| Household Size | Owner-occupied | Renter-occupied |
| 1-Person Household | 0 (0.0%) | 23 (100.0%) |
| 2-Person Household | 55 (77.5%) | 16 (22.5%) |
| 3-Person Household | 28 (30.8%) | 63 (69.2%) |
| 4+ Person Household | 0 (0.0%) | 0 (0.0%) |
| Total Housing Units | 83 (44.9%) | 102 (55.1%) |
Occupancy by Educational Attainment in Soudersburg
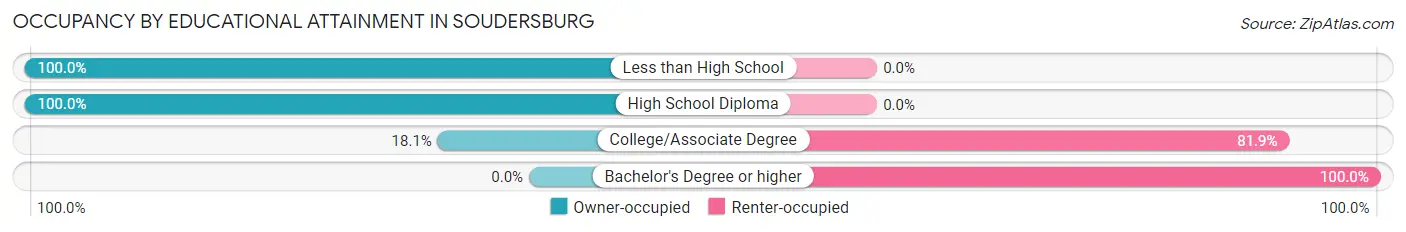
| Household Size | Owner-occupied | Renter-occupied |
| Less than High School | 25 (100.0%) | 0 (0.0%) |
| High School Diploma | 39 (100.0%) | 0 (0.0%) |
| College/Associate Degree | 19 (18.1%) | 86 (81.9%) |
| Bachelor's Degree or higher | 0 (0.0%) | 16 (100.0%) |
Occupancy by Age of Householder in Soudersburg
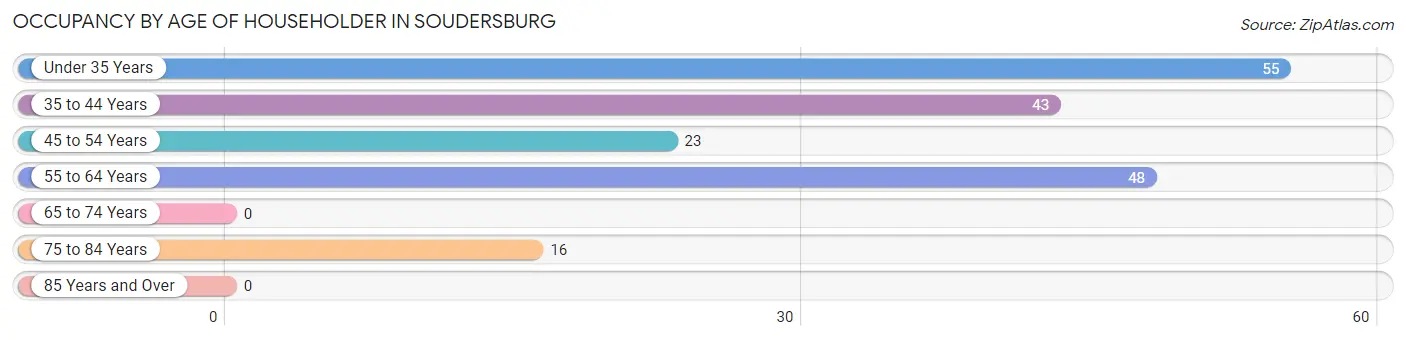
| Age Bracket | # Households | % Households |
| Under 35 Years | 55 | 29.7% |
| 35 to 44 Years | 43 | 23.2% |
| 45 to 54 Years | 23 | 12.4% |
| 55 to 64 Years | 48 | 26.0% |
| 65 to 74 Years | 0 | 0.0% |
| 75 to 84 Years | 16 | 8.6% |
| 85 Years and Over | 0 | 0.0% |
| Total | 185 | 100.0% |
Housing Finances in Soudersburg
Median Income by Occupancy in Soudersburg
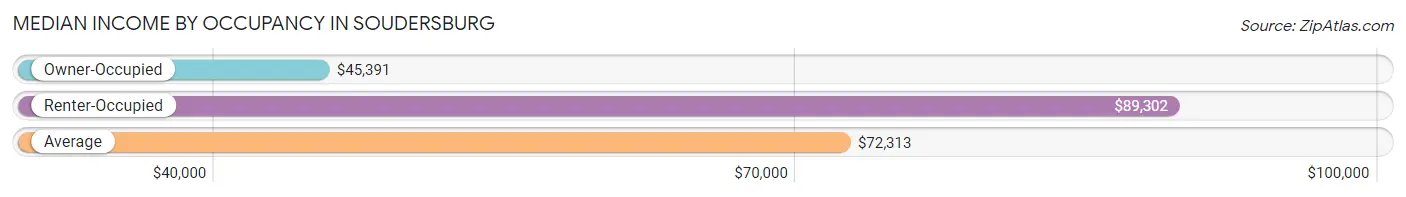
| Occupancy Type | # Households | Median Income |
| Owner-Occupied | 83 (44.9%) | $45,391 |
| Renter-Occupied | 102 (55.1%) | $89,302 |
| Average | 185 (100.0%) | $72,313 |
Occupancy by Householder Income Bracket in Soudersburg
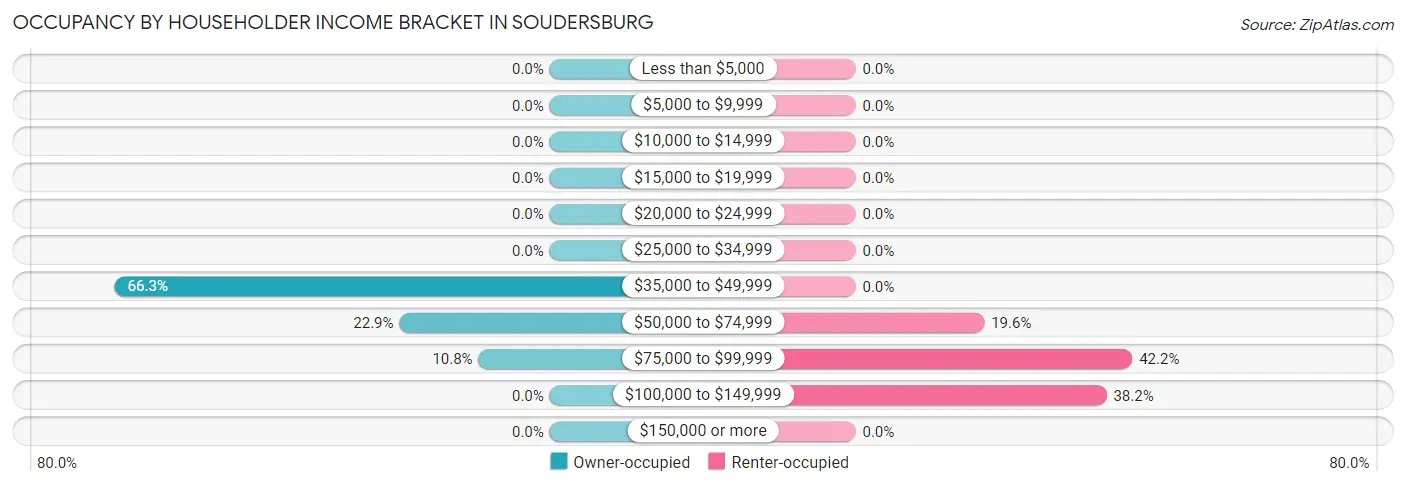
| Income Bracket | Owner-occupied | Renter-occupied |
| Less than $5,000 | 0 (0.0%) | 0 (0.0%) |
| $5,000 to $9,999 | 0 (0.0%) | 0 (0.0%) |
| $10,000 to $14,999 | 0 (0.0%) | 0 (0.0%) |
| $15,000 to $19,999 | 0 (0.0%) | 0 (0.0%) |
| $20,000 to $24,999 | 0 (0.0%) | 0 (0.0%) |
| $25,000 to $34,999 | 0 (0.0%) | 0 (0.0%) |
| $35,000 to $49,999 | 55 (66.3%) | 0 (0.0%) |
| $50,000 to $74,999 | 19 (22.9%) | 20 (19.6%) |
| $75,000 to $99,999 | 9 (10.8%) | 43 (42.2%) |
| $100,000 to $149,999 | 0 (0.0%) | 39 (38.2%) |
| $150,000 or more | 0 (0.0%) | 0 (0.0%) |
| Total | 83 (100.0%) | 102 (100.0%) |
Monthly Housing Cost Tiers in Soudersburg
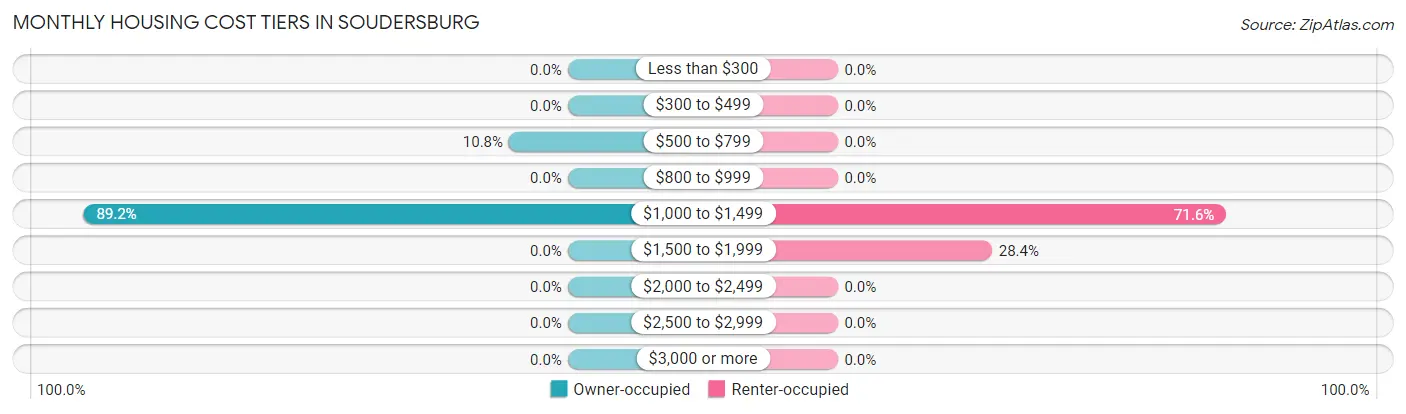
| Monthly Cost | Owner-occupied | Renter-occupied |
| Less than $300 | 0 (0.0%) | 0 (0.0%) |
| $300 to $499 | 0 (0.0%) | 0 (0.0%) |
| $500 to $799 | 9 (10.8%) | 0 (0.0%) |
| $800 to $999 | 0 (0.0%) | 0 (0.0%) |
| $1,000 to $1,499 | 74 (89.2%) | 73 (71.6%) |
| $1,500 to $1,999 | 0 (0.0%) | 29 (28.4%) |
| $2,000 to $2,499 | 0 (0.0%) | 0 (0.0%) |
| $2,500 to $2,999 | 0 (0.0%) | 0 (0.0%) |
| $3,000 or more | 0 (0.0%) | 0 (0.0%) |
| Total | 83 (100.0%) | 102 (100.0%) |
Physical Housing Characteristics in Soudersburg
Housing Structures in Soudersburg
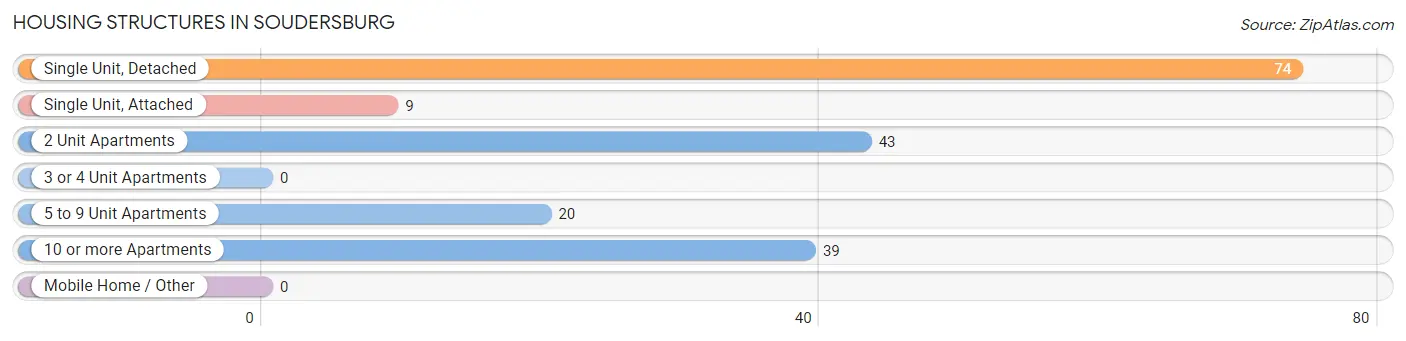
| Structure Type | # Housing Units | % Housing Units |
| Single Unit, Detached | 74 | 40.0% |
| Single Unit, Attached | 9 | 4.9% |
| 2 Unit Apartments | 43 | 23.2% |
| 3 or 4 Unit Apartments | 0 | 0.0% |
| 5 to 9 Unit Apartments | 20 | 10.8% |
| 10 or more Apartments | 39 | 21.1% |
| Mobile Home / Other | 0 | 0.0% |
| Total | 185 | 100.0% |
Housing Structures by Occupancy in Soudersburg
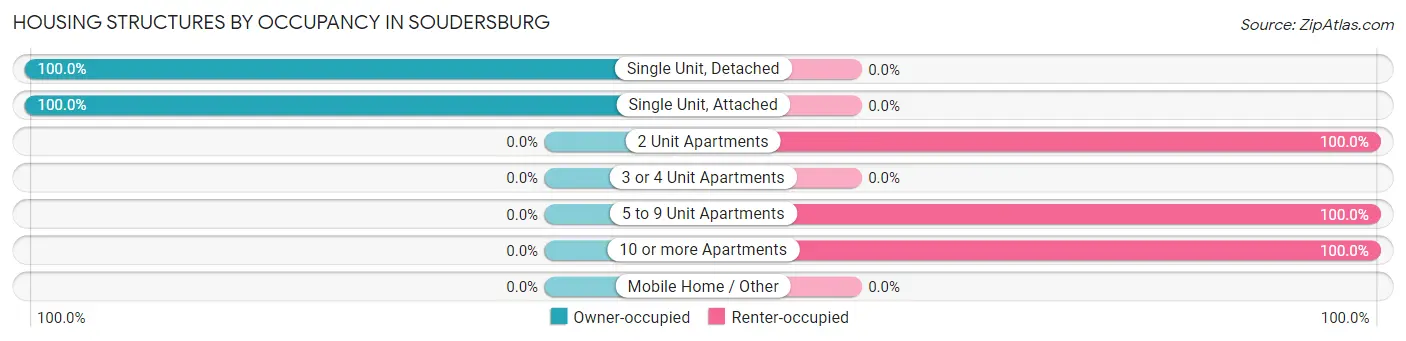
| Structure Type | Owner-occupied | Renter-occupied |
| Single Unit, Detached | 74 (100.0%) | 0 (0.0%) |
| Single Unit, Attached | 9 (100.0%) | 0 (0.0%) |
| 2 Unit Apartments | 0 (0.0%) | 43 (100.0%) |
| 3 or 4 Unit Apartments | 0 (0.0%) | 0 (0.0%) |
| 5 to 9 Unit Apartments | 0 (0.0%) | 20 (100.0%) |
| 10 or more Apartments | 0 (0.0%) | 39 (100.0%) |
| Mobile Home / Other | 0 (0.0%) | 0 (0.0%) |
| Total | 83 (44.9%) | 102 (55.1%) |
Housing Structures by Number of Rooms in Soudersburg
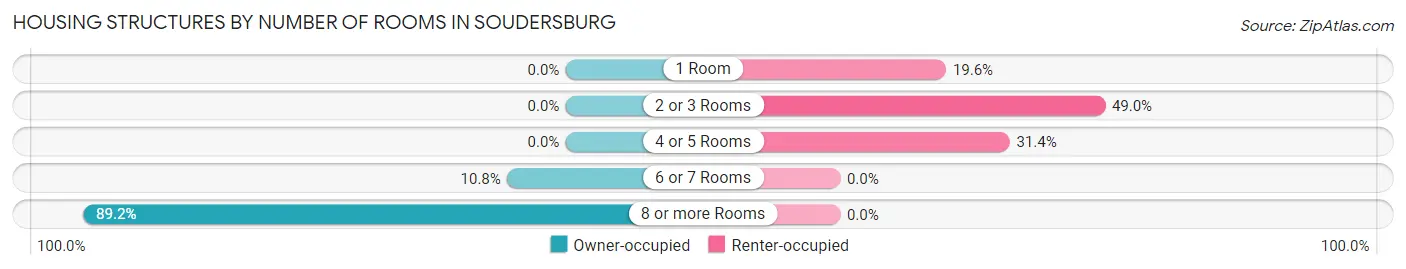
| Number of Rooms | Owner-occupied | Renter-occupied |
| 1 Room | 0 (0.0%) | 20 (19.6%) |
| 2 or 3 Rooms | 0 (0.0%) | 50 (49.0%) |
| 4 or 5 Rooms | 0 (0.0%) | 32 (31.4%) |
| 6 or 7 Rooms | 9 (10.8%) | 0 (0.0%) |
| 8 or more Rooms | 74 (89.2%) | 0 (0.0%) |
| Total | 83 (100.0%) | 102 (100.0%) |
Housing Structure by Heating Type in Soudersburg
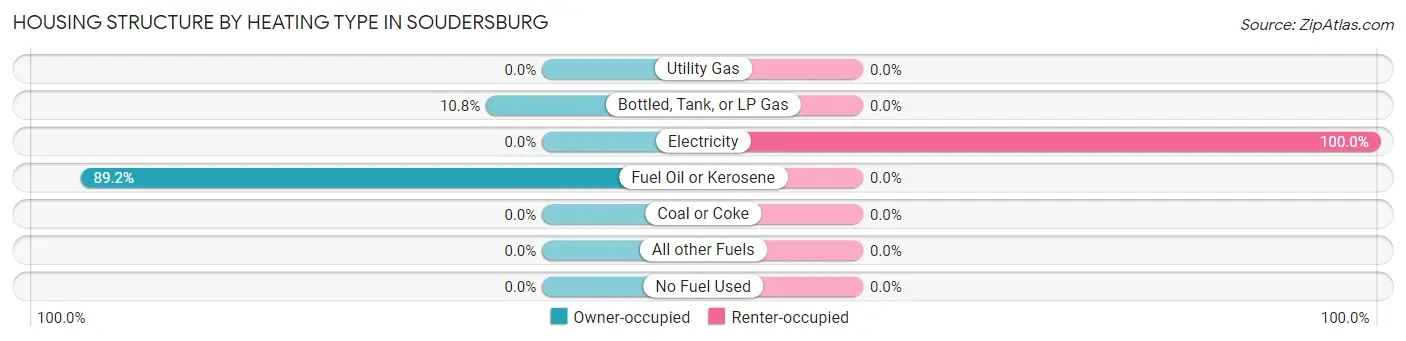
| Heating Type | Owner-occupied | Renter-occupied |
| Utility Gas | 0 (0.0%) | 0 (0.0%) |
| Bottled, Tank, or LP Gas | 9 (10.8%) | 0 (0.0%) |
| Electricity | 0 (0.0%) | 102 (100.0%) |
| Fuel Oil or Kerosene | 74 (89.2%) | 0 (0.0%) |
| Coal or Coke | 0 (0.0%) | 0 (0.0%) |
| All other Fuels | 0 (0.0%) | 0 (0.0%) |
| No Fuel Used | 0 (0.0%) | 0 (0.0%) |
| Total | 83 (100.0%) | 102 (100.0%) |
Household Vehicle Usage in Soudersburg
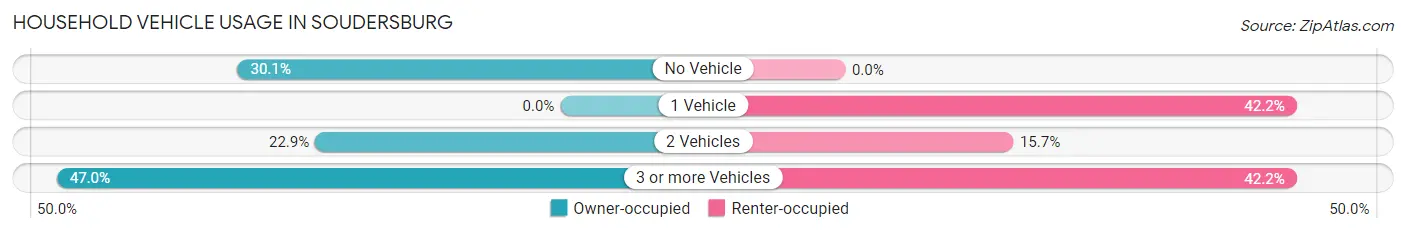
| Vehicles per Household | Owner-occupied | Renter-occupied |
| No Vehicle | 25 (30.1%) | 0 (0.0%) |
| 1 Vehicle | 0 (0.0%) | 43 (42.2%) |
| 2 Vehicles | 19 (22.9%) | 16 (15.7%) |
| 3 or more Vehicles | 39 (47.0%) | 43 (42.2%) |
| Total | 83 (100.0%) | 102 (100.0%) |
Real Estate & Mortgages in Soudersburg
Real Estate and Mortgage Overview in Soudersburg
| Characteristic | Without Mortgage | With Mortgage |
| Housing Units | 9 | 74 |
| Median Property Value | - | - |
| Median Household Income | - | - |
| Monthly Housing Costs | - | - |
| Real Estate Taxes | - | - |
Property Value by Mortgage Status in Soudersburg
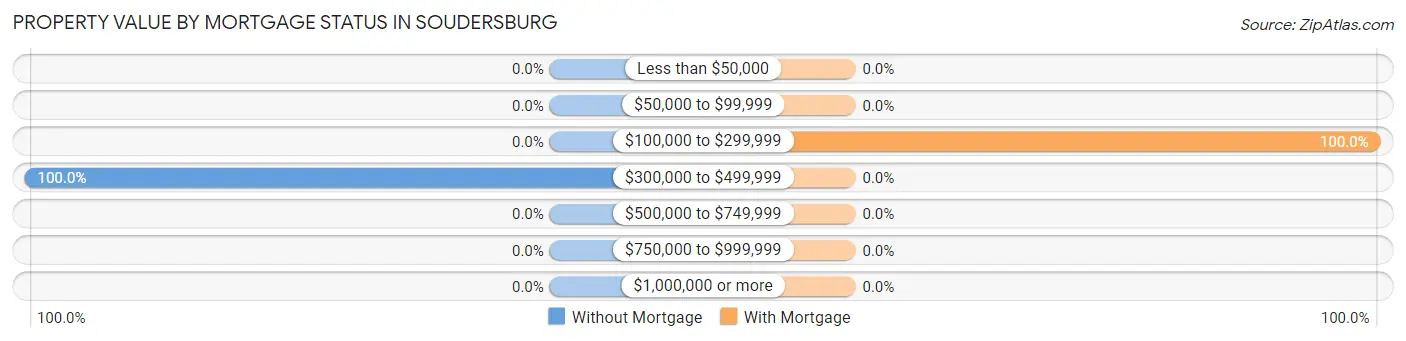
| Property Value | Without Mortgage | With Mortgage |
| Less than $50,000 | 0 (0.0%) | 0 (0.0%) |
| $50,000 to $99,999 | 0 (0.0%) | 0 (0.0%) |
| $100,000 to $299,999 | 0 (0.0%) | 74 (100.0%) |
| $300,000 to $499,999 | 9 (100.0%) | 0 (0.0%) |
| $500,000 to $749,999 | 0 (0.0%) | 0 (0.0%) |
| $750,000 to $999,999 | 0 (0.0%) | 0 (0.0%) |
| $1,000,000 or more | 0 (0.0%) | 0 (0.0%) |
| Total | 9 (100.0%) | 74 (100.0%) |
Household Income by Mortgage Status in Soudersburg
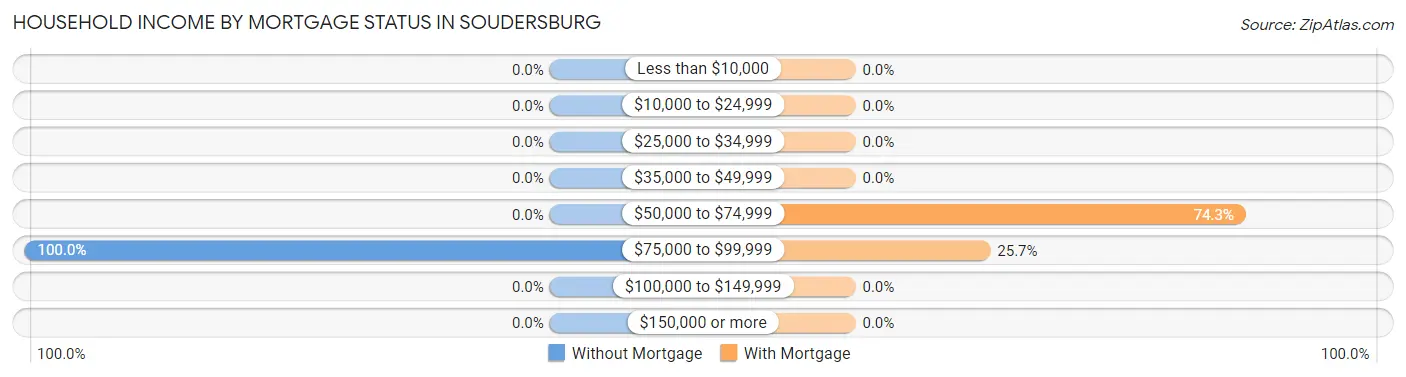
| Household Income | Without Mortgage | With Mortgage |
| Less than $10,000 | 0 (0.0%) | 0 (0.0%) |
| $10,000 to $24,999 | 0 (0.0%) | 0 (0.0%) |
| $25,000 to $34,999 | 0 (0.0%) | 0 (0.0%) |
| $35,000 to $49,999 | 0 (0.0%) | 0 (0.0%) |
| $50,000 to $74,999 | 0 (0.0%) | 55 (74.3%) |
| $75,000 to $99,999 | 9 (100.0%) | 19 (25.7%) |
| $100,000 to $149,999 | 0 (0.0%) | 0 (0.0%) |
| $150,000 or more | 0 (0.0%) | 0 (0.0%) |
| Total | 9 (100.0%) | 74 (100.0%) |
Property Value to Household Income Ratio in Soudersburg
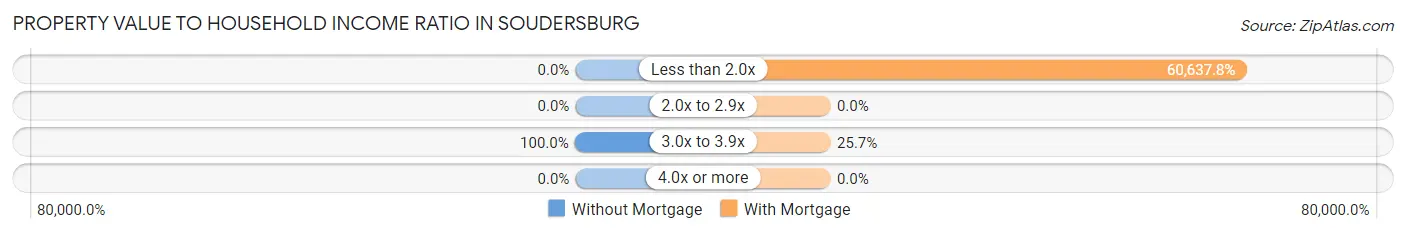
| Value-to-Income Ratio | Without Mortgage | With Mortgage |
| Less than 2.0x | 0 (0.0%) | 44,872 (60,637.8%) |
| 2.0x to 2.9x | 0 (0.0%) | 0 (0.0%) |
| 3.0x to 3.9x | 9 (100.0%) | 19 (25.7%) |
| 4.0x or more | 0 (0.0%) | 0 (0.0%) |
| Total | 9 (100.0%) | 74 (100.0%) |
Real Estate Taxes by Mortgage Status in Soudersburg
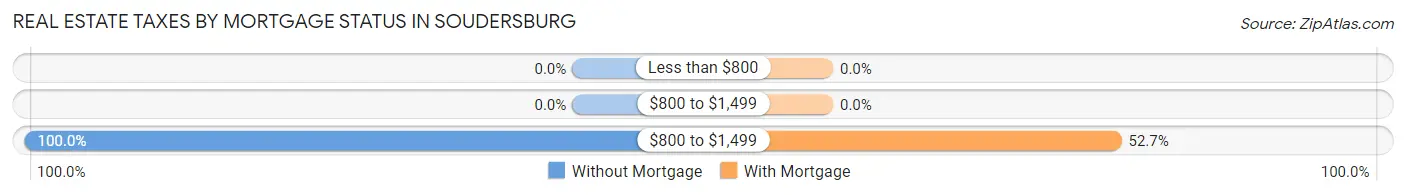
| Property Taxes | Without Mortgage | With Mortgage |
| Less than $800 | 0 (0.0%) | 0 (0.0%) |
| $800 to $1,499 | 0 (0.0%) | 0 (0.0%) |
| $800 to $1,499 | 9 (100.0%) | 39 (52.7%) |
| Total | 9 (100.0%) | 74 (100.0%) |
Health & Disability in Soudersburg
Health Insurance Coverage by Age in Soudersburg
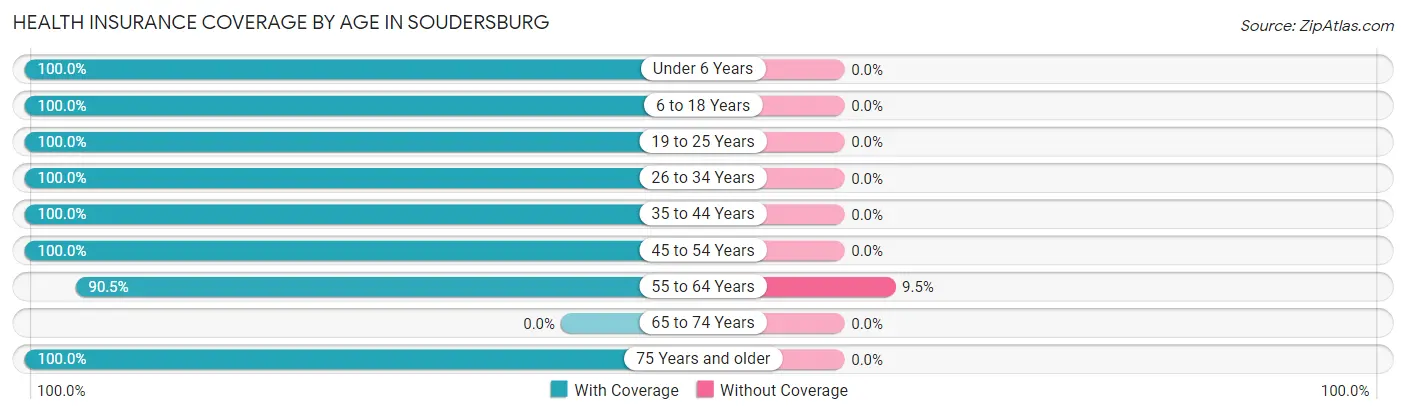
| Age Bracket | With Coverage | Without Coverage |
| Under 6 Years | 89 (100.0%) | 0 (0.0%) |
| 6 to 18 Years | 8 (100.0%) | 0 (0.0%) |
| 19 to 25 Years | 63 (100.0%) | 0 (0.0%) |
| 26 to 34 Years | 49 (100.0%) | 0 (0.0%) |
| 35 to 44 Years | 92 (100.0%) | 0 (0.0%) |
| 45 to 54 Years | 23 (100.0%) | 0 (0.0%) |
| 55 to 64 Years | 86 (90.5%) | 9 (9.5%) |
| 65 to 74 Years | 0 (0.0%) | 0 (0.0%) |
| 75 Years and older | 34 (100.0%) | 0 (0.0%) |
| Total | 444 (98.0%) | 9 (2.0%) |
Health Insurance Coverage by Citizenship Status in Soudersburg
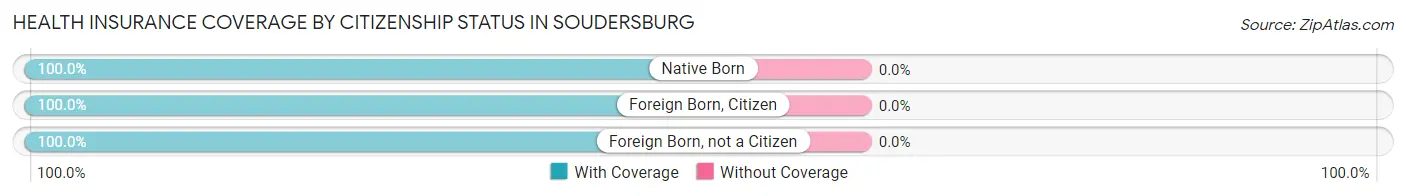
| Citizenship Status | With Coverage | Without Coverage |
| Native Born | 89 (100.0%) | 0 (0.0%) |
| Foreign Born, Citizen | 8 (100.0%) | 0 (0.0%) |
| Foreign Born, not a Citizen | 63 (100.0%) | 0 (0.0%) |
Health Insurance Coverage by Household Income in Soudersburg
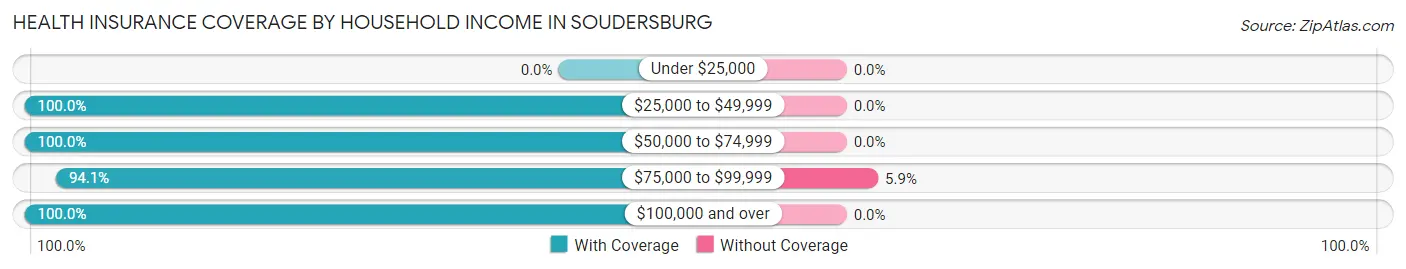
| Household Income | With Coverage | Without Coverage |
| Under $25,000 | 0 (0.0%) | 0 (0.0%) |
| $25,000 to $49,999 | 110 (100.0%) | 0 (0.0%) |
| $50,000 to $74,999 | 136 (100.0%) | 0 (0.0%) |
| $75,000 to $99,999 | 144 (94.1%) | 9 (5.9%) |
| $100,000 and over | 54 (100.0%) | 0 (0.0%) |
Public vs Private Health Insurance Coverage by Age in Soudersburg
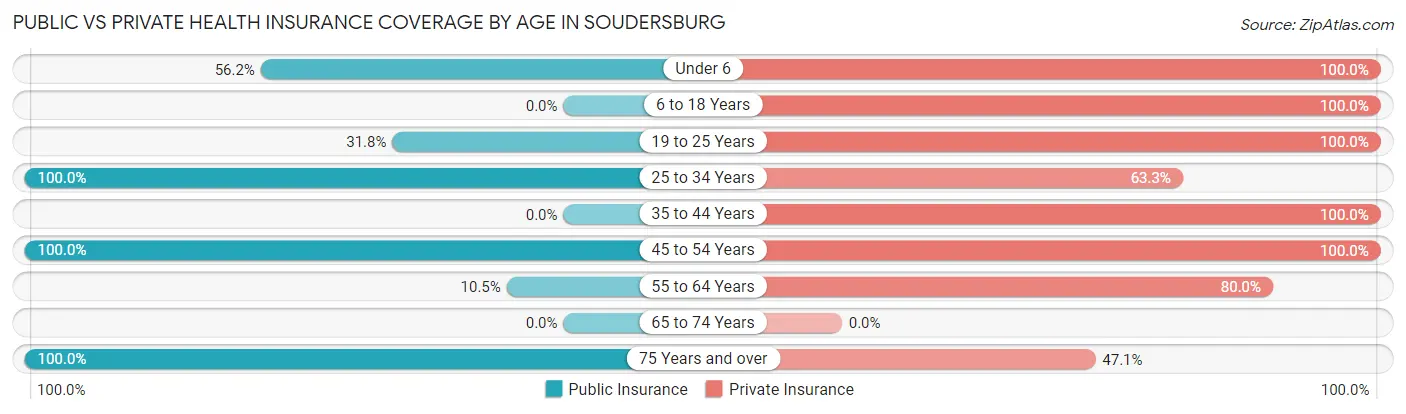
| Age Bracket | Public Insurance | Private Insurance |
| Under 6 | 50 (56.2%) | 89 (100.0%) |
| 6 to 18 Years | 0 (0.0%) | 8 (100.0%) |
| 19 to 25 Years | 20 (31.8%) | 63 (100.0%) |
| 25 to 34 Years | 49 (100.0%) | 31 (63.3%) |
| 35 to 44 Years | 0 (0.0%) | 92 (100.0%) |
| 45 to 54 Years | 23 (100.0%) | 23 (100.0%) |
| 55 to 64 Years | 10 (10.5%) | 76 (80.0%) |
| 65 to 74 Years | 0 (0.0%) | 0 (0.0%) |
| 75 Years and over | 34 (100.0%) | 16 (47.1%) |
| Total | 186 (41.1%) | 398 (87.9%) |
Disability Status by Sex by Age in Soudersburg
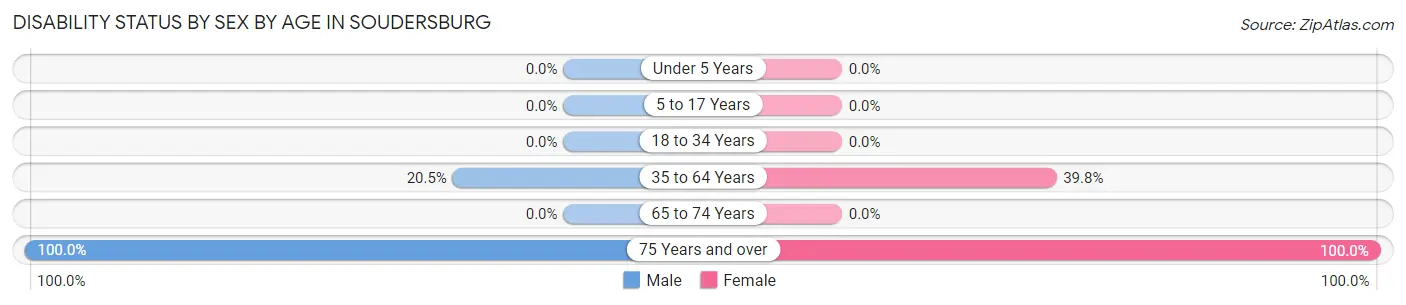
| Age Bracket | Male | Female |
| Under 5 Years | 0 (0.0%) | 0 (0.0%) |
| 5 to 17 Years | 0 (0.0%) | 0 (0.0%) |
| 18 to 34 Years | 0 (0.0%) | 0 (0.0%) |
| 35 to 64 Years | 23 (20.5%) | 39 (39.8%) |
| 65 to 74 Years | 0 (0.0%) | 0 (0.0%) |
| 75 Years and over | 16 (100.0%) | 18 (100.0%) |
Disability Class by Sex by Age in Soudersburg
Disability Class: Hearing Difficulty
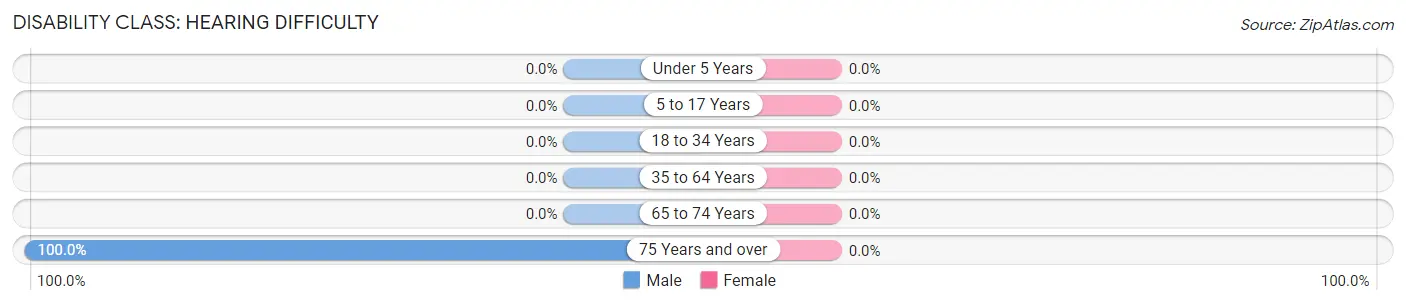
| Age Bracket | Male | Female |
| Under 5 Years | 0 (0.0%) | 0 (0.0%) |
| 5 to 17 Years | 0 (0.0%) | 0 (0.0%) |
| 18 to 34 Years | 0 (0.0%) | 0 (0.0%) |
| 35 to 64 Years | 0 (0.0%) | 0 (0.0%) |
| 65 to 74 Years | 0 (0.0%) | 0 (0.0%) |
| 75 Years and over | 16 (100.0%) | 0 (0.0%) |
Disability Class: Vision Difficulty
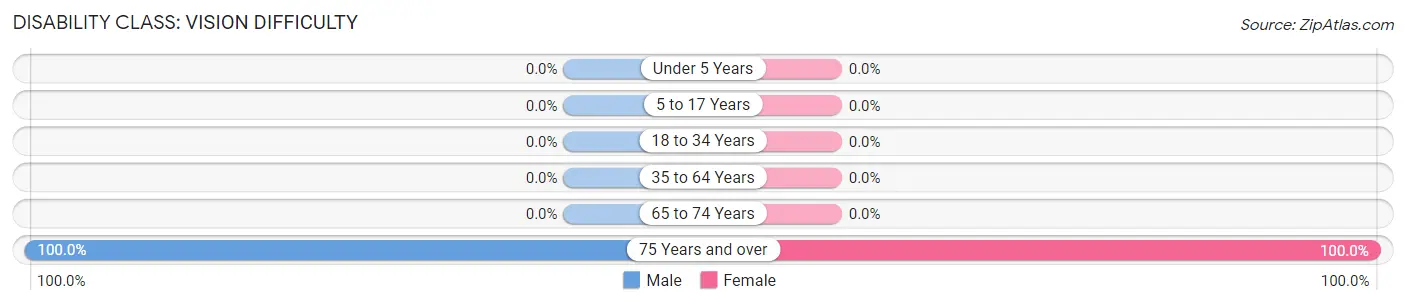
| Age Bracket | Male | Female |
| Under 5 Years | 0 (0.0%) | 0 (0.0%) |
| 5 to 17 Years | 0 (0.0%) | 0 (0.0%) |
| 18 to 34 Years | 0 (0.0%) | 0 (0.0%) |
| 35 to 64 Years | 0 (0.0%) | 0 (0.0%) |
| 65 to 74 Years | 0 (0.0%) | 0 (0.0%) |
| 75 Years and over | 16 (100.0%) | 18 (100.0%) |
Disability Class: Cognitive Difficulty
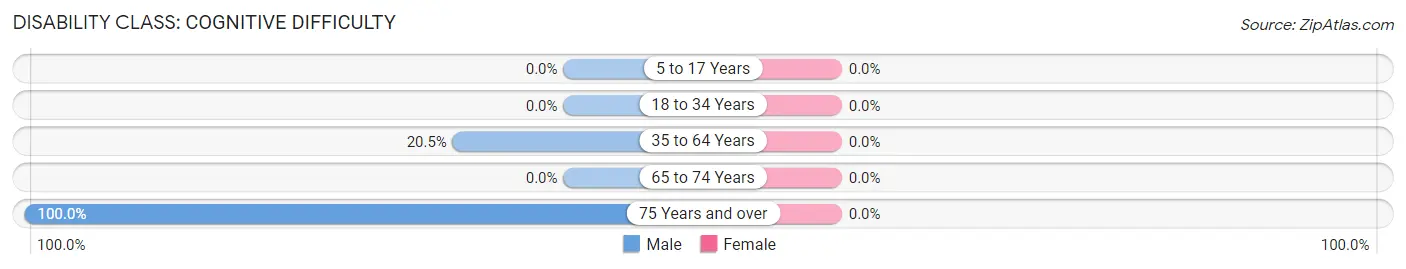
| Age Bracket | Male | Female |
| 5 to 17 Years | 0 (0.0%) | 0 (0.0%) |
| 18 to 34 Years | 0 (0.0%) | 0 (0.0%) |
| 35 to 64 Years | 23 (20.5%) | 0 (0.0%) |
| 65 to 74 Years | 0 (0.0%) | 0 (0.0%) |
| 75 Years and over | 16 (100.0%) | 0 (0.0%) |
Disability Class: Ambulatory Difficulty
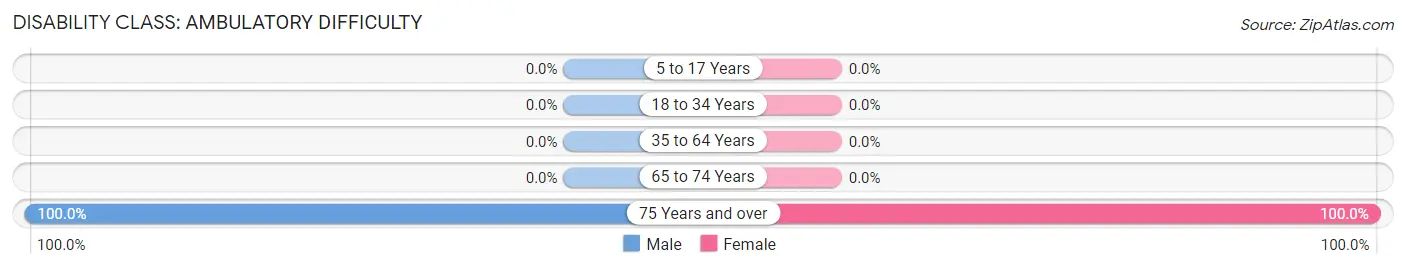
| Age Bracket | Male | Female |
| 5 to 17 Years | 0 (0.0%) | 0 (0.0%) |
| 18 to 34 Years | 0 (0.0%) | 0 (0.0%) |
| 35 to 64 Years | 0 (0.0%) | 0 (0.0%) |
| 65 to 74 Years | 0 (0.0%) | 0 (0.0%) |
| 75 Years and over | 16 (100.0%) | 18 (100.0%) |
Disability Class: Self-Care Difficulty
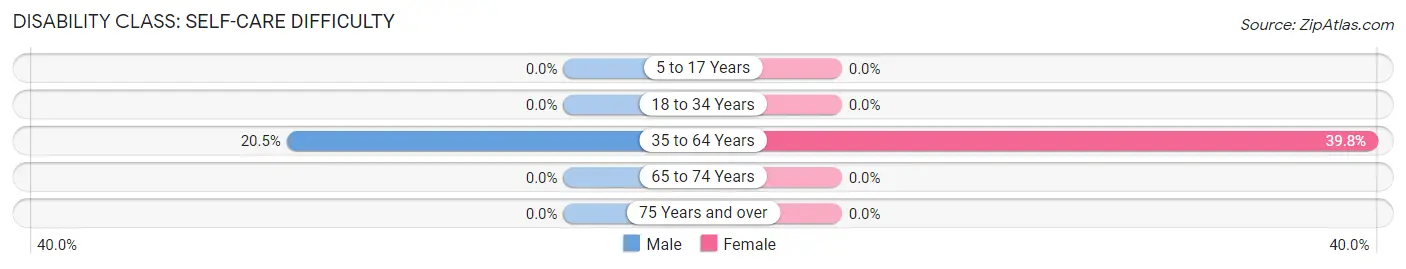
| Age Bracket | Male | Female |
| 5 to 17 Years | 0 (0.0%) | 0 (0.0%) |
| 18 to 34 Years | 0 (0.0%) | 0 (0.0%) |
| 35 to 64 Years | 23 (20.5%) | 39 (39.8%) |
| 65 to 74 Years | 0 (0.0%) | 0 (0.0%) |
| 75 Years and over | 0 (0.0%) | 0 (0.0%) |
Technology Access in Soudersburg
Computing Device Access in Soudersburg
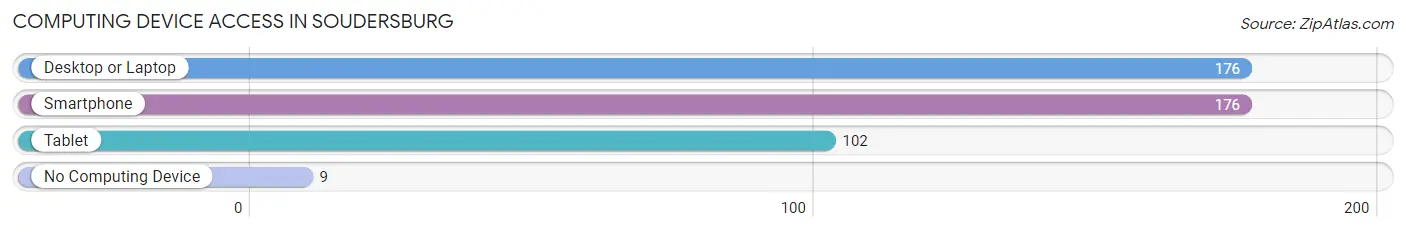
| Device Type | # Households | % Households |
| Desktop or Laptop | 176 | 95.1% |
| Smartphone | 176 | 95.1% |
| Tablet | 102 | 55.1% |
| No Computing Device | 9 | 4.9% |
| Total | 185 | 100.0% |
Internet Access in Soudersburg
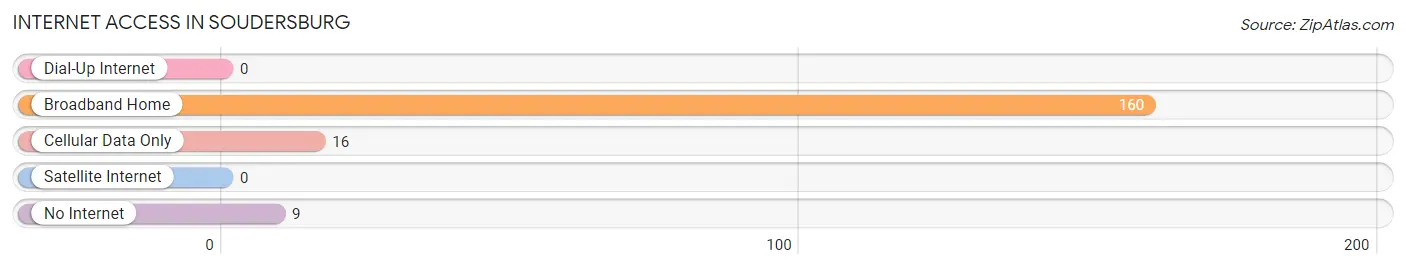
| Internet Type | # Households | % Households |
| Dial-Up Internet | 0 | 0.0% |
| Broadband Home | 160 | 86.5% |
| Cellular Data Only | 16 | 8.6% |
| Satellite Internet | 0 | 0.0% |
| No Internet | 9 | 4.9% |
| Total | 185 | 100.0% |
Soudersburg Summary
Soudersburg is a small unincorporated community located in Lancaster County, Pennsylvania. It is situated in the southeastern corner of the county, near the border with Maryland. The community is located along the Susquehanna River, and is part of the Lancaster Metropolitan Statistical Area.
History
Soudersburg was first settled in the late 1700s by German immigrants. The community was named after the Souders family, who were among the first settlers. The Souders family owned a large tract of land in the area, and the community was built around their homestead.
The community grew slowly over the years, and by the early 1900s, it had become a small farming community. The population peaked in the 1950s, when it had a population of around 500 people. Since then, the population has declined, and as of the 2010 census, the population was just over 200 people.
Geography
Soudersburg is located in southeastern Lancaster County, near the border with Maryland. It is situated along the Susquehanna River, and is part of the Lancaster Metropolitan Statistical Area. The community is located at an elevation of approximately 500 feet above sea level.
The climate in Soudersburg is classified as humid continental, with hot summers and cold winters. The average annual temperature is around 50 degrees Fahrenheit, and the average annual precipitation is around 40 inches.
Economy
The economy of Soudersburg is largely based on agriculture. The community is home to several farms, which produce a variety of crops, including corn, soybeans, and hay. The community also has a few small businesses, including a general store, a gas station, and a restaurant.
Demographics
As of the 2010 census, the population of Soudersburg was 209 people. The racial makeup of the community was 97.6% White, 0.5% African American, 0.5% Native American, 0.5% Asian, and 0.9% from other races. The median household income was $45,000, and the median family income was $50,000.
Conclusion
Soudersburg is a small unincorporated community located in southeastern Lancaster County, Pennsylvania. It is situated along the Susquehanna River, and is part of the Lancaster Metropolitan Statistical Area. The economy of the community is largely based on agriculture, and the population is around 200 people. The racial makeup of the community is predominantly White, with a small percentage of African American, Native American, and Asian residents.
Common Questions
What is Per Capita Income in Soudersburg?
Per Capita income in Soudersburg is $32,073.
What is the Median Family Income in Soudersburg?
Median Family Income in Soudersburg is $55,329.
What is the Median Household income in Soudersburg?
Median Household Income in Soudersburg is $72,313.
What is Income or Wage Gap in Soudersburg?
Income or Wage Gap in Soudersburg is 43.6%.
Women in Soudersburg earn 56.4 cents for every dollar earned by a man.
What is Inequality or Gini Index in Soudersburg?
Inequality or Gini Index in Soudersburg is 0.20.
What is the Total Population of Soudersburg?
Total Population of Soudersburg is 453.
What is the Total Male Population of Soudersburg?
Total Male Population of Soudersburg is 183.
What is the Total Female Population of Soudersburg?
Total Female Population of Soudersburg is 270.
What is the Ratio of Males per 100 Females in Soudersburg?
There are 67.78 Males per 100 Females in Soudersburg.
What is the Ratio of Females per 100 Males in Soudersburg?
There are 147.54 Females per 100 Males in Soudersburg.
What is the Median Population Age in Soudersburg?
Median Population Age in Soudersburg is 35.4 Years.
What is the Average Family Size in Soudersburg
Average Family Size in Soudersburg is 2.5 People.
What is the Average Household Size in Soudersburg
Average Household Size in Soudersburg is 2.5 People.
How Large is the Labor Force in Soudersburg?
There are 230 People in the Labor Forcein in Soudersburg.
What is the Percentage of People in the Labor Force in Soudersburg?
64.6% of People are in the Labor Force in Soudersburg.