Zip Codes with the Highest Percentage of Black / African American Population in Pittsburgh, PA
RELATED REPORTS & OPTIONS
Black / African American
Pittsburgh
Compare Zip Codes
Map of Zip Codes with the Highest Percentage of Black / African American Population in Pittsburgh
0.79%
66.7%
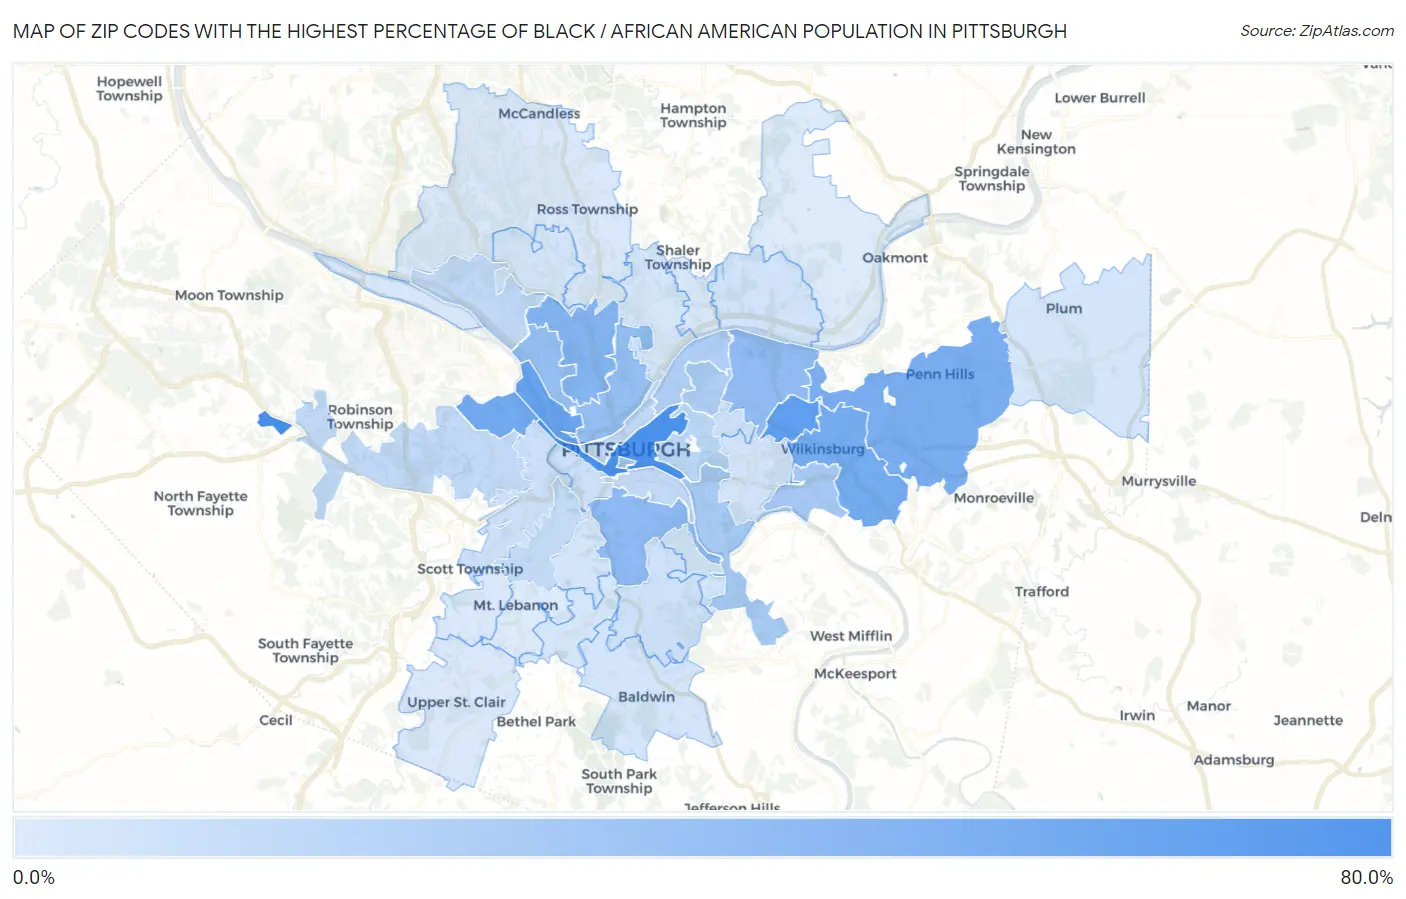
Zip Codes with the Highest Percentage of Black / African American Population in Pittsburgh, PA
| Zip Code | Black / African American | vs State | vs National | |
| 1. | 15275 | 66.7% | 10.8%(+55.8)#20 | 12.5%(+54.2)#636 |
| 2. | 15219 | 64.2% | 10.8%(+53.3)#21 | 12.5%(+51.7)#720 |
| 3. | 15208 | 52.7% | 10.8%(+41.9)#25 | 12.5%(+40.2)#1,118 |
| 4. | 15233 | 47.9% | 10.8%(+37.1)#32 | 12.5%(+35.5)#1,353 |
| 5. | 15204 | 43.7% | 10.8%(+32.9)#39 | 12.5%(+31.2)#1,588 |
| 6. | 15221 | 42.7% | 10.8%(+31.9)#42 | 12.5%(+30.2)#1,652 |
| 7. | 15235 | 40.9% | 10.8%(+30.0)#43 | 12.5%(+28.4)#1,783 |
| 8. | 15214 | 35.7% | 10.8%(+24.9)#50 | 12.5%(+23.2)#2,154 |
| 9. | 15210 | 31.4% | 10.8%(+20.6)#58 | 12.5%(+19.0)#2,524 |
| 10. | 15206 | 29.9% | 10.8%(+19.0)#60 | 12.5%(+17.4)#2,652 |
| 11. | 15212 | 28.1% | 10.8%(+17.2)#70 | 12.5%(+15.6)#2,846 |
| 12. | 15282 | 24.1% | 10.8%(+13.3)#82 | 12.5%(+11.7)#3,336 |
| 13. | 15218 | 21.6% | 10.8%(+10.8)#94 | 12.5%(+9.14)#3,693 |
| 14. | 15207 | 20.9% | 10.8%(+10.0)#96 | 12.5%(+8.39)#3,812 |
| 15. | 15224 | 19.0% | 10.8%(+8.13)#104 | 12.5%(+6.49)#4,133 |
| 16. | 15201 | 17.6% | 10.8%(+6.72)#111 | 12.5%(+5.09)#4,402 |
| 17. | 15213 | 12.8% | 10.8%(+1.98)#149 | 12.5%(+0.352)#5,597 |
| 18. | 15205 | 11.0% | 10.8%(+0.157)#170 | 12.5%(-1.47)#6,238 |
| 19. | 15203 | 10.6% | 10.8%(-0.190)#175 | 12.5%(-1.82)#6,379 |
| 20. | 15222 | 10.4% | 10.8%(-0.392)#178 | 12.5%(-2.02)#6,456 |
| 21. | 15202 | 10.2% | 10.8%(-0.621)#182 | 12.5%(-2.25)#6,548 |
| 22. | 15216 | 9.7% | 10.8%(-1.16)#187 | 12.5%(-2.79)#6,758 |
| 23. | 15211 | 6.6% | 10.8%(-4.26)#254 | 12.5%(-5.89)#8,362 |
| 24. | 15232 | 6.2% | 10.8%(-4.62)#264 | 12.5%(-6.26)#8,610 |
| 25. | 15220 | 6.1% | 10.8%(-4.70)#270 | 12.5%(-6.34)#8,669 |
| 26. | 15227 | 6.0% | 10.8%(-4.85)#273 | 12.5%(-6.48)#8,769 |
| 27. | 15217 | 4.8% | 10.8%(-6.00)#327 | 12.5%(-7.63)#9,688 |
| 28. | 15215 | 4.4% | 10.8%(-6.39)#352 | 12.5%(-8.03)#10,067 |
| 29. | 15239 | 4.2% | 10.8%(-6.65)#366 | 12.5%(-8.28)#10,303 |
| 30. | 15229 | 4.1% | 10.8%(-6.74)#372 | 12.5%(-8.37)#10,407 |
| 31. | 15226 | 3.9% | 10.8%(-6.98)#393 | 12.5%(-8.61)#10,648 |
| 32. | 15236 | 3.7% | 10.8%(-7.11)#402 | 12.5%(-8.74)#10,789 |
| 33. | 15209 | 3.1% | 10.8%(-7.77)#448 | 12.5%(-9.40)#11,710 |
| 34. | 15234 | 2.9% | 10.8%(-7.92)#463 | 12.5%(-9.55)#11,939 |
| 35. | 15225 | 2.2% | 10.8%(-8.62)#520 | 12.5%(-10.3)#13,109 |
| 36. | 15223 | 2.1% | 10.8%(-8.72)#531 | 12.5%(-10.4)#13,314 |
| 37. | 15237 | 1.4% | 10.8%(-9.46)#650 | 12.5%(-11.1)#15,192 |
| 38. | 15241 | 1.4% | 10.8%(-9.48)#653 | 12.5%(-11.1)#15,253 |
| 39. | 15243 | 1.3% | 10.8%(-9.54)#669 | 12.5%(-11.2)#15,445 |
| 40. | 15238 | 1.1% | 10.8%(-9.73)#697 | 12.5%(-11.4)#16,106 |
| 41. | 15228 | 0.79% | 10.8%(-10.0)#784 | 12.5%(-11.7)#17,479 |
1
Common Questions
What are the Top 10 Zip Codes with the Highest Percentage of Black / African American Population in Pittsburgh, PA?
Top 10 Zip Codes with the Highest Percentage of Black / African American Population in Pittsburgh, PA are:
What zip code has the Highest Percentage of Black / African American Population in Pittsburgh, PA?
15275 has the Highest Percentage of Black / African American Population in Pittsburgh, PA with 66.7%.
What is the Percentage of Black / African American Population in Pittsburgh, PA?
Percentage of Black / African American Population in Pittsburgh is 23.2%.
What is the Percentage of Black / African American Population in Pennsylvania?
Percentage of Black / African American Population in Pennsylvania is 10.8%.
What is the Percentage of Black / African American Population in the United States?
Percentage of Black / African American Population in the United States is 12.5%.