Zip Codes with the Highest Percentage of Black / African American Population in Pennsylvania
RELATED REPORTS & OPTIONS
Black / African American
Pennsylvania
Compare Zip Codes
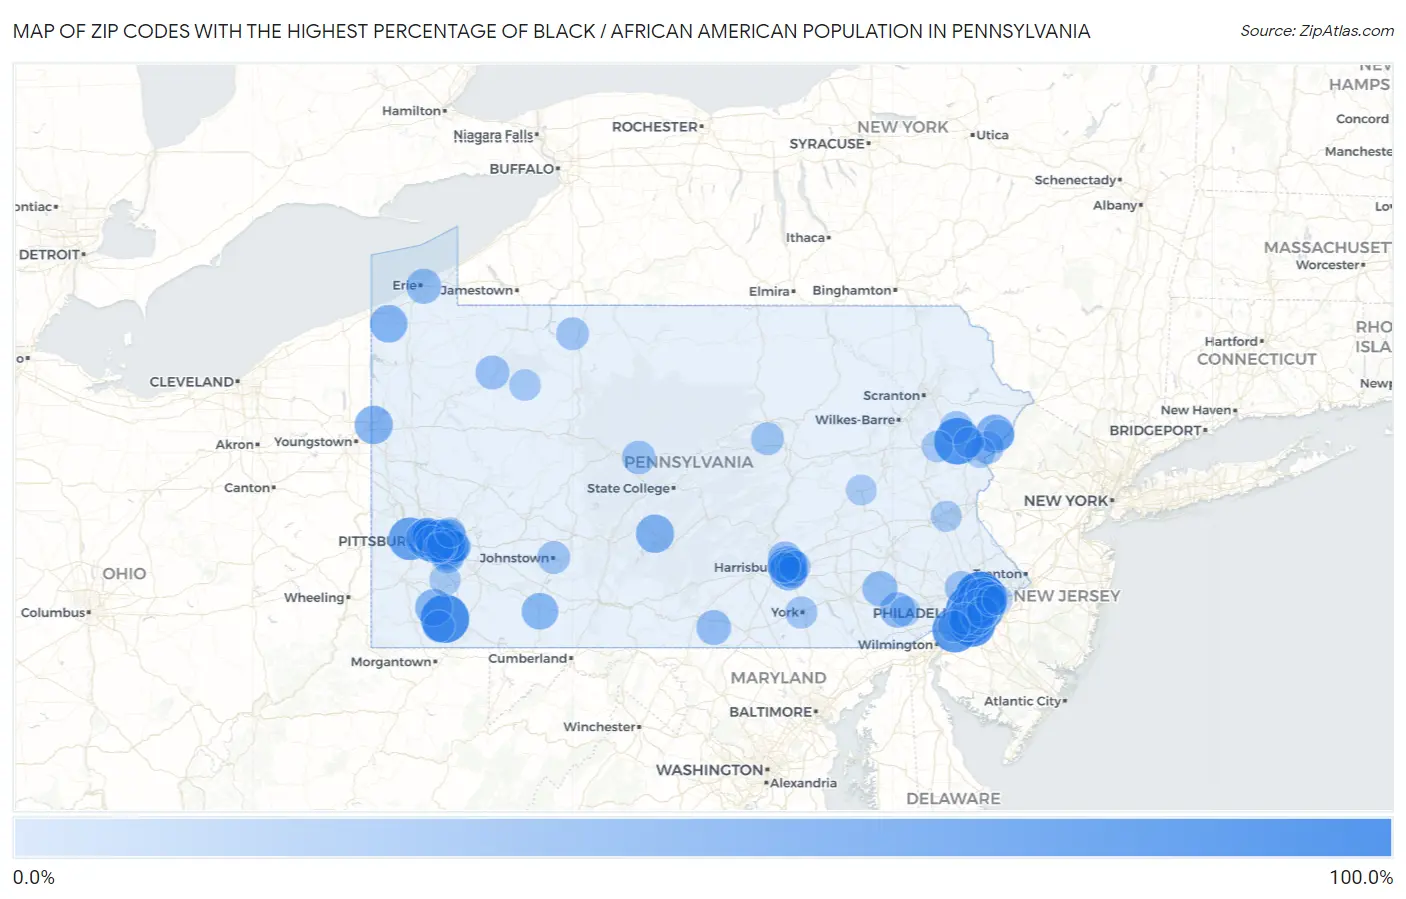
Map of Zip Codes with the Highest Percentage of Black / African American Population in Pennsylvania
0.0%
100.0%
Zip Codes with the Highest Percentage of Black / African American Population in Pennsylvania
| Zip Code | Black / African American | vs State | vs National | |
| 1. | 19138 | 93.0% | 10.8%(+82.2)#1 | 12.5%(+80.5)#106 |
| 2. | 19150 | 91.8% | 10.8%(+81.0)#2 | 12.5%(+79.4)#123 |
| 3. | 19132 | 88.8% | 10.8%(+77.9)#3 | 12.5%(+76.3)#169 |
| 4. | 15443 | 88.7% | 10.8%(+77.9)#4 | 12.5%(+76.3)#171 |
| 5. | 19151 | 87.6% | 10.8%(+76.8)#5 | 12.5%(+75.2)#194 |
| 6. | 19141 | 86.0% | 10.8%(+75.1)#6 | 12.5%(+73.5)#228 |
| 7. | 19139 | 84.9% | 10.8%(+74.0)#7 | 12.5%(+72.4)#241 |
| 8. | 19126 | 83.5% | 10.8%(+72.6)#8 | 12.5%(+71.0)#259 |
| 9. | 19142 | 82.2% | 10.8%(+71.3)#9 | 12.5%(+69.7)#274 |
| 10. | 18349 | 81.5% | 10.8%(+70.6)#10 | 12.5%(+69.0)#290 |
| 11. | 19079 | 80.9% | 10.8%(+70.0)#11 | 12.5%(+68.4)#303 |
| 12. | 19131 | 80.3% | 10.8%(+69.4)#12 | 12.5%(+67.8)#316 |
| 13. | 19153 | 78.8% | 10.8%(+68.0)#13 | 12.5%(+66.3)#356 |
| 14. | 19013 | 76.2% | 10.8%(+65.4)#14 | 12.5%(+63.7)#402 |
| 15. | 19023 | 76.2% | 10.8%(+65.4)#15 | 12.5%(+63.7)#403 |
| 16. | 19143 | 74.6% | 10.8%(+63.8)#16 | 12.5%(+62.1)#436 |
| 17. | 19144 | 73.4% | 10.8%(+62.5)#17 | 12.5%(+60.9)#466 |
| 18. | 19121 | 67.9% | 10.8%(+57.1)#18 | 12.5%(+55.4)#603 |
| 19. | 19050 | 66.9% | 10.8%(+56.0)#19 | 12.5%(+54.4)#631 |
| 20. | 15275 | 66.7% | 10.8%(+55.8)#20 | 12.5%(+54.2)#636 |
| 21. | 15219 | 64.2% | 10.8%(+53.3)#21 | 12.5%(+51.7)#720 |
| 22. | 15104 | 57.8% | 10.8%(+47.0)#22 | 12.5%(+45.4)#942 |
| 23. | 19119 | 56.6% | 10.8%(+45.8)#23 | 12.5%(+44.1)#978 |
| 24. | 17103 | 55.6% | 10.8%(+44.8)#24 | 12.5%(+43.2)#1,018 |
| 25. | 15208 | 52.7% | 10.8%(+41.9)#25 | 12.5%(+40.2)#1,118 |
| 26. | 19140 | 52.5% | 10.8%(+41.7)#26 | 12.5%(+40.1)#1,127 |
| 27. | 15112 | 52.0% | 10.8%(+41.1)#27 | 12.5%(+39.5)#1,159 |
| 28. | 16654 | 49.7% | 10.8%(+38.8)#28 | 12.5%(+37.2)#1,274 |
| 29. | 16121 | 49.4% | 10.8%(+38.5)#29 | 12.5%(+36.9)#1,290 |
| 30. | 17104 | 49.3% | 10.8%(+38.5)#30 | 12.5%(+36.8)#1,296 |
| 31. | 18371 | 49.3% | 10.8%(+38.5)#31 | 12.5%(+36.8)#1,298 |
| 32. | 15233 | 47.9% | 10.8%(+37.1)#32 | 12.5%(+35.5)#1,353 |
| 33. | 19120 | 47.0% | 10.8%(+36.1)#33 | 12.5%(+34.5)#1,404 |
| 34. | 16475 | 46.8% | 10.8%(+36.0)#34 | 12.5%(+34.4)#1,412 |
| 35. | 19082 | 45.4% | 10.8%(+34.6)#35 | 12.5%(+33.0)#1,490 |
| 36. | 15450 | 45.2% | 10.8%(+34.3)#36 | 12.5%(+32.7)#1,508 |
| 37. | 15110 | 44.7% | 10.8%(+33.8)#37 | 12.5%(+32.2)#1,540 |
| 38. | 19032 | 43.8% | 10.8%(+33.0)#38 | 12.5%(+31.3)#1,584 |
| 39. | 15204 | 43.7% | 10.8%(+32.9)#39 | 12.5%(+31.2)#1,588 |
| 40. | 15510 | 43.3% | 10.8%(+32.4)#40 | 12.5%(+30.8)#1,618 |
| 41. | 19027 | 42.7% | 10.8%(+31.9)#41 | 12.5%(+30.3)#1,650 |
| 42. | 15221 | 42.7% | 10.8%(+31.9)#42 | 12.5%(+30.2)#1,652 |
| 43. | 15235 | 40.9% | 10.8%(+30.0)#43 | 12.5%(+28.4)#1,783 |
| 44. | 19369 | 39.0% | 10.8%(+28.2)#44 | 12.5%(+26.5)#1,921 |
| 45. | 19104 | 38.2% | 10.8%(+27.3)#45 | 12.5%(+25.7)#1,982 |
| 46. | 17506 | 38.1% | 10.8%(+27.3)#46 | 12.5%(+25.6)#1,989 |
| 47. | 16503 | 37.4% | 10.8%(+26.6)#47 | 12.5%(+24.9)#2,037 |
| 48. | 19124 | 36.3% | 10.8%(+25.4)#48 | 12.5%(+23.8)#2,108 |
| 49. | 17261 | 36.2% | 10.8%(+25.3)#49 | 12.5%(+23.7)#2,115 |
| 50. | 15214 | 35.7% | 10.8%(+24.9)#50 | 12.5%(+23.2)#2,154 |
| 51. | 17110 | 35.2% | 10.8%(+24.4)#51 | 12.5%(+22.7)#2,202 |
| 52. | 19012 | 35.2% | 10.8%(+24.4)#52 | 12.5%(+22.7)#2,205 |
| 53. | 19133 | 34.8% | 10.8%(+24.0)#53 | 12.5%(+22.4)#2,240 |
| 54. | 15132 | 33.4% | 10.8%(+22.6)#54 | 12.5%(+20.9)#2,350 |
| 55. | 16370 | 33.0% | 10.8%(+22.2)#55 | 12.5%(+20.6)#2,382 |
| 56. | 19146 | 31.8% | 10.8%(+21.0)#56 | 12.5%(+19.4)#2,487 |
| 57. | 16847 | 31.5% | 10.8%(+20.7)#57 | 12.5%(+19.1)#2,512 |
| 58. | 15210 | 31.4% | 10.8%(+20.6)#58 | 12.5%(+19.0)#2,524 |
| 59. | 19122 | 30.0% | 10.8%(+19.2)#59 | 12.5%(+17.5)#2,643 |
| 60. | 15206 | 29.9% | 10.8%(+19.0)#60 | 12.5%(+17.4)#2,652 |
| 61. | 19401 | 29.5% | 10.8%(+18.7)#61 | 12.5%(+17.0)#2,695 |
| 62. | 18466 | 29.4% | 10.8%(+18.6)#62 | 12.5%(+17.0)#2,702 |
| 63. | 16738 | 29.3% | 10.8%(+18.4)#63 | 12.5%(+16.8)#2,721 |
| 64. | 19095 | 29.1% | 10.8%(+18.3)#64 | 12.5%(+16.6)#2,742 |
| 65. | 17810 | 29.0% | 10.8%(+18.2)#65 | 12.5%(+16.5)#2,751 |
| 66. | 15901 | 28.9% | 10.8%(+18.1)#66 | 12.5%(+16.5)#2,764 |
| 67. | 15148 | 28.7% | 10.8%(+17.9)#67 | 12.5%(+16.3)#2,777 |
| 68. | 18335 | 28.5% | 10.8%(+17.7)#68 | 12.5%(+16.1)#2,807 |
| 69. | 19129 | 28.4% | 10.8%(+17.6)#69 | 12.5%(+16.0)#2,817 |
| 70. | 15212 | 28.1% | 10.8%(+17.2)#70 | 12.5%(+15.6)#2,846 |
| 71. | 19145 | 27.8% | 10.8%(+16.9)#71 | 12.5%(+15.3)#2,870 |
| 72. | 17102 | 27.7% | 10.8%(+16.8)#72 | 12.5%(+15.2)#2,880 |
| 73. | 19018 | 27.3% | 10.8%(+16.5)#73 | 12.5%(+14.8)#2,928 |
| 74. | 17401 | 26.5% | 10.8%(+15.6)#74 | 12.5%(+14.0)#3,036 |
| 75. | 19111 | 26.0% | 10.8%(+15.2)#75 | 12.5%(+13.6)#3,080 |
| 76. | 15476 | 25.6% | 10.8%(+14.8)#76 | 12.5%(+13.2)#3,139 |
| 77. | 18610 | 25.1% | 10.8%(+14.3)#77 | 12.5%(+12.6)#3,198 |
| 78. | 15140 | 24.8% | 10.8%(+14.0)#78 | 12.5%(+12.3)#3,240 |
| 79. | 19123 | 24.7% | 10.8%(+13.8)#79 | 12.5%(+12.2)#3,252 |
| 80. | 19015 | 24.6% | 10.8%(+13.8)#80 | 12.5%(+12.1)#3,265 |
| 81. | 16239 | 24.6% | 10.8%(+13.7)#81 | 12.5%(+12.1)#3,270 |
| 82. | 15282 | 24.1% | 10.8%(+13.3)#82 | 12.5%(+11.7)#3,336 |
| 83. | 17109 | 23.9% | 10.8%(+13.1)#83 | 12.5%(+11.4)#3,374 |
| 84. | 17113 | 23.6% | 10.8%(+12.8)#84 | 12.5%(+11.1)#3,408 |
| 85. | 15033 | 23.3% | 10.8%(+12.5)#85 | 12.5%(+10.9)#3,448 |
| 86. | 17111 | 23.0% | 10.8%(+12.1)#86 | 12.5%(+10.5)#3,497 |
| 87. | 18324 | 22.8% | 10.8%(+12.0)#87 | 12.5%(+10.4)#3,504 |
| 88. | 15145 | 22.6% | 10.8%(+11.8)#88 | 12.5%(+10.2)#3,546 |
| 89. | 18101 | 22.4% | 10.8%(+11.5)#89 | 12.5%(+9.88)#3,582 |
| 90. | 18301 | 22.0% | 10.8%(+11.1)#90 | 12.5%(+9.51)#3,639 |
| 91. | 19149 | 22.0% | 10.8%(+11.1)#91 | 12.5%(+9.51)#3,640 |
| 92. | 18332 | 21.6% | 10.8%(+10.8)#92 | 12.5%(+9.17)#3,689 |
| 93. | 15120 | 21.6% | 10.8%(+10.8)#93 | 12.5%(+9.14)#3,691 |
| 94. | 15218 | 21.6% | 10.8%(+10.8)#94 | 12.5%(+9.14)#3,693 |
| 95. | 17931 | 21.3% | 10.8%(+10.4)#95 | 12.5%(+8.79)#3,754 |
| 96. | 15207 | 20.9% | 10.8%(+10.0)#96 | 12.5%(+8.39)#3,812 |
| 97. | 17101 | 20.3% | 10.8%(+9.50)#97 | 12.5%(+7.86)#3,893 |
| 98. | 15147 | 20.1% | 10.8%(+9.22)#98 | 12.5%(+7.59)#3,942 |
| 99. | 19320 | 19.9% | 10.8%(+9.09)#99 | 12.5%(+7.46)#3,970 |
| 100. | 19136 | 19.9% | 10.8%(+9.02)#100 | 12.5%(+7.39)#3,982 |
Common Questions
What are the Top 10 Zip Codes with the Highest Percentage of Black / African American Population in Pennsylvania?
Top 10 Zip Codes with the Highest Percentage of Black / African American Population in Pennsylvania are:
What zip code has the Highest Percentage of Black / African American Population in Pennsylvania?
19138 has the Highest Percentage of Black / African American Population in Pennsylvania with 93.0%.
What is the Percentage of Black / African American Population in the State of Pennsylvania?
Percentage of Black / African American Population in Pennsylvania is 10.8%.
What is the Percentage of Black / African American Population in the United States?
Percentage of Black / African American Population in the United States is 12.5%.