Montrose Manor, PA Map & Demographics
Montrose Manor Map
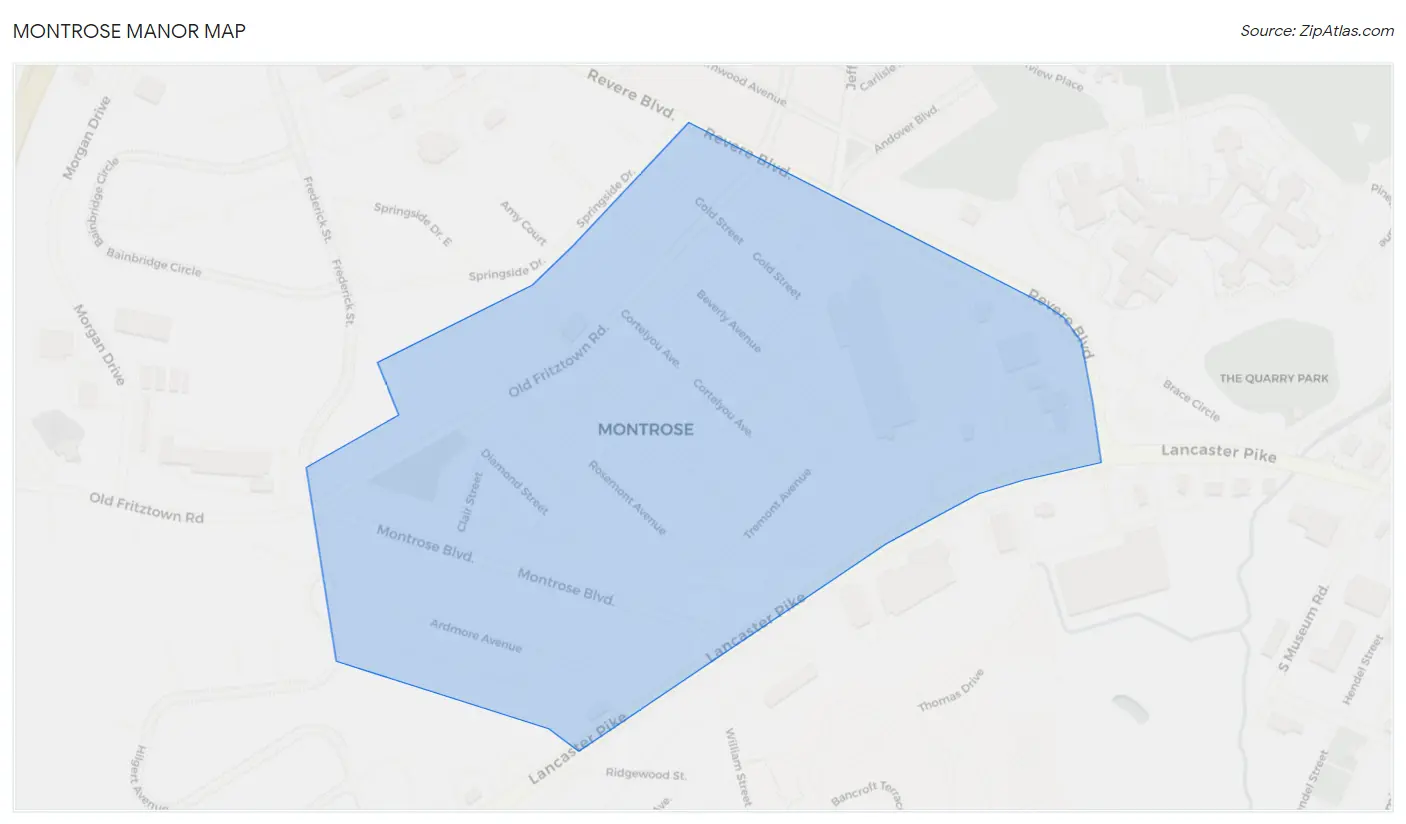
Montrose Manor Overview
$40,126
PER CAPITA INCOME
$107,083
AVG FAMILY INCOME
$75,500
AVG HOUSEHOLD INCOME
7.7%
WAGE / INCOME GAP [ % ]
92.3¢/ $1
WAGE / INCOME GAP [ $ ]
0.30
INEQUALITY / GINI INDEX
421
TOTAL POPULATION
192
MALE POPULATION
229
FEMALE POPULATION
83.84
MALES / 100 FEMALES
119.27
FEMALES / 100 MALES
51.7
MEDIAN AGE
2.8
AVG FAMILY SIZE
2.0
AVG HOUSEHOLD SIZE
246
LABOR FORCE [ PEOPLE ]
69.3%
PERCENT IN LABOR FORCE
8.5%
UNEMPLOYMENT RATE
Income in Montrose Manor
Income Overview in Montrose Manor
Per Capita Income in Montrose Manor is $40,126, while median incomes of families and households are $107,083 and $75,500 respectively.
| Characteristic | Number | Measure |
| Per Capita Income | 421 | $40,126 |
| Median Family Income | 111 | $107,083 |
| Mean Family Income | 111 | $104,030 |
| Median Household Income | 210 | $75,500 |
| Mean Household Income | 210 | $79,215 |
| Income Deficit | 111 | $0 |
| Wage / Income Gap (%) | 421 | 7.71% |
| Wage / Income Gap ($) | 421 | 92.29¢ per $1 |
| Gini / Inequality Index | 421 | 0.30 |
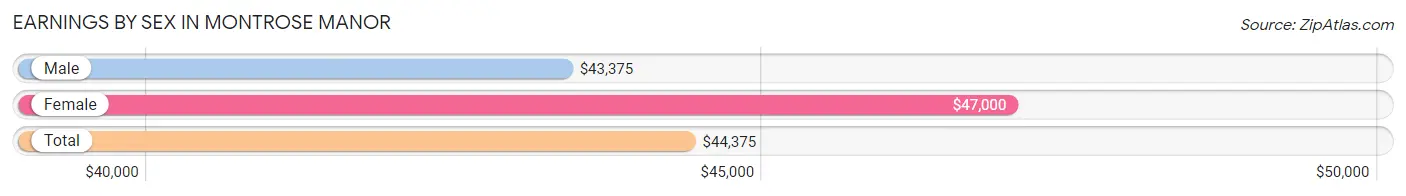
Earnings by Sex in Montrose Manor
Average Earnings in Montrose Manor are $44,375, $43,375 for men and $47,000 for women, a difference of 7.7%.
| Sex | Number | Average Earnings |
| Male | 83 (35.9%) | $43,375 |
| Female | 148 (64.1%) | $47,000 |
| Total | 231 (100.0%) | $44,375 |
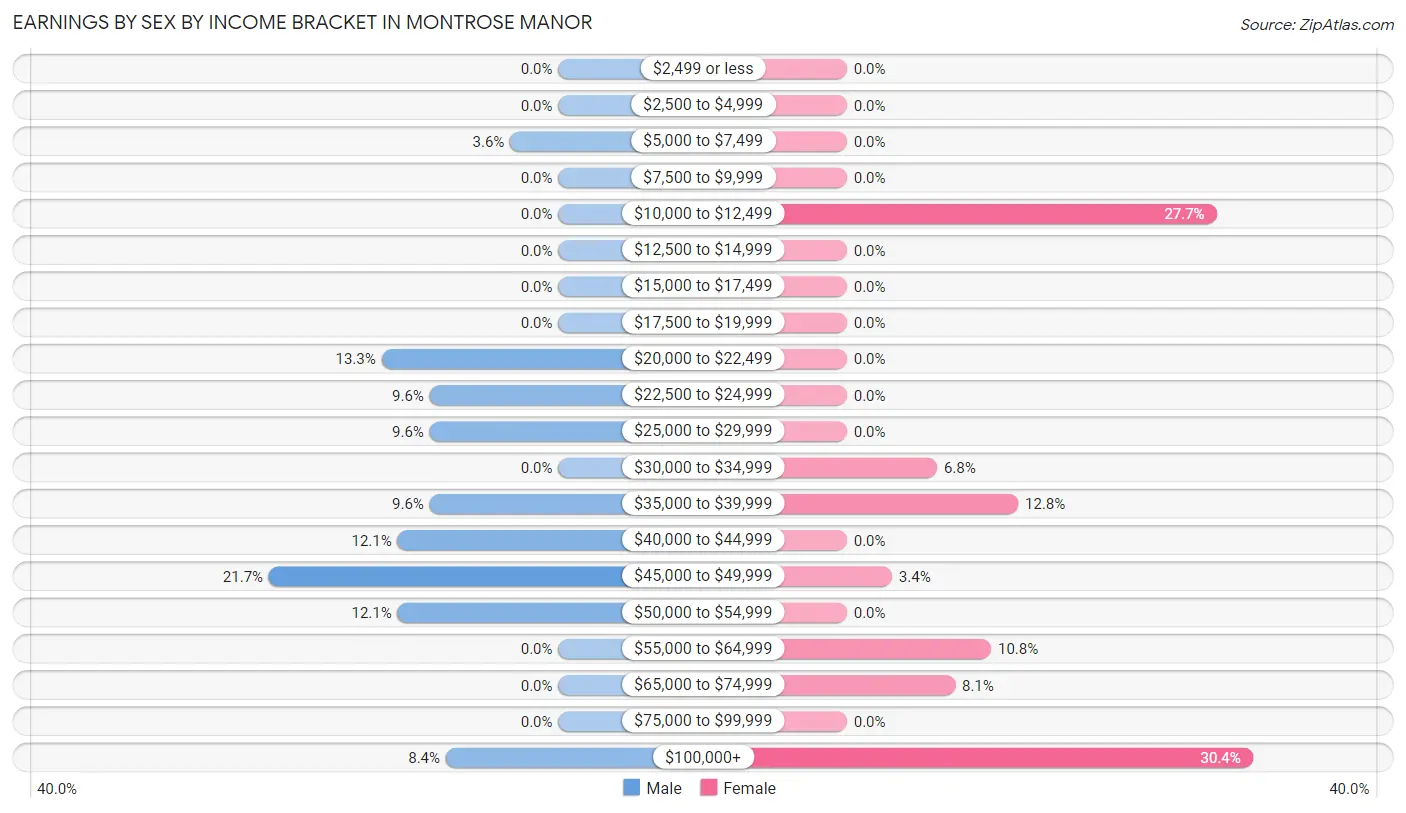
Earnings by Sex by Income Bracket in Montrose Manor
The most common earnings brackets in Montrose Manor are $45,000 to $49,999 for men (18 | 21.7%) and $100,000+ for women (45 | 30.4%).
| Income | Male | Female |
| $2,499 or less | 0 (0.0%) | 0 (0.0%) |
| $2,500 to $4,999 | 0 (0.0%) | 0 (0.0%) |
| $5,000 to $7,499 | 3 (3.6%) | 0 (0.0%) |
| $7,500 to $9,999 | 0 (0.0%) | 0 (0.0%) |
| $10,000 to $12,499 | 0 (0.0%) | 41 (27.7%) |
| $12,500 to $14,999 | 0 (0.0%) | 0 (0.0%) |
| $15,000 to $17,499 | 0 (0.0%) | 0 (0.0%) |
| $17,500 to $19,999 | 0 (0.0%) | 0 (0.0%) |
| $20,000 to $22,499 | 11 (13.3%) | 0 (0.0%) |
| $22,500 to $24,999 | 8 (9.6%) | 0 (0.0%) |
| $25,000 to $29,999 | 8 (9.6%) | 0 (0.0%) |
| $30,000 to $34,999 | 0 (0.0%) | 10 (6.8%) |
| $35,000 to $39,999 | 8 (9.6%) | 19 (12.8%) |
| $40,000 to $44,999 | 10 (12.0%) | 0 (0.0%) |
| $45,000 to $49,999 | 18 (21.7%) | 5 (3.4%) |
| $50,000 to $54,999 | 10 (12.0%) | 0 (0.0%) |
| $55,000 to $64,999 | 0 (0.0%) | 16 (10.8%) |
| $65,000 to $74,999 | 0 (0.0%) | 12 (8.1%) |
| $75,000 to $99,999 | 0 (0.0%) | 0 (0.0%) |
| $100,000+ | 7 (8.4%) | 45 (30.4%) |
| Total | 83 (100.0%) | 148 (100.0%) |
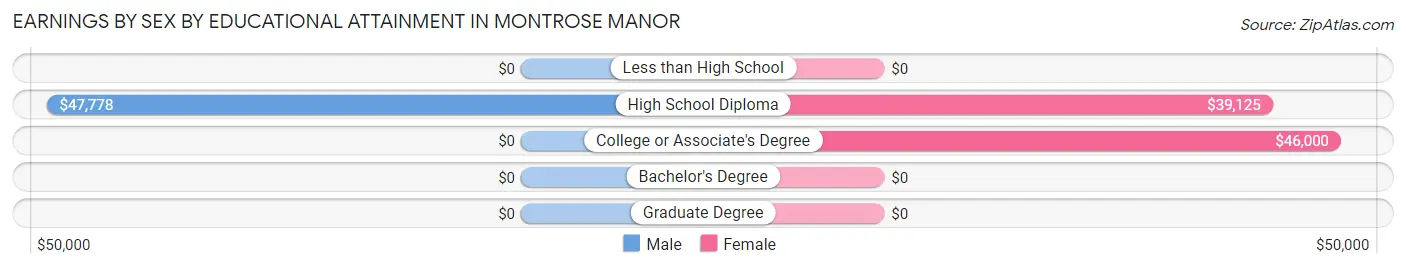
Earnings by Sex by Educational Attainment in Montrose Manor
| Educational Attainment | Male Income | Female Income |
| Less than High School | - | - |
| High School Diploma | $47,778 | $39,125 |
| College or Associate's Degree | - | - |
| Bachelor's Degree | - | - |
| Graduate Degree | - | - |
| Total | $44,750 | $0 |
Family Income in Montrose Manor
Family Income Brackets in Montrose Manor
According to the Montrose Manor family income data, there are 56 families falling into the $100,000 to $149,999 income range, which is the most common income bracket and makes up 50.4% of all families.
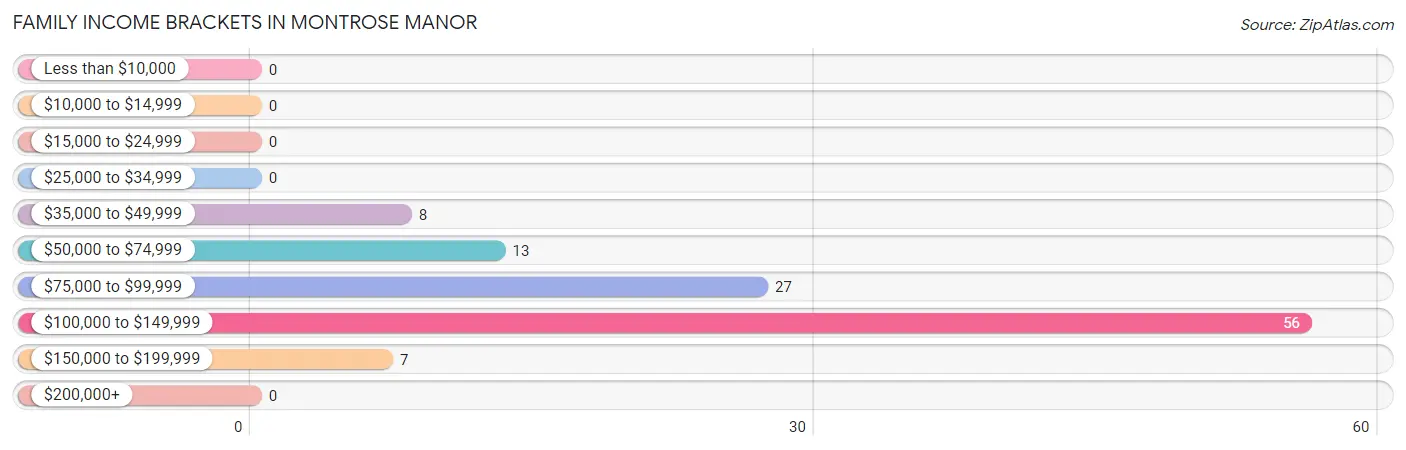
| Income Bracket | # Families | % Families |
| Less than $10,000 | 0 | 0.0% |
| $10,000 to $14,999 | 0 | 0.0% |
| $15,000 to $24,999 | 0 | 0.0% |
| $25,000 to $34,999 | 0 | 0.0% |
| $35,000 to $49,999 | 8 | 7.2% |
| $50,000 to $74,999 | 13 | 11.7% |
| $75,000 to $99,999 | 27 | 24.3% |
| $100,000 to $149,999 | 56 | 50.5% |
| $150,000 to $199,999 | 7 | 6.3% |
| $200,000+ | 0 | 0.0% |
Family Income by Famaliy Size in Montrose Manor
3-person families (51 | 46.0%) account for the highest median family income in Montrose Manor with $130,679 per family, while 3-person families (51 | 46.0%) have the highest median income of $43,560 per family member.
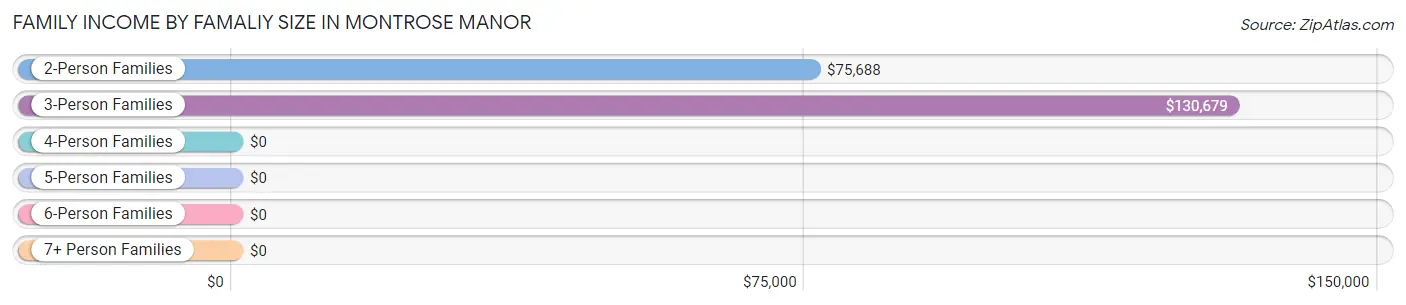
| Income Bracket | # Families | Median Income |
| 2-Person Families | 53 (47.7%) | $75,688 |
| 3-Person Families | 51 (46.0%) | $130,679 |
| 4-Person Families | 7 (6.3%) | $0 |
| 5-Person Families | 0 (0.0%) | $0 |
| 6-Person Families | 0 (0.0%) | $0 |
| 7+ Person Families | 0 (0.0%) | $0 |
| Total | 111 (100.0%) | $107,083 |
Family Income by Number of Earners in Montrose Manor
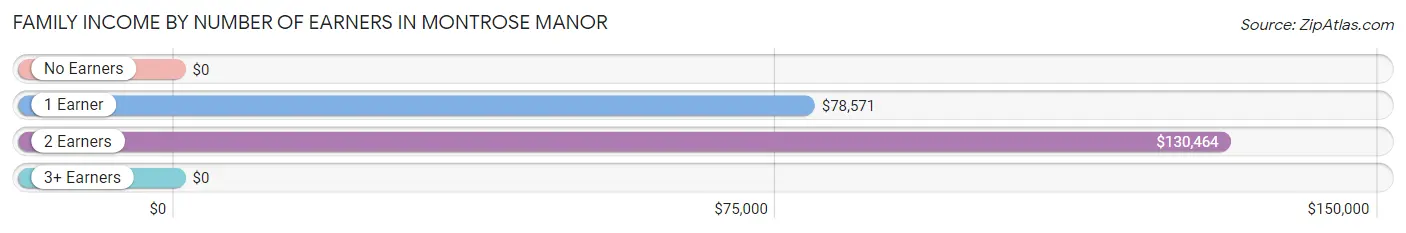
| Number of Earners | # Families | Median Income |
| No Earners | 8 (7.2%) | $0 |
| 1 Earner | 32 (28.8%) | $78,571 |
| 2 Earners | 71 (64.0%) | $130,464 |
| 3+ Earners | 0 (0.0%) | $0 |
| Total | 111 (100.0%) | $107,083 |
Household Income in Montrose Manor
Household Income Brackets in Montrose Manor
With 66 households falling in the category, the $100,000 to $149,999 income range is the most frequent in Montrose Manor, accounting for 31.4% of all households.
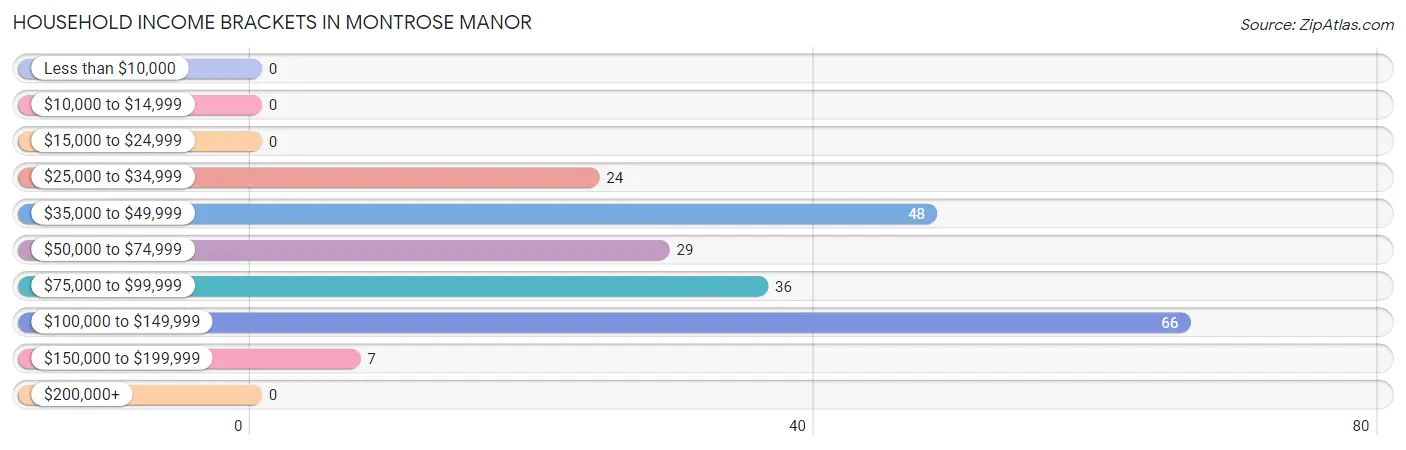
| Income Bracket | # Households | % Households |
| Less than $10,000 | 0 | 0.0% |
| $10,000 to $14,999 | 0 | 0.0% |
| $15,000 to $24,999 | 0 | 0.0% |
| $25,000 to $34,999 | 24 | 11.4% |
| $35,000 to $49,999 | 48 | 22.9% |
| $50,000 to $74,999 | 29 | 13.8% |
| $75,000 to $99,999 | 36 | 17.1% |
| $100,000 to $149,999 | 66 | 31.4% |
| $150,000 to $199,999 | 7 | 3.3% |
| $200,000+ | 0 | 0.0% |
Household Income by Householder Age in Montrose Manor
The median household income in Montrose Manor is $75,500, with the highest median household income of $118,500 found in the 45 to 64 years age bracket for the primary householder. A total of 106 households (50.5%) fall into this category.
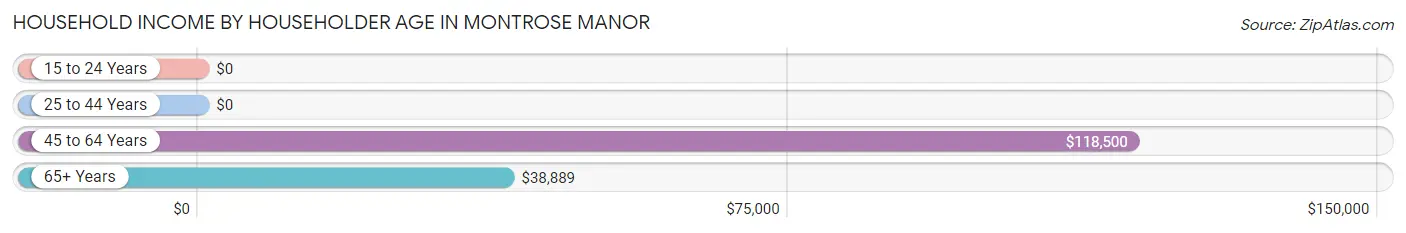
| Income Bracket | # Households | Median Income |
| 15 to 24 Years | 0 (0.0%) | $0 |
| 25 to 44 Years | 34 (16.2%) | $0 |
| 45 to 64 Years | 106 (50.5%) | $118,500 |
| 65+ Years | 70 (33.3%) | $38,889 |
| Total | 210 (100.0%) | $75,500 |
Poverty in Montrose Manor
Income Below Poverty by Sex and Age in Montrose Manor
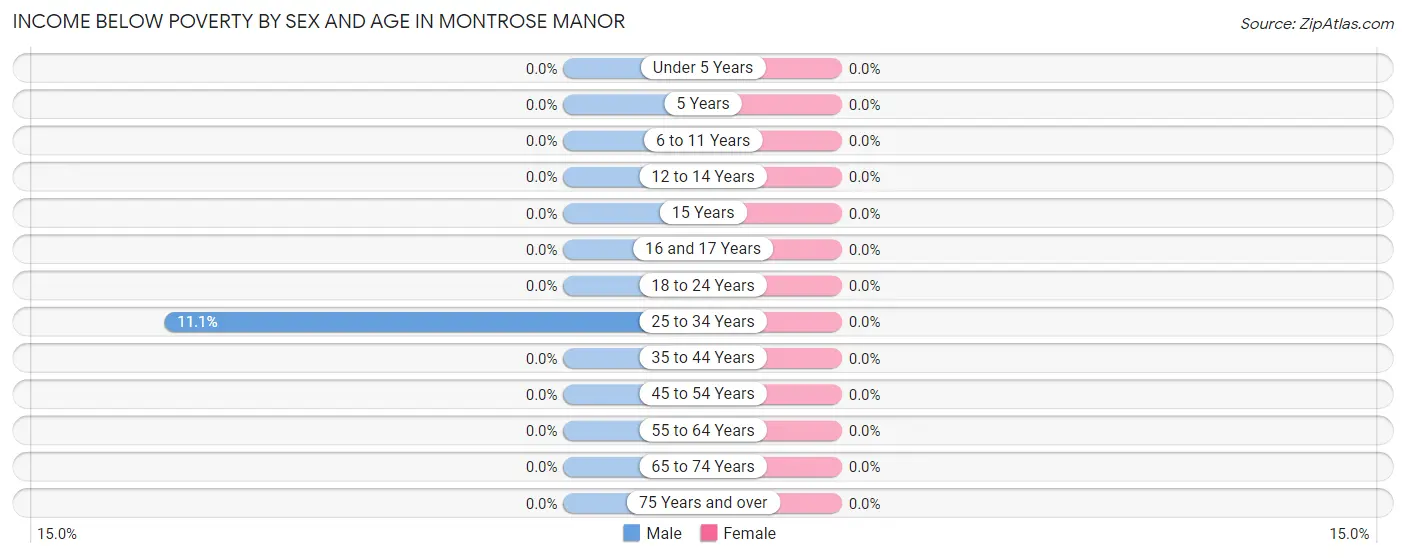
| Age Bracket | Male | Female |
| Under 5 Years | 0 (0.0%) | 0 (0.0%) |
| 5 Years | 0 (0.0%) | 0 (0.0%) |
| 6 to 11 Years | 0 (0.0%) | 0 (0.0%) |
| 12 to 14 Years | 0 (0.0%) | 0 (0.0%) |
| 15 Years | 0 (0.0%) | 0 (0.0%) |
| 16 and 17 Years | 0 (0.0%) | 0 (0.0%) |
| 18 to 24 Years | 0 (0.0%) | 0 (0.0%) |
| 25 to 34 Years | 3 (11.1%) | 0 (0.0%) |
| 35 to 44 Years | 0 (0.0%) | 0 (0.0%) |
| 45 to 54 Years | 0 (0.0%) | 0 (0.0%) |
| 55 to 64 Years | 0 (0.0%) | 0 (0.0%) |
| 65 to 74 Years | 0 (0.0%) | 0 (0.0%) |
| 75 Years and over | 0 (0.0%) | 0 (0.0%) |
| Total | 3 (1.6%) | 0 (0.0%) |
Income Above Poverty by Sex and Age in Montrose Manor
According to the poverty statistics in Montrose Manor, males aged 12 to 14 years and females aged under 5 years are the age groups that are most secure financially, with 100.0% of males and 100.0% of females in these age groups living above the poverty line.
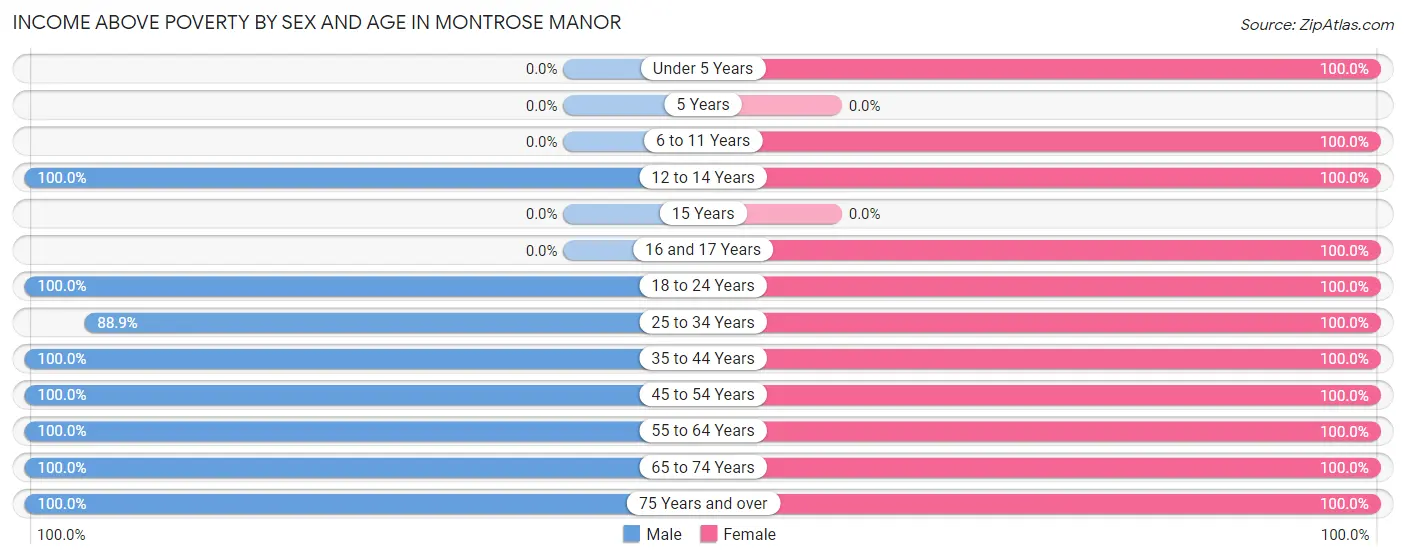
| Age Bracket | Male | Female |
| Under 5 Years | 0 (0.0%) | 9 (100.0%) |
| 5 Years | 0 (0.0%) | 0 (0.0%) |
| 6 to 11 Years | 0 (0.0%) | 7 (100.0%) |
| 12 to 14 Years | 43 (100.0%) | 7 (100.0%) |
| 15 Years | 0 (0.0%) | 0 (0.0%) |
| 16 and 17 Years | 0 (0.0%) | 10 (100.0%) |
| 18 to 24 Years | 11 (100.0%) | 41 (100.0%) |
| 25 to 34 Years | 24 (88.9%) | 9 (100.0%) |
| 35 to 44 Years | 23 (100.0%) | 17 (100.0%) |
| 45 to 54 Years | 20 (100.0%) | 45 (100.0%) |
| 55 to 64 Years | 32 (100.0%) | 43 (100.0%) |
| 65 to 74 Years | 7 (100.0%) | 7 (100.0%) |
| 75 Years and over | 29 (100.0%) | 34 (100.0%) |
| Total | 189 (98.4%) | 229 (100.0%) |
Income Below Poverty Among Married-Couple Families in Montrose Manor
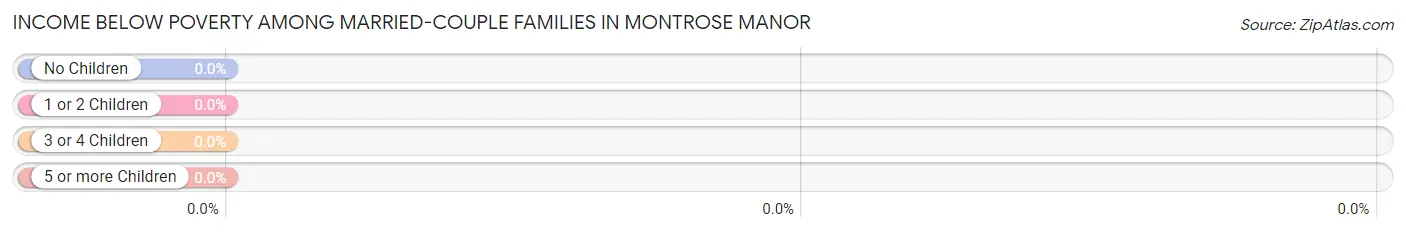
| Children | Above Poverty | Below Poverty |
| No Children | 22 (100.0%) | 0 (0.0%) |
| 1 or 2 Children | 16 (100.0%) | 0 (0.0%) |
| 3 or 4 Children | 0 (0.0%) | 0 (0.0%) |
| 5 or more Children | 0 (0.0%) | 0 (0.0%) |
| Total | 38 (100.0%) | 0 (0.0%) |
Income Below Poverty Among Single-Parent Households in Montrose Manor
| Children | Single Father | Single Mother |
| No Children | 0 (0.0%) | 0 (0.0%) |
| 1 or 2 Children | 0 (0.0%) | 0 (0.0%) |
| 3 or 4 Children | 0 (0.0%) | 0 (0.0%) |
| 5 or more Children | 0 (0.0%) | 0 (0.0%) |
| Total | 0 (0.0%) | 0 (0.0%) |
Income Below Poverty Among Married-Couple vs Single-Parent Households in Montrose Manor
| Children | Married-Couple Families | Single-Parent Households |
| No Children | 0 (0.0%) | 0 (0.0%) |
| 1 or 2 Children | 0 (0.0%) | 0 (0.0%) |
| 3 or 4 Children | 0 (0.0%) | 0 (0.0%) |
| 5 or more Children | 0 (0.0%) | 0 (0.0%) |
| Total | 0 (0.0%) | 0 (0.0%) |
Race in Montrose Manor
The most populous races in Montrose Manor are White / Caucasian (263 | 62.5%), Black / African American (119 | 28.3%), and Hispanic or Latino (18 | 4.3%).
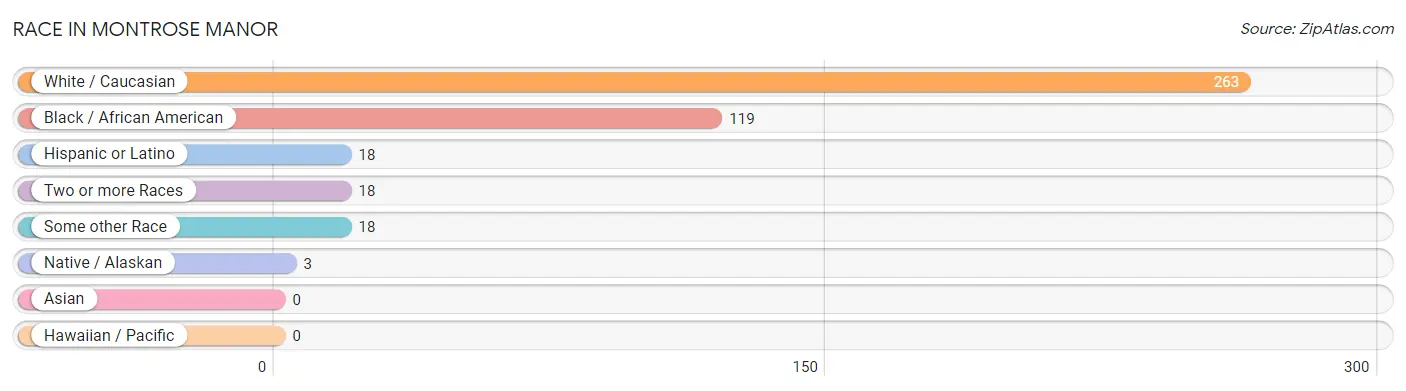
| Race | # Population | % Population |
| Asian | 0 | 0.0% |
| Black / African American | 119 | 28.3% |
| Hawaiian / Pacific | 0 | 0.0% |
| Hispanic or Latino | 18 | 4.3% |
| Native / Alaskan | 3 | 0.7% |
| White / Caucasian | 263 | 62.5% |
| Two or more Races | 18 | 4.3% |
| Some other Race | 18 | 4.3% |
| Total | 421 | 100.0% |
Ancestry in Montrose Manor
The most populous ancestries reported in Montrose Manor are German (183 | 43.5%), English (35 | 8.3%), Swiss (25 | 5.9%), Irish (21 | 5.0%), and Ukrainian (21 | 5.0%), together accounting for 67.7% of all Montrose Manor residents.
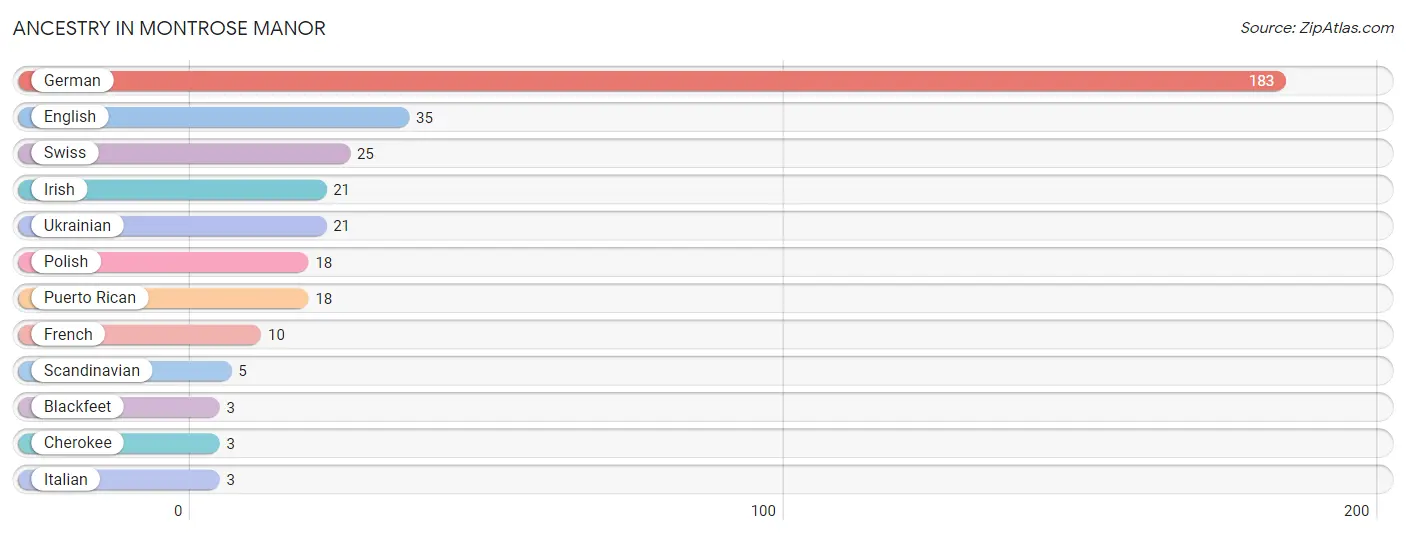
| Ancestry | # Population | % Population |
| Blackfeet | 3 | 0.7% |
| Cherokee | 3 | 0.7% |
| English | 35 | 8.3% |
| French | 10 | 2.4% |
| German | 183 | 43.5% |
| Irish | 21 | 5.0% |
| Italian | 3 | 0.7% |
| Polish | 18 | 4.3% |
| Puerto Rican | 18 | 4.3% |
| Scandinavian | 5 | 1.2% |
| Swiss | 25 | 5.9% |
| Ukrainian | 21 | 5.0% | View All 12 Rows |
Immigrants in Montrose Manor
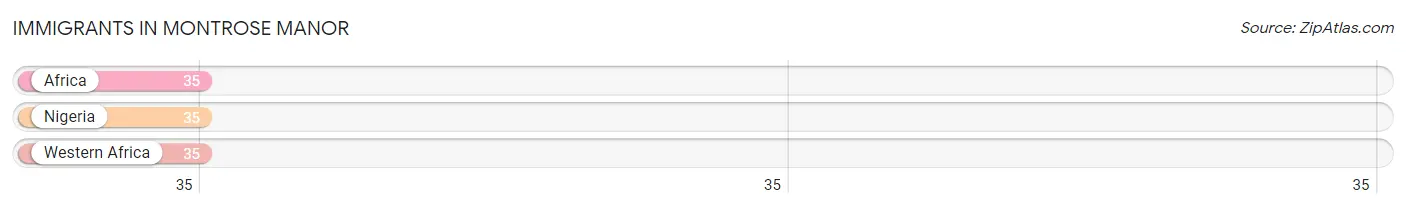
The most numerous immigrant groups reported in Montrose Manor came from Africa (35 | 8.3%), Nigeria (35 | 8.3%), and Western Africa (35 | 8.3%), together accounting for 24.9% of all Montrose Manor residents.
| Immigration Origin | # Population | % Population |
| Africa | 35 | 8.3% |
| Nigeria | 35 | 8.3% |
| Western Africa | 35 | 8.3% | View All 3 Rows |
Sex and Age in Montrose Manor
Sex and Age in Montrose Manor
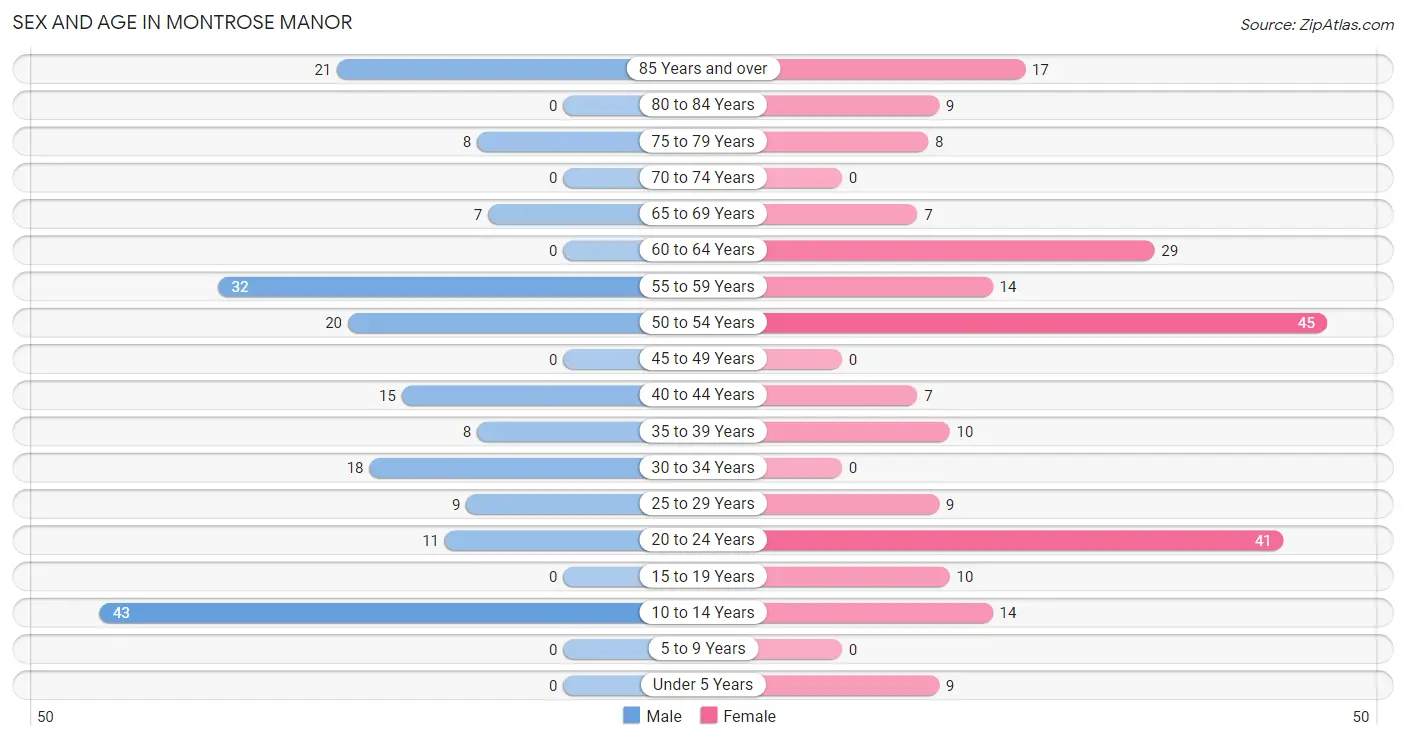
The most populous age groups in Montrose Manor are 10 to 14 Years (43 | 22.4%) for men and 50 to 54 Years (45 | 19.7%) for women.
| Age Bracket | Male | Female |
| Under 5 Years | 0 (0.0%) | 9 (3.9%) |
| 5 to 9 Years | 0 (0.0%) | 0 (0.0%) |
| 10 to 14 Years | 43 (22.4%) | 14 (6.1%) |
| 15 to 19 Years | 0 (0.0%) | 10 (4.4%) |
| 20 to 24 Years | 11 (5.7%) | 41 (17.9%) |
| 25 to 29 Years | 9 (4.7%) | 9 (3.9%) |
| 30 to 34 Years | 18 (9.4%) | 0 (0.0%) |
| 35 to 39 Years | 8 (4.2%) | 10 (4.4%) |
| 40 to 44 Years | 15 (7.8%) | 7 (3.1%) |
| 45 to 49 Years | 0 (0.0%) | 0 (0.0%) |
| 50 to 54 Years | 20 (10.4%) | 45 (19.7%) |
| 55 to 59 Years | 32 (16.7%) | 14 (6.1%) |
| 60 to 64 Years | 0 (0.0%) | 29 (12.7%) |
| 65 to 69 Years | 7 (3.6%) | 7 (3.1%) |
| 70 to 74 Years | 0 (0.0%) | 0 (0.0%) |
| 75 to 79 Years | 8 (4.2%) | 8 (3.5%) |
| 80 to 84 Years | 0 (0.0%) | 9 (3.9%) |
| 85 Years and over | 21 (10.9%) | 17 (7.4%) |
| Total | 192 (100.0%) | 229 (100.0%) |
Families and Households in Montrose Manor
Median Family Size in Montrose Manor
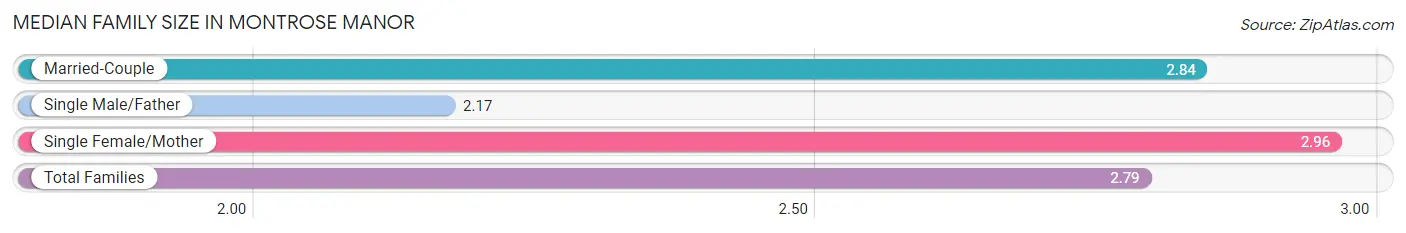
The median family size in Montrose Manor is 2.79 persons per family, with single female/mother families (55 | 49.5%) accounting for the largest median family size of 2.96 persons per family. On the other hand, single male/father families (18 | 16.2%) represent the smallest median family size with 2.17 persons per family.
| Family Type | # Families | Family Size |
| Married-Couple | 38 (34.2%) | 2.84 |
| Single Male/Father | 18 (16.2%) | 2.17 |
| Single Female/Mother | 55 (49.5%) | 2.96 |
| Total Families | 111 (100.0%) | 2.79 |
Median Household Size in Montrose Manor
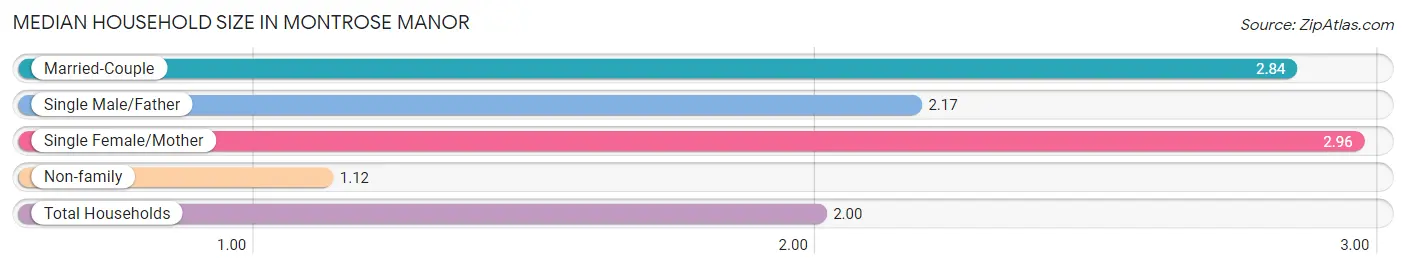
The median household size in Montrose Manor is 2.00 persons per household, with single female/mother households (55 | 26.2%) accounting for the largest median household size of 2.96 persons per household. non-family households (99 | 47.1%) represent the smallest median household size with 1.12 persons per household.
| Household Type | # Households | Household Size |
| Married-Couple | 38 (18.1%) | 2.84 |
| Single Male/Father | 18 (8.6%) | 2.17 |
| Single Female/Mother | 55 (26.2%) | 2.96 |
| Non-family | 99 (47.1%) | 1.12 |
| Total Households | 210 (100.0%) | 2.00 |
Household Size by Marriage Status in Montrose Manor
Out of a total of 210 households in Montrose Manor, 111 (52.9%) are family households, while 99 (47.1%) are nonfamily households. The most numerous type of family households are 2-person households, comprising 53, and the most common type of nonfamily households are 1-person households, comprising 80.
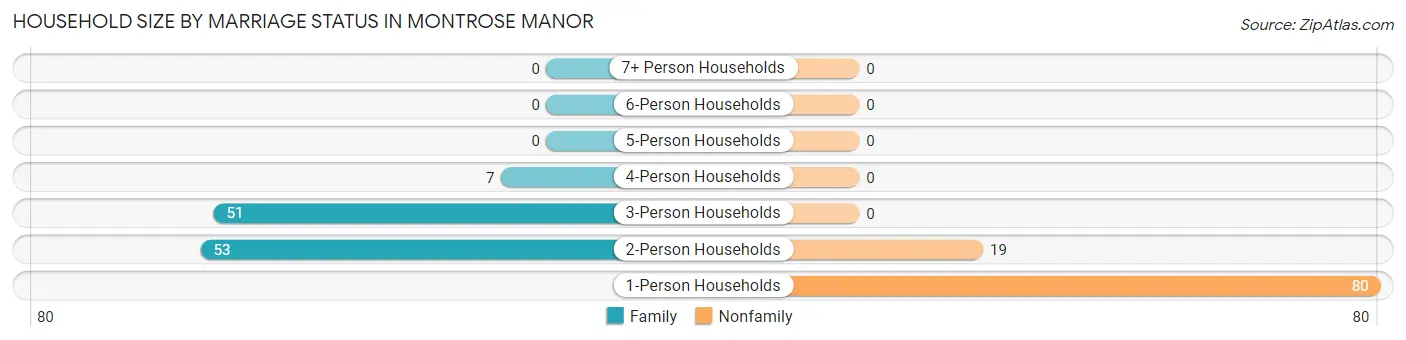
| Household Size | Family Households | Nonfamily Households |
| 1-Person Households | - | 80 (38.1%) |
| 2-Person Households | 53 (25.2%) | 19 (9.0%) |
| 3-Person Households | 51 (24.3%) | 0 (0.0%) |
| 4-Person Households | 7 (3.3%) | 0 (0.0%) |
| 5-Person Households | 0 (0.0%) | 0 (0.0%) |
| 6-Person Households | 0 (0.0%) | 0 (0.0%) |
| 7+ Person Households | 0 (0.0%) | 0 (0.0%) |
| Total | 111 (52.9%) | 99 (47.1%) |
Female Fertility in Montrose Manor
Fertility by Age in Montrose Manor
| Age Bracket | Women with Births | Births / 1,000 Women |
| 15 to 19 years | 0 (0.0%) | 0.0 |
| 20 to 34 years | 0 (0.0%) | 0.0 |
| 35 to 50 years | 0 (0.0%) | 0.0 |
| Total | 0 (0.0%) | 0.0 |
Fertility by Age by Marriage Status in Montrose Manor
| Age Bracket | Married | Unmarried |
| 15 to 19 years | 0 (0.0%) | 0 (0.0%) |
| 20 to 34 years | 0 (0.0%) | 0 (0.0%) |
| 35 to 50 years | 0 (0.0%) | 0 (0.0%) |
| Total | 0 (0.0%) | 0 (0.0%) |
Fertility by Education in Montrose Manor
| Educational Attainment | Women with Births | Births / 1,000 Women |
| Less than High School | 0 (0.0%) | 0.0 |
| High School Diploma | 0 (0.0%) | 0.0 |
| College or Associate's Degree | 0 (0.0%) | 0.0 |
| Bachelor's Degree | 0 (0.0%) | 0.0 |
| Graduate Degree | 0 (0.0%) | 0.0 |
| Total | 0 (0.0%) | 0.0 |
Fertility by Education by Marriage Status in Montrose Manor
| Educational Attainment | Married | Unmarried |
| Less than High School | 0 (0.0%) | 0 (0.0%) |
| High School Diploma | 0 (0.0%) | 0 (0.0%) |
| College or Associate's Degree | 0 (0.0%) | 0 (0.0%) |
| Bachelor's Degree | 0 (0.0%) | 0 (0.0%) |
| Graduate Degree | 0 (0.0%) | 0 (0.0%) |
| Total | 0 (0.0%) | 0 (0.0%) |
Employment Characteristics in Montrose Manor
Employment by Class of Employer in Montrose Manor
Among the 228 employed individuals in Montrose Manor, private company employees (168 | 73.7%), federal government employees (35 | 15.3%), and local government employees (17 | 7.5%) make up the most common classes of employment.
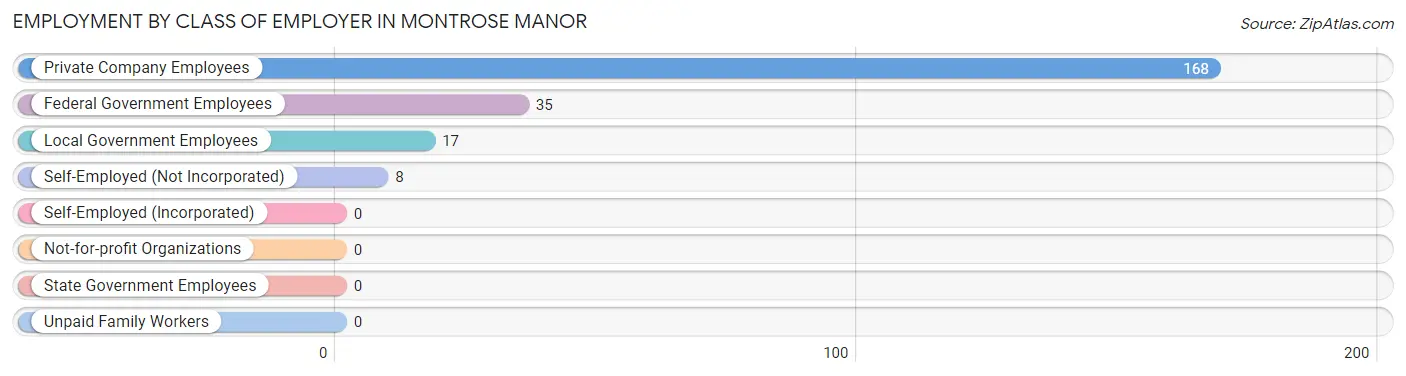
| Employer Class | # Employees | % Employees |
| Private Company Employees | 168 | 73.7% |
| Self-Employed (Incorporated) | 0 | 0.0% |
| Self-Employed (Not Incorporated) | 8 | 3.5% |
| Not-for-profit Organizations | 0 | 0.0% |
| Local Government Employees | 17 | 7.5% |
| State Government Employees | 0 | 0.0% |
| Federal Government Employees | 35 | 15.3% |
| Unpaid Family Workers | 0 | 0.0% |
| Total | 228 | 100.0% |
Employment Status by Age in Montrose Manor
According to the labor force statistics for Montrose Manor, out of the total population over 16 years of age (355), 69.3% or 246 individuals are in the labor force, with 8.5% or 21 of them unemployed. The age group with the highest labor force participation rate is 20 to 24 years, with 100.0% or 52 individuals in the labor force. Within the labor force, the 30 to 34 years age range has the highest percentage of unemployed individuals, with 100.0% or 18 of them being unemployed.
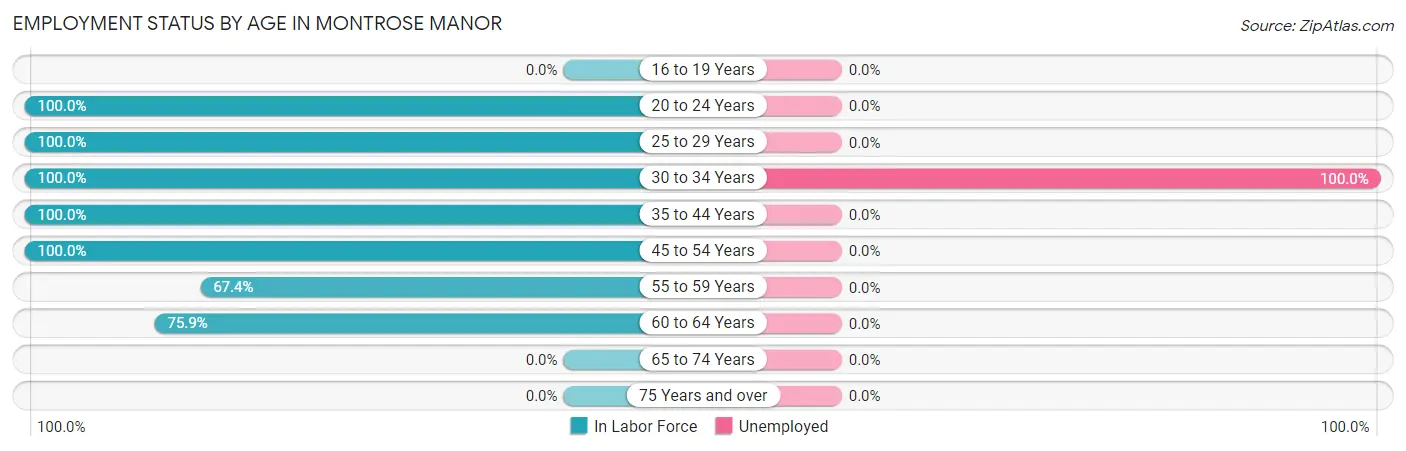
| Age Bracket | In Labor Force | Unemployed |
| 16 to 19 Years | 0 (0.0%) | 0 (0.0%) |
| 20 to 24 Years | 52 (100.0%) | 0 (0.0%) |
| 25 to 29 Years | 18 (100.0%) | 0 (0.0%) |
| 30 to 34 Years | 18 (100.0%) | 18 (100.0%) |
| 35 to 44 Years | 40 (100.0%) | 0 (0.0%) |
| 45 to 54 Years | 65 (100.0%) | 0 (0.0%) |
| 55 to 59 Years | 31 (67.4%) | 0 (0.0%) |
| 60 to 64 Years | 22 (75.9%) | 0 (0.0%) |
| 65 to 74 Years | 0 (0.0%) | 0 (0.0%) |
| 75 Years and over | 0 (0.0%) | 0 (0.0%) |
| Total | 246 (69.3%) | 21 (8.5%) |
Employment Status by Educational Attainment in Montrose Manor
According to labor force statistics for Montrose Manor, 89.8% of individuals (194) out of the total population between 25 and 64 years of age (216) are in the labor force, with 11.3% or 22 of them being unemployed. The group with the highest labor force participation rate are those with the educational attainment of bachelor's degree or higher, with 100.0% or 74 individuals in the labor force. Within the labor force, individuals with bachelor's degree or higher education have the highest percentage of unemployment, with 38.5% or 28 of them being unemployed.
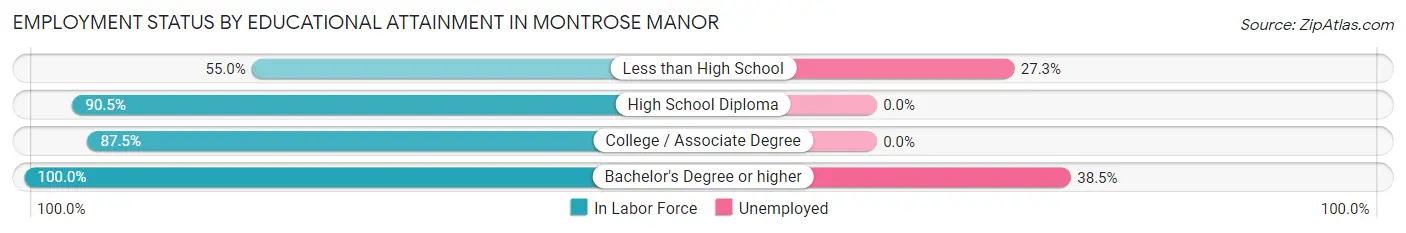
| Educational Attainment | In Labor Force | Unemployed |
| Less than High School | 11 (55.0%) | 5 (27.3%) |
| High School Diploma | 67 (90.5%) | 0 (0.0%) |
| College / Associate Degree | 42 (87.5%) | 0 (0.0%) |
| Bachelor's Degree or higher | 74 (100.0%) | 28 (38.5%) |
| Total | 194 (89.8%) | 24 (11.3%) |
Employment Occupations by Sex in Montrose Manor
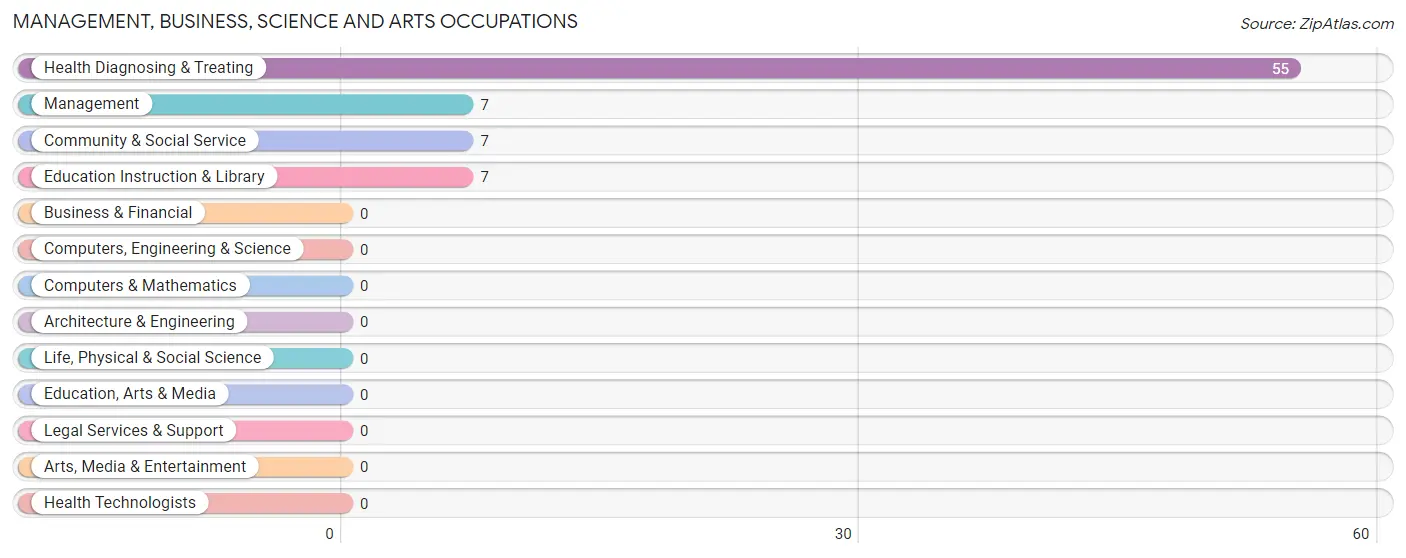
Management, Business, Science and Arts Occupations
The most common Management, Business, Science and Arts occupations in Montrose Manor are Health Diagnosing & Treating (55 | 28.5%), Management (7 | 3.6%), Community & Social Service (7 | 3.6%), and Education Instruction & Library (7 | 3.6%).
Management, Business, Science and Arts Occupations by Sex
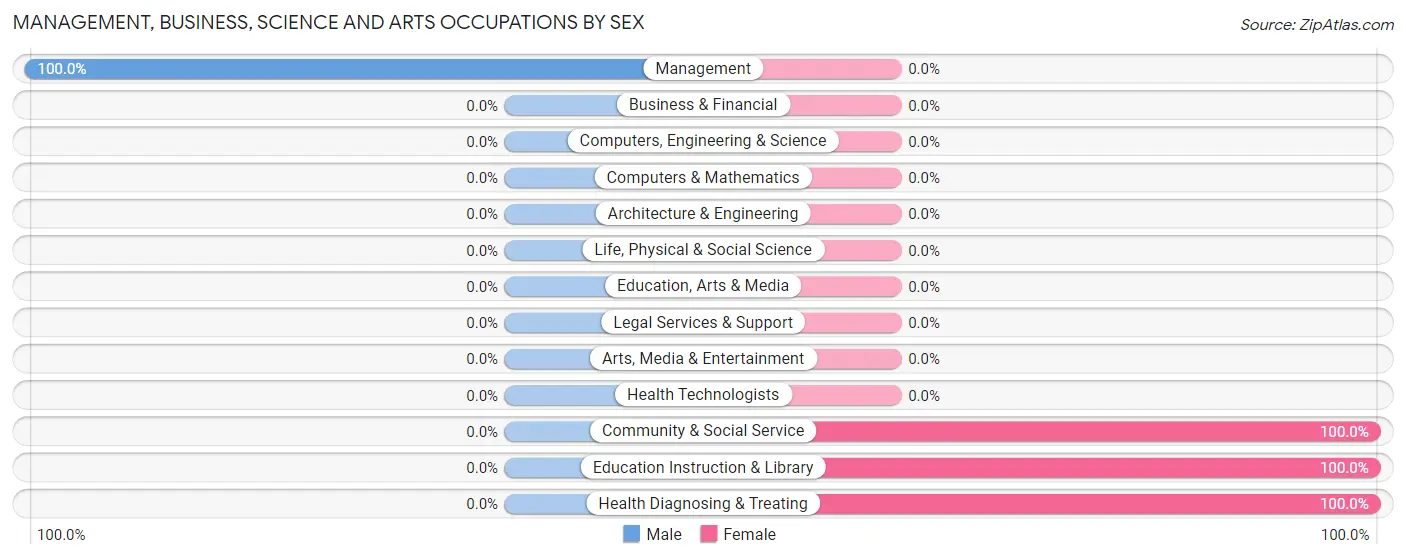
| Occupation | Male | Female |
| Management | 7 (100.0%) | 0 (0.0%) |
| Business & Financial | 0 (0.0%) | 0 (0.0%) |
| Computers, Engineering & Science | 0 (0.0%) | 0 (0.0%) |
| Computers & Mathematics | 0 (0.0%) | 0 (0.0%) |
| Architecture & Engineering | 0 (0.0%) | 0 (0.0%) |
| Life, Physical & Social Science | 0 (0.0%) | 0 (0.0%) |
| Community & Social Service | 0 (0.0%) | 7 (100.0%) |
| Education, Arts & Media | 0 (0.0%) | 0 (0.0%) |
| Legal Services & Support | 0 (0.0%) | 0 (0.0%) |
| Education Instruction & Library | 0 (0.0%) | 7 (100.0%) |
| Arts, Media & Entertainment | 0 (0.0%) | 0 (0.0%) |
| Health Diagnosing & Treating | 0 (0.0%) | 55 (100.0%) |
| Health Technologists | 0 (0.0%) | 0 (0.0%) |
| Total (Category) | 7 (10.1%) | 62 (89.9%) |
| Total (Overall) | 80 (41.4%) | 113 (58.6%) |
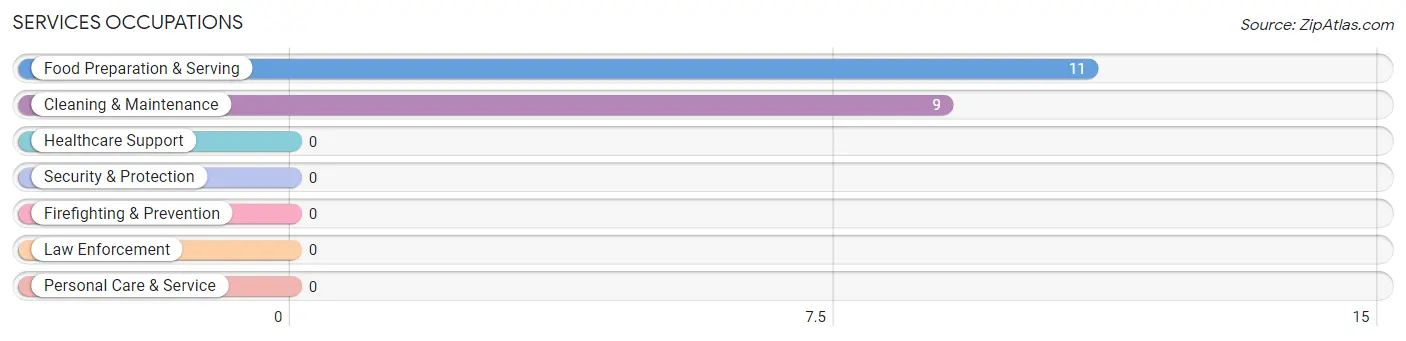
Services Occupations
The most common Services occupations in Montrose Manor are Food Preparation & Serving (11 | 5.7%), and Cleaning & Maintenance (9 | 4.7%).
Services Occupations by Sex
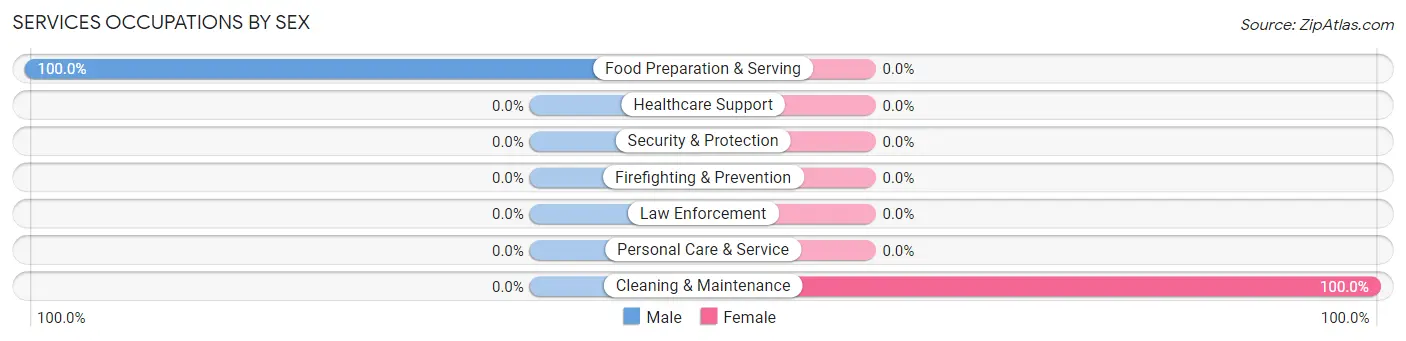
| Occupation | Male | Female |
| Healthcare Support | 0 (0.0%) | 0 (0.0%) |
| Security & Protection | 0 (0.0%) | 0 (0.0%) |
| Firefighting & Prevention | 0 (0.0%) | 0 (0.0%) |
| Law Enforcement | 0 (0.0%) | 0 (0.0%) |
| Food Preparation & Serving | 11 (100.0%) | 0 (0.0%) |
| Cleaning & Maintenance | 0 (0.0%) | 9 (100.0%) |
| Personal Care & Service | 0 (0.0%) | 0 (0.0%) |
| Total (Category) | 11 (55.0%) | 9 (45.0%) |
| Total (Overall) | 80 (41.4%) | 113 (58.6%) |
Sales and Office Occupations
The most common Sales and Office occupations in Montrose Manor are , and Office & Administration (20 | 10.4%).
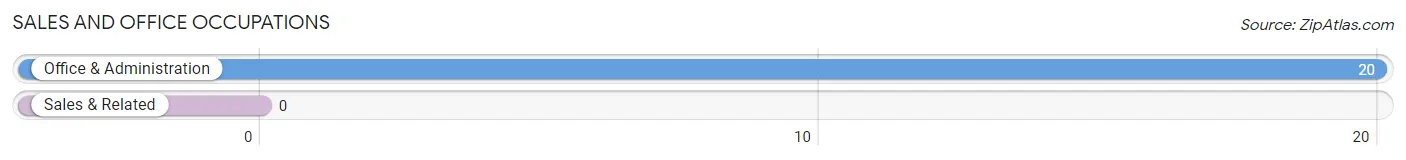
Sales and Office Occupations by Sex
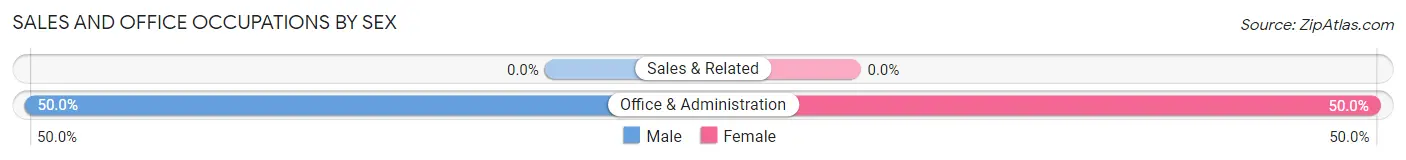
| Occupation | Male | Female |
| Sales & Related | 0 (0.0%) | 0 (0.0%) |
| Office & Administration | 10 (50.0%) | 10 (50.0%) |
| Total (Category) | 10 (50.0%) | 10 (50.0%) |
| Total (Overall) | 80 (41.4%) | 113 (58.6%) |
Natural Resources, Construction and Maintenance Occupations
The most common Natural Resources, Construction and Maintenance occupations in Montrose Manor are , and Installation, Maintenance & Repair (16 | 8.3%).
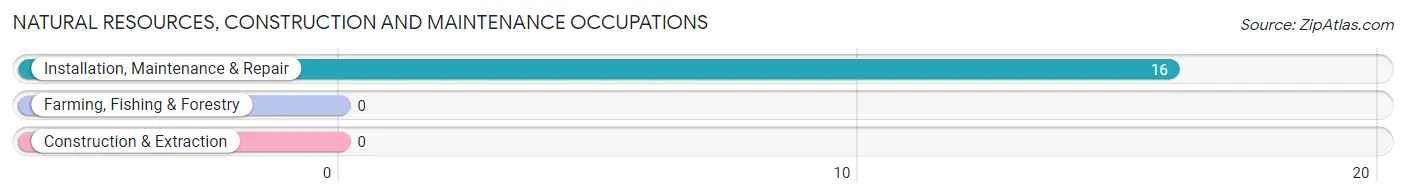
Natural Resources, Construction and Maintenance Occupations by Sex

| Occupation | Male | Female |
| Farming, Fishing & Forestry | 0 (0.0%) | 0 (0.0%) |
| Construction & Extraction | 0 (0.0%) | 0 (0.0%) |
| Installation, Maintenance & Repair | 16 (100.0%) | 0 (0.0%) |
| Total (Category) | 16 (100.0%) | 0 (0.0%) |
| Total (Overall) | 80 (41.4%) | 113 (58.6%) |
Production, Transportation and Moving Occupations
The most common Production, Transportation and Moving occupations in Montrose Manor are Material Moving (37 | 19.2%), and Production (31 | 16.1%).
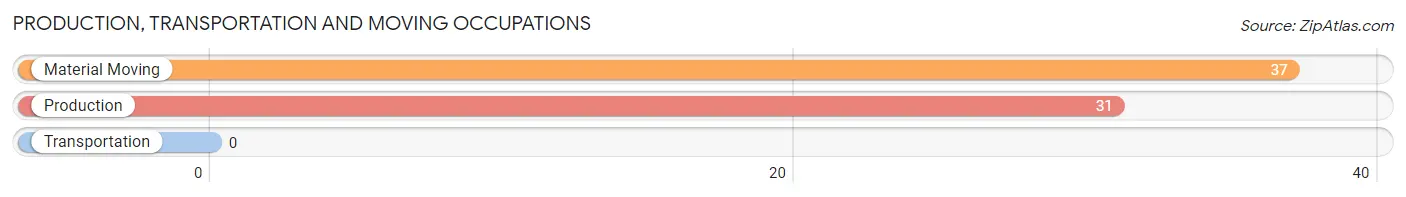
Production, Transportation and Moving Occupations by Sex
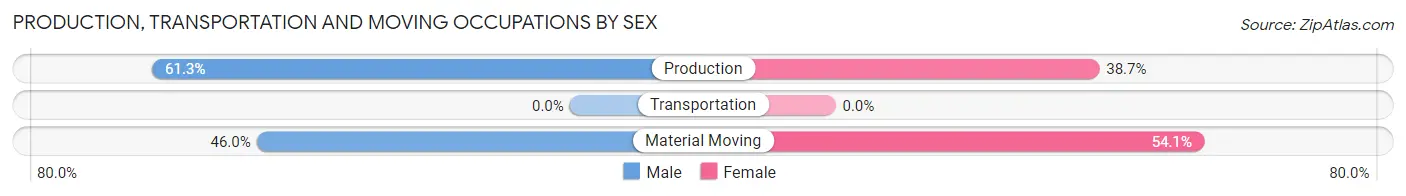
| Occupation | Male | Female |
| Production | 19 (61.3%) | 12 (38.7%) |
| Transportation | 0 (0.0%) | 0 (0.0%) |
| Material Moving | 17 (46.0%) | 20 (54.0%) |
| Total (Category) | 36 (52.9%) | 32 (47.1%) |
| Total (Overall) | 80 (41.4%) | 113 (58.6%) |
Employment Industries by Sex in Montrose Manor
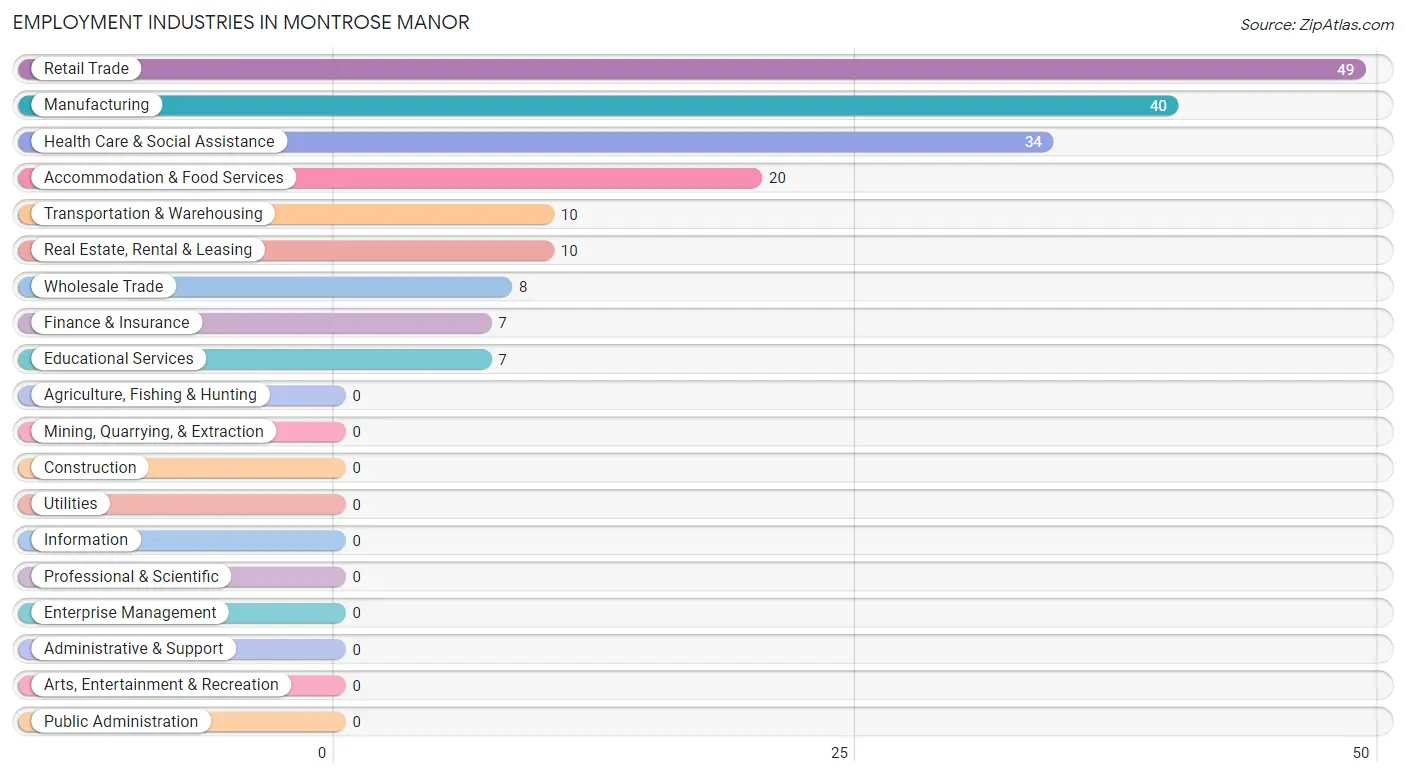
Employment Industries in Montrose Manor
The major employment industries in Montrose Manor include Retail Trade (49 | 25.4%), Manufacturing (40 | 20.7%), Health Care & Social Assistance (34 | 17.6%), Accommodation & Food Services (20 | 10.4%), and Transportation & Warehousing (10 | 5.2%).
Employment Industries by Sex in Montrose Manor
The Montrose Manor industries that see more men than women are Wholesale Trade (100.0%), Finance & Insurance (100.0%), and Real Estate, Rental & Leasing (100.0%), whereas the industries that tend to have a higher number of women are Transportation & Warehousing (100.0%), Educational Services (100.0%), and Health Care & Social Assistance (100.0%).
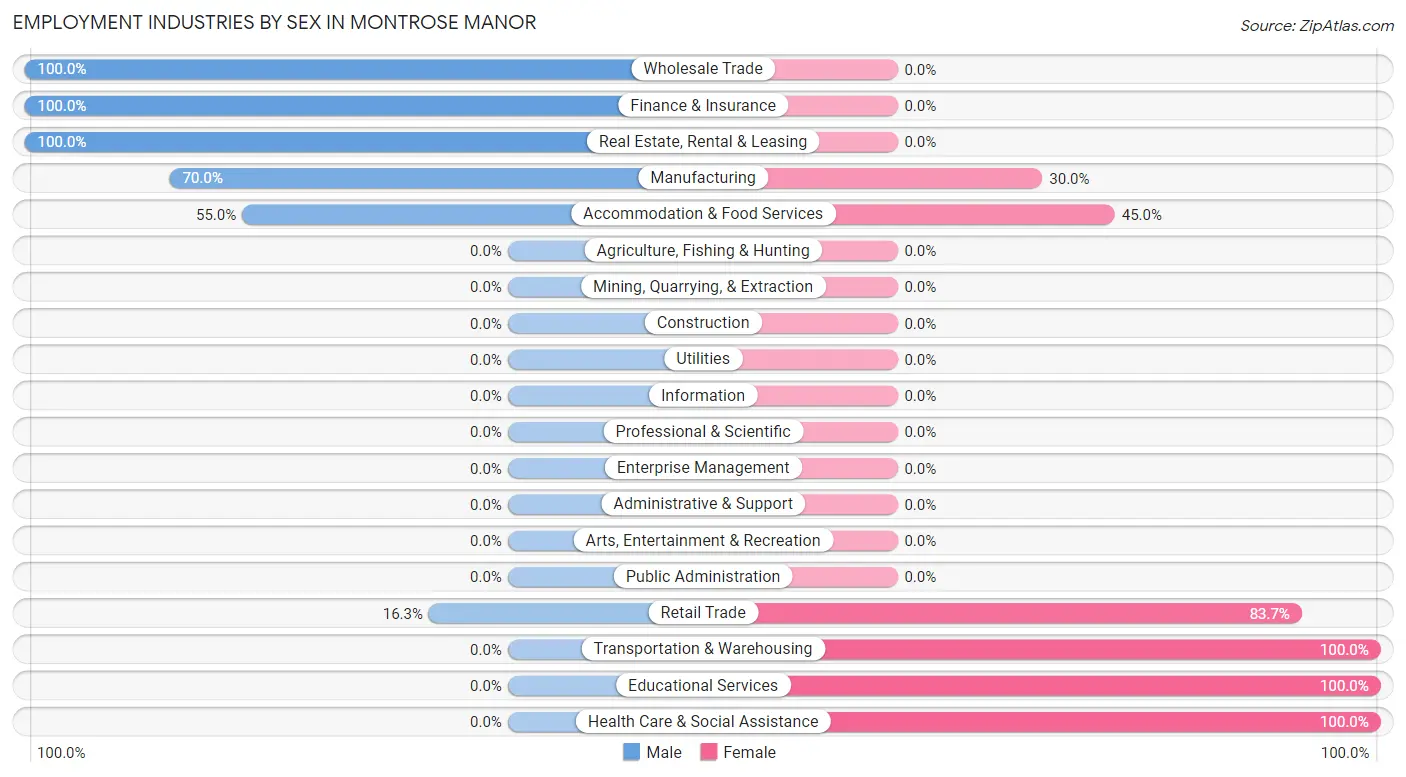
| Industry | Male | Female |
| Agriculture, Fishing & Hunting | 0 (0.0%) | 0 (0.0%) |
| Mining, Quarrying, & Extraction | 0 (0.0%) | 0 (0.0%) |
| Construction | 0 (0.0%) | 0 (0.0%) |
| Manufacturing | 28 (70.0%) | 12 (30.0%) |
| Wholesale Trade | 8 (100.0%) | 0 (0.0%) |
| Retail Trade | 8 (16.3%) | 41 (83.7%) |
| Transportation & Warehousing | 0 (0.0%) | 10 (100.0%) |
| Utilities | 0 (0.0%) | 0 (0.0%) |
| Information | 0 (0.0%) | 0 (0.0%) |
| Finance & Insurance | 7 (100.0%) | 0 (0.0%) |
| Real Estate, Rental & Leasing | 10 (100.0%) | 0 (0.0%) |
| Professional & Scientific | 0 (0.0%) | 0 (0.0%) |
| Enterprise Management | 0 (0.0%) | 0 (0.0%) |
| Administrative & Support | 0 (0.0%) | 0 (0.0%) |
| Educational Services | 0 (0.0%) | 7 (100.0%) |
| Health Care & Social Assistance | 0 (0.0%) | 34 (100.0%) |
| Arts, Entertainment & Recreation | 0 (0.0%) | 0 (0.0%) |
| Accommodation & Food Services | 11 (55.0%) | 9 (45.0%) |
| Public Administration | 0 (0.0%) | 0 (0.0%) |
| Total | 80 (41.4%) | 113 (58.6%) |
Education in Montrose Manor
School Enrollment in Montrose Manor
The most common levels of schooling among the 67 students in Montrose Manor are middle school (50 | 74.6%), high school (10 | 14.9%), and elementary school (7 | 10.4%).
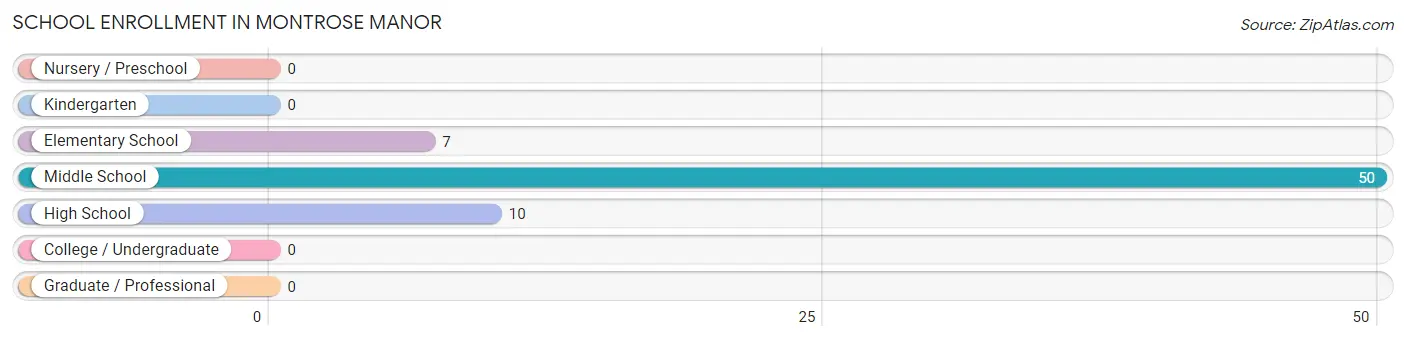
| School Level | # Students | % Students |
| Nursery / Preschool | 0 | 0.0% |
| Kindergarten | 0 | 0.0% |
| Elementary School | 7 | 10.4% |
| Middle School | 50 | 74.6% |
| High School | 10 | 14.9% |
| College / Undergraduate | 0 | 0.0% |
| Graduate / Professional | 0 | 0.0% |
| Total | 67 | 100.0% |
School Enrollment by Age by Funding Source in Montrose Manor
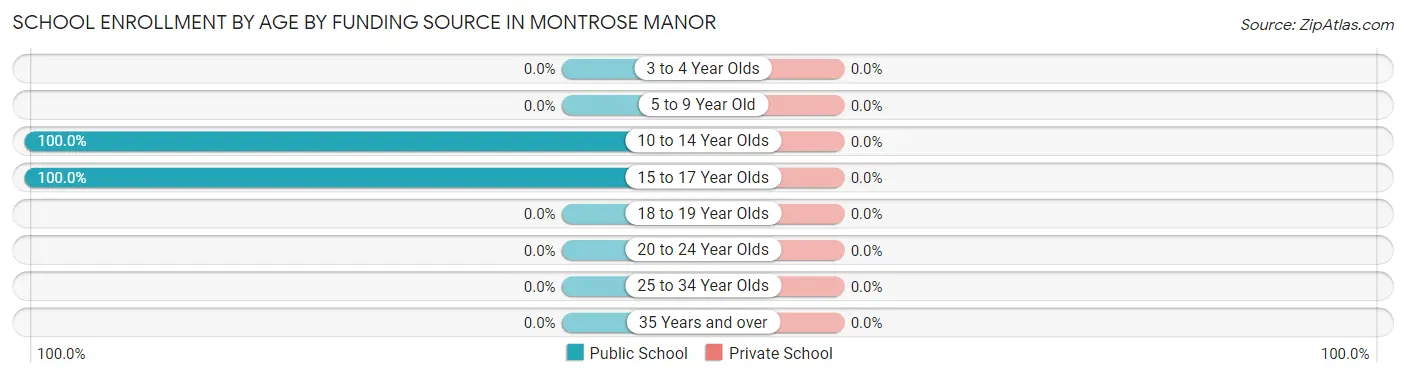
| Age Bracket | Public School | Private School |
| 3 to 4 Year Olds | 0 (0.0%) | 0 (0.0%) |
| 5 to 9 Year Old | 0 (0.0%) | 0 (0.0%) |
| 10 to 14 Year Olds | 57 (100.0%) | 0 (0.0%) |
| 15 to 17 Year Olds | 10 (100.0%) | 0 (0.0%) |
| 18 to 19 Year Olds | 0 (0.0%) | 0 (0.0%) |
| 20 to 24 Year Olds | 0 (0.0%) | 0 (0.0%) |
| 25 to 34 Year Olds | 0 (0.0%) | 0 (0.0%) |
| 35 Years and over | 0 (0.0%) | 0 (0.0%) |
| Total | 67 (100.0%) | 0 (0.0%) |
Educational Attainment by Field of Study in Montrose Manor
Bio, nature & agricultural (35 | 36.1%), business (24 | 24.7%), education (16 | 16.5%), science & technology (15 | 15.5%), and psychology (7 | 7.2%) are the most common fields of study among 97 individuals in Montrose Manor who have obtained a bachelor's degree or higher.
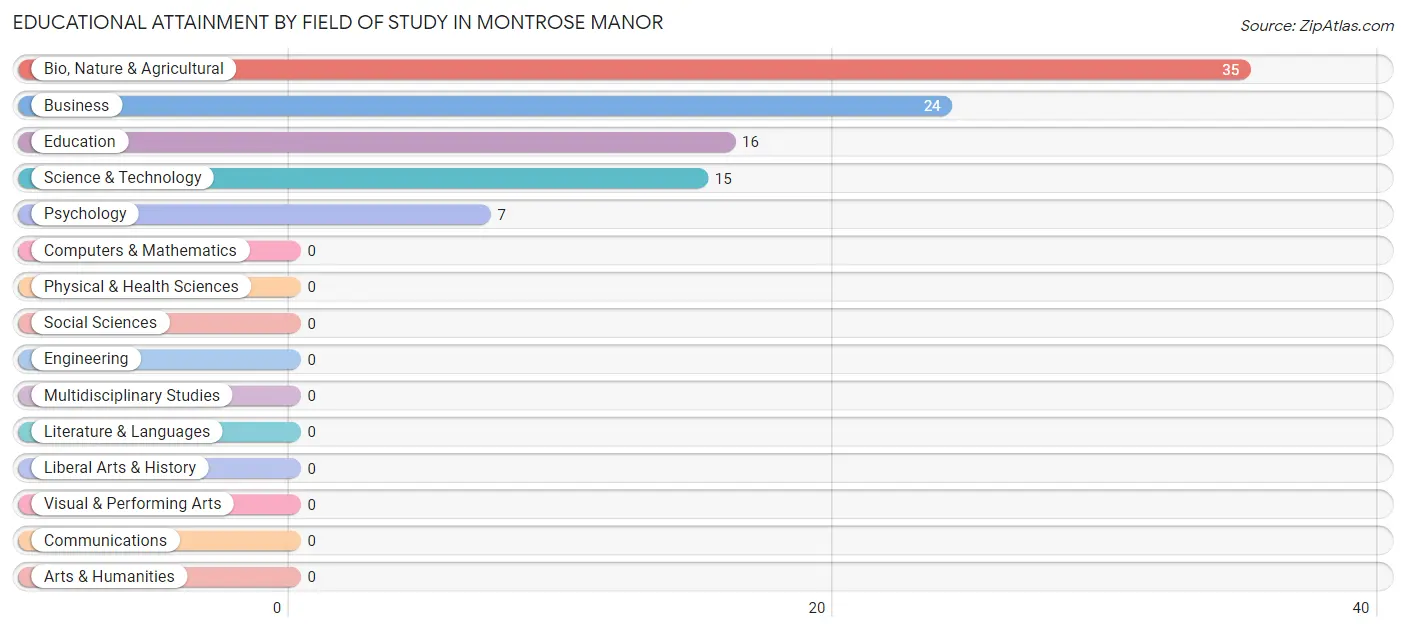
| Field of Study | # Graduates | % Graduates |
| Computers & Mathematics | 0 | 0.0% |
| Bio, Nature & Agricultural | 35 | 36.1% |
| Physical & Health Sciences | 0 | 0.0% |
| Psychology | 7 | 7.2% |
| Social Sciences | 0 | 0.0% |
| Engineering | 0 | 0.0% |
| Multidisciplinary Studies | 0 | 0.0% |
| Science & Technology | 15 | 15.5% |
| Business | 24 | 24.7% |
| Education | 16 | 16.5% |
| Literature & Languages | 0 | 0.0% |
| Liberal Arts & History | 0 | 0.0% |
| Visual & Performing Arts | 0 | 0.0% |
| Communications | 0 | 0.0% |
| Arts & Humanities | 0 | 0.0% |
| Total | 97 | 100.0% |
Transportation & Commute in Montrose Manor
Vehicle Availability by Sex in Montrose Manor
The most prevalent vehicle ownership categories in Montrose Manor are males with 2 vehicles (38, accounting for 47.5%) and females with 2 vehicles (39, making up 25.7%).
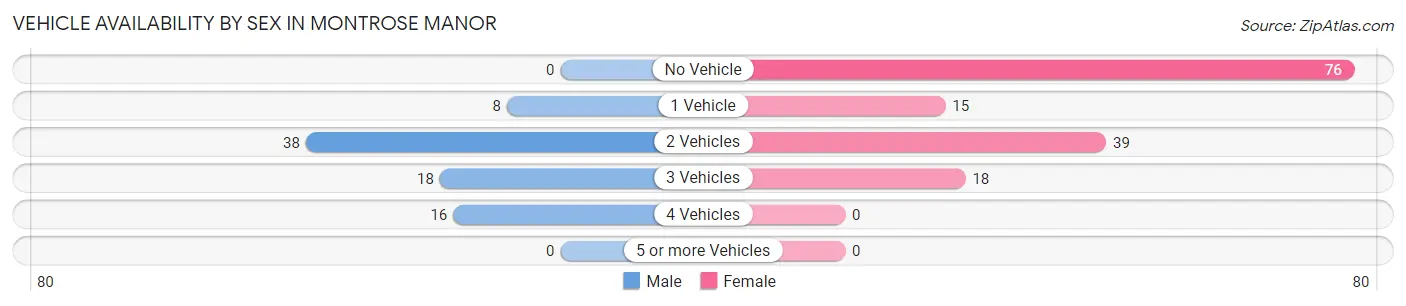
| Vehicles Available | Male | Female |
| No Vehicle | 0 (0.0%) | 76 (51.3%) |
| 1 Vehicle | 8 (10.0%) | 15 (10.1%) |
| 2 Vehicles | 38 (47.5%) | 39 (26.4%) |
| 3 Vehicles | 18 (22.5%) | 18 (12.2%) |
| 4 Vehicles | 16 (20.0%) | 0 (0.0%) |
| 5 or more Vehicles | 0 (0.0%) | 0 (0.0%) |
| Total | 80 (100.0%) | 148 (100.0%) |
Commute Time in Montrose Manor
The most frequently occuring commute durations in Montrose Manor are 60 to 89 minutes (76 commuters, 33.3%), 10 to 14 minutes (67 commuters, 29.4%), and 25 to 29 minutes (29 commuters, 12.7%).
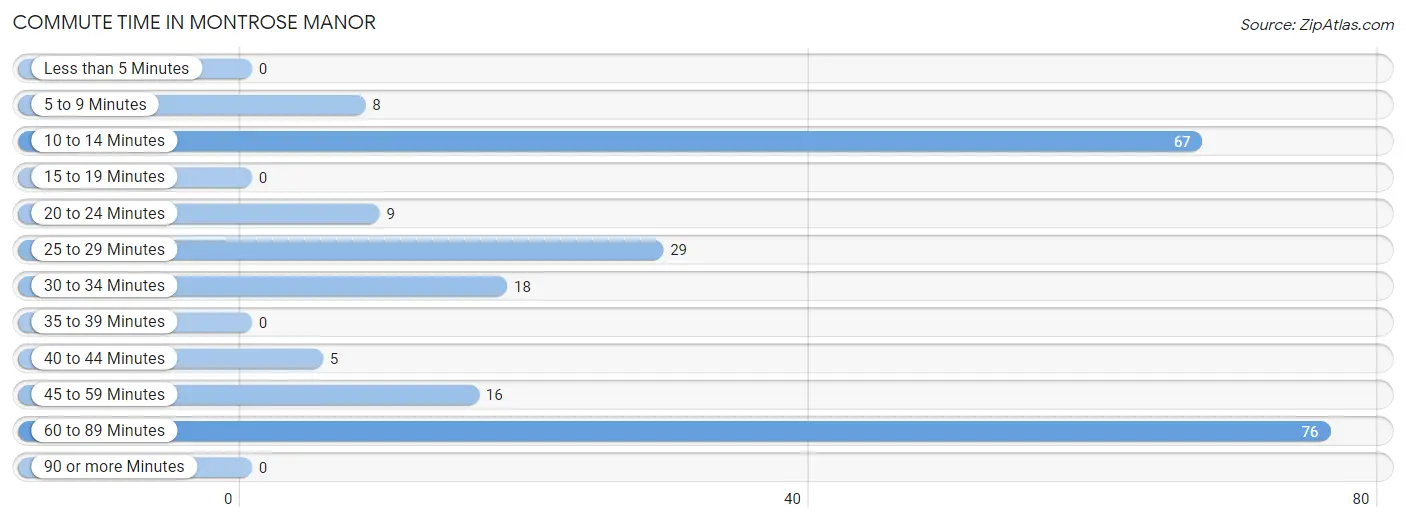
| Commute Time | # Commuters | % Commuters |
| Less than 5 Minutes | 0 | 0.0% |
| 5 to 9 Minutes | 8 | 3.5% |
| 10 to 14 Minutes | 67 | 29.4% |
| 15 to 19 Minutes | 0 | 0.0% |
| 20 to 24 Minutes | 9 | 4.0% |
| 25 to 29 Minutes | 29 | 12.7% |
| 30 to 34 Minutes | 18 | 7.9% |
| 35 to 39 Minutes | 0 | 0.0% |
| 40 to 44 Minutes | 5 | 2.2% |
| 45 to 59 Minutes | 16 | 7.0% |
| 60 to 89 Minutes | 76 | 33.3% |
| 90 or more Minutes | 0 | 0.0% |
Commute Time by Sex in Montrose Manor
The most common commute times in Montrose Manor are 10 to 14 minutes (31 commuters, 38.8%) for males and 60 to 89 minutes (76 commuters, 51.3%) for females.
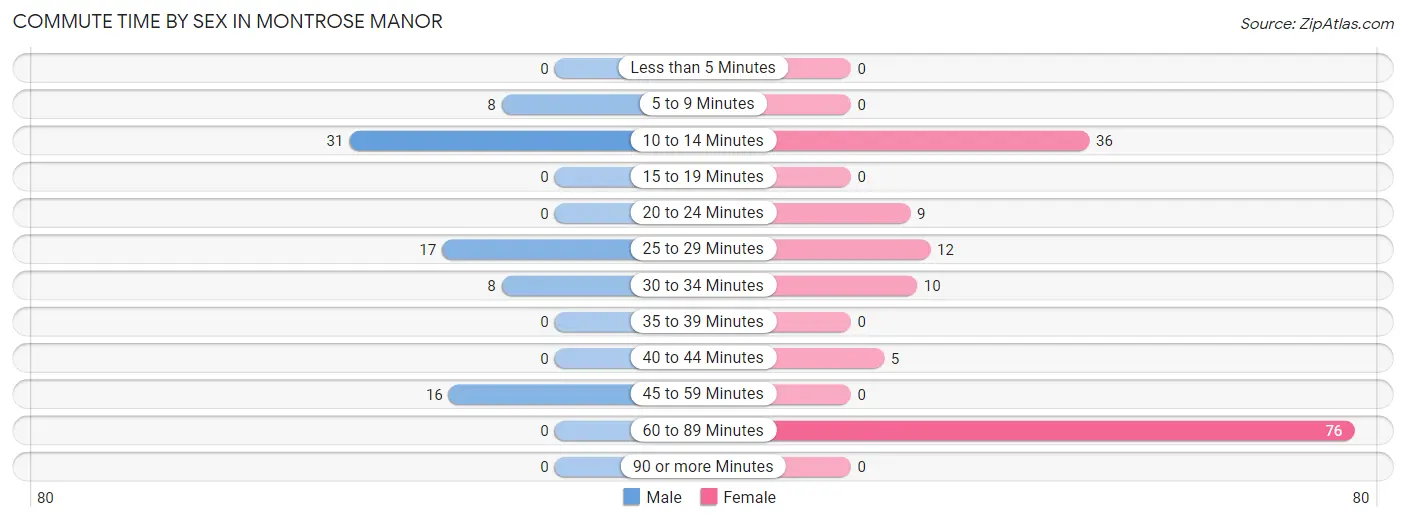
| Commute Time | Male | Female |
| Less than 5 Minutes | 0 (0.0%) | 0 (0.0%) |
| 5 to 9 Minutes | 8 (10.0%) | 0 (0.0%) |
| 10 to 14 Minutes | 31 (38.8%) | 36 (24.3%) |
| 15 to 19 Minutes | 0 (0.0%) | 0 (0.0%) |
| 20 to 24 Minutes | 0 (0.0%) | 9 (6.1%) |
| 25 to 29 Minutes | 17 (21.2%) | 12 (8.1%) |
| 30 to 34 Minutes | 8 (10.0%) | 10 (6.8%) |
| 35 to 39 Minutes | 0 (0.0%) | 0 (0.0%) |
| 40 to 44 Minutes | 0 (0.0%) | 5 (3.4%) |
| 45 to 59 Minutes | 16 (20.0%) | 0 (0.0%) |
| 60 to 89 Minutes | 0 (0.0%) | 76 (51.3%) |
| 90 or more Minutes | 0 (0.0%) | 0 (0.0%) |
Time of Departure to Work by Sex in Montrose Manor
The most frequent times of departure to work in Montrose Manor are 6:00 AM to 6:29 AM (19, 23.7%) for males and 8:00 AM to 8:29 AM (76, 51.3%) for females.
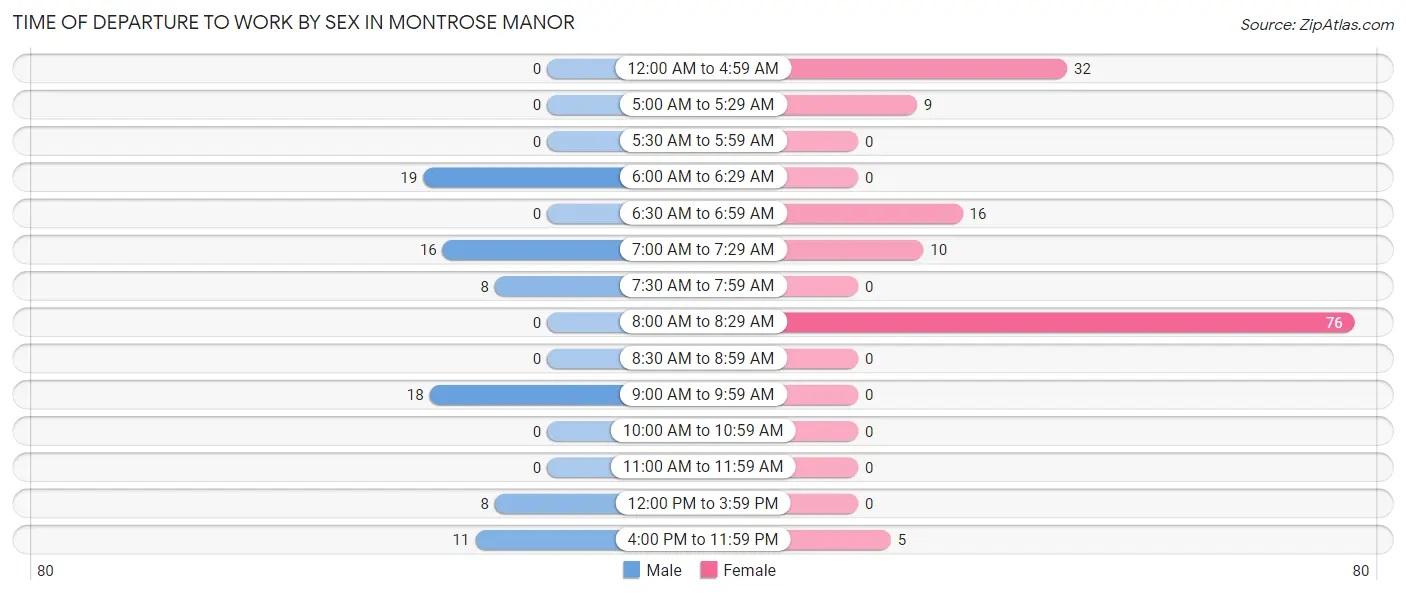
| Time of Departure | Male | Female |
| 12:00 AM to 4:59 AM | 0 (0.0%) | 32 (21.6%) |
| 5:00 AM to 5:29 AM | 0 (0.0%) | 9 (6.1%) |
| 5:30 AM to 5:59 AM | 0 (0.0%) | 0 (0.0%) |
| 6:00 AM to 6:29 AM | 19 (23.7%) | 0 (0.0%) |
| 6:30 AM to 6:59 AM | 0 (0.0%) | 16 (10.8%) |
| 7:00 AM to 7:29 AM | 16 (20.0%) | 10 (6.8%) |
| 7:30 AM to 7:59 AM | 8 (10.0%) | 0 (0.0%) |
| 8:00 AM to 8:29 AM | 0 (0.0%) | 76 (51.3%) |
| 8:30 AM to 8:59 AM | 0 (0.0%) | 0 (0.0%) |
| 9:00 AM to 9:59 AM | 18 (22.5%) | 0 (0.0%) |
| 10:00 AM to 10:59 AM | 0 (0.0%) | 0 (0.0%) |
| 11:00 AM to 11:59 AM | 0 (0.0%) | 0 (0.0%) |
| 12:00 PM to 3:59 PM | 8 (10.0%) | 0 (0.0%) |
| 4:00 PM to 11:59 PM | 11 (13.8%) | 5 (3.4%) |
| Total | 80 (100.0%) | 148 (100.0%) |
Housing Occupancy in Montrose Manor
Occupancy by Ownership in Montrose Manor
Of the total 210 dwellings in Montrose Manor, owner-occupied units account for 143 (68.1%), while renter-occupied units make up 67 (31.9%).
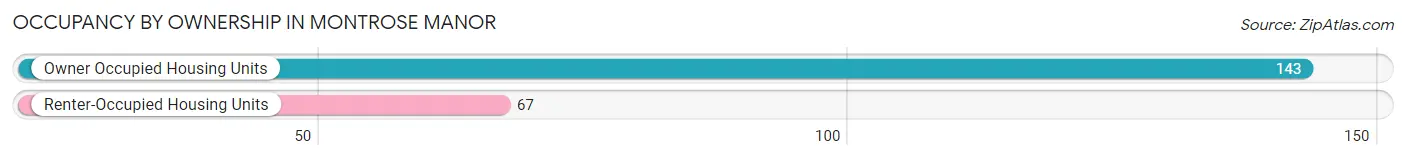
| Occupancy | # Housing Units | % Housing Units |
| Owner Occupied Housing Units | 143 | 68.1% |
| Renter-Occupied Housing Units | 67 | 31.9% |
| Total Occupied Housing Units | 210 | 100.0% |
Occupancy by Household Size in Montrose Manor
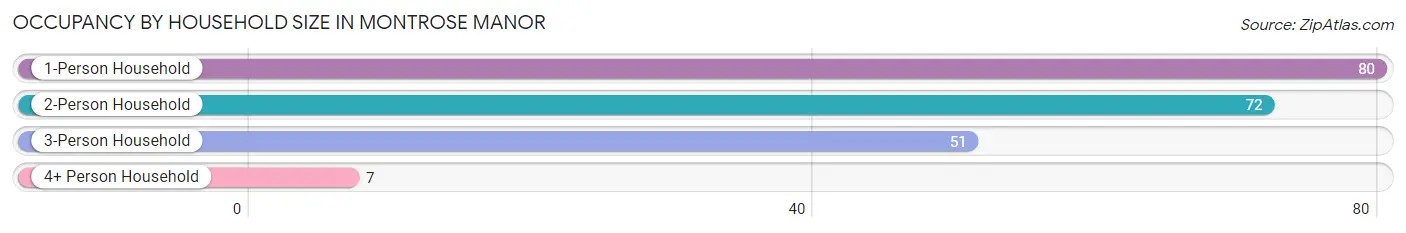
| Household Size | # Housing Units | % Housing Units |
| 1-Person Household | 80 | 38.1% |
| 2-Person Household | 72 | 34.3% |
| 3-Person Household | 51 | 24.3% |
| 4+ Person Household | 7 | 3.3% |
| Total Housing Units | 210 | 100.0% |
Occupancy by Ownership by Household Size in Montrose Manor
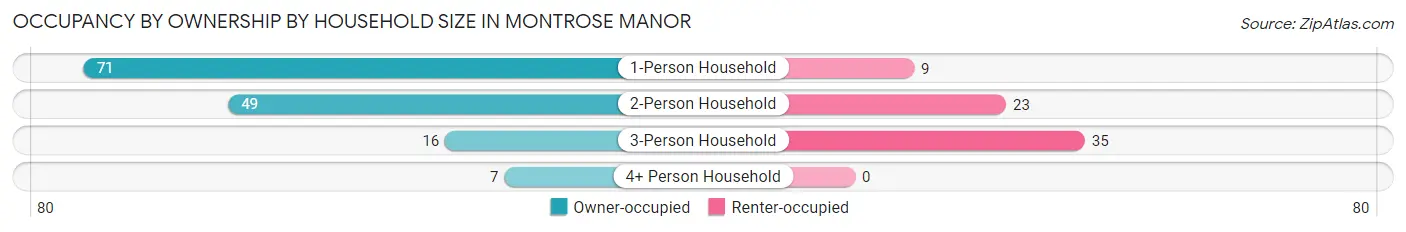
| Household Size | Owner-occupied | Renter-occupied |
| 1-Person Household | 71 (88.7%) | 9 (11.3%) |
| 2-Person Household | 49 (68.1%) | 23 (31.9%) |
| 3-Person Household | 16 (31.4%) | 35 (68.6%) |
| 4+ Person Household | 7 (100.0%) | 0 (0.0%) |
| Total Housing Units | 143 (68.1%) | 67 (31.9%) |
Occupancy by Educational Attainment in Montrose Manor
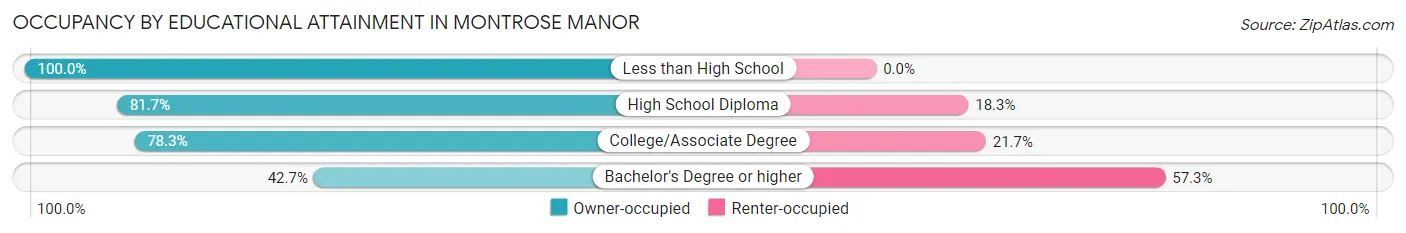
| Household Size | Owner-occupied | Renter-occupied |
| Less than High School | 8 (100.0%) | 0 (0.0%) |
| High School Diploma | 85 (81.7%) | 19 (18.3%) |
| College/Associate Degree | 18 (78.3%) | 5 (21.7%) |
| Bachelor's Degree or higher | 32 (42.7%) | 43 (57.3%) |
Occupancy by Age of Householder in Montrose Manor
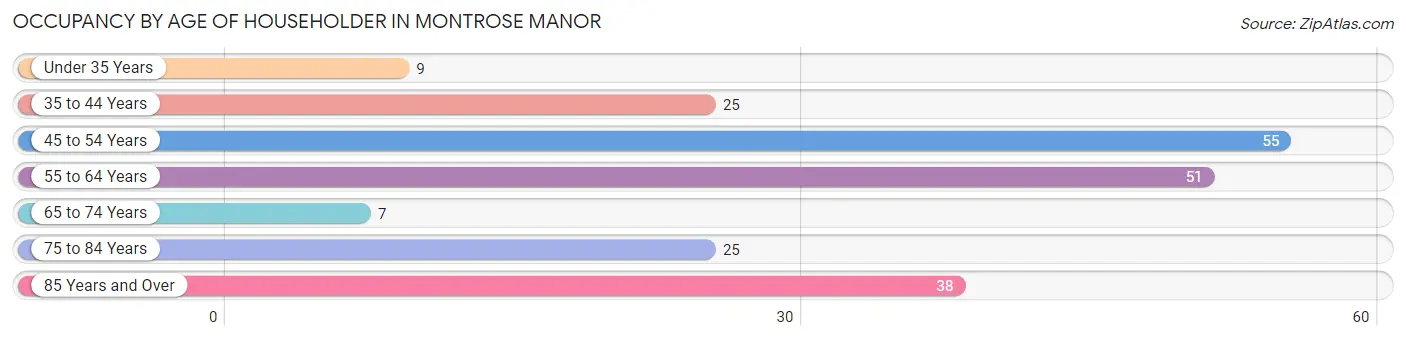
| Age Bracket | # Households | % Households |
| Under 35 Years | 9 | 4.3% |
| 35 to 44 Years | 25 | 11.9% |
| 45 to 54 Years | 55 | 26.2% |
| 55 to 64 Years | 51 | 24.3% |
| 65 to 74 Years | 7 | 3.3% |
| 75 to 84 Years | 25 | 11.9% |
| 85 Years and Over | 38 | 18.1% |
| Total | 210 | 100.0% |
Housing Finances in Montrose Manor
Median Income by Occupancy in Montrose Manor
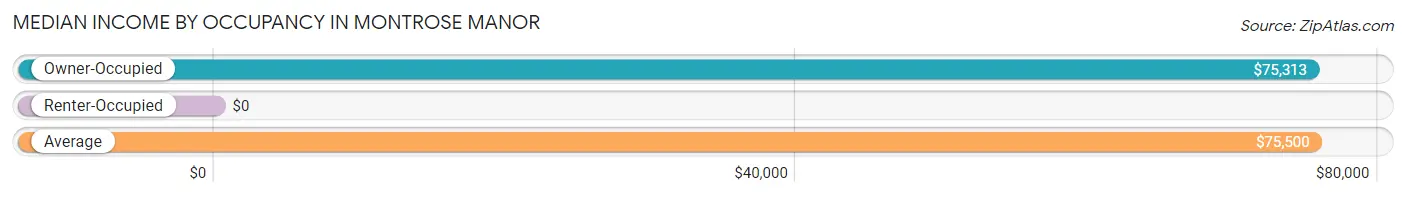
| Occupancy Type | # Households | Median Income |
| Owner-Occupied | 143 (68.1%) | $75,313 |
| Renter-Occupied | 67 (31.9%) | $0 |
| Average | 210 (100.0%) | $75,500 |
Occupancy by Householder Income Bracket in Montrose Manor
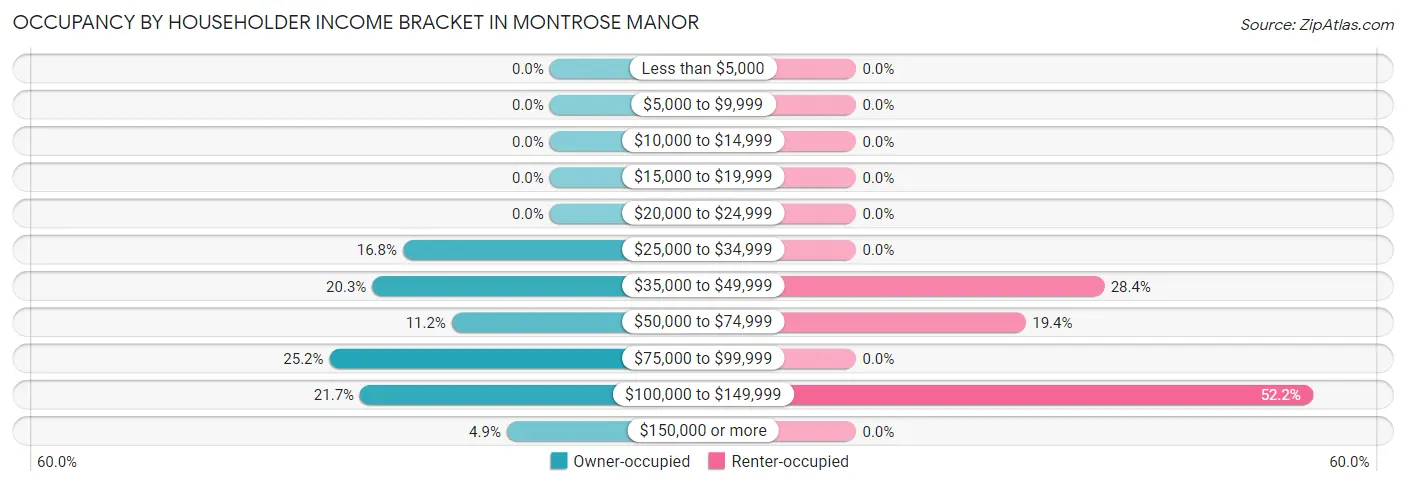
| Income Bracket | Owner-occupied | Renter-occupied |
| Less than $5,000 | 0 (0.0%) | 0 (0.0%) |
| $5,000 to $9,999 | 0 (0.0%) | 0 (0.0%) |
| $10,000 to $14,999 | 0 (0.0%) | 0 (0.0%) |
| $15,000 to $19,999 | 0 (0.0%) | 0 (0.0%) |
| $20,000 to $24,999 | 0 (0.0%) | 0 (0.0%) |
| $25,000 to $34,999 | 24 (16.8%) | 0 (0.0%) |
| $35,000 to $49,999 | 29 (20.3%) | 19 (28.4%) |
| $50,000 to $74,999 | 16 (11.2%) | 13 (19.4%) |
| $75,000 to $99,999 | 36 (25.2%) | 0 (0.0%) |
| $100,000 to $149,999 | 31 (21.7%) | 35 (52.2%) |
| $150,000 or more | 7 (4.9%) | 0 (0.0%) |
| Total | 143 (100.0%) | 67 (100.0%) |
Monthly Housing Cost Tiers in Montrose Manor
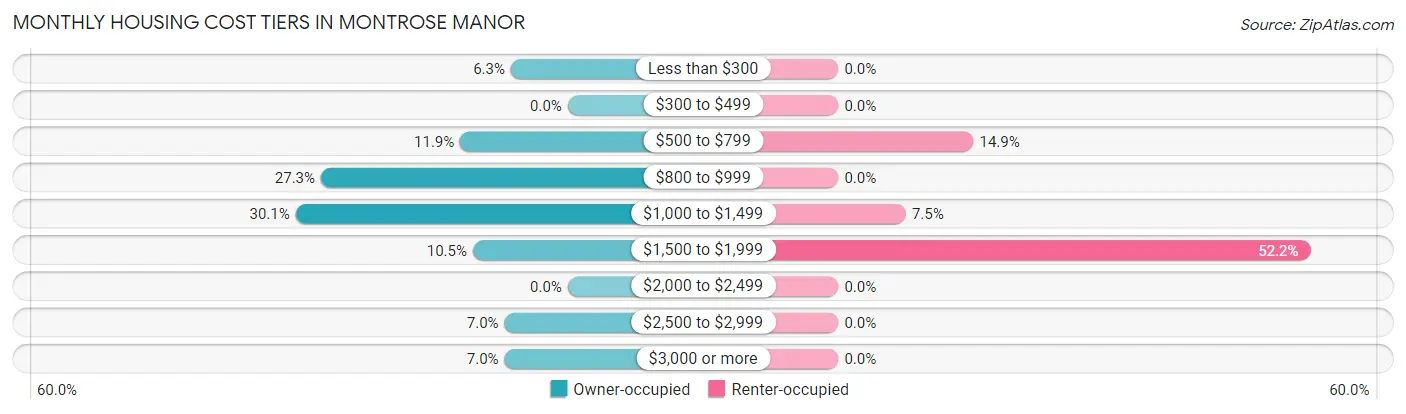
| Monthly Cost | Owner-occupied | Renter-occupied |
| Less than $300 | 9 (6.3%) | 0 (0.0%) |
| $300 to $499 | 0 (0.0%) | 0 (0.0%) |
| $500 to $799 | 17 (11.9%) | 10 (14.9%) |
| $800 to $999 | 39 (27.3%) | 0 (0.0%) |
| $1,000 to $1,499 | 43 (30.1%) | 5 (7.5%) |
| $1,500 to $1,999 | 15 (10.5%) | 35 (52.2%) |
| $2,000 to $2,499 | 0 (0.0%) | 0 (0.0%) |
| $2,500 to $2,999 | 10 (7.0%) | 0 (0.0%) |
| $3,000 or more | 10 (7.0%) | 0 (0.0%) |
| Total | 143 (100.0%) | 67 (100.0%) |
Physical Housing Characteristics in Montrose Manor
Housing Structures in Montrose Manor
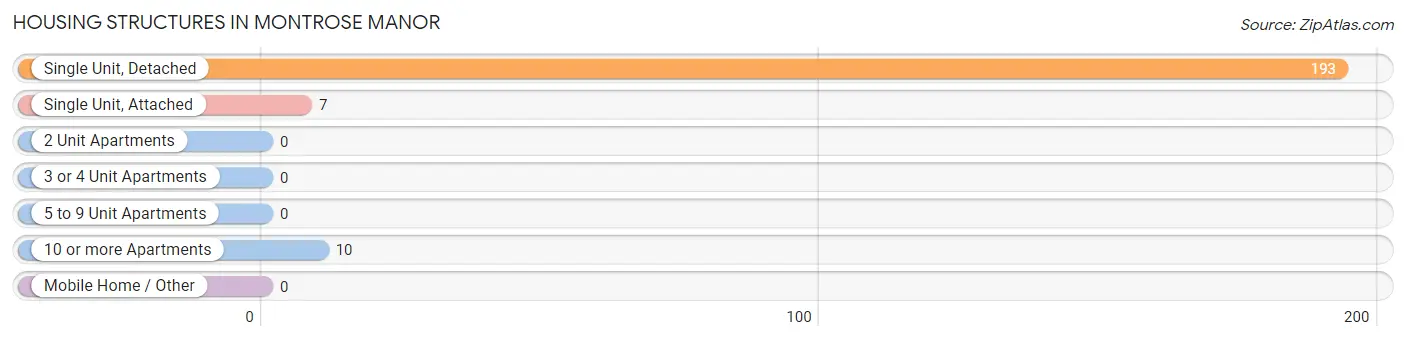
| Structure Type | # Housing Units | % Housing Units |
| Single Unit, Detached | 193 | 91.9% |
| Single Unit, Attached | 7 | 3.3% |
| 2 Unit Apartments | 0 | 0.0% |
| 3 or 4 Unit Apartments | 0 | 0.0% |
| 5 to 9 Unit Apartments | 0 | 0.0% |
| 10 or more Apartments | 10 | 4.8% |
| Mobile Home / Other | 0 | 0.0% |
| Total | 210 | 100.0% |
Housing Structures by Occupancy in Montrose Manor
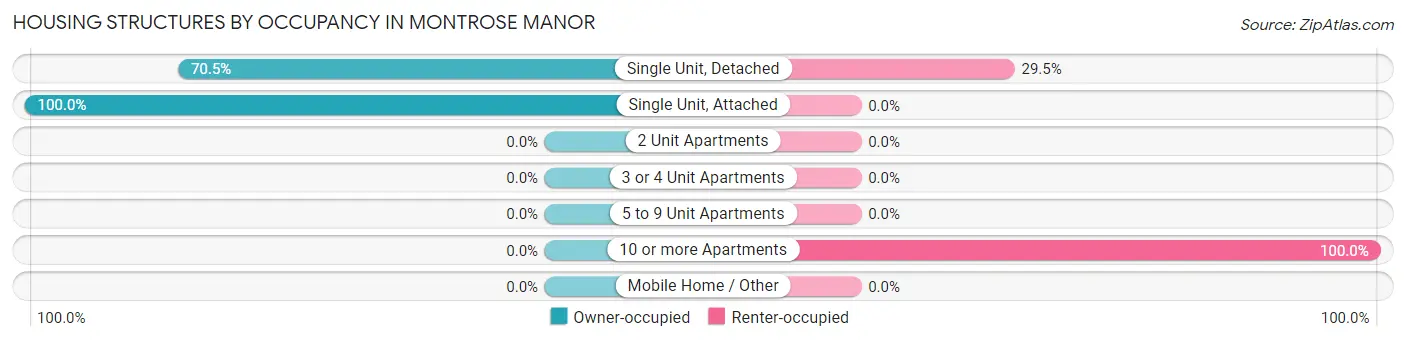
| Structure Type | Owner-occupied | Renter-occupied |
| Single Unit, Detached | 136 (70.5%) | 57 (29.5%) |
| Single Unit, Attached | 7 (100.0%) | 0 (0.0%) |
| 2 Unit Apartments | 0 (0.0%) | 0 (0.0%) |
| 3 or 4 Unit Apartments | 0 (0.0%) | 0 (0.0%) |
| 5 to 9 Unit Apartments | 0 (0.0%) | 0 (0.0%) |
| 10 or more Apartments | 0 (0.0%) | 10 (100.0%) |
| Mobile Home / Other | 0 (0.0%) | 0 (0.0%) |
| Total | 143 (68.1%) | 67 (31.9%) |
Housing Structures by Number of Rooms in Montrose Manor
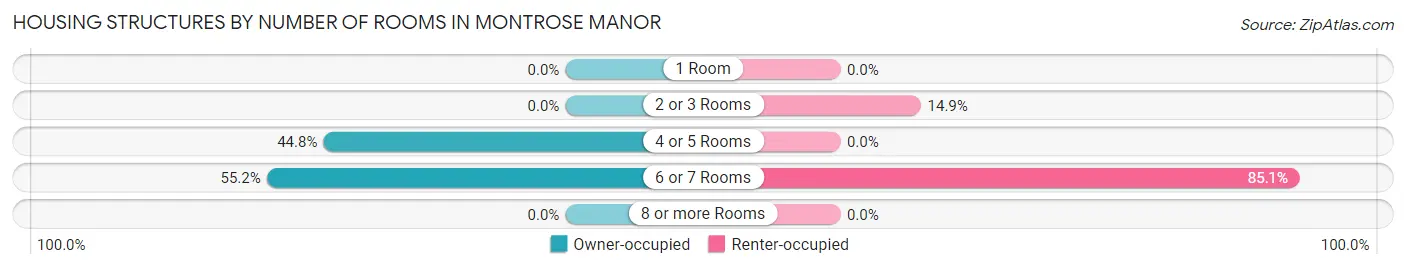
| Number of Rooms | Owner-occupied | Renter-occupied |
| 1 Room | 0 (0.0%) | 0 (0.0%) |
| 2 or 3 Rooms | 0 (0.0%) | 10 (14.9%) |
| 4 or 5 Rooms | 64 (44.8%) | 0 (0.0%) |
| 6 or 7 Rooms | 79 (55.2%) | 57 (85.1%) |
| 8 or more Rooms | 0 (0.0%) | 0 (0.0%) |
| Total | 143 (100.0%) | 67 (100.0%) |
Housing Structure by Heating Type in Montrose Manor
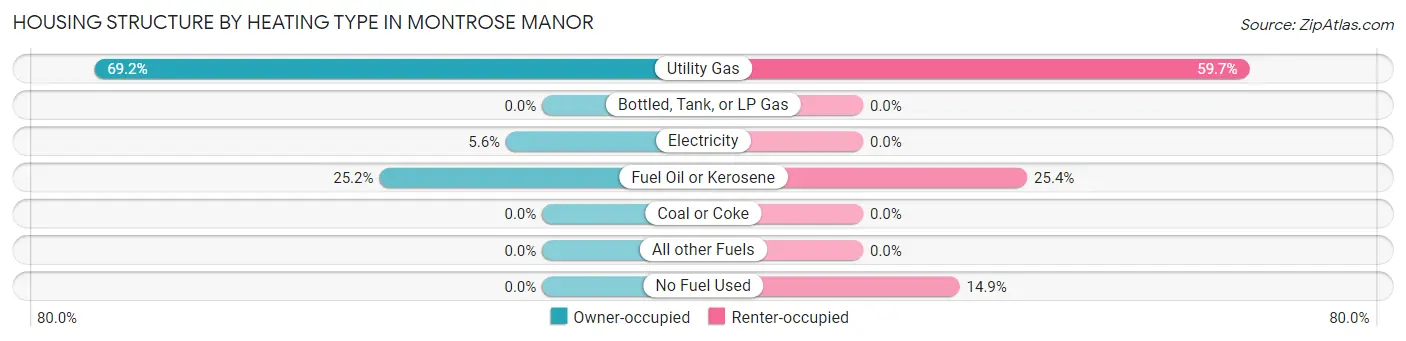
| Heating Type | Owner-occupied | Renter-occupied |
| Utility Gas | 99 (69.2%) | 40 (59.7%) |
| Bottled, Tank, or LP Gas | 0 (0.0%) | 0 (0.0%) |
| Electricity | 8 (5.6%) | 0 (0.0%) |
| Fuel Oil or Kerosene | 36 (25.2%) | 17 (25.4%) |
| Coal or Coke | 0 (0.0%) | 0 (0.0%) |
| All other Fuels | 0 (0.0%) | 0 (0.0%) |
| No Fuel Used | 0 (0.0%) | 10 (14.9%) |
| Total | 143 (100.0%) | 67 (100.0%) |
Household Vehicle Usage in Montrose Manor
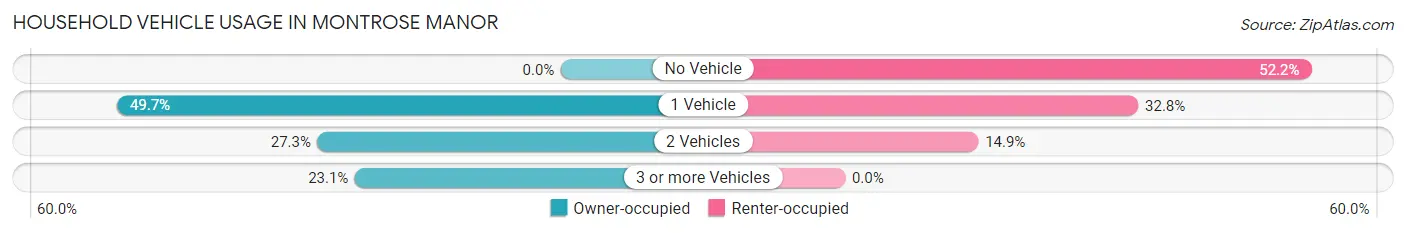
| Vehicles per Household | Owner-occupied | Renter-occupied |
| No Vehicle | 0 (0.0%) | 35 (52.2%) |
| 1 Vehicle | 71 (49.6%) | 22 (32.8%) |
| 2 Vehicles | 39 (27.3%) | 10 (14.9%) |
| 3 or more Vehicles | 33 (23.1%) | 0 (0.0%) |
| Total | 143 (100.0%) | 67 (100.0%) |
Real Estate & Mortgages in Montrose Manor
Real Estate and Mortgage Overview in Montrose Manor
| Characteristic | Without Mortgage | With Mortgage |
| Housing Units | 47 | 96 |
| Median Property Value | $153,700 | $163,900 |
| Median Household Income | $36,726 | $7 |
| Monthly Housing Costs | $772 | $10 |
| Real Estate Taxes | $2,690 | $0 |
Property Value by Mortgage Status in Montrose Manor
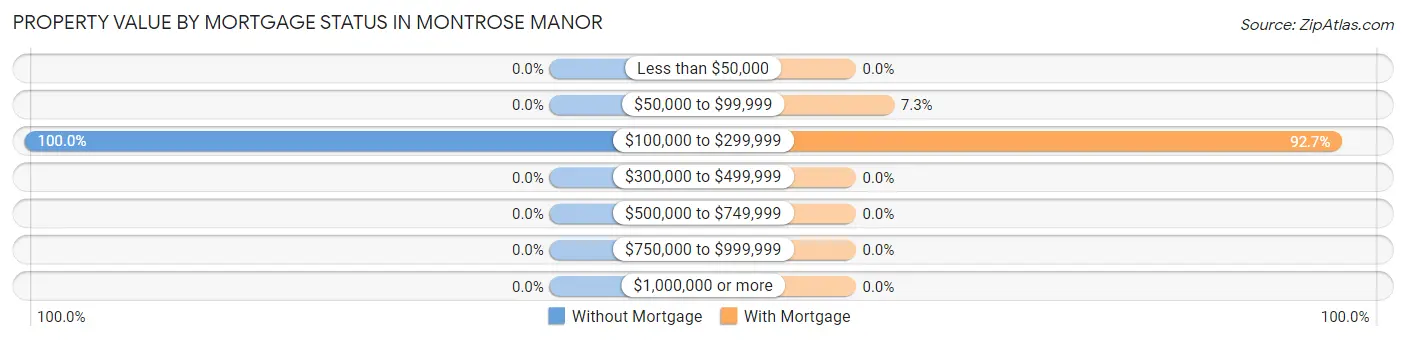
| Property Value | Without Mortgage | With Mortgage |
| Less than $50,000 | 0 (0.0%) | 0 (0.0%) |
| $50,000 to $99,999 | 0 (0.0%) | 7 (7.3%) |
| $100,000 to $299,999 | 47 (100.0%) | 89 (92.7%) |
| $300,000 to $499,999 | 0 (0.0%) | 0 (0.0%) |
| $500,000 to $749,999 | 0 (0.0%) | 0 (0.0%) |
| $750,000 to $999,999 | 0 (0.0%) | 0 (0.0%) |
| $1,000,000 or more | 0 (0.0%) | 0 (0.0%) |
| Total | 47 (100.0%) | 96 (100.0%) |
Household Income by Mortgage Status in Montrose Manor
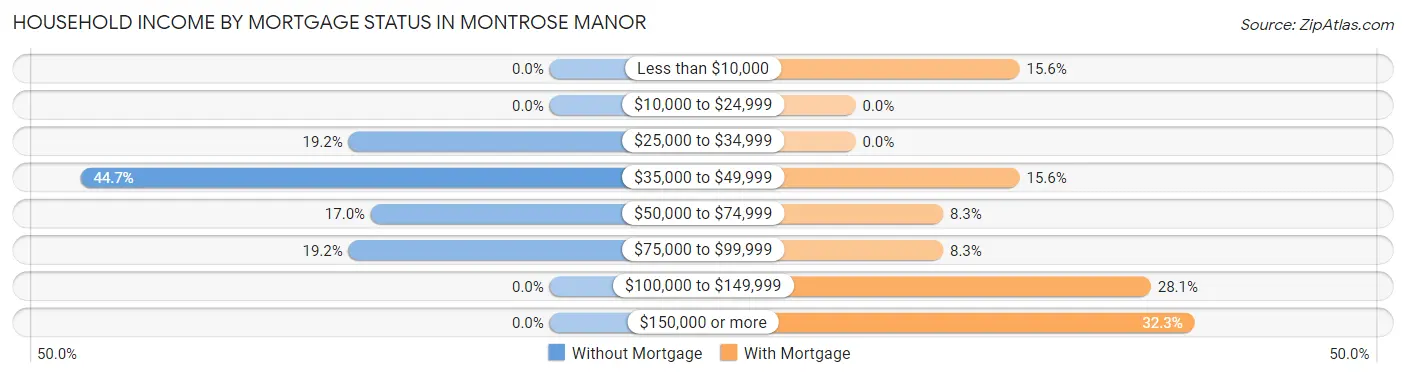
| Household Income | Without Mortgage | With Mortgage |
| Less than $10,000 | 0 (0.0%) | 15 (15.6%) |
| $10,000 to $24,999 | 0 (0.0%) | 0 (0.0%) |
| $25,000 to $34,999 | 9 (19.2%) | 0 (0.0%) |
| $35,000 to $49,999 | 21 (44.7%) | 15 (15.6%) |
| $50,000 to $74,999 | 8 (17.0%) | 8 (8.3%) |
| $75,000 to $99,999 | 9 (19.2%) | 8 (8.3%) |
| $100,000 to $149,999 | 0 (0.0%) | 27 (28.1%) |
| $150,000 or more | 0 (0.0%) | 31 (32.3%) |
| Total | 47 (100.0%) | 96 (100.0%) |
Property Value to Household Income Ratio in Montrose Manor
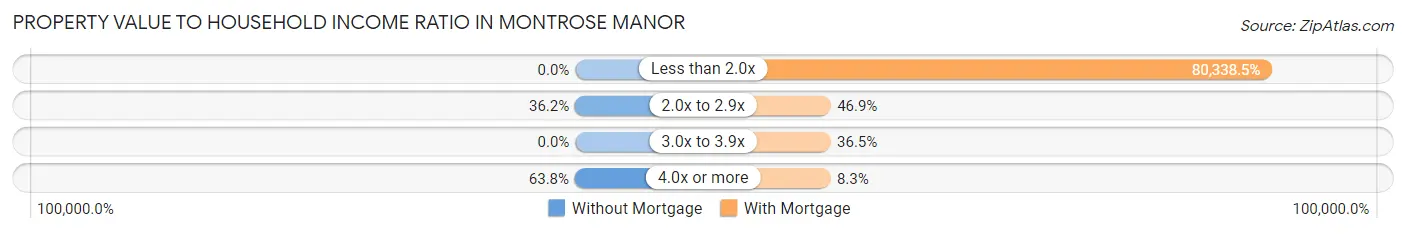
| Value-to-Income Ratio | Without Mortgage | With Mortgage |
| Less than 2.0x | 0 (0.0%) | 77,125 (80,338.5%) |
| 2.0x to 2.9x | 17 (36.2%) | 45 (46.9%) |
| 3.0x to 3.9x | 0 (0.0%) | 35 (36.5%) |
| 4.0x or more | 30 (63.8%) | 8 (8.3%) |
| Total | 47 (100.0%) | 96 (100.0%) |
Real Estate Taxes by Mortgage Status in Montrose Manor
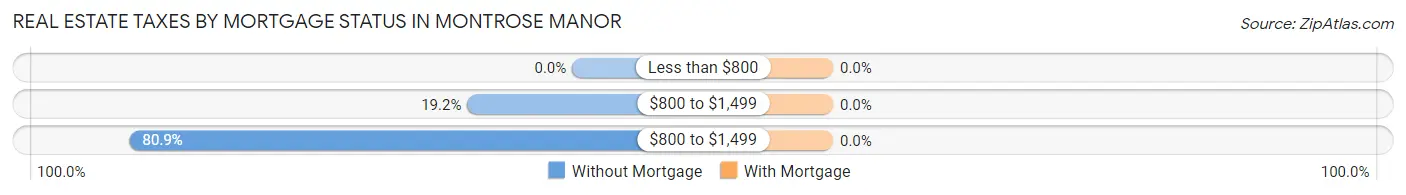
| Property Taxes | Without Mortgage | With Mortgage |
| Less than $800 | 0 (0.0%) | 0 (0.0%) |
| $800 to $1,499 | 9 (19.2%) | 0 (0.0%) |
| $800 to $1,499 | 38 (80.8%) | 0 (0.0%) |
| Total | 47 (100.0%) | 96 (100.0%) |
Health & Disability in Montrose Manor
Health Insurance Coverage by Age in Montrose Manor
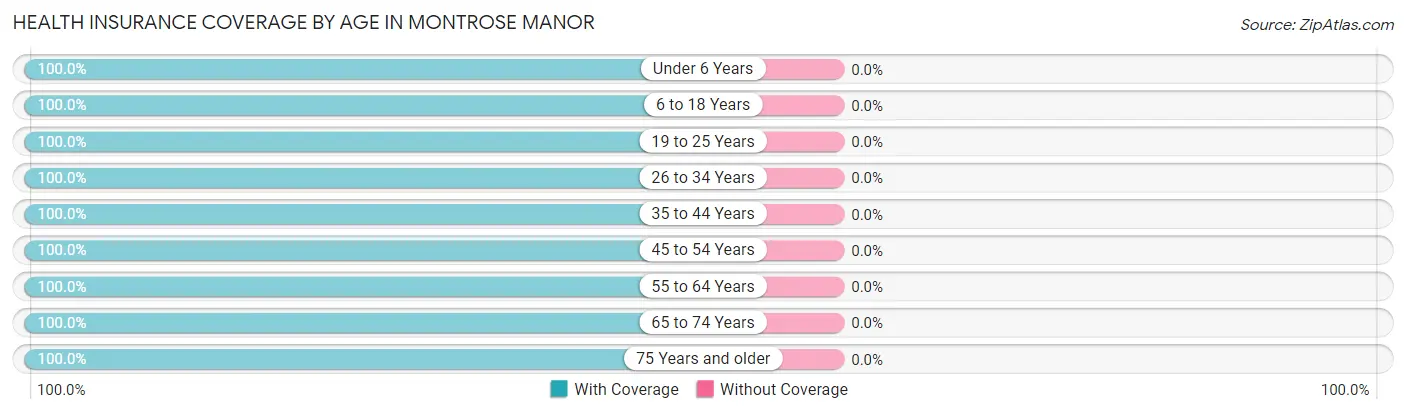
| Age Bracket | With Coverage | Without Coverage |
| Under 6 Years | 9 (100.0%) | 0 (0.0%) |
| 6 to 18 Years | 67 (100.0%) | 0 (0.0%) |
| 19 to 25 Years | 52 (100.0%) | 0 (0.0%) |
| 26 to 34 Years | 36 (100.0%) | 0 (0.0%) |
| 35 to 44 Years | 40 (100.0%) | 0 (0.0%) |
| 45 to 54 Years | 30 (100.0%) | 0 (0.0%) |
| 55 to 64 Years | 75 (100.0%) | 0 (0.0%) |
| 65 to 74 Years | 14 (100.0%) | 0 (0.0%) |
| 75 Years and older | 63 (100.0%) | 0 (0.0%) |
| Total | 386 (100.0%) | 0 (0.0%) |
Health Insurance Coverage by Citizenship Status in Montrose Manor

| Citizenship Status | With Coverage | Without Coverage |
| Native Born | 9 (100.0%) | 0 (0.0%) |
| Foreign Born, Citizen | 67 (100.0%) | 0 (0.0%) |
| Foreign Born, not a Citizen | 52 (100.0%) | 0 (0.0%) |
Health Insurance Coverage by Household Income in Montrose Manor
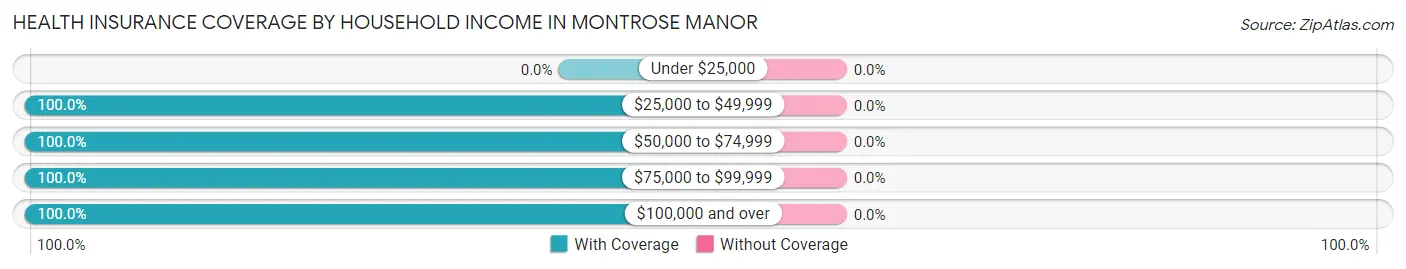
| Household Income | With Coverage | Without Coverage |
| Under $25,000 | 0 (0.0%) | 0 (0.0%) |
| $25,000 to $49,999 | 85 (100.0%) | 0 (0.0%) |
| $50,000 to $74,999 | 44 (100.0%) | 0 (0.0%) |
| $75,000 to $99,999 | 81 (100.0%) | 0 (0.0%) |
| $100,000 and over | 176 (100.0%) | 0 (0.0%) |
Public vs Private Health Insurance Coverage by Age in Montrose Manor
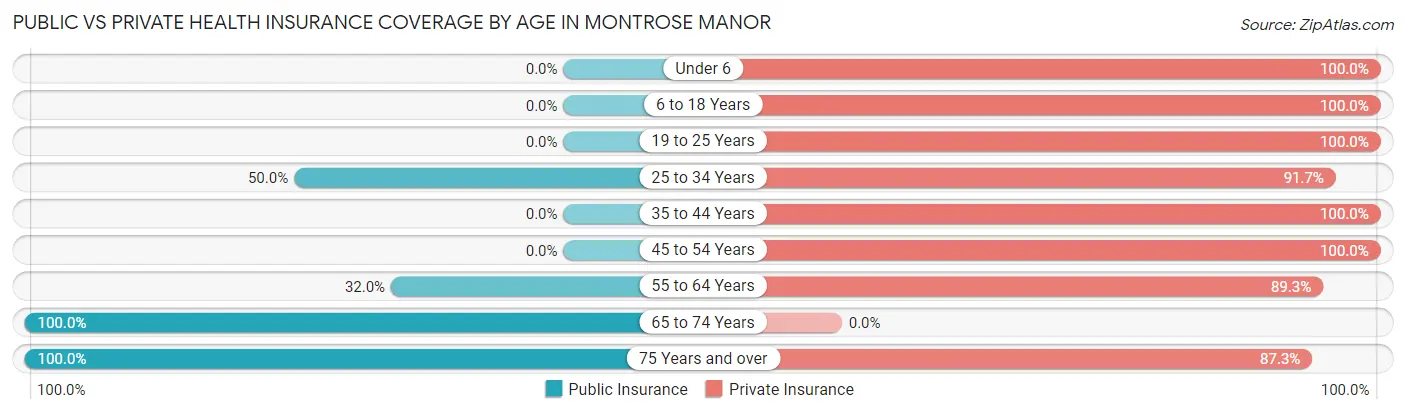
| Age Bracket | Public Insurance | Private Insurance |
| Under 6 | 0 (0.0%) | 9 (100.0%) |
| 6 to 18 Years | 0 (0.0%) | 67 (100.0%) |
| 19 to 25 Years | 0 (0.0%) | 52 (100.0%) |
| 25 to 34 Years | 18 (50.0%) | 33 (91.7%) |
| 35 to 44 Years | 0 (0.0%) | 40 (100.0%) |
| 45 to 54 Years | 0 (0.0%) | 30 (100.0%) |
| 55 to 64 Years | 24 (32.0%) | 67 (89.3%) |
| 65 to 74 Years | 14 (100.0%) | 0 (0.0%) |
| 75 Years and over | 63 (100.0%) | 55 (87.3%) |
| Total | 119 (30.8%) | 353 (91.4%) |
Disability Status by Sex by Age in Montrose Manor
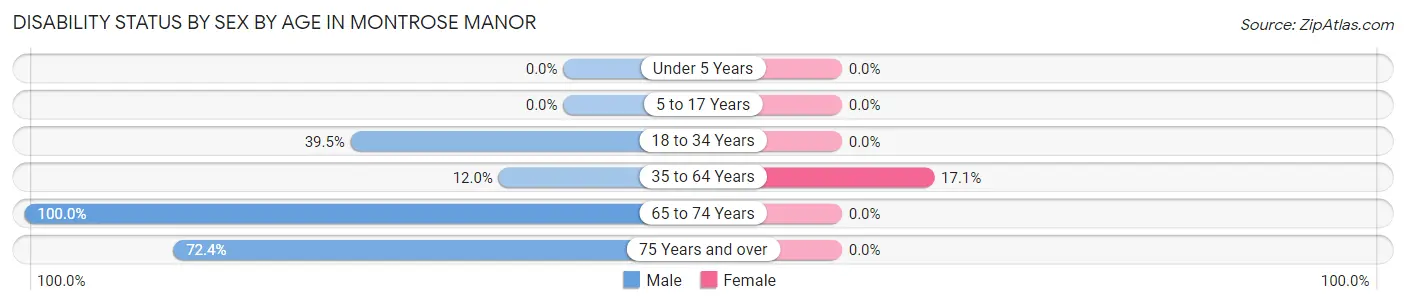
| Age Bracket | Male | Female |
| Under 5 Years | 0 (0.0%) | 0 (0.0%) |
| 5 to 17 Years | 0 (0.0%) | 0 (0.0%) |
| 18 to 34 Years | 15 (39.5%) | 0 (0.0%) |
| 35 to 64 Years | 9 (12.0%) | 12 (17.1%) |
| 65 to 74 Years | 7 (100.0%) | 0 (0.0%) |
| 75 Years and over | 21 (72.4%) | 0 (0.0%) |
Disability Class by Sex by Age in Montrose Manor
Disability Class: Hearing Difficulty
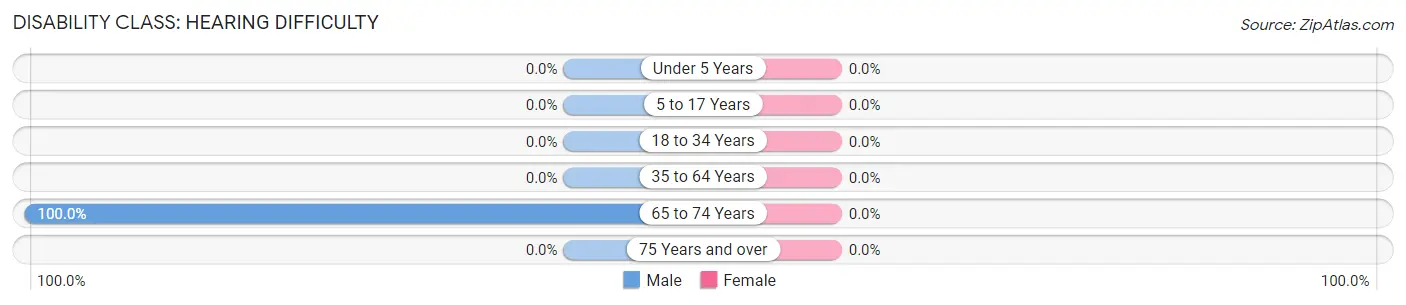
| Age Bracket | Male | Female |
| Under 5 Years | 0 (0.0%) | 0 (0.0%) |
| 5 to 17 Years | 0 (0.0%) | 0 (0.0%) |
| 18 to 34 Years | 0 (0.0%) | 0 (0.0%) |
| 35 to 64 Years | 0 (0.0%) | 0 (0.0%) |
| 65 to 74 Years | 7 (100.0%) | 0 (0.0%) |
| 75 Years and over | 0 (0.0%) | 0 (0.0%) |
Disability Class: Vision Difficulty
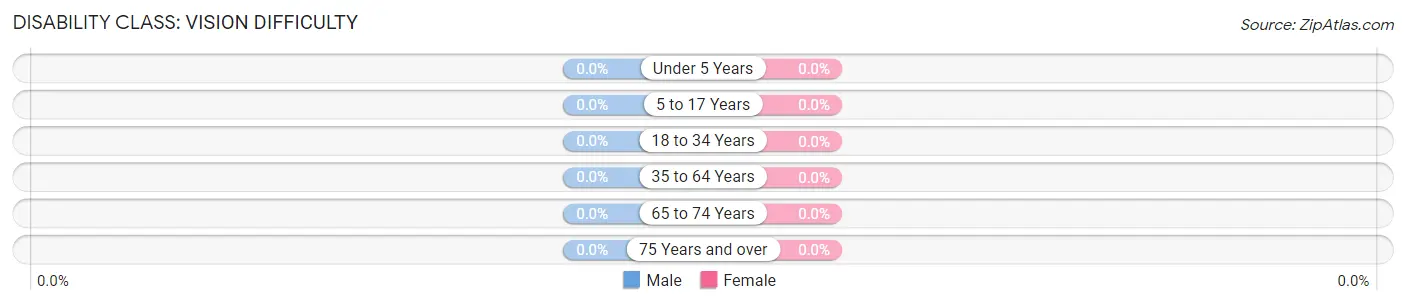
| Age Bracket | Male | Female |
| Under 5 Years | 0 (0.0%) | 0 (0.0%) |
| 5 to 17 Years | 0 (0.0%) | 0 (0.0%) |
| 18 to 34 Years | 0 (0.0%) | 0 (0.0%) |
| 35 to 64 Years | 0 (0.0%) | 0 (0.0%) |
| 65 to 74 Years | 0 (0.0%) | 0 (0.0%) |
| 75 Years and over | 0 (0.0%) | 0 (0.0%) |
Disability Class: Cognitive Difficulty
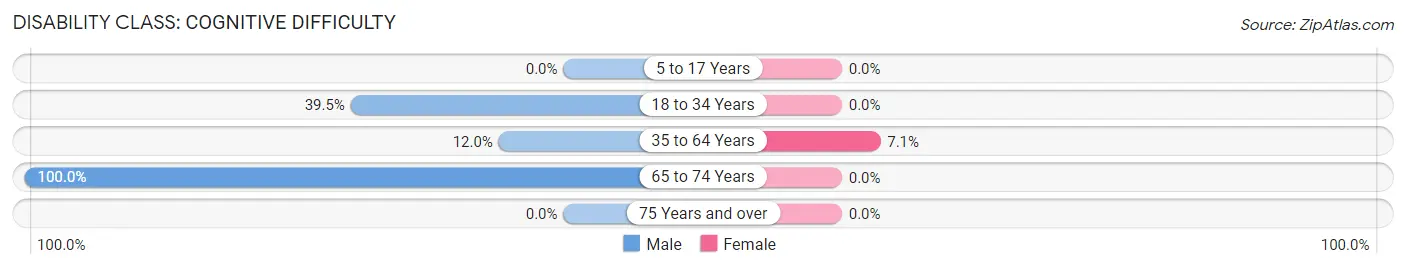
| Age Bracket | Male | Female |
| 5 to 17 Years | 0 (0.0%) | 0 (0.0%) |
| 18 to 34 Years | 15 (39.5%) | 0 (0.0%) |
| 35 to 64 Years | 9 (12.0%) | 5 (7.1%) |
| 65 to 74 Years | 7 (100.0%) | 0 (0.0%) |
| 75 Years and over | 0 (0.0%) | 0 (0.0%) |
Disability Class: Ambulatory Difficulty
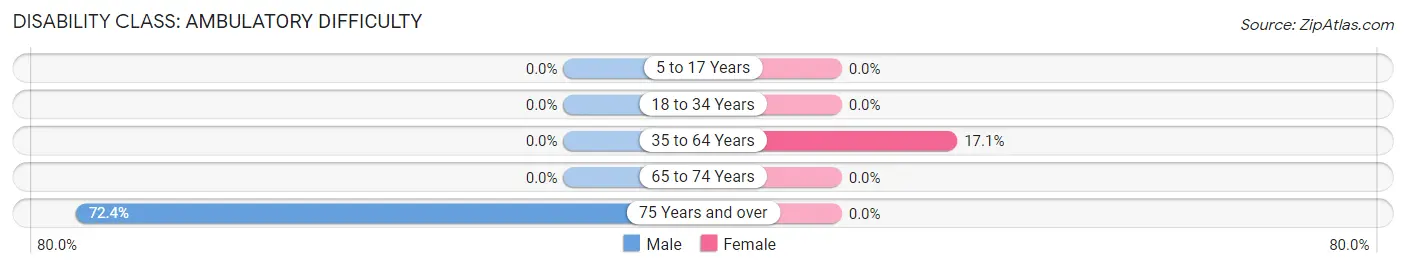
| Age Bracket | Male | Female |
| 5 to 17 Years | 0 (0.0%) | 0 (0.0%) |
| 18 to 34 Years | 0 (0.0%) | 0 (0.0%) |
| 35 to 64 Years | 0 (0.0%) | 12 (17.1%) |
| 65 to 74 Years | 0 (0.0%) | 0 (0.0%) |
| 75 Years and over | 21 (72.4%) | 0 (0.0%) |
Disability Class: Self-Care Difficulty
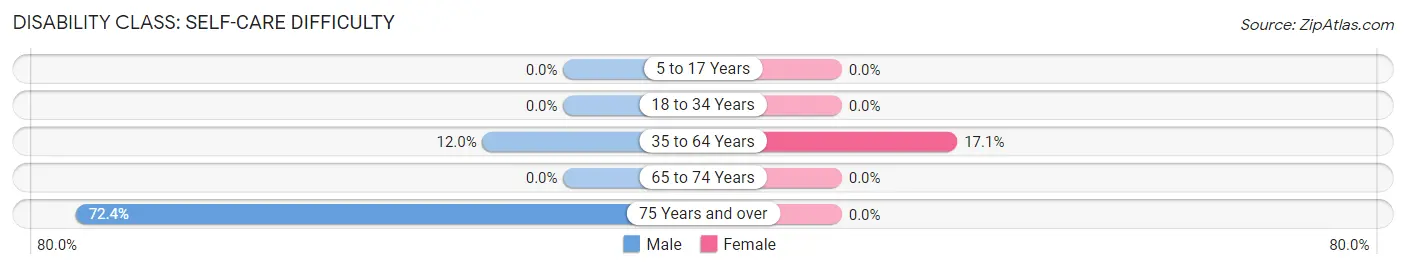
| Age Bracket | Male | Female |
| 5 to 17 Years | 0 (0.0%) | 0 (0.0%) |
| 18 to 34 Years | 0 (0.0%) | 0 (0.0%) |
| 35 to 64 Years | 9 (12.0%) | 12 (17.1%) |
| 65 to 74 Years | 0 (0.0%) | 0 (0.0%) |
| 75 Years and over | 21 (72.4%) | 0 (0.0%) |
Technology Access in Montrose Manor
Computing Device Access in Montrose Manor
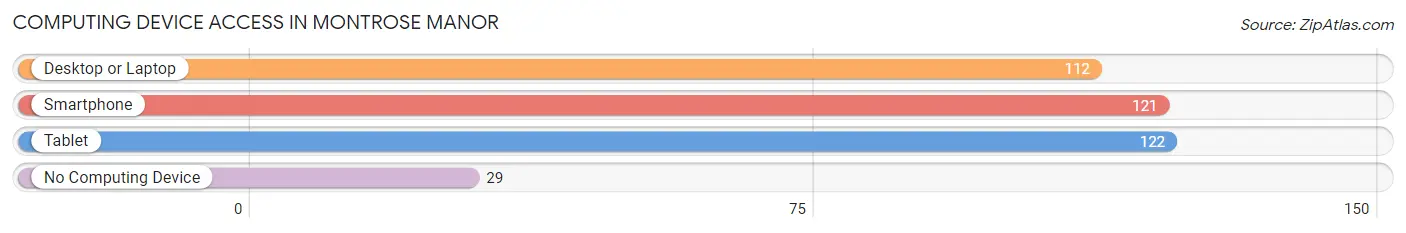
| Device Type | # Households | % Households |
| Desktop or Laptop | 112 | 53.3% |
| Smartphone | 121 | 57.6% |
| Tablet | 122 | 58.1% |
| No Computing Device | 29 | 13.8% |
| Total | 210 | 100.0% |
Internet Access in Montrose Manor
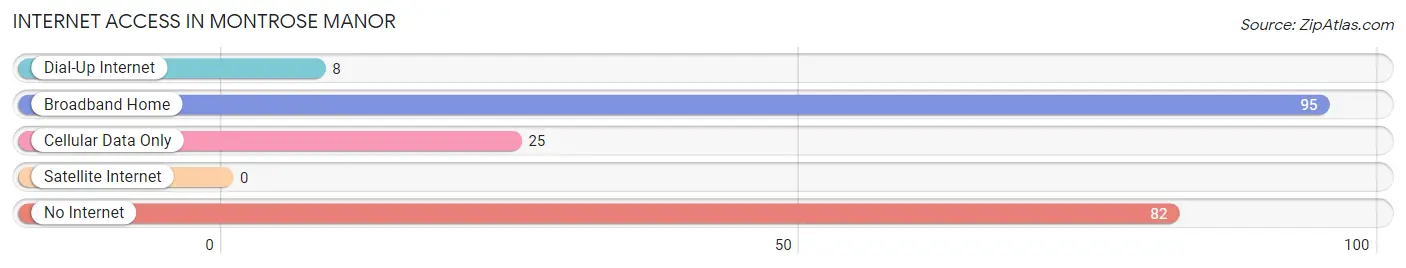
| Internet Type | # Households | % Households |
| Dial-Up Internet | 8 | 3.8% |
| Broadband Home | 95 | 45.2% |
| Cellular Data Only | 25 | 11.9% |
| Satellite Internet | 0 | 0.0% |
| No Internet | 82 | 39.1% |
| Total | 210 | 100.0% |
Montrose Manor Summary
Montrose Manor is a small borough located in Susquehanna County, Pennsylvania. It is situated in the Endless Mountains region of the state, and is bordered by the towns of Clifford, Dimock, and Springville. The population of Montrose Manor was 1,845 at the 2010 census.
History
Montrose Manor was founded in 1820 by a group of settlers from Connecticut. The settlers named the town after the nearby town of Montrose, Pennsylvania. The town was originally a farming community, and the first settlers built a grist mill and a saw mill. The town was incorporated in 1845, and the first post office was established in 1847.
In the late 19th century, Montrose Manor became a popular summer resort destination. The town was home to several hotels, including the Montrose Manor Hotel, which was built in 1891. The hotel was a popular destination for wealthy families from New York City and Philadelphia.
Geography
Montrose Manor is located in the Endless Mountains region of Pennsylvania. The borough is situated in the Susquehanna River Valley, and is bordered by the towns of Clifford, Dimock, and Springville. The borough has a total area of 1.2 square miles, all of which is land.
The terrain of Montrose Manor is mostly flat, with some rolling hills. The borough is located in a temperate climate zone, with hot summers and cold winters. The average annual temperature is around 50 degrees Fahrenheit.
Economy
The economy of Montrose Manor is largely based on tourism and agriculture. The town is home to several small businesses, including restaurants, shops, and bed and breakfasts. The town is also home to several farms, which produce a variety of crops, including corn, soybeans, and hay.
Demographics
As of the 2010 census, the population of Montrose Manor was 1,845. The racial makeup of the borough was 97.3% White, 0.7% African American, 0.3% Native American, 0.2% Asian, and 1.5% from other races. The median household income was $41,250, and the median family income was $50,000.
The population of Montrose Manor is largely Christian, with the majority of residents belonging to the Roman Catholic Church. The town is also home to a small Jewish community. The town is served by the Montrose Area School District, which includes two elementary schools, a middle school, and a high school.
Common Questions
What is Per Capita Income in Montrose Manor?
Per Capita income in Montrose Manor is $40,126.
What is the Median Family Income in Montrose Manor?
Median Family Income in Montrose Manor is $107,083.
What is the Median Household income in Montrose Manor?
Median Household Income in Montrose Manor is $75,500.
What is Income or Wage Gap in Montrose Manor?
Income or Wage Gap in Montrose Manor is 7.7%.
Women in Montrose Manor earn 92.3 cents for every dollar earned by a man.
What is Inequality or Gini Index in Montrose Manor?
Inequality or Gini Index in Montrose Manor is 0.30.
What is the Total Population of Montrose Manor?
Total Population of Montrose Manor is 421.
What is the Total Male Population of Montrose Manor?
Total Male Population of Montrose Manor is 192.
What is the Total Female Population of Montrose Manor?
Total Female Population of Montrose Manor is 229.
What is the Ratio of Males per 100 Females in Montrose Manor?
There are 83.84 Males per 100 Females in Montrose Manor.
What is the Ratio of Females per 100 Males in Montrose Manor?
There are 119.27 Females per 100 Males in Montrose Manor.
What is the Median Population Age in Montrose Manor?
Median Population Age in Montrose Manor is 51.7 Years.
What is the Average Family Size in Montrose Manor
Average Family Size in Montrose Manor is 2.8 People.
What is the Average Household Size in Montrose Manor
Average Household Size in Montrose Manor is 2.0 People.
How Large is the Labor Force in Montrose Manor?
There are 246 People in the Labor Forcein in Montrose Manor.
What is the Percentage of People in the Labor Force in Montrose Manor?
69.3% of People are in the Labor Force in Montrose Manor.
What is the Unemployment Rate in Montrose Manor?
Unemployment Rate in Montrose Manor is 8.5%.